| Author (publication year) | Index test variable included (threshold) | Reference standard quality and definition |
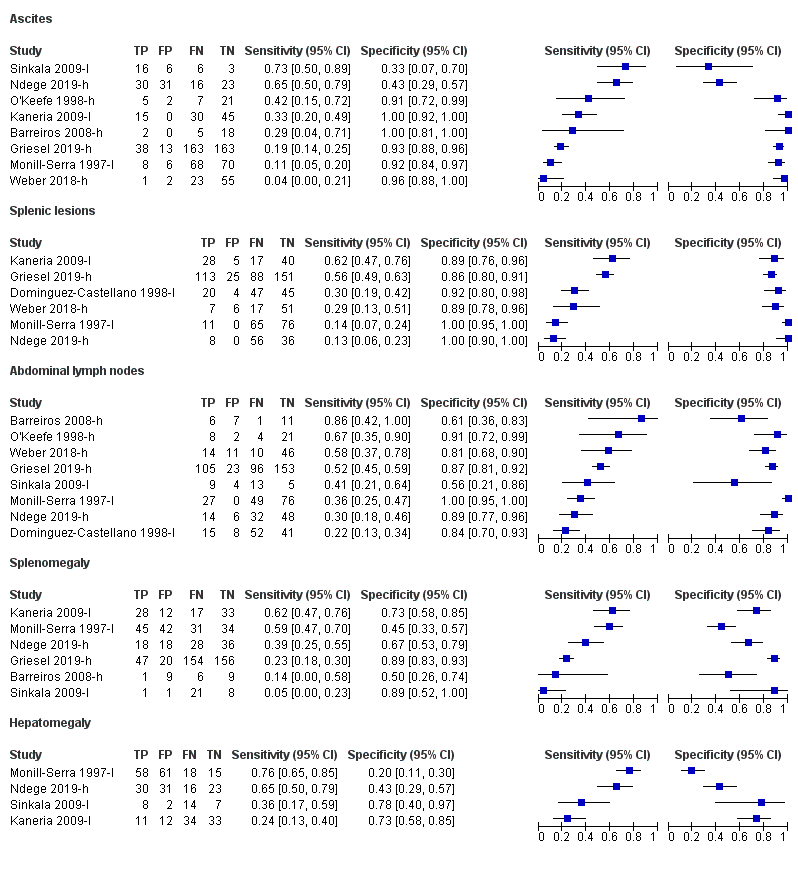
| Barreiros 2008‐h | Ascites (any) Lymphadenopathy (abdominal and perihepatic nodes with longitudinal diameter > 20 mm) Splenomegaly (> 135 mm) | Lower: Clinical, endoscopic, histologic, radiologic and operative findings including microbiology and polymerase chain reaction of biopsies taken during endoscopy |
| Bobbio 2019‐l | Any abnormality (Presence of ≥ 1: i) pericardial effusion, ii) periportal/para‐aortic lymph nodes (> 15 mm diameter), iii) focal splenic lesions, iv) pleural effusion or consolidation of the lung, v) ascites without alternative explanation) | Lower: Sputum microscopy OR clinical reasons OR Focused Assessment with Sonography in HIV‐associated tuberculosis (FASH) |
| Dominguez‐Castellano 1998‐h; Dominguez‐Castellano 1998‐l | Any abnormality (presence of ≥ 1: i) multiple hypoechoic splenic lesions (< 10 mm), ii) any abdominal adenopathy, iii) hypo‐ or hyperechoic liver lesions) | Higher: Microscopy OR culture
Lower: Microscopy OR culture OR clinical or radiographic indications and response to treatment |
| Griesel 2019‐h | Any abnormality (presence of ≥ 1: i) abdominal lymph nodes (any size), ii) splenic hypoechoic lesions, iii) splenomegaly (≥ 110 mm), iv) any one of abdominal, pleural, or pericardial effusions) Ascites (any) Lymphadenopathy (any size) Splenic lesions (hypoechoic) Splenomegaly (≥ 110 mm) | Higher: Positive culture for M tuberculosis from any site |
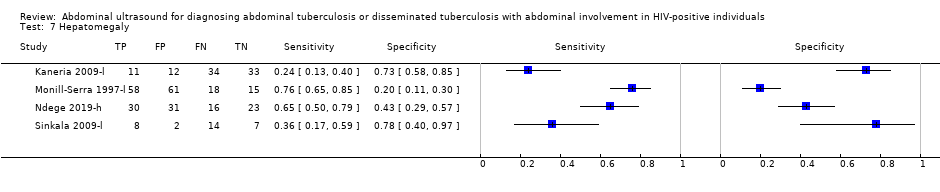
| Kaneria 2009‐l | Ascites (any) Hepatomegaly (not defined) Lymphadenopathy (diameter > 15 mm) Splenic lesions (multiple, hypoechoic, 5 mm to 10 mm diameter) Splenomegaly (not defined) | Lower: Lymphocytic predominance and elevated adenosine deaminase (ADA) levels in pleural or ascitic fluid OR granulomatous lymphadenitis and acid‐fast bacilli in lymph node OR sputum microscopy |
| Monill‐Serra 1997‐l | Ascites (any) Hepatomegaly (not defined) Lymphadenopathy (> 15 mm diameter) Splenic lesions (hypoechoic nodes) Splenomegaly (long axis > 120 mm or subjective impression) | Lower: Blood culture positive for M tuberculosis OR medullary bone or liver biopsy with granulomatous inflammation or culture positive for M tuberculosis OR microbiological or histopathological confirmation in ≥ 2 non‐contiguous extra‐pulmonary sites |
| Ndege 2019‐h; Ndege 2019‐l | Any abnormality (presence of ≥ 1: i) pleural or pericardial effusion, ii) ascites, iii) abdominal lymph nodes > 15 mm, iv) hypoechogenic lesions in the liver or spleen, v) ileum wall thickening > 4 mm or destructed ileum wall architecture) Ascites (any) Hepatomegaly (not defined) Lymphadenopathy (> 15 mm diameter) Splenomegaly (not defined) | Higher: Xpert MTB/RIF assay and/or bacteriologic culture (growth of M tuberculosis)
Lower: Positive Xpert MTB/RIF assay and/or bacteriologic culture (growth of M tuberculosis) OR acid‐fast bacilli in sputum OR raised adenosine deaminase (ADA) levels in pleural, pericardial or ascitic fluid OR negative microbiological tests and improvement 2 months after start of anti‐tuberculosis treatment |
| O'Keefe 1998‐h | Ascites (any) Lymphadenopathy (not defined) | Higher: Positive mycobacterial blood or bone marrow cultures OR positive mycobacterial cultures from 2 or more other sites OR post mortem evidence |
| Sculier 2010‐h | Any abnormality (presence of ≥ 1: i) any lymph nodes ≥ 12 mm, ii) ascites, iii) hepatomegaly, iv) splenomegaly, v) hepatic or splenic hypoechoic lesions with or without organ enlargement) | Higher: Positive culture for M tuberculosis from any site |
| Sinkala 2009‐l | Ascites (any) Hepatomegaly (not defined) Lymphadenopathy (not defined) Splenomegaly (not defined) | Lower: Positive bacteriological culture OR granulomatous inflammation with positive Ziehl‐Neelsen (ZN) staining on microscopy OR granulomatous inflammation on microscopy OR visual inspection on laparoscopy consistent with tuberculosis (presence of tubercles, fibro‐adhesive peritonitis, or caseating lymphadenopathy) and favourable response to anti‐tuberculous treatment |
| Weber 2018‐h; Weber 2018‐l | Any abnormality (presence of ≥ 1: i) pericardial or pleural effusion, ii) focal liver or splenic lesions, iii) abdominal lymphadenopathy) Ascites (any) Hepatomegaly (not defined) Lymphadenopathy (≥ 15 mm diameter) Splenic lesions (multiple, hypoechoic, 2 mm to 5 mm diameter) | Higher: Positive fluorescent microscopy, polymerase chain reaction, or tuberculosis culture
Lower: Microbiological confirmation (fluorescent microscopy, polymerase chain reaction, culture) OR clinical diagnosis and anti‐tuberculous treatment initiated |