Contexto y técnicas para monitorizar la presión arterial durante el embarazo
Resumen
Antecedentes
La medición regular de la presión arterial (PA) es crucial para el diagnóstico y el manejo de los trastornos hipertensivos en el embarazo, como la preeclampsia. La PA puede medirse en diversos contextos, como los consultorios convencionales o la automedición en el domicilio, y con diferentes técnicas, como el uso de dispositivos de presión arterial auscultatorios o automatizados. Es importante comprender el impacto de los diferentes contextos y técnicas de medición de la PA sobre desenlaces importantes para las mujeres embarazadas.
Objetivos
Evaluar los efectos del contexto y la técnica de medición de la PA para el diagnóstico de trastornos hipertensivos en el embarazo en los desenlaces maternos y perinatales subsiguientes, la calidad de vida de las mujeres o el uso de los recursos de los servicios de salud.
Métodos de búsqueda
Se realizaron búsquedas en el registro de ensayos del Grupo Cochrane de Embarazo y el Parto (Cochrane Pregnancy and Childbirth’s Trials Register), ClinicalTrials.gov, en la Plataforma de registros internacionales de ensayos clínicos de la OMS(ICTRP) el 22 de abril de 2020 y en las listas de referencias de los estudios obtenidos.
Criterios de selección
Ensayos controlados aleatorizados (ECA) que incluyeran a mujeres embarazadas, utilizando dispositivos validados de PA en diferentes contextos o utilizando diferentes técnicas.
Obtención y análisis de los datos
Dos autores de la revisión extrajeron los datos de forma independiente, evaluaron el riesgo de sesgo y utilizaron el método GRADE para evaluar la certeza de la evidencia.
Resultados principales
De los 21 estudios identificados, se incluyeron tres y se excluyeron 11; siete estaban en curso. De los tres ECA incluidos (536 607 mujeres), uno fue un ECA grupal, con un número sustancialmente mayor de participantes (536 233 partos) que los otros dos ensayos, pero no proporcionó datos para la mayoría de los desenlaces. En general, se consideró que los estudios incluidos tenían un bajo riesgo de sesgo. Sin embargo, la certeza de la evidencia era baja, debido a la falta de direccionalidad e imprecisión. El metanálisis no fue posible porque cada estudio investigó una comparación diferente.
Ninguno de los estudios incluidos informó sobre el desenlace primario de la PA sistólica mayor o igual a 150 mmHg. Ninguno de los estudios informó de ninguno de los desenlaces secundarios importantes: ingresos hospitalarios prenatales, duración de la estancia en la unidad neonatal o intubación endotraqueal neonatal y uso de ventilación mecánica.
Configuración de la medición de la PA: automedición versus medición clínica convencional (un estudio, 154 mujeres)
No hubo muertes maternas ni en el grupo de automonitorización ni en el grupo de atención habitual. El estudio no informó de la mortalidad perinatal.
La automonitorización puede dar lugar a un número ligeramente superior de diagnósticos de preeclampsia en comparación con la atención habitual (riesgos relativos (RR) 1,49; intervalo de confianza (IC) del 95%: 0,87 a 2,54; 154 mujeres; un estudio; evidencia de certeza baja), pero el amplio IC del 95% es coherente con los posibles efectos beneficiosos y perjudiciales.
La automonitorización puede tener poco o ningún efecto sobre la probabilidad de inducir el trabajo de parto en comparación con la atención habitual (RR 1,09; IC del 95%: 0,82 a 1,45; 154 mujeres; un estudio; evidencia de certeza baja).
No se sabe con certeza si la automonitorización de la PA tiene algún efecto sobre el ingreso de la madre en cuidados intensivos (RR 1,54; IC del 95%: 0,06 a 37,25; 154 mujeres; un estudio; evidencia de certeza baja), el nacimiento de mortinatos (RR 2,57; IC del 95%: 0,13 a 52,63; 154 mujeres; un estudio; evidencia de certeza baja), la muerte neonatal (RR 1,54; IC del 95%: 0,06 a 37,25; 154 mujeres; un estudio; evidencia de certeza baja) o el nacimiento prematuro (RR 1,15; IC del 95%: 0,37 a 3,55; 154 mujeres; un estudio; evidencia de certeza baja), en comparación con la atención habitual porque la certeza de la evidencia es baja y el IC del 95% es coherente con efectos beneficiosos y perjudiciales apreciables.
La automonitorización puede dar lugar a un número ligeramente mayor de ingresos en la unidad neonatal en comparación con la atención habitual (RR 1,53; IC del 95%: 0,65 a 3,62; 154 mujeres; un estudio; evidencia de certeza baja), pero el amplio IC del 95% incluye la posibilidad de un número ligeramente menor de ingresos con automonitorización.
Técnica de medición de la PA: fase IV de Korotkoff (K4, sonido amortiguado) versus fase V de Korotkoff (K5, desaparición del sonido) para representar la PA diastólica (un estudio, 220 mujeres)
No hubo muertes maternas ni en el grupo K4 ni en el K5.
Es posible que haya poca o ninguna diferencia en el diagnóstico de la preeclampsia entre el uso de K4 o K5 para la PA diastólica (RR 1,16; IC del 95%: 0,89 a 1,49; un estudio; 220 mujeres; evidencia de certeza baja), ya que el amplio IC del 95% incluye la posibilidad de más diagnósticos con K4.
No se sabe con certeza si hay una diferencia en la mortalidad perinatal entre los grupos porque la calidad de la evidencia es baja y el IC del 95% es consistente con un efecto beneficioso y perjudicial apreciable (RR 1,14; IC del 95%: 0,16 a 7,92; un estudio, 220 mujeres; evidencia de certeza baja).
El ensayo no informó de datos sobre el ingreso de la madre en cuidados intensivos, la inducción del trabajo de parto, el nacimiento de mortinatos, la muerte neonatal, el parto prematuro o los ingresos en la unidad neonatal.
Técnica de medición de la PA: intervención CRADLE (dispositivo CRADLE, un monitor de PA semiautomático con características adicionales, y un paquete de educación) versus la atención habitual (un estudio, 536 233 partos)
Puede haber poca o ninguna diferencia entre el uso del dispositivo CRADLE y la atención habitual en el número de muertes maternas (RR ajustado 0,80; IC del 95%: 0,30 a 2,11; 536 233 mujeres; un estudio; evidencia de certeza baja), pero el IC del 95% es coherente con un efecto beneficioso y perjudicial apreciable.
El ensayo no informó de preeclampsia, inducción del parto, mortalidad perinatal, parto prematuro o ingresos en unidades neonatales. El ingreso de las madres en cuidados intensivos y los desenlaces perinatales (mortinatos y muertes neonatales) sólo se recogieron para una pequeña proporción de las mujeres, identificadas por un desenlace y no por las características iniciales, rompiendo así la asignación aleatoria. Por lo tanto, no se pudo atribuir ninguna diferencia entre los grupos a la intervención, y no se extrajeron datos para estos desenlaces.
Conclusiones de los autores
El beneficio, si lo hay, de la automonitorización de la PA en los embarazos hipertensos sigue siendo incierto, ya que la evidencia se limita a un estudio de factibilidad. La práctica actual de usar la K5 para medir la PA diastólica se apoya en mujeres con hipertensión en el embarazo. El beneficio, si es que lo hay, de usar el dispositivo CRADLE para medir la PA en el embarazo sigue siendo incierto, debido a las limitaciones e inestabilidad del diseño del estudio del ensayo.
PICO
Resumen en términos sencillos
¿Los diferentes contextos y técnicas para medir la presión arterial durante el embarazo ayudan a mejorar los desenlaces para las mujeres y los bebés?
¿Cuál es el problema?
Las mediciones regulares de la presión arterial (PA) son cruciales durante el embarazo para el diagnóstico y el manejo de la PA alta. La PA puede medirse en varios contextos (por ejemplo, la automedición en el domicilio versus en el consultorio) y utilizando diferentes técnicas (por ejemplo, la medición basada en diferentes sonidos del flujo sanguíneo). Pueden tener diferentes efectos en el diagnóstico y la monitorización de la hipertensión arterial, y en la reducción del riesgo de enfermedades graves o muerte, tanto en la mujer como en el bebé.
¿Por qué es esto importante?
Si la hipertensión arterial en el embarazo no se detecta y ni se controla a tiempo, pueden surgir complicaciones graves. Esta revisión es necesaria para establecer los beneficios y riesgos de estos contextos y técnicas para las mujeres y sus bebés.
¿Qué evidencia se encontró?
Se buscó evidencia de ensayos controlados aleatorizados en abril de 2020, y se identificaron tres estudios (con 536 607 mujeres). En general, los estudios se llevaron a cabo de tal manera que no se tiene seguridad acerca de los hallazgos, principalmente debido al pequeño tamaño de dos de los estudios y el diseño del otro.
Un estudio (154 mujeres) comparó los contextos de la PA en el Reino Unido: autocontrol en el domicilio versus la medición habitual en el consultorio. Los otros dos estudios compararon técnicas de medición de la PA: uno (220 mujeres) comparó dos sonidos diferentes del flujo sanguíneo para determinar la presión arterial diastólica (el número inferior) en Australia, y el otro (536 233 partos) investigó la introducción de un monitor de presión arterial semiautomático y un paquete de educación (intervención CRADLE) en comparación con la atención habitual en África, India y Haití.
Ninguno de los estudios midió la PA alta, el número de mujeres ingresadas en el hospital antes del nacimiento, el tiempo que los bebés permanecieron en la unidad neonatal, o la ayuda extra que recibieron los bebés para respirar.
Automedición de la PA en el domicilio comparada con la medición habitual de la PA en el consultorio
El autocontrol de la PA puede llevar a que más mujeres sean diagnosticadas con preeclampsia en comparación con la atención habitual, pero la evidencia es incierta.
Existen dudas de si el autocontrol de la PA aumenta la probabilidad de que el bebé nazca muerto, de muertes de bebés (después del nacimiento), de mujeres que dan a luz antes de tiempo o de mujeres ingresadas en la unidad de cuidados intensivos.
El autocontrol de la PA puede tener poco o ningún efecto en la probabilidad de que a las mujeres se les induzca el parto en comparación con la atención habitual.
El autocontrol de la PA puede hacer que ingresen más recién nacidos en una unidad neonatal en comparación con la atención habitual.
En este ensayo no se registraron muertes maternas ni se informó del número de muertes de bebés, antes o poco después del nacimiento.
Medición de la PA usando diferentes sonidos de flujo sanguíneo‐ Fase IV de Korotkoff (K4, sonido más suave y apagado) comparado con la Fase V de Korotkoff (K5, cuando el sonido desaparece) para medir la PA diastólica
Puede haber poca o ninguna diferencia entre el uso de K4 o K5 para diagnosticar la preeclampsia; la evidencia es incierta.
No se sabe con seguridad si hay un efecto sobre las muertes de los bebés, antes o poco después del nacimiento.
En este ensayo, no se registraron muertes maternas y no se informó el número de mujeres ingresadas en cuidados intensivos, mujeres que necesitaban que se les indujera el parto, mujeres que daban a luz prematuramente, bebés nacidos muertos, muertes de bebés (después del nacimiento) o bebés ingresados en la unidad neonatal.
Intervención CRADLE (monitor de PA semiautomático y un paquete de educación)en comparación con la atención habitual
El monitor de PA CRADLE puede lograr poca o ninguna diferencia en el riesgo de muerte materna.
El ensayo no informó el número de mujeres con preeclampsia, mujeres que necesitaban que se les indujera el parto, mujeres que daban a luz antes de tiempo, muertes de bebés (antes y después del nacimiento), o el número de bebés ingresados en la unidad neonatal. El número de mujeres ingresadas en cuidados intensivos, los bebés nacidos muertos y muertes de bebés (después del nacimiento) sólo se informaron para un subgrupo de mujeres en este ensayo, por lo que no se incluyeron estos resultados.
¿Qué significa esto?
Se necesita más evidencia sobre si el autocontrol de la PA en mujeres embarazadas con PA alta es beneficioso, porque el estudio que exploró esto era pequeño.
La práctica actual de utilizar la K5 (sin sonido de flujo sanguíneo) para medir la PA diastólica se apoya en las mujeres embarazadas con PA alta.
El ensayo utilizando el dispositivo CRADLE para controlar la PA en el embarazo tuvo limitaciones en su diseño, y existen dudas acerca de su beneficio.
Authors' conclusions
Summary of findings
| Setting of BP measurement: self‐measurement versus conventional clinic measurement | ||||||
|---|---|---|---|---|---|---|
| Patient or population: pregnant women with chronic or gestational hypertension | ||||||
| Outcomes | Anticipated absolute effects* (95% CI) | Relative effect | № of participants | Certainty of the evidence | Comments | |
| Assumed risk with usual care | Corresponding risk with self‐monitoring | |||||
| Maternal outcomes | ||||||
| Systolic BP ≥ 150 mmHg | Not reported | |||||
| Maternal death | 0/102 maternal deaths in the self‐monitoring group, compared with 0/52 in the usual care group | ‐ | 154 | ‐ | ||
| Pre‐eclampsia | Study population | RR 1.49 | 154 | ⊕⊕⊝⊝ | ||
| 250 per 1000 | 373 per 1000 123 more per 1000 (from 33 fewer to 385 more) | |||||
| Number of antenatal hospital admissions | Not reported | |||||
| Maternal admission to intensive care | 1/102 maternal admission to intensive care in the self‐monitoring group, compared with 0/52 in the usual care group | RR 1.54 | 154 | ⊕⊕⊝⊝ | ||
| Induction of labour | Study population | RR 1.09 | 154 | ⊕⊕⊝⊝ | ||
| 558 per 100 | 608 per 1000 50 more per 1000 (from 100 fewer to 251 more) | |||||
| Neonatal outcomes | ||||||
| Stillbirth (death after 24 weeks inutero) | 2/102 stillbirths in the self‐monitoring group, compared with 0/52 in the usual care group | RR 2.57 | 154 | ⊕⊕⊝⊝ | ||
| Neonatal death | 1/102 neonatal death in the self‐monitoring group compared with 0/52 in the usual care group | RR 1.54 | 154 | ⊕⊕⊝⊝ | ||
| Perinatal mortality | Not reported | |||||
| Preterm birth (birth before 34 completed weeks' gestation) | Study population | RR 1.15 | 154 | ⊕⊕⊝⊝ | ||
| 77 per 1000 | 88 per 1000 12 more per 1000 (from 48 fewer to 196 more) | |||||
| Neonatal unit admission | Study population | RR 1.53 | 154 | ⊕⊕⊝⊝ | ||
| 115 per 1000 | 177 per 1000 61 more per 1000 (from 40 fewer to 302 more) | |||||
| Neonatal unit length of stay | Not reported | |||||
| Neonatal endotracheal intubation and use of mechanical ventilation | Not reported | |||||
| *The risk in the intervention group (and its 95% confidence interval) is based on the assumed risk in the comparison group and the relative effect of the intervention (and its 95% CI). | ||||||
| GRADE Working Group grades of evidence | ||||||
| aDowngraded two levels for very serious imprecision: few participants, wide 95% confidence interval spanning possible harm and possible benefit, based on a feasibility trial not powered to measure clinical outcomes. | ||||||
| Technique of BP measurement: Korotkoff phase IV versus Korotkoff phase V to represent diastolic BP | ||||||
|---|---|---|---|---|---|---|
| Patient or population: pregnant women with diastolic hypertension | ||||||
| Outcomes | Anticipated absolute effects* (95% CI) | Relative effect | № of participants | Certainty of the evidence | Comments | |
| Assumed risk with K5 | Corresponding risk with K4 | |||||
| Maternal outcomes | ||||||
| Systolic BP ≥ 150 mmHg | Not reported | |||||
| Maternal death | 0/103 maternal deaths in the K4 group, compared with 0/117 in the K5 group | ‐ | 220 | ‐ | ||
| Pre‐eclampsia | Study population | RR 1.16 | 220 | ⊕⊕⊝⊝ | ||
| 479 per 1000 | 555 per 1000 77 more per 1000 (from 53 fewer to 235 more) | |||||
| Number of antenatal hospital admissions | Not reported | |||||
| Maternal admission to intensive care | Not reported | |||||
| Induction of labour | Not reported | |||||
| Neonatal outcomes | ||||||
| Stillbirth | Not reported | |||||
| Neonatal death | Not reported | |||||
| Perinatal mortality | Study population | RR 1.14 | 220 | ⊕⊕⊝⊝ | ||
| 17 per 1000 | 19 per 1000 2 more per 1000 (from 14 fewer to 118 more) | |||||
| Preterm birth | Not reported | |||||
| Neonatal unit admission | Not reported | |||||
| Neonatal unit length of stay | Not reported | |||||
| Neonatal endotracheal intubation and use of mechanical ventilation | Not reported | |||||
| *The risk in the intervention group (and its 95% confidence interval) is based on the assumed risk in the comparison group and the relative effect of the intervention (and its 95% CI). | ||||||
| GRADE Working Group grades of evidence | ||||||
| aDowngraded two levels for very serious imprecision: few participants and wide 95% confidence intervals spanning possible harm and possible benefit | ||||||
| Technique of BP measurement: CRADLE intervention versus usual care | ||||||
|---|---|---|---|---|---|---|
| Patient or population: pregnant women, or those within 42 days of delivery | ||||||
| Outcomes | Anticipated absolute effects* (95% CI) | Relative effect | № of participants | Certainty of the evidence | Comments | |
| Assumed risk with usual care | Corresponding risk with CRADLE intervention | |||||
| Maternal outcomes | ||||||
| Systolic BP ≥ 150 mmHg | Not reported | |||||
| Maternal death | Study population | RR 0.80 | 536,233 | ⊕⊕⊝⊝ | Effect estimate is adjusted RR, taking into account cluster design. | |
| 2 per 1000 | 1 per 1000 0 fewer per 1000 (from 1 fewer to 2 more) | |||||
| Pre‐eclampsia | Not reported | |||||
| Number of antenatal hospital admissions | Not reported | |||||
| Maternal admission to intensive care | Not reported | |||||
| Induction of labour | Not reported | |||||
| Neonatal outcomes | ||||||
| Stillbirth | Not reported | |||||
| Neonatal death | Not reported | |||||
| Perinatal mortality | Not reported | |||||
| Preterm birth | Not reported | |||||
| Neonatal unit admission | Not reported | |||||
| Neonatal unit length of stay | Not reported | |||||
| Neonatal endotracheal intubation and use of mechanical ventilation | Not reported | |||||
| *The risk in the intervention group (and its 95% confidence interval) is based on the assumed risk in the comparison group and the relative effect of the intervention (and its 95% CI). | ||||||
| GRADE Working Group grades of evidence | ||||||
| aDowngraded one level for serious indirectness: intervention and comparator were not directly representative of the prespecified settings and techniques. The intervention was an oscillometric device with additional features (early warning system and an eduction package) and the comparator usual care, which varied across the clusters according to local context. bDowngraded one level for serious imprecision: wide 95% CI spanning possible benefit and possible harm. | ||||||
Background
Description of the condition
Hypertensive disorders of pregnancy (HDP) are common, with pre‐eclampsia complicating 2% to 3% of pregnancies, pre‐existing hypertension complicating 1%, and isolated gestational hypertension complicating 5% to 6% of pregnancies (Hutcheon 2011). Hypertension is defined as a systolic blood pressure (BP) of 140 mmHg or higher, or a diastolic BP of 90 mmHg or higher, or both; severe hypertension is defined as a BP of 160/110 mmHg; and non‐severe (or mild to moderate) hypertension, as a systolic BP of 140 to 159 and diastolic BP of 90 to 109 mmHg (NICE 2019).
HDP are leading causes of maternal and perinatal morbidity and mortality, particularly in low‐ and middle‐income countries (Duley 2009). NICE 2019 defines pre‐eclampsia as gestational hypertension, or maternal end‐organ complication(s), or both, or fetal involvement; it is the cause of most HDP‐associated morbidity and mortality (Khan 2006). Although there are still gaps in understanding around the pathophysiology of pre‐eclampsia, it has been established as a systemic syndrome, characterised by placental and maternal vascular dysfunction, which if severe, may lead to adverse outcomes, such as severe hypertension, stroke, seizures (eclampsia), coagulopathy, renal and hepatic injury, haemorrhage, or death (Brown 2000). Two small, yet landmark cohort studies, have suggested that neurological complications of pre‐eclampsia and eclampsia, including stroke and posterior reversible encephalopathy syndrome, are more prevalent in women with systolic hypertension as opposed to diastolic hypertension (Martin 2005; Wagner 2011). These findings support the 2019 NICE guidelines that recommend treatment if systolic BP is 140 mmHg or higher (NICE 2019). Perinatal mortality and morbidity is also high as a result of pre‐eclampsia; the blood supply to the placenta is disrupted, which may result in intrauterine growth restriction, or fetal death secondary to placental abruption. Furthermore, pre‐eclampsia is an antecedent for one‐fifth of infants born prematurely (Hewitt 1988). Hypertension in pregnancy, independent of pre‐eclampsia, is also associated with increased risk of stroke and other maternal and perinatal complications, including pulmonary oedema, placental abruption, and perinatal death (Brown 2000).
Accurate and regular BP measurement is crucial to the diagnosis and management of HDP, which are often asymptomatic. Most deaths associated with HDP are considered preventable with timely and effective detection, along with management of hypertension and associated complications (MacKay 2001). The 2006–2008 UK Confidential Enquiries into Maternal Deaths report found that the most common reason for substandard care in deaths secondary to pre‐eclampsia and eclampsia was failure to recognise and treat hypertension (Cantwell 2011). The 2009–2014 report found that although the proportion of women dying secondary to hypertensive disorders had decreased, in 93% of those women, improvements in the care may have made a difference in their outcome (Knight 2016). Therefore, BP measurement and subsequent management, including treatment of hypertension and timing of birth, are critical in preventing avoidable maternal deaths.
Description of the intervention
BP measurement has traditionally taken place within an antenatal clinic environment, conventionally with one or two mercury sphygmomanometer (gold standard) measurements, taken to guide further investigation and management. In recent years, there has been a shift away from mercury sphygmomanometry, owing to environmental and safety concerns of mercury in clinical settings, and issues with user error (Nathan 2015). Likewise, some authors consider aneroid devices (which also rely on auscultation, and therefore, are also associated with user and calibration error) as unattractive options for BP measurement (Canzanello 2001). With this, there has been a move towards the use of automated devices, which rely on the detection of oscillometric waveforms produced within the cuff during BP measurement, giving a digital BP reading and minimising user error (Perry 1991). This shift has coincided with growing concern over the accuracy of automated devices, most of which have not been formally validated as accurate. This is particularly problematic in pre‐eclamptic women, for whom automated devices have been shown to significantly underestimate BP, possibly due to the pathophysiological changes of pre‐eclampsia that can alter the oscillometric waveform (Nataranjan 1999; Shennan 1993). The British & Irish Hypertension Society (BIHS), the European Society of Hypertension (ESH), and the International Organisation for Standardisation (IOS), each recommend that automated BP devices be independently validated, to ensure accuracy according to a recognised protocol (ISO 2013; O'Brien 1993; O'Brien 2010). Even if a device is validated as accurate in a non‐pregnant population, these studies recommend formally validating it in a specific group of pregnant women before using it in pregnancy (O'Brien 1993; O'Brien 2002; O'Brien 2010).
How the intervention might work
Setting of BP measurement
Relying only on clinic or home BP readings may limit the diagnostic potential of BP measurement. White coat hypertension (elevated BP in a hospital setting, yet normotension in a home setting) may occur in nearly 30% of pregnant women. Its recognition can prevent unnecessary admission to hospital or antihypertension treatment; however, it is associated with an increased risk of developing hypertension in pregnancy and pre‐eclampsia, so clinicians should not ignore it (Bellomo 1999; Brown 2005). In women with hypertension in pregnancy (including pre‐eclampsia), the diurnal variation in BP may be altered (Hermida 2000). Alternatives to conventional clinical BP measurement include self (or home) BP measurement (SBPM) and ambulatory BP measurement (ABPM). In SBPM, people are trained to use the device and interpret readings, in order to alert a health professional if they obtain abnormal readings, or readings can be automatically sent to a central facility for evaluation by a health professional (O'Brien 2001). In ABPM, a portable automated device performs repeated measurements, typically over 24 hours, during the woman's normal daily routine (Greer 1993). Both methods may increase reproducible measurements, minimise misleading results, identify impaired diurnal variation, and improve BP control and prediction of adverse clinical outcomes (Bellomo 1999; Halligan 1993; Higgins 1997).
Technique of BP measurement
It is well recognised that only BP devices that have been validated as accurate through formal validation, according to recognised protocols, should be used clinically. Even if validation has occurred, other variables outside of the test environment may influence BP measurement, including BP measurement technique. The BHIS and ESH have published several recommendations related to BP measurement technique to ensure reliability: resting for at least five minutes prior to BP measurement, sitting upright with the arm supported and the cuff placed at the level of the heart, using the appropriately sized cuff, deflating the cuff at a rate of 2 mmHg to 3 mmHg, using Korotkoff phase V, and recording BP to the nearest 2 mmHg (O'Brien 1993; O'Brien 2003). Unfortunately, correct technique may not be practised outside of the test environment, yet it may impact on BP measurement, and therefore, outcome. Universal cuffs (that can be used in women with a wide range of arm circumferences) may eliminate the potential error introduced by using an inappropriately sized cuff; however, their impact on outcome is not known.
Why it is important to do this review
As well as confirming or predicting disease, a screening and diagnostic test should also show clear benefit according to robust evidence, in terms of improved survival, function, or quality of life. The Cochrane Review 'Ambulatory versus conventional methods for measuring BP during pregnancy', published in 2002, highlighted the absence of randomised controlled trial (RCT) evidence comparing the two methods of BP measurement according to clinical outcome, use of healthcare resources, and women's views (Bergel 2002).
The BHS and ESH have made recommendations on various aspects of BP measurement technique, and a number of studies have assessed the effectiveness of SBPM, ABPM and aspects of BP measurement technique in non‐pregnant and pregnant populations. However, no systematic review has evaluated their impact on survival, health service resources or quality of life. Many of the current guidelines recommendations related to BP techniques derive from extrapolations from other populations and expert consensus; whilst many of these techniques have been adopted into clinical practice, it is important to examine the evidence base specifically for clinically relevant pregnancy outcomes.
This review aims to identify all new published and unpublished RCTs of ABPM, SBPM, and all aspects of BP measurement technique, to establish the benefits and risks of each for pregnant women. This review will not assess the accuracy of BP devices, but rather the clinical performance of BP equipment that has been previously validated according to recognised protocols, in terms of technique and interpretation.
Objectives
To assess the effects of setting and technique of blood pressure measurement for diagnosing and managing hypertensive disorders in pregnancy on subsequent maternal and perinatal outcomes, women's quality of life, or use of health service resources.
Methods
Criteria for considering studies for this review
Types of studies
We included all randomised controlled trials (RCT), including cluster‐RCTs, that use either automated blood pressure (BP) devices previously validated (as per The Association for the Advancement of Medical Instrumentation, the British & Irish Hypertension Society (BIHS), and the European Society of Hypertension (ESH)) in a pregnant population, or calibrated mercury or aneroid sphygmomanometers and appropriate cuffing. We excluded cross‐over randomised controlled designs and quasi‐randomised designs. Outcomes were not part of the criteria for including studies.
Types of participants
Studies involving pregnant women (including all gestations of pregnancy), including RCTs delivering interventions at the population level that were primarily intended for pregnant women.
Types of interventions
Eligible interventions were the use of the following listed settings and techniques for assessment, decision making, or management.
Setting
-
Ambulatory measurement (using automated devices that provide a large number of device‐initiated BP measurements over a period of time, usually a 24‐hour period) versus conventional clinic BP measurement
-
Self‐measurement (using an automated BP device at home) versus conventional clinic BP measurement
Technique
-
Auscultatory technique (using calibrated aneroid or mercury sphygmomanometer) versus automated technique (using oscillometric devices) to measure BP
-
Korotkoff phase IV (K4, muffling sound) versus Korotkoff phase V (K5, disappearance of sound) to represent diastolic BP
-
Resting for at least five minutes from arrival at clinic prior to BP measurement versus immediate BP measurement on arrival in clinic
-
Multiple BP measurements at one clinic visit versus one BP measurement at one clinic visit
-
Appropriately sized cuff versus universal cuff (cuff designed to be used in all women, regardless of arm circumference)
-
Systolic BP versus diastolic BP
-
Systolic or diastolic BP, or both, versus mean arterial pressure
Types of outcome measures
Primary outcomes
Systolic BP greater than or equal to 150 mmHg
Secondary outcomes
Maternal outcomes
-
Maternal death: death during pregnancy, or up to 42 days after end of pregnancy
-
Maternal morbidity
-
Pre‐eclampsia
-
Eclampsia
-
Cerebrovascular event
-
Renal failure
-
Hepatic failure
-
HELLP syndrome (haemolysis, elevated liver enzymes, and low platelet count)
-
Disseminated intravascular coagulation
-
Pulmonary oedema
-
Placental abruption
-
Obstetric haemorrhage
-
Neonatal outcomes
-
Death
-
Stillbirth: death in utero, at or after 20 weeks' gestation
-
Neonatal death: death in the first 28 days after birth
-
Perinatal mortality: stillbirth and early neonatal deaths (death in the first seven days after birth)
-
-
Neonatal morbidity
-
Preterm birth: birth before 37 completed weeks' gestation
-
Use of health service resources
-
Maternal
-
Number of antenatal clinic visits
-
Number of antenatal hospital admissions
-
Induction of labour
-
Operative delivery
-
Maternal admission to intensive care
-
Maternal length of stay in intensive care
-
Ventilation
-
Dialysis
-
-
Neonatal
-
Neonatal unit admission
-
Neonatal unit length of stay
-
Endotracheal intubation and use of mechanical ventilation
-
Measures of maternal quality of life
-
Maternal experiences and views of the interventions
-
Maternal anxiety
-
Maternal self‐confidence
Search methods for identification of studies
The methods section of this review is based on a standard template used by Cochrane Pregnancy and Childbirth.
Electronic searches
We searched Cochrane Pregnancy and Childbirth’s Trials Register by contacting their Information Specialist (22 April 2020).
The Register is a database containing over 25,000 reports of controlled trials in the field of pregnancy and childbirth. It represents over 30 years of searching. For full current search methods used to populate Pregnancy and Childbirth’s Trials Register, including the detailed search strategies for CENTRAL, MEDLINE, Embase, and CINAHL; the list of hand searched journals and conference proceedings; and the list of journals reviewed via the current awareness service; please follow this link.
Briefly, Cochrane Pregnancy and Childbirth’s Trials Register is maintained by their Information Specialist, and contains trials identified from:
-
monthly searches of the Cochrane Central Register of Controlled Trials (CENTRAL);
-
weekly searches of MEDLINE Ovid;
-
weekly searches of Embase Ovid;
-
monthly searches of CINAHL EBSCO;
-
handsearches of 30 journals and the proceedings of major conferences;
-
weekly current awareness alerts for a further 44 journals, plus monthly BioMed Central email alerts.
Two people screen search results and review the full text of all relevant trial reports identified through the searching activities described above. Based on the intervention described, they assign each trial report a number that corresponds to a specific Pregnancy and Childbirth review topic (or topics), and then add it to the Register. The Information Specialist searches the Register for each review using this topic number rather than keywords. This results in a more specific search set that has been fully accounted for in the relevant review sections (Included studies; Excluded studies; Studies awaiting classification; Ongoing studies).
In addition, we searched ClinicalTrials.gov and the WHO ICTRP for unpublished, planned, and ongoing trial reports (22 April 2020) using the search methods detailed in Appendix 1.
Searching other resources
We searched the reference lists of retrieved studies.
We endeavoured to contact the study authors if the information we required was not included in the full article.
We did not apply any language or date restrictions.
Data collection and analysis
We used the following methods to assess the reports identified in the search. The methods section of this review is based on a standard template used by Cochrane Pregnancy and Childbirth.
Selection of studies
Two review authors independently assessed for inclusion all the potential studies identified as a result of the search strategy. They resolved any disagreement through discussion, or if required, through consultation with a third review author.
Data extraction and management
We designed a form to extract data. For eligible studies, two review authors extracted the data using the agreed form. We resolved discrepancies through discussion, or if required, through consultation with a third review author. We entered data into Review Manager 5 software (RevMan 5), and checked it for accuracy (Review Manager 2014).
When information regarding any of the above was unclear, we contacted authors of the original reports to provide further details.
Assessment of risk of bias in included studies
Two review authors independently assessed risk of bias for each study using the criteria outlined in the Cochrane Handbook for Systematic Reviews of Interventions (Higgins 2011). We resolved any disagreement by discussion, or by involving a third review author.
For cluster‐randomised trials, we considered recruitment bias, baseline imbalance, loss of clusters, incorrect analysis, and comparability with individually randomised trials.
Random sequence generation (checking for possible selection bias)
For each included study, we described the method used to generate the allocation sequence in sufficient detail to allow an assessment of whether it should produce comparable groups.
We assessed the method as being at:
-
low risk of bias (any truly random process, e.g. random number table; computer random number generator);
-
high risk of bias (any non‐random process, e.g. odd or even date of birth; hospital or clinic record number);
-
unclear risk of bias.
Allocation concealment (checking for possible selection bias)
For each included study, we described the method used to conceal allocation to interventions prior to assignment, and assessed whether intervention allocation could have been foreseen in advance of or during recruitment or changed after assignment.
We assessed the methods as being at:
-
low risk of bias (e.g. telephone or central randomisation; consecutively numbered sealed opaque envelopes);
-
high risk of bias (open random allocation; unsealed or non‐opaque envelopes, alternation; date of birth);
-
unclear risk of bias.
Blinding of participants and personnel (checking for possible performance bias)
For each included study, we described the methods used, if any, to blind study participants and personnel from knowledge of which intervention a participant received. We considered that studies were at low risk of bias if they were blinded, or if we judged that the lack of blinding would be unlikely to affect results.
We assessed the methods as being at:
-
low, high, or unclear risk of bias for participants;
-
low, high, or unclear risk of bias for personnel.
Blinding of outcome assessment (checking for possible detection bias)
For each included study, we described the methods used, if any, to blind outcome assessors from knowledge of which intervention a participant received.
We assessed methods used to blind outcome assessment as being at low, high, or unclear risk of bias.
Incomplete outcome data (checking for possible attrition bias due to the amount, nature and handling of incomplete outcome data)
For each included study, and for each outcome or class of outcomes, we described the completeness of data, including attrition and exclusions from the analysis. We stated whether studies reported attrition and exclusions, as well as the numbers included in the analysis at each stage (compared with the total randomised participants), reasons for attrition or exclusion where reported, and whether missing data were balanced across groups, or were related to outcomes. We contacted authors where there were missing data, and included them, were appropriate, information was provided.
We assessed methods as being at:
-
low risk of bias (e.g. no missing outcome data; missing outcome data balanced across groups);
-
high risk of bias (e.g. numbers or reasons for missing data imbalanced across groups; 'as treated' analysis done with substantial departure of intervention received from that assigned at randomisation);
-
unclear risk of bias.
Selective reporting (checking for reporting bias)
For each included study, we described how we investigated the possibility of selective outcome reporting bias and what we found.
We assessed the methods as being at:
-
low risk of bias (where it was clear that the study reported all prespecified outcomes and all expected outcomes of interest to the review);
-
high risk of bias (where authors did not report all the study's prespecified outcomes; did not prespecify one or more reported primary outcomes; incompletely reported outcomes of interest, rendering them unfit for analysis; failed to include results of a key outcome that they would have been expected to report);
-
unclear risk of bias.
Other bias (checking for bias due to problems not covered by the domains described above)
For each included study, we described any important concerns we had about other possible sources of bias.
We assessed whether each study was free of other problems that could put it at risk of bias, assigning it as being at:
-
low risk of other bias;
-
high risk of other bias;
-
unclear risk of other bias.
Overall risk of bias
We made explicit judgements about whether studies were at high risk of bias, according to the criteria given in Higgins 2011. With reference to the risk of bias domains, we assessed the likely magnitude and direction of the bias, and whether we considered it likely to impact on the findings.
If the quantity of data had allowed, we would have explored the impact of the level of bias by undertaking sensitivity analyses – see Sensitivity analysis.
Measures of treatment effect
Dichotomous data
For dichotomous data, we presented results as a summary risk ratio (RR) with 95% confidence intervals (CI).
For one of the trials, we reported adjusted data to account for the stepped‐wedge cluster design (Vousden 2019). In data and analysis tables, we reported summary RRs, as planned, instead of odds ratios (ORs), as reported by trial authors.
Continuous data
For continuous data, we planned to use the mean difference if outcomes were measured in the same way between trials. We would have used the standardised mean difference to combine trials that measured the same outcome but used different methods.
Unit of analysis issues
Cluster‐randomised trials
We identified one cluster‐randomised trial (Vousden 2019), which was not combined with any other trials in a meta‐analysis because it did not address the same comparison as any other trial. Within this trial, for our outcome of interest (maternal death), we used reported data (which had been adjusted using a 'bent stick' approach, adapted from the approach used for interrupted time series for a stepped wedge cluster‐randomised trial (Bernal 2017)). We entered these data into RevMan 5 using the generic inverse variance (Review Manager 2014). Although reported as ORs by the trial authors, we presented them as RRs, as the outcome was rare (maternal death), and thus the OR approximated the RR closely (McNutt 2003).
In future updates, if we identify both cluster‐randomised trials and individually randomised trials investigating the same comparisons, we plan to synthesise the relevant information. We will consider it reasonable to combine the results from both if there is little heterogeneity between the study designs, and we consider the interaction between the effect of intervention and the choice of randomisation unit to be unlikely. We will adjust their standard errors using the methods described in Section 16.3.4 or 16.3.6 of Higgins 2011, using an estimate of the intracluster correlation co‐efficient (ICC) derived from the trial (if possible), from a similar trial, or from a study of a similar population. If we use ICCs from other sources, we will report this, and conduct sensitivity analyses to investigate the effect of variation in the ICC.
We will also acknowledge heterogeneity in the randomisation unit, and perform a subgroup analysis to investigate the effects of the randomisation unit.
Other unit of analysis issues
We did not identify any other unit of analysis issues in this version of the review. In future updates, we may include multi‐arm studies in relevant analyses, for example, ambulatory versus self (automated) versus conventional clinic BP measurement. We would include factorial studies in all relevant analyses, as two separate studies. For example, we may include ambulatory versus self BP measurement (SBPM), and appropriate cuff size versus universal cuff factorial studies in a meta‐analysis of ambulatory versus self in the appropriate cuff size group and the universal cuff group.
Dealing with missing data
We noted levels of attrition in the included studies. If combining studies in meta‐analyses had been possible, we would have explored the impact of including studies with high levels of missing data in the overall assessment of treatment effect by using a sensitivity analysis.
For all outcomes, we carried out analyses, as far as possible, on an intention‐to‐treat basis; we attempted to include all participants randomised to each group in the analyses, and we analysed all participants in the group to which they were allocated, regardless of whether or not they received the allocated intervention. The denominator for each outcome, in each trial, is the number randomised minus any participants whose outcomes are known to be missing.
Assessment of heterogeneity
Since combining studies in meta‐analyses was not possible, it was not necessary to consider heterogeneity. If meta‐analysis is possible in future updates, we will assess statistical heterogeneity in each meta‐analysis using Tau², and I², and Chi² statistics. We will regard heterogeneity as substantial if I² is greater than 30%, and either Tau² is greater than zero, or there is a low P value (less than 0.10) in the Chi² test for heterogeneity.
Assessment of reporting biases
If meta‐analysis is possible in future updates, and if there are 10 or more studies in the meta‐analysis, we will investigate reporting biases (such as publication bias) using funnel plots. We will assess funnel plot asymmetry visually, and at any suggestion of asymmetry, we will perform exploratory analyses to investigate it.
Data synthesis
We carried out statistical analysis using RevMan 5 (Review Manager 2014). If meta‐analysis is possible in future updates, we will use the fixed‐effect model to combine data, where it is reasonable to assume that studies are estimating the same underlying treatment effect, that is, where trials are examining the same intervention, and the trials' populations and methods are sufficiently similar. If there is sufficient clinical heterogeneity to suggest that the underlying treatment effects differ between trials, or if we detect substantial statistical heterogeneity, we will use the random‐effects model to produce an overall summary, if we determine an average treatment effect across trials is considered clinically meaningful. We will treat the random‐effects summary as the average range of possible treatment effects, and we will discuss the clinical implications of treatment effects differing between trials. If the average treatment effect is not clinically meaningful, we will not combine trials.
If we use the random‐effects model, we will present the results as the average treatment effect with 95% confidence intervals, and the estimates of Tau² and I².
Subgroup analysis and investigation of heterogeneity
If meta‐analysis is possible in future updates, and we identify substantial heterogeneity, we will investigate it using subgroup analyses and sensitivity analyses.
We plan to carry out the following subgroup analyses.
-
Women at low or average risk of hypertension in pregnancy (unselected) versus women defined as being at high risk of hypertension in pregnancy (these will include women selected by the trial authors on the basis of an increased risk of hypertension in pregnancy, e.g. women with previous pre‐eclampsia).
-
Women with hypertension, without other signs of pre‐eclampsia versus women with established pre‐eclampsia or eclampsia.
-
Low‐ and middle‐income country setting versus high‐income country setting.
We will assess the primary outcome (systolic BP ≥ 150 mmHg) in subgroup analysis.
We will assess subgroup differences by interaction tests available in RevMan 5, reporting the results of subgroup analyses along with the Chi² statistic, P value, and the interaction test I² value (Review Manager 2014).
Sensitivity analysis
If meta‐analysis is possible in future updates, we will perform sensitivity analysis for the studies at high (or unclear) risk of selection bias (allocation concealment and sequence generation) and attrition bias. If studies are at high or unclear risk of bias for one or more of these domains, we will exclude them from the sensitivity analysis. It is likely that most studies will not have blinded participants, so this will not be one of our key domains for sensitivity analysis.
In future updates, where meta‐analysis is possible, we will also explore the robustness of our findings by excluding studies with high levels of missing data.
Summary of findings and assessment of the certainty of the evidence
We assessed the certainty of the evidence using the GRADE approach, as outlined in the GRADE handbook, in order to assess the quality of the body of evidence relating to the following outcomes for the main comparisons.
Maternal outcomes
-
Systolic BP greater than or equal to 150 mmHg
-
Maternal death
-
Pre‐eclampsia
-
Number of antenatal hospital admissions
-
Maternal admission to intensive care
-
Induction of labour
Neonatal outcomes
-
Stillbirth
-
Neonatal death
-
Perinatal mortality
-
Preterm birth
-
Neonatal unit admission
-
Neonatal unit length of stay
-
Endotracheal intubation and use of mechanical ventilation
We used GRADEpro GST to import data from RevMan 5, in order to create ’Summary of findings’ tables (GRADEpro GDT; Review Manager 2014). A summary of the intervention effect and a measure of quality for each of the above outcomes were produced using the GRADE approach.
The GRADE approach uses five considerations (study limitations, consistency of effect, imprecision, indirectness, and publication bias) to assess the certainty of the body of evidence for each outcome. The evidence can be downgraded from 'high certainty' by one level for serious (or by two levels for very serious) limitations, depending on assessments for risk of bias, indirectness of evidence, serious inconsistency, imprecision of effect estimates, or potential publication bias.
Results
Description of studies
Results of the search
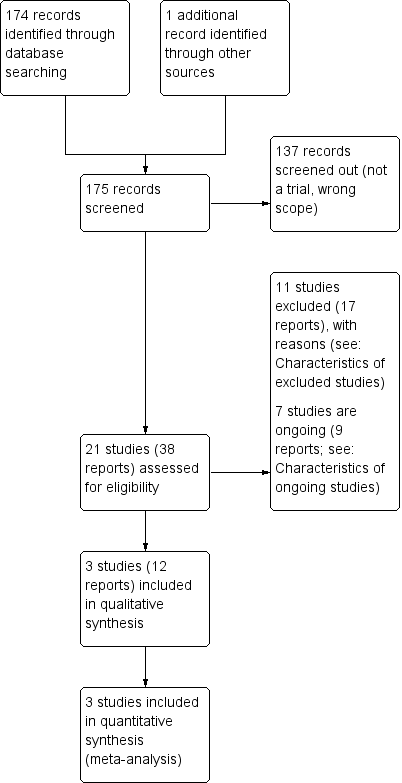
The search (22 April 2020) retrieved 37 trial reports to assess. One additional report was identified through contact with one of the trial authors. Of the 38 trial reports, there were: 16 peer‐reviewed papers, nine abstracts, and 13 study registrations. These 38 reports represented 21 individual studies, with multiple reports related to the same study. We successfully contacted eight authors when we required additional information.
Of the 21 studies identified, we included three in the review, excluded 11, and seven were ongoing. Figure 1 shows the study flow diagram.
Study flow diagram
Included studies
We included three studies were included in this review (Brown 1998; Pealing 2019a; Vousden 2019). Study details are shown in Characteristics of included studies.
Design
All three included studies were prospective, multi‐centred, two‐arm randomised controlled trials (RCT), including one feasibility study (Pealing 2019a), and a pragmatic cluster‐RCT (Vousden 2019). One study was published in 1998, and the other two over two decades later in 2019 (participants recruited between 2015 and 2017).
Sample sizes
Of the three included studies: two were small (with a total of 374 women recruited across six maternity units), and one was large (a total of 536,233 deliveries across 10 clusters).
Setting
Two studies took place in high‐income countries; one in Australia (Brown 1998), and the other in the UK (Pealing 2019a). The third study was conducted in middle‐ or low‐income countries (Ethiopia, Sierra Leone, Zimbabwe, Uganda, Zambia, Malawi, India and Haiti; Vousden 2019).
Participants
Two studies recruited pregnant women with hypertension, and the third, pregnant or postpartum women presenting for maternity care (Vousden 2019).
Interventions and comparisons
Of the three included studies, one explored setting of blood pressure (BP) measurement, two explored techniques of BP measurement for diagnosing and managing hypertensive disorders in pregnancy on subsequent maternal and perinatal outcomes (Brown 1998; Vousden 2019). For all three included studies, we were able to successfully contact trial authors for additional information including outcome definitions (Pealing 2019a), details of BP device calibration and cuffing used (Brown 1998), and secondary outcome data capture (Vousden 2019).
Setting of BP measurement: self‐measurement (using an automated BP device at home) versus conventional clinic BP measurement
The OPTIMUM‐BP study assessed the feasibility of self‐monitoring BP, versus usual care, for the management of pregnancy hypertension in 154 women (Pealing 2019a).
Technique of BP measurement: Korotkoff phase IV (K4, muffling sound) versus Korotkoff phase V (K5, disappearance of sound) to represent diastolic BP
Brown 1998 explored the management of pregnancy hypertension in 220 pregnant women with diastolic hypertension, using different arterial sounds, either Korotkoff phase IV (K4, muffling sound) or Korotkoff phase V (K5, disappearance of sound), and its influence on maternal and fetal outcomes, and the likelihood of episodes of severe hypertension.
Technique of BP measurement: auscultatory technique (using calibrated aneroid or mercury sphygmomanometer) versus automated technique (using oscillometric devices) to measure BP
The CRADLE‐3 trial aimed to determine whether implementation of the CRADLE device (a hand‐held, upper‐arm, semi‐automated BP device that incorporates a traffic‐light early warning system that alerts healthcare professionals to abnormalities in BP and pulse) and an education package, into maternity care in low‐resource settings could reduce a composite of all‐cause maternal mortality or major morbidity, with information collected on 536,233 deliveries from 10 clusters across Africa, India, and Haiti (Vousden 2019).
We decided that the CRADLE intervention addressed the objectives of this review (automated oscillometric device compared with previous usual care). The intervention was an automated oscillometric device with additional features (early warning system and an eduction package), compared to usual care, in which a variety of locally available BP devices were used and clinical management followed local guidelines. We recognise that the main component of the CRADLE intervention was the BP monitoring device. Typically, all BP devices come with training, delivered either generically or specifically. As the CRADLE intervention was being introduced into settings where previous training was uncertain, training was an explicit part of the intervention.
Outcomes
None of the included studies report our primary outcome of systolic BP greater than or equal to 150 mmHg. All of the included studies reported maternal death, and only one included study reported on any one of the following outcomes: maternal admission to intensive care, induction of labour, stillbirth, neonatal death, perinatal mortality and preterm birth, and neonatal unit admission.
None of the studies reported the following secondary outcomes:
-
renal failure;
-
hepatic failure;
-
disseminated intravascular coagulation;
-
pulmonary oedema;
-
placental abruption;
-
obstetric haemorrhage;
-
number of antenatal clinic visits;
-
number of antenatal hospital admissions;
-
maternal length of stay in intensive care;
-
ventilation (maternal);
-
dialysis (maternal);
-
neonatal unit length of stay;
-
neonatal endotracheal intubation and use of mechanical ventilation;
-
women's experiences and views of the interventions;
-
maternal anxiety;
-
maternal self confidence.
Excluded studies
We excluded eleven studies. Study details are shown in Characteristics of excluded studies. Studies were excluded because:
1. BP monitors used are not validated (automated BP devices) or calibrated (sphygmomanometers) for use in the hypertensive pregnant population (7 studies). When the BP monitor used was not fully documented in the identified reports, we contracted trial authors for further information. Excluded BP monitors were as follows.
-
Brown 2012 and Denolle 2008 used the Omron HEM‐705CP. Although both studies reported the device was validated in pregnancy, they did not reference a validation paper, and the review authors found peer‐reviewed papers invalidating this device (Gupta 1997; Lo 2002). A systematic review of BP validation studies does not recommend the use of this BP device (Bello 2018).
-
Cartwright 1992 used the Dinamap 1846SX. No validation paper was referenced, and the review authors found peer‐reviewed papers invalidating this device (Franx 1994; Green 1996), alongside a review that does not recommended use of this BP device (Bello 2018).
-
Duggan 1999 used the QuietTrak ambulatory. No validation paper was referenced; the review authors found peer‐reviewed papers invalidating this device (Penny 1996; Nataranjan 1999). The European Society of Hypertension Working Group on Blood Pressure Monitoring did not recommend this BP devise in their clinical review (O'Brien 2001a).
-
Rhodes 2018 used the Spacelabs 90207. Although a validation paper was referenced in the study paper (Shennan 1993), the review authors found peer‐reviewed papers invalidating this device (Nataranjan 1999), or not recommending its use (O'Brien 1993a; Franx 1997; Shennan 1996). This BP device is also not recommended by reviews of BP devices (Bello 2018; O'Brien 2001a), or on the Dabl education website.
-
Ross‐McGill 2000 used the Omron Rx (author contacted to establish BP device details). No validation paper has been published in the pregnant population (adult population validation; Cuckson 2004).
-
Leung 1998 used unspecified home BP monitors (author contacted to establish BP device details).
We used a variety of sources to assess validation, including published literature and websites, including: STRIDE BP, the BIHS, and Dabl education website. The latter is supported by manufacturers of BP devices, however, this did not appear to have influenced the list of validated devices for use in pregnancy, as none of our excluded BP devices were listed as validated for use in pregnancy.
2. Reference type not eligible for the review (1 study): a protocol (Aslani 2014).
3. Study type not eligible for the review (3 studies): cross‐over RCTs (Holm 2019; Mangos 2012; NCT03222414).
Ongoing studies
Of the seven ongoing studies, estimated study completion dates ranged from December 2019 to April 2023. Study details are shown in Characteristics of ongoing studies.
Risk of bias in included studies
We judged the included studies to be generally at low risk of bias (Figure 2; Figure 3).

Risk of bias graph: review authors' judgements about each 'Risk of bias' item presented as percentages across all included studies

Risk of bias summary: review authors' judgements about each 'Risk of bias' item for each included study
Allocation
Random sequence generation: All three studies described random components in the sequence generation, all detailing computer‐generated methods, and thus were assessed at low risk of bias.
Allocation concealment: two of the three studies described the methods used to conceal the allocation sequence and we assessed them at low risk of bias, because it was unlikely that the intervention allocation could have been foreseen. Pealing 2019a used secure web‐based software to conceal allocation; Vousden 2019 stated that "all clusters were masked to the order until two months before receiving the intervention, when the next cluster to receive the intervention was informed". It was unclear whether allocation was concealed in the remaining study, as it did not provide details of the method of concealment.
Blinding
Blinding of participants and personnel: due to the nature of the interventions, all three studies were unblinded, with study participants, healthcare professionals, and investigators aware of the intervention allocated. Blinding is not possible when exploring BP setting with a self‐monitoring BP intervention (OPTIMUM‐BP (Pealing 2019a), and is difficult when exploring BP techniques, due to the influence of BP on clinical management decisions, and the high frequency of BP measurements taken throughout pregnancy by a variety of different staff members. We assessed the risk of performance bias for all three studies at low risk of bias, because we decided that lack of blinding was unlikely to influence trial outcomes.
Blinding of outcome assessment: one of the three studies conducted a blinded endpoint analysis, and we assessed it at low risk of detection bias (Brown 1998). Outcome assessors in the two remaining trials were aware of intervention allocation, as outcomes were ‘hard clinical outcomes’. We decided that lack of blinding was unlikely to influence outcome assessment. We assessed Pealing 2019a at low risk of bias, and Vousden 2019 as unclear risk, because in balance, although the outcomes were ‘hard clinical outcomes’ and thus, unlikely to be influenced by lack of blinding, the authors also stated that a limitation was that the same team implemented and collected data, introducing possible measurement bias.
These assessments are further supported by a recent meta‐epidemiological study that explored the impact of blinding on estimated treatment effects in a wide range of meta‐analyses, which concluded that "No evidence was found for an average difference in estimated treatment effect between trials with and without blinded patients, healthcare providers, or outcome assessors" (Moustgaard 2020).
Incomplete outcome data
All three studies reported outcome data and analysis for all or almost all women randomised, and thus we assessed them at low risk of attrition bias.
Selective reporting
With no study protocol or trial registration for Brown 1998, we assessed the risk of selective reporting bias as unclear, as we did not know the expected outcomes and outcome measures. We assessed the remaining two studies at low risk of selective reporting as outcomes and outcome measures were prespecified in an ISRCTN registry (Pealing 2019a), or in a published protocol (Vousden 2019).
Other potential sources of bias
We identified other potential sources of bias for all three studies, but judged none of them at high risk of bias. In Pealing 2019a, other biases related to the evidence of cross‐over and imbalance between groups. The trial authors addressed both of these potential sources of bias; they reported that the imbalance between groups was expected because it was a feasibility study, and they minimised the effects of cross‐over by using an intention‐to‐treat analysis.
Effects of interventions
See: Summary of findings 1 Setting of BP measurement: self‐measurement versus conventional clinic measurement; Summary of findings 2 Technique of BP measurement: Korotkoff phase IV versus Korotkoff phase V to represent diastolic BP; Summary of findings 3 Technique of BP measurement: CRADLE intervention versus usual care
Comparison 1: Setting. Self‐measurement (using an automated BP device at home) versus conventional clinic measurement
One study (154 women) investigated the effects of self‐measurement of BP to manage pregnancy hypertension (Pealing 2019a; summary of findings Table 1). Pealing 2019a calculated results separately by hypertensive status (chronic hypertension and gestational hypertension); we combined the data in our analyses.
Primary outcomes
Systolic BP greater than or equal to 150 mmHg
Not reported.
Secondary outcomes
Maternal outcomes
Maternal death
No women in either the self‐monitoring (0/102) or the usual care group died (0/52; Analysis 1.1).
Pre‐eclampsia
Self‐monitoring may lead to slightly more diagnoses of pre‐eclampsia compared with usual care (risk ratio (RR) 1.49, 95% CI 0.87 to 2.54; 1 study, 154 women; low‐certainty evidence; Analysis 1.1) but the 95% CI is wide and includes the possibility of fewer diagnoses of pre‐eclampsia with self‐monitoring. It may be that 12.3% more women will have pre‐eclampsia diagnosed with self‐monitoring than with usual care (from 3.3% fewer to 38.5% more).
Eclampsia
Two women in the usual care group had eclampsia diagnosed compared with none in the self‐monitoring group (RR 0.10, 95% CI 0.01 to 2.11; 1 study, 154 women; Analysis 1.2).
Cerebrovascular event
Not reported.
Renal failure
Not reported.
Hepatic failure
Not reported.
HELLP syndrome
One woman in the self‐monitoring group developed HELLP syndrome compared with none in the usual care group (RR 1.54, 95% CI 0.06 to 37.25; 1 study, 154 women; Analysis 1.3).
Disseminated intravascular coagulation
Not reported.
Pulmonary oedema
Not reported.
Placental abruption
Not reported.
Obstetric haemorrhage
Not reported.
Neonatal outcomes
Stillbirth
Pealing 2019a defined stillbirth as death after 24 weeks in utero.
There were 2/102 stillbirths in the self‐monitoring group compared with 0/52 in the usual care group. We are uncertain if there is any difference between groups in the incidence of stillbirth, because the certainty of evidence is low, and the 95% CI is very wide, and includes both appreciable harm and appreciable benefit (RR 2.57, 95% CI 0.13 to 52.63; 1 study, 154 babies; low‐certainty evidence; Analysis 1.4).
Neonatal death
There was 1/102 death in the self‐monitoring group compared with 0/52 in the usual care group. We are uncertain if there is any difference between groups in the incidence of neonatal death, because the certainty of evidence is low, and the 95% CI is very wide and includes both appreciable harm and appreciable benefit (RR 1.54, 95% CI 0.06 to 37.25; 1 study, 154 babies; low‐certainty evidence; Analysis 1.5).
Perinatal mortality
Not reported.
Preterm birth
Pealing 2019a defined preterm birth as birth before 34 completed weeks' gestation.
There were 9/102 preterm births in the self‐monitoring group compared with 4/52 in the usual care group. We are uncertain if there is any difference between groups in the incidence of preterm birth, because the certainty of evidence is low, and the 95% CI is wide and includes both appreciable harm and appreciable benefit (RR 1.15, 95% CI 0.37 to 3.55; 1 study, 154 babies; low‐certainty evidence; Analysis 1.6).
Use of health service resources
Maternal: number of antenatal clinic visits
Not reported.
Maternal: number of antenatal hospital admissions
Not reported.
Maternal: induction of labour
There may be little to no difference between self‐monitoring and usual care for induction of labour (RR 1.09, 95% CI 0.82 to 1.45; 1 study, 154 women; low‐certainty evidence; Analysis 1.7).
Maternal: operative delivery
In the self‐monitoring group, 64/102 women had a caesarean section birth compared with 24/52 in the usual group (RR 1.36, 95% CI 0.98 to 1.89; 1 study, 154 women; Analysis 1.8).
Maternal: admission to intensive care
In the self‐monitoring group, 1/102 woman was admitted to intensive care, compared with 0/52 in the usual care group. We are uncertain if there is any difference between groups in admission to intensive care, because the certainty of evidence is low, and the 95% CI is very wide and includes both appreciable harm and appreciable benefit (RR 1.54, 0.06 to 37.25; 1 study, 154 women; low‐certainty evidence; Analysis 1.9).
Maternal: length of stay in intensive care
Not reported.
Maternal: ventilation
Not reported.
Maternal: dialysis
Not reported.
Neonatal: neonatal unit admission
Self‐monitoring may lead to slightly more neonatal unit admissions compared with usual care (RR 1.53, 0.65 to 3.62; 1 study, 154 women; low‐certainty evidence; Analysis 1.10) but the 95% CI is wide and includes the possibility of fewer admissions with self‐monitoring. Self‐monitoring may lead to 6.1% more neonatal unit admissions with self‐monitoring compared with usual care (from 4% fewer to 30.2% more).
Neonatal: neonatal unit length of stay
Not reported.
Neonatal: endotracheal intubation and use of mechanical ventilation
Not reported.
Measures of maternal quality of life
Not reported.
Comparison 2: Technique. Korotkoff phase IV (K4, muffling sound) versus Korotkoff phase V (K5, disappearance of sound) to represent diastolic BP
One study (220 women) investigated management of hypertensive pregnancies according to either Korotkoff phase IV (K4, muffling sound) or Korotkoff phase V (K5,disappearance of sound) to represent diastolic BP (Brown 1998; summary of findings Table 2). The primary outcome was severe hypertension, defined as either systolic BP 170 mmHg, or diastolic BP 110 mmHg, or both. As systolic and diastolic severe hypertension were not reported separately, our primary outcome could not be extracted.
Primary outcomes
Systolic BP greater than or equal to 150 mmHg
Not reported.
Secondary outcomes
Maternal outcomes
Maternal death
There were no maternal deaths in either the K4 group (N = 103 women) or the K5 group (N = 117; Analysis 2.1).
Pre‐eclampsia
There may be little to no difference between K4 and K5 in terms of pre‐eclampsia diagnosis (RR 1.16, 95% CI 0.89 to 1.49; 1 study, 220 women; low‐certainty evidence; Analysis 2.1) but the wide 95% CI includes the possibility of more pre‐eclampsia diagnoses with K4.
Eclampsia
Not reported.
Cerebrovascular event
Not reported.
Renal failure
Not reported.
Hepatic failure
Not reported.
HELLP syndrome
Not reported.
Disseminated intravascular coagulation
Not reported.
Pulmonary oedema
Not reported.
Placental abruption
Not reported.
Obstetric haemorrhage
Not reported.
Neonatal outcomes
Stillbirth
Not reported.
Neonatal death
Not reported.
Perinatal mortality
We are uncertain if the use of K4 reduces or increases perinatal mortality, because the certainty of evidence is low, and the 95% CI is wide and includes both appreciable harm and appreciable benefit (RR 1.14, 95% CI 0.16 to 7.92; 1 study, 220 women; low‐certainty evidence; Analysis 2.2).
Preterm birth
Not reported.
Use of health service resources
Not reported.
Measures of maternal quality of life
Not reported.
Comparison 3: Technique. CRADLE intervention (CRADLE device, a semi‐automated BP monitor with additional features, and education package) versus usual care
One stepped‐wedge cluster‐RCT investigated the introduction of the CRADLE device (Microlife 3AS1‐2) and an education package (Vousden 2019; 536,233 deliveries; summary of findings Table 3).
Here we present adjusted data (reported in the trial report) as RRs (as planned), as the outcomes were rare, in which case, odds ratio (OR) closely approximated the RR.
Primary outcomes
Systolic BP greater than or equal to 150 mmHg
Not reported.
Secondary outcomes
Maternal outcomes
Maternal death
There may be little to no difference in the number of maternal deaths following the introduction of the CRADLE device compared with usual care (adjusted RR 0.80, 95% CI 0.30 to 2.11; 1 study, 536,233 deliveries; low‐certainty evidence; Analysis 3.1).
Pre‐eclampsia
Not reported.
Eclampsia
The number of women who were diagnosed with eclampsia following the introduction of the CRADLE device was 1378/288,995, compared with 1314/247,238 following usual care (adjusted RR 1.91, 95% CI 0.91 to 4.02; 1 study, 536,233 deliveries; Analysis 3.2).
Cerebrovascular event
The number of women who had a stroke was only collected for women with the primary outcome (a selected subdivision of the main study population identified by an outcome, not by baseline characteristics, thereby, breaking the random allocation). Therefore, trial groups would not have comparable populations, and any differences between the groups could not be attributed to the intervention, so, we did not use data relating to secondary maternal outcomes.
Renal failure
Not reported.
Hepatic failure
Not reported.
HELLP syndrome
Not reported.
Disseminated intravascular coagulation
Not reported.
Pulmonary oedema
Not reported.
Placental abruption
Not reported.
Obstetric haemorrhage
Not reported.
Neonatal outcomes
Stillbirth
The number of stillbirths was only collected from women with the primary outcome (a selected subdivision of the main study population identified by an outcome, not by baseline characteristics, thereby, breaking the random allocation). Therefore, trial groups would not have comparable populations, and any differences between the groups could not be attributed to the intervention, so, we did not use data relating to secondary neonatal outcomes.
Neonatal death
The number of neonatal deaths was only collected from women with the primary outcome (a selected subdivision of the main study population identified by an outcome, not by baseline characteristics, thereby, breaking the random allocation). Therefore, trial groups would not have comparable populations, and any differences between the groups could not be attributed to the intervention, so, we did not use data relating to secondary neonatal outcomes.
Perinatal mortality
Not reported.
Preterm birth
Not reported.
Use of health service resources
Maternal: number of antenatal clinic visits
Not reported.
Maternal: number of antenatal hospital admissions
Not reported.
Maternal: induction of labour
Not reported.
Maternal: operative delivery
The number of women birthing by caesarean section was only collected from women with the primary outcome (a selected subdivision of the main study population identified by an outcome, not by baseline characteristics, thereby, breaking the random allocation). Therefore, trial groups would not have comparable populations, and any differences between the groups could not be attributed to the intervention, so, we did not use data relating to secondary maternal outcomes.
Maternal: intensive care admission
Maternal admissions to an intensive care unit were only collected for women with the primary outcome (a selected subdivision of the main study population identified by an outcome, not by baseline characteristics, thereby, breaking the random allocation). Therefore, trial groups would not have comparable populations, and any differences between the groups could not be attributed to the intervention, so, we did not use data relating to secondary maternal outcomes.
Maternal: length of stay in intensive care admission
Not reported.
Maternal: ventilation
Not reported.
Maternal: dialysis
Not reported.
Neonatal: neonatal unit admission
Not reported.
Neonatal: neonatal unit length of stay
Not reported.
Neonatal: endotracheal intubation and use of mechanical ventilation
Not reported.
Measures of maternal quality of life
Not reported.
Discussion
Summary of main results
We identified three randomised controlled trials (RCT), with a total of 536,607 women (one of which was a cluster‐RCT involving 536,233 deliveries), to assess the effects of setting and technique of blood pressure (BP) measurement for diagnosing and managing hypertensive disorders in pregnancy, on maternal and perinatal outcomes, and use of health service resources. We judged the studies to be generally at low risk of bias, and the certainty of evidence low.
Of the nine prespecified settings and techniques we wished to assessed, studies addressed three: one examined setting (self‐monitoring BP versus usual care), and two examined techniques (Korotkoff phase IV (K4) versus Korotkoff phase V (K4); and the CRADLE device versus usual care).
Self‐measurement (using an automated BP device at home) versus conventional clinic BP measurement
Low‐certainty evidence shows that self‐monitoring BP compared with usual care may lead to slightly more diagnoses of pre‐eclampsia, may make little to no difference to the likelihood of induction of labour, and may lead to slightly more neonatal unit admissions.
As the certainty of the evidence is low (downgraded two levels for imprecision due to the small sample size, few events and wide 95% CI) we are uncertain if self‐monitoring BP changes the risk of stillbirth, neonatal death, preterm birth, or maternal admission to intensive care compared with usual care.
Korotkoff phase IV (K4, muffling sound) versus Korotkoff phase V (K5, disappearance of sound) to represent diastolic BP
Low‐certainty evidence shows that there may be little to no difference between K5 compared with K4 in terms of pre‐eclampsia diagnosis. We are uncertain if there is a difference in perinatal mortality between the groups because of the low‐certainty of evidence.
CRADLE intervention (CRADLE device, a semi‐automated BP monitor with additional features, and an education package) versus usual care
Low‐certainty evidence shows there is probably little or no difference between the CRADLE device and usual care in the risk of maternal death compared with usual care.
Other outcomes of interest were either not measured, or were not measured in the whole population.
Overall completeness and applicability of evidence
Although we conducted a comprehensive search of the worldwide literature for RCTs on the setting and technique of BP measurement for diagnosing and managing hypertensive disorders in pregnancy, the evidence we identified was limited to three of the nine settings and techniques we set out to investigate. Moreover, we did not identify any evidence relating to our primary outcome, or to several of our important prespecified secondary outcomes.
The healthcare context of two of the three included studies suggests that the effects of the interventions in other contexts may be different, and the applicability of this evidence limited. This is evident for self‐monitoring BP and the introduction of the CRADLE device, whereby both were compared with usual care. With usual care as a comparator, the evidence from the introduction of the CRADLE device is likely only applicable to the low‐ and middle‐income country settings, whereas self‐monitoring BP is only applicable to a high‐income healthcare context. The evidence from K5 versus K4 is likely to be highly applicable, because of the universal intervention and comparator, which are independent of healthcare context.
Quality of the evidence
Overall, we judged the studies to have a low risk of bias. One of the three included studies (K4 versus K5), was judged to have an unclear risk of selection bias and reporting bias due to lack of information reported in the study paper. Another study (introducing the CRADLE device), was judged to have an unclear risk of detection bias due to the pragmatic, large study design.
We assessed the body of evidence to be of low‐certainty. For self‐monitoring versus usual care and K4 versus K5 for diastolic BP, we downgraded two levels for imprecision due to the small sample sizes, few events, and wide 95% confidence intervals (CI) that crossed the line of no effect.
We downgraded the evidence relating to the introduction of the CRADLE device one level for impression (wide 95% CI that crossed the line of no effect), and one level for serious indirectness (intervention and comparator were not directly representative of the prespecified settings and techniques). The intervention was an oscillometric device with additional features (early warning system and an eduction package) and the comparator, usual care, which varied across clusters according to local context.
Potential biases in the review process
To minimise potential biases in the review process, we conducted a comprehensive literature search and ensured that data extraction, and assessment of risk of bias and GRADE were done independently, by at least two review authors.
Authors of two of the three included studies are review authors. These authors had no part in assessment, data extraction, or data entry.
Without a core outcome set for hypertensive disorders in pregnancy, there is potential for the introduction of bias in the selection of the prespecified outcomes. Also, there were only a few of the prespecified outcomes investigated in the included studies. Furthermore, the study exploring self‐monitoring BP is a small feasibility study, which was not powered to detect differences between groups for clinical outcomes, and thus, we were unable to draw definitive conclusions from this study.
Agreements and disagreements with other studies or reviews
A number of the BP monitoring techniques (multiple BP measurements at one clinic visit, using an appropriately sized BP cuff, resting prior to BP measurement) are already detailed in clinical guidelines: the NICE Antenatal care for uncomplicated pregnancies (NICE 2008), the NICE Hypertension in adults: diagnosis and management (NICE 2019a), and the American College of Obstetricians and Gynecologists’ Task Force on Hypertension in Pregnancy (ACOG 2013). As these are already good practice recommendations, it is unlikely that new research will be funded or generated to explore these BP techniques.
It is important to note that dynamic BP changes in pregnancy are distinct, and occur in a shorter time‐frame than outside of pregnancy, therefore, some of the BP settings and techniques recommended in adult hypertension guidance cannot be extrapolated for hypertension in pregnancy. This includes the use of ambulatory BP monitors, and self‐monitoring BP in pregnancy, for which there is ongoing research.

Study flow diagram

Risk of bias graph: review authors' judgements about each 'Risk of bias' item presented as percentages across all included studies

Risk of bias summary: review authors' judgements about each 'Risk of bias' item for each included study

Comparison 1: Setting of BP measurement: self‐measurement (with automated BP device at home) versus conventional clinic measurement, Outcome 1: Pre‐eclampsia

Comparison 1: Setting of BP measurement: self‐measurement (with automated BP device at home) versus conventional clinic measurement, Outcome 2: Eclampsia

Comparison 1: Setting of BP measurement: self‐measurement (with automated BP device at home) versus conventional clinic measurement, Outcome 3: HELLP syndrome

Comparison 1: Setting of BP measurement: self‐measurement (with automated BP device at home) versus conventional clinic measurement, Outcome 4: Stillbirth (death after 24 weeks in utero)

Comparison 1: Setting of BP measurement: self‐measurement (with automated BP device at home) versus conventional clinic measurement, Outcome 5: Neonatal death

Comparison 1: Setting of BP measurement: self‐measurement (with automated BP device at home) versus conventional clinic measurement, Outcome 6: Preterm birth (birth before 34 completed weeks' gestation)

Comparison 1: Setting of BP measurement: self‐measurement (with automated BP device at home) versus conventional clinic measurement, Outcome 7: Induction of labour

Comparison 1: Setting of BP measurement: self‐measurement (with automated BP device at home) versus conventional clinic measurement, Outcome 8: Operative delivery

Comparison 1: Setting of BP measurement: self‐measurement (with automated BP device at home) versus conventional clinic measurement, Outcome 9: Maternal admission to intensive care

Comparison 1: Setting of BP measurement: self‐measurement (with automated BP device at home) versus conventional clinic measurement, Outcome 10: Neonatal unit admission

Comparison 2: Technique of BP measurement: Korotkoff phase IV (K4, muffling sound) versus Korotkoff phase V (K5, disappearance of sound) to represent diastolic BP, Outcome 1: Pre‐eclampsia

Comparison 2: Technique of BP measurement: Korotkoff phase IV (K4, muffling sound) versus Korotkoff phase V (K5, disappearance of sound) to represent diastolic BP, Outcome 2: Perinatal mortality

Comparison 3: Technique of BP measurement: CRADLE intervention (CRADLE device: semi‐automated BP monitor with additional features, plus an education package) versus usual care, Outcome 1: Maternal death

Comparison 3: Technique of BP measurement: CRADLE intervention (CRADLE device: semi‐automated BP monitor with additional features, plus an education package) versus usual care, Outcome 2: Eclampsia
| Setting of BP measurement: self‐measurement versus conventional clinic measurement | ||||||
|---|---|---|---|---|---|---|
| Patient or population: pregnant women with chronic or gestational hypertension | ||||||
| Outcomes | Anticipated absolute effects* (95% CI) | Relative effect | № of participants | Certainty of the evidence | Comments | |
| Assumed risk with usual care | Corresponding risk with self‐monitoring | |||||
| Maternal outcomes | ||||||
| Systolic BP ≥ 150 mmHg | Not reported | |||||
| Maternal death | 0/102 maternal deaths in the self‐monitoring group, compared with 0/52 in the usual care group | ‐ | 154 | ‐ | ||
| Pre‐eclampsia | Study population | RR 1.49 | 154 | ⊕⊕⊝⊝ | ||
| 250 per 1000 | 373 per 1000 123 more per 1000 (from 33 fewer to 385 more) | |||||
| Number of antenatal hospital admissions | Not reported | |||||
| Maternal admission to intensive care | 1/102 maternal admission to intensive care in the self‐monitoring group, compared with 0/52 in the usual care group | RR 1.54 | 154 | ⊕⊕⊝⊝ | ||
| Induction of labour | Study population | RR 1.09 | 154 | ⊕⊕⊝⊝ | ||
| 558 per 100 | 608 per 1000 50 more per 1000 (from 100 fewer to 251 more) | |||||
| Neonatal outcomes | ||||||
| Stillbirth (death after 24 weeks inutero) | 2/102 stillbirths in the self‐monitoring group, compared with 0/52 in the usual care group | RR 2.57 | 154 | ⊕⊕⊝⊝ | ||
| Neonatal death | 1/102 neonatal death in the self‐monitoring group compared with 0/52 in the usual care group | RR 1.54 | 154 | ⊕⊕⊝⊝ | ||
| Perinatal mortality | Not reported | |||||
| Preterm birth (birth before 34 completed weeks' gestation) | Study population | RR 1.15 | 154 | ⊕⊕⊝⊝ | ||
| 77 per 1000 | 88 per 1000 12 more per 1000 (from 48 fewer to 196 more) | |||||
| Neonatal unit admission | Study population | RR 1.53 | 154 | ⊕⊕⊝⊝ | ||
| 115 per 1000 | 177 per 1000 61 more per 1000 (from 40 fewer to 302 more) | |||||
| Neonatal unit length of stay | Not reported | |||||
| Neonatal endotracheal intubation and use of mechanical ventilation | Not reported | |||||
| *The risk in the intervention group (and its 95% confidence interval) is based on the assumed risk in the comparison group and the relative effect of the intervention (and its 95% CI). | ||||||
| GRADE Working Group grades of evidence | ||||||
| aDowngraded two levels for very serious imprecision: few participants, wide 95% confidence interval spanning possible harm and possible benefit, based on a feasibility trial not powered to measure clinical outcomes. | ||||||
| Technique of BP measurement: Korotkoff phase IV versus Korotkoff phase V to represent diastolic BP | ||||||
|---|---|---|---|---|---|---|
| Patient or population: pregnant women with diastolic hypertension | ||||||
| Outcomes | Anticipated absolute effects* (95% CI) | Relative effect | № of participants | Certainty of the evidence | Comments | |
| Assumed risk with K5 | Corresponding risk with K4 | |||||
| Maternal outcomes | ||||||
| Systolic BP ≥ 150 mmHg | Not reported | |||||
| Maternal death | 0/103 maternal deaths in the K4 group, compared with 0/117 in the K5 group | ‐ | 220 | ‐ | ||
| Pre‐eclampsia | Study population | RR 1.16 | 220 | ⊕⊕⊝⊝ | ||
| 479 per 1000 | 555 per 1000 77 more per 1000 (from 53 fewer to 235 more) | |||||
| Number of antenatal hospital admissions | Not reported | |||||
| Maternal admission to intensive care | Not reported | |||||
| Induction of labour | Not reported | |||||
| Neonatal outcomes | ||||||
| Stillbirth | Not reported | |||||
| Neonatal death | Not reported | |||||
| Perinatal mortality | Study population | RR 1.14 | 220 | ⊕⊕⊝⊝ | ||
| 17 per 1000 | 19 per 1000 2 more per 1000 (from 14 fewer to 118 more) | |||||
| Preterm birth | Not reported | |||||
| Neonatal unit admission | Not reported | |||||
| Neonatal unit length of stay | Not reported | |||||
| Neonatal endotracheal intubation and use of mechanical ventilation | Not reported | |||||
| *The risk in the intervention group (and its 95% confidence interval) is based on the assumed risk in the comparison group and the relative effect of the intervention (and its 95% CI). | ||||||
| GRADE Working Group grades of evidence | ||||||
| aDowngraded two levels for very serious imprecision: few participants and wide 95% confidence intervals spanning possible harm and possible benefit | ||||||
| Technique of BP measurement: CRADLE intervention versus usual care | ||||||
|---|---|---|---|---|---|---|
| Patient or population: pregnant women, or those within 42 days of delivery | ||||||
| Outcomes | Anticipated absolute effects* (95% CI) | Relative effect | № of participants | Certainty of the evidence | Comments | |
| Assumed risk with usual care | Corresponding risk with CRADLE intervention | |||||
| Maternal outcomes | ||||||
| Systolic BP ≥ 150 mmHg | Not reported | |||||
| Maternal death | Study population | RR 0.80 | 536,233 | ⊕⊕⊝⊝ | Effect estimate is adjusted RR, taking into account cluster design. | |
| 2 per 1000 | 1 per 1000 0 fewer per 1000 (from 1 fewer to 2 more) | |||||
| Pre‐eclampsia | Not reported | |||||
| Number of antenatal hospital admissions | Not reported | |||||
| Maternal admission to intensive care | Not reported | |||||
| Induction of labour | Not reported | |||||
| Neonatal outcomes | ||||||
| Stillbirth | Not reported | |||||
| Neonatal death | Not reported | |||||
| Perinatal mortality | Not reported | |||||
| Preterm birth | Not reported | |||||
| Neonatal unit admission | Not reported | |||||
| Neonatal unit length of stay | Not reported | |||||
| Neonatal endotracheal intubation and use of mechanical ventilation | Not reported | |||||
| *The risk in the intervention group (and its 95% confidence interval) is based on the assumed risk in the comparison group and the relative effect of the intervention (and its 95% CI). | ||||||
| GRADE Working Group grades of evidence | ||||||
| aDowngraded one level for serious indirectness: intervention and comparator were not directly representative of the prespecified settings and techniques. The intervention was an oscillometric device with additional features (early warning system and an eduction package) and the comparator usual care, which varied across the clusters according to local context. bDowngraded one level for serious imprecision: wide 95% CI spanning possible benefit and possible harm. | ||||||
| Outcome or subgroup title | No. of studies | No. of participants | Statistical method | Effect size |
| 1.1 Pre‐eclampsia Show forest plot | 1 | 154 | Risk Ratio (M‐H, Fixed, 95% CI) | 1.49 [0.87, 2.54] |
| 1.2 Eclampsia Show forest plot | 1 | 154 | Risk Ratio (M‐H, Fixed, 95% CI) | 0.10 [0.01, 2.11] |
| 1.3 HELLP syndrome Show forest plot | 1 | 154 | Risk Ratio (M‐H, Fixed, 95% CI) | 1.54 [0.06, 37.25] |
| 1.4 Stillbirth (death after 24 weeks in utero) Show forest plot | 1 | 154 | Risk Ratio (M‐H, Fixed, 95% CI) | 2.57 [0.13, 52.63] |
| 1.5 Neonatal death Show forest plot | 1 | 154 | Risk Ratio (M‐H, Fixed, 95% CI) | 1.54 [0.06, 37.25] |
| 1.6 Preterm birth (birth before 34 completed weeks' gestation) Show forest plot | 1 | 154 | Risk Ratio (M‐H, Fixed, 95% CI) | 1.15 [0.37, 3.55] |
| 1.7 Induction of labour Show forest plot | 1 | 154 | Risk Ratio (M‐H, Fixed, 95% CI) | 1.09 [0.82, 1.45] |
| 1.8 Operative delivery Show forest plot | 1 | 154 | Risk Ratio (M‐H, Fixed, 95% CI) | 1.36 [0.98, 1.89] |
| 1.9 Maternal admission to intensive care Show forest plot | 1 | 154 | Risk Ratio (M‐H, Fixed, 95% CI) | 1.54 [0.06, 37.25] |
| 1.10 Neonatal unit admission Show forest plot | 1 | 154 | Risk Ratio (M‐H, Fixed, 95% CI) | 1.53 [0.65, 3.62] |
| Outcome or subgroup title | No. of studies | No. of participants | Statistical method | Effect size |
| 2.1 Pre‐eclampsia Show forest plot | 1 | 220 | Risk Ratio (M‐H, Fixed, 95% CI) | 1.16 [0.89, 1.49] |
| 2.2 Perinatal mortality Show forest plot | 1 | 220 | Risk Ratio (M‐H, Fixed, 95% CI) | 1.14 [0.16, 7.92] |
| Outcome or subgroup title | No. of studies | No. of participants | Statistical method | Effect size |
| 3.1 Maternal death Show forest plot | 1 | Risk Ratio (IV, Fixed, 95% CI) | 0.80 [0.30, 2.11] | |
| 3.2 Eclampsia Show forest plot | 1 | Risk Ratio (IV, Fixed, 95% CI) | 1.91 [0.91, 4.02] | |