Antibióticos para la inducción y el mantenimiento de la remisión de la enfermedad de Crohn
Resumen
Antecedentes
Se han evaluado varios antibióticos en la enfermedad de Crohn (EC); sin embargo, en los ensayos controlados aleatorios (ECA) se han obtenido resultados contradictorios.
Objetivos
Evaluar la eficacia y la seguridad de los antibióticos para la inducción y el mantenimiento de la remisión en la EC.
Métodos de búsqueda
Se hicieron búsquedas en las bases de datos MEDLINE, Embase, CENTRAL, en el registro especializado de ensayos del Grupo Cochrane de Enfermedad Inflamatoria Intestinal y Trastornos Funcionales del Intestino (EII/TFI) (Cochrane Inflammatory Bowel Disease and Functional Bowel Disorders Group, IBD/FBD Group), y en clinicaltrials.gov, desde su inicio hasta el 28 febrero 2018. También se buscaron listas de referencias y actas de congresos.
Criterios de selección
Se consideró la inclusión de ECA que comparen los antibióticos con el placebo o un comparador activo en pacientes adultos (mayores de 15 años) con EC.
Obtención y análisis de los datos
Dos autores examinaron de forma independiente los resultados de la búsqueda y extrajeron los datos. El sesgo se evaluó con la herramienta Cochrane de riesgo de sesgo. Los resultados primarios fueron el fracaso para lograr la remisión clínica y la recaída. Los resultados secundarios fueron: la respuesta clínica, la respuesta endoscópica, la remisión endoscópica, la recaída endoscópica, la respuesta histológica, la remisión histológica, los eventos adversos (EA), los EA graves, los retiros debido a los EA y la calidad de vida. La remisión se define comúnmente con un Crohn's disease activity index (CDAI) de < 150. La respuesta clínica se define comúnmente como una disminución en el CDAI inicial de 70 o 100 puntos. La recaída se define con un CDAI > 150. Para los estudios que incorporaron a pacientes con EC fistulizante, la respuesta se definió como una reducción de un 50% del drenaje de las fístulas. La remisión se definió como el cierre completo de las fístulas. Se calculó el cociente de riesgos (CR) y el intervalo de confianza del 95% (IC del 95%) correspondiente para los resultados dicotómicos. Se calculó la diferencia de medias (DM) y el IC del 95% correspondiente para los resultados continuos. Para evaluar la certeza de la evidencia se utilizaron los criterios GRADE.
Resultados principales
Fueron elegibles 13 ECA (N = 1303 participantes). Dos ensayos se calificaron como de alto riesgo de sesgo (ningún cegamiento). Siete ensayos se calificaron como de riesgo de sesgo poco claro, y cuatro ensayos se calificaron como de bajo riesgo de sesgo. Las comparaciones fueron: ciprofloxacina (500 mg dos veces al día) versus placebo; rifaximina (800 a 2400 mg diarios) versus placebo; metronidazol (400 mg a 500 mg dos veces al día) versus placebo; claritromicina (1 g/día) versus placebo; cotrimoxazol (960 mg dos veces al día) versus placebo; ciprofloxacina (500 mg dos veces al día) y metronidazol (250 mg cuatro veces al día) versus metilprednisolona (0,7 a 1 mg/kg diarios); ciprofloxacina (500 mg diarios), metronidazol (500 mg diarios) y budesonida (9 mg diarios) versus placebo con budesonida (9 mg diarios); ciprofloxacina (500 mg dos veces al día) versus mesalazina (2 g dos veces al día); ciprofloxacina (500 mg dos veces al día) con adalimumab versus placebo con adalimumab; ciprofloxacina (500 mg dos veces al día) con infliximab versus placebo con infliximab; claritromicina (750 mg diarios) y antimicobacteriano versus placebo y metronidazol (400 mg dos veces al día) y cotrimoxazol (960 mg dos veces al día) versus placebo. Se agruparon todos los antibióticos como una clase versus placebo y los antibióticos con anti‐factor de necrosis tumoral (anti‐FNT) versus placebo con anti‐FNT.
Por lo general, el efecto de los antibióticos individuales sobre la EC fue incierto debido a la imprecisión. Cuando se agruparon los antibióticos como una clase, un 55% (289/524) de los pacientes con antibióticos no lograron la remisión a las seis a diez semanas en comparación con un 64% (149/231) de los que recibieron placebo (CR 0,86; IC del 95%: 0,76 a 0,98; siete estudios; evidencia de certeza alta). A las 10 a 14 semanas, un 41% (174/428) de los pacientes que recibieron antibióticos no lograron una respuesta clínica en comparación con un 49% (93/189) de los que recibieron placebo (CR 0,77; IC del 95%: 0,64 a 0,93; cinco estudios; evidencia de certeza moderada. No puede precisarse el efecto de los antibióticos sobre la recaída. Un 45% (37/83) de los pacientes que recibieron antibióticos presentaron una recaída a las 52 semanas en comparación con un 57% (41/72) de los que recibieron placebo (CR 0,87; IC del 95%: 0,52 a 1,47; dos estudios; evidencia de certeza baja. La recaída de la remisión endoscópica no se informó en los estudios incluidos. Los antibióticos no parecen aumentar el riesgo de EA. El 38% (214/568) de los pacientes que recibieron antibióticos presentaron al menos un evento adverso en comparación con el 45% (128/284) de los que recibieron placebo (CR 0,87; IC del 95%: 0,75 a 1,02; nueve estudios; evidencia de certeza alta). Fue incierto el efecto de los antibióticos sobre los EA graves y los retiros debidos a los EA. Un 2% (6/377) de los pacientes que recibieron antibióticos presentaron al menos un evento adverso en comparación con el 0,7% (1/143) de los que recibieron placebo (CR 1,70; IC del 95%: 0,29 a 10,01; tres estudios; evidencia de certeza baja. Un 9% (53/569) de los pacientes que recibieron antibióticos se retiraron debido a los EA en comparación con un 12% (36/289) de los que recibieron placebo (CR 0,86; IC del 95%: 0,57 a 1,29; nueve estudios; evidencia de certeza baja). Los eventos adversos comunes en los estudios fueron: molestias gastrointestinales, infección de las vías respiratorias superiores, formación de abscesos y cefalea, cambios en el gusto y parestesias
Cuando se agruparon los antibióticos usados con el anti‐FNT, un 21% (10/48) de los pacientes con tratamiento combinado no lograron una respuesta clínica (50% de cierre de las fístulas) ni la remisión (cierre de fístulas) a las 12 semanas en comparación con un 36% (19/52) de los pacientes con placebo y anti‐FNT (CR 0,57; IC del 95%: 0,29 a 1,10; dos estudios; evidencia de certeza baja. Estos estudios no evaluaron el efecto de los antibióticos y el anti‐FNT en la recaída clínica o endoscópica. Un 77% (37/48) de los pacientes con antibióticos y anti‐FNT presentaron un EA en comparación con un 83% (43/52) de los pacientes con placebo y anti‐FNT (CR 0,93; IC del 95%: 0,76 a 1,12; dos estudios, evidencia de certeza moderada). Es incierto el efecto de los antibióticos y el anti‐FNT sobre los retiros debidos a los EA. Un 6% (3/48) de los pacientes con antibióticos y anti‐FNT se retiraron debido a un EA en comparación con un 8% (4/52) de los pacientes con placebo y anti‐FNT (CR 0,82; IC del 95%: 0,19 a 3,45; dos estudios, evidencia de certeza baja). Los eventos adversos comunes fueron: náuseas, vómitos, infecciones de vías respiratorias superiores, cambios en el gusto, fatiga y cefalea
Conclusiones de los autores
La evidencia de calidad moderada a alta sugiere que es probable que cualquier beneficio de los antibióticos en la EC activa sea moderado y puede no ser clínicamente significativo. La evidencia de alta calidad indica que no hay mayor riesgo de eventos adversos con los antibióticos en comparación con el placebo. Es incierto el efecto de los antibióticos sobre el riesgo de eventos adversos graves. Es incierto el efecto de los antibióticos sobre el mantenimiento de la remisión en la EC. Por lo tanto, no pueden establecerse conclusiones firmes con respecto a la eficacia y la seguridad de los antibióticos para el mantenimiento de la remisión en la EC. Se necesitan más estudios de investigación para determinar la eficacia y la seguridad de los antibióticos como tratamiento de la EC
PICO
Resumen en términos sencillos
Antibióticos para el tratamiento de la enfermedad de Crohn
¿Qué es la enfermedad de Crohn?
La enfermedad de Crohn (EC) es una afección inflamatoria que puede afectar cualquier parte del tubo digestivo, desde la boca hasta el ano. Los síntomas frecuentes de la EC son: fiebre, diarrea, dolor abdominal y pérdida de peso. La EC se caracteriza por períodos de recaída, en que los pacientes presentan síntomas, y períodos de remisión sin síntomas.
¿Qué son los antibióticos?
Los antibióticos son fármacos utilizados para tratar las infecciones bacterianas. Están diseñados para dirigirse a poblaciones bacterianas específicas y tienen diferentes mecanismos de la acción para detener el crecimiento de una población bacteriana o erradicarla.
¿Cuál es la finalidad de este estudio?
Los antibióticos se han usado comúnmente para el tratamiento de los pacientes con EC porque se asumió que el proceso inflamatorio intestinal era desencadenado por una bacteria patógena específica. La eliminación de este objetivo bacteriano permitiría la resolución del proceso inflamatorio. Sin embargo, las guías clínicas actuales no recomiendan la administración de antibióticos para la inducción o el mantenimiento de la remisión clínica en pacientes con EC porque no existe evidencia definitiva que sugiera un beneficio del uso de estos agentes.
¿Cómo se realizó este estudio?
Se realizó una revisión sistemática de la bibliografía actual para determinar si la antibioticoterapia es efectiva para la inducción o el mantenimiento de la remisión en la EC. Se realizó una búsqueda electrónica de varias bases de datos y se seleccionaron los estudios que cumplieron con los criterios de inclusión para una evaluación adicional. Se realizaron análisis estadísticos para determinar con qué antibióticos específicos se obtenía un beneficio general.
¿Cuáles fueron los resultados?
Se han estudiado varios antibióticos para la EC, incluida la ciprofloxacina, el metronidazol, la claritromicina, la rifaximina y el cotrimoxazol. La mayoría de los estudios incluidos eran de pequeño tamaño. Cuando se agruparon los antibióticos como clase, se obtuvo un beneficio moderado con estos fármacos con respecto al placebo (es decir, un fármaco sin actividad, como una pastilla de azúcar) para la inducción de la remisión y la mejoría de los síntomas de la EC. Por ejemplo, las tasas de remisión fueron de un 45% (253/542) en los pacientes que recibieron antibióticos en comparación con un 36% (82/231) de los que recibieron placebo. La calidad de la evidencia que apoya este resultado se calificó como alta. Pocos estudios evaluaron el uso de antibióticos para el mantenimiento de la remisión en la EC. Es incierto el efecto de los antibióticos sobre la prevención de la recaída en la EC. Los antibióticos no parecen aumentar el riesgo de efectos secundarios en comparación con el placebo. Los efectos secundarios comunes informados en los estudios fueron: molestias gastrointestinales, infección de vías respiratorias superiores, formación de abscesos, cefalea, cambios en el gusto y parestesias (hormigueo en las extremidades). No fueron bien informados en los estudios los efectos secundarios graves, y es incierta la repercusión de los antibióticos sobre el riesgo de este tipo de efectos secundarios.
Conclusiones
La evidencia de calidad moderada a alta sugiere que es probable que los beneficios de los antibióticos en la EC activa sean muy moderados. La evidencia de alta calidad indica que no hay mayor riesgo de efectos secundarios con los antibióticos en comparación con el placebo. Es incierto el efecto de los antibióticos sobre el riesgo de efectos secundarios graves. Es incierto el efecto de los antibióticos sobre la prevención de la recaída en la EC. Por lo tanto, no pueden establecerse conclusiones firmes con respecto a los efectos beneficiosos y perjudiciales de los antibióticos para el mantenimiento de la remisión en la EC. Se necesita más investigación para determinar los efectos beneficiosos y perjudiciales de la antibioticoterapia en la EC.
Conclusiones de los autores
Summary of findings
| Antibiotic compared to placebo for induction and maintenance of remission in Crohn's disease | ||||||
| Patient or population: Participants with active CD | ||||||
| Outcomes | Anticipated absolute effects* (95% CI) | Relative effect | № of participants | Quality of the evidence | Comments | |
| Risk with placebo | Risk with Antibiotic | |||||
| Failure to enter clinical remission Follow‐up: 6‐10 weeks | 645 per 1,000 | 555 per 1,000 | RR 0.86 | 773 | ⊕⊕⊕⊕ | Clinical remission was defined as CDAI ≤150 Antibiotics included Cotrimoxazole, Metronidazole, Ciprofloxacin, Clarithromycin, and Rifaximin |
| Failure to maintain clinical remission Follow‐up: 52 weeks | 569 per 1,000 | 495 per 1,000 | RR 0.87 | 155 | ⊕⊕⊝⊝ | Clinical remission was defined as CDAI ≤150 Antibiotics included Cotrimoxazole and Clarithromycin |
| Failure to achieve clinical response Follow‐up: 10‐14 weeks | 492 per 1,000 | 379 per 1,000 | RR 0.77 | 617 | ⊕⊕⊕⊝ | Clinical response was defined as a reduction in CDAI score of 100 points and/or a 50% or greater reduction in perianal fistulas Antibiotics included Ciprofloxacin and Rifaximin |
| Failure to maintain endoscopic remission | Not reported | This outcome was not reported | ||||
| Adverse events Follow‐up: 6‐52 weeks | 451 per 1,000 | 392 per 1,000 | RR 0.87 | 852 | ⊕⊕⊕⊕ | Adverse events included gastrointestinal upset, upper respiratory tract infection, abscess formation, headache and paraesthesia Antibiotics included Cotrimoxazole, Metronidazole, Ciprofloxacin, Clarithromycin, and Rifaximin |
| Serious adverse events Follow‐up: 6‐52 weeks | 7 per 1,000 | 12 per 1,000 | RR 1.70 | 520 | ⊕⊕⊝⊝ | Serious adverse events were not well described in the studies. Reported serious adverse events included one scrotal edema and one death Antibiotics included Rifaximin, Ciprofloxacin and Metronidazole |
| Withdrawal due to adverse events Follow‐up: 6‐52 weeks | 125 per 1,000 | 107 per 1,000 | RR 0.86 | 858 | ⊕⊕⊝⊝ | Adverse events leading to withdrawal included worsening CD, gastrointestinal symptoms,headache, abscess, rash, arthralgia, nausea, vomiting, arthropathy and infusion reaction Antibiotics included Cotrimoxazole, Metronidazole, Ciprofloxacin, Clarithromycin, and Rifaximin |
| *The risk in the intervention group (and its 95% confidence interval) is based on the assumed risk in the comparison group and the relative effect of the intervention (and its 95% CI). | ||||||
| GRADE Working Group grades of evidence | ||||||
| 1 Downgraded one level due to sparse data (78 events) 2 Downgraded one level due to heterogeneity (I2 = 63%) 3 Downgraded one level due to sparse data (267 events) 4 Downgraded two levels due to very sparse data (8 events) 5 Downgraded one level due to sparse data (89 events) | ||||||
| Antibiotic with anti‐TNF compared to placebo with anti‐TNF for induction of remission in Crohn's disease | ||||||
| Patient or population: Participants with active CD | ||||||
| Outcomes | Anticipated absolute effects* (95% CI) | Relative effect | № of participants | Quality of the evidence | Comments | |
| Risk with placebo with anti‐TNF | Risk with Antibiotic with anti‐TNF | |||||
| Failure to enter clinical remission | Not reported | This outcome was reported in one study. We decided to pool this study with the other anti‐TNF study below (failure to achieve clinical response or remission Antibiotics included Ciprofloxacin | ||||
| Failure to maintain clinical remission | Not reported | This outcome was not reported | ||||
| Failure to achieve clinical response or remission Follow‐up: 12 weeks | 365 per 1,000 | 208 per 1,000 | RR 0.57 | 100 | ⊕⊕⊝⊝ | Clinical response was defined as a 50% reduction in perianal fistulas. Remission was defined as a closure of fistulas Antibiotics included Ciprofloxacin |
| Failure to maintain endoscopic remission | Not reported | This outcome was not reported | ||||
| Adverse events Follow‐up: 12 weeks | 827 per 1,000 | 769 per 1,000 | RR 0.93 | 100 | ⊕⊕⊕⊝ | Adverse events included nausea, vomiting, upper respiratory tract infections, fatigue and headache Antibiotics included Ciprofloxacin |
| Serious adverse events | Not reported | This outcome was not reported | ||||
| Withdrawal due to adverse events Follow‐up: 12 weeks | 77 per 1,000 | 63 per 1,000 | RR 0.82 | 100 | ⊕⊕⊝⊝ | Adverse events leading to withdrawal included gastrointestinal symptoms, transfusion reaction and herpes simplex virus infection Antibiotics included Ciprofloxacin |
| *The risk in the intervention group (and its 95% confidence interval) is based on the assumed risk in the comparison group and the relative effect of the intervention (and its 95% CI). | ||||||
| GRADE Working Group grades of evidence | ||||||
| 1Downgraded one level due to sparse data (80 events) 2 Downgraded two levels due to very sparse data (29 events) 3 Downgraded two levels due to very sparse data (7 events) | ||||||
Antecedentes
Descripción de la afección
La enfermedad de Crohn (EC) es un trastorno inflamatorio del aparato digestivo que compromete con más frecuencia al íleon y el colon. Los rasgos histológicos característicos de la enfermedad incluyen inflamación transmural y ulceración de la mucosa. La etiología exacta de la EC no está claro, sin embargo, tanto los factores genéticos como los ambientales contribuyen de manera importante (Elson 2005; Scribano 2013). En este sentido, se considera que el microbioma humano es un factor de riesgo ambiental clave.
En modelos animales, la interacción entre el sistema inmunitario de la mucosa y las bacterias comensales contribuyen a las alteraciones anatomopatológicas observadas en la EC (Elson 1995; Elson 2005; Rath 1999). Los estudios posteriores realizados en seres humanos han demostrado que los pacientes con EC tienen una mayor concentración de bacterias intestinales y colónicas (Scribano 2013) y una población mayor de bacterias específicas (Gevers 2014), en comparación con los controles sanos. Los pacientes con EC también pueden presentar un deterioro de la función de la barrera, que facilita la translocación de los microbios en la mucosa (Marks 2006).
Se aislaron cepas bacterianas patógenas, como Escherichia coli (Mylonaki 2005) en los ganglios linfáticos de la mucosa y mesentéricos de estos pacientes (Ambrose 1984). Además, se observa un cambio en la composición microbiana con menos especies en general y una sobrerrepresentación relativa de Enterobacteriaceae, Proteobacteria, Actinobacteria (Sartor 2008) y Bacteroides (Barnich 2007). Estas observaciones apoyan la hipótesis de que la respuesta patológica en la EC es resultado de una respuesta anormal al microbioma del huésped y que la manipulación de la flora con antibióticos podría ser un posible tratamiento (Sartor 2008).
Descripción de la intervención
Los antibióticos se han considerado como tratamiento para la EC dada la conexión propuesta entre una mayor concentración bacteriana intestinal e inflamación crónica (Swidsinski 2002). Los estudios han señalado a la Escherichia coli como objetivo bacteriano específico, entre otros gérmenes (Mylonaki 2005; Sartor 2008).
De qué manera podría funcionar la intervención
Se han evaluado diversos antibióticos para el tratamiento de la EC. La reducción de la carga bacteriana de la mucosa intestinal podría reducir la respuesta inmunitaria patológica en la mucosa intestinal (Scribano 2013; Swidsinski 2002). Además, los antibióticos también limitan la translocación bacteriana y reducen la concentración de bacterias que se adhieren a la luz y la mucosa (Scribano 2013). En los pacientes con niveles altos de Escherichia en el microbioma, el tratamiento con mesalamina mostró una disminución de la inflamación intestinal. Este efecto sugiere aún más la función central que el microbioma intestinal puede tener en la fisiopatología de la EII y el uso potencial de los agentes antimicrobianos (Kostic 2014). De modo acumulativo, estos datos han planteado la posibilidad de que la alteración de la flora de la mucosa puede tener una función terapéutica en la EC mediante la inhibición del estímulo para las respuestas inmunitarias patógenas (Ott 2004; Swidsinski 2002).
Por qué es importante realizar esta revisión
Es razonable postular, dado el gran número de datos derivados de humanos y animales que apoyan la función de las bacterias en la patogenia de la EC, que la antibioticoterapia podría ser efectiva para la inducción o el mantenimiento de la remisión en la EC. Sin embargo, este enfoque acarrea varios problemas potenciales. Primero, la administración de antibióticos de amplio espectro es una estrategia contundente que puede agravar la disbiosis ya mencionada. Segundo, la flora residente está determinada por factores genéticos y alimentarios cuya modificación a largo plazo puede ser difícil sino imposible. Por lo tanto, de ser efectivo, el tratamiento podría necesitar continuarse indefinidamente. Finalmente, la antibioticoterapia de amplio espectro se asocia con efectos adversos importantes, en particular un mayor riesgo de infección por Clostridium difficile. Por estas razones, se necesita evidencia de ensayos controlados aleatorios (ECA) de alta calidad antes de que los antibióticos se acepten como efectivos y seguros para el tratamiento de la EC.
No existen recomendaciones con respecto al antibiótico de elección, la dosis ni la duración para el tratamiento de la EC. Las guías más recientes publicadas por la World Gastroenterology Organisation apoyan el uso de antibióticos en la enfermedad perianal, la forma fistulizante y la hiperproliferación bacteriana secundaria a enfermedad estenótica, a pesar de la evidencia limitada (Bernstein 2016). Hay evidencia con respecto al uso de antibióticos en el tratamiento posoperatorio de la EC (Bernstein 2016).
Objetivos
Determinar si la antibioticoterapia es segura y efectiva para la inducción o el mantenimiento de la remisión en la EC.
Métodos
Criterios de inclusión de estudios para esta revisión
Tipos de estudios
Se consideró la inclusión de ECA de pacientes adultos (> 15 años de edad). Para ser considerados para la inclusión, los estudios de inducción de la remisión debían tener una duración mínima de al menos cuatro semanas. Para ser considerados para la inclusión, los estudios de mantenimiento de la remisión debían tener una duración mínima de al menos seis meses.
Tipos de participantes
Se consideraron para la inclusión los pacientes con EC activa o inactiva (según la definición de los estudios originales).
Tipos de intervenciones
Se consideró la inclusión de los ensayos que comparan la antibioticoterapia oral con un placebo o un comparador activo.
Tipos de medida de resultado
Resultados primarios
La medida de resultado primaria para los estudios de inducción de la remisión fue la proporción de pacientes que no lograron la remisión, según la definición de los estudios originales. El resultado primario para los estudios de mantenimiento de la remisión fue la proporción de pacientes que presentaron una recaída, tal como la definieron los estudios incluidos.
Resultados secundarios
Los resultados secundarios de eficacia, según la definición de los estudios originales, fueron la proporción de pacientes:
1. que no lograron una respuesta clínica (según la definición de los estudios originales);
2. que no lograron una respuesta endoscópica (según la definición de los estudios originales);
3. que no lograron la remisión endoscópica (según la definición de los estudios originales);
4. que no lograron una respuesta histológica (según la definición de los estudios originales);
5. que no lograron la remisión histológica (según la definición de los estudios originales);
6. que presentaron una recaída endoscópica (según la definición de los estudios originales);
7. que no lograron una respuesta clínica ni endoscópica (según la definición de los estudios originales);
8. que no lograron la remisión clínica ni endoscópica (según la definición de los estudios originales); y
9. calidad de vida relacionada con la salud (medida con una herramienta validada de calidad de vida).
Los resultados de seguridad fueron la proporción de pacientes:
10. con cualquier evento adverso (EA);
11. con eventos adversos graves (EAG); y
12. que abandonaron el estudio debido a los eventos adversos.
Métodos de búsqueda para la identificación de los estudios
Búsquedas electrónicas
We searched the following databases for relevant studies:
1. MEDLINE (Ovid, 1946 to present);
2. Embase (Ovid, 1984 to present);
3. CENTRAL; and
4. The Cochrane IBD Group Specialized Register.
5. Clinicaltrials.gov
The search strategies are listed in Appendix 1.
Búsqueda de otros recursos
We also searched the references listed in relevant studies and review articles for additional citations not identified in the search. Furthermore, conference proceedings from major meetings (Digestive Disease Week, the European Crohn's and Colitis Organisation congress, and the United European Gastroenterology Week conference) from the last five years were searched for studies published in abstract form only.
Obtención y análisis de los datos
Selección de los estudios
Two authors (CMT and CEP) screened the search results independently for eligible studies based on the inclusion criteria as listed. Disagreements were discussed until a consensus is reached. Any disagreements were brought to a third author (JKM) for resolution.
Extracción y manejo de los datos
Data were extracted from included studies by two independent authors (CMT and CEP). Any disagreements over extracted data were first discussed and then brought to a third author (JKM) for resolution if deemed necessary.
Evaluación del riesgo de sesgo de los estudios incluidos
The methodological quality of included studies was independently assessed by two authors (CMT and CEP) using the Cochrane risk of bias tool (Higgins 2011). We assessed several factors including sequence generation, allocation sequence concealment, blinding, incomplete outcome data, selective outcome reporting and other potential sources of bias. Studies were judged to be at high, low or unclear risk of bias. Any disagreements regarding risk of bias were first discussed and then brought to a third author (JKM) for resolution.
We used the GRADE approach to determine the overall certainty of evidence supporting both primary and selected secondary outcomes (Guyatt 2008; Schünemann 2011). For the 'Summary of findings' tables, we included the following outcomes: failure to achieve clinical remission (at study endpoint), failure to maintain clinical remission (or relapse at study endpoint), failure to achieve clinical response (at study endpoint), failure to maintain endoscopic remission (or endoscopic relapse at study endpoint), adverse events, adverse events, serious adverse events and study withdrawal due to adverse events. Evidence from RCTs was considered high certainty. However, the certainty of the evidence could have been downgraded after considering the following factors:
1. Risk of bias;
2. Indirect evidence;
3. Inconsistency (unexplained heterogeneity);
4. Imprecision; and
5. Publication bias.
Each outcome was reviewed to determine the overall certainty of evidence supporting the outcome. The outcome was classified as high certainty (the estimate of effect is very unlikely to be changed despite further research); moderate certainty (the estimate of effect is unlikely to be changed despite further research); low certainty (the estimate of effect may be changed despite further research) or very low certainty (the estimate of effect likely will be changed with further research).
Medidas del efecto del tratamiento
Review Manager (RevMan 5.3.5) was used to analyse the data on an intention‐to‐treat (ITT) basis. We calculated the risk ratio (RR) and corresponding 95% confidence interval (95% CI) for dichotomous outcomes and the mean difference (MD) and corresponding 95% CI for continuous outcomes.
Cuestiones relativas a la unidad de análisis
To deal with repeated observations on participants, we determined appropriate fixed intervals for follow‐up for each outcome. Cross‐over trials were included if data was available for the first phase of the trial prior to cross‐over. To deal with events that may re‐occur (e.g. adverse events), we reported on the proportion of participants who experience at least one event. Separate comparisons were performed for studies that compared antibiotics to placebo and for studies that compared antibiotics to other active therapies. We also performed separate comparisons for each type of antibiotic. If we encountered multiple treatment groups (e.g. different dose groups of antibiotics), we divided the placebo group across the treatment groups or we combined groups to create a single pair‐wise comparison as appropriate.
Manejo de los datos faltantes
An intention‐to‐treat analysis was used for dichotomous outcomes whereby patients with missing treatment outcomes were assumed to be treatment failures. Sensitivity analyses were performed to assess the impact of this assumption on the effect estimate.
Evaluación de la heterogeneidad
Heterogeneity was assessed using the Chi² test (a P value of 0.10 was considered statistically significant) and the I² statistic. We considered an I² statistic> 75% to indicate high heterogeneity among study data, > 50% indicated moderate heterogeneity and > 25% will indicated low heterogeneity (Higgins 2003). Sensitivity analysis were conducted to explore possible explanations for heterogeneity.
Evaluación de los sesgos de notificación
We initially compared outcomes listed in the protocol to those reported in the published manuscript. If we did not have access to the protocol, we used the outcomes listed in the methods sections of the published manuscript compared to what was reported in the results section. If any pooled analyses included 10 or more studies, we investigated potential publication bias using funnel plots (Egger 1997).
Síntesis de los datos
Data for meta‐analysis from individual trials were combined when the interventions, patient groups and outcomes were similar, as deemed by author consensus. We calculated the pooled RR and corresponding 95% CI for dichotomous outcomes and the pooled MD and corresponding 95% CI for continuous outcomes. The standardized mean difference (SMD) and 95% CI was calculated when different scales were used to measure the same outcome. A fixed‐effect model was used to pool data unless significant heterogeneity existed between the studies. A random‐effects model was used if heterogeneity existed (I² = 50 to 75%). We did not pool data for meta‐analysis if a high degree of heterogeneity (I² ≥ 75%) was found.
Análisis de subgrupos e investigación de la heterogeneidad
Planned subgroup analysis (data allowing) included:
a) Patient baseline characteristics (i.e. sex, age, weight, disease duration, disease severity, time since diagnosis, concomitant medication, objective markers of inflammation such as C‐reactive protein, and previous exposure to anti‐tumour necrosis factor‐alpha therapy); and
b) Different antibiotic doses.
Análisis de sensibilidad
We planned to use sensitivity analysis to assess the impact of random‐effects and fixed‐effect modelling, risk of bias, type of report (full manuscript, abstract or unpublished data) and loss to follow‐up on the pooled effect estimate.
Results
Description of studies
Results of the search
The literature search conducted on 28 February 2018 retrieved 2334 records for consideration. We removed all duplicate records, which left 1803 records for screening. Two authors (CMT and CEP) reviewed the titles and abstracts independently and in duplicate. Forty‐eight articles were selected for full text review (see Figure 1). Thirty reports of 25 studies were excluded with reasons (See Characteristics of excluded studies). Seventeen reports of 13 trials met the inclusion criteria and were included in the review (See Characteristics of included studies). One ongoing study was identified (NCT02240108).
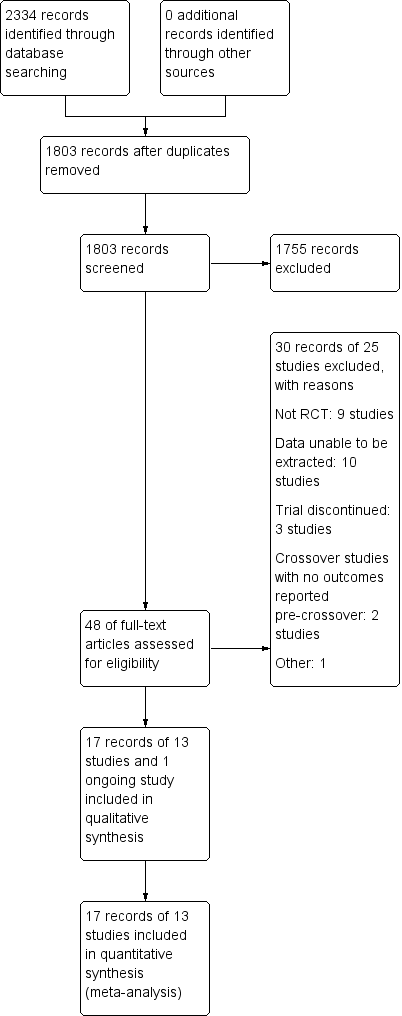
Study flow diagram.
Included studies
Of the 13 eligible RCTs identified (N = 1303), five different antibiotics (ciprofloxacin, metronidazole, clarithromycin, rifaximin and cotrimoxazole) were evaluated. Eleven of these trials were placebo‐controlled (Ambrose 1985; Arnold 2002; Dewint 2014; Lieper 2008; Prantera 2006; Prantera 2012; Selby 2007; Steinhart 2002; Sutherland 1991; Thia 2009; West 2004), and two were active comparator trials (Colombel 1999; Prantera 1996). Two of the placebo‐controlled trials also included active comparator arms (Ambrose 1985; Thia 2009). Patients were adults with active CD at the time of randomisation. The majority of the included studies defined an adult as 18 years of age or older, however, Steinhart 2002, Ambrose 1985 and Thia 2009 included patients 14, 15 and 16 years of age or older, respectively.
Four placebo‐controlled RCTs (Arnold 2002; Dewint 2014; Thia 2009; West 2004) evaluated ciprofloxacin. One active comparator trial randomised patients to ciprofloxacin or oral mesalamine (Colombel 1999). In two studies, ciprofloxacin was administered in conjunction with an anti‐TNF agent (Dewint 2014; West 2004). In the Dewint 2014 study, all patients were treated with self‐administered adalimumab at an induction dose of 160 mg at day 0 and 80 mg at week 2, followed by maintenance of 40 mg every 4 weeks until week 24. In the West 2004 study, all participants received infliximab at a dose of 5 mg/kg at weeks 6, 8 and 12. Rifaximin was evaluated in two placebo‐controlled RCTs (Prantera 2006; Prantera 2012). Metronidazole was studied in three induction trials (Ambrose 1985; Steinhart 2002; Thia 2009) and one maintenance trial (Sutherland 1991). Two studies evaluated metronidazole in combination with other therapeutic agents. In Prantera 1996, patients were assigned to metronidazole combined with ciprofloxacin or methylprednisolone, while patients enrolled in Steinhart 2002 received metronidazole combined with ciprofloxacin or placebo. All participants in the Steinhart 2002 study received budesonide (9 mg/day). One study compared a combination of cotrimoxazole and metronidazole with placebo (Ambrose 1985). Two trials compared clarithromycin to placebo (Lieper 2008; Selby 2007). In Lieper 2008 patients were randomised to placebo or clarithromycin and followed for three months. Selby 2007 assigned patients to clarithromycin, oral rifabutin, oral clofazimine or placebo, in addition to a tapering course of prednisolone.
Excluded studies
Twenty‐five studies were excluded with reasons after the full text review was performed. In ten studies, data on outcomes of interest were not available in the manuscript, (Allan 1997; Biancone 1998; Goodgame 2001; Gui 1997; Hartley‐Asp 1981; Jigaranu 2014; Laudage 1983; Lee 2018; Mitelman 1982; Turunen 1995) Two of these studies were cross‐over trials that did not report on outcomes pre‐crossover (Blichfeldt 1978; Ursing 1982). Nine trials were not RCTs (Bernstein 1992; Gilat 1982; Jaworski 2016; Koretz 1997; Leiper 2000; Melmed 2009; Ronge 2007; Steele 2009; To 1995). Three trials was terminated and data were not available (Koch 2007; Rogler 2014; Steinhart 2008). One study evaluated rectal therapy, which was beyond the scope of this review (Maeda 2010).
Risk of bias in included studies
The risk of bias for the included studies is summarized in Figure 2. Overall, most studies received low or unclear risk of bias ratings for the for seven domains.
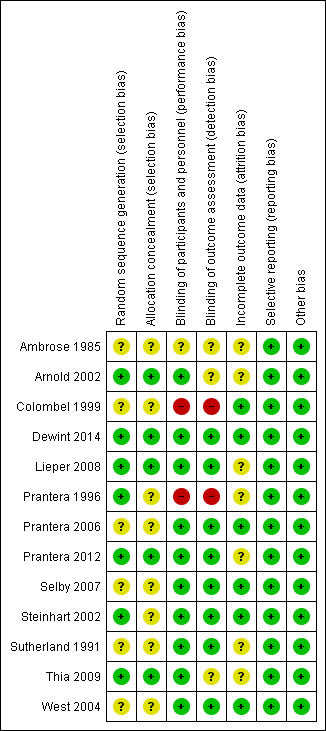
Risk of bias summary: review authors' judgements about each risk of bias item for each included study.
Allocation
Six of the included studies did not adequately describe the methods used to for random sequence generation and therefore received an unclear risk of bias assessment for this domain (Ambrose 1985; Colombel 1999; Prantera 2006; Selby 2007; Sutherland 1991; West 2004). The remaining seven studies were rated as low risk of bias for this item (Arnold 2002; Dewint 2014; Lieper 2008; Prantera 1996; Prantera 2012; Steinhart 2002; Thia 2009).
Eight of the included studies did not adequately describe the methods used to conceal allocation and therefore received an unclear risk of bias rating for this domain (Ambrose 1985; Colombel 1999; Prantera 1996; Prantera 2006; Selby 2007; Steinhart 2002; Sutherland 1991; West 2004) . The remaining five studies received a low risk of bias rating for this item (Arnold 2002; Dewint 2014; Lieper 2008; Prantera 2012; Thia 2009) .
Blinding
One study did not adequately describe whether participants and personnel were blinded, and therefore received an unclear risk of bias rating for this domain (Ambrose 1985). A total of 10 studies were rated as low risk of bias for blinding of participants and personnel (Arnold 2002; Dewint 2014; Lieper 2008; Prantera 2006; Prantera 2012; Selby 2007; Steinhart 2002; Sutherland 1991; Thia 2009; West 2004). Two studies were rated as high risk of bias for this domain (Colombel 1999; Prantera 2006). In Colombel 1999, participants and investigators were not blinded. In Prantera 1996, patients were blinded but some investigators were unblinded.
It was unclear whether outcome assessors were blinded in three studies (Ambrose 1985; Arnold 2002; Thia 2009). Eight of the included studies were rated as low risk of bias for blinded of outcome assessment (Dewint 2014; Lieper 2008; Prantera 2006; Prantera 2012; Selby 2007; Steinhart 2002; Sutherland 1991; West 2004), while two studies did not employ blinded outcome assessment and received high risk of bias ratings (Colombel 1999; Prantera 1996).
Incomplete outcome data
Seven of the included studies were rated as unclear risk of bias with regard to incomplete outcome data (Ambrose 1985; Arnold 2002; Lieper 2008; Prantera 1996; Prantera 2012; Sutherland 1991; Thia 2009). The remaining six studies were rated as low risk of bias (Colombel 1999; Dewint 2014; Prantera 2006; Selby 2007; Steinhart 2002; West 2004).
Selective reporting
All studies were rated as low risk of bias for selective reporting (Ambrose 1985; Arnold 2002; Colombel 1999; Dewint 2014; Lieper 2008; Prantera 1996; Prantera 2006; Prantera 2012; Selby 2007; Steinhart 2002; Sutherland 1991; Thia 2009; West 2004).
Other potential sources of bias
All studies were rated as low risk of bias for other sources of bias (Ambrose 1985; Arnold 2002; Colombel 1999; Dewint 2014; Lieper 2008; Prantera 1996; Prantera 2006; Prantera 2012; Selby 2007; Steinhart 2002; Sutherland 1991; Thia 2009; West 2004).
Effects of interventions
See: Summary of findings for the main comparison Antibiotic compared to placebo for induction and maintenance of remission in Crohn's disease; Summary of findings 2 Antibiotic with anti‐TNF compared to placebo with anti‐TNF for induction of remission in Crohn's disease
Ciprofloxacin versus placebo
Failure to enter clinical remission at week 10 or 12
Two placebo‐controlled trials involving a total of 65 patients reported on the proportion of patients who failed to enter clinical remission at week 10 or 12 (Arnold 2002; Thia 2009). Forty‐five per cent (17/38) of patients who received ciprofloxacin (500 mg twice daily) failed to achieve clinical remission compared with 74% (20/27) of patients assigned to placebo (RR 0.61, 95% CI 0.41 to 0.92). No heterogeneity was detected for this comparison (I² = 31%). The GRADE analysis indicated that the overall certainty of the evidence for this outcome was low due to very sparse data (See Table 1).
| Ciprofloxacin compared to placebo for induction of remission in Crohn's disease | ||||||
| Patient or population: Participants with active CD | ||||||
| Outcomes | Anticipated absolute effects* (95% CI) | Relative effect | № of participants | Quality of the evidence | Comments | |
| Risk with placebo | Risk with Ciprofloxacin | |||||
| Failure to enter clinical remission Follow‐up:10‐12 weeks | 741 per 1,000 | 489 per 1,000 | RR 0.66 | 65 | ⊕⊕⊝⊝ | Clinical remission was defined as CDAI ≤150 |
| Failure to maintain clinical remission Follow‐up: 24 weeks | 842 per 1,000 | 320 per 1,000 (185 to 573) | RR 0.38 (0.22 to 0.68) | 47 (1 RCT) | ⊕⊕⊝⊝ | Clinical remission was defined as CDAI ≤150 |
| Failure to have clinical response Follow‐up: 10 weeks | 875 per 1,000 | 403 per 1,000 (175 to 893) | RR 0.46 (0.20 to 1.02) | 18 (1 RCT) | ⊕⊕⊝⊝ | Clinical response was defined as at least a 50% reduction in baseline draining fistulas |
| Failure to maintain endoscopic remission | Not reported | This outcome was not reported | ||||
| Adverse events Follow‐up: 10‐24 weeks | 407 per 1,000 | 407 per 1,000 | RR 1.00 | 65 | ⊕⊕⊝⊝ | Adverse events included upper respiratory tract infection, abscess, open fistula, arthralgias and unpleasant taste/sore mouth |
| Serious adverse events | 0 per 1,000 | 0 per 1,000 (0 to 0) | not | 18 | No serious adverse events were observed | |
| Withdrawal due to adverse events Follow‐up: 10‐24 weeks | 148 per 1,000 | 50 per 1,000 | RR 0.34 | 65 | ⊕⊕⊝⊝ | Withdrawals were due to worsening Crohn's disease |
| *The risk in the intervention group (and its 95% confidence interval) is based on the assumed risk in the comparison group and the relative effect of the intervention (and its 95% CI). | ||||||
| GRADE Working Group grades of evidence | ||||||
1 Downgraded two levels due to very sparse data (37 events)
2 Downgraded two levels due to very sparse data (25 events)
3 Downgraded two levels due to very sparse data (11 events)
4 Downgraded two levels due to very sparse data (26 events)
5 Downgraded two levels due to very sparse data (6 events)
Failure to maintain clinical remission at week 24
One study (Arnold 2002, N = 48) reported on failure to maintain clinical remission at 24 weeks. Thirty‐two per cent (9/28) of patients receiving ciprofloxacin (500 mg twice daily) relapsed at 24 weeks compared with 84% (16/19) of patients assigned to placebo (RR 0.38. 95% CI 0.22 to 0.68) (Arnold 2002). The GRADE analysis indicated that the overall certainty of the evidence for this outcome was low due to very sparse data (See Table 1).
Failure to have a clinical response at week 10
One study (Thia 2009) evaluated failure to achieve clinical response at week 10. Forty per cent (4/10) of patients assigned to ciprofloxacin (500 mg twice daily) failed to have a clinical response at week 10 compared with 88% (7/8) of placebo patients (RR 0.46. 95% CI 0.20 to 1.02). The GRADE analysis indicated that the overall certainty of the evidence for this outcome was low due to very sparse data ( See Table 1).
Adverse events
Two studies that enrolled a total of 38 patients provided data on the proportion of patients with AEs (Arnold 2002; Thia 2009). Thirty‐nine per cent (15/38) of patients receiving ciprofloxacin (500 mg twice daily) experienced an AEcompared with 41% (11/27) of placebo patients (RR 1.0, 95% CI 0.57 to 1.76). No heterogeneity was detected for this comparison (I² = 0%). The GRADE analysis indicated that the certainty of evidence for this outcome was low due to very sparse data (See Summary of findings table 1). AEs in the ciprofloxacin group included Clostridium difficile infection, upper respiratory tract infection and abscess or open fistula. AEs in the placebo group included arthralgias, unpleasant taste/sore mouth and upper respiratory tract infections.
Serious adverse events
No patients in Thia 2009 reported serious SAEs. Arnold 2002 did not report on SAEs.
Withdrawal due to adverse events
Two studies (Arnold 2002; Thia 2009; N = 65) provided data on the proportion of patients who withdrew due to AEs. Seven per cent (2/38) of ciprofloxacin participants withdrew due to an AEcompared to 15% (4/27) placebo participants (RR 0.34, 95% CI 0.07 to 1.67). The overall certainty of evidence for this outcome was rated as low due very sparse data (SeeTable 1). Patients in both ciprofloxacin and placebo groups withdrew due to flare of disease.
Rifaximin versus placebo
Failure to enter clinical remission at week 12 or 14
Two placebo‐controlled trials enrolling a total of 489 patients reported on the proportion of patients who failed to enter clinical remission at week 12 or 14 (Prantera 2006; Prantera 2012). A total of 48% (174/360) of patients receiving rifaximin (800 mg to 2400 mg daily) failed to achieve remission compared with 60% (77/129) of those patients who received placebo (RR 0.82, 95% CI 0.69 to 0.98). No heterogeneity was detected (I² = 0%). The GRADE analysis indicated that the overall certainty of the evidence for this outcome was moderate due to sparse data (See Table 2).
| Rifaximin compared to placebo for induction of remission in Crohn's disease | ||||||
| Patient or population: Participants with active CD | ||||||
| Outcomes | Anticipated absolute effects* (95% CI) | Relative effect | № of participants | Quality of the evidence | Comments | |
| Risk with placebo | Risk with Rifaximin | |||||
| Failure to enter clinical remission Follow‐up 12‐14 weeks | 597 per 1,000 | 489 per 1,000 (412 to 585) | RR 0.82 (0.69 to 0.98) | 489 (2 RCTs) | ⊕⊕⊕⊝ | Clinical remission was defined as CDAI ≤150 |
| Failure to maintain clinical remission | Not reported | This outcome was not reported | ||||
| Failure to have clinical response Follow‐up: 12‐14 weeks | 519 per 1,000 | 426 per 1,000 | RR 0.82 | 489 | ⊕⊕⊕⊝ | Clinical response was defined as reduction of CDAI ≥ 70 points and reduction in CDAI score of 100 points |
| Failure to maintain endoscopic remission | Not reported | This outcome was not reported | ||||
| Adverse events Follow‐up: 12‐14 weeks | 473 per 1,000 | 392 per 1,000 | RR 0.83 | 489 | ⊕⊕⊕⊝ | Adverse events included gastrointestinal disorders, infections, headache and ocular disorders |
| Serious adverse events Follow‐up: 12‐14 weeks | 8 per 1,000 | 9 per 1,000 | RR 1.11 | 489 | ⊕⊕⊝⊝ | The types of serious adverse events were not described by study authors |
| Withdrawal due to adverse events Follow‐up: 12 ‐14 weeks | 62 per 1,000 | 78 per 1,000 | RR 1.25 | 489 | ⊕⊕⊝⊝ | The adverse events leading to withdrawal were not described by study authors |
| *The risk in the intervention group (and its 95% confidence interval) is based on the assumed risk in the comparison group and the relative effect of the intervention (and its 95% CI). | ||||||
| GRADE Working Group grades of evidence | ||||||
1 Downgraded one level due to sparse data (251 events)
2Downgraded one level due to sparse data (221 events)
3 Downgraded one level due to sparse data (201 events)
4 Downgraded two levels due to very sparse data (7 events)
5 Downgraded two levels due to very sparse data (37 events)
Planned subgroup analyses performed according to dose demonstrated 51% (67/131) of patients who received rifaximin 1600 mg once‐daily (OD) failed to enter clinical remission at week 12 or 14 compared with 62% (29/47) of patients who received placebo (RR 0.68, 95% CI 0.50 to 0.93). Forty per cent (51/126) of patients who received rifaximin 800 mg OD failed to enter clinical remission at week 12 or 14 compared with 60% (29/48) of patients who received placebo (RR 0.85, 95% CI 0.65 to 1.12) and 54% (56/103) of patients who received 2400 mg OD failed to enter clinical remission at week 12 or 14 compared with 56% (19/34)of placebo (RR 0.97, 95% CI 0.69 to 1.38). For dose, the test for subgroup differences showed no difference between the dose subgroups (test for subgroup differences Chi² = 2.40, df = 2, P = 0.30, I² = 16.7%).
Failure to have a clinical response at weeks 12 or 14
In these same studies (Prantera 2006; Prantera 2012), 43% (154/360) patients receiving rifaximin (800 mg to 2400 mg daily)failed to respond at weeks 12 or 14 compared with 52% (67/129) of patients receiving placebo (RR 0.82, 95% CI 0.67 to 1.01). No heterogeneity was seen for this comparison (I² = 0%). The overall certainty of evidence for this outcome was moderate due to sparse data (See Table 2).
Planned subgroup analyses performed according to dose demonstrated a difference between the rifaximin 1600 mg once‐daily (OD) and placebo. However, no difference between the rifaximin 800 mg OD or 2400 mg OD group and the placebo group was observed. In patients who received rifaximin 800 mg daily, 46% (60/131) of patients treated with rifaximin failed to achieve response at 12 or 14 weeks compared with 51% (24/47) of patients treated with placebo (RR 0.91, 95% CI 0.65 to 1.28). No heterogeneity was seen for this comparison (I² = 0%). In patients who received 1600 mg of rifaximin daily, 32% (41/126) of patients on the study drug failed to respond, compared with 52% (25/48) of patients receiving placebo (RR 0.63, 95% CI 0.43 to 0.91). No heterogeneity was seen in this comparison (I² = 0%). In patients who received 2400 mg of rifaximin daily, 51% (53/103) of patients failed to respond compared with 53% (18/34) in the placebo group (RR 0.97, 95% CI 0.67 to 1.40). The test for subgroup differences showed no difference between the dose subgroups (test for subgroup differences Chi² = 3.16, df = 2, P = 0.30, I² = 36.7%).
Adverse events
In total, 39% (140/360) patients who received rifaximin (800 mg to 2400 mg daily) reported an AE compared to 47% (61/129) of those who received placebo (RR 0.83, 95% CI 0.66 to 1.04). No heterogeneity was seen for this comparison (I² = 0%). The overall certainty of evidence for this outcome was moderate due to sparse data (See Table 2). AEs in the rifaximin group included gastrointestinal disorders, headache and skin and subcutaneous tissue disorders. AEs in the placebo group included gastrointestinal disorders, ocular disorders and headache.
Subgroup analysis by dose showed 34% (45/131) of patients taking rifaximin 800 mg had AEs compared with 49% (23/47) of patients who received placebo (RR 0.72, 95% CI 0.49 to 1.05). Forty per cent (50/126) of patients taking rifaximin 1600 mg had AEs compared with 48% (23/48) of patients who received placebo (RR 0.84, 95% CI 0.58 to 1.21). Forty four per cent (45/103) of patients taking rifaximin 2400 mg had AEs compared with 44% (15/34) of patients who received placebo (RR 0.99, 95% CI 0.64 to 1.53) (Prantera 2006; Prantera 2012). The test for subgroup differences showed no difference between the dose subgroups (test for subgroup differences Chi² = 1.20, df = 2, P = 0.55, I² = 0%).
Serious adverse events
Two per cent (6/360) of patients who received rifaximin (800 mg to 2400 mg daily) reported a SAE compared with 1% (1/129) of patients in the placebo group (RR 1.11, 95% CI 0.27 to 4.54). No heterogeneity was seen in this comparison (I² = 0%). The overall certainty of evidence for this outcome was low due to very sparse data (See Table 2). The one SAE reported in Prantera 2006 included scrotal edema. SAEs were not well described in Prantera 2012. However, one death was reported in the rifaximin group. The investigators felt that this death was not related to treatment,
Subgroup analysis by dose showed 2% (2/131) of patients taking rifaximin 800 mg experienced SAEs compared with 0% (0/47) of patients who received placebo (RR 1.64, 95% CI 0.08 to 33.26). Two per cent (2/126) of patients taking rifaximin 1600 mg had a SAEs compared with 0% (0/48) of patients who received placebo (RR 1.31, 95% CI 0.14 to 12.08). Two per cent (2/103) of patients taking rifaximin 2400 mg experienced SAEss compared with 3% (1/34) of patients who received placebo (RR 0.66, 95% CI 0.06 to 7.05) (Prantera 2006; Prantera 2012). The test for subgroup differences showed no difference between the dose subgroups (test for subgroup differences Chi² = 0.27, df = 2, P = 0.87, I² = 0%).
Withdrawal due to adverse events
Eight per cent (29/360) of patients receiving rifaximin (800 mg to 2400 mg daily) withdrew from studies due to AEs, compared to 6% (8/129) of patients receiving placebo (RR 1.25, 95% CI 0.59 to 2.64). No heterogeneity was seen in this comparison (I² = 0%). The overall certainty of evidence for this outcome was low due to very sparse data (See Table 2). A summary AEs that led to withdrawal was not reported by study authors.
Subgroup analysis by dose showed 4% (5/131) of patients taking rifaximin 800 mg withdrew due to AEs compared with 6% (3/47) of patients who received placebo (RR 0.56, 95% CI 0.14 to 2.16). Six per cent (8/126) of patients taking rifaximin 1600 mg withdrew due to AEs compared with 6% (3/48) of patients who received placebo (RR 1.07, 95% CI 0.30 to 3.83). Sixteen per cent (16/103) of patients taking rifaximin 2400 mg withdrew due to AEs compared with 6% (2/34) of patients who received placebo (RR 2.64, 95% CI 0.64 to 10.90)(Prantera 2006; Prantera 2012). The test for subgroup differences showed no difference between the dose subgroups (test for subgroup differences Chi² = 2.42, df = 2, P = 0.30, I² = 17.5%).
Metronidazole versus placebo
Failure to enter clinical remission at week 6 or 10
Two placebo controlled trials (Ambrose 1985; Thia 2009), that comprised a total of 50 patients, reported on the number of patients who failed to enter clinical remission at weeks 6 or 10. One of these studies had failure of clinical remission as a primary end point (Ambrose 1985) and another had failure of clinical remission as a secondary end point (Thia 2009) at weeks 6 or 10. Two therapeutic doses of metronidazole (400 mg to 500 mg twice daily) were used in these studies. Sixty per cent (15/25) of patients who received metronidazole failed to enter clinical remission at week 6 or 10 compared with 68% (17/25) of patients who received placebo (RR 0.91, 95% CI 0.62 to 1.33). No heterogeneity was seen for this comparison (I² = 45%). A GRADE analysis indicated that the overall certainty of the evidence for the this outcome was low due to very sparse data (See Table 3).
| Metronidazole compared to placebo for induction of remission in Crohn's disease | ||||||
| Patient or population: Participants with active CD | ||||||
| Outcomes | Anticipated absolute effects* (95% CI) | Relative effect | № of participants | Quality of the evidence | Comments | |
| Risk with placebo | Risk with Metronidazole | |||||
| Failure to enter clinical remission Follow‐up: 6‐10 weeks | 680 per 1,000 | 619 per 1,000 | RR 0.91 | 50 | ⊕⊕⊝⊝ | Clinical remission was defined as closure of all open actively draining fistulas at baseline |
| Failure to maintain clinical remission | Not reported | This outcome was not reported | ||||
| Failure to have clinical response Follow‐up: 10 weeks | 875 per 1,000 | 604 per 1,000 (341 to 1,000) | RR 0.69 (0.39 to 1.21) | 18 (1 RCT) | ⊕⊕⊝⊝ | Clinical response was defined as at least a 50% reduction in baseline draining fistulas |
| Failure to maintain endoscopic remission | Not reported | This outcome was not reported | ||||
| Adverse events Follow‐up: 6‐10 weeks | 274 per 1,000 | 233 per 1,000 | RR 0.85 | 149 | ⊕⊝⊝⊝ | Adverse events include gastrointestinal upset, abscess formation and arthropathy.paraesthesias and sore mouth. |
| Serious adverse events | 0 per 1,000 | 0 per 1,000 | not estimable | 15 | No serious adverse events were observed | |
| Withdrawal due to adverse events Follow‐up: 6‐10 weeks | 148 per 1,000 | 114 per 1,000 | RR 0.77 | 149 | ⊕⊕⊝⊝ | Withdrawal due to adverse events was most often due to headache, gastrointestinal symptoms, abscess formation, rash and arthralgia |
| *The risk in the intervention group (and its 95% confidence interval) is based on the assumed risk in the comparison group and the relative effect of the intervention (and its 95% CI). | ||||||
| GRADE Working Group grades of evidence | ||||||
1 Downgraded two levels due to very sparse data (32 events)
2 Downgraded two levels due to very sparse data (13 events)
3Downgraded one level due to serious inconsistency (I2 = 71%)
4 Downgraded two levels due to very sparse data (33 events)
5 Downgraded two levels due to very sparse data (19 events)
Failure to enter clinical remission at week 16
An additional study evaluated failure to achieve clinical remission at week 16 in 99 patients (Sutherland 1991). Remission in this case was defined by improvement in the patients Crohn's Disease Activity Index (CDAI) score to less than 150. The pooled analysis showed no difference between metronidazole (400 mg to 500 mg twice daily) and placebo for induction of clinical remission. Sixty‐eight per cent (43/63) of patients receiving metronidazole failed to achieve remission at week 16 compared with 67% (24/36) of patients receiving placebo (RR 1.03, 95% CI 0.77 to 1.36). No heterogeneity was seen for this comparison (I² = 0%).
Planned subgroup analysis according to dose showed no difference in clinical remission rates. Two different doses of metronidazole were used in this study. In the group that received 10 mg/kg of metronidazole, 64% (21/33) of patients failed to achieve remission at week 16, compared with 67% (12/18) in the group that received placebo (RR 0.95, 95% CI 0.63 to 1.45). In group that received 20 mg/kg of metronidazole, 73% (22/30) of patients failed to achieve remission compared with 67% (12/18) of patients assigned to placebo (RR 1.10, 95% CI 0.74 to 1.63). The test for subgroup differences showed no difference between the dose subgroups (test for subgroup differences Chi² = 0.24, df = 1, P = 0.63, I² = 0%).
Failure to have clinical response at week 10
Thia 2009 evaluated failure to achieve clinical response at 10 weeks in 19 patients. Sixty per cent (6/10) of patients assigned to metronidazole failed to achieve clinical response at week 10 compared with 88% (7/8) of patients who received placebo (RR 0.69, 95% CI 0.39 to 1.21). A GRADE analysis indicated that the overall certainty of the evidence for this outcome was low due to very sparse data (See Table 3).
Adverse events
Eighteen per cent (16/87) of metronidazole patients reported AEs compared to 27% (17/62) of those assigned to placebo (RR 0.80, 95% CI 0.48 to 1.33). A GRADE analysis indicated that the overall certainty of the evidence for AEs was very low due to very serious inconsistency and very sparse data (See Summary of findings table 3). AEs in the metronidazole group included gastrointestinal upset, abscess formation and arthropathy. AEs in the placebo group included gastrointestinal upset, paraesthesias and sore mouth.
Serious adverse events
Thia 2009 reported no SAEs.
Withdrawal due to adverse events
Eleven per cent (10/88) of patients assigned to metronidazole withdrew from the study due to AEscompared with 15% (9/61) of patients on placebo (RR 0.77, 95% CI 0.36 to 1.68) (Ambrose 1985; Sutherland 1991; Thia 2009). A GRADE analysis indicated that the overall certainty of the evidence for withdrawal due to AEs was low due to very sparse data (See Table 3). Withdrawal due to AEs in the metronidazole group was most often due to headache, gastrointestinal symptoms and abscess formation and in the placebo group was most commonly due to rash and arthralgia.
Clarithromycin versus placebo
Failure to enter clinical remission at 12 weeks
One study that evaluated a total of 41 patients used clarithromycin as an induction agent (Lieper 2008). The primary end point of this study was clinical remission at 12 weeks as defined by CDAI ≤ 150. Eighty‐four per cent (16/19) of patients who received clarithromycin (1 g daily) failed to enter clinical remission at 12 weeks compared to 81% (18/22) of patients assigned to receive placebo (RR 1.03, 95% CI 0.78 to 1.36). A GRADE analysis indicated that the overall certainty of the evidence for this outcome was low due to very sparse data (See Table 4).
| Clarithromycin compared to placebo for induction of remission in Crohn's disease | ||||||
| Patient or population: Participants with active CD | ||||||
| Outcomes | Anticipated absolute effects* (95% CI) | Relative effect | № of participants | Quality of the evidence | Comments | |
| Risk with placebo | Risk with Clarithromycin | |||||
| Failure to enter clinical remission Follow‐up:12 weeks | 818 per 1,000 | 843 per 1,000 | RR 1.03 | 41 | ⊕⊕⊝⊝ | Clinical remission was defined as CDAI ≤150 |
| Failure to maintain clinical remission | Not reported | This outcome was not reported | ||||
| Failure to have clinical response Follow‐up: 12 weeks | 818 per 1,000 | 736 per 1,000 (532 to 1,000) | RR 0.90 (0.65 to 1.26) | 41 (1 RCT) | ⊕⊕⊝⊝ | Clinical response was defined by CDAI reduction by ≥ 70 from baseline |
| Failure to maintain endoscopic remission | Not reported | This outcome was not reported | ||||
| Adverse events Follow‐up: 12 weeks | 45 per 1,000 | 210 per 1,000 | RR 4.63 | 41 | ⊕⊕⊝⊝ | Adverse events included gastrointestinal symptoms |
| Serious adverse events | Not reported | This outcome was not reported | ||||
| Withdrawal due to adverse events Follow‐up: 12 weeks | 500 per 1,000 | 370 per 1,000 | RR 0.74 | 41 | ⊕⊕⊝⊝ | Withdrawal due to adverse events was most often due to gastrointestinal symptoms |
| *The risk in the intervention group (and its 95% confidence interval) is based on the assumed risk in the comparison group and the relative effect of the intervention (and its 95% CI). | ||||||
| GRADE Working Group grades of evidence | ||||||
1 Downgraded two levels due to very sparse data (34 events)
2 Downgraded two levels due to very sparse data (32 events)
3Downgraded two levels due to very sparse data (5 events)
4 Downgraded two levels due to very sparse data (18 events)
Failure to have clinical response at 12 weeks
Seventy‐four per cent (14/19) of clarithromycin (1 g daily) patients failed to have a clinical response at week 12, compared with 82% (18/22) of patients assigned to placebo (RR 0.90, 95% CI 0.65 to 1.26) (Lieper 2008).The certainty of evidence for this outcome was rated as low due to very sparse data (See Table 4).
Adverse events
Twenty‐one per cent (4/19) of patients who received clarithromycin (1 g daily) reported an AE compared with 5% (1/22) of patients in the placebo group (RR 4.63, 95% CI 0.57 to 37.96) (Lieper 2008). Most common AEs seen in both clarithromycin and placebo group were gastrointestinal symptoms..A GRADE analysis indicated that the overall certainty of the evidence for this outcome was low due to very sparse data (See Table 4).
Serious adverse events
Lieper 2008 did not report on this outcome.
Withdrawal due to adverse events
Thirty‐seven per cent (7/19) of patients who received 1 g daily clarithromycin withdrew due to AEs, compared to 50% (11/22) of those in the placebo group (RR 0.74, 95% CI 0.36 to 1.52) (Lieper 2008). The most common reason for withdrawal due to AEs seen in both the clarithromycin and placebo groups was gastrointestinal symptoms. The overall certainty of the evidence for this outcome was low due to very sparse data (See Table 4).
Cotrimoxazole versus placebo
Failure to enter clinical remission at week 12
One study that evaluated 33 patients assessed the efficacy of cotrimoxazole (960 mg twice daily) induction therapy (Ambrose 1985). The primary end point of this study was an improvement in a clinical assessment score created by the Authors at week 12. This score was defined by the authors. Sixteen patients were randomised to the cotrimoxazole arm of this study and 17 received placebo. Sixty‐nine per cent (11/16) of patients who received cotrimoxazole failed to enter clinical remission at 12 weeks compared to 59% (10/17) of patients assigned to placebo (RR 1.17, 95% CI 0.70 to 1.96). A GRADE analysis indicated that the overall certainty of the evidence for this outcome was low due to very sparse data (See Table 5).
| Cotrimoxazole compared to placebo for induction of remission in Crohn's disease | ||||||
| Patient or population: Participants with active CD | ||||||
| Outcomes | Anticipated absolute effects* (95% CI) | Relative effect | № of participants | Quality of the evidence | Comments | |
| Risk with placebo | Risk with Cotrimoxazole | |||||
| Failure to enter clinical remission Follow‐up: week 12 | 588 per 1,000 | 688 per 1,000 | RR 1.17 | 33 | ⊕⊕⊝⊝ | Clinical remission was defined as improvement in clinical assessment and laboratory indices |
| Failure to maintain clinical remission | Not reported | This outcome was not reported | ||||
| Failure to have a clinical response | Not reported | This outcome was not reported | ||||
| Failure to maintain endoscopic remission | Not reported | This outcome was not reported | ||||
| Adverse events Follow‐up: 12 weeks | 176 per 1,000 | 125 per 1,000 | RR 0.71 | 33 | ⊕⊕⊝⊝ | Adverse events included nausea, vomiting and arthropathy |
| Serious adverse events | Not reported | This outcome was not reported | ||||
| Withdrawal due to adverse events Follow‐up: 12 weeks | 59 per 1,000 | 125 per 1,000 | RR 2.13 | 33 | ⊕⊕⊝⊝ | Withdrawal due to adverse events was most often due to nausea, vomiting and arthropathy |
| *The risk in the intervention group (and its 95% confidence interval) is based on the assumed risk in the comparison group and the relative effect of the intervention (and its 95% CI). | ||||||
| GRADE Working Group grades of evidence | ||||||
1 Downgraded two levels due to very sparse data (21 events)
2 Downgraded two levels due to very sparse data (5 events)
3 Downgraded two levels due to very sparse data (3 events)
Adverse events
One per cent (2/16) of patients in the cotrimoxazole (960 mg twice daily) group reported an AE compared with 18% (3/17) of patients who received placebo (RR 0.71, 95% CI 0.14 to 3.70) (Ambrose 1985). AEs in cotrimoxazole group included nausea, vomiting and arthropathy. AEs in the placebo group were not mentioned by study authors. The overall certainty of evidence for this outcome is low due to very sparse data (See Table 5).
Serious adverse events
Ambrose 1985 did not report on this outcome.
Withdrawal due to adverse events
Thirteen per cent (2/16) of patients receiving 960 mg twice daily cotrimoxazole withdrew due to AEs, compared to 6% (1/17) of patients in the placebo group (RR 2.13, 95% CI 0.21 to 21.22) (Ambrose 1985). AEs leading to withdrawal in the cotrimoxazole group included nausea, vomiting and arthropathy. AEs leading to study withdrawal in the placebo group were not described by the study authors.The overall certainty of evidence for this outcome was low due to very sparse data (See Table 5).
Ciprofloxacin and metronidazole versus methylprednisolone
Failure to enter clinical remission at week 12
Prantera 1996 (N=41) compared a combination of ciprofloxacin (500 mg twice daily) and metronidazole (250 mg four times daily) to methylprednisolone (0.7‐1 mg/kg daily) induction therapy. The primary end point of this study was clinical remission at 12 weeks as defined by CDAI ≤ 150. Fifty‐five per cent (12/22) of patients in the antibiotic group failed to enter clinical remission at week 12, compared with 37% (7/19) of patients receiving methylprednisolone (RR 1.48, 95% CI 0.73 to 2.99). A GRADE analysis indicated that the overall certainty of the evidence for this outcome was low due to very sparse data (See Table 6).
| Ciprofloxacin and metronidazole compared to methylprednisone for induction and maintenance of remission in Crohn's disease | ||||||
| Patient or population: Participants with active CD | ||||||
| Outcomes | Anticipated absolute effects* (95% CI) | Relative effect | № of participants | Quality of the evidence | Comments | |
| Risk with methylprednisone | Risk with Ciprofloxacin and metronidazole | |||||
| Failure to enter clinical remission Follow‐up: 12 weeks | 368 per 1,000 | 545 per 1,000 | RR 1.48 | 41 | ⊕⊝⊝⊝ | Clinical remission was defined as CDAI ≤150 |
| Failure to maintain clinical remission Follow‐up: 52 weeks | 684 per 1,000 | 773 per 1,000 | RR 1.13 | 41 | ⊕⊕⊝⊝ | Clinical remission was defined as CDAI ≤150 |
| Failure to have clinical response | Not reported | This outcome was not reported | ||||
| Failure to maintain endoscopic remission | Not reported | This outcome was not reported | ||||
| Adverse events Follow‐up: 12‐52 weeks | 105 per 1,000 | 273 per 1,000 | RR 2.59 | 41 | ⊕⊕⊝⊝ | Adverse events include nausea, metallic taste, reflux symptoms, Cushingoid facies and acne |
| Serious adverse events | Not reported | This outcome was not reported | ||||
| Withdrawal due to adverse events Follow‐up: 12‐52 weeks | 105 per 1,000 | 273 per 1,000 | RR 2.59 | 41 | ⊕⊕⊝⊝ | Withdrawal due to adverse events was most often due to nausea, vomiting, reflux symptoms, hypertension, elevated amylase, acne and tremor |
| *The risk in the intervention group (and its 95% confidence interval) is based on the assumed risk in the comparison group and the relative effect of the intervention (and its 95% CI). | ||||||
| GRADE Working Group grades of evidence | ||||||
1 Downgraded two levels due to very sparse data (19 events)
2 Downgraded one level due to high risk bias (blinding)
3 Downgraded two levels due to very sparse data (30 events)
4 Downgraded two levels due to very sparse data (8 events)
Failure to maintain clinical remission at week 52
Seventy‐seven per cent (17/22) of patients assigned to antibiotics failed to maintain clinical remission at week 52 compared to 68% (13/19) of patients who received methylprednisolone (0.7‐1 mg/kg daily) (RR 1.13, 95% CI 0.77 to 1.65) (Prantera 1996). A GRADE analysis indicated that the overall certainty of the evidence for this outcome was low due to very sparse data (See Table 6)
Adverse events
Twenty‐seven per cent (6/22) of patients who received combination antibiotic therapy reported an AE compared with 11%(2/19) of patients who received methylprednisolone (RR 2.59, 95% CI 0.59 to 11.36) (Prantera 1996). AEs in patients receiving the combination of ciprofloxacin and metronidazole included nausea, metallic taste and reflux symptoms. AEs in steroid group included Cushingoid facies, acne and reflux. The overall certainty of evidence for this outcome was low due to very sparse data (See Table 6).
Serious adverse events
Prantera 1996 did not report on SAES.
Withdrawal due to adverse events
Twenty‐seven per cent (6/22) of patients receiving antibiotics withdrew from the study due to AEs, compared with 11% (2/19) of patients on steroid (RR 2.59, 95% CI 0.59 to 11.36) (Prantera 1996). AEs leading to withdrawal in patients receiving ciprofloxacin and metronidazole included nausea, vomiting and reflux symptoms. AEs in steroid group resulting in withdrawal included hypertension, elevated amylase, acne and tremor. The overall certainty of evidence for this outcome was low due to very sparse data (See Table 6).
Ciprofloxacin and metronidazole and budesonide versus placebo and budesonide
Failure to enter clinical remission at week 8
One study (N = 134) compared a combination of ciprofloxacin (500 mg twice daily) and metronidazole (500 mg twice daily) to placebo (Steinhart 2002). Both groups received oral budesonide (9 mg daily) induction therapy. The primary end point of this study was clinical remission at eight weeks as defined by CDAI < 150. Sixty‐eight per cent (45/66) of patients in the antibiotic group failed to achieve clinical remission at week 12, compared with 62% (43/69) of patients who received placebo (RR 1.08, 95% CI 0.84 to 1.38). A GRADE analysis indicated that the overall certainty of the evidence for this outcome was moderate due to sparse data (See Table 7).
| Ciprofloxacin and metronidazole and budesonide compared to placebo with budesonide for induction of remission in Crohn's disease | ||||||
| Patient or population: Participants with active CD | ||||||
| Outcomes | Anticipated absolute effects* (95% CI) | Relative effect | № of participants | Quality of the evidence | Comments | |
| Risk with placebo | Risk with Ciprofloxacin and metronidazole | |||||
| Failure to enter clinical remission Follow‐up: 8 weeks | 632 per 1,000 | 683 per 1,000 | RR 1.08 | 134 | ⊕⊕⊕⊝ | Clinical remission was defined as CDAI ≤150 |
| Failure to maintain clinical remission | Not reported | This outcome was not reported | ||||
| Failure to have clinical response | Not reported | This outcome was not reported | ||||
| Failure to maintain endoscopic remission | Not reported | This outcome was not reported | ||||
| Adverse events Follow‐up: 8 weeks | 0 per 1,000 | 0 per 1,000 | RR 27.81 | 134 | ⊕⊕⊝⊝ | Adverse events included taste disturbance, dizziness, gastrointestinal upset and vaginitis |
| Serious adverse events Follow‐up: 8 weeks | 29 per 1,000 | 46 per 1,000 | RR 1.55 | 134 | ⊕⊕⊝⊝ | The types of serious adverse events were not reported |
| Withdrawal due to adverse events Follow‐up: 8 weeks | 0 per 1,000 | 0 per 1,000 | RR 27.81 | 134 | ⊕⊕⊝⊝ | Withdrawals due to adverse events were most often due to nausea, taste disturbance and rash |
| *The risk in the intervention group (and its 95% confidence interval) is based on the assumed risk in the comparison group and the relative effect of the intervention (and its 95% CI). | ||||||
| GRADE Working Group grades of evidence | ||||||
1 Downgraded one level due to sparse data (88 events)
2 Downgraded two levels due to very sparse data (13 events)
3 Downgraded two levels due to very serious imprecision (5 events)
Adverse events
Twenty per cent (13/66) of patients receiving antibiotics reported an AE compared with 0% (0/68) of patients who received placebo (RR 27.81, 95% CI 1.69 to 458.44) (Steinhart 2002). Common AEs in the antibiotics group included taste disturbance, dizziness and gastrointestinal upset. Common AEs in the placebo group included gastrointestinal upset, dizziness and vaginitis.The overall certainty of evidence for this outcome was low due to very sparse data (See Table 7).
Serious adverse events
Five per cent (3/66) of patients receiving antibiotics experienced a SAE compared with 0% (0/68) of patients who received placebo (RR1.55, 95% CI 0.27 to 8.95) (Steinhart 2002). Specific SAEs were not described by the study authors.The overall certainty of evidence for this outcome was low due to very sparse data (See Table 7).
Withdrawal due to adverse events
Twenty per cent (13/66) of patients receiving antibiotics withdrew from the study due to AEs, compared with 0% (0/68) of patients who received placebo (RR 27.81, 95% CI 1.69 to 458.44) (Steinhart 2002). Patients in the antibiotic group withdrew due to nausea, taste disturbance and rash. The overall certainty of evidence for this outcome was low due to very sparse data (See Table 7).
Ciprofloxacin versus mesalazine
Failure to enter clinical remission at week 6
Colombel 1999 (N = 40) compared ciprofloxacin (500 mg twice daily) with mesalamine (2 g twice daily) induction therapy. The primary end point of this study was clinical remission at six weeks defined by a CDAI ≤ 150. Forty‐four per cent (8/18) of patients who received ciprofloxacin failed to enter clinical remission at week six, compared with 45% (10/22) of patients assigned to mesalamine (RR 0.98, 95% CI 0.49 to 1.95). A GRADE analysis indicated that the overall certainty of the evidence for this outcome was very low due to very sparse data and high risk of bias (lack of blinding) (See Table 8).
| Ciprofloxacin compared to mesalazine for induction of remission in Crohn's disease | ||||||
| Patient or population: Participants with active CD | ||||||
| Outcomes | Anticipated absolute effects* (95% CI) | Relative effect | № of participants | Quality of the evidence | Comments | |
| Risk with mesalazine | Risk with Ciprofloxacin | |||||
| Failure to enter clinical remission Follow‐up: 6 weeks | 455 per 1,000 | 445 per 1,000 | RR 0.98 | 40 | ⊕⊝⊝⊝ | Clinical remission was defined as CDAI ≤150 |
| Failure to maintain clinical remission | Not reported | This outcome was not reported | ||||
| Failure to have clinical response | Not reported | This outcome was not reported | ||||
| Failure to maintain endoscopic remission | Not reported | This outcome was not reported | ||||
| Adverse Events Follow‐up: 6 weeks | 0 per 1,000 | 0 per 1,000 | RR 3.63 | 40 | ⊕⊝⊝⊝ | Adverse events included abdominal pain |
| Serious adverse events | Not reported | This outcome was not reported | ||||
| Withdrawal due to adverse events Follow‐up: 6 weeks | 0 per 1,000 | 0 per 1,000 | RR 3.63 | 40 | ⊕⊝⊝⊝ | The withdrawal due to an adverse event was due to abdominal pain |
| *The risk in the intervention group (and its 95% confidence interval) is based on the assumed risk in the comparison group and the relative effect of the intervention (and its 95% CI). | ||||||
| GRADE Working Group grades of evidence | ||||||
1 Downgraded one level due to high risk of bias (no blinding)
2 Downgraded two levels due to very sparse data (18 events)
3 Downgraded two levels due to very sparse data (1 event)
Adverse events
Six per cent (1/18) of patients who received ciprofloxacin reported an AE compared with 0% (0/22) of patients assigned to mesalamine (RR 3.63, 95% CI 0.16 to 84.11) (Colombel 1999). The AE in the ciprofloxacin group was abdominal pain. The overall certainty of evidence for this outcome was very low due to very sparse data and risk of bias (lack of blinding) (See Table 8).
Serious adverse events
Colombel 1999 did not report on SAEs.
Withdrawal due to adverse events
Six per cent (1/18) of patients who received ciprofloxacin withdrew from the study due to AEs, compared with 0% (0/22) of patients assigned to mesalamine (RR 3.63, 95% CI 0.16 to 84.11) (Colombel 1999). The AE that led to withdrawal in the ciprofloxacin group was abdominal pain.The overall certainty of evidence for this outcome was very low due to very sparse data and risk of bias (lack of blinding) (See Table 8).
Ciprofloxacin with adalimumab versus placebo with adalimumab
Failure to enter clinical remission at week 12
Dewint 2014 compared ciprofloxacin (500 mg twice daily) to placebo in 76 patients who also received concomitant adalimumab induction therapy (Dewint 2014). Secondary end points included clinical remission at twelve weeks as defined by CDAI. Twenty‐four per cent (9/37) of patients in the ciprofloxacin group failed to enter clinical remission at week 12, compared with 36% (14/39) of patients who received placebo (RR 0.68, 95% CI 0.33 to 1.37). A GRADE analysis indicated that the overall certainty of the evidence for this outcome was low due to very serious imprecision (See Table 9).
| Ciprofloxacin with adalimumab compared to placebo with adalimumab for induction and maintenance of remission in Crohn's disease | ||||||
| Patient or population: Participants with active CD | ||||||
| Outcomes | Anticipated absolute effects* (95% CI) | Relative effect | № of participants | Quality of the evidence | Comments | |
| Risk with placebo with adalimumab | Risk with Ciprofloxacin with adalimumab | |||||
| Failure to enter clinical remission Follow‐up: 12 weeks | 359 per 1,000 | 244 per 1,000 | RR 0.68 | 76 | ⊕⊕⊝⊝ | Clinical remission was defined as the closure of all fistulas All patients were treated with self‐administered adalimumab (patients were given induction dosing of 160 mg at day 0 and 80 mg at week 2, followed by maintenance of 40 mg every 4 weeks until week 24) |
| Failure to maintain clinical remission Follow‐up: 24 weeks | See comments | Although the authors reported on this outcome, we did not include it as participants only received ciprofloxacin up to week 12. All participants received maintenance adalimumab after week 12 | ||||
| Failure to have clinical response | Not reported | This outcome was not reported | ||||
| Failure to maintain endoscopic remission | Not reported | This outcome was not reported | ||||
| Adverse Events Follow‐up: 12‐24 weeks | 872 per 1,000 | 837 per 1,000 | RR 0.96 | 76 | ⊕⊕⊕⊝ | Adverse events included respiratory tract infection, fatigue and headache |
| Serious adverse events Follow‐up: 12‐24 weeks | 77 per 1,000 | 81 per 1,000 | RR 1.05 | 76 | ⊕⊕⊝⊝ | Serious adverse events included sagittal sinus thrombosis, severe disease flares, herpes simplex infection and parastomal herniation |
| Withdrawal due to adverse events Follow‐up: 12‐24 weeks | 77 per 1,000 | 54 per 1,000 | RR 0.70 | 76 | ⊕⊕⊝⊝ | Specific adverse events causing withdrawal were not reported |
| *The risk in the intervention group (and its 95% confidence interval) is based on the assumed risk in the comparison group and the relative effect of the intervention (and its 95% CI). | ||||||
| GRADE Working Group grades of evidence | ||||||
1 Downgraded two levels due to very sparse data (23 events)
2 Downgraded two levels due to very sparse data (29 events)
3 Downgraded one level due to sparse data (65 events)
4 Downgraded two levels due to very sparse data (6 events)
5 Downgraded two levels due to very sparse data (5 events)
Adverse events
Eighty‐four per cent (31/37) of ciprofloxacin (500 mg twice daily) patients reported an AE compared with 87% (34/39) of patients assigned to placebo (RR 0.96, 95% CI 0.80 to 1.16) (Dewint 2014). Common AEs included upper respiratory tract infection, fatigue and headache.The overall certainty of evidence for this outcome is moderate due to sparse data (See Table 9).
Serious adverse events
Eight per cent (3/37) of patients who received ciprofloxacin (500 mg twice daily) had a SAE compared with 8% (3/39) of patients assigned to placebo (RR 1.05, 95% CI 0.23 to 4.90) (Dewint 2014). SAEs in patients who received ciprofloxacin included sagittal sinus thrombosis and severe disease flares. SAEs in patients who received placebo included herpes simplex infection, parastomal herniation and severe disease flares. The overall certainty of evidence for this outcome was low due to very sparse data (See Table 9).
Withdrawal due to adverse events
Five per cent (2/37) of patients who received ciprofloxacin (500 mg twice daily) withdrew from the study due to AEs, compared with 8% (3/39) of patients assigned to placebo (RR 0.70, 95% CI 0.12 to 3.97) (Dewint 2014). The specific AEs causing withdrawal were not described by the study authors. The overall certainty of evidence for this outcome is low due to very sparse data (See Table 9).
Ciprofloxacin with infliximab versus placebo with infliximab
Failure to have clinical response at week 12
West 2004 (N = 24) compared ciprofloxacin (500 mg twice daily) to placebo in patients who also received infliximab therapy for the treatment of fistulizing CD. The primary endpoint was clinical response defined as 50% or greater reduction in draining fistulae confirmed by no drainage despite firm finger compression. Secondary end points included AEs and withdrawal due to AEs. Twenty‐four patients were enrolled in this trial. Nine per cent (1/11) of patients in the ciprofloxacin group failed to have a clinical response at week 12, compared with 38% (5/13) of patients who received placebo (RR 0.24, 95% CI 0.03 to 1.73). GRADE analysis indicated that the overall certainty of the evidence for the this outcome was low due to very sparse data (See Table 10).
| Ciprofloxacin with infliximab compared to placebo with infliximab for induction of remission in Crohn's disease | ||||||
| Patient or population: Participants with active CD | ||||||
| Outcomes | Anticipated absolute effects* (95% CI) | Relative effect | № of participants | Quality of the evidence | Comments | |
| Risk with placebo with infliximab | Risk with Ciprofloxacin with infliximab | |||||
| Failure to enter clinical remission | Not reported | This outcome was not reported | ||||
| Failure to maintain clinical remission | Not reported | This outcome was not reported | ||||
| Failure to have clinical response Follow‐up: 12 weeks | 385 per 1,000 | 92 per 1,000 | RR 0.24 | 24 | ⊕⊕⊝⊝ | Clinical response was defined as 50% or greater reduction in draining fistulae confirmed by no drainage despite firm finger compression |
| Failure to maintain endoscopic remission | Not reported | This outcome was not reported | ||||
| Adverse events Follow‐up: 12 weeks | 692 per 1,000 | 547 per 1,000 | RR 0.79 | 24 | ⊕⊕⊝⊝ | Adverse events included nausea, rash and diarrhea and metallic taste |
| Serious adverse events | Not reported | This outcome was not reported | ||||
| Withdrawal due to adverse events Follow‐up: 12 weeks | 77 per 1,000 | 91 per 1,000 | RR 1.18 | 24 | ⊕⊕⊝⊝ | Adverse events leading to withdrawal included infusion reaction and disease exacerbation |
| *The risk in the intervention group (and its 95% confidence interval) is based on the assumed risk in the comparison group and the relative effect of the intervention (and its 95% CI). | ||||||
| GRADE Working Group grades of evidence | ||||||
1 Downgraded two levels due to very sparse data (6 events)
2 Downgraded two levels due to very sparse data (15 events)
3 Downgraded two levels due to very sparse data (2 events)
Adverse events
Fifty‐five per cent (6/11) of patients who received ciprofloxacin (500 mg twice daily) reported an AE compared with 69% (9/13) of those who received placebo (RR 0.79, 95% CI 0.41 to 1.51) (West 2004). Common AEs in the ciprofloxacin group included nausea, rash, diarrhea, arthralgias, infusion reactions, and perianal abscess. Common AEs in the placebo group included metallic taste, exacerbation of CD, arthralgias, infusion reaction, headache, nausea and perianal abscess. The overall certainty of evidence for this outcome was low due to very sparse data (See Table 10).
Serious adverse events
West 2004 did not report on SAEs.
Withdrawal due to adverse events
Nine per cent (1/11) of patients who received ciprofloxacin (500 mg twice daily) withdrew from the study due to an AE compared with 8% (1/13) of placebo patients (RR 1.18, 95% CI 0.08 to 16.78) (West 2004). AEs leading to withdrawal included an infusion reaction in the ciprofloxacin group and disease exacerbation in the placebo group. The overall certainty of evidence for this outcome was low due to very sparse data (See Table 10).
Clarithromycin and antimycobacterial versus placebo
Failure to enter clinical remission at week 16
One study performed a controlled trial that compared combination antimycobacterial therapy with clarithromycin (750 mg daily), clofazimine (50 mg daily) and rifabutin (450 mg daily) to placebo as long term therapy for CD (Selby 2007). Primary end points were failure to maintain clinical remission at weeks 52, 104 or 156 weeks. Secondary end points were induction of remission at week 16 (CDAI ≤ 150), failure to achieve endoscopic remission and withdrawal due to AEs. Two‐hundred and thirteen patients were enrolled in the induction phase and one hundred and twenty‐two in the maintenance phase. Thirty‐four per cent (35/102) of patients in the clarithromycin group failed to have a clinical response at week 16, compared with 50% (56/111) of patients receiving placebo (RR 0.68, 95% CI 0.49 to 0.94). A GRADE analysis indicated that the overall certainty of the evidence for this outcome was moderate due to sparse data (See Table 11).
| Clarithromycin and antimycobacterial compared to placebo for maintenance of remission in Crohn's disease | ||||||
| Patient or population: Participants with active CD | ||||||
| Outcomes | Anticipated absolute effects* (95% CI) | Relative effect | № of participants | Quality of the evidence | Comments | |
| Risk with placebo | Risk with Clarithromycin and antimycobacterial | |||||
| Failure to enter clinical remission Follow‐up: 16 weeks | 505 per 1,000 | 343 per 1,000 | RR 0.68 | 213 | ⊕⊕⊕⊝ | Clinical remission was defined as CDAI ≤150 |
| Failure to maintain clinical remission Follow‐up: 1 year | 564 per 1,000 | 389 per 1,000 | RR 0.69 | 122 | ⊕⊕⊕⊝ | Clinical remission was defined as CDAI ≤150 |
| Failure to have clinical response | Not reported | This outcome was not reported | ||||
| Failure to maintain endoscopic remission Follow‐up: 3 years | 800 per 1,000 | 864 per 1,000 | RR 1.08 | 122 | ⊕⊕⊕⊝ | The definition of endoscopic remission was not reported |
| Adverse events | Not reported | This outcome was not reported | ||||
| Serious adverse events | Not reported | This outcome was not reported | ||||
| Withdrawal of adverse events Follow‐up: 16 weeks‐3 years | 73 per 1,000 | 75 per 1,000 | RR 1.03 | 122 | ⊕⊕⊝⊝ | Adverse events leading to withdrawal included abdominal distention, abnormal liver enzymes, vaginal candidiasis and myalgia |
| *The risk in the intervention group (and its 95% confidence interval) is based on the assumed risk in the comparison group and the relative effect of the intervention (and its 95% CI). | ||||||
| GRADE Working Group grades of evidence | ||||||
1 Downgraded one level due to sparse data (91 events)
2 Downgraded one level due to sparse data (57 events)
3 Downgraded one level due to sparse data (102 events)
4 Downgraded two levels due to very sparse data (9 events)
Failure to maintain clinical remission at 1 year
Thirty‐nine per cent (26/67) of patients taking clarithromycin (750 mg daily) failed to maintain clinical remission at one year compared to 56% (31/55) of patients receiving placebo (RR 0.69, 95% CI 0.47 to 1.01) (Selby 2007). The overall certainty of evidence for this outcome was moderate due to sparse data (SeeTable 11).
Failure to maintain endoscopic remission at 3 years
Eighty‐seven per cent (58/67) of patients who received clarithromycin (750 mg daily) failed to maintain endoscopic remission at three years compared to 80% (44/55) of patients who received placebo (RR 1.08, 95% CI 0.92 to 1.27) (Selby 2007). The overall certainty of evidence for this outcome was moderate due to sparse data (See Table 11).
Adverse events
Selby 2007 did not report on the proportion of participants who experienced at least one AE.
Serious adverse events
Selby 2007 did not report on the proportion of participants who had a SAE.
Withdrawal due to adverse events
Seven per cent (5/67) of patients who received clarithromycin withdrew from the study due to an AE, compared with 7% (4/55) of patients who received placebo (RR 1.03, 95% CI 0.29 to 3.64) (Selby 2007). AEs leading to withdrawal in the clarithromycin group included abdominal distention, abnormal liver enzymes and vaginal candidiasis. AEs leading to withdrawal in the placebo group included abdominal distention, vaginal candidiasis and myalgia. The overall certainty of evidence for this outcome was low due to very sparse data (See Table 11).
Metronidazole and cotrimoxazole versus placebo
Failure to enter clinical remission at week 6
Ambrose 1985 (N=38) evaluated a combination of metronidazole (400 mg twice daily) and cotrimoxazole (960 mg twice daily) induction therapy. The primary end point of this study was clinical remission at six weeks as defined by the authors' own scoring system. The secondary end points were AEs, SAEs or withdrawal due to AEs. Sixty‐two per cent (13/21) of patients in the antibiotic group failed to enter clinical remission at week six, compared with 59% (10/17) of patients assigned to placebo (RR 1.05, 95% CI 0.63 to 1.77). A GRADE analysis indicated that the overall certainty of the evidence for this outcome was low due to very sparse data (See Table 12).
| Metronidazole and cotrimoxazole compared to placebo for induction of remission in Crohn's disease | ||||||
| Patient or population: Participants with active CD | ||||||
| Outcomes | Anticipated absolute effects* (95% CI) | Relative effect | № of participants | Quality of the evidence | Comments | |
| Risk with placebo | Risk with Metronidazole and cotrimoxazole | |||||
| Failure to enter clinical remission Follow‐up: 6 weeks | 588 per 1,000 | 618 per 1,000 | RR 1.05 | 38 | ⊕⊕⊝⊝ | Clinical remission was based on clinical assessment and laboratory indices |
| Failure to maintain clinical remission | Not reported | This outcome was not reported | ||||
| Failure to have clinical response | Not reported | This outcome was not reported | ||||
| Failure to maintain endoscopic remission | Not reported | This outcome was not reported | ||||
| Adverse events Follow‐up: 6 weeks | 235 per 1,000 | 47 per 1,000 | RR 0.20 | 38 | ⊕⊕⊝⊝ | Adverse events included nausea, vomiting, esophagitis and erythema nodosum |
| Serious adverse events Follow‐up: 6 weeks | 59 per 1,000 | 16 per 1,000 | RR 0.27 | 38 | ⊕⊕⊝⊝ | Serious adverse events included surgery abscess, nausea, vomitting and erythema nodosum |
| Withdrawal due to adverse events Follow‐up: 6 weeks | 59 per 1,000 | 48 per 1,000 | RR 0.81 | 38 | ⊕⊕⊝⊝ | Adverse events leading to withdrawal included surgery abscess, nausea, vomiting and erythema nodosum |
| *The risk in the intervention group (and its 95% confidence interval) is based on the assumed risk in the comparison group and the relative effect of the intervention (and its 95% CI). | ||||||
| GRADE Working Group grades of evidence | ||||||
1 Downgraded two levels due to very sparse data (23 events)
2 Downgraded two levels due to very sparse data (5 events)
3 Downgraded two levels due to very sparse data (1 event)
4 Downgraded two levels due to very sparse data (2 events)
Adverse events
Five per cent (1/21) of patients who received antibiotics reported an AE compared with 24% (4/17) of patients assigned to placebo (RR 0.20, 95% CI 0.02 to 1.65) (Ambrose 1985). Common AEs in the treatment group included nausea, vomiting, esophagitis and erythema nodosum. The overall certainty of evidence for this outcome was low due to very sparse data (See Table 12).
Serious adverse events
Zero per cent (0/21) of patients receiving antibiotics reported a SAE compared with 6% (1/17) of patients in the placebo group (RR 0.27, 95% CI 0.01 to 6.30) (Ambrose 1985). The SAE in placebo group was described as a severe clinical deterioration requiring hospital admission. The overall certainty of evidence for this outcome was low due to very sparse data (See Table 12).
Withdrawal due to adverse events
Five per cent (1/21) of patients who received antibiotics withdrew from the study due to AEs, compared with 6% (1/17) of patients assigned to placebo (RR 0.81, 95% CI 0.05 to12.01) (Ambrose 1985). The specific AEs leading to withdrawal were not reported . The overall certainty of evidence for this outcome is low due to very sparse data (See Table 12).
Antibiotic versus placebo
Failure to enter clinical remission at weeks 6 to 10
Data from seven studies including 773 participants were pooled for failure to enter clinical remission at weeks 6 to 10 (Ambrose 1985; Arnold 2002; Lieper 2008; Prantera 2006; Prantera 2012; Sutherland 1991; Thia 2009). Fifty‐five per cent (289/524) of patients who received an antibiotic failed to achieve remission at weeks 6 to 10 compared with 65% (149/231) of patients assigned to placebo (RR 0.86, 95% CI 0.76 to 0.98). No heterogeneity was detected for this comparison (I² = 11%). A GRADE analysis indicated that the overall certainty of the evidence for this outcome was high (See summary of findings Table for the main comparison).
Failure to enter clinical response at weeks 10, 12 or 14
Data from five studies including 617 participants were pooled for failure to have a clinical response at weeks 10, 12 or 14 endpoint (Dewint 2014; Prantera 2006; Prantera 2012; Thia 2009; West 2004). Forty‐one per cent (174/428) of patients who received antibiotic failed to achieve a clinical response at weeks 10, 12 or 14 compared with 49% (93/189) of patients assigned to placebo (RR 0.77, 95% CI 0.64 to 0.93). No heterogeneity was detected for this comparison (I² = 0%). A GRADE analysis indicated that the overall certainty of the evidence for this outcome was moderate due to sparse data (See summary of findings Table for the main comparison).
Failure to maintain clinical remission at 52 weeks
Data from two studies including 155 participants were pooled for failure to maintain clinical remission at 52 weeks (Ambrose 1985; Selby 2007). Forty‐five per cent (37/83) of patients who received antibiotic failed to maintain clinical remission at 52 weeks compared with 57% (41/72) of patients who received placebo (RR 0.87, 95% CI 0.52 to 1.47). Moderate to high heterogeneity was detected for this comparison (I² = 63%). A GRADE analysis indicated that the overall certainty of the evidence for this outcome was moderate due to sparse data (See summary of findings Table for the main comparison).
Adverse events
AEs were reported in nine studies that included 852 participants (Ambrose 1985; Arnold 2002; Dewint 2014; Lieper 2008; Prantera 2006; Prantera 2012; Sutherland 1991; Thia 2009; West 2004). Thirty‐eight per cent (214/568) of patients on antibiotics experienced an AE compared with 45% (128/284) of patients who received placebo (RR 0.87, 95% CI 0.75 to 1.02). No heterogeneity was detected for this comparison (I² = 6%). A GRADE analysis indicated that the overall certainty of the evidence for this outcome was high (See summary of findings Table for the main comparison). Common AEs in the antibiotic group included gastrointestinal upset, upper respiratory tract infection, abscess formation and headache. Common AEs in placebo group included gastrointestinal upset, change of taste and paraesthesia.
Serious adverse events
SAEs were reported in three studies that included 520 participants (Ambrose 1985; Prantera 2006; Prantera 2012; Thia 2009). Two per cent (6/395) of patients who received antibiotic experienced a SAEs compared with 1%(2/160) of patients assigned to placebo (RR 1.12, 95% CI 0.26 to 4.76). No statistically heterogeneity was detected for this comparison (I² = 0%). GRADE analysis indicated that the overall certainty of the evidence for this outcome was low due to very sparse data (See summary of findings Table for the main comparison). Many of the SAEs were not described by the study authors. One scrotal edema was reported in the Prantera 2006 study and one death was reported in the Prantera 2012 study.
Withdrawal due to adverse events
Study withdrawal due to AEs was reported in nine studies including 858 participants (Ambrose 1985; Arnold 2002; Dewint 2014; Lieper 2008; Prantera 2006; Prantera 2012; Sutherland 1991; Thia 2009; West 2004). Nine per cent (53/569) of patients who received antibiotic withdrew due to AEs compared with 12% (36/289) of patients assigned to placebo (RR 0.86, 95% CI 0.57 to 1.29). No heterogeneity was detected for this comparison (I² = 0%). A GRADE analysis indicated that the overall certainty of the evidence for this outcome was low due to sparse data (See summary of findings Table for the main comparison). Common AEs leading to withdrawal included worsening CD, gastrointestinal symptoms, headache, abscess, rash, arthralgia, nausea, vomiting, arthropathy and infusion reaction.
Antibiotic with anti‐TNF versus placebo with anti‐TNF
Clinical response at week 12
Two studies including 100 patients were pooled to evaluate the effect of antibiotics (500 mg twice daily) on failure to achieve clinical response at week 12 in the presence of a TNF antagonist (Dewint 2014; West 2004). Twenty‐one per cent (10/48) of patients who received an antibiotic failed to achieve a clinical response at week 12 compared with 37% (19/52) of patients assigned to placebo (RR 0.57, 95% CI 0.29 to 1.10). No heterogeneity was detected for this comparison (I² = 0%). A GRADE analysis indicated that the overall certainty of the evidence for this outcome was low due to very sparse data (See summary of findings Table 2).
Adverse events
AEs were reported in two studies that included 100 participants (Dewint 2014; West 2004). Seventy‐seven per cent (37/48) of patients who received antibiotics (500 mg twice daily) experienced an AE compared with 83% (43/52) of patients assigned to placebo (RR 0.93, 95% CI 0.76 to 1.12). No heterogeneity was detected for this comparison (I² = 0%). A GRADE analysis indicated that the overall certainty of the evidence for this outcome was moderate due to sparse data (See summary of findings Table 2). AEs in the antibiotic group included nausea, vomiting and upper respiratory tract infections. AEs in the placebo group included change of taste, upper respiratory infections, fatigue and headache.
Serious adverse events
SAEs were only reported by Dewint 2014. These data are reported for the comparison Ciprofloxacin with adalimumab versus placebo with adalimumab.
Withdrawal due to adverse events
Withdrawal due to AEs was reported in two studies that included 100 participants (Dewint 2014; West 2004). Six per cent (3/48) of patients who received antibiotic withdrew due to AEs compared with 8% (4/52) of patients assigned to placebo (RR 0.82, 95% CI 0.19 to 3.45). No heterogeneity was detected for this comparison (I² = 0%). A GRADE analysis indicated that the overall certainty of the evidence for this outcome was low due to very sparse data (See summary of findings Table 2). AEs leading to withdrawal in the antibiotic group included gastrointestinal symptoms and infusion reactions. AEs leading to withdrawal in the placebo group included gastrointestinal symptoms and herpes simplex virus infection.
Discusión
Resumen de los resultados principales
Esta revisión incluye 11 ensayos aleatorios controlados con placebo (Ambrose 1985; Arnold 2002; Dewint 2014; Lieper 2008; Prantera 2006; Prantera 2012; Selby 2007; Steinhart 2002; Sutherland 1991; Thia 2009; West 2004) y dos ensayos con comparador activo (Colombel 1999; Prantera 1996), que examinaron la eficacia y la seguridad de los antibióticos para la inducción y el mantenimiento de la remisión en pacientes con EC. Dos de los ensayos controlados con placebo también incluyeron grupos con comparador activo (Ambrose 1985; Thia 2009). Los estudios incluidos compararon los antibióticos con el placebo, otros antibióticos, la metilprednisolona y la mesalamina. En dos estudios, los antibióticos también se administraron con los inhibidores del FNT alfa infliximab y adalimumab (Dewint 2014; West 2004).
Un estudio no usó una medida de resultado validada para las variables de evaluación (Ambrose 1985). Ambrose 1985 usó la salud general, el dolor abdominal, la cantidad de heces líquidas en el día anterior y las complicaciones de la enfermedad para evaluar la eficacia. Once estudios definieron la remisión clínica según una puntuación del CDAI menor que o igual a 150 (Arnold 2002; Colombel 1999; Dewint 2014; Lieper 2008; Prantera 1996; Prantera 2006; Prantera 2012; Selby 2007; Steinhart 2002; Sutherland 1991; Thia 2009). En general, la duración del tratamiento fue diferente en muchos estudios. West 2004 usó la respuesta clínica, la Peritoneal Disease Activity Score (PDAI) y la ecografía endoanal como criterios de valoración. La variedad de medidas de resultado impuso un reto para el análisis.
Dos estudios se centraron específicamente en el tratamiento con rifaximina (800 mg a 2400 mg diarios) (Prantera 2006; Prantera 2012). Estos estudios informaron sobre la proporción de pacientes que no lograron entrar en fase de remisión clínica a la semana 12 o 14. Los análisis de subgrupos basados en la dosis demostraron un beneficio para rifaximina 1600 mg una vez al día sobre el placebo (CR 0,68; IC del 95%: 0,50 a 0,93), pero no para los subgrupos de 800 mg una vez al día o 2400 mg una vez al día. Se tienen dudas en cuanto a aceptar lo anterior como un efecto del tratamiento. No hubo efectos congruentes en los grupos de dosis y ningún efecto sostenido de una dosis mayor de la medicación en comparación con una dosis menor. Parece ser moderado cualquier efecto beneficioso de la rifaximina. En general, un 48% (174/360) de los pacientes con rifaximina no lograron entrar en fase de remisión clínica a las 12 a 14 semanas en comparación con un 60% (77/129) de los pacientes con placebo (CR 0,82; IC del 95%: 0,69 a 0,98; evidencia de certeza moderada. La evidencia de certeza moderada sugiere que no hubo diferencias en los EA entre los subgrupos. Un 39% (140/360) de los pacientes del grupo de rifaximina presentaron un EA en comparación con un 47% (61/129) de los pacientes con placebo. La evidencia de certeza baja sugiere que no hubo diferencias los EA graves. Un 2% (6/360) de los pacientes con rifaximina presentaron un EAG en comparación con un 1% (1/129) de los pacientes con placebo.
Los efectos del metronidazol, la claritromicina y el cotrimoxazol sobre la EC son en su mayoría poco claros. Tres estudios (N = 149) evaluaron el metronidazol (400 mg a 500 mg dos veces al día) en los pacientes con EC activa (Ambrose 1985; Sutherland 1991; Thia 2009). A las seis a 10 semanas, un 60% (15/25) de los pacientes con metronidazol no lograron la remisión en comparación con un 68% (17/25) de los que recibieron placebo (CR 0,91; IC del 95%: 0,62 a 1,33; evidencia de certeza baja. Se encontraron resultados similares en un estudio que se evaluó la remisión a las 16 semanas (Sutherland 1991). Un estudio (N = 41) evaluó el tratamiento con claritromicina (1 g diario) en los pacientes con EC activa (Lieper 2008). La evidencia de certeza baja indica que la claritromicina no brinda ningún beneficio sobre el placebo para la inducción de la remisión o la mejoría clínica en los pacientes con EC activa. A las 12 semanas, un 84% (16/19) de los pacientes con claritromicina no lograron la remisión clínica en comparación con un 82% (18/22) de los que recibieron placebo (CR 1,03; IC del 95%: 0,78 a 1,36). Un estudio (N = 33) evaluó el cotrimoxazol (960 mg dos veces al día) en los participantes con EC activa (Ambrose 1985). La evidencia de certeza baja indica que el cotrimoxazol no implica beneficios sobre el placebo para la inducción de la remisión en la EC. A las 12 semanas, un 69% (11/16) de los pacientes con cotrimoxazol no lograron la remisión en comparación con un 59% (10/17) de los que recibieron placebo (CR 1,17; IC del 95%: 0,70 a 1,96). Ambrose 1985 (N = 38) también evaluó el tratamiento de combinación con metronidazol (400 mg dos veces al día) y cotrimoxazol (960 mg dos veces al día) en los participantes con EC activa. Es incierto el efecto del tratamiento combinado con estos dos antibióticos en la EC activa. A las seis semanas, un 62% (13/21) de los pacientes con antibióticos combinados no lograron la remisión en comparación con un 59% (10/17) de los que recibieron placebo (CR 1,05; IC del 95%: 0,63 a 1,77; evidencia de certeza baja. Selby 2007 evaluó el tratamiento combinado con claritromicina (750 mg diarios) y fármacos antimicobacterianos en los participantes con EC activa. La evidencia de calidad moderada indica que el tratamiento combinado con claritromicina y fármacos antimicobacterianos es superior al placebo para la inducción de la remisión en la EC activa. A las 16 semanas, un 34% (35/102) de los participantes con tratamiento combinado no lograron la remisión en comparación con un 50% (56/111) de los que recibieron placebo.
Prantera 1996 comparó el tratamiento combinado con ciprofloxacina (500 mg dos veces al día) y metronidazol (250 mg cuatro veces al día) con metilprednisolona (0,7 a 1 mg/kg/día) en los pacientes con EC activa. El efecto del tratamiento con ciprofloxacina y metronidazol sobre la EC activa es incierto, aunque los antibióticos no parecen implicar un beneficio sobre los corticosteroides. A las 12 semanas, un 54% (12/22) de los pacientes que recibieron tratamiento combinado con antibióticos no lograron la remisión en comparación con un 37% (7/19) de los que recibieron corticosteroides (CR 1,48; IC del 95%: 0,73 a 2,99; evidencia de certeza muy baja). Colombel 1999 comparó la ciprofloxacina (500 mg dos veces al día) con la mesalazina (2 g dos veces al día) en los pacientes con EC activa. El efecto de la ciprofloxacina sobre la EC activa es incierto. Un 44% (8/18) de los pacientes del grupo de ciprofloxacina no lograron la remisión en la semana 6 en comparación con un 45% (10/22) de los pacientes con mesalazina (CR 0,98; IC del 95%: 0,49 a 1,95; evidencia de certeza muy baja).
Aunque la evidencia que apoya los tipos individuales de antibióticos es incierta, cuando se considera a los antibióticos como una clase, la evidencia de certeza moderada a alta indica que los beneficios de los antibióticos en la EC activa son moderados y pueden no ser clínicamente significativos. Por ejemplo, en un análisis agrupado de siete estudios con 773 participantes, un 47% (253/542) de los que recibieron antibióticos lograron la remisión a las seis a diez semanas en comparación con un 36% (82/231) de los que recibieron placebo (Ambrose 1985; Arnold 2002; Lieper 2008; Prantera 2006; Prantera 2012; Sutherland 1991; Thia 2009). La certeza de la evidencia para este resultado fue alta. En un análisis agrupado de cinco estudios con 617 participantes, un 59% (254/428) de los que recibieron antibióticos mejoraron clínicamente a las 10 a 14 semanas en comparación con un 51% (96/189) de los pacientes que recibieron placebo ( Dewint 2014; Prantera 2006; Prantera 2012; Thia 2009; West 2004). La certeza de la evidencia para este resultado fue moderada. La evidencia de certeza alta sugiere que hubo una diferencia pequeña en la tasa de EA en los pacientes que recibieron antibióticos en comparación con el placebo (Ambrose 1985; Arnold 2002; Dewint 2014; Lieper 2008; Prantera 2006; Prantera 2012; Sutherland 1991; Thia 2009; West 2004). Un 38% (214/568) de los pacientes del grupo del antibiótico presentaron al menos un EA en comparación con un 45% de los pacientes con placebo.
Dos estudios (N = 155) consideraron el mantenimiento de la remisión a las 52 semanas como una variable de evaluación clínica (Ambrose 1985; Selby 2007). Los dos estudios usaron el CDAI como resultado. Es incierto el efecto de los antibióticos sobre el mantenimiento de la remisión. A las 52 semanas, un 45% (37/83) de los pacientes con antibióticos presentaron una recaída en comparación con un 57% (41/72) de los que recibieron placebo (CR 0,87; IC del 95%: 0,52 a 1,47; evidencia de certeza baja. Dos estudios analizaron los antibióticos en comparación con el placebo en presencia del tratamiento anti‐FNT tanto en los grupos de tratamiento como de placebo (Dewint 2014; West 2004). Uno de estos estudios usó el CDAI como variable de evaluación clínica (Dewint 2014). Es incierta la repercusión de los antibióticos en la mejoría clínica de los pacientes con EC que reciben tratamiento con anti‐FNT concomitante. A las 12 semanas, un 21% (10/48) de los pacientes que recibieron antibióticos no lograron una respuesta al tratamiento en comparación con un 36% (19/52) de los que recibieron placebo (CR 0,57; IC del 95%: 0,29 a 1,10; evidencia de certeza baja.
Compleción y aplicabilidad general de las pruebas
El interés principal de esta revisión era determinar si los antibióticos son efectivos en la inducción y el mantenimiento de la remisión en pacientes con EC. En relación con los datos recopilados, se hallaron pocas dificultades. Una de las dificultades principales de esta revisión fue la certeza de la evidencia hallada en la bibliografía. En muchos de los estudios, el tamaño de la muestra fue pequeño y el número de resultados evaluados, bajo. No se pudieron recopilar los datos para muchos de los resultados predefinidos. Por ejemplo, sólo un estudio tenía los resultados endoscópicos como uno de los resultados secundarios (Selby 2007). Los datos agrupados de los antibióticos usados con el anti‐FNT fueron de certeza baja. Muy pocos estudios consideraron la variable de mantenimiento de la remisión que se incluye en esta revisión. Esta variable fue utilizada en dos estudios, y los datos se agruparon (Ambrose 1985, Selby 2007) .
Otro desafío fue la amplia variedad de antibióticos y comparaciones evaluadas en los estudios incluidos. La ciprofloxacina se comparó con el placebo en dos estudios (Arnold 2002; Thia 2009). La ciprofloxacina también fue administrada con el metronidazol y en comparación con el tratamiento con metilprednisolona en un estudio (Prantera 1996). Otro estudio consideró la ciprofloxacina y el metronidazol en comparación con un placebo en los participantes que recibían tratamiento con budesonida(Steinhart 2002). La ciprofloxacina también se comparó con la mesalamina en un estudio (Colombel 1999). Dos estudios consideraron el tratamiento de ciprofloxacina en comparación con el placebo, aunque como parte del ensayo se administró la terapia biológica a ambos grupos. Dewint 2014 utilizó adalimumab, y West 2004, infliximab. La ciprofloxacina se usó con mayor frecuencia en los estudios en comparación con los otros antibióticos similares debido a la actividad contra las bacterias comunes del aparato digestivo. La rifaximina se examinó en dos estudios con varias dosis diferentes (Prantera 2006; Prantera 2012). El metronidazol se examinó en dos (Ambrose 1985; Thia 2009). La claritromicina se examinó en uno (Lieper 2008). El cotrimoxazol se examinó en uno (Ambrose 1985). Ambrose 1985 también consideró una combinación de metronidazol y cotrimoxazol en comparación con un placebo. En general, la duración del tratamiento fue variable en los estudios.
Debido al pequeño tamaño de la muestra general, se presume que este conjunto de estudios de investigación no representa de modo fidedigno a la población con EC, por lo que se necesita más investigación en esta área. Esta investigación también destaca la posibilidad de efectos adversos con la antibioticoterapia a largo plazo a pesar de la tasa baja de efectos adversos observados en los grupos de tratamiento.
Calidad de la evidencia
En esta revisión se han incluido 13 estudios con 1303 pacientes. Los estudios se calificaron como de riesgo de sesgo poco claro para varios indicadores importantes de certeza, sobre todo en cuanto a las prácticas de asignación al azar y la ocultación de la asignación de grupos. Se consideró que el riesgo de sesgo fue alto en dos estudios porque no usaron cegamiento. Cinco estudios no informaron de todos los resultados y en dos estudios estaba poco claro si hubo un sesgo de informe que afectara los resultados. El análisis según los criterios GRADE indicó que la certeza general de la evidencia para los dos análisis agrupados fue, en general, moderada para los antibióticos en comparación con el placebo para la inducción y el mantenimiento de la EC, y baja para el análisis agrupado de los antibióticos en comparación con el placebo en presencia de un anti‐FNT para la inducción y el mantenimiento de la remisión en la EC. Lo anterior se debió en gran parte a los datos escasos de estos estudios.
Sesgos potenciales en el proceso de revisión
Se realizó una revisión bibliográfica exhaustiva para asegurar que se incluyeran todos los estudios relevantes. También hubo dos autores independientes que evaluaron los estudios para su inclusión, extrajeron los datos y evaluaron el riesgo de sesgo. El tamaño de la muestra pequeño en muchos de los estudios incluidos fue la principal limitación de esta revisión. Algunos estudios fueron excluidos porque no estaban disponibles los datos sobre los resultados, y fueron infructuosos los intentos para ponerse en contacto con los investigadores para solicitarles datos. Los resultados se midieron en varios momentos diferentes, lo que dificultó las comparaciones. Finalmente, la certeza general de la evidencia en esta revisión varió de muy baja para algunos resultados a alta para otros.
Acuerdos y desacuerdos con otros estudios o revisiones
Otra revisión sistemática ha considerado el efecto de la antibioticoterapia sobre la inducción y el mantenimiento de la EC, aunque también se incluyó el tratamiento antimicobacteriano en este análisis (Khan 2011). Hay otra revisión Cochrane que evalúa el efecto del tratamiento antituberculoso sobre el mantenimiento de la remisión en pacientes con EC (Patton 2016). La base para la diferenciación entre la antibioticoterapia y el tratamiento antimicobacteriano se determinó mediante la definición de la Organización Mundial de la Salud de tratamiento antimicobacteriano.

Study flow diagram.

Risk of bias summary: review authors' judgements about each risk of bias item for each included study.
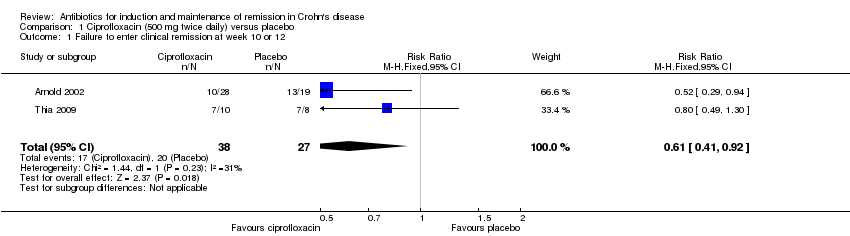
Comparison 1 Ciprofloxacin (500 mg twice daily) versus placebo, Outcome 1 Failure to enter clinical remission at week 10 or 12.

Comparison 1 Ciprofloxacin (500 mg twice daily) versus placebo, Outcome 2 Failure to maintain clinical remission at week 24.

Comparison 1 Ciprofloxacin (500 mg twice daily) versus placebo, Outcome 3 Failure to have a clinical response at week 10.

Comparison 1 Ciprofloxacin (500 mg twice daily) versus placebo, Outcome 4 Adverse events.
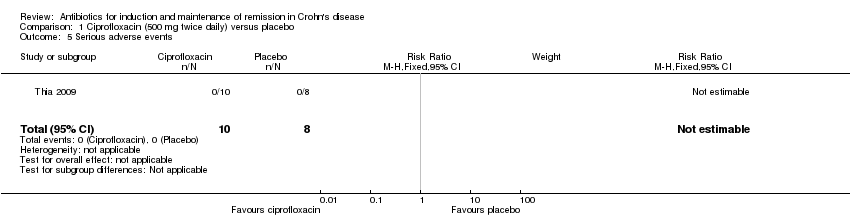
Comparison 1 Ciprofloxacin (500 mg twice daily) versus placebo, Outcome 5 Serious adverse events.

Comparison 1 Ciprofloxacin (500 mg twice daily) versus placebo, Outcome 6 Withdrawal due to adverse events.

Comparison 2 Rifaximin (800 mg to 2400 mg daily) versus placebo, Outcome 1 Failure to enter clinical remission week 12 or 14.

Comparison 2 Rifaximin (800 mg to 2400 mg daily) versus placebo, Outcome 2 Failure to have clinical response at week 12 or 14.

Comparison 2 Rifaximin (800 mg to 2400 mg daily) versus placebo, Outcome 3 Adverse events.

Comparison 2 Rifaximin (800 mg to 2400 mg daily) versus placebo, Outcome 4 Serious adverse events.

Comparison 2 Rifaximin (800 mg to 2400 mg daily) versus placebo, Outcome 5 Withdrawal due to adverse events.

Comparison 3 Metronidazole (400 mg to 500 mg twice daily) versus placebo, Outcome 1 Failure to enter clinical remission week 6 or 10.

Comparison 3 Metronidazole (400 mg to 500 mg twice daily) versus placebo, Outcome 2 Failure to enter clinical remission at week 16.

Comparison 3 Metronidazole (400 mg to 500 mg twice daily) versus placebo, Outcome 3 Failure to have clinical response at week 10.

Comparison 3 Metronidazole (400 mg to 500 mg twice daily) versus placebo, Outcome 4 Adverse events.

Comparison 3 Metronidazole (400 mg to 500 mg twice daily) versus placebo, Outcome 5 Serious adverse events.

Comparison 3 Metronidazole (400 mg to 500 mg twice daily) versus placebo, Outcome 6 Withdrawal due to adverse events.

Comparison 4 Clarithromycin (1 g/day) versus placebo, Outcome 1 Failure to enter clinical remission at 12 weeks.

Comparison 4 Clarithromycin (1 g/day) versus placebo, Outcome 2 Failure to have clinical response at 12 weeks.

Comparison 4 Clarithromycin (1 g/day) versus placebo, Outcome 3 Adverse events.

Comparison 4 Clarithromycin (1 g/day) versus placebo, Outcome 4 Withdrawal due to adverse events.

Comparison 5 Cotrimoxazole (960 mg twice daily) versus placebo, Outcome 1 Failure to enter clinical remission at week 12.

Comparison 5 Cotrimoxazole (960 mg twice daily) versus placebo, Outcome 2 Adverse events.

Comparison 5 Cotrimoxazole (960 mg twice daily) versus placebo, Outcome 3 Withdrawal due to adverse events.

Comparison 6 Ciprofloxacin (500 mg twice daily) and metronidazole (250 mg four times daily) versus methylprednisolone (0.7‐1 mg/kg daily), Outcome 1 Failure to enter clinical remission at week 12.

Comparison 6 Ciprofloxacin (500 mg twice daily) and metronidazole (250 mg four times daily) versus methylprednisolone (0.7‐1 mg/kg daily), Outcome 2 Failure to maintain clinical remission at week 52.

Comparison 6 Ciprofloxacin (500 mg twice daily) and metronidazole (250 mg four times daily) versus methylprednisolone (0.7‐1 mg/kg daily), Outcome 3 Adverse events.
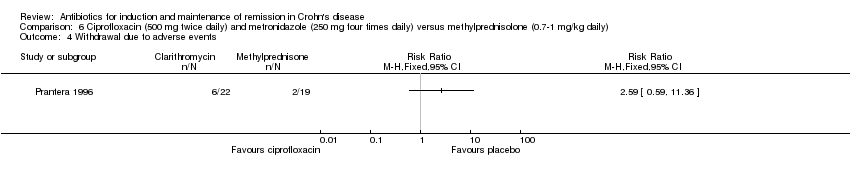
Comparison 6 Ciprofloxacin (500 mg twice daily) and metronidazole (250 mg four times daily) versus methylprednisolone (0.7‐1 mg/kg daily), Outcome 4 Withdrawal due to adverse events.

Comparison 7 Ciprofloxacin (500 mg twice daily) and metronidazole (500 mg twice daily) and budesonide (9 mg daily) versus placebo and budesonide (9 mg daily), Outcome 1 Failure to enter clinical remission at week 8.

Comparison 7 Ciprofloxacin (500 mg twice daily) and metronidazole (500 mg twice daily) and budesonide (9 mg daily) versus placebo and budesonide (9 mg daily), Outcome 2 Adverse events.

Comparison 7 Ciprofloxacin (500 mg twice daily) and metronidazole (500 mg twice daily) and budesonide (9 mg daily) versus placebo and budesonide (9 mg daily), Outcome 3 Serious adverse events.

Comparison 7 Ciprofloxacin (500 mg twice daily) and metronidazole (500 mg twice daily) and budesonide (9 mg daily) versus placebo and budesonide (9 mg daily), Outcome 4 Withdrawal due to adverse events.

Comparison 8 Ciprofloxacin (500 mg twice daily) versus mesalazine (2 g twice daily), Outcome 1 Failure to enter clinical remission at week 6.

Comparison 8 Ciprofloxacin (500 mg twice daily) versus mesalazine (2 g twice daily), Outcome 2 Adverse Events.

Comparison 8 Ciprofloxacin (500 mg twice daily) versus mesalazine (2 g twice daily), Outcome 3 Withdrawal due to adverse events.

Comparison 9 Ciprofloxacin (500 mg twice daily) with adalimumab versus placebo with adalimumab, Outcome 1 Failure to enter clinical remission at week 12.

Comparison 9 Ciprofloxacin (500 mg twice daily) with adalimumab versus placebo with adalimumab, Outcome 2 Failure to maintain clinical remission at week 24.

Comparison 9 Ciprofloxacin (500 mg twice daily) with adalimumab versus placebo with adalimumab, Outcome 3 Adverse events.

Comparison 9 Ciprofloxacin (500 mg twice daily) with adalimumab versus placebo with adalimumab, Outcome 4 Serious adverse events.

Comparison 9 Ciprofloxacin (500 mg twice daily) with adalimumab versus placebo with adalimumab, Outcome 5 Withdrawal due to adverse events.

Comparison 10 Ciprofloxacin (500 mg twice daily) with infliximab versus placebo with infliximab, Outcome 1 Failure to achieve clinical response at week 12.

Comparison 10 Ciprofloxacin (500 mg twice daily) with infliximab versus placebo with infliximab, Outcome 2 Adverse events.

Comparison 10 Ciprofloxacin (500 mg twice daily) with infliximab versus placebo with infliximab, Outcome 3 Withdrawal due to adverse events.

Comparison 11 Clarithromycin (750 mg daily) and antimycobacterial versus placebo, Outcome 1 Failure to enter clinical remission at week 16.

Comparison 11 Clarithromycin (750 mg daily) and antimycobacterial versus placebo, Outcome 2 Failure to maintain clinical remission at 1 year.

Comparison 11 Clarithromycin (750 mg daily) and antimycobacterial versus placebo, Outcome 3 Endoscopic relapse at 3 years.

Comparison 11 Clarithromycin (750 mg daily) and antimycobacterial versus placebo, Outcome 4 Withdrawal of adverse events.

Comparison 12 Metronidazole (400 mg twice daily) and cotrimoxazole (960 mg twice daily) versus placebo, Outcome 1 Failure to enter clinical remission at week 6.

Comparison 12 Metronidazole (400 mg twice daily) and cotrimoxazole (960 mg twice daily) versus placebo, Outcome 2 Adverse events.

Comparison 12 Metronidazole (400 mg twice daily) and cotrimoxazole (960 mg twice daily) versus placebo, Outcome 3 Withdrawal due to adverse events.

Comparison 13 Antibiotic versus placebo, Outcome 1 Failure to enter clinical remission at 6 to 10 weeks.

Comparison 13 Antibiotic versus placebo, Outcome 2 Failure to achieve clinical response at week 10 or 12 or 14.

Comparison 13 Antibiotic versus placebo, Outcome 3 Failure to maintain clinical remission at 52 weeks.

Comparison 13 Antibiotic versus placebo, Outcome 4 Adverse events.

Comparison 13 Antibiotic versus placebo, Outcome 5 Serious adverse events.
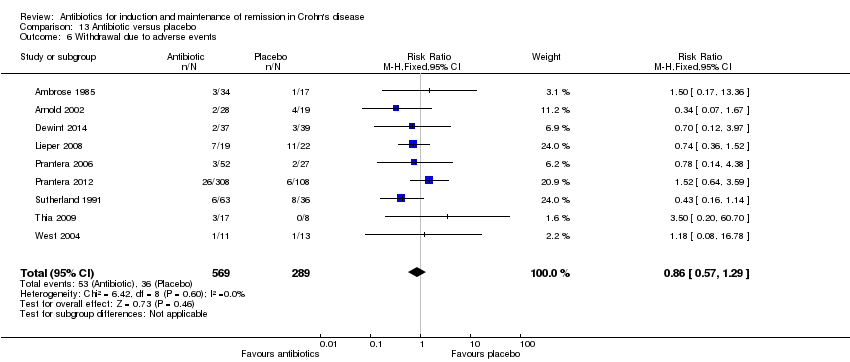
Comparison 13 Antibiotic versus placebo, Outcome 6 Withdrawal due to adverse events.

Comparison 14 Antibiotic (500 mg twice daily) with anti‐TNF versus placebo with anti‐TNF, Outcome 1 Failure to achieve clinical response at week 12.

Comparison 14 Antibiotic (500 mg twice daily) with anti‐TNF versus placebo with anti‐TNF, Outcome 2 Adverse events.

Comparison 14 Antibiotic (500 mg twice daily) with anti‐TNF versus placebo with anti‐TNF, Outcome 3 Withdrawal due to adverse events.
| Antibiotic compared to placebo for induction and maintenance of remission in Crohn's disease | ||||||
| Patient or population: Participants with active CD | ||||||
| Outcomes | Anticipated absolute effects* (95% CI) | Relative effect | № of participants | Quality of the evidence | Comments | |
| Risk with placebo | Risk with Antibiotic | |||||
| Failure to enter clinical remission Follow‐up: 6‐10 weeks | 645 per 1,000 | 555 per 1,000 | RR 0.86 | 773 | ⊕⊕⊕⊕ | Clinical remission was defined as CDAI ≤150 Antibiotics included Cotrimoxazole, Metronidazole, Ciprofloxacin, Clarithromycin, and Rifaximin |
| Failure to maintain clinical remission Follow‐up: 52 weeks | 569 per 1,000 | 495 per 1,000 | RR 0.87 | 155 | ⊕⊕⊝⊝ | Clinical remission was defined as CDAI ≤150 Antibiotics included Cotrimoxazole and Clarithromycin |
| Failure to achieve clinical response Follow‐up: 10‐14 weeks | 492 per 1,000 | 379 per 1,000 | RR 0.77 | 617 | ⊕⊕⊕⊝ | Clinical response was defined as a reduction in CDAI score of 100 points and/or a 50% or greater reduction in perianal fistulas Antibiotics included Ciprofloxacin and Rifaximin |
| Failure to maintain endoscopic remission | Not reported | This outcome was not reported | ||||
| Adverse events Follow‐up: 6‐52 weeks | 451 per 1,000 | 392 per 1,000 | RR 0.87 | 852 | ⊕⊕⊕⊕ | Adverse events included gastrointestinal upset, upper respiratory tract infection, abscess formation, headache and paraesthesia Antibiotics included Cotrimoxazole, Metronidazole, Ciprofloxacin, Clarithromycin, and Rifaximin |
| Serious adverse events Follow‐up: 6‐52 weeks | 7 per 1,000 | 12 per 1,000 | RR 1.70 | 520 | ⊕⊕⊝⊝ | Serious adverse events were not well described in the studies. Reported serious adverse events included one scrotal edema and one death Antibiotics included Rifaximin, Ciprofloxacin and Metronidazole |
| Withdrawal due to adverse events Follow‐up: 6‐52 weeks | 125 per 1,000 | 107 per 1,000 | RR 0.86 | 858 | ⊕⊕⊝⊝ | Adverse events leading to withdrawal included worsening CD, gastrointestinal symptoms,headache, abscess, rash, arthralgia, nausea, vomiting, arthropathy and infusion reaction Antibiotics included Cotrimoxazole, Metronidazole, Ciprofloxacin, Clarithromycin, and Rifaximin |
| *The risk in the intervention group (and its 95% confidence interval) is based on the assumed risk in the comparison group and the relative effect of the intervention (and its 95% CI). | ||||||
| GRADE Working Group grades of evidence | ||||||
| 1 Downgraded one level due to sparse data (78 events) 2 Downgraded one level due to heterogeneity (I2 = 63%) 3 Downgraded one level due to sparse data (267 events) 4 Downgraded two levels due to very sparse data (8 events) 5 Downgraded one level due to sparse data (89 events) | ||||||
| Antibiotic with anti‐TNF compared to placebo with anti‐TNF for induction of remission in Crohn's disease | ||||||
| Patient or population: Participants with active CD | ||||||
| Outcomes | Anticipated absolute effects* (95% CI) | Relative effect | № of participants | Quality of the evidence | Comments | |
| Risk with placebo with anti‐TNF | Risk with Antibiotic with anti‐TNF | |||||
| Failure to enter clinical remission | Not reported | This outcome was reported in one study. We decided to pool this study with the other anti‐TNF study below (failure to achieve clinical response or remission Antibiotics included Ciprofloxacin | ||||
| Failure to maintain clinical remission | Not reported | This outcome was not reported | ||||
| Failure to achieve clinical response or remission Follow‐up: 12 weeks | 365 per 1,000 | 208 per 1,000 | RR 0.57 | 100 | ⊕⊕⊝⊝ | Clinical response was defined as a 50% reduction in perianal fistulas. Remission was defined as a closure of fistulas Antibiotics included Ciprofloxacin |
| Failure to maintain endoscopic remission | Not reported | This outcome was not reported | ||||
| Adverse events Follow‐up: 12 weeks | 827 per 1,000 | 769 per 1,000 | RR 0.93 | 100 | ⊕⊕⊕⊝ | Adverse events included nausea, vomiting, upper respiratory tract infections, fatigue and headache Antibiotics included Ciprofloxacin |
| Serious adverse events | Not reported | This outcome was not reported | ||||
| Withdrawal due to adverse events Follow‐up: 12 weeks | 77 per 1,000 | 63 per 1,000 | RR 0.82 | 100 | ⊕⊕⊝⊝ | Adverse events leading to withdrawal included gastrointestinal symptoms, transfusion reaction and herpes simplex virus infection Antibiotics included Ciprofloxacin |
| *The risk in the intervention group (and its 95% confidence interval) is based on the assumed risk in the comparison group and the relative effect of the intervention (and its 95% CI). | ||||||
| GRADE Working Group grades of evidence | ||||||
| 1Downgraded one level due to sparse data (80 events) 2 Downgraded two levels due to very sparse data (29 events) 3 Downgraded two levels due to very sparse data (7 events) | ||||||
| Ciprofloxacin compared to placebo for induction of remission in Crohn's disease | ||||||
| Patient or population: Participants with active CD | ||||||
| Outcomes | Anticipated absolute effects* (95% CI) | Relative effect | № of participants | Quality of the evidence | Comments | |
| Risk with placebo | Risk with Ciprofloxacin | |||||
| Failure to enter clinical remission Follow‐up:10‐12 weeks | 741 per 1,000 | 489 per 1,000 | RR 0.66 | 65 | ⊕⊕⊝⊝ | Clinical remission was defined as CDAI ≤150 |
| Failure to maintain clinical remission Follow‐up: 24 weeks | 842 per 1,000 | 320 per 1,000 (185 to 573) | RR 0.38 (0.22 to 0.68) | 47 (1 RCT) | ⊕⊕⊝⊝ | Clinical remission was defined as CDAI ≤150 |
| Failure to have clinical response Follow‐up: 10 weeks | 875 per 1,000 | 403 per 1,000 (175 to 893) | RR 0.46 (0.20 to 1.02) | 18 (1 RCT) | ⊕⊕⊝⊝ | Clinical response was defined as at least a 50% reduction in baseline draining fistulas |
| Failure to maintain endoscopic remission | Not reported | This outcome was not reported | ||||
| Adverse events Follow‐up: 10‐24 weeks | 407 per 1,000 | 407 per 1,000 | RR 1.00 | 65 | ⊕⊕⊝⊝ | Adverse events included upper respiratory tract infection, abscess, open fistula, arthralgias and unpleasant taste/sore mouth |
| Serious adverse events | 0 per 1,000 | 0 per 1,000 (0 to 0) | not | 18 | No serious adverse events were observed | |
| Withdrawal due to adverse events Follow‐up: 10‐24 weeks | 148 per 1,000 | 50 per 1,000 | RR 0.34 | 65 | ⊕⊕⊝⊝ | Withdrawals were due to worsening Crohn's disease |
| *The risk in the intervention group (and its 95% confidence interval) is based on the assumed risk in the comparison group and the relative effect of the intervention (and its 95% CI). | ||||||
| GRADE Working Group grades of evidence | ||||||
| 1 Downgraded two levels due to very sparse data (37 events) 2 Downgraded two levels due to very sparse data (25 events) 3 Downgraded two levels due to very sparse data (11 events) 4 Downgraded two levels due to very sparse data (26 events) 5 Downgraded two levels due to very sparse data (6 events) | ||||||
| Rifaximin compared to placebo for induction of remission in Crohn's disease | ||||||
| Patient or population: Participants with active CD | ||||||
| Outcomes | Anticipated absolute effects* (95% CI) | Relative effect | № of participants | Quality of the evidence | Comments | |
| Risk with placebo | Risk with Rifaximin | |||||
| Failure to enter clinical remission Follow‐up 12‐14 weeks | 597 per 1,000 | 489 per 1,000 (412 to 585) | RR 0.82 (0.69 to 0.98) | 489 (2 RCTs) | ⊕⊕⊕⊝ | Clinical remission was defined as CDAI ≤150 |
| Failure to maintain clinical remission | Not reported | This outcome was not reported | ||||
| Failure to have clinical response Follow‐up: 12‐14 weeks | 519 per 1,000 | 426 per 1,000 | RR 0.82 | 489 | ⊕⊕⊕⊝ | Clinical response was defined as reduction of CDAI ≥ 70 points and reduction in CDAI score of 100 points |
| Failure to maintain endoscopic remission | Not reported | This outcome was not reported | ||||
| Adverse events Follow‐up: 12‐14 weeks | 473 per 1,000 | 392 per 1,000 | RR 0.83 | 489 | ⊕⊕⊕⊝ | Adverse events included gastrointestinal disorders, infections, headache and ocular disorders |
| Serious adverse events Follow‐up: 12‐14 weeks | 8 per 1,000 | 9 per 1,000 | RR 1.11 | 489 | ⊕⊕⊝⊝ | The types of serious adverse events were not described by study authors |
| Withdrawal due to adverse events Follow‐up: 12 ‐14 weeks | 62 per 1,000 | 78 per 1,000 | RR 1.25 | 489 | ⊕⊕⊝⊝ | The adverse events leading to withdrawal were not described by study authors |
| *The risk in the intervention group (and its 95% confidence interval) is based on the assumed risk in the comparison group and the relative effect of the intervention (and its 95% CI). | ||||||
| GRADE Working Group grades of evidence | ||||||
| 1 Downgraded one level due to sparse data (251 events) 2Downgraded one level due to sparse data (221 events) 3 Downgraded one level due to sparse data (201 events) 4 Downgraded two levels due to very sparse data (7 events) 5 Downgraded two levels due to very sparse data (37 events) | ||||||
| Metronidazole compared to placebo for induction of remission in Crohn's disease | ||||||
| Patient or population: Participants with active CD | ||||||
| Outcomes | Anticipated absolute effects* (95% CI) | Relative effect | № of participants | Quality of the evidence | Comments | |
| Risk with placebo | Risk with Metronidazole | |||||
| Failure to enter clinical remission Follow‐up: 6‐10 weeks | 680 per 1,000 | 619 per 1,000 | RR 0.91 | 50 | ⊕⊕⊝⊝ | Clinical remission was defined as closure of all open actively draining fistulas at baseline |
| Failure to maintain clinical remission | Not reported | This outcome was not reported | ||||
| Failure to have clinical response Follow‐up: 10 weeks | 875 per 1,000 | 604 per 1,000 (341 to 1,000) | RR 0.69 (0.39 to 1.21) | 18 (1 RCT) | ⊕⊕⊝⊝ | Clinical response was defined as at least a 50% reduction in baseline draining fistulas |
| Failure to maintain endoscopic remission | Not reported | This outcome was not reported | ||||
| Adverse events Follow‐up: 6‐10 weeks | 274 per 1,000 | 233 per 1,000 | RR 0.85 | 149 | ⊕⊝⊝⊝ | Adverse events include gastrointestinal upset, abscess formation and arthropathy.paraesthesias and sore mouth. |
| Serious adverse events | 0 per 1,000 | 0 per 1,000 | not estimable | 15 | No serious adverse events were observed | |
| Withdrawal due to adverse events Follow‐up: 6‐10 weeks | 148 per 1,000 | 114 per 1,000 | RR 0.77 | 149 | ⊕⊕⊝⊝ | Withdrawal due to adverse events was most often due to headache, gastrointestinal symptoms, abscess formation, rash and arthralgia |
| *The risk in the intervention group (and its 95% confidence interval) is based on the assumed risk in the comparison group and the relative effect of the intervention (and its 95% CI). | ||||||
| GRADE Working Group grades of evidence | ||||||
| 1 Downgraded two levels due to very sparse data (32 events) 2 Downgraded two levels due to very sparse data (13 events) 3Downgraded one level due to serious inconsistency (I2 = 71%) 4 Downgraded two levels due to very sparse data (33 events) 5 Downgraded two levels due to very sparse data (19 events) | ||||||
| Clarithromycin compared to placebo for induction of remission in Crohn's disease | ||||||
| Patient or population: Participants with active CD | ||||||
| Outcomes | Anticipated absolute effects* (95% CI) | Relative effect | № of participants | Quality of the evidence | Comments | |
| Risk with placebo | Risk with Clarithromycin | |||||
| Failure to enter clinical remission Follow‐up:12 weeks | 818 per 1,000 | 843 per 1,000 | RR 1.03 | 41 | ⊕⊕⊝⊝ | Clinical remission was defined as CDAI ≤150 |
| Failure to maintain clinical remission | Not reported | This outcome was not reported | ||||
| Failure to have clinical response Follow‐up: 12 weeks | 818 per 1,000 | 736 per 1,000 (532 to 1,000) | RR 0.90 (0.65 to 1.26) | 41 (1 RCT) | ⊕⊕⊝⊝ | Clinical response was defined by CDAI reduction by ≥ 70 from baseline |
| Failure to maintain endoscopic remission | Not reported | This outcome was not reported | ||||
| Adverse events Follow‐up: 12 weeks | 45 per 1,000 | 210 per 1,000 | RR 4.63 | 41 | ⊕⊕⊝⊝ | Adverse events included gastrointestinal symptoms |
| Serious adverse events | Not reported | This outcome was not reported | ||||
| Withdrawal due to adverse events Follow‐up: 12 weeks | 500 per 1,000 | 370 per 1,000 | RR 0.74 | 41 | ⊕⊕⊝⊝ | Withdrawal due to adverse events was most often due to gastrointestinal symptoms |
| *The risk in the intervention group (and its 95% confidence interval) is based on the assumed risk in the comparison group and the relative effect of the intervention (and its 95% CI). | ||||||
| GRADE Working Group grades of evidence | ||||||
| 1 Downgraded two levels due to very sparse data (34 events) 2 Downgraded two levels due to very sparse data (32 events) 3Downgraded two levels due to very sparse data (5 events) 4 Downgraded two levels due to very sparse data (18 events) | ||||||
| Cotrimoxazole compared to placebo for induction of remission in Crohn's disease | ||||||
| Patient or population: Participants with active CD | ||||||
| Outcomes | Anticipated absolute effects* (95% CI) | Relative effect | № of participants | Quality of the evidence | Comments | |
| Risk with placebo | Risk with Cotrimoxazole | |||||
| Failure to enter clinical remission Follow‐up: week 12 | 588 per 1,000 | 688 per 1,000 | RR 1.17 | 33 | ⊕⊕⊝⊝ | Clinical remission was defined as improvement in clinical assessment and laboratory indices |
| Failure to maintain clinical remission | Not reported | This outcome was not reported | ||||
| Failure to have a clinical response | Not reported | This outcome was not reported | ||||
| Failure to maintain endoscopic remission | Not reported | This outcome was not reported | ||||
| Adverse events Follow‐up: 12 weeks | 176 per 1,000 | 125 per 1,000 | RR 0.71 | 33 | ⊕⊕⊝⊝ | Adverse events included nausea, vomiting and arthropathy |
| Serious adverse events | Not reported | This outcome was not reported | ||||
| Withdrawal due to adverse events Follow‐up: 12 weeks | 59 per 1,000 | 125 per 1,000 | RR 2.13 | 33 | ⊕⊕⊝⊝ | Withdrawal due to adverse events was most often due to nausea, vomiting and arthropathy |
| *The risk in the intervention group (and its 95% confidence interval) is based on the assumed risk in the comparison group and the relative effect of the intervention (and its 95% CI). | ||||||
| GRADE Working Group grades of evidence | ||||||
| 1 Downgraded two levels due to very sparse data (21 events) 2 Downgraded two levels due to very sparse data (5 events) 3 Downgraded two levels due to very sparse data (3 events) | ||||||
| Ciprofloxacin and metronidazole compared to methylprednisone for induction and maintenance of remission in Crohn's disease | ||||||
| Patient or population: Participants with active CD | ||||||
| Outcomes | Anticipated absolute effects* (95% CI) | Relative effect | № of participants | Quality of the evidence | Comments | |
| Risk with methylprednisone | Risk with Ciprofloxacin and metronidazole | |||||
| Failure to enter clinical remission Follow‐up: 12 weeks | 368 per 1,000 | 545 per 1,000 | RR 1.48 | 41 | ⊕⊝⊝⊝ | Clinical remission was defined as CDAI ≤150 |
| Failure to maintain clinical remission Follow‐up: 52 weeks | 684 per 1,000 | 773 per 1,000 | RR 1.13 | 41 | ⊕⊕⊝⊝ | Clinical remission was defined as CDAI ≤150 |
| Failure to have clinical response | Not reported | This outcome was not reported | ||||
| Failure to maintain endoscopic remission | Not reported | This outcome was not reported | ||||
| Adverse events Follow‐up: 12‐52 weeks | 105 per 1,000 | 273 per 1,000 | RR 2.59 | 41 | ⊕⊕⊝⊝ | Adverse events include nausea, metallic taste, reflux symptoms, Cushingoid facies and acne |
| Serious adverse events | Not reported | This outcome was not reported | ||||
| Withdrawal due to adverse events Follow‐up: 12‐52 weeks | 105 per 1,000 | 273 per 1,000 | RR 2.59 | 41 | ⊕⊕⊝⊝ | Withdrawal due to adverse events was most often due to nausea, vomiting, reflux symptoms, hypertension, elevated amylase, acne and tremor |
| *The risk in the intervention group (and its 95% confidence interval) is based on the assumed risk in the comparison group and the relative effect of the intervention (and its 95% CI). | ||||||
| GRADE Working Group grades of evidence | ||||||
| 1 Downgraded two levels due to very sparse data (19 events) 2 Downgraded one level due to high risk bias (blinding) 3 Downgraded two levels due to very sparse data (30 events) 4 Downgraded two levels due to very sparse data (8 events) | ||||||
| Ciprofloxacin and metronidazole and budesonide compared to placebo with budesonide for induction of remission in Crohn's disease | ||||||
| Patient or population: Participants with active CD | ||||||
| Outcomes | Anticipated absolute effects* (95% CI) | Relative effect | № of participants | Quality of the evidence | Comments | |
| Risk with placebo | Risk with Ciprofloxacin and metronidazole | |||||
| Failure to enter clinical remission Follow‐up: 8 weeks | 632 per 1,000 | 683 per 1,000 | RR 1.08 | 134 | ⊕⊕⊕⊝ | Clinical remission was defined as CDAI ≤150 |
| Failure to maintain clinical remission | Not reported | This outcome was not reported | ||||
| Failure to have clinical response | Not reported | This outcome was not reported | ||||
| Failure to maintain endoscopic remission | Not reported | This outcome was not reported | ||||
| Adverse events Follow‐up: 8 weeks | 0 per 1,000 | 0 per 1,000 | RR 27.81 | 134 | ⊕⊕⊝⊝ | Adverse events included taste disturbance, dizziness, gastrointestinal upset and vaginitis |
| Serious adverse events Follow‐up: 8 weeks | 29 per 1,000 | 46 per 1,000 | RR 1.55 | 134 | ⊕⊕⊝⊝ | The types of serious adverse events were not reported |
| Withdrawal due to adverse events Follow‐up: 8 weeks | 0 per 1,000 | 0 per 1,000 | RR 27.81 | 134 | ⊕⊕⊝⊝ | Withdrawals due to adverse events were most often due to nausea, taste disturbance and rash |
| *The risk in the intervention group (and its 95% confidence interval) is based on the assumed risk in the comparison group and the relative effect of the intervention (and its 95% CI). | ||||||
| GRADE Working Group grades of evidence | ||||||
| 1 Downgraded one level due to sparse data (88 events) 2 Downgraded two levels due to very sparse data (13 events) 3 Downgraded two levels due to very serious imprecision (5 events) | ||||||
| Ciprofloxacin compared to mesalazine for induction of remission in Crohn's disease | ||||||
| Patient or population: Participants with active CD | ||||||
| Outcomes | Anticipated absolute effects* (95% CI) | Relative effect | № of participants | Quality of the evidence | Comments | |
| Risk with mesalazine | Risk with Ciprofloxacin | |||||
| Failure to enter clinical remission Follow‐up: 6 weeks | 455 per 1,000 | 445 per 1,000 | RR 0.98 | 40 | ⊕⊝⊝⊝ | Clinical remission was defined as CDAI ≤150 |
| Failure to maintain clinical remission | Not reported | This outcome was not reported | ||||
| Failure to have clinical response | Not reported | This outcome was not reported | ||||
| Failure to maintain endoscopic remission | Not reported | This outcome was not reported | ||||
| Adverse Events Follow‐up: 6 weeks | 0 per 1,000 | 0 per 1,000 | RR 3.63 | 40 | ⊕⊝⊝⊝ | Adverse events included abdominal pain |
| Serious adverse events | Not reported | This outcome was not reported | ||||
| Withdrawal due to adverse events Follow‐up: 6 weeks | 0 per 1,000 | 0 per 1,000 | RR 3.63 | 40 | ⊕⊝⊝⊝ | The withdrawal due to an adverse event was due to abdominal pain |
| *The risk in the intervention group (and its 95% confidence interval) is based on the assumed risk in the comparison group and the relative effect of the intervention (and its 95% CI). | ||||||
| GRADE Working Group grades of evidence | ||||||
| 1 Downgraded one level due to high risk of bias (no blinding) 2 Downgraded two levels due to very sparse data (18 events) 3 Downgraded two levels due to very sparse data (1 event) | ||||||
| Ciprofloxacin with adalimumab compared to placebo with adalimumab for induction and maintenance of remission in Crohn's disease | ||||||
| Patient or population: Participants with active CD | ||||||
| Outcomes | Anticipated absolute effects* (95% CI) | Relative effect | № of participants | Quality of the evidence | Comments | |
| Risk with placebo with adalimumab | Risk with Ciprofloxacin with adalimumab | |||||
| Failure to enter clinical remission Follow‐up: 12 weeks | 359 per 1,000 | 244 per 1,000 | RR 0.68 | 76 | ⊕⊕⊝⊝ | Clinical remission was defined as the closure of all fistulas All patients were treated with self‐administered adalimumab (patients were given induction dosing of 160 mg at day 0 and 80 mg at week 2, followed by maintenance of 40 mg every 4 weeks until week 24) |
| Failure to maintain clinical remission Follow‐up: 24 weeks | See comments | Although the authors reported on this outcome, we did not include it as participants only received ciprofloxacin up to week 12. All participants received maintenance adalimumab after week 12 | ||||
| Failure to have clinical response | Not reported | This outcome was not reported | ||||
| Failure to maintain endoscopic remission | Not reported | This outcome was not reported | ||||
| Adverse Events Follow‐up: 12‐24 weeks | 872 per 1,000 | 837 per 1,000 | RR 0.96 | 76 | ⊕⊕⊕⊝ | Adverse events included respiratory tract infection, fatigue and headache |
| Serious adverse events Follow‐up: 12‐24 weeks | 77 per 1,000 | 81 per 1,000 | RR 1.05 | 76 | ⊕⊕⊝⊝ | Serious adverse events included sagittal sinus thrombosis, severe disease flares, herpes simplex infection and parastomal herniation |
| Withdrawal due to adverse events Follow‐up: 12‐24 weeks | 77 per 1,000 | 54 per 1,000 | RR 0.70 | 76 | ⊕⊕⊝⊝ | Specific adverse events causing withdrawal were not reported |
| *The risk in the intervention group (and its 95% confidence interval) is based on the assumed risk in the comparison group and the relative effect of the intervention (and its 95% CI). | ||||||
| GRADE Working Group grades of evidence | ||||||
| 1 Downgraded two levels due to very sparse data (23 events) 2 Downgraded two levels due to very sparse data (29 events) 3 Downgraded one level due to sparse data (65 events) 4 Downgraded two levels due to very sparse data (6 events) 5 Downgraded two levels due to very sparse data (5 events) | ||||||
| Ciprofloxacin with infliximab compared to placebo with infliximab for induction of remission in Crohn's disease | ||||||
| Patient or population: Participants with active CD | ||||||
| Outcomes | Anticipated absolute effects* (95% CI) | Relative effect | № of participants | Quality of the evidence | Comments | |
| Risk with placebo with infliximab | Risk with Ciprofloxacin with infliximab | |||||
| Failure to enter clinical remission | Not reported | This outcome was not reported | ||||
| Failure to maintain clinical remission | Not reported | This outcome was not reported | ||||
| Failure to have clinical response Follow‐up: 12 weeks | 385 per 1,000 | 92 per 1,000 | RR 0.24 | 24 | ⊕⊕⊝⊝ | Clinical response was defined as 50% or greater reduction in draining fistulae confirmed by no drainage despite firm finger compression |
| Failure to maintain endoscopic remission | Not reported | This outcome was not reported | ||||
| Adverse events Follow‐up: 12 weeks | 692 per 1,000 | 547 per 1,000 | RR 0.79 | 24 | ⊕⊕⊝⊝ | Adverse events included nausea, rash and diarrhea and metallic taste |
| Serious adverse events | Not reported | This outcome was not reported | ||||
| Withdrawal due to adverse events Follow‐up: 12 weeks | 77 per 1,000 | 91 per 1,000 | RR 1.18 | 24 | ⊕⊕⊝⊝ | Adverse events leading to withdrawal included infusion reaction and disease exacerbation |
| *The risk in the intervention group (and its 95% confidence interval) is based on the assumed risk in the comparison group and the relative effect of the intervention (and its 95% CI). | ||||||
| GRADE Working Group grades of evidence | ||||||
| 1 Downgraded two levels due to very sparse data (6 events) 2 Downgraded two levels due to very sparse data (15 events) 3 Downgraded two levels due to very sparse data (2 events) | ||||||
| Clarithromycin and antimycobacterial compared to placebo for maintenance of remission in Crohn's disease | ||||||
| Patient or population: Participants with active CD | ||||||
| Outcomes | Anticipated absolute effects* (95% CI) | Relative effect | № of participants | Quality of the evidence | Comments | |
| Risk with placebo | Risk with Clarithromycin and antimycobacterial | |||||
| Failure to enter clinical remission Follow‐up: 16 weeks | 505 per 1,000 | 343 per 1,000 | RR 0.68 | 213 | ⊕⊕⊕⊝ | Clinical remission was defined as CDAI ≤150 |
| Failure to maintain clinical remission Follow‐up: 1 year | 564 per 1,000 | 389 per 1,000 | RR 0.69 | 122 | ⊕⊕⊕⊝ | Clinical remission was defined as CDAI ≤150 |
| Failure to have clinical response | Not reported | This outcome was not reported | ||||
| Failure to maintain endoscopic remission Follow‐up: 3 years | 800 per 1,000 | 864 per 1,000 | RR 1.08 | 122 | ⊕⊕⊕⊝ | The definition of endoscopic remission was not reported |
| Adverse events | Not reported | This outcome was not reported | ||||
| Serious adverse events | Not reported | This outcome was not reported | ||||
| Withdrawal of adverse events Follow‐up: 16 weeks‐3 years | 73 per 1,000 | 75 per 1,000 | RR 1.03 | 122 | ⊕⊕⊝⊝ | Adverse events leading to withdrawal included abdominal distention, abnormal liver enzymes, vaginal candidiasis and myalgia |
| *The risk in the intervention group (and its 95% confidence interval) is based on the assumed risk in the comparison group and the relative effect of the intervention (and its 95% CI). | ||||||
| GRADE Working Group grades of evidence | ||||||
| 1 Downgraded one level due to sparse data (91 events) 2 Downgraded one level due to sparse data (57 events) 3 Downgraded one level due to sparse data (102 events) 4 Downgraded two levels due to very sparse data (9 events) | ||||||
| Metronidazole and cotrimoxazole compared to placebo for induction of remission in Crohn's disease | ||||||
| Patient or population: Participants with active CD | ||||||
| Outcomes | Anticipated absolute effects* (95% CI) | Relative effect | № of participants | Quality of the evidence | Comments | |
| Risk with placebo | Risk with Metronidazole and cotrimoxazole | |||||
| Failure to enter clinical remission Follow‐up: 6 weeks | 588 per 1,000 | 618 per 1,000 | RR 1.05 | 38 | ⊕⊕⊝⊝ | Clinical remission was based on clinical assessment and laboratory indices |
| Failure to maintain clinical remission | Not reported | This outcome was not reported | ||||
| Failure to have clinical response | Not reported | This outcome was not reported | ||||
| Failure to maintain endoscopic remission | Not reported | This outcome was not reported | ||||
| Adverse events Follow‐up: 6 weeks | 235 per 1,000 | 47 per 1,000 | RR 0.20 | 38 | ⊕⊕⊝⊝ | Adverse events included nausea, vomiting, esophagitis and erythema nodosum |
| Serious adverse events Follow‐up: 6 weeks | 59 per 1,000 | 16 per 1,000 | RR 0.27 | 38 | ⊕⊕⊝⊝ | Serious adverse events included surgery abscess, nausea, vomitting and erythema nodosum |
| Withdrawal due to adverse events Follow‐up: 6 weeks | 59 per 1,000 | 48 per 1,000 | RR 0.81 | 38 | ⊕⊕⊝⊝ | Adverse events leading to withdrawal included surgery abscess, nausea, vomiting and erythema nodosum |
| *The risk in the intervention group (and its 95% confidence interval) is based on the assumed risk in the comparison group and the relative effect of the intervention (and its 95% CI). | ||||||
| GRADE Working Group grades of evidence | ||||||
| 1 Downgraded two levels due to very sparse data (23 events) 2 Downgraded two levels due to very sparse data (5 events) 3 Downgraded two levels due to very sparse data (1 event) 4 Downgraded two levels due to very sparse data (2 events) | ||||||
| Outcome or subgroup title | No. of studies | No. of participants | Statistical method | Effect size |
| 1 Failure to enter clinical remission at week 10 or 12 Show forest plot | 2 | 65 | Risk Ratio (M‐H, Fixed, 95% CI) | 0.61 [0.41, 0.92] |
| 2 Failure to maintain clinical remission at week 24 Show forest plot | 1 | Risk Ratio (M‐H, Fixed, 95% CI) | Totals not selected | |
| 3 Failure to have a clinical response at week 10 Show forest plot | 1 | Risk Ratio (M‐H, Fixed, 95% CI) | Totals not selected | |
| 4 Adverse events Show forest plot | 2 | 65 | Risk Ratio (M‐H, Fixed, 95% CI) | 1.00 [0.57, 1.76] |
| 5 Serious adverse events Show forest plot | 1 | 18 | Risk Ratio (M‐H, Fixed, 95% CI) | 0.0 [0.0, 0.0] |
| 6 Withdrawal due to adverse events Show forest plot | 2 | 65 | Risk Ratio (M‐H, Fixed, 95% CI) | 0.34 [0.07, 1.67] |
| Outcome or subgroup title | No. of studies | No. of participants | Statistical method | Effect size |
| 1 Failure to enter clinical remission week 12 or 14 Show forest plot | 2 | 489 | Risk Ratio (M‐H, Fixed, 95% CI) | 0.82 [0.69, 0.98] |
| 1.1 Dose 800 mg daily | 2 | 178 | Risk Ratio (M‐H, Fixed, 95% CI) | 0.85 [0.65, 1.12] |
| 1.2 Dose 1600 mg daily | 2 | 174 | Risk Ratio (M‐H, Fixed, 95% CI) | 0.68 [0.50, 0.93] |
| 1.3 Dose 2400 mg daily | 1 | 137 | Risk Ratio (M‐H, Fixed, 95% CI) | 0.97 [0.69, 1.38] |
| 2 Failure to have clinical response at week 12 or 14 Show forest plot | 2 | 489 | Risk Ratio (M‐H, Fixed, 95% CI) | 0.82 [0.67, 1.01] |
| 2.1 Dose 800 mg daily | 2 | 178 | Risk Ratio (M‐H, Fixed, 95% CI) | 0.91 [0.65, 1.28] |
| 2.2 Dose 1600 mg daily | 2 | 174 | Risk Ratio (M‐H, Fixed, 95% CI) | 0.63 [0.43, 0.91] |
| 2.3 Dose 2400 mg daily | 1 | 137 | Risk Ratio (M‐H, Fixed, 95% CI) | 0.97 [0.67, 1.40] |
| 3 Adverse events Show forest plot | 2 | 489 | Risk Ratio (M‐H, Fixed, 95% CI) | 0.83 [0.66, 1.04] |
| 3.1 Dose 800 mg daily | 2 | 178 | Risk Ratio (M‐H, Fixed, 95% CI) | 0.72 [0.49, 1.05] |
| 3.2 Dose 1600 mg daily | 2 | 174 | Risk Ratio (M‐H, Fixed, 95% CI) | 0.84 [0.58, 1.21] |
| 3.3 Dose 2400 mg daily | 1 | 137 | Risk Ratio (M‐H, Fixed, 95% CI) | 0.99 [0.64, 1.53] |
| 4 Serious adverse events Show forest plot | 2 | 489 | Risk Ratio (M‐H, Fixed, 95% CI) | 1.11 [0.27, 4.54] |
| 4.1 Dose 800 mg daily | 2 | 178 | Risk Ratio (M‐H, Fixed, 95% CI) | 1.64 [0.08, 33.26] |
| 4.2 Dose 1600 mg daily | 2 | 174 | Risk Ratio (M‐H, Fixed, 95% CI) | 1.31 [0.14, 12.08] |
| 4.3 Dose 2400 mg daily | 1 | 137 | Risk Ratio (M‐H, Fixed, 95% CI) | 0.66 [0.06, 7.05] |
| 5 Withdrawal due to adverse events Show forest plot | 2 | 489 | Risk Ratio (M‐H, Fixed, 95% CI) | 1.25 [0.59, 2.64] |
| 5.1 Dose 800 mg daily | 2 | 178 | Risk Ratio (M‐H, Fixed, 95% CI) | 0.56 [0.14, 2.16] |
| 5.2 Dose 1600 mg daily | 2 | 174 | Risk Ratio (M‐H, Fixed, 95% CI) | 1.07 [0.30, 3.83] |
| 5.3 Dose 2400 mg daily | 1 | 137 | Risk Ratio (M‐H, Fixed, 95% CI) | 2.64 [0.64, 10.90] |
| Outcome or subgroup title | No. of studies | No. of participants | Statistical method | Effect size |
| 1 Failure to enter clinical remission week 6 or 10 Show forest plot | 2 | 50 | Risk Ratio (M‐H, Fixed, 95% CI) | 0.91 [0.62, 1.33] |
| 2 Failure to enter clinical remission at week 16 Show forest plot | 1 | 99 | Risk Ratio (M‐H, Fixed, 95% CI) | 1.03 [0.77, 1.36] |
| 2.1 Dose 10 mg/kg | 1 | 51 | Risk Ratio (M‐H, Fixed, 95% CI) | 0.95 [0.63, 1.45] |
| 2.2 Dose 20 mg/kg | 1 | 48 | Risk Ratio (M‐H, Fixed, 95% CI) | 1.1 [0.74, 1.63] |
| 3 Failure to have clinical response at week 10 Show forest plot | 1 | Risk Ratio (M‐H, Fixed, 95% CI) | Totals not selected | |
| 4 Adverse events Show forest plot | 3 | 149 | Risk Ratio (M‐H, Random, 95% CI) | 0.85 [0.32, 2.31] |
| 5 Serious adverse events Show forest plot | 1 | Risk Ratio (M‐H, Fixed, 95% CI) | Totals not selected | |
| 6 Withdrawal due to adverse events Show forest plot | 3 | 149 | Risk Ratio (M‐H, Fixed, 95% CI) | 0.77 [0.36, 1.68] |
| 6.1 Dose 10 mg/kg or 20 mg/kg | 3 | 149 | Risk Ratio (M‐H, Fixed, 95% CI) | 0.77 [0.36, 1.68] |
| Outcome or subgroup title | No. of studies | No. of participants | Statistical method | Effect size |
| 1 Failure to enter clinical remission at 12 weeks Show forest plot | 1 | Risk Ratio (M‐H, Fixed, 95% CI) | Totals not selected | |
| 2 Failure to have clinical response at 12 weeks Show forest plot | 1 | Risk Ratio (M‐H, Fixed, 95% CI) | Totals not selected | |
| 3 Adverse events Show forest plot | 1 | Risk Ratio (M‐H, Fixed, 95% CI) | Totals not selected | |
| 4 Withdrawal due to adverse events Show forest plot | 1 | Risk Ratio (M‐H, Fixed, 95% CI) | Totals not selected | |
| Outcome or subgroup title | No. of studies | No. of participants | Statistical method | Effect size |
| 1 Failure to enter clinical remission at week 12 Show forest plot | 1 | Risk Ratio (M‐H, Fixed, 95% CI) | Totals not selected | |
| 2 Adverse events Show forest plot | 1 | Risk Ratio (M‐H, Fixed, 95% CI) | Totals not selected | |
| 3 Withdrawal due to adverse events Show forest plot | 1 | Risk Ratio (M‐H, Fixed, 95% CI) | Totals not selected | |
| Outcome or subgroup title | No. of studies | No. of participants | Statistical method | Effect size |
| 1 Failure to enter clinical remission at week 12 Show forest plot | 1 | Risk Ratio (M‐H, Fixed, 95% CI) | Totals not selected | |
| 2 Failure to maintain clinical remission at week 52 Show forest plot | 1 | Risk Ratio (M‐H, Fixed, 95% CI) | Totals not selected | |
| 3 Adverse events Show forest plot | 1 | Risk Ratio (M‐H, Fixed, 95% CI) | Totals not selected | |
| 4 Withdrawal due to adverse events Show forest plot | 1 | Risk Ratio (M‐H, Fixed, 95% CI) | Totals not selected | |
| Outcome or subgroup title | No. of studies | No. of participants | Statistical method | Effect size |
| 1 Failure to enter clinical remission at week 8 Show forest plot | 1 | Risk Ratio (M‐H, Fixed, 95% CI) | Totals not selected | |
| 2 Adverse events Show forest plot | 1 | Risk Ratio (M‐H, Fixed, 95% CI) | Totals not selected | |
| 3 Serious adverse events Show forest plot | 1 | Risk Ratio (M‐H, Fixed, 95% CI) | Totals not selected | |
| 4 Withdrawal due to adverse events Show forest plot | 1 | Risk Ratio (M‐H, Fixed, 95% CI) | Totals not selected | |
| Outcome or subgroup title | No. of studies | No. of participants | Statistical method | Effect size |
| 1 Failure to enter clinical remission at week 6 Show forest plot | 1 | Risk Ratio (M‐H, Fixed, 95% CI) | Totals not selected | |
| 2 Adverse Events Show forest plot | 1 | Risk Ratio (M‐H, Fixed, 95% CI) | Totals not selected | |
| 3 Withdrawal due to adverse events Show forest plot | 1 | Risk Ratio (M‐H, Fixed, 95% CI) | Totals not selected | |
| Outcome or subgroup title | No. of studies | No. of participants | Statistical method | Effect size |
| 1 Failure to enter clinical remission at week 12 Show forest plot | 1 | Risk Ratio (M‐H, Fixed, 95% CI) | Totals not selected | |
| 2 Failure to maintain clinical remission at week 24 Show forest plot | 1 | Risk Ratio (M‐H, Fixed, 95% CI) | Totals not selected | |
| 3 Adverse events Show forest plot | 1 | Risk Ratio (M‐H, Fixed, 95% CI) | Totals not selected | |
| 4 Serious adverse events Show forest plot | 1 | Risk Ratio (M‐H, Fixed, 95% CI) | Totals not selected | |
| 5 Withdrawal due to adverse events Show forest plot | 1 | Risk Ratio (M‐H, Fixed, 95% CI) | Totals not selected | |
| Outcome or subgroup title | No. of studies | No. of participants | Statistical method | Effect size |
| 1 Failure to achieve clinical response at week 12 Show forest plot | 1 | Risk Ratio (M‐H, Fixed, 95% CI) | Totals not selected | |
| 2 Adverse events Show forest plot | 1 | Risk Ratio (M‐H, Fixed, 95% CI) | Totals not selected | |
| 3 Withdrawal due to adverse events Show forest plot | 1 | Risk Ratio (M‐H, Fixed, 95% CI) | Totals not selected | |
| Outcome or subgroup title | No. of studies | No. of participants | Statistical method | Effect size |
| 1 Failure to enter clinical remission at week 16 Show forest plot | 1 | Risk Ratio (M‐H, Fixed, 95% CI) | Totals not selected | |
| 2 Failure to maintain clinical remission at 1 year Show forest plot | 1 | Risk Ratio (M‐H, Fixed, 95% CI) | Totals not selected | |
| 3 Endoscopic relapse at 3 years Show forest plot | 1 | Risk Ratio (M‐H, Fixed, 95% CI) | Totals not selected | |
| 4 Withdrawal of adverse events Show forest plot | 1 | Risk Ratio (M‐H, Fixed, 95% CI) | Totals not selected | |
| Outcome or subgroup title | No. of studies | No. of participants | Statistical method | Effect size |
| 1 Failure to enter clinical remission at week 6 Show forest plot | 1 | Risk Ratio (M‐H, Fixed, 95% CI) | Totals not selected | |
| 2 Adverse events Show forest plot | 1 | Risk Ratio (M‐H, Fixed, 95% CI) | Totals not selected | |
| 3 Withdrawal due to adverse events Show forest plot | 1 | Risk Ratio (M‐H, Fixed, 95% CI) | Totals not selected | |
| Outcome or subgroup title | No. of studies | No. of participants | Statistical method | Effect size |
| 1 Failure to enter clinical remission at 6 to 10 weeks Show forest plot | 7 | 773 | Risk Ratio (M‐H, Fixed, 95% CI) | 0.86 [0.76, 0.98] |
| 2 Failure to achieve clinical response at week 10 or 12 or 14 Show forest plot | 5 | 617 | Risk Ratio (M‐H, Fixed, 95% CI) | 0.77 [0.64, 0.93] |
| 3 Failure to maintain clinical remission at 52 weeks Show forest plot | 2 | 155 | Risk Ratio (M‐H, Random, 95% CI) | 0.87 [0.52, 1.47] |
| 4 Adverse events Show forest plot | 9 | 852 | Risk Ratio (M‐H, Fixed, 95% CI) | 0.87 [0.75, 1.02] |
| 5 Serious adverse events Show forest plot | 3 | 520 | Risk Ratio (M‐H, Fixed, 95% CI) | 1.70 [0.29, 10.01] |
| 6 Withdrawal due to adverse events Show forest plot | 9 | 858 | Risk Ratio (M‐H, Fixed, 95% CI) | 0.86 [0.57, 1.29] |
| Outcome or subgroup title | No. of studies | No. of participants | Statistical method | Effect size |
| 1 Failure to achieve clinical response at week 12 Show forest plot | 2 | 100 | Risk Ratio (M‐H, Fixed, 95% CI) | 0.57 [0.29, 1.10] |
| 2 Adverse events Show forest plot | 2 | 100 | Risk Ratio (M‐H, Fixed, 95% CI) | 0.93 [0.76, 1.12] |
| 3 Withdrawal due to adverse events Show forest plot | 2 | 100 | Risk Ratio (M‐H, Fixed, 95% CI) | 0.82 [0.19, 3.45] |