Ventilación de alta frecuencia no invasiva para neonatos con dificultad respiratoria
Resumen
Antecedentes
Hasta el 7% de los neonatos presentan dificultad respiratoria, y la asistencia respiratoria (AR) se proporciona de forma invasiva mediante un tubo endotraqueal (TE) o de forma no invasiva mediante un aparato nasal. La ventilación invasiva aumenta el riesgo de lesión pulmonar y enfermedad pulmonar crónica (EPC). El uso de estrategias no invasivas, con o sin el uso de un agente tensioactivo mínimamente invasivo, podría reducir la necesidad de ventilación mecánica y el riesgo de daño pulmonar en neonatos con dificultad respiratoria.
Objetivos
Evaluar los efectos beneficiosos y perjudiciales de la ventilación nasal de alta frecuencia (VNAF) en comparación con la ventilación invasiva a través de un TE u otros métodos de ventilación no invasiva sobre la morbilidad y la mortalidad en neonatos prematuros y a término con o en riesgo de dificultad respiratoria.
Métodos de búsqueda
En abril de 2023 se realizaron búsquedas en CENTRAL, MEDLINE, Embase, CINAHL y en tres registros de ensayos.
Criterios de selección
Ensayos controlados aleatorizados (ECA), ensayos controlados por conglomerados o ensayos controlados cuasialeatorizados de VNAF en neonatos con dificultad respiratoria en comparación con la ventilación invasiva o no invasiva.
Obtención y análisis de los datos
Dos autores seleccionaron de forma independiente los ensayos para inclusión, extrajeron los datos, evaluaron el riesgo de sesgo y realizaron la evaluación con el sistema GRADE.
Resultados principales
Se identificaron 33 estudios, la mayoría en contextos de ingresos bajos a medios, que investigaron este tratamiento en 5068 neonatos prematuros y 46 a término.
VNAF en comparación con tratamiento respiratorio invasivo para la AR inicial
No está muy claro si la VNAF reduce la mortalidad antes del alta hospitalaria (RR 0,67; IC del 95%: 0,20 a 2,18; un estudio, 80 neonatos) o la incidencia de EPC (RR 0,38; IC del 95%: 0,09 a 1,59; dos estudios, 180 lactantes), ambos desenlaces con evidencia de certeza muy baja. No se informó acerca de la intubación endotraqueal, la muerte o la EPC, la hemorragia intraventricular (Hiv) grave ni la discapacidad del neurodesarrollo (DND).
VNAF versus presión positiva continua nasal en las vías respiratorias (NCPAP) utilizada para la AR inicial
No se sabe con certeza si la VNAF reduce la mortalidad antes del alta hospitalaria (RR 1,00; IC del 95%: 0,41 a 2,41; cuatro estudios, 531 neonatos; certeza muy baja). La VNAF podría reducir la intubación endotraqueal (RR 0,52; IC del 95%: 0,33 a 0,82; cinco estudios, 571 neonatos), pero podría haber poca o ninguna diferencia en la EPC (RR 1,35; IC del 95%: 0,80 a 2,27; cuatro estudios, 481 neonatos); la muerte o la EPC (RR 2,50; IC del 95%: 0,52 a 12,01; un estudio, 68 participantes); o la Hiv grave (RR 1,17; IC del 95%: 0,36 a 3,78; cuatro estudios, 531 neonatos), todos con evidencia de certeza baja. No se informó acerca de la DND.
VNAF versus ventilación nasal con presión positiva intermitente (VNPPI) utilizada para la AR inicial
La VNAF podría dar lugar a poca o ninguna diferencia en la mortalidad antes del alta hospitalaria (RR 1,86; IC del 95%: 0,90 a 3,83; dos estudios, 84 neonatos; certeza baja). La VNAF podría tener poco o ningún efecto en la reducción de la intubación endotraqueal (RR 1,33; IC del 95%: 0,76 a 2,34; cinco estudios, 228 neonatos; certeza baja). Podría haber una reducción de la EPC (RR 0,63; IC del 95%: 0,42 a 0,95; cinco estudios, 307 neonatos; certeza baja). Un único estudio (36 neonatos) informó que no hubo ningún episodio de Hiv grave. No se informó acerca de la muerte o la EPC ni la DND.
VNAF versus cánula nasal de alto flujo (CNAF) utilizada para la AR inicial
No está muy claro si la VNAF reduce la intubación endotraqueal (RR 2,94; IC del 95%: 0,65 a 13,27; un estudio, 37 neonatos) ni si reduce la EPC (RR 1,18; IC del 95%: 0,46 a 2,98; un estudio, 37 participantes), ambos desenlaces con evidencia de certeza muy baja. No se produjeron muertes antes del alta hospitalaria ni Hiv grave. No se informó acerca de otras muertes, EPC ni DND.
VNAF versus NCPAP utilizada para la AR tras la extubación programada
La VNAF probablemente da lugar a poca o ninguna diferencia en la mortalidad antes del alta hospitalaria (RR 0,92; IC del 95%: 0,52 a 1,64; seis estudios, 1472 neonatos; certeza moderada). La VNAF podría dar lugar a una reducción de la reintubación endotraqueal (RR 0,42; IC del 95%: 0,35 a 0,51; 11 estudios, 1897 neonatos) y de la EPC (RR 0,78; IC del 95%: 0,67 a 0,91; 10 estudios, 1829 neonatos), ambos desenlaces con evidencia de certeza baja. La VNFH probablemente tiene poco o ningún efecto sobre la muerte o la EPC (RR 0,90; IC del 95%: 0,77 a 1,06; dos estudios, 966 neonatos) y la Hiv grave (RR 0,80; IC del 95%: 0,57 a 1,13; tres estudios, 1117 neonatos), ambos con evidencia de certeza moderada. No está claro que la VNAF reduzca la DND (RR 0,92; IC del 95%: 0,37 a 2,29; un estudio, 74 neonatos; certeza muy baja).
VNAF versus VNPPI utilizada para la AR tras la extubación programada
La VNAF podría tener poco o ningún efecto sobre la mortalidad antes del alta hospitalaria (RR 1,83; IC del 95%: 0,70 a 4,79; dos estudios, 984 neonatos; certeza baja). Probablemente se reduzca la reintubación endotraqueal (RR 0,69; IC del 95%: 0,54 a 0,89; seis estudios, 1364 neonatos), pero haya poco o ningún efecto sobre la EPC (RR 0,88; IC del 95%: 0,75 a 1,04; cuatro estudios, 1236 neonatos); la muerte o la EPC (RR 0,92; IC del 95%: 0,79 a 1,08; tres estudios, 1070 neonatos); o la Hiv grave (RR 0,78; IC del 95%: 0,55 a 1,10; cuatro estudios, 1162 neonatos), todos los desenlaces con evidencia de certeza moderada. Un estudio informó que podría no haber diferencias en la DND (RR 0,88; IC del 95%: 0,35 a 2,16; un estudio, 72 neonatos; certeza baja).
VNAF versus VNPPI tras el fracaso inicial de la AR no invasiva
La VNAF podría tener poco o ningún efecto sobre la mortalidad antes del alta hospitalaria (RR 1,44; IC del 95%: 0,10 a 21,33); la intubación endotraqueal (RR 1,23; IC del 95%: 0,51 a 2,98); la EPC (RR 1,01; IC del 95%: 0,70 a 1,47); o la Hiv grave (RR 0,47; IC del 95%: 0,02 a 10,87); un estudio, 39 participantes, toda la evidencia de certeza baja o muy baja. No se informó acerca de otras muertes o la EPC ni la DND.
Conclusiones de los autores
En el caso de la AR inicial, se tienen muchas dudas sobre si el uso de la VNAF en comparación con el tratamiento respiratorio invasivo afecta los desenlaces clínicos. Sin embargo, la VNAF podría reducir la intubación en comparación con la NCPAP.
En la extubación programada, la VNAF podría reducir el riesgo de reintubación en comparación con la NCPAP y la VNPPI. La VNAF podría reducir el riesgo de EPC en comparación con la NCPAP.
Tras el fracaso inicial de la asistencia respiratoria no invasiva, la VNAF comparada con la VNPPI podría dar lugar a poca o ninguna diferencia en la intubación.
Se necesitan ensayos grandes, en particular en contextos de ingresos altos, para determinar la función de la VNAF en la AR inicial y tras el fracaso de otra asistencia respiratoria no invasiva. Además, es preciso seguir investigando los contextos óptimos de la VNAF.
PICO
Resumen en términos sencillos
Ventilación de alta frecuencia (VNAF) no invasiva para recién nacidos con dificultad respiratoria
Mensajes clave
¿Qué es la dificultad respiratoria?
La dificultad respiratoria es un problema respiratorio que afecta con frecuencia a los recién nacidos. Las causas varían en función de la gestación del bebé (el tiempo que pasa en el útero antes del parto). La causa más frecuente en los bebés nacidos antes de tiempo (prematuros) es la falta del compuesto natural del pulmón (agente tensioactivo), lo que impide que los sacos de aire (alvéolos) se abran y cierren con facilidad. La causa más frecuente en los bebés nacidos después de las 37 semanas de gestación (a término) es una afección denominada taquipnea transitoria del recién nacido (o pulmones húmedos), que se produce por un retraso en la eliminación del líquido pulmonar tras el nacimiento, lo que provoca dificultad respiratoria y respiración rápida. Hay muchos otros casos de dificultad respiratoria.
¿Cómo se trata el síndrome de dificultad respiratoria?
El tratamiento habitual consiste en proporcionar asistencia respiratoria (ventilación mecánica), oxígeno y administrar un medicamento llamado agente tensioactivo directamente en el conducto respiratorio (tráquea) del recién nacido.
La asistencia respiratoria se puede proporcionar a través de un tubo denominado tubo endotraqueal introducido en la tráquea del lactante (ventilación invasiva) o a través de una mascarilla o cánula situada en la nariz (ventilación no invasiva). La ventilación invasiva se asocia con un mayor riesgo de daño pulmonar denominado enfermedad pulmonar crónica. La ventilación no invasiva, con o sin tratamiento con un agente tensioactivo, podría reducir la necesidad de ventilación mecánica y el riesgo de enfermedad pulmonar crónica en los recién nacidos con dificultad respiratoria.
¿Qué es la ventilación de alta frecuencia no invasiva?
La ventilación de alta frecuencia proporciona respiraciones muy cortas a un ritmo muy rápido (de 6 a 15 hercios, lo que equivale a 360 a 900 respiraciones por minuto). La ventilación de alta frecuencia ayuda a abrir el tejido pulmonar colapsado al proporcionar una presión positiva constante en la tráquea. La ventilación de alta frecuencia se suele administrar a través de un tubo endotraqueal. La ventilación de alta frecuencia no invasiva se administra a través de una mascarilla o una cánula situada en la nariz (gafas nasales).
¿Por qué es importante la ventilación de alta frecuencia no invasiva en los recién nacidos?
La ventilación de alta frecuencia no invasiva en recién nacidos es un método relativamente nuevo de ventilación no invasiva en comparación con otras formas de ventilación no invasiva que también utilizan gafas nasales, como la presión nasal continua en las vías respiratorias, la ventilación nasal con presión positiva intermitente o la cánula nasal de alto flujo que suministra una mezcla de aire y oxígeno humidificada y calentada. La presión positiva continua en las vías respiratorias proporciona una presión de distensión constante en las vías respiratorias del lactante. La ventilación con presión positiva intermitente proporciona respiraciones normales, normalmente a la frecuencia respiratoria normal del lactante (de 30 a 60 respiraciones por minuto). Una cánula nasal de alto flujo suministra aire u oxígeno humidificado y calentado a flujos entre tres y ocho litros por minuto.
¿Qué se quiso averiguar?
Se deseaba averiguar si la ventilación de alta frecuencia no invasiva comparada con otras formas de ventilación no invasiva a través de gafas nasales (p. ej., presión nasal continua en las vías respiratorias; ventilación nasal con presión positiva intermitente; cánula nasal de alto flujo humidificado y calentado) y la ventilación invasiva a través de un tubo endotraqueal podría mejorar la supervivencia y reducir la tasa de necesidad de un tubo endotraqueal y otros desenlaces en recién nacidos a término y prematuros con o en riesgo de síndrome de dificultad respiratoria. También se quería determinar si el uso de ventilación de alta frecuencia no invasiva tenía efectos no deseados.
¿Qué se hizo?
Se buscaron estudios que compararan la ventilación de alta frecuencia no invasiva con la presión nasal continua en las vías respiratorias, la ventilación nasal con presión positiva intermitente, la cánula nasal de alto flujo humidificado y calentado y la ventilación invasiva a través de un tubo endotraqueal en recién nacidos prematuros con o en riesgo de síndrome de dificultad respiratoria. Los resultados de los estudios incluidos se compararon y resumieron, y la confianza en la evidencia se calificó según factores como la metodología y el tamaño de los estudios.
¿Qué se encontró?
Se identificaron 33 estudios, la mayoría en contextos de ingresos bajos a medios, que investigaron este tratamiento en 5068 recién nacidos prematuros y 46 recién nacidos a término. En los recién nacidos prematuros con dificultad respiratoria, el uso inicial de ventilación de alta frecuencia no invasiva probablemente reduce el riesgo de intubación y ventilación en comparación con el uso de presión nasal continua en las vías respiratorias. En los recién nacidos prematuros con extubación planificada tras intubación y un agente tensioactivo, el uso de ventilación de alta frecuencia no invasiva probablemente reduce el riesgo de reintubación endotraqueal en comparación con la presión nasal continua en las vías respiratorias y la ventilación nasal con presión positiva intermitente. En comparación con la presión nasal continua en las vías respiratorias, el uso de la ventilación de alta frecuencia no invasiva probablemente también reduce el riesgo de enfermedad pulmonar crónica. No se encontraron diferencias en cuanto a las muertes u otros desenlaces neonatales. Los desenlaces a largo plazo no se informaron o solo se informaron en un ensayo pequeño. Se necesitan ensayos grandes para comparar la ventilación de alta frecuencia no invasiva y la ventilación nasal con presión positiva intermitente para la asistencia respiratoria inicial y la extubación planificada con el fin de determinar las estrategias óptimas de asistencia respiratoria en recién nacidos.
Dados los resultados alentadores de estos ensayos, está justificado el uso de ventilación de alta frecuencia no invasiva en recién nacidos muy prematuros con síndrome de dificultad respiratoria o en riesgo de padecerlo en situaciones clínicas seleccionadas.
¿Cuáles son las limitaciones de la evidencia?
Se necesitan ensayos grandes, en particular en contextos de ingresos altos, para determinar la función de la ventilación de alta frecuencia no invasiva en la asistencia respiratoria inicial y tras el fracaso de otros tipos de asistencia respiratoria no invasiva. Por lo tanto, se necesitan más ensayos de investigación para identificar las estrategias y los contextos óptimos de ventilación con ventilación de alta frecuencia no invasiva.
¿Cuál es el grado de actualización de esta evidencia?
La evidencia está actualizada hasta el 9 de abril de 2023.
Authors' conclusions
Summary of findings
| nHFV compared to invasive respiratory therapy for initial respiratory support | ||||||
| Patient or population: preterm infants with respiratory distress | ||||||
| Outcomes | Illustrative comparative risks* (95% CI) | Relative effect | No of participants | Certainty of the evidence | Comments | |
|---|---|---|---|---|---|---|
| Assumed risk | Corresponding risk | |||||
| Invasive respiratory therapy | nHFV | |||||
| Mortality before hospital discharge | 150 per 1000 | 101 per 1000 | RR 0.67 | 80 | ⊕⊝⊝⊝ | |
| Endotracheal intubation or reintubation To discharge | See comment | See comment | Not estimable | 0 | See comment | Not reported |
| Chronic lung disease | 67 per 1000 | 25 per 1000 | RR 0.38 | 180 | ⊕⊝⊝⊝ | |
| Death or chronic lung disease | See comment | See comment | Not estimable | 0 | See comment | Not reported |
| Intraventricular haemorrhage, Papile grade 3/4 | See comment | See comment | Not estimable | 0 | See comment | Not reported |
| Neurodevelopmental disability | See comment | See comment | Not estimable | 0 | See comment | Not reported |
| *The corresponding risk (and its 95% confidence interval) is based on the assumed risk in the comparison group and the relative effect of the intervention (and its 95% CI). | ||||||
| GRADE Working Group certainty of evidence | ||||||
| 1 Downgraded one level for high risk of bias 2 Downgraded two levels for imprecision due to a single small study and wide confidence intervals 3 Downgraded two levels for serious imprecision due to few events, and confidence intervals include appreciable benefit or harm | ||||||
| nHFV compared to nCPAP used for initial respiratory support | ||||||
| Patient or population: newborn (term* and preterm) infants with respiratory distress for initial respiratory support | ||||||
| Outcomes | Illustrative comparative risks* (95% CI) | Relative effect | No of participants | Certainty of the evidence | Comments | |
|---|---|---|---|---|---|---|
| Assumed risk | Corresponding risk | |||||
| nCPAP | nHFV | |||||
| Mortality before hospital discharge | 34 per 1000 | 34 per 1000 | RR 1.00 | 531 | ⊕⊝⊝⊝ | |
| Endotracheal intubation To discharge | 165 per 1000 | 86 per 1000 | RR 0.52 | 571 | ⊕⊕⊝⊝ | Subgroup analyses according to gestation, nHFV mean airway pressure, and nHFV frequency found no statistically significant subgroup differences. |
| Chronic lung disease | 91 per 1000 | 123 per 1000 | RR 1.35 (0.80 to 2.27) | 481 | ⊕⊕⊝⊝ | |
| Death or chronic lung disease | 59 per 1000 | 147 per 1000 | RR 2.50 | 68 | ⊕⊕⊝⊝ | |
| Intraventricular haemorrhage, Papile grade 3/4 | 19 per 1000 | 22 per 1000 | RR 1.17 | 531 | ⊕⊕⊝⊝ | |
| Neurodevelopmental disability | See comment | See comment | Not estimable | 0 | See comment | Not reported |
| *The corresponding risk (and its 95% confidence interval) is based on the assumed risk in the comparison group and the relative effect of the intervention (and its 95% CI). | ||||||
| GRADE Working Group certainty of evidence | ||||||
| 1 Downgraded one level for risk of bias 2 Downgraded two levels for serious imprecision because of wide confidence intervals and few events 3 Downgraded one level for imprecision due to confidence intervals, including appreciable benefit or harm 4 Single small study 5 Subjective outcome measure * A single study enroled 46 term infants (De La Roque 2011). | ||||||
| nHFV compared to nIPPV used for initial respiratory support | ||||||
| Patient or population: preterm infants with respiratory distress for initial respiratory support | ||||||
| Outcomes | Illustrative comparative risks* (95% CI) | Relative effect | No of participants | Certainty of the evidence | Comments | |
|---|---|---|---|---|---|---|
| Assumed risk | Corresponding risk | |||||
| NIPPV | nHFV | |||||
| Mortality before hospital discharge | 163 per 1000 | 303 per 1000 | RR 1.86 | 84 | ⊕⊕⊝⊝ | |
| Endotracheal intubation To discharge | 144 per 1000 | 192 per 1000 | RR 1.33 (0.76 to 2.34) | 228 | ⊕⊕⊝⊝ | |
| Chronic lung disease | 276 per 1000 | 174 per 1000 | RR 0.63 (0.42 to 0.95) | 307 | ⊕⊕⊝⊝ | |
| Death or chronic lung disease | See comment | See comment | Not estimable | 0 | See comment | Not reported |
| Intraventricular haemorrhage, Papile grade 3/4 | See comment | See comment | Not estimable | 36 | ⊕⊝⊝⊝ | No events |
| Neurodevelopmental disability | See comment | See comment | Not estimable | 0 | See comment | Not reported |
| *The corresponding risk (and its 95% confidence interval) is based on the assumed risk in the comparison group and the relative effect of the intervention (and its 95% CI). | ||||||
| GRADE Working Group certainty of evidence | ||||||
| 1 Downgraded one level for risk of bias 2 Downgraded one level for imprecision due to wide confidence intervals 3 Downgraded two levels for serious imprecision due to a single small study with no/few events 4 Subjective outcome measure | ||||||
| nHFV compared to HFNC for initial respiratory support | ||||||
| Patient or population: preterm infants with respiratory distress for initial respiratory support | ||||||
| Outcomes | Illustrative comparative risks* (95% CI) | Relative effect | No of participants | Certainty of the evidence | Comments | |
|---|---|---|---|---|---|---|
| Assumed risk | Corresponding risk | |||||
| HFNC | nHFV | |||||
| Mortality before hospital discharge | See comment | See comment | Not estimable | 37 | ⊕⊝⊝⊝ | No events |
| Endotracheal intubation or reintubation To discharge | 100 per 1000 | 294 per 1000 | RR 2.94 (0.65 to 13.27) | 37 | ⊕⊝⊝⊝ | |
| Chronic lung disease | 300 per 1000 | 354 per 1000 | RR 1.18 (0.46 to 2.98) | 37 | ⊕⊝⊝⊝ | |
| Death or chronic lung disease | See comment | See comment | Not estimable | 0 | See comment | Not reported |
| Intraventricular haemorrhage, Papile grade 3/4 | See comment | See comment | Not estimable | 37 | ⊕⊝⊝⊝ | No events |
| Neurodevelopmental disability | See comment | See comment | Not estimable | 0 | See comment | Not reported |
| *The corresponding risk (and its 95% confidence interval) is based on the assumed risk in the comparison group and the relative effect of the intervention (and its 95% CI). | ||||||
| GRADE Working Group certainty of evidence | ||||||
| 1 Downgraded one level for risk of bias 2 Downgraded two levels for serious imprecision due to a single small study with few/no events 3 Subjective outcome measure | ||||||
| nHFV compared to nCPAP for respiratory support following planned extubation | ||||||
| Patient or population: ventilated preterm infants with planned extubation | ||||||
| Outcomes | Illustrative comparative risks* (95% CI) | Relative effect | No of participants | Certainty of the evidence | Comments | |
|---|---|---|---|---|---|---|
| Assumed risk | Corresponding risk | |||||
| NCPAP | nHFV | |||||
| Mortality before hospital discharge | 32 per 1000 | 30 per 1000 | RR 0.92 | 1427 | ⊕⊕⊕⊝ | |
| Endotracheal reintubation To discharge | 306 per 1000 | 128 per 1000 | RR 0.42 | 1897 | ⊕⊕⊝⊝ | Subgroup analyses according to gestation, nHFV mean airway pressure, and nHFV frequency found no statistically significant subgroup differences. |
| Chronic lung disease | 284 per 1000 | 222 per 1000 | RR 0.78 | 1829 | ⊕⊕⊝⊝ | |
| Death or chronic lung disease | 394 per 1000 | 355 per 1000 | RR 0.90 | 966 | ⊕⊕⊕⊝ | |
| Intraventricular haemorrhage, Papile grade 3/4 | 116 per 1000 | 93 per 1000 | RR 0.80 | 1117 | ⊕⊕⊕⊝ | |
| Neurodevelopmental disability | 211 per 1000 | 194 per 1000 | RR 0.92 (0.37, 2.29) | 74 | ⊕⊝⊝⊝ | |
| *The corresponding risk (and its 95% confidence interval) is based on the assumed risk in the comparison group and the relative effect of the intervention (and its 95% CI). | ||||||
| GRADE Working Group certainty of evidence | ||||||
| 1 Downgraded one level for imprecision because of wide confidence intervals 2 Downgraded one level for risk of bias 3 Downgraded one level for publication bias 4 Subjective outcome measure 5 Downgraded two levels for serious imprecision due to a single study with few events, and confidence intervals included appreciable benefit or harm | ||||||
| nHFV compared to nIPPV for respiratory support following planned extubation | ||||||
| Patient or population: ventilated preterm infants with planned extubation | ||||||
| Outcomes | Illustrative comparative risks* (95% CI) | Relative effect | No of participants | Certainty of the evidence | Comments | |
|---|---|---|---|---|---|---|
| Assumed risk | Corresponding risk | |||||
| NIPPV | nHFV | |||||
| Mortality before hospital discharge | 12 per 1000 | 22 per 1000 | RR 1.83 | 984 | ⊕⊕⊝⊝ | |
| Endotracheal reintubation To discharge | 179 per 1000 | 123 per 1000 | RR 0.69 | 1364 | ⊕⊕⊕⊝ | Subgroup analyses according to gestation, nHFV mean airway pressure, and nHFV frequency found no statistically significant subgroup differences. |
| Chronic lung disease | 336 per 1000 | 296 per 1000 | RR 0.88 | 1236 | ⊕⊕⊕⊝ | |
| Death or chronic lung disease | 387 per 1000 | 356 per 1000 | RR 0.92 | 1070 | ⊕⊕⊕⊝ | |
| Intraventricular haemorrhage, Papile grade 3/4 | 115 per 1000 | 90 per 1000 | RR 0.78 | 1162 | ⊕⊕⊕⊝ | |
| Neurodevelopmental disability | 222 per 1000 | 196 per 1000 | RR 0.88 | 72 | ⊕⊕⊝⊝ | |
| *The corresponding risk (and its 95% confidence interval) is based on the assumed risk in the comparison group and the relative effect of the intervention (and its 95% CI). | ||||||
| GRADE Working Group certainty of evidence | ||||||
| 1 Downgraded one level for risk of bias 2 Downgraded one level for imprecision due to confidence intervals, including appreciable benefit or harm 3 Subjective outcome measure | ||||||
| nHFV compared to nIPPV following failure of initial non‐invasive respiratory support | ||||||
| Patient or population: ventilated preterm infants with failure of initial non‐invasive respiratory support | ||||||
| Outcomes | Illustrative comparative risks* (95% CI) | Relative effect | No of participants | Certainty of the evidence | Comments | |
|---|---|---|---|---|---|---|
| Assumed risk | Corresponding risk | |||||
| NIPPV | nHFV | |||||
| Mortality before hospital discharge | 43 per 1000 | 63 per 1000 | RR 1.44 | 39 | ⊕⊕⊝⊝ | |
| Endotracheal intubation To discharge | 304 per 1000 | 374 per 1000 | RR 1.23 | 39 | ⊕⊝⊝⊝ | |
| Chronic lung disease | 739 per 1000 | 747 per 1000 | RR 1.01 | 39 | ⊕⊕⊝⊝ | |
| Death or chronic lung disease | See comment | See comment | Not estimable | 0 | See comment | Not reported |
| Intraventricular haemorrhage, Papile grade 3/4 | 43 per 1000 | 20 per 1000 | RR 0.47 | 39 | ⊕⊕⊝⊝ | |
| Neurodevelopmental disability | See comment | See comment | Not estimable | 0 | See comment | Not reported |
| *The corresponding risk (and its 95% confidence interval) is based on the assumed risk in the comparison group and the relative effect of the intervention (and its 95% CI). | ||||||
| GRADE Working Group certainty of evidence | ||||||
| 1 Downgraded two levels for serious imprecision due to a single small study with few events, and confidence intervals included appreciable benefit or harm 2 Downgraded one level for risk of bias (unblinded study/subjective outcome measure) 3 A single event of Intraventricular haemorrhage, Papile grade 3/4, was reported amongst the nasal intermittent positive pressure ventilation (nIPPV) group. | ||||||
Background
Description of the condition
Respiratory distress
Respiratory distress occurs in 7% of newborn infants (Reuter 2014). Causes vary between preterm and term infants. Respiratory distress syndrome (RDS) and infection are responsible for around half of the cases in preterm infants, and infection, pulmonary hypoplasia, meconium aspiration syndrome (MAS), congenital heart disease, and diaphragmatic hernia contribute to half of all cases of respiratory distress in term infants (Reuter 2014). Respiratory distress syndrome is a disease that occurs predominantly in preterm infants and is associated with surfactant deficiency, dysfunction, or inactivation (Pfister 2009; Soll 2010). The term 'hyaline membrane disease' is used synonymously with 'respiratory distress syndrome' to describe respiratory distress in preterm infants (Stedman 2000). Transient tachypnoea of the newborn (TTN) is a common cause of respiratory distress in term infants, particularly after caesarean section.
Management of respiratory distress and its complications
Despite varied causes, the goals of managing respiratory distress include maintaining airway patency and providing respiratory support to deliver oxygen and remove carbon dioxide. In severe respiratory distress, mechanical ventilation often achieves these goals (Sarnaik 2011). Bronchopulmonary dysplasia (BPD) is one of the sequelae of mechanical ventilation of most significant concern. The term 'BPD' is used interchangeably with 'chronic lung disease (CLD)' (Jobe 2001). BPD is a chronic pulmonary condition caused by incomplete resolution or abnormal lung injury repair during the neonatal period. A factor that contributes to BPD is when mechanical ventilation leads to volutrauma and barotrauma, causing fluid and protein transudation in the alveoli (Jobe 2001). Insufficiently opened lung areas may be damaged by shear forces during the respiratory cycle through repetitive opening and closing of alveoli (atelectotrauma). These different traumas, in turn, stimulate the release of pro‐inflammatory cytokines and an inflammatory cascade, causing biotrauma to the lungs. In addition, high‐inspired oxygen can cause oxidative stress and inflammation (Neumann 2014). Furthermore, the endotracheal (ET) tube used in mechanical ventilation causes trauma during the introduction, leading to loss of defence mechanisms, including mucociliary clearance, and increasing the risk for bacterial colonisation and respiratory infection (Aly 2008). Prolonged use of the ET tube can lead to subglottic stenosis and oedema, resulting in subsequent failure to extubate.
Description of the intervention
Non‐invasive ventilation techniques have the potential to minimise BPD caused by invasive endotracheal ventilation and have been reported to reduce BPD in some cases (DiBlasi 2011). Several methods of non‐invasive ventilation can be used, including nasal continuous positive airway pressure (nCPAP) (Ho 2020a; Ho 2020b; Rojas‐Reyes 2012; Subramaniam 2021); nasal intermittent positive‐pressure ventilation (nIPPV) (Davis 2003; Lemyre 2023); and humidified high‐flow nasal cannula (HFNC) (Hodgson 2023).
Non‐invasive high‐frequency ventilation (nHFV) is another non‐invasive strategy that addresses some disadvantages of mechanical ventilation. Three modes of high‐frequency ventilation (HFV) are used (Allan 2010):
-
non‐invasive high‐frequency oscillatory ventilation (nHFOV);
-
non‐invasive high‐frequency percussive ventilation (nHFPV);
-
non‐invasive high‐frequency jet ventilation (nHFJV).
High‐frequency jet ventilation delivers tidal volumes of 1 to 3 mL/kg at respiratory rates between 240 and 660 breaths per minute. Exhalation during jet HFV is passive, which is similar to that of conventional mechanical ventilation. Jet HFV is a more effective means of treating pulmonary interstitial emphysema (Keszler 1991), and decreasing CLD in infants with severe respiratory distress (Keszler 1997), than rapid‐rate conventional mechanical ventilation. Oscillatory HFV differs from jet HFV in that smaller volumes are delivered at a faster respiratory rate of about 8 to 15 hertz (Hz) (Donn 2009). Percussive HFV involves small pulses of gas at ≥ 60 breaths/minute that accumulate to form a 'low‐frequency' tidal volume breath; this technique was initially used in burn units and may have an application in neonatal ventilation (Allan 2010).
It has been postulated that coupling HFV with a non‐invasive nasal delivery method may produce a synergistic effect that enhances the benefit of HFV. In a single case report, nHFV was shown to be effective in managing pulmonary emphysema in a premature infant (Al Tawil 2011). Non‐invasive delivery of HFV to newborn infants has been achieved successfully using nasal prongs (De Luca 2010), and a nasopharyngeal tube (Colaizy 2008); benefits for CO2 removal have been observed. In a newborn mannequin model, nHFV was superior to nIPPV for lung CO2 elimination. However, it is unclear how nHFV achieves more effective CO2 elimination or whether it provides adequate gas exchange in neonates (Mukerji 2013).
nHFV may be used similarly to HFV in several scenarios (Bhuta 1998; Cools 2009; Cools 2010; Rojas‐Reyes 2015). It may be used:
-
as initial respiratory support;
-
for respiratory support following extubation; or
-
following the failure of initial non‐invasive therapy.
nHFV has some potential problems. The pressure amplitude in nHFV is dampened by varying diameters of the circuit, nasopharyngeal tube, and airways; this makes it difficult to estimate the extent of the dampening variable. Resulting leakages and changes in airway patency may cause sudden undesirable changes in pressure delivery, leading to under‐ventilation or over‐ventilation (Carlo 2008).
How the intervention might work
Non‐invasive high‐frequency ventilation operates at high frequency and low tidal volumes to allow gas exchange; this distinguishes it from conventional ventilation, which relies on large changes in pressure and volume (Ghazanshahi 1986; Habre 2010). In animal models, this ventilation method has been reported to result in more uniform lung inflation, improve oxygenation, and reduce the severity of lung pathology produced by conventional ventilation (Yoder 2000). The expiration phase in jet HFV is passive; this allows jet HFV to be used with lower mean airway pressure without risk of airway collapse (Brown 2011). In contrast, the expiration phase in oscillatory HFV is active, reducing expiratory time and preventing air trapping (Wheeler 2007).
Nasal high‐frequency ventilation introduced via a less invasive interphase (e.g. nasal or nasopharyngeal tube) may achieve adequate gas exchange and may prevent intubation in newborn infants with respiratory distress or prevent extubation failure. Observational studies reported the feasibility of nHFV in preventing intubation or facilitating extubation (Cao 2020; Czernik 2012; Mukerji 2015).
Why it is important to do this review
Applying positive‐pressure ventilation for an extended duration increases the likelihood of BPD (Ramanathan 2008). Despite significant advances in neonatal intensive care, BPD remains challenging. Newborn infants surviving BPD are at increased risk of respiratory infection, asthma‐like disease, and pulmonary hypertension. They are more likely to be admitted to hospital during the first two years of life for lower respiratory tract infection (Greenough 2002), and they suffer more deficits in somatic growth and neurodevelopmental follow‐up (Reiterer 2013). Preterm infants with BPD who survive to adulthood have been shown to have general impairment and poorer respiratory health when compared with adults born at term (Gough 2012). Neurodevelopmental impairment is also strongly associated with neonatal BPD (Singer 1997; Singer 2001; Vohr 2000).
Furthermore, coupling non‐invasive modes of ventilation, such as nHFV, with non‐invasive or minimally surfactant administration methods may potentially reduce the need for intubation and endotracheal surfactant administration (Abdel‐Latif 2011a; Abdel‐Latif 2011b; Abdel‐Latif 2012; Abdel‐Latif 2021).
The use of nHFV is on the rise. A European survey of neonatal intensive care units (NICUs) (n = 172) in five European countries revealed that nHFV was used in 17% of the units, most frequently in premature infants < 1500 g with nCPAP failure (Fischer 2015).
Although the comparison between modes of ventilation delivered by non‐invasive means such as nCPAP and nIPPV following extubation in preterm infants has been the topic of various Cochrane Reviews (Davis 2003; Lemyre 2023), to date, no other systematic review has compared nHFV with other ventilation techniques.
This systematic review will gather evidence for using nHFV in newborn infants compared with other ventilation modes delivered invasively or non‐invasively. Furthermore, we will gather evidence on subgroups of gestation, mean airway pressure, frequency and interphase used to deliver nHFV, and different types of nHFV if data allow (Subgroup analysis and investigation of heterogeneity).
Objectives
To evaluate the benefits and harms of nHFV compared to invasive ventilation via an ET tube or other non‐invasive ventilation methods on morbidity and mortality in preterm and term infants with or at risk of respiratory distress.
Methods
Criteria for considering studies for this review
Types of studies
We included parallel interventional trials, randomised or quasi‐randomised, regardless of the allocation unit (individual or cluster). Cross‐over trials were not eligible for inclusion as outcomes required longitudinal follow‐up of parallel groups, and there is a likelihood of carry‐over in some outcomes as described in the Cochrane Handbook for Systematic Reviews of Interventions (Higgins 2023).
Types of participants
We included term and preterm infants with or at risk of respiratory distress during their initial hospitalisation.
Types of interventions
Intervention
Non‐invasive high‐frequency ventilation (nHFV).
We also planned to compare different types of nHFV (oscillatory, percussive, and jet) with one another.
Types of comparisons
nHFV was compared in separate comparisons to the following comparator (control) groups as below:
-
Invasive respiratory support (with or without surfactant therapy) via an ET including:
-
conventional ventilation, such as synchronised intermittent positive‐pressure ventilation (SIPPV) and synchronised intermittent mechanical ventilation (SIMV);
-
high‐frequency ventilation, such as high‐frequency oscillation ventilation (HFOV) or high‐frequency jet ventilation (HFJV);
-
neurally adjusted ventilatory assist (NAVA).
-
-
Non‐invasive respiratory support including:
-
nasal continuous positive airway pressure (nCPAP);
-
nasal intermittent positive airway pressure (nIPPV);
-
heated humidified high‐flow nasal cannula (HFNC);
-
non‐invasive neurally adjusted ventilatory assist (nNAVA).
-
For trials of nHFV versus other methods of non‐invasive respiratory support, we did not consider trials that included differential surfactant treatment regimens between groups.
nHFV or non‐invasive respiratory support could be delivered by any interface, including unilateral or bilateral nasal prongs, short or long nasal prongs, nasopharyngeal tube, face mask, and laryngeal mask airway.
We considered nasal biphasic continuous positive airway pressure (BP‐CPAP), bilevel positive airway pressure (BiPAP), and duo positive airway pressure (DuoPAP) as equivalent strategies to nIPPV.
The above comparisons were further separated according to indications for respiratory support as below:
1. nHFV for initial respiratory support
In this category, nHFV is used as an initial respiratory support after birth/after resuscitation at delivery (if needed).
2. nHFV for respiratory support following planned extubation
In this category, nHFV is used as an alternative to other non‐invasive respiratory support following extubation.
3. nHFV following the failure of initial non‐invasive therapy
In this category, nHFV is used as an alternative to ET ventilation following the failure of other forms of non‐invasive respiratory support.
Types of outcome measures
The critical outcomes that we have graded and presented in the summary of findings' tables are in bold text.
Primary outcomes
-
Mortality before hospital discharge (all causes);
-
Endotracheal intubation or reintubation during admission.
Secondary outcomes
We intended to include the following secondary outcomes.
Measures of the safety of the nHFV
-
Trauma to the nostrils and upper airway (whilst on allocated mode of support).
Measures of respiratory support
-
Failure of respiratory support or failure of extubation as defined by respiratory support failure criteria (e.g. partial pressure of carbon dioxide (PCO2) ≥ 60 mm Hg or blood pH < 7.20, or both; increased oxygen requirement; apnoea that is frequent or severe, leading to additional ventilatory support), or as defined by trial authors;
-
Duration of respiratory support (days);
-
Duration of oxygen therapy (days).
Outcomes during the first hospitalisation
-
All‐cause mortality at 28 days;
-
Chronic lung disease (CLD) is defined as the need for oxygen or respiratory support at 36 weeks' postmenstrual age (PMA)(Shennan 1988);
-
Death or CLD reported at 36 weeks' PMA;
-
Patent ductus arteriosus (PDA) (treated medically or surgically);
-
Pulmonary air leak syndromes, including pulmonary interstitial emphysema (PIE) and gross extrapulmonary air leak (such as pneumothorax);
-
Proven sepsis;
-
Necrotising enterocolitis (NEC) (any Bell stage; Bell 1978);
-
NEC (Bell stage ≥ 2; Bell 1978);
-
Spontaneous intestinal perforation;
-
Intraventricular haemorrhage (IVH) (any Papile grade; Papile 1978);
-
Severe IVH (Papile grade 3/4; Papile 1978);
-
Periventricular leukomalacia;
-
Retinopathy of prematurity (ROP) (any stage; International Committee 2005);
-
ROP (stage ≥ 3; International Committee 2005);
-
Length of hospital stay (days);
-
Discharge on home oxygen.
Postdischarge outcomes
-
All‐cause mortality to follow‐up (≥ 1 year of age);
-
Neurodevelopmental disability at least 18 months' postnatal age or later (defined as neurological abnormality including cerebral palsy on clinical examination or developmental delay more than two standard deviations (SD) below the population mean on a standardised test of development, for instance, the Denver developmental screening test); blindness (visual acuity < 6/60); or deafness (any hearing impairment requiring amplification) at any time after term corrected.
Search methods for identification of studies
Search strategies were developed by an Information Specialist (MF). We used controlled vocabulary and keywords and combined them with methodological filters to restrict retrieval to RCTs and systematic reviews. We conducted searches without language, publication year, publication type, or publication status restrictions.
Electronic searches
We searched the following databases in April 2023.
-
Cochrane Central Register of Controlled Trials (CENTRAL), via Wiley, Issue 4, 2023;
-
Ovid MEDLINE(R) All, 1946 to 8 April 2023;
-
OVID Embase 1974 to 8 April 2023;
-
CINAHL (Cumulative Index to Nursing and Allied Health Literature; 1982 to 8 April 2023;
-
Epistemonikos https://www.epistemonikos.org.
The search strategies are available: Appendix 1; Appendix 2; Appendix 3; Appendix 4; Appendix 5.
Searching other resources
We conducted additional searches of the following sources in 28 April 2023.
-
Ongoing trials at the following trial registries:
These search strategies are available in Appendix 6.
Other searches:
-
Abstracts from the following conferences:
-
Proceedings of the Pediatric Academic Societies (PAS) and European Society for Paediatric Research (ESPR) from 1990 to 2022 in the journal of Pediatric Research and via the PAS website (https://www.pas-meeting.org/past-abstracts/).
-
Proceedings of the European Academy of Paediatric Societies (EAPS), including EAPS 2020; EAPS 2021; EAPS 2022; the European Academy of Paediatrics (EAP), and the European Society of Paediatric and Neonatal Intensive Care (ESPNIC) from 2003 to 2022 from Abstracts Online.
-
Proceedings of the Perinatal Society of Australia and New Zealand (PSANZ) from 1996 to 2022 (handsearch).
-
-
Reference lists: we also screened the reference lists of relevant manuscripts after reading studies that examined the effects of nHFV on morbidity or mortality, or both, in newborn infants at risk of respiratory distress to identify other relevant studies.
-
Personal communications; we planned to contact:
-
the corresponding investigator for information if we had identified any potentially relevant unpublished trials;
-
the corresponding authors of identified RCTs for additional information about their studies when data provided in the studies were deemed insufficient;
-
study authors who published in this field to ask about possible unpublished articles;
-
medical ventilator companies that develop high‐frequency ventilators to ask about possible unpublished studies using their product.
-
Data collection and analysis
We collected information regarding the method of randomisation, blinding, intervention, stratification, and whether the trial was single or multicentre for each included study. We noted information regarding trial participants, interventions and outcomes as detailed under Data extraction and management. We analysed the clinical outcomes mentioned above in Types of outcome measures. We entered and cross‐checked data using Review Manager (RevMan 2024).
Where studies have multiple publications, we collated the reports of the same study so that each study, rather than each report, was the unit of interest for the review, and such studies have a single identifier with multiple references.
Selection of studies
We used Covidence for screening (Covidence 2023). Two review authors (MEA and DAO) independently reviewed the titles and abstracts of potentially relevant studies identified by the literature searches. Two review authors (MEA and DAO) independently reviewed full texts of the studies included based on the title abstract. At any point in the screening process, we resolved disagreements between review authors by discussion. We documented our reasons for excluding studies during the review of full texts in the Characteristics of excluded studies table. We collated multiple reports of the same study so that each study, rather than each report or reference, was the unit of interest in the review; related reports were grouped under a single study ID. We also provided any information we could obtain about ongoing studies in the Characteristics of ongoing studies table. We recorded the selection process in sufficient detail to complete a PRISMA flow diagram (Liberati 2009).
Data extraction and management
One review author (MEA) extracted and entered the data into Cochrane's statistical software for data entry (RevMan 2024). A second review author (DAO) independently checked the data. We resolved disagreements through discussion. We contacted study investigators/authors for clarification in cases requiring additional data.
We extracted the following characteristics from each included study in the Characteristics of included studies table and Table 1; Table 2; Table 3; Table 4.
| Study | Country/total participants | Eligibility criteria | Gestational age weeks/birthweight g | Intervention group | Control group | Interface (in both intervention and control groups) | |||
| Intervention group | Control group | Mode | Settings | Mode | Settings | ||||
| China 80 | RDS | 30.46 +/‐ 1.35 weeks | 30.37 +/‐ 1.31 weeks | nHFOV with surfactant | Ventilator: Stephanie, Servo‐a MAP: 10 to 12 cm H2O Frequency: 12 to 15 Hz Amplitude: 30 to 45 cm H2O | Invasive respiratory support (conventional mechanical ventilation) with surfactant | Ventilator: Maquet PIP: 15 to 25 cm H2O PEEP: PEEP 4 to 6 cm H2O Respiratory Rate: 40 to 60 bpm | Not reported | |
| China 100 | RDS | 31.05 +/‐ 1.26 (range 25 to 35) weeks | 31.02+/‐1.24 (range 28 to 35) weeks | nHFOV | Ventilator: Medin CNO, Germany MAP: 5 to 10 cm H2O Frequency: 7 to 10 Hz Amplitude: 4 to 10 cm H2O | Invasive respiratory support (conventional mechanical ventilation) | Ventilator: Drager Babylog VN500 PIP: 15 to 25 cm H2O PEEP: 4 to 8 cm H2O Respiratory rate: 30 to 40 bpm | Not reported | |
bpm: breaths per minute; hz: hertz; MAP: mean airway pressure; nHFOV: non‐invasive high‐frequency oscillatory ventilation; PEEP: positive end‐expiratory pressure; PIP: positive inspiratory pressure; RDS: respiratory distress syndrome
| Study | Country total participants | Gestation and weight eligibility criteria | Gestational age weeks/birthweight g | Intervention group | Control group | Interface (in both intervention and control groups) | |||
| Intervention group | Control group | Mode | Settings | Mode | Settings | ||||
| France 46 | ≥ 37 weeks ≥ 2000 g | 38 +/‐ 0.5 weeks 3004 +/‐ 116 g | 37 +/‐ 0.5 weeks 3375 +/‐ 160 g | nHFPV | Ventilator: Percussionaire MAP: 5 cm H2O Frequency: 5 Hz Amplitude: 2 to 35 cm H2O | nCPAP | Ventilator: Babylog 8000 PEEP: 5 cm H2O | Single heated humidified nasal probe | |
| Egypt 60 | GA between 28 + 0 and 33 + 6 weeks | Not stated | Not stated | nHFOV | Ventilator: SLE5000, UK MAP: NS Frequency: NS Amplitude: NS | nCPAP | Ventilator: Medin CNO, medin Medical Innovations GmbH, Olching, Germany) or (SLE 1000, SLE Limited, UK) PEEP: NS | nCPAP via binasal prongs nHFOV via nasopharyngeal tube | |
| Iran 68 | 30 to 36 + 6/7 weeks | 33 (IQR 30–34) weeks 1959 (613) g | 33 (IQR 31–35) weeks 2161 (764) g | nHFOV | Ventilator: Fabian MAP: 8 cmH2O Frequency: 10 to 20 Hz Amplitude: 20 cm H2O | nCPAP | Ventilator: Fabian PEEP: 6 to 7 cm H2O | Short binasal prongs | |
| Iran 124 | 28 to 34 weeks | 31.08 ± 2.9 weeks 1486 ± 470 g | 31.07 ± 2.8 weeks 1506 ± 490 g | nHFOV | Ventilator: CNO driver MAP: 8 cm H2O Frequency: 5 Hz Amplitude: 3 to 7 cm H2O | nCPAP | Ventilator: Flow‐driver (Sindi NCPAP driver) PEEP: 4 to 8 cm H2O | Short binasal prongs | |
| China 74 | RDS | NR | NR | nHFOV | Ventilator: Medin CNO MAP: 8 to 12 cm H2O Frequency: 7 to 12 Hz Amplitude: 2 to 3 times MAP with visible chest oscillation | nCPAP | PEEP: 5 to 7 cm H2O | Not reported | |
| Turkey 37 | < 32 weeks | Median 29 (range 27 to 34) weeks Median 1250 (range 800 to 2240) g | Median 28 (range 26 to 32) weeks Median 1240 (range 580 to 2010) g | nHFOV | Ventilator: Babylog 8000 MAP: 6 cm H2O Frequency: 10 Hz Amplitude: deltaP 100% | nCPAP | Ventilator: bubble CPAP system PEEP: 5 to 6 cm H2O | Short binasal prongs | |
| China 102 | 26 to 42 weeks | 26 to 42 (34.52 +/‐ 2.98) weeks | 26‐39 (34.25 +/‐ 3.14) | nHFOV | Ventilator: SLE 5000 MAP: 8 to 12 cm H20 Frequency: 7 to 12 Hz Amplitude not reported | nCPAP | Ventilator: NV8 PEEP: 5 to 7 cm H2O | Not reported | |
| China 340 | 26 to 33 + 6/7 weeks | 30.6 +/‐ 1.7 weeks 1564 +/‐ 367 g | 30.9 +/‐ 1.8 weeks 1582 +/‐ 343 g | nHFOV | Ventilator: CNO MAP: 6 [6 to 10] cm H2O Frequency: 8 [8 to 12] Hz Amplitude: level 7 (range 7 to 10) or Ventilator: SLE5000 MAP: 6 [6 to 10] cm H2O Frequency: 8 [8 to 12] Hz Amplitude: 20 [20 to 35) cm H2O | nCPAP | Ventilator: CNO or SLE5000 PEEP: 6 [6 to 8] cm H2O | Short binasal prongs | |
| China 65 | 28 to 35 weeks | 33.5 ± 1.5 weeks 1790 ± 330 g | 34.2 ± 1.6 weeks 1840 ± 420 g | nHFOV | Ventilator: SLE Baby 5000, Germany MAP: 6 to 12 cm H2O Frequency: 6 to 12 Hz Amplitude: 2 to 3 times MAP | BP‐CPAP (considered to be equivalent to nIPPV) | Ventilator: Fabian, Swiss PIP: 12 to 15 cm H2O PEEP: 5 cm H2O Rate: | Short binasal prongs | |
| China 82 | < 37 weeks | 33.2 ± 1.4 weeks 1820 ± 330 g | 33.5 ± 1.5 weeks 1840 ± 410 g | nHFOV with thin‐catheter surfactant | Ventilator: SLE5000 MAP: 8 cm H2O Frequency: 7 to 12 Hz Amplitude: 16 to 24 cm H2O | BiPAP (considered to be equivalent to nIPPV) with thin‐catheter surfactant | Ventilator: Fabian PIP: 12 to 15 cm H2O PEEP: 5 cm H2O Rate: 30 to 40 bpm | Not reported | |
| China 60 | RDS | 30.73 +/‐ 1.31 weeks | 30.46 +/‐ 1.35 weeks | nHFOV | Ventilator: Sophie MAP: 8 to 12 cm H2O Frequency: 10 to 15 Hz Amplitude: 30 to 40 cm | nIPPV | Ventilator: Sophie PIP: 15 to 25 cm H20 PEEP: 4 to 6 cm H20 | Not reported | |
| China 120 | < 31 weeks < 1500 g | 28.56 ± 1.23 weeks 1150 ± 135 g | 28.71 ± 1.18 weeks 1188 ± 142 g | nHFOV | Not reported | nIPPV | Not reported | Not reported | |
| Pakistan 48 | 27 to 34 weeks | 29.96 ± 2.38 weeks 1347 ± 458 g | 43.58 ± 61.03 weeks 1672 ± 534 g | nHFOV with surfactant administration via InSurE | Ventilator: CNO Medin MAP: 6 (range 6‐10) cm H2O Frequency: 8 (range 8‐12) Hz Amplitude: 7 (range 7‐10) cm H2O | nIPPV with surfactant administration via InSurE | Ventilator: CNO Medin PIP: 15 (range 1‐25) H2O PEEP: 6 (range 1‐8) cm H2O Rate: 40 (range 5‐60) bpm Inspiratory time (IT): 0.40 s | Nasal mask | |
| China 60 | 28 to 34 weeks | 31.38 ± 1.60 weeks 1656 ± 423 g | 31.78 ± 1.55 weeks 1572 ± 370 g | nHFOV with non‐invasive surfactant | Ventilator: Leoni Plus MAP: 6 to 12 cm H2O Frequency: 6 to 12 Hz Amplitude: 2 times MAP with visible chest oscillation | nIPPV with non‐invasive surfactant | Ventilator: Leoni Plus PIP: 15 to 25 cm H2O PEEP: 4 to 6 cm H2O Rate: 15 to 30 bpm | Not reported | |
| Turkey 37 | < 32 weeks | Median 29 (range 27 to 34) weeks Median 1250 (range 800 to 2240) g | Median 28 (26 to 32) weeks Median 1130 (range 530 to 2550) g | nHFOV | Ventilator: Babylog 8000 MAP: 6 cm H2O Frequency: 10 Hz Amplitude: deltaP 100% | nIPPV | Ventilator: Babylog 8000 PIP: 15 to 20 cm H2O PEEP: 5 to 6 cm H2O Rate: 25 to 30 bpm | Short binasal prongs | |
| China 41 | Newborns with PPHN | 35.0 +/‐ 1.8 weeks 1900 +/‐ 300 g | 34.2 +/‐ 2.0 weeks 1800 +/‐ 200 g | nHFOV | MAP: 6 to 10 cm H2O Frequency: 6 to 12 Hz Amplitude: 2 to 3 times the MAP | nIPPV | PIP: 15 to 20 cm H2O PEEP: 4 to 6 cm H2O Rate: 25 to 50 bpm | Not reported | |
| China 43 | < 36 weeks | 32.82 ± 1.87 weeks/ 2088.86 ± 583.37 g | 32.57 ± 2.69 weeks/ 2125.24 ± 781.48 g | nHFOV with non‐invasive surfactant | MAP: 6 to 12 cm H2O Frequency: 6 to 12 Hz Amplitude: 2 to 3 times the MAP | Duo positive airway pressure (DuoPAP; Bilevel positive airway pressure) with non‐invasive surfactant (considered to be equivalent to nIPPV) | PIP: 12 to 15 cm H2O PEEP: 5 cm H2O Rate: 30 to 40 bpm | Not reported | |
| Turkey 37 | < 32 weeks | Median 29 (range 27 to 34) weeks Median 1250 (range 800 to 2240) g | Median 28 (range 26 to 32) weeks Median 1190 (range 600 to 2010) g | nHFOV | Ventilator: Babylog 8000 MAP: 6 cm H2O Frequency: 10 Hz Amplitude: deltaP 100% | HFNC | Ventilator: Precision Flow, Vapotherm (5 L/min) | Short binasal prongs | |
BiPAP: bilevel positive airway pressure; BP‐CPAP: bi‐level pressure continuous positive airway pressure; bpm: beats per minute; CNO: MedicinCNO device manufacturer; DuoPAP: Duo positive airway pressure; GA: gestational age; InSurE: Intubate, Surfactant, Extubate; IQR: interquartile range; IT: Inspiratory time; MAP: mean airway pressure; MV: mechanical ventilation; HFNC: Heated humidified high‐flow nasal cannula; nCPAP: nasal continuous positive airway pressure; nHFOV: non‐invasive high‐frequency oscillatory ventilation; nHFPV: non‐invasive high‐frequency percussive ventilation; nIPPV: non‐invasive intermittent positive‐pressure ventilation; NR: not reported; NS: not stated; PEEP: positive end‐expiratory pressure; PIP: positive inspiratory pressure; PPHN: Persistent pulmonary hypertension of the newborn; RDS: respiratory distress syndrome.
*4‐arm trial (nHFOV versus NIPPV versus nCPAP versus HFNC)
| Study | Country total participants | Eligibility criteria | Gestational age weeks/birthweight g | Intervention group | Control group | Interface (in both intervention and control groups) | |||
| Intervention group | Control group | Mode | Settings | Mode | Settings | ||||
| China 65 | Ventilated infants with respiratory distress | 32.5 ± 1.3 weeks 1790 ± 350 g | 32.4 ± 1.4 weeks 1850 ± 410 g | nHFOV | Ventilator: SLE baby 5000, Germany MAP: 5 to 7 cm H2O Frequency: 6 to 12 Hz Amplitude: 2 to 3 times MAP | nCPAP | Ventilator: Stephan, Germany PEEP: 4 to 6 cm H2O | Short binasal prongs | |
| China 81 | Ventilated infants 28 to 34 weeks | 31.7 ± 1.7 weeks 1670 ± 353 g | 32.0 ± 1.9 weeks 1735 ± 327 g | nHFOV | Ventilator: CNO driver MAP: 6 cm H2O Frequency: 10 Hz Amplitude: visible chest oscillation | nCPAP | Ventilator: Bubble CPAP system PEEP: 6 cm H2O | Short binasal prongs | |
| China 206 | Ventilated infants < 37 weeks | 32.4 +/‐ 2.4 weeks 1859 +/‐ 569 g | 32.8 +/‐ 2.4 weeks 1917 +/‐ 478 g | nHFOV | Ventilator: SLE5000 MAP: 10 cm H2O Frequency: 10 Hz Amplitude: 35 cm H2O | nCPAP | Ventilator: Bubble CPAP system PEEP: 6 to 8 cm H2O | Short binasal prongs | |
| Germany 6 | Ventilated infants < 32 weeks < 1500 g | 25 (range 23 + 4/7 to 26 + 3/7) weeks 503 (420 to 568) g | 24 (range 23 + 6/7 to 24 + 6/7) weeks 668 (550 to 786) g | nHFOV | Ventilator: SLE5000 MAP: 8 cm H2O Frequency: 9 to 10 Hz Amplitude: 20 to 30 cm H2O | nCPAP | Ventilator: SLE 5000 PEEP: 8 cm H2O | Short binasal prongs | |
| China 114 | Ventilated infants 26 to 31 + 6/7 weeks < 1500 g | 30.6 +/‐ 1.3 weeks 1257 +/‐ 340 g | 30.8 +/‐ 1.4 weeks 1282 +/‐ 354 g | nHFOV | Ventilator: SLE5000 MAP: 8 to 14 cm H2O Frequency: 8 to 12 Hz Amplitude: 20 to 35 cm H2O | nCPAP | PEEP: 6 to 8 cm H2O | Binasal prongs | |
| China 80 | Ventilated infants with RDS | 3330 ± 240 g (range 2500 to 4200) g | 3410 ± 180 g (range 2600 to 4600) g | nHFOV | MAP: 2 to 4 cm H2O higher than MAP prior to extubation Frequency: 6 to 12 Hz Amplitude: 2.5 to 3 times the value for MAP | nCPAP | PEEP: 4 to 6 cm H2O | Not reported | |
| China 98 | Ventilated infants 25 to 33 + 6/7 weeks < 1500 g | 29.0 +/‐ 1.9 weeks 1118 +/‐ 202 g | 29.0 +/‐ 1.7 weeks 1132 +/‐ 203 g | nHFOV | Ventilator: Fabian HFO MAP: 10 cm H2O Frequency: 10 [6 to 12] Hz Amplitude: 25 [25 to 50] cm H2O | nCPAP | Ventilator: Fabian PEEP: 5 [3 to 8] cm H2O | Short binasal prongs | |
| China 68 | Ventilated preterm infants | 28.42 +/‐ 1.15 weeks | 28.36 +/‐ 1.24 weeks | nHFOV | MAP: Range 8 to 14 cm H2O Frequency: 8 to 12 Hz Amplitude: 20 to 35 cm H2O | nCPAP | PEEP: 6 to 8 cm H2O | Not reported | |
| China 240 | Ventilated infants < 37 weeks | 31.02 ± 1.88 weeks 1440 ± 300 g | 30.31 ± 1.58 weeks 1390 ± 320 g | nHFOV | Ventilator: Löwenstein Leoni plus MAP: 8 [6 to 12] cm H2O Frequency: 6 to 12 Hz Amplitude: 2 to 3 times MAP with visible chest oscillation | nCPAP | Ventilator: F.STEPHAN PEEP: 4 to 6 cm H2O | Not reported | |
| China 70 | Ventilated infants 32 to 36 weeks | 33.8 +/‐ 0.8 weeks 1985 +/‐ 246 g | 33.6 +/‐ 1.1 weeks 1878 +/‐ 325 g | nHFOV | Ventilator: SLE5000 MAP: range 8 to 14 cm H2O Frequency: 8 to 12 Hz Amplitude: 20 to 35 cm H2O | nCPAP | Ventilator: NV8 PEEP: 3 to 8 cm H2O | Not reported | |
| China 998 | Ventilated infants 25 to 32 + 6/7 weeks | 29.4 +/‐ 1.8 weeks 1334 +/‐ 366 g | 29.5 +/‐ 1.7 weeks 1341 +/‐ 318 g | nHFOV | Ventilator: Piston/membrane oscillator MAP: 5 to 16 cm H2O Frequency: 8 to 10 Hz Amplitude: titrated to PaCO2 | nCPAP | Ventilator: PEEP: 5 to 8 cm H2O | Short binasal prongs | |
| Ukraine 24 | Ventilated infants ≤ 32 weeks ≤ 1500 g | 27.75 +/‐ 2.41 weeks 918 +/‐ 227 g | 27.66 +/‐ 1.66 weeks 1034 +/‐ 177 g | nHFOV | Ventilator: CNO driver MAP: 6 to 8 cm H2O Frequency: 10 Hz Amplitude: visible chest oscillation | nIPPV | Ventilator: Servo‐I PIP: 6 to 12 cm H2O PEEP: 4 to 8 cm H2O Rate: 15 to 25 bpm | Long or short binasal prongs or mask | |
| China 42 | Ventilated infants with RDS | 30.86 +/‐ 3.01 weeks | 31.02 +/‐ 3.23 weeks | nHFOV | MAP: < 14 cm H2O Amplitude: Amplitude set at visible oscillation noted at neck and chest area | nIPPV | PIP: 15 to 20 cm H2O PEEP: 4 to 6 cm H20 Rate: 40 bpm | Not reported | |
| China 98 | Ventilated infants 25 to 33 + 6/7 weeks < 1500 g | 29.0 +/‐ 1.9 weeks 1118 +/‐ 202 g | 28.9 +/‐ 2.0 weeks 1088 +/‐ 154 g | nHFOV | Ventilator: Fabian HFO MAP: 10 cm H2O Frequency: 10 [6 to 12] Hz Amplitude: 25 [25 to 50] cm H2O | nIPPV | Ventilator: Comen NV8 PIP: 15 [15 to 25] cm H2O PEEP: 4 [4 to 8] cm H2O Rate: 30 [15 to 40] bpm | Short binasal prongs | |
| India 42 | Ventilated infants 26 to 36 + 6/7 weeks | Median 32 (IQR 28 to 35) weeks Median 1500 (1120 to 2140) g | Median 31 (IQR 29 to 35) weeks Median 1495 (980 to 2214) g | nHFOV | Ventilator: SLE6000 MAP: 8 to 10 cm H2O Frequency: 10 to 12 Hz Amplitude: 25 to 35 cm H2O with visible chest oscillation | nIPPV | Ventilator: Dragger Babylog 8000 PIP: 2 cm H2O above pre‐extubation PIP PEEP: 4 to 6 cm H2O Rate: 40 to 50 bpm | Short binasal prongs or masks | |
| China 240 | Ventilated infants < 37 weeks | 31.02 ± 1.88 weeks 1440 ± 300 g | 30.82 ± 1.60 weeks 1430 ± 330 g | nHFOV | Ventilator: Löwenstein Leoni plus MAP: 8 [6 to 12] cm H2O Frequency: 6 to 12 Hz Amplitude: 2 to 3 times MAP with visible chest oscillation | nIPPV | nIPPV Ventilator: COMEN NV8 PIP: 10 cm H2O PEEP: 5 to 6 cm H2O Rate: 25 to 30 bpm | Not reported | |
| China 992 | Ventilated infants 25 to 32 + 6/7 weeks | nHFOV | Ventilator: Piston/membrane oscillator MAP: 5 to 16 cm H2O Frequency: 8 to 10 Hz Amplitude: titrated to PaCO2 | nIPPV | nIPPV Ventilator: any neonatal ventilator PIP: 10 to 25 cm H2O PEEP: 5 to 8 cm H2O Rate: 30 to 40 bpm | Short binasal prongs | |||
CNO: MedicinCNO device manufacturer; IQR: interquartile range; MAP: mean airway pressure; MV: mechanical ventilation; nCPAP: nasal continuous positive airway pressure; nHFOV: non‐invasive high‐frequency oscillatory ventilation; nIPPV: non‐invasive intermittent positive‐pressure ventilation; NR: not reported; PaCO2: arterial partial pressure of carbon dioxide; PEEP: positive end‐expiratory pressure; PIP: positive inspiratory pressure; RDS: respiratory distress syndrome
*3‐arm trials (nHFOV versus NIPPV versus nCPAP)
| Study | Country total participants | Eligibility criteria | Gestational age weeks/birthweight g | Intervention group | Control group | Interface (in both intervention and control groups) | |||
| Intervention group | Control group | Mode | Settings | Mode | Settings | ||||
| Canada 26 | Birthweight < 1250 g Current weight < 2000 g Failed nCPAP | 26.1 +/‐ 1.3 weeks gestation Birthweight 832 +/‐ 150 g PMA 28.6 +/‐ 1.5 weeks | 26.5 +/‐ 1.6 weeks gestation Birthweight 878 +/‐ 198 g PMA 29.0 +/‐ 2.3 weeks | nHFOV | Ventilator: Drager VN500, Lubeck, Germany MAP: 8 to 10 cm H2O Frequency: 5 to 14 Hz Amplitude: visible chest oscillation | BP‐CPAP (considered to be equivalent to nIPPV) | Ventilator: Infant‐Flow device PIP: 8 [7 to 10] cm H2O PEEP: 5 [7 to 10] cm H2O Rate: 20 to 30 bpm | Short binasal prongs or masks | |
bpm: breaths per minute; BP‐CPAP: bi‐level pressure continuous positive airway pressure; MAP: mean airway pressure; nCPAP: nasal continuous positive airway pressure; nHFOV: non‐invasive high‐frequency oscillatory ventilation; niPPV: nasal intermittent positive‐pressure ventilation; PEEP: positive end‐expiratory pressure; PIP: positive inspiratory pressure; PMA: postmenstrual age
-
Administrative details: study author(s); published or unpublished; year of publication; year in which the study was conducted; the presence of vested interest by study authors; details of other relevant papers cited;
-
Study characteristics: study registration, study design type, study setting, number of study centres and location; informed consent; ethics approval, details of any 'run‐in' period (if applicable), completeness of follow‐up (e.g. greater than 80%);
-
Participants: number randomised, number lost to follow‐up/withdrawn, number analysed, mean gestational age (GA), GA age range, mean chronological age (CA), CA age range, sex, diagnostic criteria, inclusion criteria and exclusion criteria;
-
Interventions: indication and timing, type, settings (mean airway pressure (MAP), frequency, rate, interface), surfactant co‐administration;
-
Outcomes: as mentioned above under Types of outcome measures.
We described ongoing studies identified by our search and documented available information such as the primary author, research question(s), methods, and outcome measures, together with an estimate of the anticipated reporting date in the Characteristics of ongoing studies table. We replaced any standard error of the mean (SEM) with the corresponding SD.
Assessment of risk of bias in included studies
Two review authors (MEA and DO) independently assessed study quality and risk of bias (low, high, or unclear) of all included trials using the Cochrane ‘Risk of bias’ tool (RoB1) for the following domains (Higgins 2011).
-
Sequence generation (selection bias);
-
Allocation concealment (selection bias);
-
Blinding of participants and personnel (performance bias);
-
Blinding of outcome assessment (detection bias);
-
Attrition bias:
-
Incomplete outcome data; and
-
Incomplete long‐term outcome data;
-
-
Selective reporting (reporting bias);
-
Any other bias.
We resolved any disagreements by discussion or by consultation with a third assessor. See Appendix 7 for a more detailed description of the risk of bias domains.
Measures of treatment effect
We analysed the results of the included studies using the statistical package Review Manager (RevMan 2024). We used the standard methods of Cochrane Neonatal. We used a fixed‐effect model for meta‐analysis. In assessing treatment effects for dichotomous data or categorical data, we reported the risk ratio (RR) or the risk difference (RD), respectively, along with the 95% confidence interval (CI). If the RD was statistically significant, we calculated the number needed to treat for an additional beneficial outcome (NNTB) and the number needed to treat for an additional harmful outcome (NNTH) (1/RD). For outcomes measured on a continuous scale, we reported the mean difference (MD) and the 95% CI.
Unit of analysis issues
For parallel‐group trial designs by which infants were randomised to receive one or more different types of ventilation (nHFV, invasive ventilation, or an alternative type of non‐invasive ventilation such as nCPAP, nIPPV, HFNC), the unit of analysis for both short‐term and long‐term outcomes was the infant by group of assignment (intention‐to‐treat (ITT)).
Cluster‐randomised trials
The unit of analysis for cluster‐randomised trials was planned to be the randomised treating centre or cluster. We planned to include cluster‐randomised trials in the analyses, using an estimate of the intra‐cluster correlation coefficient (ICC) derived from the trial (if possible) or from another source, as described in the Cochrane Handbook for Systematic Reviews of Interventions (Higgins 2023). If ICCs from other sources were used, we planned to report this and conduct sensitivity analyses to investigate the effects of variation in the ICC. We planned to synthesise the relevant information if we identified both cluster‐randomised and individually randomised trials. We considered that it was reasonable to combine the results of both studies if we noted little heterogeneity between study designs and if the interaction between effects of the intervention and choice of randomisation unit was considered unlikely.
Dealing with missing data
In the case of missing data, we described the number of participants with missing data in the Results section and the Characteristics of included studies table. We performed an ITT meta‐analysis using reconstructed denominators, when possible. We discussed the implications of data missing from the review, as appropriate.
Assessment of heterogeneity
We used Review Manager to assess the heterogeneity of treatment effects between trials (RevMan 2024). We used two formal statistical approaches to assess the presence of statistical heterogeneity.
-
The Chi² test for homogeneity: because this test has low power when the number of studies included in the meta‐analysis is small, we set the level of significance at 10% probability (P < 0.1) (Higgins 2023).
-
The I² statistic: the I² statistic describes the percentage of total variation across studies due to heterogeneity rather than sampling error. It is thus a measure of the validity of data pooling for meta‐analysis. We graded the degree of heterogeneity as follows: ≤ 24%, no heterogeneity; 25% to 49%, low heterogeneity; 50% to 74%, moderate heterogeneity; and ≥ 75%, high heterogeneity.
When we noted evidence of apparent or statistical heterogeneity, we assessed the source of heterogeneity by using sensitivity and subgroup analyses to look for evidence of bias or methodological differences between trials.
Assessment of reporting biases
We attempted to obtain the study protocols of all included studies and compare outcomes reported in the protocol versus those reported in the findings for each of the included studies. If reporting bias was suspected, we attempted to contact the study authors to ask them for further information. When this was impossible and missing data were thought to introduce serious bias, we examined the impact of including/excluding such studies in the overall assessment of results by performing a sensitivity analysis.
We investigated non‐reporting (including publication) bias by visually assessing funnel plot asymmetry and by using Egger's test in meta‐analyses if data from at least ten trials contributing events were available (Egger 1997).
Data synthesis
We performed meta‐analyses using the standard methods of the Cochrane Handbook for Systematic Reviews of Interventions (Higgins 2023). We used a fixed‐effect model. When studies were statistically heterogenous, we examined study characteristics, including design and quality. When appropriate, we performed a sensitivity analysis, including only trials with higher methodological rigour.
We did not pool trials that included different comparison groups (see Types of interventions).
Subgroup analysis and investigation of heterogeneity
Where sufficient data were available, we explored potential sources of clinical heterogeneity by analysing whether results differed for newborn infants:
-
gestational age ≥ 37 weeks (term), < 37 weeks (preterm), < 32 weeks (very preterm), or < 28 weeks (extremely preterm);
-
ventilated with nHFV using lower (< 10 cm H2O) versus higher mean airway pressures (≥ 10 cm H2O);
-
ventilated with nHFV using lower (< 10 Hz) versus higher frequencies (≥ 10 Hz);
-
interface used to deliver nHFV: unilateral or bilateral and short or long nasal prongs, nasopharyngeal tube, face mask, laryngeal mask airway;
-
different types of nHFV (oscillatory, percussive, and jet).
Sensitivity analysis
When sufficient data were available, we explored methodological heterogeneity by performing sensitivity analyses to assess any change in the direction of effect caused by the inclusion of studies of lower quality. We assessed studies as having low quality based on a lack of any of the following: sequence generation, allocation concealment and if the loss to follow‐up was greater than 10%. As the intervention is unlikely to be adequately blinded, we did not include blinding as a criterion in the sensitivity analyses for objective outcomes (e.g. death). However, we included blinding as a criterion in the sensitivity analyses for subjective outcomes (endotracheal intubation and endotracheal reintubation).
Summary of findings and assessment of the certainty of the evidence
We used the GRADE approach, as outlined in the GRADE Handbook, to assess the certainty of evidence for the following (clinically relevant) outcomes (Schünemann 2013).
-
Mortality before hospital discharge;
-
Endotracheal intubation or reintubation;
-
Chronic lung disease at 36 weeks;
-
Death or chronic lung disease at 36 weeks;
-
Intraventricular haemorrhage, Papile grade 3/4;
-
Neurodevelopmental disability at least 18 months postnatal age or later.
Two review authors (MEA and DO) independently assessed the certainty of evidence for each of the outcomes above. We considered evidence from RCTs as high certainty, but downgraded the evidence by one level for serious (or by two levels for very serious) limitations based upon the following: design (risk of bias), consistency across studies, directness of the evidence, precision of estimates, and presence of publication bias. We used the GRADEpro GDT Guideline Development Tool to create seven summary of findings tables to report the certainty of the evidence for the following comparisons.
-
nHFV compared to invasive respiratory therapy for initial respiratory support (summary of findings Table 1);
-
nHFV compared to nCPAP used for initial respiratory support (summary of findings Table 2);
-
nHFV compared to nIPPV used for initial respiratory support (summary of findings Table 3);
-
nHFV compared to HFNC for initial respiratory support (summary of findings Table 4);
-
nHFV compared to nCPAP for respiratory support following planned extubation (summary of findings Table 5);
-
nHFV compared to nIPPV for respiratory support following planned extubation (summary of findings Table 6);
-
nHFV compared to nIPPV following failure of initial non‐invasive respiratory support (summary of findings Table 7).
The GRADE approach results in an assessment of the certainty of a body of evidence as belonging to one of four grades.
-
High certainty: further research is very unlikely to change our confidence in the estimate of effect;
-
Moderate certainty: further research is likely to have an important impact on our confidence in the estimate of effect and may change the estimate;
-
Low certainty: further research is very likely to have an important impact on our confidence in the estimate of effect and is likely to change the estimate;
-
Very low certainty: we are very uncertain about the estimate.
We justified all decisions to downgrade the certainty of the evidence using footnotes and made comments to aid the reader's understanding of the review, where necessary. For precision of estimates, we considered whether the confidence intervals included or excluded clinically important differences and whether the confidence intervals were influenced by a 'few events' (< 10 events).
Results
Description of studies
See Characteristics of included studies; Characteristics of excluded studies; Characteristics of ongoing studies.
Results of the search
Searches of databases, trial registries, and conference proceedings identified 2134 references. After removing 921 duplicates, 1213 records were available for screening. We excluded 1088 based on title/abstract and reviewed 125 full texts, trial registration records or conference abstracts. We excluded 34 studies (40 references); identified 25 ongoing studies (26 references); classified 0 as awaiting assessment; and included 33 studies (59 references). For details, see Characteristics of included studies, Characteristics of excluded studies, and Characteristics of ongoing studies. Details of the selection are available in Figure 1.

Study flow diagram. Updated search April 2023.
Included studies
A description of all the included studies is detailed in the Characteristics of included studies, and summarised in Figure 2 and Table 1, Table 2, Table 3, and Table 4.
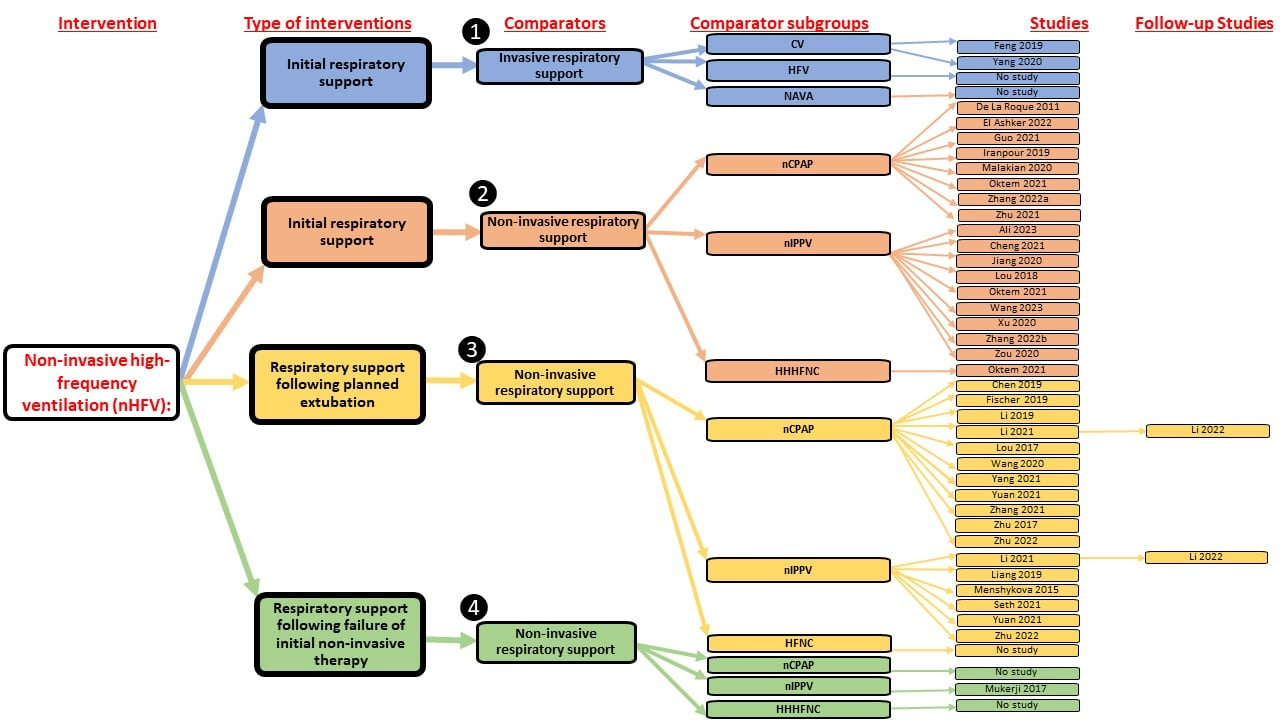
Studies included in the review were categorised by comparison group.
CV denotes invasive conventional ventilation; InSurE: Intubate, Surfactant, Extubate; HFV: invasive high‐frequency ventilation; HHHFNC: Heated humidified high‐flow nasal cannula; NAVA: invasive Neurally Adjusted Ventilatory Assist; nCPAP: nasal continuous positive airway pressure; nHFV: non‐invasive high‐frequency ventilation; nIPPV: non‐invasive intermittent positive‐pressure ventilation
Population
We identified 33 studies mostly in low‐ to middle‐income settings that investigated this therapy in 5068 preterm (Ali 2023; Chen 2019; Cheng 2021; El Ashker 2022; Feng 2019; Fischer 2019; Guo 2021; Iranpour 2019; Jiang 2020; Li 2019; Li 2021; Lou 2017; Lou 2018; Malakian 2020; Menshykova 2015; Mukerji 2017; Oktem 2021; Seth 2021; Wang 2020; Wang 2023; Xu 2020; Yang 2020; Yang 2021; Yuan 2021; Zhang 2021; Zhang 2022a; Zhang 2022b; Zhenyu 2019; Zhu 2017; Zhu 2021; Zhu 2022; Zou 2020), and 46 term infants (De La Roque 2011).
The studies were primarily conducted in low‐ to middle‐income settings as follows: Canada (n = 1), China (n = 23), Egypt (n = 1), France (n = 1), Germany (n = 1), India (n = 1), Iran (n = 2), Pakistan (n = 1), Turkey (n = 1) and Ukraine (n = 1). Only three studies enroling 78 term or preterm infants were conducted in high‐income settings (De La Roque 2011; Fischer 2019; Mukerji 2017).
Interventions and comparisons
We categorised the included studies into four separate comparisons based on the comparison group as follows:
1. Comparison 1: nHFV versus invasive respiratory therapy used for initial respiratory support
a. nHFV versus invasive conventional ventilation: Two studies enroled 180 preterm infants with respiratory distress and allocated them to nHFV versus conventional ventilation as the initial treatment for respiratory distress (Feng 2019; Yang 2020).
b. nHFV versus invasive high‐frequency ventilation: no studies were identified in this comparison.
c. nHFV versus invasive neurally adjusted ventilatory assist (iNAVA) ventilation: no studies were identified in this comparison.
2. Comparison 2: nHFV versus other non‐invasive respiratory therapy modalities used for initial respiratory support
a. nHFV versus nCPAP: this comparison included eight studies enroling a total of 851 infants and compared nHFV versus CPAP for initial respiratory management (De La Roque 2011; El Ashker 2022; Guo 2021; Iranpour 2019; Malakian 2020; Oktem 2021; Zhang 2022a; Zhu 2021). A single study enroled 46 term infants (> 37 weeks gestation) with mild respiratory distress consistent with transient tachypnoea of the newborn and allocated them to nHFV versus nCPAP as the initial treatment for respiratory distress (De La Roque 2011). The other seven studies enroled a total of 805 preterm infants.
b. nHFV versus nIPPV: this comparison included nine studies enroling a total of 513 infants (Ali 2023; Cheng 2021; Jiang 2020; Lou 2018; Oktem 2021; Wang 2023; Xu 2020; Zhang 2022b; Zou 2020). Of these, four studies included surfactant administration in both arms. Ali 2023 (Pakistan, 48 preterm infants) compared nHFV with InSurE versus nIPPV with InSurE. Three studies (Cheng 2021 (China, 60 preterm infants); Jiang 2020 (China, 82 preterm infants); Wang 2023 (China, 43 preterm infants)) compared nHFV with non‐invasive surfactant versus nIPPV with non‐invasive surfactant. The other studies did not report the use of a minimally invasive surfactant as an adjunct to non‐invasive respiratory support. Three studies enroling 190 preterm infants used nasal biphasic continuous positive airway pressure (BP‐CPAP), bilevel positive airway pressure (BiPAP) or duo positive airway pressure (DuoPAP) considered equivalent strategies to nIPPV (Jiang 2020; Lou 2018; Wang 2023). The other studies used standard nIPPV. A single study (Zhang 2022b) enroled 82 newborn infants with persistent pulmonary hypertension of the newborn (PPHN) with a mean gestation of 34 to 35 weeks. The other studies enroled preterm or low birthweight infants.
c. nHFV versus HFNC: a single study enroling 37 preterm infants compared nHFV versus HFNC for initial respiratory management (Oktem 2021).
d. nHFV versus non‐invasive neurally adjusted ventilatory assist (nNAVA): no studies were identified in this comparison.
3. Comparison 3: nHFV versus other non‐invasive respiratory therapy modalities used for respiratory support following planned extubation
a. nHFV versus nCPAP: this comparison included 11 studies involving 2026 preterm infants with planned extubation after intubation and surfactant and compared nHFV versus nCPAP (Chen 2019; Fischer 2019; Li 2019; Li 2021; Lou 2017; Wang 2020; Yang 2021; Yuan 2021; Zhang 2021; Zhu 2017; Zhu 2022). Two studies used InSurE procedures with extubation to the allocated intervention (Yuan 2021; Zhu 2017).
b. nHFV versus nIPPV: this comparison included six studies that enroled 1448 preterm infants (Li 2021; Menshykova 2015; Seth 2021; Yuan 2021; Zhenyu 2019; Zhu 2022).
c. nHFV versus HFNC: no studies were identified in this comparison.
d. nHFV versus nNAVA: no studies were identified in this comparison.
4. Comparison 4: nHFV vs other non‐invasive respiratory therapy modalities following the failure of initial non‐invasive respiratory support
a. nHFV versus nCPAP: no studies were identified in this comparison.
b. nHFV versus nIPPV: this comparison included a single study that enroled 39 preterm infants who had failed nCPAP treatment and allocated them to nHFV versus nIPPV (Mukerji 2017).
c. nHFV versus HFNC: no studies were identified in this comparison.
d. nHFV vs nNAVA: no studies were identified in this comparison.
The ventilatory setting and interphase used in the intervention group (nHFV) and control groups (invasive respiratory support, nCPAP, nIPPV, BP‐CPAP, BiPAP, and DuoPAP) were broad variables between the studies and are summarised in the above‐mentioned tables.
Outcomes
The included studies reported a wide range of outcomes, and the prevalence of these depends on the type of population studied (preterm, borderline preterm or extremely preterm infants). The mean gestational age and birthweight of each trial are summarised in the above‐mentioned tables.
Primary outcomes
-
14 studies reported mortality before discharge (Ali 2023; Chen 2019; Feng 2019; Fischer 2019; Iranpour 2019; Li 2019; Lou 2017; Malakian 2020; Menshykova 2015; Mukerji 2017; Oktem 2021; Zhu 2017; Zhu 2021; Zhu 2022).
-
24 studies reported endotracheal intubation or reintubation (Ali 2023; Chen 2019; Cheng 2021; De La Roque 2011; Fischer 2019; Iranpour 2019; Li 2019; Li 2021; Lou 2017; Malakian 2020; Menshykova 2015; Mukerji 2017; Oktem 2021; Seth 2021; Wang 2020; Wang 2023; Yang 2021; Yuan 2021; Zhang 2021; Zhang 2022b; Zhenyu 2019; Zhu 2017; Zhu 2021; Zhu 2022).
Secondary outcomes
-
Reporting of the majority of secondary outcomes was incomplete.
-
Continuous outcomes, including duration of respiratory support, oxygen therapy, and hospitalisation, were incomplete and variably reported as means (SD) and non‐parametric data (medians and interquartile range or range). We converted non‐parametric data to parametric data, where available, for inclusion in the meta‐analysis.
Excluded studies
We excluded 34 studies.
We excluded five cross‐over RCTs (Bottino 2018; Gaertner 2021; Klotz 2018; Renesme 2020; Ruegger 2018). No other randomised, cluster‐randomised or quasi‐RCTs were identified for exclusion from the review.
We identified and excluded 30 observational non‐randomised and non‐controlled studies (See Characteristics of excluded studies for more details).
Ongoing studies
See Characteristics of ongoing studies.
We identified 25 ongoing trials. The recruiting status of these trials is as follows:
-
Finished recruiting but not published (IRCT2016111930964N1; IRCT20180915041040N3; IRCT20190416043290N2; IRCT20201222049795N1);
-
Still recruiting (DRKS00005387; DRKS00023438; NCT03206489; NCT04905732; NCT05141435; NCT05493527; NCT05706428);
-
Active but not recruiting (ChiCTR1900028092; ChiCTR2100045446; CTRI/2021/10/037681; NCT03558737; NCT04323397; NCT04914715);
-
Recruitment pending (IRCT20221120056556N1);
-
Terminated, withdrawn or suspended (NCT01277874; NCT01852916; NCT03711565);
-
Unknown status: (NCT02543125; NCT03006354; NCT03842462; NCT04282369).
Studies awaiting classification
There are no studies awaiting classification.
Risk of bias in included studies
The risk of bias for studies included in this review based on the review authors' judgements is reported in the Characteristics of included studies and summarised in Figure 3 and Figure 4.

Risk of bias summary: review authors' judgements about each risk of bias item for each included study

Nine studies were assessed as having low risk of selection and attrition bias and were included in sensitivity analyses (Chen 2019; De La Roque 2011; Fischer 2019; Li 2021; Mukerji 2017; Seth 2021; Zhu 2017; Zhu 2021; Zhu 2022).
Allocation
Random sequence generation
One study reported quasi‐random allocation using odd and even admission dates, so it was considered at high risk of selection bias (Yang 2021). Seven studies did not report the method of random sequence generation, so they were at unclear risk of selection bias (Li 2019; Menshykova 2015; Oktem 2021; Xu 2020; Yuan 2021; Zhang 2022a; Zou 2020). The remaining 25 studies were assessed as having a low risk of selection bias from random sequence generation.
Allocation concealment
Thirteen studies were assessed as having low risk of selection bias due to adequate allocation concealment (Ali 2023; Chen 2019; De La Roque 2011; El Ashker 2022; Fischer 2019; Iranpour 2019; Li 2021; Menshykova 2015; Mukerji 2017; Seth 2021; Zhu 2017; Zhu 2021; Zhu 2022). One study was at high risk of selection bias from predictable allocation (Yang 2021). The remaining 19 studies did not report methods of allocation concealment, so were considered at unclear risk of selection bias.
Blinding
Blinding of participants
No study reported blinding of participants. However, given the nature of the interventions, blinding was unlikely and so all studies were assessed as being at high risk of performance bias. Twelve studies reported the participants were unblinded, which reflects the quality of reporting (Chen 2019; De La Roque 2011; Li 2021; Malakian 2020; Menshykova 2015; Mukerji 2017; Oktem 2021; Seth 2021; Yuan 2021; Zhu 2017; Zhu 2021; Zhu 2022). The other 21 studies did not report whether the study was blinded.
Blinding of outcome assessment
Three studies reported blinding of outcome assessment (low risk of bias: Seth 2021; Wang 2023; Zhu 2022). Nine studies reported that outcome assessment was not blinded (high risk of bias: Ali 2023; Chen 2019; De La Roque 2011; El Ashker 2022; Malakian 2020; Menshykova 2015; Mukerji 2017; Zhu 2017; Zhu 2021). The other 21 studies did not report whether the outcome assessment was blinded (unclear risk of bias).
Incomplete outcome data
Twenty studies reported no or minimal losses (< 10%) to follow‐up, so were considered to be at low risk of attrition bias (Ali 2023; Chen 2019; Cheng 2021; De La Roque 2011; El Ashker 2022; Fischer 2019; Iranpour 2019; Li 2019; Li 2021; Lou 2017; Malakian 2020; Mukerji 2017; Oktem 2021; Seth 2021; Wang 2023; Yuan 2021; Zhu 2017; Zhu 2021; Zhu 2022; Zou 2020). For the other 13 studies, the reporting of losses was unclear.
A single study reporting neurodevelopmental disability had a 26.2% loss to follow‐up at 24 months corrected age, so it was assessed as being at high risk of attrition bias for long‐term outcomes (Li 2019).
Selective reporting
Ten studies were assessed as having a low risk of reporting bias either from the availability of a trial protocol or prospective trial registration (Ali 2023; Chen 2019; De La Roque 2011; Fischer 2019; Iranpour 2019; Li 2021; Seth 2021; Wang 2023; Zhu 2021; Zhu 2022). Trial protocols and prospective trial registrations were unavailable for the other 23 studies, so they were assessed as having an unclear risk of selective reporting bias.
Other potential sources of bias
Fischer 2019 prematurely stopped the trial for feasibility and low number of enrolments and so was considered at high risk of bias. Four studies did not provide sufficient information, including baseline characteristics of groups, so they were considered at unclear risk of other sources of bias (Cheng 2021; Feng 2019; Menshykova 2015; Zhenyu 2019). Ali 2023 reported baseline differences between groups for spontaneous vaginal delivery, gestational age and birthweight, so it was considered at high risk of other bias. The other 27 studies had no other biases identified in the assessment and were considered at low risk of bias.
Effects of interventions
See: Summary of findings 1 nHFV compared to invasive respiratory therapy for initial respiratory support; Summary of findings 2 nHFV compared to nCPAP used for initial respiratory support; Summary of findings 3 nHFV compared to nIPPV used for initial respiratory support; Summary of findings 4 nHFV compared to HFNC for initial respiratory support; Summary of findings 5 nHFV compared to nCPAP for respiratory support following planned extubation; Summary of findings 6 nHFV compared to nIPPV for respiratory support following planned extubation; Summary of findings 7 nHFV compared to nIPPV following failure of initial non‐invasive respiratory support
We identified 33 studies in 5068 preterm and 46 term infants.
Comparison 1: nHFV versus invasive respiratory therapy used for initial respiratory support
1.a nHFV versus invasive conventional ventilation used for initial respiratory support
For details, see summary of findings Table 1.
Two studies enroled 180 preterm infants with respiratory distress and allocated them to nHFV versus conventional ventilation as the initial treatment for respiratory distress (Feng 2019; Yang 2020).
Primary outcomes
Mortality before hospital discharge
One study reported this outcome (Feng 2019). We are very uncertain whether nHFV reduces mortality before hospital discharge compared with invasive conventional ventilation used for initial respiratory support (RR 0.67, 95% CI 0.20 to 2.18; RD ‐0.05, 95% CI ‐0.19 to 0.09; I2 = not applicable (NA); 1 study, 80 participants; very low‐certainty evidence; Analysis 1.1).
Endotracheal intubation or reintubation
None of the studies in this comparison reported this outcome.
Secondary outcomes
Measures of respiratory support
Duration of respiratory support (days)
One study reported this outcome (Feng 2019). We are very uncertain whether nHFV reduces the duration of respiratory support compared with invasive conventional ventilation used for initial respiratory support (MD ‐0.43 days, 95% CI ‐0.59 to ‐0.27; I2 = NA; 1 study, 80 participants; Analysis 1.2).
Outcomes during the first hospitalisation
Chronic lung disease (CLD), defined as the need for oxygen or respiratory support at 36 weeks' postmenstrual age (PMA)
Two studies reported this outcome (Feng 2019; Yang 2020). We are very uncertain whether nHFV reduces CLD at 36 weeks compared with invasive conventional ventilation used for initial respiratory support (RR 0.38, 95% CI 0.09 to 1.59; I2 = 0%; RD ‐0.04, 95% CI ‐0.11 to 0.02; I2 = 0%; 2 studies, 180 participants; very low‐certainty evidence; Analysis 1.3).
Pulmonary air leak syndromes, including pulmonary interstitial emphysema (PIE) and gross extrapulmonary air leak (such as pneumothorax)
Two studies reported this outcome (Feng 2019; Yang 2020). We are very uncertain whether nHFV reduces pulmonary air leak syndromes compared with invasive conventional ventilation used for initial respiratory support (RR 0.25, 95% CI 0.05 to 1.14; I2 = 0%; 2 studies, 180 participants; Analysis 1.4).
Length of hospital stay (days)
One study reported this outcome (Feng 2019). We are very uncertain whether nHFV reduces the length of hospital stay compared with invasive conventional ventilation used for initial respiratory support (MD ‐6.68 days, 95% CI ‐8.08 to ‐5.28; I2 = NA; 1 study, 80 participants; Analysis 1.5).
Other secondary outcomes
None of the studies in this comparison reported the following outcomes.
-
Trauma to the nostrils and upper airway;
-
Failure of respiratory support as defined by respiratory support failure criteria or as defined by trial authors;
-
Duration of oxygen therapy (days);
-
All‐cause mortality at 28 days;
-
Death or CDL reported at 36 weeks' PMA or discharge on home oxygen;
-
Patent ductus arteriosus (PDA) (treated medically or surgically);
-
Proven sepsis;
-
Necrotising enterocolitis (NEC) (any Bell stage);
-
NEC (Bell stage ≥ 2);
-
Spontaneous intestinal perforation;
-
Intraventricular haemorrhage (IVH) (any Papile grade);
-
IVH (Papile grade 3/4);
-
Periventricular leukomalacia;
-
Retinopathy of prematurity (ROP) (any stage);
-
ROP (stage ≥ 3);
-
Discharge on home oxygen;
-
All‐cause mortality to follow‐up (≥ one year of age);
-
Neurodevelopmental disability at least 18 months postnatal age (PNA) or later.
Subgroup analyses
Data were not available to conduct these analyses.
Sensitivity analyses
Data were not available to conduct these analyses.
1.b nHFV versus invasive high‐frequency ventilation used for initial respiratory support
We did not find any RCT that compared nHFV with invasive high‐frequency ventilation for initial respiratory support.
1.c nHFV versus invasive neurally adjusted ventilatory assist (iNAVA) ventilation used for initial respiratory support
We did not find any RCT that compared nHFV with NAVA for initial respiratory support.
Comparison 2: nHFV versus other non‐invasive respiratory therapy modalities used for initial respiratory support
2.a nHFV versus nCPAP used for initial respiratory support
For details, see summary of findings Table 2.
Eight studies enroling a total of 851 infants compared nHFV versus nCPAP for initial respiratory management (De La Roque 2011; El Ashker 2022; Guo 2021; Iranpour 2019; Malakian 2020; Oktem 2021; Zhang 2022a; Zhu 2021).
Primary outcomes
Mortality before hospital discharge
Four studies reported this outcome (Iranpour 2019; Malakian 2020; Oktem 2021; Zhu 2021). We are very uncertain whether nHFV reduces mortality before hospital discharge compared with nCPAP (RR 1.00, 95% CI 0.41 to 2.41; I2 = 0%; RD ‐0.00, 95% CI ‐0.03 to 0.03; I2 = 0%; 4 studies, 531 participants; very low‐certainty evidence; Analysis 2.1).
Endotracheal intubation or reintubation
Five studies reported this outcome (De La Roque 2011; Iranpour 2019; Malakian 2020; Oktem 2021; Zhu 2021). Using nHFV probably reduces endotracheal intubation compared to nCPAP (RR 0.52, 95% CI 0.33 to 0.82; I2 = 0%; RD ‐0.08, 95% CI ‐0.13 to ‐0.03; I2 = 0%; NNTB = 13, 95% CI 7 to 37; 5 studies, 571 participants; low‐certainty evidence; Analysis 2.2).
Secondary outcomes
Measures of the safety of nHFV
Trauma to the nostrils and upper airway
Two studies reported this outcome (Malakian 2020; Oktem 2021). We are very uncertain whether nHFV reduces trauma to the nostrils and upper airway compared with nCPAP used for initial respiratory support (RR 1.03, 95% CI 0.72 to 1.47; I2 = 86%; 2 studies, 161 participants; Analysis 2.3).
Measures of respiratory support
Failure of respiratory support as defined by respiratory support failure criteria or as defined by trial authors
Three studies reported this outcome (Malakian 2020; Oktem 2021; Zhu 2021). nHFV, compared with nCPAP used for initial respiratory support, may reduce failure of respiratory support (RR 0.57, 95% CI 0.36 to 0.90; I2 = 0%; RD ‐0.08, ‐0.14 to ‐0.02; I2 = 0%; 3 studies, 463 participants; Analysis 2.4).
Duration of respiratory support (days)
Six studies reported this outcome (Guo 2021; Iranpour 2019; Malakian 2020; Oktem 2021; Zhang 2022a; Zhu 2021). nHFV, compared with nCPAP used for initial respiratory support, may reduce the duration of respiratory support (MD ‐0.48 days, 95% CI ‐0.55 to ‐0.40; I2 = 91%; 6 studies, 707 participants; Analysis 2.5).
Duration of oxygen therapy (days)
Three studies reported this outcome (De La Roque 2011; Malakian 2020; Zhu 2021). nHFV, compared with nCPAP used for initial respiratory support, may have little or no effect on the duration of oxygen therapy (MD 0.03 days, 95% CI ‐0.05 to 0.11; I2 = 95%; 3 studies, 466 participants; Analysis 2.6).
Outcomes during the first hospitalisation
CLD, defined as the need for oxygen or respiratory support at 36 weeks' PMA
Four studies reported this outcome (Guo 2021; Iranpour 2019; Oktem 2021; Zhu 2021). nHFV, compared with nCPAP used for initial respiratory support, may have little or no effect on CLD (RR 1.35, 95% CI 0.80 to 2.27; I2 = 0%; RD 0.03, 95% CI ‐0.02 to 0.09; I2 = 0%; 4 studies, 481 participants; low‐certainty evidence; Analysis 2.7).
Death or CLD reported at 36 weeks' PMA or discharge on home oxygen
One study reported this outcome (Iranpour 2019). We are very uncertain whether nHFV compared with nCPAP used for initial respiratory support, reduces death or CLD reported at 36 weeks (RR 2.50, 95% CI 0.52 to 12.01; I2 = NA; 1 study, 68 participants; low‐certainty evidence; Analysis 2.8).
PDA (treated medically or surgically)
Two studies reported this outcome (Iranpour 2019; Oktem 2021). We are very uncertain whether nHFV, compared with nCPAP used for initial respiratory support, reduces PDA (RR 0.68, 95% CI 0.29 to 1.62; I2 = 0%; 2 studies, 105 participants; Analysis 2.9).
Pulmonary air leak syndromes, including PIE and gross extrapulmonary air leak (such as pneumothorax)
Six studies reported this outcome (De La Roque 2011; Guo 2021; Iranpour 2019; Malakian 2020; Oktem 2021; Zhu 2021). nHFV, compared with nCPAP used for initial respiratory support, may have little or no effect on pulmonary air leak syndromes (RR 2.01, 95% CI 0.70 to 5.75; I2 = 0%; 6 studies, 645 participants; Analysis 2.10).
Proven sepsis
Two studies reported this outcome (De La Roque 2011; Oktem 2021). One study reported no events amongst the study groups (De La Roque 2011). We are very uncertain whether nHFV, compared with nCPAP used for initial respiratory support, reduces proven sepsis (RR 0.88, 95% CI 0.38 to 2.04; I2 = NA; I2 = NA; 2 studies, 77 participants; Analysis 2.11).
NEC (any Bell stage)
Three studies reported this outcome (Iranpour 2019; Oktem 2021; Zhu 2021). nHFV, compared with nCPAP used for initial respiratory support, may have little or no effect on NEC (RR 1.19, 95% CI 0.52 to 2.69; I2 = 37%; 3 studies, 407 participants; Analysis 2.12).
IVH (any Papile grade)
Three studies reported this outcome (Guo 2021; Iranpour 2019; Oktem 2021). nHFV, compared with nCPAP used for initial respiratory support, may have little or no effect on IVH (any Papile grade) (RR 0.42, 95% CI 0.16 to 1.13; I2 = 0%; I2 = 54%; 3 studies, 179 participants; Analysis 2.15).
IVH (Papile grade 3/4)
Four studies reported this outcome (Iranpour 2019; Malakian 2020; Oktem 2021; Zhu 2021). nHFV, compared with nCPAP used for initial respiratory support, may have little or no effect on IVH Papile grade 3/4 (RR 1.17, 95% CI 0.36 to 3.78; I2 = 0%; RD 0.00, 95% CI ‐0.02 to 0.03; I2 = 0%; 4 studies, 531 participants; low‐certainty evidence; Analysis 2.16).
ROP (any stage)
One study reported this outcome (Guo 2021). We are very uncertain whether nHFV, compared with nCPAP used for initial respiratory support, reduces ROP (any stage) (RR 0.70, 95% CI 0.12 to 3.97; I2 = NA; 1 study, 74 participants; Analysis 2.18).
ROP (stage ≥ 3)
One study reported this outcome (Zhu 2021). We are very uncertain whether nHFV, compared with nCPAP used for initial respiratory support, reduces ROP ≥ 3 (RR 0.77, 95% CI 0.29 to 2.01; I2 = NA; 1 study, 302 participants; Analysis 2.19).
Length of hospital stay (days)
Four studies reported this outcome (Guo 2021; Malakian 2020; Zhang 2022a; Zhu 2021). nHFV, compared with nCPAP used for initial respiratory support, may have little or no effect on the length of hospital stay (MD ‐4.07 days, 95% CI ‐4.46 to ‐3.67; I2 = 93%; 4 studies, 602 participants; Analysis 2.20).
Other secondary outcomes
None of the studies in this comparison reported the following outcomes.
-
All‐cause mortality at 28 days;
-
NEC (Bell stage ≥ 2);
-
Discharge on home oxygen;
-
All‐cause mortality to follow‐up (≥ one year of age);
-
Neurodevelopmental disability at least 18 months postnatal age (PNA) or later.
Subgroup analyses
The following GRADE outcomes are reported for gestation (term or near‐term versus preterm), nHFV mean airway pressure (≥ 10 cm H2O versus < 10 cm H2O) and nHFV frequency (≥ 10 Hz versus < 10 Hz) subgroup analyses:
Mortality before hospital discharge (Analysis 3.1)
-
Gestation: term or near‐term infants: no studies. Analysis of studies enroling preterm infants found no difference (RR 1.00, 95% CI 0.41 to 2.41; I2 = 0%; 4 studies, 531 participants). The test for subgroup differences was not performed.
-
nHFV mean airway pressure: analysis of studies using nHFV MAP ≥ 10 cm H2O found no studies. Analysis of studies using nHFV MAP < 10 cm H2O found no difference (RR 1.00, 95% CI 0.41 to 2.41; I2 = 0%; 4 studies, 531 participants). The test for subgroup differences was not performed.
-
nHFV frequency: analysis of studies using nHFV Hz ≥ 10 found no difference (RR 0.39, 95% CI 0.02 to 8.97; I2 = 0%; 2 studies, 105 participants). Analysis of studies using nHFV Hz < 10 found no difference: (RR 0.73, 95% CI 0.17 to 3.11; I2 = NA; 1 study, 124 participants). The subgroup differences test was not significant (Chi² = 0.13; df = 1; P = 0.72; I² = 0%).
Endotracheal intubation (Analysis 3.2)
-
Gestation: term or near‐term infants ‐ De La Roque 2011 reported no intubation in either group (40 participants).
-
Analysis of studies enroling preterm infants found a reduction (RR 0.52, 95% CI 0.33 to 0.82; I2 = 0%; 4 studies, 531 participants). The test for subgroup differences was not performed.
-
Mean airway pressure: analysis of studies using HFV MAP ≥ 10 cm H2O found no studies. Analysis of studies using nHFV MAP < 10 cm H2O found a reduction (RR 0.52, 95% CI 0.33 to 0.82; I2 = 0%; 5 studies, 571 participants). The test for subgroup differences was not performed.
-
Frequency: analysis of studies using nHFV Hz ≥ 10 found no difference (RR 0.50, 95% CI 0.21 to 1.18; I2 = 43%; 2 studies, 105 participants). Analysis of studies using nHFV Hz < 10 found a reduction (RR 0.43, 95% CI 0.14 to 1.32; 12 = NA; 2 studies, 164 participants). The subgroup differences test was not significant (Chi² = 0.04; df = 1; P = 0.84; I² = 0).
Failure of respiratory support (Analysis 3.3)
-
Gestation: term or near‐term infants ‐ no studies. Analysis of studies enroling preterm infants found a reduction (RR 0.57, 95% CI 0.36 to 0.90; I2 = 0%; 3 studies, 463 participants). The test for subgroup differences was not performed.
-
Mean airway pressure: analysis of studies using HFV MAP ≥ 10 cm H2O found no studies. Analysis of studies using nHFV MAP < 10 cm H2O found a reduction (RR 0.57, 95% CI 0.36 to 0.90; I2 = 0%; 3 studies, 463 participants).
-
Frequency: analysis of studies using nHFV Hz ≥ 10 found a single study (Oktem 2021). That study reported no difference (RR 0.74, 95% CI 0.30 to 1.83; 1 study, 37 participants). A single study (Malakian 2020) used nHFV Hz < 10. This study reported no difference (RR 0.43, 95% CI 0.14 to 1.32; I2 = NA; 1 study, 124 participants). The subgroup differences test was not significant (Chi² = 0.53, df = 1; P = 0.47; I² = 0%).
CLD at 36 weeks (Analysis 3.4)
-
Gestation: term or near‐term infants ‐ no studies. Analysis of studies enroling preterm infants found no difference (RR 1.35, 95% CI 0.80 to 2.27; I2 = 0%; 4 studies, 481 participants). The test for subgroup differences was not performed.
-
Mean airway pressure: No study used nHFV MAP ≥ 10 cm H2O. Analysis of studies using nHFV MAP < 10 cm H2O found no difference (RR 1.43, 95% CI 0.84 to 2.44; I2 = 0%; 3 studies, 407 participants). The test for subgroup differences was not performed.
-
Frequency: analysis of studies using nHFV Hz ≥ 10 found no difference (RR 2.41, 95% CI 0.91 to 6.38; I2 = 0%; 2 studies, 105 participants). Analysis of studies using nHFV Hz < 10 found no studies. The test for subgroup differences was not performed.
Death or CLD at 36 weeks (Analysis 3.5).
A single study reported data for a single subgroup (Iranpour 2019). The test for subgroup differences was not performed.
IVH, Papile grade 3/4 (Analysis 3.6)
-
Gestation: term or near‐term infants ‐ no studies. Analysis of studies enroling preterm infants found no difference (RR 1.17, 95% CI 0.36 to 3.78; I2 = 0%; 4 studies, 531 participants). The test for subgroup differences was not performed.
-
Mean airway pressure: analysis of studies using HFV MAP ≥ 10 cm H2O found no studies. Analysis of studies using nHFV MAP < 10 cm H2O found no difference (RR 1.17, 95% CI 0.36 to 3.78; I2 = 0%; 4 studies, 531 participants). The test for subgroup differences was not performed.
-
Frequency: analysis of studies using nHFV Hz ≥ 10 found two studies that reported no events in either group (Iranpour 2019; Oktem 2021; 105 participants). Analysis of a single study using nHFV Hz < 10 found no difference (Malakian 2020); (RR 0.65, 95% CI 0.11 to 3.73; I2 = NA; 1 study, 124 participants). The test for subgroup differences was not performed.
Neurodevelopmental disability at least 18 months' PNA or later
No studies reported this outcome.
Sensitivity analyses
Three studies were assessed as having a low risk of selection and attrition bias (De La Roque 2011; Iranpour 2019; Zhu 2021).
Mortality before hospital discharge
Sensitivity analyses found no difference in mortality before hospital discharge (RR 1.48, 95% CI 0.43 to 5.14; I2 = 0%; 2 studies, 370 participants; Analysis 5.1).
Endotracheal intubation
Sensitivity analyses found reduced endotracheal reintubation (RR 0.50, 95% CI 0.28 to 0.89; I2 = 18%; 3 studies, 410 participants = 410; Analysis 5.2).
Failure of respiratory support
A single study reported no difference in extubation failure (Zhu 2021) (RR 0.57, 95% CI 0.31 to 1.03; 1 study, 302 participants; Analysis 5.3).
CLD at 36 weeks
The analysis found no difference in CLD at 36 weeks (RR 1.28, 95% CI 0.70 to 2.33; I2 = 0%; 2 studies, 370 participants; Analysis 5.4).
Death or CLD at 36 weeks
A single study reported no difference in death or CLD at 36 weeks (Iranpour 2019); (RR 2.50, 95% CI 0.52 to 12.01; 1 study, 68 participants; Analysis 5.5).
IVH, Papile grade 3/4
The analysis found no difference in IVH, Papile grade 3/4 (RR 1.97, 95% CI 0.37 to 10.61; I2 = NA; 2 studies, 370 participants; Analysis 5.6).
Neurodevelopmental disability at least 18 months' PNA or later
No studies reported this outcome.
2.b nHFV versus nIPPV used for initial respiratory support
For details, see summary of findings Table 3.
Nine studies enroled 513 infants comparing nHFV versus nIPPV for initial respiratory management (Ali 2023; Cheng 2021; Jiang 2020; Lou 2018; Oktem 2021; Wang 2023; Xu 2020; Zhang 2022b; Zou 2020).
Primary outcomes
Mortality before hospital discharge
Two studies reported this outcome (Ali 2023; Oktem 2021). Oktem 2021 reported no mortality before discharge (participants = 36). Ali 2023 reported a total of 20 deaths before hospital discharge (participants = 48). nHFV may result in little to no difference in mortality before hospital discharge compared with nIPPV used for initial respiratory support (RR 1.86, 95% CI 0.90 to 3.83; I2 = NA; RD 0.14, 95% CI ‐0.02 to 0.30; I2 = 88%; 2 studies, 84 participants; low‐certainty evidence; Analysis 2.1).
Endotracheal intubation or reintubation
Five studies reported this outcome (Ali 2023; Cheng 2021; Oktem 2021; Wang 2023; Zhang 2022b). Using nHFV probably has no effect in reducing endotracheal intubation compared to nIPPV (RR 1.33, 95% CI 0.76 to 2.34; I2 = 15%; RD 0.05, 95% CI ‐0.04 to 0.14; I2 = 38%; 5 studies, 228 participants; low‐certainty evidence; Analysis 2.2).
Secondary outcomes
Measures of the safety of nHFV
Trauma to the nostrils and upper airway
Two studies reported this outcome (Jiang 2020; Oktem 2021). We are very uncertain whether nHFV reduces trauma to the nostrils and upper airway compared with nIPPV used for initial respiratory support (RR 0.98, 95% CI 0.68 to 1.40; I2 = 0%; 2 studies, 118 participants; Analysis 2.3).
Measures of respiratory support
Failure of respiratory support or failure of extubation as defined by respiratory support failure criteria or as defined by trial authors
One study reported this outcome (Oktem 2021). We are very uncertain whether nHFV compared with nIPPV used for initial respiratory support reduces failure of respiratory support (RR 2.79, 95% CI 0.62 to 12.57; I2 = NA; RD 0.19, ‐0.07 to 0.45; I2 = NA; 1 study, 37 participants; very low‐certainty evidence; Analysis 2.4).
Duration of respiratory support (days)
Five studies reported this outcome (Ali 2023; Cheng 2021; Jiang 2020; Oktem 2021; Wang 2023). nHFV, compared with nIPPV used for initial respiratory support, may have little or no effect on the duration of respiratory support (MD 0.22 days, 95% CI ‐0.58 to 1.01; I2 = 56%; 5 studies, 269 participants; Analysis 2.5).
Duration of oxygen therapy (days)
Three studies reported this outcome (Cheng 2021; Jiang 2020; Wang 2023). nHFV, compared with nIPPV used for initial respiratory support, may reduce the duration of oxygen therapy (MD ‐0.65 days, 95% CI ‐1.13 to ‐0.17; I2 = 0%; 3 studies, 185 participants; Analysis 2.6).
Outcomes during the first hospitalisation
CLD, defined as the need for oxygen or respiratory support at 36 weeks' PMA
Five studies reported this outcome (Ali 2023; Cheng 2021; Oktem 2021; Wang 2023; Zou 2020). nHFV, compared with nIPPV used for initial respiratory support, may reduce CLD (RR 0.63, 95% CI 0.42 to 0.95; I2 = 0%; RD ‐0.10, 95% CI ‐0.19 to ‐0.02; I2 = 56%; NNTB 10, 95% CI% 5 to 91; 5 studies, 307 participants; low‐certainty evidence; Analysis 2.7).
PDA (treated medically or surgically)
Two studies reported this outcome (Ali 2023; Oktem 2021). Ali 2023 reported no events amongst the study groups. We are very uncertain whether nHFV compared with nIPPV used for initial respiratory support reduces PDA (RR 0.67, 95% CI 0.19 to 2.40; I2 = NA; 2 studies, 84 participants; Analysis 2.9).
Pulmonary air leak syndromes, including PIE and gross extrapulmonary air leak (such as pneumothorax)
Five studies reported this outcome (Ali 2023; Jiang 2020; Oktem 2021; Xu 2020; Zhang 2022b). nHFV, compared with nIPPV used for initial respiratory support, may have little or no effect on pulmonary air leak syndromes (RR 0.66, 95% CI 0.27 to 1.66; I2 = 0%; 5 studies, 267 participants; Analysis 2.10).
Proven sepsis
One study reported this outcome (Oktem 2021). We are very uncertain whether nHFV, compared with nIPPV used for initial respiratory support, reduces proven sepsis (RR 0.75, 95% CI 0.34 to 1.66; I2 = NA; 1 study, 36 participants; Analysis 2.11).
NEC (any Bell stage)
Two studies reported this outcome (Ali 2023; Oktem 2021). We are very uncertain whether nHFV, compared with nIPPV used for initial respiratory support, reduces NEC (RR 0.63, 95% CI 0.09 to 4.64; I2 = 0%; 2 studies, 84 participants; Analysis 2.12).
NEC (Bell stage ≥ 2)
A single study reported no events amongst the study groups (Wang 2023: 43 participants; Analysis 2.13).
Spontaneous intestinal perforation
A single study reported no events amongst the study groups (Ali 2023: 48 participants; Analysis 2.14).
IVH (any Papile grade)
Five studies reported this outcome (Ali 2023; Oktem 2021; Wang 2023; Zhang 2022b; Zou 2020). nHFV, compared with nCPAP used for initial respiratory support, may have little or no effect on IVH (any Papile grade) (RR 0.61, 95% CI 0.30 to 1.22; I2 = 0%; 5 studies, 288 participants; Analysis 2.15).
IVH (Papile grade 3/4)
A single study reported no events amongst the study groups (36 participants; very low‐certainty evidence; Analysis 2.16; Oktem 2021).
Periventricular leukomalacia
A single study reported no difference in periventricular leukomalacia (RR 0.95, 95% CI 0.44 to 2.07; I2 = NA; 43 participants; Analysis 2.17; Wang 2023).
ROP (any stage)
Two studies reported this outcome (Ali 2023; Zou 2020). nHFV compared with nIPPV used for initial respiratory support may reduce ROP at any stage (RR 0.54, 95% CI 0.30 to 0.98; I2 = 0%; RD ‐0.13, 95% CI ‐0.25 to ‐0.01; I2 = 0%; NNTB 8, 95% CI 4 to 140; 2 studies, 168 participants; Analysis 2.18).
Length of hospital stay (days)
Two studies reported this outcome (Jiang 2020; Wang 2023). nHFV, compared with nCPAP used for initial respiratory support, may reduce the length of hospital stay (MD ‐4.34 days, 95% CI ‐6.22 to ‐2.47; I2 = 0%; 2 studies, 125 participants; Analysis 2.20).
Other secondary outcomes
None of the studies in this comparison reported the following outcomes.
-
All‐cause mortality at 28 days;
-
Death or CDL reported at 36 weeks' PMA or discharge on home oxygen;
-
ROP (stage ≥ 3);
-
Discharge on home oxygen;
-
All‐cause mortality to follow‐up (≥ one year of age);
-
Neurodevelopmental disability at least 18 months postnatal age (PNA) or later.
Subgroup analyses
The following GRADE outcomes were reported for gestation (term or near‐term versus preterm): nHFV mean airway pressure (≥ 10 cm H2O versus < 10 cm H2O) and nHFV frequency (≥ 10 Hz versus < 10 Hz) subgroup analyses.
Mortality before hospital discharge (Analysis 4.1)
-
Gestation: term or near‐term infants ‐ no studies. Analysis of studies enroling preterm infants found no difference (RR 1.86, 95% CI 0.90 to 3.83; I2 = NA; 2 studies, 84 participants). The test for subgroup differences was not performed.
-
nHFV mean airway pressure: nHFV MAP ≥ 10 cm H2O ‐ no studies. Analysis of studies using nHFV MAP < 10 cm H2O found no difference (RR 1.86, 95% CI 0.90 to 3.83; I2 = NA; 2 studies, 84 participants). The test for subgroup differences was not performed.
-
nHFV frequency: a single study using nHFV Hz ≥ 10 reported no events (participants = 36). nHFV Hz < 10 ‐ no studies. The test for subgroup differences was not performed (Oktem 2021).
Endotracheal intubation (Analysis 4.2)
-
Gestation: term or near‐term infants ‐ Zhang 2022b reported no difference (RR 0.10, 95% CI 0.01 to 1.78, 1 study, 41 participants). Analysis of studies enroling preterm infants found no difference (RR 1.58, 95% CI 0.84 to 3.00; I2 = 9%; 4 studies, 187 participants). The test for subgroup differences was not significant (Chi² = 3.37; df = 1; P = 0.07; I² = 70.3%).
-
Mean airway pressure: HFV MAP ≥ 10 cm H2O ‐ no studies. Analysis of studies using nHFV MAP < 10 cm H2O found no difference (RR 1.29, 95% CI 0.68 to 2.44; I2 = 58%; 3 studies, 125 participants; Analysis 4.2). The test for subgroup differences was not performed.
-
Frequency: Oktem 2021, using nHFV Hz ≥ 10, reported no difference (RR 2.79, 95% CI 0.62 to 12.57; 1 study, 36 participants; Analysis 4.2). nHFV Hz < 10 ‐ no studies. The test for subgroup differences was not performed.
Failure of respiratory support (Analysis 4.3)
A single study reported on failure of respiratory support (Oktem 2021).
-
Gestation: term or near‐term infants ‐ no studies. A single study enroling preterm infants reported no difference (RR 2.79, 95% CI 0.62 to 12.57; 1 study, 36 participants). The test for subgroup differences was not performed.
-
Mean airway pressure: HFV MAP ≥ 10 cm H2O ‐ no studies. A single study using nHFV MAP < 10 cm H2O reported no difference (RR 2.79, 95% CI 0.62 to 12.57; 36 participants). The test for subgroup differences was not performed.
-
Frequency: a single study using nHFV Hz ≥ 10 reported no difference (RR 2.79, 95% CI 0.62 to 12.57; 1 study, 36 participants). nHFV Hz < 10 ‐ no studies. The test for subgroup differences was not performed.
CLD at 36 weeks (Analysis 4.4)
-
Gestation: term or near‐term infants ‐ no studies. Analysis of studies enroling preterm infants found a reduction (RR 0.63, 95% CI 0.42 to 0.95; I2 = 0%; 5 studies, 307 participants). The test for subgroup differences was not performed.
-
Mean airway pressure: HFV MAP ≥ 10 cm H2O ‐ no studies. Analysis of studies using nHFV MAP < 10 cm H2O found no difference (RR 0.79, 95% CI 0.37 to 1.66; I2 = 0%; 2 studies, 84 participants). The test for subgroup differences was not performed.
-
Frequency: a single study using nHFV Hz ≥ 10 reported no difference (RR 3.35, 95% CI 0.78 to 14.44; 1 study, 36 participants). nHFV Hz < 10 ‐ no studies. The test for subgroup differences was not performed.
Death or CLD at 36 weeks
No studies reported this outcome.
IVH, Papile grade 3/4 (Analysis 4.5)
A single study (36 participants) reported no events (Oktem 2021). The test for subgroup differences was not performed.
Neurodevelopmental disability at least 18 months' PNA or later
No studies reported this outcome.
Sensitivity analyses
No study was considered to have a low risk of bias.
2.c nHFV versus HFNC used for initial respiratory support
For details, see summary of findings Table 4.
A single study enroling 37 preterm infants compared nHFV versus HFNC for initial respiratory management (Oktem 2021).
Primary outcomes
Mortality before hospital discharge
Oktem 2021 reported no mortality in nHFV and HFNC arms before hospital discharge (37 participants; very low‐certainty evidence; Analysis 2.1).
Endotracheal intubation or reintubation
We are very uncertain whether nHFV, compared with HFNC used for initial respiratory support, reduces endotracheal intubation (RR 2.94, 95% CI 0.65 to 13.27; I2 = NA; RD 0.19, 95% CI ‐0.06 to 0.45; I2 = NA; 1 study, 37 participants; very low‐certainty evidence; Analysis 2.2).
Secondary outcomes
Measures of the safety of nHFV
Trauma to the nostrils and upper airway
nHFV compared with HFNC used for initial respiratory support may increase trauma to the nostrils and upper airway (RR 2.35, 95% CI 1.25 to 4.45; I2 = NA; RD 0.47, 0.20 to 0.75; I2 = NA; NNTB 3, 95% CI 1 to 5; 1 study, 37 participants; Analysis 2.3).
Measures of respiratory support
Failure of respiratory support or failure of extubation as defined by respiratory support failure criteria or as defined by trial authors
We are very uncertain whether nHFV compared with HFNC used for initial respiratory support reduces failure of respiratory support (RR 2.94, 95% CI 0.65 to 13.27; I2 = NA; RD 0.19, ‐0.06 to 0.45; I2 = NA; 1 study, 37 participants; Analysis 2.4).
Duration of respiratory support (days)
We are very uncertain whether nHFV, compared with HFNC used for initial respiratory support, reduces the duration of respiratory support (MD ‐6.40 days, 95% CI ‐14.74 to 1.94; I2 = NA; 1 study, 37 participants; Analysis 2.5).
Outcomes during the first hospitalisation
CLD, defined as the need for oxygen or respiratory support at 36 weeks' PMA
We are very uncertain whether nHFV, compared with HFNC used for initial respiratory support, reduces CLD (RR 1.18, 95% CI 0.46 to 2.98; I2 = NA; RD 0.05, 95% CI ‐0.25 to 0.36; I2 = NA; 1 study, 37 participants; very low‐certainty evidence; Analysis 2.7).
PDA (treated medically or surgically)
We are very uncertain whether nHFV, compared with HFNC used for initial respiratory support, reduces PDA (RR 1.18, 95% CI 0.27 to 5.09; I2 = NA; 1 study, 37 participants; Analysis 2.9).
Pulmonary air leak syndromes, including PIE and gross extrapulmonary air leak (such as pneumothorax)
We are very uncertain whether nHFV, compared with HFNC used for initial respiratory support, reduces pulmonary air leak syndromes (RR 3.50, 95% CI 0.15 to 80.71; I2 = NA; 1 study, 37 participants; Analysis 2.10).
Proven sepsis
We are very uncertain whether nHFV, compared with HFNC used for initial respiratory support, reduces proven sepsis (RR 1.01, 95% CI 0.42 to 2.43; I2 = NA; 1 study, 37 participants; Analysis 2.11).
NEC (any Bell stage)
We are very uncertain whether nHFV, compared with HFNC used for initial respiratory support, reduces NEC (any Bell stage) (RR 0.23, 95% CI 0.01 to 4.55; I2 = NA; 1 study, 37 participants; Analysis 2.12).
IVH (any Papile grade)
We are very uncertain whether nHFV, compared with HFNC used for initial respiratory support, reduces IVH (any Papile grade) (RR 0.23, 95% CI 0.01 to 4.55; I2 = NA; 1 study, 37 participants; Analysis 2.15).
IVH (Papile grade 3/4)
Oktem 2021 reported no IVH Papile grade 3/4 in both nHFC and HFNC arms (37 participants; very low‐certainty evidence; Analysis 2.16).
Other secondary outcomes
None of the studies in this comparison reported the following outcomes.
-
Duration of oxygen therapy (days);
-
All‐cause mortality at 28 days;
-
Death or CLD reported at 36 weeks' PMA;
-
NEC (Bell stage ≥ 2);
-
Spontaneous intestinal perforation;
-
Periventricular leukomalacia;
-
ROP (any stage);
-
ROP (stage ≥ 3);
-
Length of hospital stay (days);
-
Discharge on home oxygen;
-
All‐cause mortality to follow‐up (≥ one year of age);
-
Neurodevelopmental disability at least 18 months' PNA or later.
Subgroup analyses
These were not performed as only a single study was included in this comparison (Oktem 2021).
Sensitivity analyses
No study was at low risk of bias.
2.d nHFV versus non‐invasive neurally adjusted ventilatory assist (nNAVA) ventilation used for initial respiratory support
No studies assessed this comparison.
Comparison 3: nHFV versus other non‐invasive respiratory therapy modalities used for respiratory support following planned extubation
3.a nHFV versus nCPAP used for respiratory support following planned extubation
For details, see summary of findings Table 5.
Eleven studies enroled 2026 preterm infants with planned extubation after intubation and surfactant, and compared nHFV versus nCPAP (Chen 2019; Fischer 2019; Li 2019; Li 2021; Lou 2017; Wang 2020; Yang 2021; Yuan 2021; Zhang 2021; Zhu 2017; Zhu 2022).
Two studies used InSurE procedures with extubation to the allocated intervention (Yuan 2021; Zhu 2017).
Primary outcomes
Mortality before hospital discharge
Six studies reported this outcome (Chen 2019; Fischer 2019; Li 2019; Lou 2017; Zhu 2017; Zhu 2022). nHFV probably does not reduce mortality before hospital discharge compared with nCPAP (RR 0.92, 95% CI 0.52 to 1.64; I2 = 0%; RD ‐0.00, 95% CI ‐0.02 to 0.02; I2 = 0%; 6 studies, 1472 participants; moderate‐certainty evidence; Analysis 6.1).
Endotracheal intubation or reintubation
Eleven studies reported this outcome (Chen 2019; Fischer 2019; Li 2019; Li 2021; Lou 2017; Wang 2020; Yang 2021; Yuan 2021; Zhang 2021; Zhu 2017; Zhu 2022). nHFV results in a reduction in endotracheal intubation or reintubation compared with nCPAP (RR 0.42, 95% CI 0.35 to 0.51; I2 = 0%; RD ‐0.18, 95% CI ‐0.21 to ‐0.14; I2 = 55%; NNTB 6, 95% CI 5 to 7; 11 studies, 1897 participants; low‐certainty evidence; Analysis 6.2). There was statistically significant evidence of funnel plot asymmetry consistent with trials favouring controls missing from the meta‐analysis (Egger test for bias, P = 0.002; Figure 5).

Funnel plot: Trials comparing nHFV with nCPAP for respiratory support following planned extubation: Outcome 6.2 Endotracheal reintubation. Current studies are depicted as blue, and imputed studies are red. Egger test P = 0.002
Secondary outcomes
Measures of the safety of nHFV
Trauma to the nostrils and upper airway
Four studies reported this outcome (Chen 2019; Li 2021; Yuan 2021; Zhu 2022). nHFV, compared with nCPAP for respiratory support following planned extubation, may have little or no effect on trauma to the nostrils and upper airway (RR 0.96, 95% CI 0.64 to 1.44; I2 = 60%; RD‐0.00, 95% CI ‐0.03 to 0.02; I2 = 72%; 4 studies, 1418 participants; Analysis 6.3).
Measures of respiratory support
Failure of respiratory support or failure of extubation as defined by respiratory support failure criteria or as defined by trial authors
One study reported this outcome (Fischer 2019). We are very uncertain whether nHFV, compared with nCPAP for respiratory support following planned extubation, reduces failure of respiratory support (RR 0.60, 95% CI 0.22 to 1.65; I2 = NA; RD ‐0.50, 95% CI ‐1.11 to 0.11; I2 = NA; 1 study, 6 participants; Analysis 6.4).
Duration of respiratory support (days)
Seven studies reported this outcome (Fischer 2019; Li 2019; Li 2021; Lou 2017; Yang 2021; Zhang 2021; Zhu 2022). nHFV compared with nCPAP for respiratory support following planned extubation may reduce the duration of respiratory support (MD ‐0.11 days, 95% CI ‐0.20 to ‐0.03 days; I2 = 69%; 7 studies, 1371 participants; Analysis 6.5).
Duration of oxygen therapy (days)
Four studies reported this outcome (Fischer 2019; Li 2021; Yuan 2021; Zhu 2022). nHFV compared with nCPAP for respiratory support following planned extubation may reduce the duration of respiratory support (MD ‐2.38 days, 95% CI ‐3.48 to ‐1.28 days; I2 = 0%; 4 studies, 1218 participants; Analysis 6.6).
Outcomes during the first hospitalisation
CLD, defined as the need for oxygen or respiratory support at 36 weeks' PMA
Ten studies reported this outcome (Chen 2019; Fischer 2019; Li 2019; Li 2021; Lou 2017; Wang 2020; Yuan 2021; Zhang 2021; Zhu 2017; Zhu 2022). nHFV may reduce CLD compared with nCPAP for respiratory support following planned extubation (RR 0.78, 95% CI 0.67 to 0.91; I2 = 16%; RD ‐0.06, 95% CI ‐0.10 to ‐0.03; I2 = 34%; NNTB 16, 95% CI 10 to 42; 10 studies, 1829 participants; low‐certainty evidence; Analysis 6.7). There was no evidence of funnel plot asymmetry consistent with trials favouring controls missing from the meta‐analysis (Egger test for bias, P = 0.050; Figure 6).

Funnel plot: Trials comparing nHFV with nCPAP for respiratory support following planned extubation: Outcome 6.7 Chronic lung disease at 36 weeks. Current studies are depicted as blue, and imputed studies are red. Egger test = 0.050
Death or CLD reported at 36 weeks' PMA
Two studies reported this outcome (Fischer 2019; Zhu 2022). nHFV probably has little or no effect on death or CLD compared with nCPAP for respiratory support following planned extubation (RR 0.90, 95% CI 0.77 to 1.06; I2 = 0%; RD ‐0.04, 95% CI ‐0.10 to 0.02; I2 = 0%; 2 studies, 966 participants; moderate‐certainty evidence; Analysis 6.8).
PDA (treated medically or surgically)
Three studies reported this outcome (Chen 2019; Li 2021; Zhu 2022). There is probably little or no difference in PDA (RR 0.99, 95% CI 0.84 to 1.16; I2 = 0%; 3 studies, 1258 participants; Analysis 6.9).
Pulmonary air leak syndromes, including PIE and gross extrapulmonary air leak (such as pneumothorax)
Eight studies reported this outcome (Chen 2019; Li 2021; Lou 2017; Wang 2020; Yuan 2021; Zhang 2021; Zhu 2017; Zhu 2022). There is probably little or no difference in pulmonary air leak syndrome (RR 0.60, 95% CI 0.31 to 1.15; I2 = 19%; 8 studies, 1673 participants; Analysis 6.10).
Proven sepsis
One study reported this outcome (Zhu 2022). We are very uncertain whether nHFV, compared with nCPAP for respiratory support following planned extubation, reduces proven sepsis (RR 0.85, 95% CI 0.38 to 1.87; I2 = NA; 1 study, 960 participants; Analysis 6.11).
NEC (any Bell stage)
Four studies reported this outcome (Chen 2019; Li 2021; Lou 2017; Yuan 2021). nHFV compared with nCPAP used for initial respiratory support may have little or no effect on NEC (RR 0.83, 95% CI 0.47 to 1.45; I2 = 43%; 4 studies, 523 participants; Analysis 6.12).
NEC (Bell stage ≥ 2)
Three studies reported this outcome (Li 2019; Yang 2021; Zhu 2022). nHFV, compared with nCPAP used for initial respiratory support, may have little or no effect on NEC Bell stage ≥ 2 (RR 1.32, 95% CI 0.82 to 2.10; I2 = 0%; 3 studies, 1142 participants; Analysis 6.13).
Intraventricular haemorrhage (any Papile grade)
Seven studies reported this outcome (Chen 2019; Li 2021; Wang 2020; Yuan 2021; Zhang 2021; Zhu 2017; Zhu 2022). nHFV probably has little or no effect on intraventricular haemorrhage, any Papile grade, compared with nCPAP for respiratory support following planned extubation (RR 0.92, 95% CI 0.69 to 1.21; I2 = 5%; 7 studies, 1644 participants; Analysis 6.14).
IVH (Papile grade 3/4)
Three studies reported this outcome (Li 2021; Lou 2017; Zhu 2022). nHFV compared with nCPAP for respiratory support following planned extubation probably has little or no effect on IVH Papile grade 3/4 (RR 0.80, 95% CI 0.57 to 1.13; I2 = 0%; RD ‐0.02, 95% CI ‐0.06 to 0.01; I2 = 25%; 3 studies, 1117 participants; moderate‐certainty evidence; Analysis 6.15).
ROP (any stage)
Four studies reported this outcome (Chen 2019; Li 2021; Lou 2017; Yuan 2021). nHFV compared with nCPAP for respiratory support following planned extubation may reduce ROP, any stage (RR 0.76, 95% CI 0.58 to 0.99; I2 = 36%; RD ‐0.04, 95% CI ‐0.07 to ‐0.00; I2 = 55%; NNTB 28, 95% CI 14 to 951; 4 studies, 1418 participants; Analysis 6.17).
ROP (stage ≥ 3)
Two studies reported this outcome (Li 2021; Zhu 2022). nHFV compared with nCPAP for respiratory support following planned extubation may have little or no effect on ROP stage ≥ 3 (RR 0.81, 95% CI 0.61 to 1.08; I2 = 0%; 2 studies, 1052 participants; Analysis 6.18).
Length of hospital stay (days)
Five studies reported this outcome (Chen 2019; Li 2019; Li 2021; Yang 2021; Yuan 2021). nHFV compared with nCPAP for respiratory support following planned extubation may reduce the length of hospital stay (MD ‐1.14 days, 95% CI ‐2.01 to ‐0.27 days; I2 = 77%; 5 studies, 640 participants; Analysis 6.19).
Postdischarge outcomes
Neurodevelopmental disability at least 18 months' PNA or later
One study reported this outcome (Li 2021). We are very uncertain whether nHFV, compared with nCPAP for respiratory support following planned extubation, reduces neurodevelopmental disability (RR 0.92, 95% CI 0.37 to 2.29; I2 = NA; RD ‐0.02, 95% CI ‐0.20 to 0.17; I2 = NA; 1 study, 72 participants; very low‐certainty evidence; Analysis 6.20).
Other secondary outcomes
None of the studies in this comparison reported the following outcomes:
-
All‐cause mortality at 28 days;
-
Spontaneous intestinal perforation;
-
Periventricular leukomalacia;
-
Discharge on home oxygen;
-
All‐cause mortality to follow‐up (≥ one year of age).
Subgroup analyses
Mortality before hospital discharge (Analysis 7.1)
-
Gestation: term or near‐term infants ‐ no studies. Analysis of studies enroling preterm infants found no difference (RR 0.92, 95% CI 0.52 to 1.64; I2 = 0%; 6 studies, 1427 participants). The test for subgroup differences was not performed.
-
Mean airway pressure: analysis of studies using HFV MAP ≥ 10 cm H2O found no difference (RR 0.67, 95% CI 0.19 to 2.29; I2 = NA; 1 study, 206 participants). Analysis of studies using nHFV MAP < 10 cm H2O found no difference (RR 0.60, 95% CI 0.15 to 2.40; I2 = 0%; 3 studies, 147 participants). The subgroup differences test was not significant (Chi² = 0.01, df = 1; P = 0.91; I² = 0%).
-
Frequency: analysis of studies using nHFV Hz ≥ 10 found no difference (RR 0.68, 95% CI 0.25 to 1.85; I2 = 0%; 2 studies, 282 participants). Analysis of studies using nHFV Hz < 10 found no difference (RR 1.60, 95% CI 0.53 to 4.86; I2 = NA; 2 studies, 968 participants). The subgroup differences test was not significant (Chi² = 1.26, df = 1; P = 0.26; I² = 20.6%).
Endotracheal intubation (Analysis 7.2)
-
Gestation: Wang 2020, enroling term or near‐term infants, reported a reduction (RR 0.31, 95% CI 0.13 to 0.77; 1 study; 80 participants). Analysis of studies enroling preterm infants found a reduction (RR 0.42, 95% CI 0.35 to 0.52; I2 = 0%; 10 studies, 1817 participants). The test for subgroup differences was not significant (Chi² = 0.42, df = 1; P = 0.52; I² = 0%).
-
Mean airway pressure: analysis of studies using HFV MAP ≥ 10 cm H2O found a reduction (RR 0.34, 95% CI 0.21 to 0.53; I2 = 70%; 2 studies, 298 participants). Analysis of studies using nHFV MAP < 10 cm H2O found a reduction (RR 0.41, 95% CI 0.25 to 0.67; I2 = 0%; 3 studies, 147 participants). The subgroup differences test was not significant (Chi² = 0.30, df = 1; P = 0.58; I² = 0%).
-
Frequency: analysis of studies using nHFV Hz ≥ 10 found a reduction (RR 0.45, 95% CI 0.30 to 0.67; I2 = 0%; 2 studies, 282 participants). Analysis of studies using nHFV Hz < 10 found a reduction (RR 0.51, 95% CI 0.39 to 0.67; I2 = 0%; 2 studies, 699 participants). The subgroup differences test was not significant (Chi² = 0.27, df = 1; P = 0.61; I² = 0%).
Failure of extubation (Analysis 7.3)
This outcome was reported by a single study (Fischer 2019). The test for subgroup differences was not performed.
CLD at 36 weeks (Analysis 7.4)
-
Gestation: Wang 2020, enroling term or near‐term infants, reported no difference (RR 0.50, 95% CI 0.05 to 5.30; 1 study, 80 participants). Analysis of studies enroling preterm infants found a reduction (RR 0.78, 95% CI 0.67 to 0.91; I2 = 24%; 9 studies, 1749 participants). The subgroup differences test was not significant (Chi² = 0.14, df = 1; P = 0.71; I² = 0%).
-
Mean airway pressure: analysis of studies using HFV MAP ≥ 10 cm H2O found a reduction (RR 0.47, 95% CI 0.29 to 0.77; I2 = 0%; 2 studies, 298 participants). Analysis of studies using nHFV MAP < 10 cm H2O found a reduction (RR 0.65, 95% CI 0.22 to 1.90; I2 = 0%; 2 studies, 147 participants). The test for subgroup differences was not significant (Chi² = 0.27, df = 1; P = 0.60; I² = 0%).
-
Frequency: analysis of studies using nHFV Hz ≥ 10 found a reduction (RR 0.56, 95% CI 0.21 to 1.46; I2 = 0%, 2 studies, 282 participants). Analysis of studies using nHFV Hz < 10 found no difference (RR 0.88, 95% CI 0.75 to 1.04; I2 = 0%; 2 studies, 966 participants). The subgroup differences test was not significant (Chi² = 0.84, df = 1; P = 0.36; I² = 0%).
Death or CLD at 36 weeks (Analysis 7.5)
-
Gestation: term or near‐term infants ‐ no studies. Analysis of studies enroling preterm infants found no difference (RR 0.90, 95% CI 0.77 to 1.06; I2 = 0%; 2 studies, 966 participants). The test for subgroup differences was not performed.
-
Mean airway pressure: HFV MAP ≥ 10 cm H2O was not reported. Fischer 2019, using nHFV MAP < 10 cm H2O, found no difference (RR 0.50, 95% CI 0.06 to 4.47; I2 = 0%; 1 study, 6 participants). The test for subgroup differences was not performed.
-
Frequency: nHFV Hz ≥ 10 found no studies. Analysis of studies using nHFV Hz < 10 found no difference (RR 0.90, 95% CI 0.77 to 1.06; I2 = 0%; 2 studies, 966 participants). The test for subgroup differences was not performed.
IVH, Papile grade 3/4 (Analysis 7.6)
-
Gestation: term or near‐term infants ‐ no studies. Analysis of studies enroling preterm infants found no difference (RR 0.80, 95% CI 0.57 to 1.13; I2 = 0%; 3 studies, 1117 participants). The test for subgroup differences was not performed.
-
Mean airway pressure: Li 2021, using HFV MAP ≥ 10 cm H2O, reported no difference (RR 2.09, 95% CI 0.20 to 22.24; 1 study, 92 participants). Lou 2017, using nHFV MAP < 10 cm H2O, reported no difference (RR 1.82, 95% CI 0.17 to 19.13; 1 study, 65 participants). The test for subgroup differences was not significant (Chi² = 0.01, df = 1; P = 0.94; I² = 0%).
-
Frequency: nHFV Hz ≥ 10 was not reported. Zhu 2022, using nHFV Hz < 10, reported no difference (RR 0.76, 95% CI 0.54 to 1.09; 1 study, 960 participants). The test for subgroup differences was not performed.
Neurodevelopmental disability at least 18 months' PNA or later (Analysis 7.7)
This outcome was reported by a single study (Li 2021). The test for subgroup differences was not performed.
Sensitivity analyses
Six studies comparing nHFV versus nCPAP for respiratory support following planned extubation were assessed as having low risk of selection and attrition bias (Chen 2019; Fischer 2019; Li 2021; Zhang 2021; Zhu 2017; Zhu 2022).
Mortality before hospital discharge
Sensitivity analyses found no difference in mortality before hospital discharge (RR 1.01, 95% CI 0.49 to 2.09; I2 = 0%; 4 studies; 1248 participants; Analysis 9.1).
Endotracheal intubation
Sensitivity analyses found reduced endotracheal reintubation (RR 0.45, 95% CI 0.36 to 0.56; I2 = 19%; 5 studies, 1340 participants; Analysis 9.2).
Failure of respiratory support
Fischer 2019, reported no difference in extubation failure (RR 0.60, 95% CI 0.22 to 1.65; 1 study, 6 participants; Analysis 9.3).
CLD at 36 weeks
The analysis found no difference in CLD at 36 weeks (RR 0.82, 95% CI 0.70 to 0.95; I2 = 36%; 5 studies, 1340 participants; Analysis 9.4).
Death or CLD at 36 weeks
The analysis found no difference in death or CLD at 36 weeks (RR 0.90, 95% CI 0.77 to 1.06; I2 = 0%; 2 studies, 966 participants; Analysis 9.5).
IVH, Papile grade 3/4
The analysis found no difference in IVH Papile grade 3/4 (RR 0.78, 95% CI 0.55 to 1.11; I2 = 0%; 2 studies, 1052 participants; Analysis 9.6).
Neurodevelopmental disability at least 18 months' PNA or later
Survival with neurosensory disability at least 18 months postnatal age was not reported.
3.b nHFV versus nIPPV used for respiratory support following planned extubation
For details, see summary of findings Table 6.
Six studies enroled 1448 preterm infants with planned extubation after intubation and surfactant and compared nHFV versus nIPPV (Li 2021; Menshykova 2015; Seth 2021; Yuan 2021; Zhenyu 2019; Zhu 2022).
Primary outcomes
Mortality before hospital discharge
Two studies reported this outcome (Menshykova 2015; Zhu 2022). nHFV compared with nIPPV for respiratory support following planned extubation may have little or no effect on mortality before hospital discharge (RR 1.83, 95% CI 0.70 to 4.79; I2 = 0%; RD 0.01, 95% CI ‐0.01 to 0.03; I2 = 0%; 2 studies, 984 participants; low‐certainty evidence; Analysis 6.1).
Endotracheal intubation or reintubation
Six studies reported this outcome (Li 2021; Menshykova 2015; Seth 2021; Yuan 2021; Zhenyu 2019; Zhu 2022). nHFV results in a reduction in endotracheal intubation or reintubation compared with nIPPV (RR 0.69, 95% CI 0.54 to 0.89; I2 = 2%; RD ‐0.06, 95% CI ‐0.09 to ‐0.02; I2 = 32%; NNTB 19, 95% CI 11 to 57; 6 studies, 1364 participants; moderate‐certainty evidence; Analysis 6.2).
Secondary outcomes
Measures of the safety of nHFV
Trauma to the nostrils and upper airway
Four studies reported this outcome (Li 2021; Yuan 2021; Zhenyu 2019; Zhu 2022). nHFV, compared with nIPPV for respiratory support following planned extubation, may have little or no effect on trauma to the nostrils and upper airway (RR 1.01, 95% CI 0.66 to 1.53; I2 = 11%; RD ‐0.00, 95% CI ‐0.03 to 0.03; I2 = 19%; 4 studies, 1254 participants; Analysis 6.3).
Duration of respiratory support (days)
Two studies reported this outcome (Li 2021; Zhu 2022). nHFV, compared with nIPPV for respiratory support following planned extubation, may reduce the duration of respiratory support (MD ‐2.09 days, 95% CI ‐3.32 to ‐0.85; I2 = 0%; 2 studies, 1052 participants; Analysis 6.5).
Duration of oxygen therapy (days)
Three studies reported this outcome (Li 2021; Yuan 2021; Zhu 2022). nHFV, compared with nIPPV for respiratory support following planned extubation, may have little or no effect on the duration of respiratory support (MD ‐0.57 days, 95% CI ‐1.59 to 0.45; I2 = 0%; 3 studies, 1212 participants; Analysis 6.6).
Outcomes during the first hospitalisation
CLD, defined as the need for oxygen or respiratory support at 36 weeks' PMA
Four studies reported this outcome (Li 2021; Menshykova 2015; Yuan 2021; Zhu 2022). nHFV probably has little or no effect on CLD compared with nIPPV for respiratory support following planned extubation (RR 0.88, 95% CI 0.75 to 1.04; I2 = 0%; RD ‐0.04, 95% CI ‐0.09 to 0.01; I2 = 0%; 4 studies, 1236 participants; moderate‐certainty evidence; Analysis 6.7).
Death or CLD reported at 36 weeks' PMA or discharge on home oxygen
Three studies reported this outcome (Menshykova 2015; Seth 2021; Zhu 2022). nHFV probably has little or no effect on death or CLD compared with nIPPV for respiratory support following planned extubation (RR 0.92, 95% CI 0.79 to 1.08; I2 = 0%; RD ‐0.03, 95% CI ‐0.09 to 0.03; I2 = 0%; 3 studies, 1070 participants; moderate‐certainty evidence; Analysis 6.8).
PDA (treated medically or surgically)
Three studies (Li 2021; Menshykova 2015; Zhu 2022). There is probably little or no difference in PDA (RR 0.88, 95% CI 0.74 to 1.05; I2 = 0%; 3 studies, 1076 participants; Analysis 6.9).
Pulmonary air leak syndrome, PIE and gross extrapulmonary air leak (such as pneumothorax)
Five studies reported this outcome (Li 2021; Menshykova 2015; Seth 2021; Yang 2021; Zhu 2022). There is probably little or no difference in pulmonary air leak syndrome (RR 0.83, 95% CI 0.36 to 1.91; I2 = 58%; 5 studies, 1322 participants; Analysis 6.10).
Proven sepsis
Two studies reported this outcome (Li 2021; Zhenyu 2019; Menshykova 2015; Seth 2021; Yuan 2021; Zhu 2022). We are very uncertain whether nHFV, compared with nIPPV for respiratory support following planned extubation, reduces proven sepsis (RR 1.00, 95% CI 0.50 to 2.00; I2 = 0%; 2 studies, 984 participants; Analysis 6.11).
NEC (any Bell stage)
Four studies reported this outcome (Li 2021; Menshykova 2015; Yuan 2021; Zhenyu 2019; Zhu 2022). nHFV, compared with nIPPV used for initial respiratory support, may have little or no effect on NEC (RR 1.02, 95% CI 0.32 to 3.24; I2 = 0%; 4 studies, 318 participants; Analysis 6.12).
NEC (Bell stage ≥ 2)
Two studies reported this outcome (Menshykova 2015; Zhu 2022). nHFV, compared with nIPPV used for initial respiratory support, may have little or no effect on NEC Bell stage ≥ 2 (RR 0.92, 95% CI 0.58 to 1.44; I2 = 0%; 2 studies, 984 participants; Analysis 6.13).
Intraventricular haemorrhage (any Papile grade)
Four studies reported this outcome (Li 2021; Menshykova 2015; Seth 2021; Zhu 2022). nHFV probably has little or no effect on intraventricular haemorrhage, any Papile grade compared with nIPPV for respiratory support following planned extubation (RR 0.99, 95% CI 0.73 to 1.34; I2 = 52%; 4 studies, 1236 participants; Analysis 6.14).
Intraventricular haemorrhage (Papile grade 3/4)
Four studies reported this outcome (Li 2021; Zhenyu 2019; Menshykova 2015; Seth 2021; Zhu 2022). nHFV probably has little or no effect on intraventricular haemorrhage, any Papile grade 3/4, compared with nIPPV for respiratory support following planned extubation (RR 0.78, 95% CI 0.55 to 1.10; I2 = 0%; RD ‐0.03, 95% CI ‐0.06 to 0.01; I2 = 0%; 4 studies, 1162 participants; moderate‐certainty evidence; Analysis 6.15).
Periventricular leukomalacia
One small study (Menshykova 2015), reported no difference in periventricular leukomalacia (RR 7.00, 95% CI 0.40 to 122.44, 1 study, 24 participants; Analysis 6.16).
ROP (any stage)
Four studies reported this outcome (Li 2021; Menshykova 2015; Yuan 2021; Zhu 2022). nHFV probably has little or no effect on ROP, any stage compared with nIPPV for respiratory support following planned extubation (RR 0.85, 95% CI 0.64 to 1.13; I2 = 0%; 4 studies, 1236 participants; Analysis 6.17).
ROP (stage ≥ 3)
Two studies reported this outcome (Li 2021; Zhu 2022). nHFV, compared with nIPPV for respiratory support following planned extubation, may have little or no effect on ROP stage ≥ 3 (RR 0.86, 95% CI 0.64 to 1.15; I2 = 0%; 2 studies, 1052 participants; Analysis 6.18).
Length of hospital stay (days)
Three studies reported this outcome (Li 2021; Menshykova 2015; Yuan 2021). nHFV, compared with nIPPV for respiratory support following planned extubation, may have little or no effect on the length of hospital stay (MD ‐1.05 days, 95% CI ‐3.34 to 1.24; I2 = 0%; 3 studies, 276 participants; Analysis 6.19).
Postdischarge outcomes
Neurodevelopmental disability at least 18 months' PNA or later
Li 2021, reported no difference in neurodevelopmental disability (RR 0.88, 95% CI 0.35 to 2.16; I2 = NA; RD ‐0.03, 95% CI ‐0.22 to 0.16; I2 = NA; 1 study, 72 participants; low‐certainty evidence; Analysis 6.20).
Other secondary outcomes
None of the studies in this comparison reported the following outcomes:
-
Failure of respiratory support as defined by respiratory support failure criteria or as defined by trial authors;
-
All‐cause mortality at 28 days;
-
Spontaneous intestinal perforation;
-
Discharge on home oxygen;
-
All‐cause mortality to follow‐up (≥ one year of age).
Subgroup analyses
Mortality before hospital discharge (Analysis 8.1)
-
Gestation: term or near‐term infants ‐ no studies. Analysis of studies enroling preterm infants found no difference (RR 1.83, 95% CI 0.70 to 4.79; I2 = 0%; 2 studies, 984 participants). The test for subgroup differences was not performed.
-
Mean airway pressure: HFV MAP ≥ 10 cm H2O was not reported. Menshykova 2015, using HFV MAP < 10 cm H2O, reported no difference (RR 1.50, 95% CI 0.30 to 7.43; 1 study, 24 participants). The test for subgroup differences was not performed.
-
Frequency: Menshykova 2015, using HFV Hz ≥ 10 cm H2O, reported no difference (RR 1.50, 95% CI 0.30 to 7.43; 1 study, 24 participants). Zhu 2022, using HFV Hz < 10 cm H2O, reported no difference (RR 2.00, 95% CI 0.61 to 6.60; 1 study, 960 participants). The test for subgroup differences was not significant (Chi² = 0.08, df = 1; P = 0.78; I² = 0%).
Endotracheal reintubation (Analysis 8.2)
-
Gestation: term or near‐term infants ‐ no studies. Analysis of studies enroling preterm infants found a reduction (RR 0.69, 95% CI 0.54 to 0.89; I2 = 2%; 6 studies, 1364 participants). The test for subgroup differences was not performed.
-
Mean airway pressure: analysis of studies using HFV MAP ≥ 10 cm H2O found a reduction (RR 0.27, 95% CI 0.11 to 0.68; I2 = 0%; RD ‐0.20, 95% CI ‐0.33 to ‐0.08; I2 = 0%; NNTB 5, 95% CI 3 to 12.5; 2 studies, 134 participants). Analysis of studies using HFV MAP < 10 cm H2O found no difference (RR 0.92, 95% CI 0.47 to 1.80; I2 = 0%; 2 studies, 110 participants). The subgroup differences test was significant (Chi² = 4.41, df = 1; P = 0.04; I² = 77.3%).
-
Frequency: analysis of studies with nHFV Hz ≥ 10 found no difference (RR 0.92, 95% CI 0.47, 1.80; I2 = 0%; 2 studies, 110 participants). Analysis of studies nHFV Hz < 10 found a borderline difference (RR 0.75, 95% CI 0.55 to 1.01; I2 = NA; 1 study, 960 participants). The subgroup differences test was not significant (Chi² = 0.31, df = 1; P = 0.58; I² = 0%).
Failure of extubation
No studies reported this outcome.
CLD at 36 weeks (Analysis 8.3)
-
Gestation: term or near‐term infants ‐ no studies. Analysis of studies enroling preterm infants found no difference (RR 0.88, 95% CI 0.75 to 1.04; I2 = 0%; 4 studies, 1236 participants). The test for subgroup differences was not performed.
-
Mean airway pressure: Li 2021, using HFV MAP ≥ 10 cm H2O, reported no difference (RR 0.80, 95% CI 0.44 to 1.45; 1 study, 92 participants). Menshykova 2015, using HFV MAP < 10 cm H2O, reported no difference (RR 1.00, 95% CI 0.39 to 2.58; 1 study, 24 participants). The subgroup differences test was not significant (Chi² = 0.16, df = 1; P = 0.69; I² = 0%).
-
Frequency: Menshykova 2015, with nHFV Hz ≥ 10, reported no difference (RR 1.00, 95% CI 0.39 to 2.58; 1 study, 24 participants). Zhu 2022, with nHFV Hz < 10, reported no difference (RR 0.90, 95% CI 0.76 to 1.06; 1 study, 960 participants). The subgroup differences test was not significant (Chi² = 0.05, df = 1; P = 0.82; I² = 0%).
Death or CLD at 36 weeks (Analysis 8.4)
-
Gestation: term or near‐term infants ‐ no studies. Analysis of studies enroling preterm infants found no difference (RR 0.92, 95% CI 0.79 to 1.08; I2 = 0%; 3 studies, 1070 participants). The test for subgroup differences was not performed.
-
Mean airway pressure: HFV MAP ≥ 10 cm H2O was not reported. Analysis of studies using HFV MAP < 10 cm H2O found no difference (RR 0.95, 95% CI 0.60 to 1.52; I2 = 0%; 2 studies, 110 participants). The test for subgroup differences was not performed.
-
Frequency: analysis of studies nHFV Hz ≥ 10 found no difference (RR 0.95, 95% CI 0.60 to 1.52; I2 = 0%; 2 studies, 110 participants). Zhu 2022, using nHFV Hz < 10, reported no difference (RR 0.92, 95% CI 0.78 to 1.08; 1 study, 960 participants). The subgroup differences test was not significant (Chi² = 0.02, df = 1; P = 0.89; I² = 0%).
IVH, Papile grade 3/4 (Analysis 8.5)
-
Gestation: term or near‐term infants ‐ no studies. Analysis of studies enroling preterm infants found no difference (RR 0.78, 95% CI 0.55 to 1.10; I2 = 0%; 4 studies, 1162 participants).
-
Mean airway pressure: Li 2021, using HFV MAP ≥ 10 cm H2O, reported no difference (RR 0.70, 95% CI 0.12 to 3.97; 1 study, 92 participants). Analysis of studies using HFV MAP V 10 cm H2O found no difference (RR 0.40, 95% CI 0.08 to 1.92; I2 = 0%; 2 studies, 110 participants). The subgroup differences test was not significant (Chi² = 0.21, df = 1; P = 0.64; I² = 0%).
-
Frequency: analysis of studies using nHFV Hz ≥ 10 found no difference (RR 0.40, 95% CI 0.08 to 1.92; I2 = 0%; 2 studies, 110 participants). A single study of nHFV Hz < 10 reported no difference (RR 0.81, 95% CI 0.57 to 1.17; 1 study, 960 participants). The subgroup differences test was not significant (Chi² = 0.75, df = 1; P = 0.39; I² = 0%).
Death or survival with neurosensory disability at least 18 months' PNA (Analysis 8.6)
This outcome was reported by a single study (Li 2021). The test for subgroup differences was not performed.
Sensitivity analyses
Three studies comparing nHFV versus nIPPV for respiratory support following planned extubation were assessed as being at low risk of selection and attrition bias (Li 2021; Seth 2021; Zhu 2022).
Mortality before hospital discharge
Zhu 2022 reported no difference in mortality before hospital discharge (RR 2.00, 95% CI 0.61 to 6.60; 1 study, 960 participants; Analysis 9.1).
Endotracheal intubation
The analysis found reduced endotracheal reintubation (RR 0.71, 95% CI 0.54 to 0.94; I2 = 3%; 3 studies, 1138 participants; Analysis 9.2).
Failure of respiratory support
No studies reported this outcome.
CLD at 36 weeks
The analysis found no difference in CLD at 36 weeks (RR 0.89, 95% CI 0.75 to 1.04; I2 = 0%; 2 studies, 1052 participants; Analysis 9.4).
Death or CLD at 36 weeks
The analysis found no difference in death or CLD at 36 weeks (RR 0.92, 95% CI 0.78 to 1.07; I2 = 0%; 2 studies, 1046 participants; Analysis 9.5).
IVH, Papile grade 3/4
The analysis found no difference in IVH Papile grade 3/4 (RR 0.80, 95% CI 0.56 to 1.13; I2 = 0%; 3 studies, 1138 participants; Analysis 9.6).
Neurodevelopmental disability at least 18 months' PNA or later
No studies reported this outcome.
3.c nHFV versus HFNC used for respiratory support following planned extubation
No studies assessed this comparison.
3.d nHFV versus non‐invasive neurally adjusted ventilatory assist (nNAVA) ventilation used for respiratory support following planned extubation
No studies assessed this comparison.
Comparison 4: nHFV versus other non‐invasive respiratory therapy modalities following initial non‐invasive respiratory support failure
4.a nHFV versus nCPAP following initial non‐invasive respiratory support failure
No studies assessed this comparison.
4.b nHFV versus nIPPV following initial non‐invasive respiratory support failure
See summary of findings Table 7.
A single study enroled 39 preterm infants who had failed nCPAP treatment and were therefore allocated to nHFV versus nIPPV (Mukerji 2017).
Primary outcomes
Mortality before hospital discharge
One study reported this outcome (Mukerji 2017). nHFV compared with nIPPV following the failure of initial non‐invasive respiratory support may have little or no effect on mortality before hospital discharge (RR 1.44, 95% CI 0.10 to 21.33; I2 = NA; RD 0.02, 95% CI ‐0.13 to 0.16; I2 = NA; 1 study, 39 participants; low‐certainty evidence; Analysis 10.1).
Endotracheal intubation or reintubation
One study reported this outcome (Mukerji 2017). nHFV compared with nIPPV following the failure of initial non‐invasive respiratory support may have little or no effect on endotracheal intubation (RR 1.23, 95% CI 0.51 to 2.98; I2 = NA; RD 0.07, 95% CI ‐0.23 to 0.37; I2 = NA; 1 study, 39 participants; very low‐certainty evidence; Analysis 10.2).
Secondary outcomes
Measures of respiratory support
Failure of respiratory support or failure of extubation as defined by respiratory support failure criteria or as defined by trial authors
One study reported this outcome (Mukerji 2017). nHFV compared with nIPPV following the failure of initial non‐invasive respiratory support may have little or no effect on endotracheal intubation (RR 0.57, 95% CI 0.29 to 1.16; I2 = NA; RD ‐0.28, 95% CI ‐0.58 to 0.03; I2 = NA; 1 study, 39 participants; Analysis 10.3).
Duration of oxygen therapy (days)
One study reported this outcome (Mukerji 2017). nHFV compared with nIPPV following the failure of initial non‐invasive respiratory support may have little or no effect on the duration of respiratory support (MD 24.00 days, 95% CI ‐8.18 to 56.18; I2 = NA; 1 study, 39 participants; Analysis 10.4).
Outcomes during the first hospitalisation
CLD, defined as the need for oxygen or respiratory support at 36 weeks' PMA
One study reported this outcome (Mukerji 2017). nHFV compared with nIPPV following the failure of initial non‐invasive respiratory support may have little or no effect on CLD (RR 1.01, 95% CI 0.70 to 1.47; I2 = NA; RD 0.01, 95% CI ‐0.27 to 0.29; I2 = NA, 1 study, 39 participants; low‐certainty evidence; Analysis 10.5).
Pulmonary air leak syndromes, including PIE and gross extrapulmonary air leak (such as pneumothorax)
Mukerji 2017 reported no infant had a pulmonary air leak syndrome (no estimate, 39 participants; Analysis 10.6).
NEC (any Bell stage)
One study reported this outcome (Mukerji 2017). nHFV compared with nIPPV following the failure of initial non‐invasive respiratory support may have little or no effect on endotracheal intubation (RR 0.47, 95% CI 0.02 to 10.87; I2 = NA; 1 study, 39 participants; Analysis 10.7).
Spontaneous intestinal perforation
Mukerji 2017 reported no infant had spontaneous intestinal perforation (no estimate, 39 participants; Analysis 10.8).
IVH (Papile grade 3/4)
One study reported this outcome (Mukerji 2017). A single event of IVH (Papile grade 3/4) was reported amongst the nasal intermittent positive pressure ventilation (nIPPV) group. nHFV compared with nIPPV following the failure of initial non‐invasive respiratory support may have little or no effect on Papile grade 3/4 (RR 0.47, 95% CI 0.02 to 10.87; I2 = NA; RD ‐0.04, 95% CI ‐0.17 to 0.08; I2 = NA, 1 study, 39 participants; low‐certainty evidence; Analysis 10.9).
Periventricular leukomalacia
No infant was reported to have periventricular leukomalacia (no estimate, 1 study, 39 participants; Analysis 10.10).
ROP (any stage)
One study reported this outcome (Mukerji 2017). nHFV compared with nIPPV following the failure of initial non‐invasive respiratory support may have little or no effect on ROP stage ≥ 3 (RR 9.88, 95% CI 0.55 to 179.12; I2 = NA, 1 study, 39 participants; Analysis 10.11).
Other secondary outcomes
None of the studies in this comparison reported the following outcomes:
-
Trauma to the nostrils and upper airway;
-
Duration of respiratory support (days);
-
All‐cause mortality at 28 days;
-
Death or CDL reported at 36 weeks' PMA or discharge on home oxygen;
-
Patent ductus arteriosus (PDA) (treated medically or surgically);
-
Proven sepsis;
-
NEC (Bell stage ≥ 2);
-
Spontaneous intestinal perforation;
-
IVH (Papile grade 3/4);
-
ROP (stage ≥ 3);
-
Length of hospital stay (days);
-
Discharge on home oxygen;
-
All‐cause mortality to follow‐up (≥ one year of age);
-
Neurodevelopmental disability at least 18 months postnatal age (PNA) or later.
Subgroup analyses
These analyses were not performed, as only one study was included in this comparison.
Sensitivity analyses
Mukerji 2017 was at low risk of selection and attrition bias. Analyses were reported, as above.
4.c nHFV versus HFNC following initial non‐invasive respiratory support failure
No studies assessed this comparison.
4.d nHFV versus non‐invasive neurally adjusted ventilatory assist (nNAVA) ventilation following initial non‐invasive respiratory support failure
No studies assessed this comparison.
Discussion
Summary of main results
We identified 33 studies, mostly in low‐ to middle‐income settings, that investigated this therapy in 5068 preterm and 46‐term infants.
nHFV versus invasive respiratory therapy used for initial respiratory support
Two studies enroled 180 preterm infants with respiratory distress and allocated them to nHFV versus conventional ventilation as the initial treatment for respiratory distress. For primary outcomes, a single study reported there may be little or no difference in mortality before discharge (very low‐certainty evidence). Endotracheal intubation was not reported. For secondary outcomes, a single study reported there may be a small reduction in the duration of respiratory support (MD ‐0.43 days, 95% CI ‐0.59 to ‐0.27) and a larger reduction in length of hospital stay for infants on nHFV (MD ‐6.68 days, 95% CI ‐8.08 to ‐5.28) from the use of nHFV, but little or no difference in chronic lung disease (very low‐certainty evidence) and pulmonary air leak syndromes. Other neonatal morbidities and longer‐term outcomes were not reported.
nHRV versus other non‐invasive respiratory therapy used for initial respiratory support
nHFV versus nCPAP used for initial respiratory support
Eight studies enroling 851 infants compared nHFV versus CPAP for initial respiratory management. For primary outcomes, there may be little or no difference in mortality before discharge (very low‐certainty evidence), but the use of nHFV may reduce endotracheal intubation compared to nCPAP (RD ‐0.08, 95% CI ‐0.13 to ‐0.03; NNTB 13, 95% CI 7 to 37; low‐certainty evidence). For secondary outcomes, the use of nHFV may reduce failure of respiratory support and result in a small reduction in the duration of respiratory support (MD ‐0.48 days, 95% CI ‐0.55 to ‐0.40) and a moderate reduction in the length of hospital stay (MD ‐4.07 days, 95% CI ‐4.46 to ‐3.67). However, there may be little or no difference in chronic lung disease (low‐certainty evidence) and no differences found for other neonatal morbidities. Longer‐term outcomes were not reported.
Subgroup analyses (Analysis 3) according to gestation (term and near‐term versus preterm), mean airway pressure (≥ 10 cm H2O versus < 10 cm H2O), and nHFV frequency (≥ 10 Hz versus < 10 Hz) found no statistically significant subgroup differences.
nHFV versus nIPPV used for initial respiratory support
Nine studies enroling a total of 513 compared nHFV versus nIPPV for initial respiratory management. For primary outcomes, there may be little or no difference in mortality before discharge (low‐certainty evidence). For secondary outcomes, there may be little or no difference in endotracheal intubation (very low‐certainty), and a single small study reported there may be little or no difference in failure of respiratory support. Duration of respiratory support did not differ, but a reduction in the duration of oxygen therapy was found (MD ‐0.65 days, 95% CI ‐1.13 to ‐0.17) and there may be a reduction in chronic lung disease at 36 weeks from use of nHFV compared to nIPPV (RD ‐0.10, 95% CI ‐0.19 to ‐0.02; NNTB 10, 95% CI% 5 to 50; low‐certainty evidence). There may also be a reduction in the length of hospital stay (MD ‐4.34 days, 95% CI ‐6.22 to ‐2.47). There were no differences found for other neonatal morbidities. Longer‐term outcomes were not reported.
Subgroup analyses (Analysis 4) according to gestation (term and near‐term versus preterm), mean airway pressure (≥ 10 cm H2O versus < 10 cm H2O), and nHFV frequency (≥ 10 Hz versus < 10 Hz) found no subgroup differences.
nHFV versus HFNC used for initial respiratory support
A single small study enroling 37 preterm infants compared nHFV versus HFNC for initial respiratory management. The study reported no mortality before hospital discharge and no difference in endotracheal intubation (both very low‐certainty evidence). nHFV was reported to increase trauma to the nostrils and upper airways compared to HFNC (RD 0.47, 95% CI 0.20 to 0.75; NNTB 3, 95% CI 1 to 5). No difference was reported for other measures of respiratory support or neonatal morbidities. However, periventricular leukomalacia, retinopathy of prematurity, length of hospital stay, discharge on home oxygen, mortality up to follow‐up and neurodevelopmental disability were not reported.
nHFV versus nCPAP for respiratory support following planned extubation
Eleven studies that enroled 2026 preterm infants with planned extubation after intubation and surfactant compared nHFV versus nCPAP. For primary outcomes, there is probably little or no difference in mortality before hospital discharge (moderate‐certainty evidence), but there maybe a reduction in endotracheal reintubation from the use of nHFV compared to nCPAP for respiratory support following planned extubation (RD ‐0.18, 95% CI ‐0.21 to ‐0.14; NNTB 6, 95% CI 5 to 7; low‐certainty evidence). For secondary outcomes, there may be small reductions in the duration of respiratory support (MD ‐0.11 days, 95% CI ‐0.20 to ‐0.03), duration of oxygen therapy (MD ‐2.38 days, 95% CI ‐3.48 to ‐1.28) and length of hospital stay (MD ‐1.14 days, 95% CI ‐2.01 to ‐0.27). There may be a reduction in chronic lung disease reported at 36 weeks (RD ‐0.06, 95% CI ‐0.10 to ‐0.03; NNTB 17, 95% CI 10 to 33; low‐certainty evidence). However, there is probably little or no difference in death or chronic lung disease reported at 36 weeks (RR 0.90, 95% CI 0.77 to 1.06; moderate‐certainty evidence). There was no difference in other neonatal morbidities other than a possible reduction in retinopathy of prematurity at any stage (RD ‐0.04, 95% CI ‐0.07 to ‐0.00; NNTB 28, 95% CI 14 to 950). Discharge on home oxygen and mortality up to follow‐up were not reported. A single small study reported there may be no difference in neurodevelopmental disability (very low‐certainty evidence).
Subgroup analyses (Analysis 7) according to gestation (term and near‐term versus preterm), mean airway pressure (≥ 10 cm H2O versus < 10 cm H2O), and nHFV frequency (≥ 10 Hz versus < 10 Hz) found no statistically significant subgroup differences.
nHFV versus nIPPV used for respiratory support following planned extubation
Six studies enroled 1448 preterm infants with planned extubation after intubation and surfactant and compared nHFV versus nIPPV. For primary outcomes, there is probably little or no difference in mortality before hospital discharge (low‐certainty evidence). There is probably a reduction in endotracheal reintubation from the use of nHFV compared to nIPPV for respiratory support following planned extubation (RD ‐0.06, 95% CI ‐0.09 to ‐0.02; NNTB 19, 95% CI 11 to 57; moderate‐certainty evidence). For secondary outcomes, there may be a moderate reduction in the duration of respiratory support (MD ‐2.09 days, 95% CI ‐3.32 to ‐0.85) but little or no effect on the duration of oxygen therapy and hospital stay. There is probably little or no effect on chronic lung disease at 36 weeks (moderate‐certainty evidence) and death or chronic lung disease at 36 weeks (moderate‐certainty evidence). There was no difference found for other neonatal morbidities. Discharge on home oxygen and mortality up to follow‐up were not reported. A single study reported there may be no difference in neurodevelopmental disability (low‐certainty).
For endotracheal reintubation, subgroup analyses (Analysis 8.2) according to mean airway pressure (≥ 10 cm H2O versus < 10 cm H2O) found a significant difference (P = 0.04). Analysis of studies using HFV MAP ≥ 10 cm H2O found a reduction in reintubation (RD ‐0.20, 95% CI ‐0.33 to ‐0.08; NNTB 5, 95% CI 3 to 12.5) compared to analysis of studies using HFV MAP < 10 cm H2O which found no difference (RR 0.92, 95% CI 0.47 to 1.80).
Subgroup analyses (Analysis 8) for other outcomes and according to gestation (term and near‐term versus preterm) and nHFV frequency (≥ 10 Hz versus < 10 Hz) found no other statistically significant subgroup differences.
nHFV versus nIPPV following the failure of initial non‐invasive respiratory support
A small study enroled 39 preterm infants who had failed nCPAP treatment and allocated them to nHFV versus nIPPV. The study reported there may be little or no difference in mortality before hospital discharge (low‐certainty evidence) and endotracheal intubation (low‐certainty evidence). For secondary outcomes, the study reported there may be no difference in the duration of oxygen therapy and chronic lung disease (low‐certainty evidence). Death or chronic lung disease was not reported, and a single infant in the nIPPV was reported with intraventricular haemorrhage Papile grade 3/4. Other neonatal outcomes were not different or not reported. Discharge on home oxygen, mortality up to follow‐up and neurodevelopmental disability at least 18 months postnatal age or later were not reported.
Overall completeness and applicability of evidence
This review included infants with different indications for respiratory support and multiple comparisons of invasive and non‐invasive support. Comparisons of nHFV versus nCPAP and nIPPV for initial respiratory support and following planned extubation had the most studies and participants. Several comparisons had few studies and infants, including use of nHFV compared to invasive respiratory therapy as initial respiratory support, and nHFV compared to HFNC for initial respiratory support. Several comparisons had no studies including use of nHFV compared to NAVA for any indication, and nFHV versus HFNC for planned extubation. In addition, outcomes were often incompletely reported, especially those postdischarge from hospital, so analyses often lacked precision.
The comparison of nHFV versus invasive respiratory therapy used for initial respiratory support included two studies that enroled 180 preterm infants with respiratory distress. Many outcomes were not reported. The analysis was incomplete and imprecise. Term and near‐term infants were not enroled.
The comparison of nHFV versus nCPAP used for initial respiratory support included eight studies enroling 851 infants. A single study enroled 46 term infants > 37 weeks with mild respiratory distress consistent with transient tachypnoea of the newborn (De La Roque 2011). The other seven studies enroled 805 preterm infants, so results broadly apply to preterm infants with respiratory distress syndrome without preceding surfactant administration. Primary outcomes and GRADE outcomes were reported. However, longer‐term outcomes were not reported.
The comparison of nHFV versus nIPPV used for initial respiratory support included nine studies enroling 513 infants. Of these, four studies (233 preterm infants) included surfactant administration in both arms. Ali 2023 (Pakistan, 48 preterm infants) compared nHFV with InSurE versus nIPPV with InSurE. Cheng 2021 (China, 60 preterm infants), Jiang 2020 (China, 82 preterm infants) and Wang 2023 (China, 43 preterm infants) compared nHFV with non‐invasive surfactant versus nIPPV with non‐invasive surfactant. The other studies did not report the use of a minimally invasive surfactant as an adjunct to non‐invasive respiratory support. Three studies enroling 190 preterm infants used nasal biphasic continuous positive airway pressure (BP‐CPAP), bilevel positive airway pressure (BiPAP) or duo positive airway pressure (DuoPAP) considered equivalent strategies to nIPPV (Jiang 2020; Lou 2018; Wang 2023). The other studies used standard nIPPV. A single study enroled 82 newborn infants with persistent pulmonary hypertension of the newborn (PPHN) with mean gestation of 34 to 35 weeks (Zhang 2022b). The other studies enroled preterm or low birthweight infants without preceding surfactant administration, so results broadly apply to preterm infants with respiratory distress syndrome without preceding surfactant administration. Most primary outcomes and most GRADE outcomes were reported. However, death or chronic lung disease, and longer‐term outcomes were not reported.
A single study enroling 37 preterm infants compared nHFV versus HFNC for initial respiratory support (Oktem 2021). Most primary outcomes and most GRADE outcomes were reported. However, death or chronic lung disease, and longer‐term outcomes were not reported. The analyses had a serious lack of precision.
The comparison of nHFV versus nCPAP used for respiratory support following planned extubation after intubation and surfactant included 11 studies that enroled 2026 preterm infants. Two studies used InSurE procedures with extubation to the allocated intervention (Yuan 2021; Zhu 2017). Primary outcomes and GRADE outcomes were reported. However, longer‐term outcomes were reported by a single study. The results broadly apply to preterm infants with respiratory distress syndrome with planned extubation after surfactant administration.
The comparison of nHFV versus nIPPV used for respiratory support following planned extubation included six studies that enroled 1448 preterm infants. Primary and GRADE outcomes were mainly reported apart from the failure of respiratory support. However, longer‐term outcomes were reported by a single study. The results largely apply to preterm infants with respiratory distress syndrome with planned extubation after surfactant administration.
No studies compared nHFV versus HFNC used for respiratory support following planned extubation.
A small study enroling 39 preterm infants compared nHFV to nIPPV following initial non‐invasive respiratory support failure (Mukerji 2017). Many outcomes, including longer‐term outcomes, were not reported. The analysis was incomplete and imprecise. Term and near‐term infants were not enroled.
This review conducted subgroup analyses, where possible, for studies that enroled term and near‐term infants versus preterm infants; studies that used nHFV mean airway pressures ≥ 10 cm H2O versus < 10 cm H2O; and studies that used nHFV frequencies ≥ 10 Hz versus < 10 Hz. Few studies enroled term or near‐term infants, so subgroup analyses according to gestation either lacked power or were unable to be performed. The results of this review broadly apply to preterm infants. For subgroup analyses according to nHFV mean airway pressure and frequency, tests of subgroup difference were statistically not significant, except for the comparison of nHFV versus nIPPV for respiratory support following planned extubation, which found that the use of nHFV mean airway pressures ≥ 10 cm H2O reduced endotracheal reintubation.
Most of the trials included in this review used oscillatory nHFOV except for one trial which used percussive nHFV (nHFPV) (De La Roque 2011), and two ongoing trials of jet nHFV (nHFJV) (NCT03558737; NCT03006354). As such, the results of this review are mainly applicable to oscillatory nHFOV.
Quality of the evidence
Twelve of the 33 studies were assessed as having low risk of selection and attrition bias and were included in sensitivity analyses. However, many studies were considered at unclear risk due to inadequate reporting of methods. This was particularly the case for studies published in Chinese journals. Journals must enforce CONSORT Statement 2011 guidelines for reporting RCTs.
Only two analyses had at least 10 studies reporting specific outcomes. Both of these analyses (comparing nHFV with nCPAP for respiratory support following planned extubation) found statistical evidence of publication bias through use of funnel plots and Egger tests (see Analysis 6.2; Analysis 6.7). GRADE assessments were downgraded accordingly for these outcomes (endotracheal reintubation and chronic lung disease at 36 weeks). However, it was not possible to statistically explore the potential of publication bias for other comparisons due to the limited number of studies available.
Most GRADE outcomes across the comparisons were assessed as having low or very low certainty of evidence due to the risk of bias and lack of precision. However, several analyses were evaluated as having high or moderate certainty of evidence, including the following comparisons:
-
nHFV compared to nCPAP used for initial respiratory support, assessed as moderate certainty for a reduction in endotracheal intubation;
-
nHFV compared to nCPAP for respiratory support following planned extubation, assessed as moderate certainty for no difference in mortality, death or chronic lung disease and intraventricular haemorrhage grade 3 or 4, moderate certainty for a reduction in chronic lung disease and high certainly for a reduction in endotracheal intubation;
-
nHFV compared to nIPPV for respiratory support following planned extubation was assessed as high‐certainty evidence for a reduction in endotracheal intubation and moderate‐certainty evidence for no difference in chronic lung disease, death or chronic lung disease and intraventricular haemorrhage grade 3 or 4.
Potential biases in the review process
This review was conducted to a prespecified Cochrane protocol (Chan 2017), and included extensive searches for published and unpublished literature and supplemented with cross‐checking of citations of included studies and reviews. Furthermore, we searched additional databases: Epistemonikos and the Chinese language articles from China/Asia On Demand (CAOD). The eligibility, characteristics of included studies, risk of bias and data extraction were conducted independently by at least two review authors, except for Chinese language articles. Chinese language articles were translated by a single author (OT) under the supervision of a senior author (MEA). Differences were reconciled through the consensus of all authors.
Sensitivity and subgroup analyses were prespecified and performed where sufficient data were available. We removed blinding as a criterion in the sensitivity analysis for objective outcomes as the intervention was unlikely to be able to be adequately blinded. However, for endotracheal intubation and reintubation, we considered these subjective outcomes and downgraded risk of bias assessments for these outcomes.
These post hoc changes might be considered potential biases in the review process.
We included subgroup analyses even when only one study was available because weight and gestation groups are commonly used in guideline development.
Some outcomes may only be relevant for certain groups within the study population. For instance, BPD is more relevant for extremely preterm infants (28 weeks' gestation or less) than preterm (33 to 36 weeks' gestation). Subgroup analyses were performed only for GRADE outcomes. Data were limited, particularly for term infants.
We identified 33 studies, mostly in low‐ to middle‐income settings, that investigated this therapy in 5068 preterm and 46 term infants. Only three studies, enroling a total of 78 term or preterm infants, were conducted in high‐income settings (De La Roque 2011; Fischer 2019; Mukerji 2017).
Agreements and disagreements with other studies or reviews
The findings of our systematic review are consistent in part with recently published meta‐analyses (De Luca 2021; Haidar 2021; Li 2019; Li 2022). They differ from the findings of previously published meta‐narrative reviews, which did not include more recent studies (Mukerji 2016; Yoder 2016).
A systematic review of nHFOV versus nCPAP as primary respiratory support strategies for respiratory distress syndrome in preterm infants included four RCTs involving 570 participants and reported that compared with nCPAP, nHFV resulted in less intubation (RR 0.44; 95% CI 0.29 to 0.67, P = 0.0002) (Li 2022). The review concluded that nHFV decreased the intubation rate compared with nCPAP as a primary respiratory supporting strategy in preterm infants suffering from RDS. Future research should assess whether NHFOV can reduce the incidence of BPD and intubation rate in preterm infants with BPD. This review agrees with the findings of our comparison of nHFV to nCPAP used for initial respiratory support.
A Cochrane systematic review of non‐invasive respiratory support for the management of transient tachypnoea of the newborn included three trials (150 infants) comparing either CPAP to free‐flow oxygen, nasal intermittent mandatory ventilation to nCPAP, or nasal high‐frequency percussive ventilation versus nCPAP (Moresco 2020). However, only the single trial included in our review (De La Roque 2011), compared nHFV to nCPAP and reported that no cases of mechanical ventilation or pneumothorax occurred (46 participants), but the duration of tachypnoea was reduced in the nHFV group (MD ‐4.53, 95% CI ‐5.64 to ‐3.42; 1 study, 46 participants).
Two previous systematic reviews of nHFV as respiratory support in preterm infants with respiratory distress included four RCTs involving 218 infants (Yang 2018), and eight RCTs involving 463 infants (Li 2019), so they provided imprecise estimates of effect. Both reviews concluded that nHFV reduced intubation compared to nCPAP with no differences in clinical morbidities.

Study flow diagram. Updated search April 2023.

Studies included in the review were categorised by comparison group.
CV denotes invasive conventional ventilation; InSurE: Intubate, Surfactant, Extubate; HFV: invasive high‐frequency ventilation; HHHFNC: Heated humidified high‐flow nasal cannula; NAVA: invasive Neurally Adjusted Ventilatory Assist; nCPAP: nasal continuous positive airway pressure; nHFV: non‐invasive high‐frequency ventilation; nIPPV: non‐invasive intermittent positive‐pressure ventilation

Risk of bias summary: review authors' judgements about each risk of bias item for each included study


Funnel plot: Trials comparing nHFV with nCPAP for respiratory support following planned extubation: Outcome 6.2 Endotracheal reintubation. Current studies are depicted as blue, and imputed studies are red. Egger test P = 0.002

Funnel plot: Trials comparing nHFV with nCPAP for respiratory support following planned extubation: Outcome 6.7 Chronic lung disease at 36 weeks. Current studies are depicted as blue, and imputed studies are red. Egger test = 0.050

Comparison 1: Initial respiratory support: nHFV vs invasive respiratory therapy, Outcome 1: Mortality before hospital discharge

Comparison 1: Initial respiratory support: nHFV vs invasive respiratory therapy, Outcome 2: Duration of respiratory support, days

Comparison 1: Initial respiratory support: nHFV vs invasive respiratory therapy, Outcome 3: Chronic lung disease at 36 weeks

Comparison 1: Initial respiratory support: nHFV vs invasive respiratory therapy, Outcome 4: Pulmonary air leak syndromes

Comparison 1: Initial respiratory support: nHFV vs invasive respiratory therapy, Outcome 5: Length of hospital stay, days

Comparison 2: Initial respiratory support: nHFV vs other non‐invasive respiratory therapy modalities, Outcome 1: Mortality before hospital discharge

Comparison 2: Initial respiratory support: nHFV vs other non‐invasive respiratory therapy modalities, Outcome 2: Endotracheal intubation

Comparison 2: Initial respiratory support: nHFV vs other non‐invasive respiratory therapy modalities, Outcome 3: Trauma to the nostrils and upper airway

Comparison 2: Initial respiratory support: nHFV vs other non‐invasive respiratory therapy modalities, Outcome 4: Failure of respiratory support

Comparison 2: Initial respiratory support: nHFV vs other non‐invasive respiratory therapy modalities, Outcome 5: Duration of respiratory support, days

Comparison 2: Initial respiratory support: nHFV vs other non‐invasive respiratory therapy modalities, Outcome 6: Duration of oxygen therapy, days

Comparison 2: Initial respiratory support: nHFV vs other non‐invasive respiratory therapy modalities, Outcome 7: Chronic lung disease at 36 weeks

Comparison 2: Initial respiratory support: nHFV vs other non‐invasive respiratory therapy modalities, Outcome 8: Death or chronic lung disease at 36 weeks

Comparison 2: Initial respiratory support: nHFV vs other non‐invasive respiratory therapy modalities, Outcome 9: Patent ductus arteriosus

Comparison 2: Initial respiratory support: nHFV vs other non‐invasive respiratory therapy modalities, Outcome 10: Pulmonary air leak syndromes

Comparison 2: Initial respiratory support: nHFV vs other non‐invasive respiratory therapy modalities, Outcome 11: Proven sepsis

Comparison 2: Initial respiratory support: nHFV vs other non‐invasive respiratory therapy modalities, Outcome 12: Necrotising enterocolitis

Comparison 2: Initial respiratory support: nHFV vs other non‐invasive respiratory therapy modalities, Outcome 13: Necrotising enterocolitis (NEC) (Bell stage ≥ 2)

Comparison 2: Initial respiratory support: nHFV vs other non‐invasive respiratory therapy modalities, Outcome 14: Spontaneous intestinal perforation

Comparison 2: Initial respiratory support: nHFV vs other non‐invasive respiratory therapy modalities, Outcome 15: Intraventricular haemorrhage, any

Comparison 2: Initial respiratory support: nHFV vs other non‐invasive respiratory therapy modalities, Outcome 16: Intraventricular haemorrhage, Papile grade 3/4

Comparison 2: Initial respiratory support: nHFV vs other non‐invasive respiratory therapy modalities, Outcome 17: Periventricular leukomalacia

Comparison 2: Initial respiratory support: nHFV vs other non‐invasive respiratory therapy modalities, Outcome 18: Retinopathy of prematurity, any

Comparison 2: Initial respiratory support: nHFV vs other non‐invasive respiratory therapy modalities, Outcome 19: Retinopathy of prematurity, stage ≥ 3

Comparison 2: Initial respiratory support: nHFV vs other non‐invasive respiratory therapy modalities, Outcome 20: Length of hospital stay, days

Comparison 3: Initial respiratory support: nHFV vs nCPAP ‐ subgroup analyses, Outcome 1: Mortality before hospital discharge

Comparison 3: Initial respiratory support: nHFV vs nCPAP ‐ subgroup analyses, Outcome 2: Endotracheal intubation

Comparison 3: Initial respiratory support: nHFV vs nCPAP ‐ subgroup analyses, Outcome 3: Failure of respiratory support

Comparison 3: Initial respiratory support: nHFV vs nCPAP ‐ subgroup analyses, Outcome 4: Chronic lung disease at 36 weeks

Comparison 3: Initial respiratory support: nHFV vs nCPAP ‐ subgroup analyses, Outcome 5: Death or chronic lung disease at 36 weeks

Comparison 3: Initial respiratory support: nHFV vs nCPAP ‐ subgroup analyses, Outcome 6: Intraventricular haemorrhage, Papile grade 3/4

Comparison 4: Initial respiratory support: nHFV vs nIPPV ‐ subgroup analyses, Outcome 1: Mortality before hospital discharge

Comparison 4: Initial respiratory support: nHFV vs nIPPV ‐ subgroup analyses, Outcome 2: Endotracheal intubation

Comparison 4: Initial respiratory support: nHFV vs nIPPV ‐ subgroup analyses, Outcome 3: Failure of respiratory support

Comparison 4: Initial respiratory support: nHFV vs nIPPV ‐ subgroup analyses, Outcome 4: Chronic lung disease at 36 weeks

Comparison 4: Initial respiratory support: nHFV vs nIPPV ‐ subgroup analyses, Outcome 5: Intraventricular haemorrhage, Papile grade 3/4

Comparison 5: Initial respiratory support: nHFV vs other non‐invasive respiratory therapy modalities ‐ sensitivity analyses, Outcome 1: Mortality before hospital discharge

Comparison 5: Initial respiratory support: nHFV vs other non‐invasive respiratory therapy modalities ‐ sensitivity analyses, Outcome 2: Endotracheal intubation

Comparison 5: Initial respiratory support: nHFV vs other non‐invasive respiratory therapy modalities ‐ sensitivity analyses, Outcome 3: Failure of respiratory support

Comparison 5: Initial respiratory support: nHFV vs other non‐invasive respiratory therapy modalities ‐ sensitivity analyses, Outcome 4: Chronic lung disease at 36 weeks

Comparison 5: Initial respiratory support: nHFV vs other non‐invasive respiratory therapy modalities ‐ sensitivity analyses, Outcome 5: Death or chronic lung disease at 36 weeks

Comparison 5: Initial respiratory support: nHFV vs other non‐invasive respiratory therapy modalities ‐ sensitivity analyses, Outcome 6: Intraventricular haemorrhage, Papile grade 3/4

Comparison 6: Respiratory support following planned extubation: nHFV vs other non‐invasive respiratory therapy modalities, Outcome 1: Mortality before hospital discharge

Comparison 6: Respiratory support following planned extubation: nHFV vs other non‐invasive respiratory therapy modalities, Outcome 2: Endotracheal reintubation

Comparison 6: Respiratory support following planned extubation: nHFV vs other non‐invasive respiratory therapy modalities, Outcome 3: Trauma to the nostrils and upper airway

Comparison 6: Respiratory support following planned extubation: nHFV vs other non‐invasive respiratory therapy modalities, Outcome 4: Failure of extubation

Comparison 6: Respiratory support following planned extubation: nHFV vs other non‐invasive respiratory therapy modalities, Outcome 5: Duration of respiratory support, days

Comparison 6: Respiratory support following planned extubation: nHFV vs other non‐invasive respiratory therapy modalities, Outcome 6: Duration of oxygen therapy, days

Comparison 6: Respiratory support following planned extubation: nHFV vs other non‐invasive respiratory therapy modalities, Outcome 7: Chronic lung disease at 36 weeks

Comparison 6: Respiratory support following planned extubation: nHFV vs other non‐invasive respiratory therapy modalities, Outcome 8: Death or chronic lung disease at 36 weeks

Comparison 6: Respiratory support following planned extubation: nHFV vs other non‐invasive respiratory therapy modalities, Outcome 9: Patent ductus arteriosus

Comparison 6: Respiratory support following planned extubation: nHFV vs other non‐invasive respiratory therapy modalities, Outcome 10: Pulmonary air leak syndromes

Comparison 6: Respiratory support following planned extubation: nHFV vs other non‐invasive respiratory therapy modalities, Outcome 11: Proven sepsis

Comparison 6: Respiratory support following planned extubation: nHFV vs other non‐invasive respiratory therapy modalities, Outcome 12: Necrotising enterocolitis

Comparison 6: Respiratory support following planned extubation: nHFV vs other non‐invasive respiratory therapy modalities, Outcome 13: Necrotising enterocolitis, Bell stage ≥ 2

Comparison 6: Respiratory support following planned extubation: nHFV vs other non‐invasive respiratory therapy modalities, Outcome 14: Intraventricular haemorrhage, any

Comparison 6: Respiratory support following planned extubation: nHFV vs other non‐invasive respiratory therapy modalities, Outcome 15: Intraventricular haemorrhage, Papile grade 3/4

Comparison 6: Respiratory support following planned extubation: nHFV vs other non‐invasive respiratory therapy modalities, Outcome 16: Periventricular leukomalacia

Comparison 6: Respiratory support following planned extubation: nHFV vs other non‐invasive respiratory therapy modalities, Outcome 17: Retinopathy of prematurity, any

Comparison 6: Respiratory support following planned extubation: nHFV vs other non‐invasive respiratory therapy modalities, Outcome 18: Retinopathy of prematurity, stage ≥ 3

Comparison 6: Respiratory support following planned extubation: nHFV vs other non‐invasive respiratory therapy modalities, Outcome 19: Length of hospital stay, days

Comparison 6: Respiratory support following planned extubation: nHFV vs other non‐invasive respiratory therapy modalities, Outcome 20: Neurodevelopmental disability at least 18 months' postnatal age or later

Comparison 7: Respiratory support following planned extubation: nHFV vs nCPAP ‐ subgroup analyses, Outcome 1: Mortality before hospital discharge

Comparison 7: Respiratory support following planned extubation: nHFV vs nCPAP ‐ subgroup analyses, Outcome 2: Endotracheal reintubation

Comparison 7: Respiratory support following planned extubation: nHFV vs nCPAP ‐ subgroup analyses, Outcome 3: Failure of extubation

Comparison 7: Respiratory support following planned extubation: nHFV vs nCPAP ‐ subgroup analyses, Outcome 4: Chronic lung disease at 36 weeks

Comparison 7: Respiratory support following planned extubation: nHFV vs nCPAP ‐ subgroup analyses, Outcome 5: Death or chronic lung disease at 36 weeks

Comparison 7: Respiratory support following planned extubation: nHFV vs nCPAP ‐ subgroup analyses, Outcome 6: Intraventricular haemorrhage, Papile grade 3/4

Comparison 7: Respiratory support following planned extubation: nHFV vs nCPAP ‐ subgroup analyses, Outcome 7: Neurodevelopmental disability at least 18 months' postnatal age or later

Comparison 8: Respiratory support following planned extubation: nHFV vs nIPPV ‐ subgroup analyses, Outcome 1: Mortality before hospital discharge

Comparison 8: Respiratory support following planned extubation: nHFV vs nIPPV ‐ subgroup analyses, Outcome 2: Endotracheal reintubation

Comparison 8: Respiratory support following planned extubation: nHFV vs nIPPV ‐ subgroup analyses, Outcome 3: Chronic lung disease at 36 weeks

Comparison 8: Respiratory support following planned extubation: nHFV vs nIPPV ‐ subgroup analyses, Outcome 4: Death or chronic lung disease at 36 weeks

Comparison 8: Respiratory support following planned extubation: nHFV vs nIPPV ‐ subgroup analyses, Outcome 5: Intraventricular haemorrhage, Papile grade 3/4

Comparison 8: Respiratory support following planned extubation: nHFV vs nIPPV ‐ subgroup analyses, Outcome 6: Neurodevelopmental disability at least 18 months' postnatal age or later

Comparison 9: Respiratory support following planned extubation: nHFV vs other non‐invasive respiratory therapy modalities ‐ sensitivity analyses, Outcome 1: Mortality before hospital discharge

Comparison 9: Respiratory support following planned extubation: nHFV vs other non‐invasive respiratory therapy modalities ‐ sensitivity analyses, Outcome 2: Endotracheal reintubation

Comparison 9: Respiratory support following planned extubation: nHFV vs other non‐invasive respiratory therapy modalities ‐ sensitivity analyses, Outcome 3: Failure of extubation

Comparison 9: Respiratory support following planned extubation: nHFV vs other non‐invasive respiratory therapy modalities ‐ sensitivity analyses, Outcome 4: Chronic lung disease at 36 weeks

Comparison 9: Respiratory support following planned extubation: nHFV vs other non‐invasive respiratory therapy modalities ‐ sensitivity analyses, Outcome 5: Death or chronic lung disease at 36 weeks

Comparison 9: Respiratory support following planned extubation: nHFV vs other non‐invasive respiratory therapy modalities ‐ sensitivity analyses, Outcome 6: Intraventricular haemorrhage, Papile grade 3/4

Comparison 10: Respiratory support following initial non‐invasive respiratory support failure: nHFV vs nIPPV, Outcome 1: Mortality before hospital discharge

Comparison 10: Respiratory support following initial non‐invasive respiratory support failure: nHFV vs nIPPV, Outcome 2: Endotracheal intubation

Comparison 10: Respiratory support following initial non‐invasive respiratory support failure: nHFV vs nIPPV, Outcome 3: Failure of respiratory support

Comparison 10: Respiratory support following initial non‐invasive respiratory support failure: nHFV vs nIPPV, Outcome 4: Duration of oxygen therapy, days

Comparison 10: Respiratory support following initial non‐invasive respiratory support failure: nHFV vs nIPPV, Outcome 5: Chronic lung disease at 36 weeks

Comparison 10: Respiratory support following initial non‐invasive respiratory support failure: nHFV vs nIPPV, Outcome 6: Pulmonary air leak syndromes

Comparison 10: Respiratory support following initial non‐invasive respiratory support failure: nHFV vs nIPPV, Outcome 7: Necrotising enterocolitis

Comparison 10: Respiratory support following initial non‐invasive respiratory support failure: nHFV vs nIPPV, Outcome 8: Spontaneous intestinal perforation

Comparison 10: Respiratory support following initial non‐invasive respiratory support failure: nHFV vs nIPPV, Outcome 9: Intraventricular haemorrhage, Papile grade 3/4

Comparison 10: Respiratory support following initial non‐invasive respiratory support failure: nHFV vs nIPPV, Outcome 10: Periventricular leukomalacia

Comparison 10: Respiratory support following initial non‐invasive respiratory support failure: nHFV vs nIPPV, Outcome 11: Retinopathy of prematurity, stage ≥ 3
| nHFV compared to invasive respiratory therapy for initial respiratory support | ||||||
| Patient or population: preterm infants with respiratory distress | ||||||
| Outcomes | Illustrative comparative risks* (95% CI) | Relative effect | No of participants | Certainty of the evidence | Comments | |
|---|---|---|---|---|---|---|
| Assumed risk | Corresponding risk | |||||
| Invasive respiratory therapy | nHFV | |||||
| Mortality before hospital discharge | 150 per 1000 | 101 per 1000 | RR 0.67 | 80 | ⊕⊝⊝⊝ | |
| Endotracheal intubation or reintubation To discharge | See comment | See comment | Not estimable | 0 | See comment | Not reported |
| Chronic lung disease | 67 per 1000 | 25 per 1000 | RR 0.38 | 180 | ⊕⊝⊝⊝ | |
| Death or chronic lung disease | See comment | See comment | Not estimable | 0 | See comment | Not reported |
| Intraventricular haemorrhage, Papile grade 3/4 | See comment | See comment | Not estimable | 0 | See comment | Not reported |
| Neurodevelopmental disability | See comment | See comment | Not estimable | 0 | See comment | Not reported |
| *The corresponding risk (and its 95% confidence interval) is based on the assumed risk in the comparison group and the relative effect of the intervention (and its 95% CI). | ||||||
| GRADE Working Group certainty of evidence | ||||||
| 1 Downgraded one level for high risk of bias 2 Downgraded two levels for imprecision due to a single small study and wide confidence intervals 3 Downgraded two levels for serious imprecision due to few events, and confidence intervals include appreciable benefit or harm | ||||||
| nHFV compared to nCPAP used for initial respiratory support | ||||||
| Patient or population: newborn (term* and preterm) infants with respiratory distress for initial respiratory support | ||||||
| Outcomes | Illustrative comparative risks* (95% CI) | Relative effect | No of participants | Certainty of the evidence | Comments | |
|---|---|---|---|---|---|---|
| Assumed risk | Corresponding risk | |||||
| nCPAP | nHFV | |||||
| Mortality before hospital discharge | 34 per 1000 | 34 per 1000 | RR 1.00 | 531 | ⊕⊝⊝⊝ | |
| Endotracheal intubation To discharge | 165 per 1000 | 86 per 1000 | RR 0.52 | 571 | ⊕⊕⊝⊝ | Subgroup analyses according to gestation, nHFV mean airway pressure, and nHFV frequency found no statistically significant subgroup differences. |
| Chronic lung disease | 91 per 1000 | 123 per 1000 | RR 1.35 (0.80 to 2.27) | 481 | ⊕⊕⊝⊝ | |
| Death or chronic lung disease | 59 per 1000 | 147 per 1000 | RR 2.50 | 68 | ⊕⊕⊝⊝ | |
| Intraventricular haemorrhage, Papile grade 3/4 | 19 per 1000 | 22 per 1000 | RR 1.17 | 531 | ⊕⊕⊝⊝ | |
| Neurodevelopmental disability | See comment | See comment | Not estimable | 0 | See comment | Not reported |
| *The corresponding risk (and its 95% confidence interval) is based on the assumed risk in the comparison group and the relative effect of the intervention (and its 95% CI). | ||||||
| GRADE Working Group certainty of evidence | ||||||
| 1 Downgraded one level for risk of bias 2 Downgraded two levels for serious imprecision because of wide confidence intervals and few events 3 Downgraded one level for imprecision due to confidence intervals, including appreciable benefit or harm 4 Single small study 5 Subjective outcome measure * A single study enroled 46 term infants (De La Roque 2011). | ||||||
| nHFV compared to nIPPV used for initial respiratory support | ||||||
| Patient or population: preterm infants with respiratory distress for initial respiratory support | ||||||
| Outcomes | Illustrative comparative risks* (95% CI) | Relative effect | No of participants | Certainty of the evidence | Comments | |
|---|---|---|---|---|---|---|
| Assumed risk | Corresponding risk | |||||
| NIPPV | nHFV | |||||
| Mortality before hospital discharge | 163 per 1000 | 303 per 1000 | RR 1.86 | 84 | ⊕⊕⊝⊝ | |
| Endotracheal intubation To discharge | 144 per 1000 | 192 per 1000 | RR 1.33 (0.76 to 2.34) | 228 | ⊕⊕⊝⊝ | |
| Chronic lung disease | 276 per 1000 | 174 per 1000 | RR 0.63 (0.42 to 0.95) | 307 | ⊕⊕⊝⊝ | |
| Death or chronic lung disease | See comment | See comment | Not estimable | 0 | See comment | Not reported |
| Intraventricular haemorrhage, Papile grade 3/4 | See comment | See comment | Not estimable | 36 | ⊕⊝⊝⊝ | No events |
| Neurodevelopmental disability | See comment | See comment | Not estimable | 0 | See comment | Not reported |
| *The corresponding risk (and its 95% confidence interval) is based on the assumed risk in the comparison group and the relative effect of the intervention (and its 95% CI). | ||||||
| GRADE Working Group certainty of evidence | ||||||
| 1 Downgraded one level for risk of bias 2 Downgraded one level for imprecision due to wide confidence intervals 3 Downgraded two levels for serious imprecision due to a single small study with no/few events 4 Subjective outcome measure | ||||||
| nHFV compared to HFNC for initial respiratory support | ||||||
| Patient or population: preterm infants with respiratory distress for initial respiratory support | ||||||
| Outcomes | Illustrative comparative risks* (95% CI) | Relative effect | No of participants | Certainty of the evidence | Comments | |
|---|---|---|---|---|---|---|
| Assumed risk | Corresponding risk | |||||
| HFNC | nHFV | |||||
| Mortality before hospital discharge | See comment | See comment | Not estimable | 37 | ⊕⊝⊝⊝ | No events |
| Endotracheal intubation or reintubation To discharge | 100 per 1000 | 294 per 1000 | RR 2.94 (0.65 to 13.27) | 37 | ⊕⊝⊝⊝ | |
| Chronic lung disease | 300 per 1000 | 354 per 1000 | RR 1.18 (0.46 to 2.98) | 37 | ⊕⊝⊝⊝ | |
| Death or chronic lung disease | See comment | See comment | Not estimable | 0 | See comment | Not reported |
| Intraventricular haemorrhage, Papile grade 3/4 | See comment | See comment | Not estimable | 37 | ⊕⊝⊝⊝ | No events |
| Neurodevelopmental disability | See comment | See comment | Not estimable | 0 | See comment | Not reported |
| *The corresponding risk (and its 95% confidence interval) is based on the assumed risk in the comparison group and the relative effect of the intervention (and its 95% CI). | ||||||
| GRADE Working Group certainty of evidence | ||||||
| 1 Downgraded one level for risk of bias 2 Downgraded two levels for serious imprecision due to a single small study with few/no events 3 Subjective outcome measure | ||||||
| nHFV compared to nCPAP for respiratory support following planned extubation | ||||||
| Patient or population: ventilated preterm infants with planned extubation | ||||||
| Outcomes | Illustrative comparative risks* (95% CI) | Relative effect | No of participants | Certainty of the evidence | Comments | |
|---|---|---|---|---|---|---|
| Assumed risk | Corresponding risk | |||||
| NCPAP | nHFV | |||||
| Mortality before hospital discharge | 32 per 1000 | 30 per 1000 | RR 0.92 | 1427 | ⊕⊕⊕⊝ | |
| Endotracheal reintubation To discharge | 306 per 1000 | 128 per 1000 | RR 0.42 | 1897 | ⊕⊕⊝⊝ | Subgroup analyses according to gestation, nHFV mean airway pressure, and nHFV frequency found no statistically significant subgroup differences. |
| Chronic lung disease | 284 per 1000 | 222 per 1000 | RR 0.78 | 1829 | ⊕⊕⊝⊝ | |
| Death or chronic lung disease | 394 per 1000 | 355 per 1000 | RR 0.90 | 966 | ⊕⊕⊕⊝ | |
| Intraventricular haemorrhage, Papile grade 3/4 | 116 per 1000 | 93 per 1000 | RR 0.80 | 1117 | ⊕⊕⊕⊝ | |
| Neurodevelopmental disability | 211 per 1000 | 194 per 1000 | RR 0.92 (0.37, 2.29) | 74 | ⊕⊝⊝⊝ | |
| *The corresponding risk (and its 95% confidence interval) is based on the assumed risk in the comparison group and the relative effect of the intervention (and its 95% CI). | ||||||
| GRADE Working Group certainty of evidence | ||||||
| 1 Downgraded one level for imprecision because of wide confidence intervals 2 Downgraded one level for risk of bias 3 Downgraded one level for publication bias 4 Subjective outcome measure 5 Downgraded two levels for serious imprecision due to a single study with few events, and confidence intervals included appreciable benefit or harm | ||||||
| nHFV compared to nIPPV for respiratory support following planned extubation | ||||||
| Patient or population: ventilated preterm infants with planned extubation | ||||||
| Outcomes | Illustrative comparative risks* (95% CI) | Relative effect | No of participants | Certainty of the evidence | Comments | |
|---|---|---|---|---|---|---|
| Assumed risk | Corresponding risk | |||||
| NIPPV | nHFV | |||||
| Mortality before hospital discharge | 12 per 1000 | 22 per 1000 | RR 1.83 | 984 | ⊕⊕⊝⊝ | |
| Endotracheal reintubation To discharge | 179 per 1000 | 123 per 1000 | RR 0.69 | 1364 | ⊕⊕⊕⊝ | Subgroup analyses according to gestation, nHFV mean airway pressure, and nHFV frequency found no statistically significant subgroup differences. |
| Chronic lung disease | 336 per 1000 | 296 per 1000 | RR 0.88 | 1236 | ⊕⊕⊕⊝ | |
| Death or chronic lung disease | 387 per 1000 | 356 per 1000 | RR 0.92 | 1070 | ⊕⊕⊕⊝ | |
| Intraventricular haemorrhage, Papile grade 3/4 | 115 per 1000 | 90 per 1000 | RR 0.78 | 1162 | ⊕⊕⊕⊝ | |
| Neurodevelopmental disability | 222 per 1000 | 196 per 1000 | RR 0.88 | 72 | ⊕⊕⊝⊝ | |
| *The corresponding risk (and its 95% confidence interval) is based on the assumed risk in the comparison group and the relative effect of the intervention (and its 95% CI). | ||||||
| GRADE Working Group certainty of evidence | ||||||
| 1 Downgraded one level for risk of bias 2 Downgraded one level for imprecision due to confidence intervals, including appreciable benefit or harm 3 Subjective outcome measure | ||||||
| nHFV compared to nIPPV following failure of initial non‐invasive respiratory support | ||||||
| Patient or population: ventilated preterm infants with failure of initial non‐invasive respiratory support | ||||||
| Outcomes | Illustrative comparative risks* (95% CI) | Relative effect | No of participants | Certainty of the evidence | Comments | |
|---|---|---|---|---|---|---|
| Assumed risk | Corresponding risk | |||||
| NIPPV | nHFV | |||||
| Mortality before hospital discharge | 43 per 1000 | 63 per 1000 | RR 1.44 | 39 | ⊕⊕⊝⊝ | |
| Endotracheal intubation To discharge | 304 per 1000 | 374 per 1000 | RR 1.23 | 39 | ⊕⊝⊝⊝ | |
| Chronic lung disease | 739 per 1000 | 747 per 1000 | RR 1.01 | 39 | ⊕⊕⊝⊝ | |
| Death or chronic lung disease | See comment | See comment | Not estimable | 0 | See comment | Not reported |
| Intraventricular haemorrhage, Papile grade 3/4 | 43 per 1000 | 20 per 1000 | RR 0.47 | 39 | ⊕⊕⊝⊝ | |
| Neurodevelopmental disability | See comment | See comment | Not estimable | 0 | See comment | Not reported |
| *The corresponding risk (and its 95% confidence interval) is based on the assumed risk in the comparison group and the relative effect of the intervention (and its 95% CI). | ||||||
| GRADE Working Group certainty of evidence | ||||||
| 1 Downgraded two levels for serious imprecision due to a single small study with few events, and confidence intervals included appreciable benefit or harm 2 Downgraded one level for risk of bias (unblinded study/subjective outcome measure) 3 A single event of Intraventricular haemorrhage, Papile grade 3/4, was reported amongst the nasal intermittent positive pressure ventilation (nIPPV) group. | ||||||
| Study | Country/total participants | Eligibility criteria | Gestational age weeks/birthweight g | Intervention group | Control group | Interface (in both intervention and control groups) | |||
| Intervention group | Control group | Mode | Settings | Mode | Settings | ||||
| China 80 | RDS | 30.46 +/‐ 1.35 weeks | 30.37 +/‐ 1.31 weeks | nHFOV with surfactant | Ventilator: Stephanie, Servo‐a MAP: 10 to 12 cm H2O Frequency: 12 to 15 Hz Amplitude: 30 to 45 cm H2O | Invasive respiratory support (conventional mechanical ventilation) with surfactant | Ventilator: Maquet PIP: 15 to 25 cm H2O PEEP: PEEP 4 to 6 cm H2O Respiratory Rate: 40 to 60 bpm | Not reported | |
| China 100 | RDS | 31.05 +/‐ 1.26 (range 25 to 35) weeks | 31.02+/‐1.24 (range 28 to 35) weeks | nHFOV | Ventilator: Medin CNO, Germany MAP: 5 to 10 cm H2O Frequency: 7 to 10 Hz Amplitude: 4 to 10 cm H2O | Invasive respiratory support (conventional mechanical ventilation) | Ventilator: Drager Babylog VN500 PIP: 15 to 25 cm H2O PEEP: 4 to 8 cm H2O Respiratory rate: 30 to 40 bpm | Not reported | |
| bpm: breaths per minute; hz: hertz; MAP: mean airway pressure; nHFOV: non‐invasive high‐frequency oscillatory ventilation; PEEP: positive end‐expiratory pressure; PIP: positive inspiratory pressure; RDS: respiratory distress syndrome | |||||||||
| Study | Country total participants | Gestation and weight eligibility criteria | Gestational age weeks/birthweight g | Intervention group | Control group | Interface (in both intervention and control groups) | |||
| Intervention group | Control group | Mode | Settings | Mode | Settings | ||||
| France 46 | ≥ 37 weeks ≥ 2000 g | 38 +/‐ 0.5 weeks 3004 +/‐ 116 g | 37 +/‐ 0.5 weeks 3375 +/‐ 160 g | nHFPV | Ventilator: Percussionaire MAP: 5 cm H2O Frequency: 5 Hz Amplitude: 2 to 35 cm H2O | nCPAP | Ventilator: Babylog 8000 PEEP: 5 cm H2O | Single heated humidified nasal probe | |
| Egypt 60 | GA between 28 + 0 and 33 + 6 weeks | Not stated | Not stated | nHFOV | Ventilator: SLE5000, UK MAP: NS Frequency: NS Amplitude: NS | nCPAP | Ventilator: Medin CNO, medin Medical Innovations GmbH, Olching, Germany) or (SLE 1000, SLE Limited, UK) PEEP: NS | nCPAP via binasal prongs nHFOV via nasopharyngeal tube | |
| Iran 68 | 30 to 36 + 6/7 weeks | 33 (IQR 30–34) weeks 1959 (613) g | 33 (IQR 31–35) weeks 2161 (764) g | nHFOV | Ventilator: Fabian MAP: 8 cmH2O Frequency: 10 to 20 Hz Amplitude: 20 cm H2O | nCPAP | Ventilator: Fabian PEEP: 6 to 7 cm H2O | Short binasal prongs | |
| Iran 124 | 28 to 34 weeks | 31.08 ± 2.9 weeks 1486 ± 470 g | 31.07 ± 2.8 weeks 1506 ± 490 g | nHFOV | Ventilator: CNO driver MAP: 8 cm H2O Frequency: 5 Hz Amplitude: 3 to 7 cm H2O | nCPAP | Ventilator: Flow‐driver (Sindi NCPAP driver) PEEP: 4 to 8 cm H2O | Short binasal prongs | |
| China 74 | RDS | NR | NR | nHFOV | Ventilator: Medin CNO MAP: 8 to 12 cm H2O Frequency: 7 to 12 Hz Amplitude: 2 to 3 times MAP with visible chest oscillation | nCPAP | PEEP: 5 to 7 cm H2O | Not reported | |
| Turkey 37 | < 32 weeks | Median 29 (range 27 to 34) weeks Median 1250 (range 800 to 2240) g | Median 28 (range 26 to 32) weeks Median 1240 (range 580 to 2010) g | nHFOV | Ventilator: Babylog 8000 MAP: 6 cm H2O Frequency: 10 Hz Amplitude: deltaP 100% | nCPAP | Ventilator: bubble CPAP system PEEP: 5 to 6 cm H2O | Short binasal prongs | |
| China 102 | 26 to 42 weeks | 26 to 42 (34.52 +/‐ 2.98) weeks | 26‐39 (34.25 +/‐ 3.14) | nHFOV | Ventilator: SLE 5000 MAP: 8 to 12 cm H20 Frequency: 7 to 12 Hz Amplitude not reported | nCPAP | Ventilator: NV8 PEEP: 5 to 7 cm H2O | Not reported | |
| China 340 | 26 to 33 + 6/7 weeks | 30.6 +/‐ 1.7 weeks 1564 +/‐ 367 g | 30.9 +/‐ 1.8 weeks 1582 +/‐ 343 g | nHFOV | Ventilator: CNO MAP: 6 [6 to 10] cm H2O Frequency: 8 [8 to 12] Hz Amplitude: level 7 (range 7 to 10) or Ventilator: SLE5000 MAP: 6 [6 to 10] cm H2O Frequency: 8 [8 to 12] Hz Amplitude: 20 [20 to 35) cm H2O | nCPAP | Ventilator: CNO or SLE5000 PEEP: 6 [6 to 8] cm H2O | Short binasal prongs | |
| China 65 | 28 to 35 weeks | 33.5 ± 1.5 weeks 1790 ± 330 g | 34.2 ± 1.6 weeks 1840 ± 420 g | nHFOV | Ventilator: SLE Baby 5000, Germany MAP: 6 to 12 cm H2O Frequency: 6 to 12 Hz Amplitude: 2 to 3 times MAP | BP‐CPAP (considered to be equivalent to nIPPV) | Ventilator: Fabian, Swiss PIP: 12 to 15 cm H2O PEEP: 5 cm H2O Rate: | Short binasal prongs | |
| China 82 | < 37 weeks | 33.2 ± 1.4 weeks 1820 ± 330 g | 33.5 ± 1.5 weeks 1840 ± 410 g | nHFOV with thin‐catheter surfactant | Ventilator: SLE5000 MAP: 8 cm H2O Frequency: 7 to 12 Hz Amplitude: 16 to 24 cm H2O | BiPAP (considered to be equivalent to nIPPV) with thin‐catheter surfactant | Ventilator: Fabian PIP: 12 to 15 cm H2O PEEP: 5 cm H2O Rate: 30 to 40 bpm | Not reported | |
| China 60 | RDS | 30.73 +/‐ 1.31 weeks | 30.46 +/‐ 1.35 weeks | nHFOV | Ventilator: Sophie MAP: 8 to 12 cm H2O Frequency: 10 to 15 Hz Amplitude: 30 to 40 cm | nIPPV | Ventilator: Sophie PIP: 15 to 25 cm H20 PEEP: 4 to 6 cm H20 | Not reported | |
| China 120 | < 31 weeks < 1500 g | 28.56 ± 1.23 weeks 1150 ± 135 g | 28.71 ± 1.18 weeks 1188 ± 142 g | nHFOV | Not reported | nIPPV | Not reported | Not reported | |
| Pakistan 48 | 27 to 34 weeks | 29.96 ± 2.38 weeks 1347 ± 458 g | 43.58 ± 61.03 weeks 1672 ± 534 g | nHFOV with surfactant administration via InSurE | Ventilator: CNO Medin MAP: 6 (range 6‐10) cm H2O Frequency: 8 (range 8‐12) Hz Amplitude: 7 (range 7‐10) cm H2O | nIPPV with surfactant administration via InSurE | Ventilator: CNO Medin PIP: 15 (range 1‐25) H2O PEEP: 6 (range 1‐8) cm H2O Rate: 40 (range 5‐60) bpm Inspiratory time (IT): 0.40 s | Nasal mask | |
| China 60 | 28 to 34 weeks | 31.38 ± 1.60 weeks 1656 ± 423 g | 31.78 ± 1.55 weeks 1572 ± 370 g | nHFOV with non‐invasive surfactant | Ventilator: Leoni Plus MAP: 6 to 12 cm H2O Frequency: 6 to 12 Hz Amplitude: 2 times MAP with visible chest oscillation | nIPPV with non‐invasive surfactant | Ventilator: Leoni Plus PIP: 15 to 25 cm H2O PEEP: 4 to 6 cm H2O Rate: 15 to 30 bpm | Not reported | |
| Turkey 37 | < 32 weeks | Median 29 (range 27 to 34) weeks Median 1250 (range 800 to 2240) g | Median 28 (26 to 32) weeks Median 1130 (range 530 to 2550) g | nHFOV | Ventilator: Babylog 8000 MAP: 6 cm H2O Frequency: 10 Hz Amplitude: deltaP 100% | nIPPV | Ventilator: Babylog 8000 PIP: 15 to 20 cm H2O PEEP: 5 to 6 cm H2O Rate: 25 to 30 bpm | Short binasal prongs | |
| China 41 | Newborns with PPHN | 35.0 +/‐ 1.8 weeks 1900 +/‐ 300 g | 34.2 +/‐ 2.0 weeks 1800 +/‐ 200 g | nHFOV | MAP: 6 to 10 cm H2O Frequency: 6 to 12 Hz Amplitude: 2 to 3 times the MAP | nIPPV | PIP: 15 to 20 cm H2O PEEP: 4 to 6 cm H2O Rate: 25 to 50 bpm | Not reported | |
| China 43 | < 36 weeks | 32.82 ± 1.87 weeks/ 2088.86 ± 583.37 g | 32.57 ± 2.69 weeks/ 2125.24 ± 781.48 g | nHFOV with non‐invasive surfactant | MAP: 6 to 12 cm H2O Frequency: 6 to 12 Hz Amplitude: 2 to 3 times the MAP | Duo positive airway pressure (DuoPAP; Bilevel positive airway pressure) with non‐invasive surfactant (considered to be equivalent to nIPPV) | PIP: 12 to 15 cm H2O PEEP: 5 cm H2O Rate: 30 to 40 bpm | Not reported | |
| Turkey 37 | < 32 weeks | Median 29 (range 27 to 34) weeks Median 1250 (range 800 to 2240) g | Median 28 (range 26 to 32) weeks Median 1190 (range 600 to 2010) g | nHFOV | Ventilator: Babylog 8000 MAP: 6 cm H2O Frequency: 10 Hz Amplitude: deltaP 100% | HFNC | Ventilator: Precision Flow, Vapotherm (5 L/min) | Short binasal prongs | |
| BiPAP: bilevel positive airway pressure; BP‐CPAP: bi‐level pressure continuous positive airway pressure; bpm: beats per minute; CNO: MedicinCNO device manufacturer; DuoPAP: Duo positive airway pressure; GA: gestational age; InSurE: Intubate, Surfactant, Extubate; IQR: interquartile range; IT: Inspiratory time; MAP: mean airway pressure; MV: mechanical ventilation; HFNC: Heated humidified high‐flow nasal cannula; nCPAP: nasal continuous positive airway pressure; nHFOV: non‐invasive high‐frequency oscillatory ventilation; nHFPV: non‐invasive high‐frequency percussive ventilation; nIPPV: non‐invasive intermittent positive‐pressure ventilation; NR: not reported; NS: not stated; PEEP: positive end‐expiratory pressure; PIP: positive inspiratory pressure; PPHN: Persistent pulmonary hypertension of the newborn; RDS: respiratory distress syndrome. *4‐arm trial (nHFOV versus NIPPV versus nCPAP versus HFNC) | |||||||||
| Study | Country total participants | Eligibility criteria | Gestational age weeks/birthweight g | Intervention group | Control group | Interface (in both intervention and control groups) | |||
| Intervention group | Control group | Mode | Settings | Mode | Settings | ||||
| China 65 | Ventilated infants with respiratory distress | 32.5 ± 1.3 weeks 1790 ± 350 g | 32.4 ± 1.4 weeks 1850 ± 410 g | nHFOV | Ventilator: SLE baby 5000, Germany MAP: 5 to 7 cm H2O Frequency: 6 to 12 Hz Amplitude: 2 to 3 times MAP | nCPAP | Ventilator: Stephan, Germany PEEP: 4 to 6 cm H2O | Short binasal prongs | |
| China 81 | Ventilated infants 28 to 34 weeks | 31.7 ± 1.7 weeks 1670 ± 353 g | 32.0 ± 1.9 weeks 1735 ± 327 g | nHFOV | Ventilator: CNO driver MAP: 6 cm H2O Frequency: 10 Hz Amplitude: visible chest oscillation | nCPAP | Ventilator: Bubble CPAP system PEEP: 6 cm H2O | Short binasal prongs | |
| China 206 | Ventilated infants < 37 weeks | 32.4 +/‐ 2.4 weeks 1859 +/‐ 569 g | 32.8 +/‐ 2.4 weeks 1917 +/‐ 478 g | nHFOV | Ventilator: SLE5000 MAP: 10 cm H2O Frequency: 10 Hz Amplitude: 35 cm H2O | nCPAP | Ventilator: Bubble CPAP system PEEP: 6 to 8 cm H2O | Short binasal prongs | |
| Germany 6 | Ventilated infants < 32 weeks < 1500 g | 25 (range 23 + 4/7 to 26 + 3/7) weeks 503 (420 to 568) g | 24 (range 23 + 6/7 to 24 + 6/7) weeks 668 (550 to 786) g | nHFOV | Ventilator: SLE5000 MAP: 8 cm H2O Frequency: 9 to 10 Hz Amplitude: 20 to 30 cm H2O | nCPAP | Ventilator: SLE 5000 PEEP: 8 cm H2O | Short binasal prongs | |
| China 114 | Ventilated infants 26 to 31 + 6/7 weeks < 1500 g | 30.6 +/‐ 1.3 weeks 1257 +/‐ 340 g | 30.8 +/‐ 1.4 weeks 1282 +/‐ 354 g | nHFOV | Ventilator: SLE5000 MAP: 8 to 14 cm H2O Frequency: 8 to 12 Hz Amplitude: 20 to 35 cm H2O | nCPAP | PEEP: 6 to 8 cm H2O | Binasal prongs | |
| China 80 | Ventilated infants with RDS | 3330 ± 240 g (range 2500 to 4200) g | 3410 ± 180 g (range 2600 to 4600) g | nHFOV | MAP: 2 to 4 cm H2O higher than MAP prior to extubation Frequency: 6 to 12 Hz Amplitude: 2.5 to 3 times the value for MAP | nCPAP | PEEP: 4 to 6 cm H2O | Not reported | |
| China 98 | Ventilated infants 25 to 33 + 6/7 weeks < 1500 g | 29.0 +/‐ 1.9 weeks 1118 +/‐ 202 g | 29.0 +/‐ 1.7 weeks 1132 +/‐ 203 g | nHFOV | Ventilator: Fabian HFO MAP: 10 cm H2O Frequency: 10 [6 to 12] Hz Amplitude: 25 [25 to 50] cm H2O | nCPAP | Ventilator: Fabian PEEP: 5 [3 to 8] cm H2O | Short binasal prongs | |
| China 68 | Ventilated preterm infants | 28.42 +/‐ 1.15 weeks | 28.36 +/‐ 1.24 weeks | nHFOV | MAP: Range 8 to 14 cm H2O Frequency: 8 to 12 Hz Amplitude: 20 to 35 cm H2O | nCPAP | PEEP: 6 to 8 cm H2O | Not reported | |
| China 240 | Ventilated infants < 37 weeks | 31.02 ± 1.88 weeks 1440 ± 300 g | 30.31 ± 1.58 weeks 1390 ± 320 g | nHFOV | Ventilator: Löwenstein Leoni plus MAP: 8 [6 to 12] cm H2O Frequency: 6 to 12 Hz Amplitude: 2 to 3 times MAP with visible chest oscillation | nCPAP | Ventilator: F.STEPHAN PEEP: 4 to 6 cm H2O | Not reported | |
| China 70 | Ventilated infants 32 to 36 weeks | 33.8 +/‐ 0.8 weeks 1985 +/‐ 246 g | 33.6 +/‐ 1.1 weeks 1878 +/‐ 325 g | nHFOV | Ventilator: SLE5000 MAP: range 8 to 14 cm H2O Frequency: 8 to 12 Hz Amplitude: 20 to 35 cm H2O | nCPAP | Ventilator: NV8 PEEP: 3 to 8 cm H2O | Not reported | |
| China 998 | Ventilated infants 25 to 32 + 6/7 weeks | 29.4 +/‐ 1.8 weeks 1334 +/‐ 366 g | 29.5 +/‐ 1.7 weeks 1341 +/‐ 318 g | nHFOV | Ventilator: Piston/membrane oscillator MAP: 5 to 16 cm H2O Frequency: 8 to 10 Hz Amplitude: titrated to PaCO2 | nCPAP | Ventilator: PEEP: 5 to 8 cm H2O | Short binasal prongs | |
| Ukraine 24 | Ventilated infants ≤ 32 weeks ≤ 1500 g | 27.75 +/‐ 2.41 weeks 918 +/‐ 227 g | 27.66 +/‐ 1.66 weeks 1034 +/‐ 177 g | nHFOV | Ventilator: CNO driver MAP: 6 to 8 cm H2O Frequency: 10 Hz Amplitude: visible chest oscillation | nIPPV | Ventilator: Servo‐I PIP: 6 to 12 cm H2O PEEP: 4 to 8 cm H2O Rate: 15 to 25 bpm | Long or short binasal prongs or mask | |
| China 42 | Ventilated infants with RDS | 30.86 +/‐ 3.01 weeks | 31.02 +/‐ 3.23 weeks | nHFOV | MAP: < 14 cm H2O Amplitude: Amplitude set at visible oscillation noted at neck and chest area | nIPPV | PIP: 15 to 20 cm H2O PEEP: 4 to 6 cm H20 Rate: 40 bpm | Not reported | |
| China 98 | Ventilated infants 25 to 33 + 6/7 weeks < 1500 g | 29.0 +/‐ 1.9 weeks 1118 +/‐ 202 g | 28.9 +/‐ 2.0 weeks 1088 +/‐ 154 g | nHFOV | Ventilator: Fabian HFO MAP: 10 cm H2O Frequency: 10 [6 to 12] Hz Amplitude: 25 [25 to 50] cm H2O | nIPPV | Ventilator: Comen NV8 PIP: 15 [15 to 25] cm H2O PEEP: 4 [4 to 8] cm H2O Rate: 30 [15 to 40] bpm | Short binasal prongs | |
| India 42 | Ventilated infants 26 to 36 + 6/7 weeks | Median 32 (IQR 28 to 35) weeks Median 1500 (1120 to 2140) g | Median 31 (IQR 29 to 35) weeks Median 1495 (980 to 2214) g | nHFOV | Ventilator: SLE6000 MAP: 8 to 10 cm H2O Frequency: 10 to 12 Hz Amplitude: 25 to 35 cm H2O with visible chest oscillation | nIPPV | Ventilator: Dragger Babylog 8000 PIP: 2 cm H2O above pre‐extubation PIP PEEP: 4 to 6 cm H2O Rate: 40 to 50 bpm | Short binasal prongs or masks | |
| China 240 | Ventilated infants < 37 weeks | 31.02 ± 1.88 weeks 1440 ± 300 g | 30.82 ± 1.60 weeks 1430 ± 330 g | nHFOV | Ventilator: Löwenstein Leoni plus MAP: 8 [6 to 12] cm H2O Frequency: 6 to 12 Hz Amplitude: 2 to 3 times MAP with visible chest oscillation | nIPPV | nIPPV Ventilator: COMEN NV8 PIP: 10 cm H2O PEEP: 5 to 6 cm H2O Rate: 25 to 30 bpm | Not reported | |
| China 992 | Ventilated infants 25 to 32 + 6/7 weeks | nHFOV | Ventilator: Piston/membrane oscillator MAP: 5 to 16 cm H2O Frequency: 8 to 10 Hz Amplitude: titrated to PaCO2 | nIPPV | nIPPV Ventilator: any neonatal ventilator PIP: 10 to 25 cm H2O PEEP: 5 to 8 cm H2O Rate: 30 to 40 bpm | Short binasal prongs | |||
| CNO: MedicinCNO device manufacturer; IQR: interquartile range; MAP: mean airway pressure; MV: mechanical ventilation; nCPAP: nasal continuous positive airway pressure; nHFOV: non‐invasive high‐frequency oscillatory ventilation; nIPPV: non‐invasive intermittent positive‐pressure ventilation; NR: not reported; PaCO2: arterial partial pressure of carbon dioxide; PEEP: positive end‐expiratory pressure; PIP: positive inspiratory pressure; RDS: respiratory distress syndrome *3‐arm trials (nHFOV versus NIPPV versus nCPAP) | |||||||||
| Study | Country total participants | Eligibility criteria | Gestational age weeks/birthweight g | Intervention group | Control group | Interface (in both intervention and control groups) | |||
| Intervention group | Control group | Mode | Settings | Mode | Settings | ||||
| Canada 26 | Birthweight < 1250 g Current weight < 2000 g Failed nCPAP | 26.1 +/‐ 1.3 weeks gestation Birthweight 832 +/‐ 150 g PMA 28.6 +/‐ 1.5 weeks | 26.5 +/‐ 1.6 weeks gestation Birthweight 878 +/‐ 198 g PMA 29.0 +/‐ 2.3 weeks | nHFOV | Ventilator: Drager VN500, Lubeck, Germany MAP: 8 to 10 cm H2O Frequency: 5 to 14 Hz Amplitude: visible chest oscillation | BP‐CPAP (considered to be equivalent to nIPPV) | Ventilator: Infant‐Flow device PIP: 8 [7 to 10] cm H2O PEEP: 5 [7 to 10] cm H2O Rate: 20 to 30 bpm | Short binasal prongs or masks | |
| bpm: breaths per minute; BP‐CPAP: bi‐level pressure continuous positive airway pressure; MAP: mean airway pressure; nCPAP: nasal continuous positive airway pressure; nHFOV: non‐invasive high‐frequency oscillatory ventilation; niPPV: nasal intermittent positive‐pressure ventilation; PEEP: positive end‐expiratory pressure; PIP: positive inspiratory pressure; PMA: postmenstrual age | |||||||||
| Outcome or subgroup title | No. of studies | No. of participants | Statistical method | Effect size |
| 1.1 Mortality before hospital discharge Show forest plot | 1 | 80 | Risk Ratio (M‐H, Fixed, 95% CI) | 0.67 [0.20, 2.18] |
| 1.2 Duration of respiratory support, days Show forest plot | 1 | 80 | Mean Difference (IV, Fixed, 95% CI) | ‐0.43 [‐0.59, ‐0.27] |
| 1.3 Chronic lung disease at 36 weeks Show forest plot | 2 | 180 | Risk Ratio (M‐H, Fixed, 95% CI) | 0.38 [0.09, 1.59] |
| 1.4 Pulmonary air leak syndromes Show forest plot | 2 | 180 | Risk Ratio (M‐H, Fixed, 95% CI) | 0.25 [0.05, 1.14] |
| 1.5 Length of hospital stay, days Show forest plot | 1 | 80 | Mean Difference (IV, Fixed, 95% CI) | ‐6.68 [‐8.08, ‐5.28] |
| Outcome or subgroup title | No. of studies | No. of participants | Statistical method | Effect size |
| 2.1 Mortality before hospital discharge Show forest plot | 5 | Risk Ratio (M‐H, Fixed, 95% CI) | Subtotals only | |
| 2.1.1 nHFV versus nCPAP | 4 | 531 | Risk Ratio (M‐H, Fixed, 95% CI) | 1.00 [0.41, 2.41] |
| 2.1.2 nHFV versus nIPPV | 2 | 84 | Risk Ratio (M‐H, Fixed, 95% CI) | 1.86 [0.90, 3.83] |
| 2.1.3 nHFV versus HFNC | 1 | 37 | Risk Ratio (M‐H, Fixed, 95% CI) | Not estimable |
| 2.2 Endotracheal intubation Show forest plot | 9 | Risk Ratio (M‐H, Fixed, 95% CI) | Subtotals only | |
| 2.2.1 nHFV versus nCPAP | 5 | 571 | Risk Ratio (M‐H, Fixed, 95% CI) | 0.52 [0.33, 0.82] |
| 2.2.2 nHFV versus nIPPV | 5 | 228 | Risk Ratio (M‐H, Fixed, 95% CI) | 1.33 [0.76, 2.34] |
| 2.2.3 nHFV versus HFNC | 1 | 37 | Risk Ratio (M‐H, Fixed, 95% CI) | 2.94 [0.65, 13.27] |
| 2.3 Trauma to the nostrils and upper airway Show forest plot | 3 | Risk Ratio (M‐H, Fixed, 95% CI) | Subtotals only | |
| 2.3.1 nHFV versus nCPAP | 2 | 161 | Risk Ratio (M‐H, Fixed, 95% CI) | 1.03 [0.72, 1.47] |
| 2.3.2 nHFV versus nIPPV | 2 | 118 | Risk Ratio (M‐H, Fixed, 95% CI) | 0.98 [0.68, 1.40] |
| 2.3.3 nHFV versus HFNC | 1 | 37 | Risk Ratio (M‐H, Fixed, 95% CI) | 2.35 [1.25, 4.45] |
| 2.4 Failure of respiratory support Show forest plot | 3 | Risk Ratio (M‐H, Fixed, 95% CI) | Subtotals only | |
| 2.4.1 nHFV versus nCPAP | 3 | 463 | Risk Ratio (M‐H, Fixed, 95% CI) | 0.57 [0.36, 0.90] |
| 2.4.2 nHFV versus nIPPV | 1 | 36 | Risk Ratio (M‐H, Fixed, 95% CI) | 2.79 [0.62, 12.57] |
| 2.4.3 nHFV versus HFNC | 1 | 37 | Risk Ratio (M‐H, Fixed, 95% CI) | 2.94 [0.65, 13.27] |
| 2.5 Duration of respiratory support, days Show forest plot | 10 | Mean Difference (IV, Fixed, 95% CI) | Subtotals only | |
| 2.5.1 nHFV vs nCPAP | 6 | 707 | Mean Difference (IV, Fixed, 95% CI) | ‐0.48 [‐0.55, ‐0.40] |
| 2.5.2 nHFV versus nIPPV | 5 | 269 | Mean Difference (IV, Fixed, 95% CI) | 0.22 [‐0.58, 1.01] |
| 2.5.3 nHFV versus HFNC | 1 | 37 | Mean Difference (IV, Fixed, 95% CI) | ‐6.40 [‐14.74, 1.94] |
| 2.6 Duration of oxygen therapy, days Show forest plot | 6 | Mean Difference (IV, Fixed, 95% CI) | Subtotals only | |
| 2.6.1 nHFV versus nCPAP | 3 | 466 | Mean Difference (IV, Fixed, 95% CI) | 0.03 [‐0.05, 0.11] |
| 2.6.2 nHFV versus nIPPV | 3 | 185 | Mean Difference (IV, Fixed, 95% CI) | ‐0.65 [‐1.13, ‐0.17] |
| 2.7 Chronic lung disease at 36 weeks Show forest plot | 8 | Risk Ratio (M‐H, Fixed, 95% CI) | Subtotals only | |
| 2.7.1 nHFV versus nCPAP | 4 | 481 | Risk Ratio (M‐H, Fixed, 95% CI) | 1.35 [0.80, 2.27] |
| 2.7.2 nHFV versus nIPPV | 5 | 307 | Risk Ratio (M‐H, Fixed, 95% CI) | 0.63 [0.42, 0.95] |
| 2.7.3 nHFV versus HFNC | 1 | 37 | Risk Ratio (M‐H, Fixed, 95% CI) | 1.18 [0.46, 2.98] |
| 2.8 Death or chronic lung disease at 36 weeks Show forest plot | 1 | 68 | Risk Ratio (M‐H, Fixed, 95% CI) | 2.50 [0.52, 12.01] |
| 2.8.1 nHFV versus nCPAP | 1 | 68 | Risk Ratio (M‐H, Fixed, 95% CI) | 2.50 [0.52, 12.01] |
| 2.9 Patent ductus arteriosus Show forest plot | 3 | Risk Ratio (M‐H, Fixed, 95% CI) | Subtotals only | |
| 2.9.1 nHFV versus nCPAP | 2 | 105 | Risk Ratio (M‐H, Fixed, 95% CI) | 0.68 [0.29, 1.62] |
| 2.9.2 nHFV versus nIPPV | 2 | 84 | Risk Ratio (M‐H, Fixed, 95% CI) | 0.67 [0.19, 2.40] |
| 2.9.3 nHFV versus HFNC | 1 | 37 | Risk Ratio (M‐H, Fixed, 95% CI) | 1.18 [0.27, 5.09] |
| 2.10 Pulmonary air leak syndromes Show forest plot | 10 | Risk Ratio (M‐H, Fixed, 95% CI) | Subtotals only | |
| 2.10.1 nHFV versus nCPAP | 6 | 645 | Risk Ratio (M‐H, Fixed, 95% CI) | 2.01 [0.70, 5.75] |
| 2.10.2 nHFV versus nIPPV | 5 | 267 | Risk Ratio (M‐H, Fixed, 95% CI) | 0.66 [0.27, 1.66] |
| 2.10.3 nHFV versus HFNC | 1 | 37 | Risk Ratio (M‐H, Fixed, 95% CI) | 3.50 [0.15, 80.71] |
| 2.11 Proven sepsis Show forest plot | 2 | Risk Ratio (M‐H, Fixed, 95% CI) | Subtotals only | |
| 2.11.1 nHFV versus nCPAP | 2 | 77 | Risk Ratio (M‐H, Fixed, 95% CI) | 0.88 [0.38, 2.04] |
| 2.11.2 nHFV versus nIPPV | 1 | 36 | Risk Ratio (M‐H, Fixed, 95% CI) | 0.75 [0.34, 1.66] |
| 2.11.3 nHFV versus HFNC | 1 | 37 | Risk Ratio (M‐H, Fixed, 95% CI) | 1.01 [0.42, 2.43] |
| 2.12 Necrotising enterocolitis Show forest plot | 4 | Risk Ratio (M‐H, Fixed, 95% CI) | Subtotals only | |
| 2.12.1 nHFV versus nCPAP | 3 | 407 | Risk Ratio (M‐H, Fixed, 95% CI) | 1.19 [0.52, 2.69] |
| 2.12.2 nHFV versus nIPPV | 2 | 84 | Risk Ratio (M‐H, Fixed, 95% CI) | 0.63 [0.09, 4.64] |
| 2.12.3 nHFV versus HFNC | 1 | 37 | Risk Ratio (M‐H, Fixed, 95% CI) | 0.23 [0.01, 4.55] |
| 2.13 Necrotising enterocolitis (NEC) (Bell stage ≥ 2) Show forest plot | 1 | 43 | Risk Ratio (M‐H, Fixed, 95% CI) | Not estimable |
| 2.13.1 nHFV versus nIPPV | 1 | 43 | Risk Ratio (M‐H, Fixed, 95% CI) | Not estimable |
| 2.14 Spontaneous intestinal perforation Show forest plot | 1 | 48 | Risk Ratio (M‐H, Fixed, 95% CI) | Not estimable |
| 2.14.1 nHFV versus nIPPV | 1 | 48 | Risk Ratio (M‐H, Fixed, 95% CI) | Not estimable |
| 2.15 Intraventricular haemorrhage, any Show forest plot | 7 | Risk Ratio (M‐H, Fixed, 95% CI) | Subtotals only | |
| 2.15.1 nHFV versus nCPAP | 3 | 179 | Risk Ratio (M‐H, Fixed, 95% CI) | 0.42 [0.16, 1.13] |
| 2.15.2 nHFV versus nIPPV | 5 | 288 | Risk Ratio (M‐H, Fixed, 95% CI) | 0.61 [0.30, 1.22] |
| 2.15.3 nHFV versus HFNC | 1 | 37 | Risk Ratio (M‐H, Fixed, 95% CI) | 0.23 [0.01, 4.55] |
| 2.16 Intraventricular haemorrhage, Papile grade 3/4 Show forest plot | 4 | Risk Ratio (M‐H, Fixed, 95% CI) | Subtotals only | |
| 2.16.1 nHFV versus nCPAP | 4 | 531 | Risk Ratio (M‐H, Fixed, 95% CI) | 1.17 [0.36, 3.78] |
| 2.16.2 nHFV versus nIPPV | 1 | 36 | Risk Ratio (M‐H, Fixed, 95% CI) | Not estimable |
| 2.16.3 nHFV versus HFNC | 1 | 37 | Risk Ratio (M‐H, Fixed, 95% CI) | Not estimable |
| 2.17 Periventricular leukomalacia Show forest plot | 1 | 43 | Risk Ratio (M‐H, Fixed, 95% CI) | 0.95 [0.44, 2.07] |
| 2.17.1 nHFV versus nIPPV | 1 | 43 | Risk Ratio (M‐H, Fixed, 95% CI) | 0.95 [0.44, 2.07] |
| 2.18 Retinopathy of prematurity, any Show forest plot | 3 | Risk Ratio (M‐H, Fixed, 95% CI) | Subtotals only | |
| 2.18.1 nHFV versus nCPAP | 1 | 74 | Risk Ratio (M‐H, Fixed, 95% CI) | 0.70 [0.12, 3.97] |
| 2.18.2 nHFV versus nIPPV | 2 | 168 | Risk Ratio (M‐H, Fixed, 95% CI) | 0.54 [0.30, 0.98] |
| 2.19 Retinopathy of prematurity, stage ≥ 3 Show forest plot | 1 | 302 | Risk Ratio (M‐H, Fixed, 95% CI) | 0.77 [0.29, 2.01] |
| 2.19.1 nHFV versus nCPAP | 1 | 302 | Risk Ratio (M‐H, Fixed, 95% CI) | 0.77 [0.29, 2.01] |
| 2.20 Length of hospital stay, days Show forest plot | 6 | Mean Difference (IV, Fixed, 95% CI) | Subtotals only | |
| 2.20.1 nHFV versus nCPAP | 4 | 602 | Mean Difference (IV, Fixed, 95% CI) | ‐4.07 [‐4.46, ‐3.67] |
| 2.20.2 nHFV versus nIPPV | 2 | 125 | Mean Difference (IV, Fixed, 95% CI) | ‐4.34 [‐6.22, ‐2.47] |
| Outcome or subgroup title | No. of studies | No. of participants | Statistical method | Effect size |
| 3.1 Mortality before hospital discharge Show forest plot | 4 | Risk Ratio (M‐H, Fixed, 95% CI) | Subtotals only | |
| 3.1.1 nHFV versus nCPAP ‐ preterm infants | 4 | 531 | Risk Ratio (M‐H, Fixed, 95% CI) | 1.00 [0.41, 2.41] |
| 3.1.2 nHFV versus nCPAP ‐ nHFV MAP < 10 cm H2O | 4 | 531 | Risk Ratio (M‐H, Fixed, 95% CI) | 1.00 [0.41, 2.41] |
| 3.1.3 nHFV versus nCPAP ‐ nHFV Hz ≥ 10 | 2 | 105 | Risk Ratio (M‐H, Fixed, 95% CI) | 0.39 [0.02, 8.97] |
| 3.1.4 nHFV versus nCPAP ‐ nHFV Hz < 10 | 1 | 124 | Risk Ratio (M‐H, Fixed, 95% CI) | 0.73 [0.17, 3.11] |
| 3.2 Endotracheal intubation Show forest plot | 5 | Risk Ratio (M‐H, Fixed, 95% CI) | Subtotals only | |
| 3.2.1 nHFV versus nCPAP ‐ term or near‐term infants | 1 | 40 | Risk Ratio (M‐H, Fixed, 95% CI) | Not estimable |
| 3.2.2 nHFV versus nCPAP ‐ preterm infants | 4 | 531 | Risk Ratio (M‐H, Fixed, 95% CI) | 0.52 [0.33, 0.82] |
| 3.2.3 nHFV versus nCPAP ‐ nHFV MAP < 10 cm H2O | 5 | 571 | Risk Ratio (M‐H, Fixed, 95% CI) | 0.52 [0.33, 0.82] |
| 3.2.4 nHFV versus nCPAP ‐ nHFV Hz ≥ 10 | 2 | 105 | Risk Ratio (M‐H, Fixed, 95% CI) | 0.50 [0.21, 1.18] |
| 3.2.5 nHFV versus nCPAP ‐ nHFV Hz < 10 | 2 | 164 | Risk Ratio (M‐H, Fixed, 95% CI) | 0.43 [0.14, 1.32] |
| 3.3 Failure of respiratory support Show forest plot | 3 | Risk Ratio (M‐H, Fixed, 95% CI) | Subtotals only | |
| 3.3.1 nHFV versus nCPAP ‐ preterm infants | 3 | 463 | Risk Ratio (M‐H, Fixed, 95% CI) | 0.57 [0.36, 0.90] |
| 3.3.2 nHFV versus nCPAP ‐ nHFV MAP < 10 cm H2O | 3 | 463 | Risk Ratio (M‐H, Fixed, 95% CI) | 0.57 [0.36, 0.90] |
| 3.3.3 nHFV versus nCPAP ‐ nHFV Hz ≥ 10 | 1 | 37 | Risk Ratio (M‐H, Fixed, 95% CI) | 0.74 [0.30, 1.83] |
| 3.3.4 nHFV versus nCPAP ‐ nHFV Hz < 10 | 1 | 124 | Risk Ratio (M‐H, Fixed, 95% CI) | 0.43 [0.14, 1.32] |
| 3.4 Chronic lung disease at 36 weeks Show forest plot | 4 | Risk Ratio (M‐H, Fixed, 95% CI) | Subtotals only | |
| 3.4.1 nHFV versus nCPAP ‐ preterm infants | 4 | 481 | Risk Ratio (M‐H, Fixed, 95% CI) | 1.35 [0.80, 2.27] |
| 3.4.2 nHFV versus nCPAP ‐ nHFV MAP < 10 cm H2O | 3 | 407 | Risk Ratio (M‐H, Fixed, 95% CI) | 1.43 [0.84, 2.44] |
| 3.4.3 nHFV versus nCPAP ‐ nHFV Hz ≥ 10 | 2 | 105 | Risk Ratio (M‐H, Fixed, 95% CI) | 2.41 [0.91, 6.38] |
| 3.5 Death or chronic lung disease at 36 weeks Show forest plot | 1 | Risk Ratio (M‐H, Fixed, 95% CI) | Subtotals only | |
| 3.5.1 nHFV versus nCPAP ‐ preterm infants | 1 | 68 | Risk Ratio (M‐H, Fixed, 95% CI) | 2.50 [0.52, 12.01] |
| 3.5.2 nHFV versus nCPAP ‐ nHFV MAP < 10 cm H2O | 1 | 68 | Risk Ratio (M‐H, Fixed, 95% CI) | 2.50 [0.52, 12.01] |
| 3.5.3 nHFV versus nCPAP ‐ nHFV Hz ≥ 10 | 1 | 68 | Risk Ratio (M‐H, Fixed, 95% CI) | 2.50 [0.52, 12.01] |
| 3.6 Intraventricular haemorrhage, Papile grade 3/4 Show forest plot | 4 | Risk Ratio (M‐H, Fixed, 95% CI) | Subtotals only | |
| 3.6.1 nHFV versus nCPAP ‐ preterm infants | 4 | 531 | Risk Ratio (M‐H, Fixed, 95% CI) | 1.17 [0.36, 3.78] |
| 3.6.2 nHFV versus nCPAP ‐ nHFV MAP < 10 cm H2O | 4 | 531 | Risk Ratio (M‐H, Fixed, 95% CI) | 1.17 [0.36, 3.78] |
| 3.6.3 nHFV versus nCPAP ‐ nHFV Hz ≥ 10 | 2 | 105 | Risk Ratio (M‐H, Fixed, 95% CI) | Not estimable |
| 3.6.4 nHFV versus nCPAP ‐ nHFV Hz < 10 | 1 | 124 | Risk Ratio (M‐H, Fixed, 95% CI) | 0.65 [0.11, 3.73] |
| Outcome or subgroup title | No. of studies | No. of participants | Statistical method | Effect size |
| 4.1 Mortality before hospital discharge Show forest plot | 2 | Risk Ratio (M‐H, Fixed, 95% CI) | Subtotals only | |
| 4.1.1 nHFV versus nIPPV ‐ preterm infants | 2 | 84 | Risk Ratio (M‐H, Fixed, 95% CI) | 1.86 [0.90, 3.83] |
| 4.1.2 nHFV versus nIPPV ‐ nHFV MAP < 10 cm H2O | 2 | 84 | Risk Ratio (M‐H, Fixed, 95% CI) | 1.86 [0.90, 3.83] |
| 4.1.3 nHFV versus nIPPV ‐ nHFV Hz ≥ 10 | 1 | 36 | Risk Ratio (M‐H, Fixed, 95% CI) | Not estimable |
| 4.2 Endotracheal intubation Show forest plot | 5 | Risk Ratio (M‐H, Fixed, 95% CI) | Subtotals only | |
| 4.2.1 nHFV versus nIPPV ‐ term or near‐term infants | 1 | 41 | Risk Ratio (M‐H, Fixed, 95% CI) | 0.10 [0.01, 1.78] |
| 4.2.2 nHFV versus nIPPV‐ preterm infants | 4 | 187 | Risk Ratio (M‐H, Fixed, 95% CI) | 1.58 [0.84, 3.00] |
| 4.2.3 nHFV versus nIPPV ‐ nHFV MAP < 10 cm H2O | 3 | 125 | Risk Ratio (M‐H, Fixed, 95% CI) | 1.29 [0.68, 2.44] |
| 4.2.4 nHFV versus nIPPV ‐ nHFV Hz ≥ 10 | 1 | 36 | Risk Ratio (M‐H, Fixed, 95% CI) | 2.79 [0.62, 12.57] |
| 4.3 Failure of respiratory support Show forest plot | 1 | Risk Ratio (M‐H, Fixed, 95% CI) | Subtotals only | |
| 4.3.1 nHFV versus nIPPV‐ preterm infants | 1 | 36 | Risk Ratio (M‐H, Fixed, 95% CI) | 2.79 [0.62, 12.57] |
| 4.3.2 nHFV versus nIPPV ‐ nHFV MAP < 10 cm H2O | 1 | 36 | Risk Ratio (M‐H, Fixed, 95% CI) | 2.79 [0.62, 12.57] |
| 4.3.3 nHFV versus nIPPV ‐ nHFV Hz ≥ 10 | 1 | 36 | Risk Ratio (M‐H, Fixed, 95% CI) | 2.79 [0.62, 12.57] |
| 4.4 Chronic lung disease at 36 weeks Show forest plot | 5 | Risk Ratio (M‐H, Fixed, 95% CI) | Subtotals only | |
| 4.4.1 nHFV versus nIPPV ‐ preterm infants | 5 | 307 | Risk Ratio (M‐H, Fixed, 95% CI) | 0.63 [0.42, 0.95] |
| 4.4.2 nHFV versus nIPPV ‐ nHFV MAP < 10 cm H2O | 2 | 84 | Risk Ratio (M‐H, Fixed, 95% CI) | 0.79 [0.37, 1.66] |
| 4.4.3 nHFV versus nIPPV ‐ nHFV Hz ≥ 10 | 1 | 36 | Risk Ratio (M‐H, Fixed, 95% CI) | 3.35 [0.78, 14.44] |
| 4.5 Intraventricular haemorrhage, Papile grade 3/4 Show forest plot | 1 | Risk Ratio (M‐H, Fixed, 95% CI) | Subtotals only | |
| 4.5.1 nHFV versus nIPPV ‐ preterm infants | 1 | 36 | Risk Ratio (M‐H, Fixed, 95% CI) | Not estimable |
| 4.5.2 nHFV versus nIPPV ‐ nHFV MAP < 10 cm H2O | 1 | 36 | Risk Ratio (M‐H, Fixed, 95% CI) | Not estimable |
| 4.5.3 nHFV versus nIPPV ‐ nHFV Hz ≥ 10 | 1 | 32 | Risk Ratio (M‐H, Fixed, 95% CI) | Not estimable |
| Outcome or subgroup title | No. of studies | No. of participants | Statistical method | Effect size |
| 5.1 Mortality before hospital discharge Show forest plot | 2 | Risk Ratio (M‐H, Fixed, 95% CI) | Subtotals only | |
| 5.1.1 nHFV versus nCPAP | 2 | 370 | Risk Ratio (M‐H, Fixed, 95% CI) | 1.48 [0.43, 5.14] |
| 5.2 Endotracheal intubation Show forest plot | 3 | Risk Ratio (M‐H, Fixed, 95% CI) | Subtotals only | |
| 5.2.1 nHFV versus nCPAP | 3 | 410 | Risk Ratio (M‐H, Fixed, 95% CI) | 0.50 [0.28, 0.89] |
| 5.3 Failure of respiratory support Show forest plot | 1 | 302 | Risk Ratio (M‐H, Fixed, 95% CI) | 0.57 [0.31, 1.03] |
| 5.3.1 nHFV versus nCPAP | 1 | 302 | Risk Ratio (M‐H, Fixed, 95% CI) | 0.57 [0.31, 1.03] |
| 5.4 Chronic lung disease at 36 weeks Show forest plot | 2 | Risk Ratio (M‐H, Fixed, 95% CI) | Subtotals only | |
| 5.4.1 nHFV versus nCPAP | 2 | 370 | Risk Ratio (M‐H, Fixed, 95% CI) | 1.28 [0.70, 2.33] |
| 5.5 Death or chronic lung disease at 36 weeks Show forest plot | 1 | 68 | Risk Ratio (M‐H, Fixed, 95% CI) | 2.50 [0.52, 12.01] |
| 5.5.1 nHFV versus nCPAP | 1 | 68 | Risk Ratio (M‐H, Fixed, 95% CI) | 2.50 [0.52, 12.01] |
| 5.6 Intraventricular haemorrhage, Papile grade 3/4 Show forest plot | 2 | 370 | Risk Ratio (M‐H, Fixed, 95% CI) | 1.97 [0.37, 10.61] |
| 5.6.1 nHFV versus nCPAP | 2 | 370 | Risk Ratio (M‐H, Fixed, 95% CI) | 1.97 [0.37, 10.61] |
| Outcome or subgroup title | No. of studies | No. of participants | Statistical method | Effect size |
| 6.1 Mortality before hospital discharge Show forest plot | 7 | Risk Ratio (M‐H, Fixed, 95% CI) | Subtotals only | |
| 6.1.1 nHFV versus nCPAP | 6 | 1427 | Risk Ratio (M‐H, Fixed, 95% CI) | 0.92 [0.52, 1.64] |
| 6.1.2 nHFV versus nIPPV | 2 | 984 | Risk Ratio (M‐H, Fixed, 95% CI) | 1.83 [0.70, 4.79] |
| 6.2 Endotracheal reintubation Show forest plot | 14 | Risk Ratio (M‐H, Fixed, 95% CI) | Subtotals only | |
| 6.2.1 nHFV versus nCPAP | 11 | 1897 | Risk Ratio (M‐H, Fixed, 95% CI) | 0.42 [0.35, 0.51] |
| 6.2.2 nHFV versus nIPPV | 6 | 1364 | Risk Ratio (M‐H, Fixed, 95% CI) | 0.69 [0.54, 0.89] |
| 6.3 Trauma to the nostrils and upper airway Show forest plot | 5 | Risk Ratio (M‐H, Fixed, 95% CI) | Subtotals only | |
| 6.3.1 nHFV versus nCPAP | 4 | 1418 | Risk Ratio (M‐H, Fixed, 95% CI) | 0.96 [0.64, 1.44] |
| 6.3.2 nHFV versus nIPPV | 4 | 1254 | Risk Ratio (M‐H, Fixed, 95% CI) | 1.01 [0.66, 1.53] |
| 6.4 Failure of extubation Show forest plot | 1 | 6 | Risk Ratio (M‐H, Fixed, 95% CI) | 0.60 [0.22, 1.65] |
| 6.4.1 nHFV versus nCPAP | 1 | 6 | Risk Ratio (M‐H, Fixed, 95% CI) | 0.60 [0.22, 1.65] |
| 6.5 Duration of respiratory support, days Show forest plot | 7 | Mean Difference (IV, Fixed, 95% CI) | Subtotals only | |
| 6.5.1 nHFV versus nCPAP | 7 | 1371 | Mean Difference (IV, Fixed, 95% CI) | ‐0.11 [‐0.20, ‐0.03] |
| 6.5.2 nHFV versus nIPPV | 2 | 1052 | Mean Difference (IV, Fixed, 95% CI) | ‐2.09 [‐3.32, ‐0.85] |
| 6.6 Duration of oxygen therapy, days Show forest plot | 4 | Mean Difference (IV, Fixed, 95% CI) | Subtotals only | |
| 6.6.1 nHFV versus nCPAP | 4 | 1218 | Mean Difference (IV, Fixed, 95% CI) | ‐2.38 [‐3.48, ‐1.28] |
| 6.6.2 nHFV versus nIPPV | 3 | 1212 | Mean Difference (IV, Fixed, 95% CI) | ‐0.57 [‐1.59, 0.45] |
| 6.7 Chronic lung disease at 36 weeks Show forest plot | 11 | Risk Ratio (M‐H, Fixed, 95% CI) | Subtotals only | |
| 6.7.1 nHFV versus nCPAP | 10 | 1829 | Risk Ratio (M‐H, Fixed, 95% CI) | 0.78 [0.67, 0.91] |
| 6.7.2 nHFV versus nIPPV | 4 | 1236 | Risk Ratio (M‐H, Fixed, 95% CI) | 0.88 [0.75, 1.04] |
| 6.8 Death or chronic lung disease at 36 weeks Show forest plot | 4 | Risk Ratio (M‐H, Fixed, 95% CI) | Subtotals only | |
| 6.8.1 nHFV versus nCPAP | 2 | 966 | Risk Ratio (M‐H, Fixed, 95% CI) | 0.90 [0.77, 1.06] |
| 6.8.2 nHFV versus nIPPV | 3 | 1070 | Risk Ratio (M‐H, Fixed, 95% CI) | 0.92 [0.79, 1.08] |
| 6.9 Patent ductus arteriosus Show forest plot | 4 | Risk Ratio (M‐H, Fixed, 95% CI) | Subtotals only | |
| 6.9.1 nHFV versus nCPAP | 3 | 1258 | Risk Ratio (M‐H, Fixed, 95% CI) | 0.99 [0.84, 1.16] |
| 6.9.2 nHFV versus nIPPV | 3 | 1076 | Risk Ratio (M‐H, Fixed, 95% CI) | 0.88 [0.74, 1.05] |
| 6.10 Pulmonary air leak syndromes Show forest plot | 10 | Risk Ratio (M‐H, Fixed, 95% CI) | Subtotals only | |
| 6.10.1 nHFV versus nCPAP | 8 | 1673 | Risk Ratio (M‐H, Fixed, 95% CI) | 0.60 [0.31, 1.15] |
| 6.10.2 nHFV versus nIPPV | 5 | 1322 | Risk Ratio (M‐H, Fixed, 95% CI) | 0.83 [0.36, 1.91] |
| 6.11 Proven sepsis Show forest plot | 2 | Risk Ratio (M‐H, Fixed, 95% CI) | Subtotals only | |
| 6.11.1 nHFV versus nCPAP | 1 | 960 | Risk Ratio (M‐H, Fixed, 95% CI) | 0.85 [0.38, 1.87] |
| 6.11.2 nHFV versus nIPPV | 2 | 984 | Risk Ratio (M‐H, Fixed, 95% CI) | 1.00 [0.50, 2.00] |
| 6.12 Necrotising enterocolitis Show forest plot | 6 | Risk Ratio (M‐H, Fixed, 95% CI) | Subtotals only | |
| 6.12.1 nHFV versus nCPAP | 4 | 523 | Risk Ratio (M‐H, Fixed, 95% CI) | 0.83 [0.47, 1.45] |
| 6.12.2 nHFV versus nIPPV | 4 | 318 | Risk Ratio (M‐H, Fixed, 95% CI) | 1.02 [0.32, 3.24] |
| 6.13 Necrotising enterocolitis, Bell stage ≥ 2 Show forest plot | 4 | Risk Ratio (M‐H, Fixed, 95% CI) | Subtotals only | |
| 6.13.1 nHFV versus nCPAP | 3 | 1142 | Risk Ratio (M‐H, Fixed, 95% CI) | 1.32 [0.82, 2.10] |
| 6.13.2 nHFV versus nIPPV | 2 | 984 | Risk Ratio (M‐H, Fixed, 95% CI) | 0.92 [0.58, 1.44] |
| 6.14 Intraventricular haemorrhage, any Show forest plot | 8 | Risk Ratio (M‐H, Fixed, 95% CI) | Subtotals only | |
| 6.14.1 nHFV versus nCPAP | 7 | 1644 | Risk Ratio (M‐H, Fixed, 95% CI) | 0.92 [0.69, 1.21] |
| 6.14.2 nHFV versus nIPPV | 4 | 1236 | Risk Ratio (M‐H, Fixed, 95% CI) | 0.99 [0.73, 1.34] |
| 6.15 Intraventricular haemorrhage, Papile grade 3/4 Show forest plot | 5 | Risk Ratio (M‐H, Fixed, 95% CI) | Subtotals only | |
| 6.15.1 nHFV versus nCPAP | 3 | 1117 | Risk Ratio (M‐H, Fixed, 95% CI) | 0.80 [0.57, 1.13] |
| 6.15.2 nHFV versus nIPPV | 4 | 1162 | Risk Ratio (M‐H, Fixed, 95% CI) | 0.78 [0.55, 1.10] |
| 6.16 Periventricular leukomalacia Show forest plot | 1 | 24 | Risk Ratio (M‐H, Fixed, 95% CI) | 7.00 [0.40, 122.44] |
| 6.16.1 nHFV versus nIPPV | 1 | 24 | Risk Ratio (M‐H, Fixed, 95% CI) | 7.00 [0.40, 122.44] |
| 6.17 Retinopathy of prematurity, any Show forest plot | 5 | Risk Ratio (M‐H, Fixed, 95% CI) | Subtotals only | |
| 6.17.1 nHFV versus nCPAP | 4 | 1418 | Risk Ratio (M‐H, Fixed, 95% CI) | 0.76 [0.58, 0.99] |
| 6.17.2 nHFV versus nIPPV | 4 | 1236 | Risk Ratio (M‐H, Fixed, 95% CI) | 0.85 [0.64, 1.13] |
| 6.18 Retinopathy of prematurity, stage ≥ 3 Show forest plot | 2 | Risk Ratio (M‐H, Fixed, 95% CI) | Subtotals only | |
| 6.18.1 nHFV versus nCPAP | 2 | 1052 | Risk Ratio (M‐H, Fixed, 95% CI) | 0.81 [0.61, 1.08] |
| 6.18.2 nHFV versus nIPPV | 2 | 1052 | Risk Ratio (M‐H, Fixed, 95% CI) | 0.86 [0.64, 1.15] |
| 6.19 Length of hospital stay, days Show forest plot | 6 | Mean Difference (IV, Fixed, 95% CI) | Subtotals only | |
| 6.19.1 nHFV versus nCPAP | 5 | 640 | Mean Difference (IV, Fixed, 95% CI) | ‐1.14 [‐2.01, ‐0.27] |
| 6.19.2 nHFV versus nIPPV | 3 | 276 | Mean Difference (IV, Fixed, 95% CI) | ‐1.05 [‐3.34, 1.24] |
| 6.20 Neurodevelopmental disability at least 18 months' postnatal age or later Show forest plot | 1 | Risk Ratio (M‐H, Fixed, 95% CI) | Subtotals only | |
| 6.20.1 nHFV versus nCPAP | 1 | 74 | Risk Ratio (M‐H, Fixed, 95% CI) | 0.92 [0.37, 2.29] |
| 6.20.2 nHFV versus nIPPV | 1 | 72 | Risk Ratio (M‐H, Fixed, 95% CI) | 0.88 [0.35, 2.16] |
| Outcome or subgroup title | No. of studies | No. of participants | Statistical method | Effect size |
| 7.1 Mortality before hospital discharge Show forest plot | 6 | Risk Ratio (M‐H, Fixed, 95% CI) | Subtotals only | |
| 7.1.1 nHFV versus nCPAP ‐ preterm infants | 6 | 1427 | Risk Ratio (M‐H, Fixed, 95% CI) | 0.92 [0.52, 1.64] |
| 7.1.2 nHFV versus nCPAP ‐ nHFV MAP ≥ 10 cm H2O | 1 | 206 | Risk Ratio (M‐H, Fixed, 95% CI) | 0.67 [0.19, 2.29] |
| 7.1.3 nHFV versus nCPAP ‐ nHFV MAP < 10 cm H2O | 3 | 147 | Risk Ratio (M‐H, Fixed, 95% CI) | 0.60 [0.15, 2.40] |
| 7.1.4 nHFV versus nCPAP ‐ nHFV Hz ≥ 10 | 2 | 282 | Risk Ratio (M‐H, Fixed, 95% CI) | 0.68 [0.25, 1.85] |
| 7.1.5 nHFV versus nCPAP ‐ nHFV Hz < 10 | 2 | 966 | Risk Ratio (M‐H, Fixed, 95% CI) | 1.60 [0.53, 4.86] |
| 7.2 Endotracheal reintubation Show forest plot | 11 | Risk Ratio (M‐H, Fixed, 95% CI) | Subtotals only | |
| 7.2.1 nHFV versus nCPAP ‐ term or near‐term infants | 1 | 80 | Risk Ratio (M‐H, Fixed, 95% CI) | 0.31 [0.13, 0.77] |
| 7.2.2 nHFV versus nCPAP ‐ preterm infants | 10 | 1817 | Risk Ratio (M‐H, Fixed, 95% CI) | 0.42 [0.35, 0.52] |
| 7.2.3 nHFV versus nCPAP ‐ nHFV MAP ≥ 10 cm H2O | 2 | 298 | Risk Ratio (M‐H, Fixed, 95% CI) | 0.34 [0.21, 0.53] |
| 7.2.4 nHFV versus nCPAP ‐ nHFV MAP < 10 cm H2O | 3 | 147 | Risk Ratio (M‐H, Fixed, 95% CI) | 0.41 [0.25, 0.67] |
| 7.2.5 nHFV versus nCPAP ‐ nHFV Hz ≥ 10 | 2 | 282 | Risk Ratio (M‐H, Fixed, 95% CI) | 0.45 [0.30, 0.67] |
| 7.2.6 nHFV versus nCPAP ‐ nHFV Hz < 10 | 2 | 966 | Risk Ratio (M‐H, Fixed, 95% CI) | 0.51 [0.39, 0.67] |
| 7.3 Failure of extubation Show forest plot | 1 | Risk Ratio (M‐H, Fixed, 95% CI) | Subtotals only | |
| 7.3.1 nHFV versus nCPAP ‐ preterm infants | 1 | 6 | Risk Ratio (M‐H, Fixed, 95% CI) | 0.60 [0.22, 1.65] |
| 7.3.2 nHFV versus nCPAP ‐ nHFV MAP < 10 cm H2O | 1 | 6 | Risk Ratio (M‐H, Fixed, 95% CI) | 0.60 [0.22, 1.65] |
| 7.3.3 nHFV versus nCPAP ‐ nHFV Hz < 10 | 1 | 6 | Risk Ratio (M‐H, Fixed, 95% CI) | 0.60 [0.22, 1.65] |
| 7.4 Chronic lung disease at 36 weeks Show forest plot | 10 | Risk Ratio (M‐H, Fixed, 95% CI) | Subtotals only | |
| 7.4.1 nHFV versus nCPAP ‐ term or near‐term infants | 1 | 80 | Risk Ratio (M‐H, Fixed, 95% CI) | 0.50 [0.05, 5.30] |
| 7.4.2 nHFV versus nCPAP ‐ preterm infants | 9 | 1749 | Risk Ratio (M‐H, Fixed, 95% CI) | 0.78 [0.67, 0.91] |
| 7.4.3 nHFV versus nCPAP ‐ nHFV MAP ≥ 10 cm H2O | 2 | 298 | Risk Ratio (M‐H, Fixed, 95% CI) | 0.47 [0.29, 0.77] |
| 7.4.4 nHFV versus nCPAP ‐ nHFV MAP < 10 cm H2O | 3 | 147 | Risk Ratio (M‐H, Fixed, 95% CI) | 0.65 [0.22, 1.90] |
| 7.4.5 nHFV versus nCPAP ‐ nHFV Hz ≥ 10 | 2 | 282 | Risk Ratio (M‐H, Fixed, 95% CI) | 0.56 [0.21, 1.46] |
| 7.4.6 nHFV versus nCPAP ‐ nHFV Hz < 10 | 2 | 966 | Risk Ratio (M‐H, Fixed, 95% CI) | 0.88 [0.75, 1.04] |
| 7.5 Death or chronic lung disease at 36 weeks Show forest plot | 2 | Risk Ratio (M‐H, Fixed, 95% CI) | Subtotals only | |
| 7.5.1 nHFV versus nCPAP ‐ preterm infants | 2 | 966 | Risk Ratio (M‐H, Fixed, 95% CI) | 0.90 [0.77, 1.06] |
| 7.5.2 nHFV versus nCPAP ‐ nHFV MAP < 10 cm H2O | 1 | 6 | Risk Ratio (M‐H, Fixed, 95% CI) | 0.50 [0.06, 4.47] |
| 7.5.3 nHFV versus nCPAP ‐ nHFV Hz < 10 | 2 | 966 | Risk Ratio (M‐H, Fixed, 95% CI) | 0.90 [0.77, 1.06] |
| 7.6 Intraventricular haemorrhage, Papile grade 3/4 Show forest plot | 3 | Risk Ratio (M‐H, Fixed, 95% CI) | Subtotals only | |
| 7.6.1 nHFV versus nCPAP ‐ preterm infants | 3 | 1117 | Risk Ratio (M‐H, Fixed, 95% CI) | 0.80 [0.57, 1.13] |
| 7.6.2 nHFV versus nCPAP ‐ nHFV MAP ≥ 10 cm H2O | 1 | 92 | Risk Ratio (M‐H, Fixed, 95% CI) | 2.09 [0.20, 22.24] |
| 7.6.3 nHFV versus nCPAP ‐ nHFV MAP < 10 cm H2O | 1 | 65 | Risk Ratio (M‐H, Fixed, 95% CI) | 1.82 [0.17, 19.13] |
| 7.6.4 nHFV versus nCPAP ‐ nHFV Hz < 10 | 1 | 960 | Risk Ratio (M‐H, Fixed, 95% CI) | 0.76 [0.54, 1.09] |
| 7.7 Neurodevelopmental disability at least 18 months' postnatal age or later Show forest plot | 1 | Risk Ratio (M‐H, Fixed, 95% CI) | Subtotals only | |
| 7.7.1 nHFV versus nCPAP ‐ preterm infants | 1 | 72 | Risk Ratio (M‐H, Fixed, 95% CI) | 0.88 [0.35, 2.16] |
| 7.7.2 nHFV versus nCPAP ‐ nHFV MAP ≥ 10 cm H2O | 1 | 72 | Risk Ratio (M‐H, Fixed, 95% CI) | 0.88 [0.35, 2.16] |
| Outcome or subgroup title | No. of studies | No. of participants | Statistical method | Effect size |
| 8.1 Mortality before hospital discharge Show forest plot | 2 | Risk Ratio (M‐H, Fixed, 95% CI) | Subtotals only | |
| 8.1.1 nHFV versus nIPPV ‐ preterm infants | 2 | 984 | Risk Ratio (M‐H, Fixed, 95% CI) | 1.83 [0.70, 4.79] |
| 8.1.2 nHFV versus nIPPV ‐ nHFV MAP < 10 cm H2O | 1 | 24 | Risk Ratio (M‐H, Fixed, 95% CI) | 1.50 [0.30, 7.43] |
| 8.1.3 nHFV versus nIPPV ‐ nHFV Hz ≥ 10 | 1 | 24 | Risk Ratio (M‐H, Fixed, 95% CI) | 1.50 [0.30, 7.43] |
| 8.1.4 nHFV versus nIPPV‐ nHFV Hz < 10 | 1 | 960 | Risk Ratio (M‐H, Fixed, 95% CI) | 2.00 [0.61, 6.60] |
| 8.2 Endotracheal reintubation Show forest plot | 6 | Risk Ratio (M‐H, Fixed, 95% CI) | Subtotals only | |
| 8.2.2 nHFV versus nIPPV ‐ preterm infants | 6 | 1364 | Risk Ratio (M‐H, Fixed, 95% CI) | 0.69 [0.54, 0.89] |
| 8.2.3 nHFV versus nIPPV ‐ nHFV MAP ≥ 10 cm H2O | 2 | 134 | Risk Ratio (M‐H, Fixed, 95% CI) | 0.27 [0.11, 0.68] |
| 8.2.4 nHFV versus nIPPV ‐ nHFV MAP < 10 cm H2O | 2 | 110 | Risk Ratio (M‐H, Fixed, 95% CI) | 0.92 [0.47, 1.80] |
| 8.2.5 nHFV versus nIPPV ‐ nHFV Hz ≥ 10 | 2 | 110 | Risk Ratio (M‐H, Fixed, 95% CI) | 0.92 [0.47, 1.80] |
| 8.2.6 nHFV versus nIPPV‐ nHFV Hz < 10 | 1 | 960 | Risk Ratio (M‐H, Fixed, 95% CI) | 0.75 [0.55, 1.01] |
| 8.3 Chronic lung disease at 36 weeks Show forest plot | 4 | Risk Ratio (M‐H, Fixed, 95% CI) | Subtotals only | |
| 8.3.2 nHFV versus nIPPV ‐ preterm infants | 4 | 1236 | Risk Ratio (M‐H, Fixed, 95% CI) | 0.88 [0.75, 1.04] |
| 8.3.3 nHFV versus nIPPV ‐ nHFV MAP ≥ 10 cm H2O | 1 | 92 | Risk Ratio (M‐H, Fixed, 95% CI) | 0.80 [0.44, 1.45] |
| 8.3.4 nHFV versus nIPPV ‐ nHFV MAP < 10 cm H2O | 1 | 24 | Risk Ratio (M‐H, Fixed, 95% CI) | 1.00 [0.39, 2.58] |
| 8.3.5 nHFV versus nIPPV ‐ nHFV Hz ≥ 10 | 1 | 24 | Risk Ratio (M‐H, Fixed, 95% CI) | 1.00 [0.39, 2.58] |
| 8.3.6 nHFV versus nIPPV‐ nHFV Hz < 10 | 1 | 960 | Risk Ratio (M‐H, Fixed, 95% CI) | 0.90 [0.76, 1.06] |
| 8.4 Death or chronic lung disease at 36 weeks Show forest plot | 3 | Risk Ratio (M‐H, Fixed, 95% CI) | Subtotals only | |
| 8.4.1 nHFV versus nIPPV ‐ preterm infants | 3 | 1070 | Risk Ratio (M‐H, Fixed, 95% CI) | 0.92 [0.79, 1.08] |
| 8.4.2 nHFV versus nIPPV ‐ nHFV MAP < 10 cm H2O | 2 | 110 | Risk Ratio (M‐H, Fixed, 95% CI) | 0.95 [0.60, 1.52] |
| 8.4.3 nHFV versus nIPPV ‐ nHFV Hz ≥ 10 | 2 | 110 | Risk Ratio (M‐H, Fixed, 95% CI) | 0.95 [0.60, 1.52] |
| 8.4.4 nHFV versus nIPPV‐ nHFV Hz < 10 | 1 | 960 | Risk Ratio (M‐H, Fixed, 95% CI) | 0.92 [0.78, 1.08] |
| 8.5 Intraventricular haemorrhage, Papile grade 3/4 Show forest plot | 4 | Risk Ratio (M‐H, Fixed, 95% CI) | Subtotals only | |
| 8.5.2 nHFV versus nIPPV ‐ preterm infants | 4 | 1162 | Risk Ratio (M‐H, Fixed, 95% CI) | 0.78 [0.55, 1.10] |
| 8.5.3 nHFV versus nIPPV ‐ nHFV MAP ≥ 10 cm H2O | 1 | 92 | Risk Ratio (M‐H, Fixed, 95% CI) | 0.70 [0.12, 3.97] |
| 8.5.4 nHFV versus nIPPV ‐ nHFV MAP < 10 cm H2O | 2 | 110 | Risk Ratio (M‐H, Fixed, 95% CI) | 0.40 [0.08, 1.92] |
| 8.5.5 nHFV versus nIPPV ‐ nHFV Hz ≥ 10 | 2 | 110 | Risk Ratio (M‐H, Fixed, 95% CI) | 0.40 [0.08, 1.92] |
| 8.5.6 nHFV versus nIPPV‐ nHFV Hz < 10 | 1 | 960 | Risk Ratio (M‐H, Fixed, 95% CI) | 0.81 [0.57, 1.17] |
| 8.6 Neurodevelopmental disability at least 18 months' postnatal age or later Show forest plot | 1 | Risk Ratio (M‐H, Fixed, 95% CI) | Subtotals only | |
| 8.6.1 nHFV versus nIPPV ‐ preterm infants | 1 | 72 | Risk Ratio (M‐H, Fixed, 95% CI) | 0.88 [0.35, 2.16] |
| 8.6.2 nHFV versus nIPPV ‐ nHFV MAP ≥ 10 cm H2O | 1 | 72 | Risk Ratio (M‐H, Fixed, 95% CI) | 0.88 [0.35, 2.16] |
| Outcome or subgroup title | No. of studies | No. of participants | Statistical method | Effect size |
| 9.1 Mortality before hospital discharge Show forest plot | 4 | Risk Ratio (M‐H, Fixed, 95% CI) | Subtotals only | |
| 9.1.1 nHFV versus nCPAP | 4 | 1248 | Risk Ratio (M‐H, Fixed, 95% CI) | 1.01 [0.49, 2.09] |
| 9.1.2 nHFV versus nIPPV | 1 | 960 | Risk Ratio (M‐H, Fixed, 95% CI) | 2.00 [0.61, 6.60] |
| 9.2 Endotracheal reintubation Show forest plot | 6 | Risk Ratio (M‐H, Fixed, 95% CI) | Subtotals only | |
| 9.2.1 nHFV versus nCPAP | 5 | 1340 | Risk Ratio (M‐H, Fixed, 95% CI) | 0.45 [0.36, 0.56] |
| 9.2.2 nHFV versus nIPPV | 3 | 1138 | Risk Ratio (M‐H, Fixed, 95% CI) | 0.71 [0.54, 0.94] |
| 9.3 Failure of extubation Show forest plot | 1 | 6 | Risk Ratio (M‐H, Fixed, 95% CI) | 0.60 [0.22, 1.65] |
| 9.3.1 nHFV versus nCPAP | 1 | 6 | Risk Ratio (M‐H, Fixed, 95% CI) | 0.60 [0.22, 1.65] |
| 9.4 Chronic lung disease at 36 weeks Show forest plot | 5 | Risk Ratio (M‐H, Fixed, 95% CI) | Subtotals only | |
| 9.4.1 nHFV versus nCPAP | 5 | 1340 | Risk Ratio (M‐H, Fixed, 95% CI) | 0.82 [0.70, 0.95] |
| 9.4.2 nHFV versus nIPPV | 2 | 1052 | Risk Ratio (M‐H, Fixed, 95% CI) | 0.89 [0.75, 1.04] |
| 9.5 Death or chronic lung disease at 36 weeks Show forest plot | 3 | Risk Ratio (M‐H, Fixed, 95% CI) | Subtotals only | |
| 9.5.1 nHFV versus nCPAP | 2 | 966 | Risk Ratio (M‐H, Fixed, 95% CI) | 0.90 [0.77, 1.06] |
| 9.5.2 nHFV versus nIPPV | 2 | 1046 | Risk Ratio (M‐H, Fixed, 95% CI) | 0.92 [0.78, 1.07] |
| 9.6 Intraventricular haemorrhage, Papile grade 3/4 Show forest plot | 3 | Risk Ratio (M‐H, Fixed, 95% CI) | Subtotals only | |
| 9.6.1 nHFV versus nCPAP | 2 | 1052 | Risk Ratio (M‐H, Fixed, 95% CI) | 0.78 [0.55, 1.11] |
| 9.6.2 nHFV versus nIPPV | 3 | 1138 | Risk Ratio (M‐H, Fixed, 95% CI) | 0.80 [0.56, 1.13] |
| Outcome or subgroup title | No. of studies | No. of participants | Statistical method | Effect size |
| 10.1 Mortality before hospital discharge Show forest plot | 1 | 39 | Risk Ratio (M‐H, Fixed, 95% CI) | 1.44 [0.10, 21.33] |
| 10.2 Endotracheal intubation Show forest plot | 1 | 39 | Risk Ratio (M‐H, Fixed, 95% CI) | 1.23 [0.51, 2.98] |
| 10.3 Failure of respiratory support Show forest plot | 1 | 39 | Risk Ratio (M‐H, Fixed, 95% CI) | 0.58 [0.29, 1.16] |
| 10.4 Duration of oxygen therapy, days Show forest plot | 1 | 39 | Mean Difference (IV, Fixed, 95% CI) | 24.00 [‐8.18, 56.18] |
| 10.5 Chronic lung disease at 36 weeks Show forest plot | 1 | 39 | Risk Ratio (M‐H, Fixed, 95% CI) | 1.01 [0.70, 1.47] |
| 10.6 Pulmonary air leak syndromes Show forest plot | 1 | 39 | Risk Ratio (M‐H, Fixed, 95% CI) | Not estimable |
| 10.7 Necrotising enterocolitis Show forest plot | 1 | 39 | Risk Ratio (M‐H, Fixed, 95% CI) | 0.47 [0.02, 10.87] |
| 10.8 Spontaneous intestinal perforation Show forest plot | 1 | 39 | Risk Ratio (M‐H, Fixed, 95% CI) | Not estimable |
| 10.9 Intraventricular haemorrhage, Papile grade 3/4 Show forest plot | 1 | 39 | Risk Ratio (M‐H, Fixed, 95% CI) | 0.47 [0.02, 10.87] |
| 10.10 Periventricular leukomalacia Show forest plot | 1 | 39 | Risk Ratio (M‐H, Fixed, 95% CI) | Not estimable |
| 10.11 Retinopathy of prematurity, stage ≥ 3 Show forest plot | 1 | 39 | Risk Ratio (M‐H, Fixed, 95% CI) | 9.88 [0.55, 179.12] |