Rociamiento de interiores con insecticidas de acción residual para la prevención del paludismo en comunidades que usan mosquiteras tratadas con insecticida
Resumen
Antecedentes
Las mosquiteras tratadas con insecticida (MTI) y el rociamiento de interiores con insecticida de acción residual (RIAR) se utilizan para prevenir la transmisión del paludismo. Ambas intervenciones usan insecticidas para eliminar los mosquitos que pican y se posan en interiores. El agregado del RIAR a las MTI podría mejorar el control del paludismo sencillamente porque dos intervenciones pueden ser mejores que una. Además, el RIAR podría mejorar el control del paludismo cuando fallan las MTI por la resistencia a los insecticidas. Los insecticidas piretroides son la clase predominante de insecticidas utilizados para las MTI, ya que son más seguros que otras clases de insecticidas en contacto prolongado con la piel humana. Aunque muchas poblaciones de mosquitos han desarrollado cierta resistencia a los insecticidas piretroides, se puede utilizar una gama más amplia de insecticidas para el RIAR. Esta es una actualización de la revisión Cochrane anterior de 2019.
Objetivos
Resumir el efecto sobre el paludismo de la aplicación adicional del RIAR, con insecticidas similares o no a los piretroides, en comunidades que usan MTI.
Métodos de búsqueda
Se buscaron entradas en el registro especializado del Grupo Cochrane de Enfermedades infecciosas (Cochrane Infectious Diseases Group), CENTRAL, MEDLINE, y otras cinco bases de datos desde el 1 de enero de 2000 al 8 de noviembre de 2021, sobre la base de que los programas de MTI no comenzaron a aplicarse como política antes del 2000.
Criterios de selección
Se incluyeron ensayos controlados aleatorizados por conglomerados (ECAc), series de tiempo interrumpido (STI) o estudios controlados tipo antes y después (ECAD) que compararan el RIAR más MTI con las MTI solas. Se incluyeron estudios con al menos un 50% de posesión de MTI (definido como la proporción de hogares que poseen una o más MTI) en ambos grupos del estudio.
Obtención y análisis de los datos
Dos autores de la revisión evaluaron de forma independiente la elegibilidad, analizaron el riesgo de sesgo de los estudios y extrajeron los datos. Se utilizó la razón de riesgos (RR) y los intervalos de confianza (IC) del 95%. Se estratificó por tipo de insecticida, "de tipo piretroide" y "no piretroide"; este último podría mejorar el control del paludismo mejor que añadir insecticidas para el RIAR que tienen la misma forma de funcionar que el insecticida en las MTI ("de tipo piretroide"). Para explorar la heterogeneidad se utilizó el análisis de subgrupos del uso de MTI en los estudios. La certeza de la evidencia se evaluó con el método GRADE.
Resultados principales
Ocho ECAc (diez comparaciones), un ECAD y un estudio de STI, todos realizados desde 2008 en el África subsahariana, cumplieron con los criterios de inclusión. Los vectores principales en todos los lugares fueron los mosquitos pertenecientes al complejo de especies Anopheles gambiae s.l.; cinco estudios en Benin, Mozambique, Ghana, Sudán y Tanzania también notificaron el vector Anopheles funestus. Cinco ECAc y ambos estudios de diseño cuasiexperimental usaron insecticidas con objetivos diferentes a los piretroides (dos usaron bendiocarb, tres usaron pirimifós‐metil y uno usó propoxur). Cada uno de estos estudios se llevó a cabo en zonas en las que los vectores se describieron como resistentes o muy resistentes a los piretroides. Dos ECAc usaron dicloro difenil tricloretano (DDT), un insecticida con el mismo objetivo que los piretroides. El ECAc restante empleó ambos tipos de insecticida (el piretroide deltametrina el primer año, con cambio a bendiocarb durante el segundo año).
Rociamiento de interiores con insecticida de acción residual "no piretroide"
Se incluyeron seis estudios (cuatro ECAc, un ECAD y una STI). El análisis principal para la prevalencia excluyó un estudio con alto riesgo de sesgo debido al muestreo repetido de la misma población. Este riesgo no fue aplicable a otros desenlaces. En general, añadir el RIAR redujo la prevalencia del parásito del paludismo (RR 0,61; IC del 95%: 0,42 a 0,88; cuatro ECAc, 16 394 participantes; evidencia de certeza alta). El RIAR también podría reducir la incidencia media del paludismo (cociente de tasas 0,86; IC del 95%: 0,61 a 1,23; cuatro ECAc, 323 631 niños‐año; evidencia de certeza baja), pero el efecto estuvo ausente en dos estudios. Los análisis de subgrupos no explicaron la heterogeneidad cualitativa entre estudios. Un ECAc no informó efectos sobre la incidencia del paludismo ni sobre la prevalencia de parásitos en el primer año, cuando se utilizó un insecticida similar a los piretroides para el RIAR, aunque mostró un efecto sobre ambos desenlaces en el segundo año, cuando se empleó un insecticida no piretroide).
Añadir el RIAR también podría haber reducido la prevalencia de anemia (RR 0,71; IC del 95%: 0,38 a 1,31; tres ECAc, 4288 participantes; evidencia de certeza baja). Cuatro ECAc informaron sobre la repercusión del RIAR en la tasa de inoculación entomológica (TIE), con resultados variables; en general, no se sabe si el RIAR tuvo algún efecto sobre la TIE en las comunidades que utilizan MTI (evidencia de certeza muy baja). Los estudios también informaron sobre la densidad de mosquitos adultos y sobre la tasa de esporozoítos, pero no se pudieron resumir ni agrupar estos desenlaces entomológicos debido a diferencias en los datos informados. Tres estudios midieron la prevalencia de la resistencia a los piretroides antes y después de introducir el RIAR: no se detectaron diferencias, pero estos datos son limitados.
Rociamiento de interiores con insecticida de acción residual “de tipo piretroide"
El agregado del RIAR con un insecticida de tipo piretroide no pareció alterar notablemente la incidencia del paludismo (cociente de tasas 1,07; IC del 95%: 0,80 a 1,43; dos ECAc, 15 717 niños‐años; evidencia de certeza moderada), la prevalencia del parásito (RR 1,11; IC del 95%: 0,86 a 1,44; tres ECAc, 10 820 participantes; evidencia de certeza moderada), o la prevalencia de anemia (RR 1,12; IC del 95%: 0,89 a 1,40; un ECAc, 4186 participantes; evidencia de certeza baja). Los datos sobre la TIE eran limitados, por lo que no se establecieron conclusiones (evidencia de certeza muy baja).
Conclusiones de los autores
En comunidades que utilizan MTI, añadir el RIAR con insecticidas “no piretroides” se asoció con una prevalencia baja de paludismo. La incidencia media de paludismo también podría haberse reducido, pero hubo una heterogeneidad cualitativa inexplicable, por lo que el efecto podría no observarse en todos los entornos.
Cuando se utilizaron insecticidas "de tipo piretroide", no hubo un beneficio adicional detectable del RIAR en las comunidades que usaban MTI.
PICO
Resumen en términos sencillos
Añadir el rociamiento de interiores con insecticidas de acción residual en las comunidades que usan mosquiteras tratadas con insecticida para prevenir el paludismo
¿Cuál era el objetivo de esta revisión?
El rociamiento de interiores con insecticidas de acción residual (RIAR) es la aplicación regular de insecticidas químicos sobre las paredes de las viviendas. El insecticida dura varios meses y elimina los mosquitos que se posan sobre las superficies rociadas. Las mosquiteras tratadas con insecticida (MTI) impiden que los mosquitos piquen a las personas y reducen la población de estos insectos. Ambas intervenciones ayudan a controlar el paludismo mediante la reducción de la cantidad de personas picadas por mosquitos infectados por el parásito. La implementación del RIAR en las comunidades que utilizan MTI podría ser mejor para controlar el paludismo que el uso de las MTI solas sencillamente porque dos intervenciones pueden ser mejores que una; pero también porque podría mejorar el control del paludismo donde los mosquitos se hayan vuelto resistentes a los insecticidas piretroides utilizados en las MTI. Los piretroides eran la única clase de insecticidas autorizados para el uso en MTI hasta 2018, pero la resistencia creciente de los mosquitos a estos deteriora su efectividad. El agregado del RIAR podría contrarrestar esta reducción de la efectividad de las MTI y ayudar a frenar la aparición de resistencia a los piretroides. Cabría esperar que los insecticidas del RIAR con mecanismos de acción diferentes a los piretroides ("no piretroides") pudieran restaurar la efectividad mejor que los que comparten el mismo mecanismo de acción ("similares a los piretroides"). El objetivo de esta revisión fue resumir el efecto de los RIAR con insecticidas similares a los piretroides o con insecticidas no similares a los piretroides sobre el paludismo, cuando se aplican en comunidades que usan MTI.
Mensajes clave
Añadir el RIAR con insecticidas “no piretroides” se asoció con una prevalencia baja de paludismo. Es posible que la incidencia media del paludismo también se reduzca, pero este efecto estuvo ausente en dos estudios y, por consiguiente, sigue habiendo cierta incertidumbre sobre si la intervención será eficaz en todos los entornos.
Cuando se utilizó un insecticida similar a los piretroides para el RIAR, los datos fueron limitados pero no se demostró ningún efecto adicional.
¿Qué se estudió en la revisión?
Se buscaron estudios que evaluaron el efecto en la transmisión del paludismo cuando se aplicó el RIAR, con la dosis recomendada por la Organización Mundial de la Salud (OMS), en comunidades que usaban MTI o mosquiteras estándares tratadas con insecticida en la dosis recomendada por la OMS. Se consideraron los efectos sobre los desenlaces de salud en humanos y sobre las poblaciones de mosquitos.
¿Cuáles son los principales resultados de la revisión?
En total, se identificaron diez estudios que cumplían con los criterios de inclusión, de los que se realizaron 12 comparaciones. Siete estudios (con ocho comparaciones) usaron un RIAR no piretroide durante todo el estudio. Cada uno de estos se llevó a cabo en zonas en las que los vectores se describieron como resistentes o muy resistentes a los piretroides. Dos estudios (con dos comparaciones) usaron un RIAR similar a los piretroides durante todo el estudio. Otro estudio utilizó un RIAR similar a los piretroides el primer año de estudio y cambió a un RIAR no piretroide en los años posteriores, por lo que aporta dos comparaciones diferentes. Todos los estudios se realizaron en el África subsahariana.
Añadir un RIAR "no piretroide" en las comunidades que usan MTI parece mejorar los desenlaces del paludismo en la mayoría de entornos. En general, los resultados de los ocho estudios incluidos observaron una menor prevalencia del parásito del paludismo, y podría haber una reducción de la incidencia del paludismo y de la prevalencia de anemia. No se sabe si se produce un efecto sobre la cantidad de picaduras infectadas recibidas por persona por año.
Cuando se añadió un RIAR similar a los piretroides en las comunidades que usaban MTI, los datos de tres estudios indican que probablemente no haya un efecto sobre la incidencia del paludismo ni la prevalencia de parásitos y podría haber poco o ningún efecto sobre la prevalencia de anemia. Los datos sobre el número de picaduras infectadas por persona por año fueron demasiado limitados para establecer conclusiones.
¿Cuál es el grado de actualización de la revisión?
Se buscaron los estudios relevantes hasta el 8 de noviembre de 2021.
Authors' conclusions
Summary of findings
| Patient or population: people at risk of malaria Setting: sub‐Saharan Africa (Ethiopia, Mozambique, Tanzania, Sudan, Ghana, Uganda) Intervention: combination of IRS + ITNs – using an insecticide for IRS that has a different target site to the pyrethroids used in ITNs Comparison: ITNs alone | ||||||
| Outcomes | Anticipated absolute effects* (95% CI) | Relative effect | Number of participants | Certainty of the evidence | Comments: the combination of IRS and ITNs, when the insecticide used for IRS has a different target site to the pyrethroids used in ITNs | |
|---|---|---|---|---|---|---|
| Risk with ITNs alone | Risk with IRS + ITNs | |||||
| Malaria incidence | 357 cases per 1000 years at risk | 307 cases per 1000 years at risk (218 to 439) | Rate ratio 0.86 | 323,631 person‐years at risk | ⊕⊕⊝⊝ | May reduce malaria incidence compared to ITNs alone. |
| Malaria parasite prevalence | 213 cases per 1000 | 119 cases per 1000 (90 to 158) | RR 0.61 (0.42 to 0.88) | 16,394 participants | ⊕⊕⊕⊕ | Reduces malaria parasite prevalence compared to ITNs alone. |
| EIR | — | — | Not estimable IRS was associated with a lower EIR in 2 of the 4 cRCTs | (5 comparisons, 4 cRCTs) | ⊕⊝⊝⊝ | We did not know if there was an effect on the EIR compared to ITNs alone. |
| Anaemia prevalence | 133 cases per 1000 | 94 cases per 1000 (50 to 174) | RR 0.71 | 4288 participants | ⊕⊕⊝⊝ | May have reduced anaemia prevalence compared to ITNs alone. |
| *The risk in the intervention arm (and its 95% CI) is based on the assumed risk in the comparison arm and the relative effect of the intervention (and its 95% CI). The assumed risk of the comparison arm is calculated from the total number of events/total number of participants in the control arms of the trials contributing to the meta‐analysis. CI: confidence interval; cRCT: cluster randomized controlled trial; EIR: entomological inoculation rate; IRS: indoor residual spraying; ITN: insecticide‐treated net; RR: risk ratio. | ||||||
| GRADE Working Group grades of evidence | ||||||
| aDowngraded one level for serious imprecision: the CIs were wide and included both a substantive decrease and no effect. | ||||||
| Patient or population: people at risk of malaria Setting: sub‐Saharan Africa (The Gambia, Sudan, Eritrea) Intervention: combination of IRS + ITNs – using an insecticide for IRS that has the same target site as the pyrethroids used in ITNs Comparison: ITNs alone | ||||||
| Outcomes | Anticipated absolute effects* (95% CI) | Relative effect | Number of participants | Certainty of the evidence | Comments: the combination of IRS and ITNs, when the insecticide used for IRS has the same target site as the pyrethroids used in ITNs | |
|---|---|---|---|---|---|---|
| Risk with ITNs alone | Risk with IRS + ITNs | |||||
| Malaria incidence | 215 cases per 1000 child‐years | 230 cases per 1000 child‐years (172 to 307) | Rate ratio 1.07 | 15,717 child‐years | ⊕⊕⊕⊝ | Probably had little or no effect on malaria incidence compared to ITNs alone. |
| Malaria parasite prevalence | 13.2 cases per 100 | 14.7 cases per 100 (11.4 to 19.0) | RR 1.11 (0.86 to 1.44) | 10,820 participants | ⊕⊕⊕⊝ | Probably had little or no effect on malaria parasite prevalence compared to ITNs alone. |
| EIR | — | — | Mean EIR was lower with IRS + ITNs than ITNs alone | (2 comparisons, 1 cRCT) | ⊕⊝⊝⊝ | We do not know if there was an effect on the EIR compared to ITNs alone. |
| Anaemia prevalence (haemoglobin < 8 g/dL) | 42.6 cases per 100 | 47.7 cases per 100 (37.9 to 59.6) | RR 1.12 | 4186 participants | ⊕⊕⊝⊝ | May have had little or no effect on anaemia prevalence compared to ITNs alone. |
| *The risk in the intervention arm (and its 95% CI) is based on the assumed risk in the comparison arm and the relative effect of the intervention (and its 95% CI). The assumed risk of the comparison arm is calculated from the total number of events/total number of participants in the control arms of the trials contributing to the meta‐analysis. CI: confidence interval; cRCT: cluster randomized controlled trial; IRS: indoor residual spraying; ITN: insecticide‐treated net; RR: risk ratio. | ||||||
| GRADE Working Group grades of evidence | ||||||
| aDowngraded one level for serious imprecision: the CIs were wide and included both an increase and decrease in the outcome. | ||||||
Background
Description of the condition
Between 2000 and 2015, malaria deaths halved globally. In this time, malaria control interventions were estimated to have averted 663 million cases of malaria, with much of the progress attributed to vector control (Bhatt 2015). Despite this decline, the disease is still a leading cause of mortality, responsible for 409,000 deaths worldwide in 2019 (WHO 2020).
Description of the intervention
Vector control depends largely on insecticides, primarily delivered as indoor residual spraying (IRS) or insecticide‐treated nets (ITNs). IRS is the regular spraying of insecticides to the indoor walls of houses. The insecticide lasts for at least four months, killing mosquitoes that land on it. ITNs are bed nets treated with insecticides, preventing mosquitoes from biting people and reducing the mosquito population. ITNs include long‐lasting insecticidal nets (LLINs), where the insecticide lasts for up to three years, and conventionally treated nets, where the insecticide is active for up to 12 months. Up until 2018, only nets treated with pyrethroids were recommended by the World Health Organization (WHO) (Zaim 2000). Since 2018, piperonyl butoxide (PBO) added to pyrethroid nets was also recommended by the WHO, making them more effective at killing mosquitoes in areas where the mosquito populations are highly resistant to pyrethroids (Gleave 2018). Insecticides used for IRS are less restricted, as people living in the households are considered less likely to come into contact with the treated walls than with the fabric of a bed net.
Pyrethroids target the mosquito voltage‐gated sodium ion channels. If mosquito resistance to pyrethroids is leading to reduced effectiveness of ITNs, IRS using insecticides with different target sites ('non‐pyrethroid‐like' insecticides) may be less affected by the pyrethroid resistance and more likely to have an impact on malaria transmission. In contrast, IRS using insecticides that also target the voltage‐gated sodium ion channels ('pyrethroid‐like' insecticides) may be less likely to have an impact.
How the intervention might work
IRS with dichloro‐diphenyl‐trichlorethane (DDT) was the main intervention of the malaria eradication programmes in the mid‐20th century (Pluess 2010). When malaria was eliminated from many parts of South America, Europe, and Asia, IRS was an integral part of the elimination strategies (Pluess 2010). However, many countries today choose to adopt ITNs rather than IRS, as they are logistically easier to implement than IRS and more acceptable to communities.
Theoretically, the simultaneous use of IRS and ITNs is better for malaria control than using ITNs alone for two main reasons. First, we might expect an incremental effect of using two vector control interventions over one, particularly when the major vector species that are targeted largely feed and largely rest indoors (endophagic and endophilic vectors). As with many vector control interventions, the reality is not simple and the success of the intervention will depend on both human and vector behaviour (Killeen 2006). Mosquito exophily can reduce the effectiveness of IRS and ITNs, as mosquitoes that rest outdoors more will have less contact with an indoor treated wall or net (Kitau 2012). Earlier biting times of Anopheles spp have also been observed, which can increase the likelihood of a mosquito encountering a human to bite and reduce the impact of ITNs (Ojuka 2015).
Second, implementing IRS in communities currently using ITNs may be beneficial for the management of mosquito resistance to insecticides. Malaria control programmes may additionally implement IRS as a reactive measure in response to high pyrethroid resistance in Anopheles mosquitoes. The addition of IRS could mitigate for this reduction in ITN effectiveness. In particular, non‐pyrethroid‐like IRS may be expected to show additional impact in instances where mosquitoes are resistant to pyrethroids on ITNs but susceptible to non‐pyrethroids that can be delivered via IRS. Policy‐makers could also introduce a combination of the two interventions proactively, administering a non‐pyrethroid‐like IRS alongside ITNs as part of an insecticide resistance management (IRM) strategy to delay the emergence of pyrethroid resistance (WHO 2012).
Why it is important to do this review
The combination of IRS and ITNs can be logistically complicated to deliver. ITNs are advantageous because they can last for three to five years, and because net distribution campaigns can be conducted at a village central point or community health centre. In contrast, the current set of insecticides used for IRS will remain active for one year at best, and an effective spray campaign in a setting with perennial malaria transmission will, therefore, require several sprays per year (WHO 2015a). IRS is also logistically more demanding, requiring a visit to every individual household. IRS programmes typically take a substantially higher amount of financial commitment than an ITN distribution campaign, in part due to the sheer quantity of insecticide required at programmatic scales (Goodman 2001). Finally, IRS has experienced more problems with the acceptability of the intervention and its delivery than ITNs (Kleinschmidt 2009).
The impact on malaria transmission of combining IRS with ITNs is not fully understood. A previous version of this review found that, in communities using ITNs, the addition of IRS using a pyrethroid‐like insecticide probably had no effect on malaria incidence or prevalence. The effect of adding IRS with a non‐pyrethroid‐like insecticide was uncertain, with inconsistent results reported across a limited number of studies (Choi 2019). The current global guidelines for malaria vector control recommend against implementing IRS as a second intervention in areas that have suboptimal coverage of ITNs, and vice versa, stating that priority should instead be given to ensuring optimal coverage of the first intervention. In areas that have achieved optimal coverage of a first intervention, programmes may consider implementing a second intervention for the purposes of IRM, though the insecticides used for IRS and ITNs must not be of the same class (WHO 2019).
A greater understanding of the impact of IRS in combination with ITNs, particularly when using insecticides of different classes, will help to determine whether the additional logistical complexity is worthwhile. Since the publication of the last updates, several new studies have been published that add to the available literature.
Objectives
To summarize the effect on malaria of additionally implementing IRS, using non‐pyrethroid‐like or pyrethroid‐like insecticides, in communities currently using ITNs.
Methods
Criteria for considering studies for this review
Types of studies
-
Randomized controlled trials (RCTs) with: the unit of randomization being a cluster and at least two clusters per arm (cRCTs). As the two interventions were distributed at a community level, we did not expect to find trials with individual randomization.
-
Controlled before‐after studies (CBAs) with: a contemporaneous control arm and at least two sites per arm.
-
Interrupted time series designs (ITS) with: a clearly defined point in time when the intervention occurred and at least three data points before and three after the intervention.
Types of participants
All people living in a rural or urban malarious area where ITNs were in use. We included participants living in all levels of endemicity, including both stable and unstable transmission.
Types of interventions
IRS using the WHO‐recommended dosage (see Table 1; WHO 2015a). We individually evaluated the effects of IRS using:
| Insecticides and formulations | Dosage (g AI/m²) |
|---|---|
| DDT WP | 1–2 |
| Malathion WP | 2 |
| Fenitrothion WP | 2 |
| Pirimiphos‐methyl WP, EC | 1–2 |
| Pirimiphos‐methyl CS | 1 |
| Bendiocarb WP, WP‐SB | 0.1–0.4 |
| Propoxur WP | 1–2 |
| Alpha‐cypermethrin WP, SC, WG‐SB | 0.02–0.03 |
| Bifenthrin WP | 0.025–0.05 |
| Cyfluthrin WP | 0.02–0.05 |
| Deltamethrin WP, WG, WG‐SB, SC‐PE | 0.02–0.025 |
| Etofenprox WP | 0.1–0.3 |
| Lambda‐cyhalothrin WP, CS | 0.02–0.03 |
AI: active ingredient; CS: capsule suspension; DDT: dichloro‐diphenyl‐trichlorethane; EC: emulsifiable concentrate; SC: suspension concentrate; SC‐PE: polymer‐enhanced suspension concentrate; WG: water‐dispersible granule; WG‐SB: water‐dispersible granules packaged in water‐soluble bags; WP: wettable powder; WP‐SB: wettable powder in sealed water‐soluble bags.
-
'non‐pyrethroid‐like insecticides': those with alternative targets such as acetylcholinesterase, in contrast to ITNs;
-
'pyrethroid‐like insecticides': those that target the voltage‐gated sodium ion channels, similarly to ITNs.
ITNs interventions were required to be the same in both intervention and control arms. Suitable ITNs included LLINs and pyrethroid‐PBO nets, with either a full or preliminary recommendation by the WHO (Table 2), or conventionally treated nets, treated with insecticide at the WHO‐recommended dosage (Table 3). Only studies with at least 50% ITN ownership (defined as the proportion of households owning one or more ITN) in both study arms were considered suitable for inclusion.
| Product name | Product type | Status of WHO recommendation |
|---|---|---|
| DawaPlus 2.0 | Deltamethrin coated on polyester | Interim |
| Duranet | Alpha‐cypermethrin incorporated into polyethylene | Full |
| Interceptor | Alpha‐cypermethrin coated on polyester | Full |
| LifeNet | Deltamethrin incorporated into polypropylene | Interim |
| MAGNet | Alpha‐cypermethrin incorporated into polyethylene | Full |
| MiraNet | Alpha‐cypermethrin incorporated into polyethylene | Interim |
| Olyset Net | Permethrin incorporated into polyethylene | Full |
| Olyset Plus | Permethrin and PBO incorporated into polyethylene | Interim |
| Panda Net 2.0 | Deltamethrin incorporated into polyethylene | Interim |
| PermaNet 2.0 | Deltamethrin coated on polyester | Full |
| PermaNet 3.0 | Combination of deltamethrin coated on polyester with strengthened border (side panels), and deltamethrin and PBO incorporated into polyethylene (roof) | Interim |
| Royal Sentry | Alpha‐cypermethrin incorporated into polyethylene | Full |
| SafeNet | Alpha‐cypermethrin coated on polyester | Full |
| Veeralin | Alpha‐cypermethrin and PBO incorporated into polyethylene | Interim |
| Yahe | Deltamethrin coated on polyester | Interim |
| Yorkool | Deltamethrin coated on polyester | Full |
LLIN: long‐lasting insecticidal nets; PBO: piperonyl butoxide.
Adapted from WHO 2014b.
| Insecticide | Formulation | Dosage (mg AI/m² of netting) |
|---|---|---|
| Alpha‐cypermethrin | SC 10% | 20–40 |
| Cyfluthrin | EW 5% | 50 |
| Deltamethrin | SC 1%; WT 25%; and WT 25% + binder | 15–25 |
| Etofenprox | EW 10% | 200 |
| Lambda‐cyhalothrin | CS 2.5% | 10–15 |
| Permethrin | EC 10% | 200–500 |
| ICON MAXX (long‐lasting lambda‐cyhalothrin formulation) | CS 10% + binder | 50–83 |
AI: active ingredient; EC: emulsifiable concentrate; EW: emulsion, oil in water; CS: capsule suspension; SC: suspension concentrate; WT: water dispersible tablet.
Adapted from WHO 2014c.
Any other malaria control measures were required to be the same in both intervention and control arms.
Types of outcome measures
Primary outcomes
Studies eligible for inclusion must have reported at least one of the following.
-
Malaria incidence: measured as a count per person unit time of 1. infections or 2. new infections, following treatment to avoid measuring pre‐existing infections. Infection was defined as any symptom, including fever, with confirmed parasitaemia (by blood smear microscopy or rapid diagnostic test (RDT)).
-
Malaria parasite prevalence: the proportion of surveyed people with confirmed parasitaemia.
Secondary outcomes
Entomological
-
Entomological inoculation rate (EIR): the estimated number of bites by infectious mosquitoes per person per unit of time. This was measured using the human biting rate (the number of mosquitoes biting a person over a stated period measured directly using human baits or indirectly using light traps, knock‐down catches, baited huts, or other methods of biting rate determination) multiplied by the sporozoite rate.
-
Sporozoite rate: the fraction of vector mosquitoes present and biting that were considered infectious, measured by a technique previously shown to be appropriate for the vector (microscopy, immunoassays, polymerase chain reaction‐based assays or other methods).
-
Adult mosquito density: measured by a technique previously shown to be appropriate for the vector (human baits, light traps, knock‐down catches, baited huts, or other methods).
Epidemiological
-
Malaria‐related deaths.
-
Anaemia prevalence defined as per WHO cut‐offs (WHO 2011).
-
Hospital admissions for malaria.
-
Number of people with severe malaria: using site‐specific definitions, provided they included 1. and either 2. or 3.: 1. demonstration of parasitaemia by blood smear; 2. symptoms of cerebral malaria including coma, prostration, or multiple seizures; 3. severe, life‐threatening anaemia (WHO 2015b).
-
Number of people with uncomplicated clinical malaria episodes: we will use site‐specific definitions, provided they included: 1. demonstration of malaria parasites by blood smear or an RDT, or both; and 2. clinical symptoms including fever detected passively or actively.
Mosquito insecticide resistance
-
Level of insecticide resistance, confirmed by WHO cylinder assays/Centers for Disease Control and Prevention (CDC) bottle bioassays or molecular techniques. This included resistance to either the class of insecticide used for IRS (i.e. as an unwanted outcome of studies due to increased coverage of insecticidal interventions) or to pyrethroid insecticides (to monitor whether the addition of IRS prevented or reduced resistance to ITNs).
Search methods for identification of studies
We attempted to identify all relevant studies regardless of language or publication status (published, unpublished, in press, and in progress).
Electronic searches
We searched the following databases from 1 January 2000 to 8 November 2021, on the basis that ITN programmes did not begin to be implemented as policy before the year 2000. We used the search terms and strategy described in Appendix 1: Cochrane Infectious Diseases Group Specialized Register; Cochrane Central Register of Controlled Trials(CENTRAL) Issue 3, April 2019, published in the Cochrane Library; MEDLINE (PubMed); Embase (Ovid); and LILACS (Bireme). We also checked the WHO International Clinical Trials Registry Platform (WHO ICTRP; www.who.int/ictrp/en/) and ClinicalTrials.gov (clinicaltrials.gov/ct2/home) for ongoing trials on 8 November 2021, using the terms: indoor residual spraying; IRS; insecticide‐treated nets; bednets; ITNs; LLIN.
Searching other resources
We contacted researchers working in the field for unpublished data. We also checked the reference lists of all studies identified by the above methods.
Data collection and analysis
Selection of studies
At least two review authors independently assessed the titles and abstracts of each identified study, with all three review authors contributing to this process. Similarly, a minimum of two of the three review authors accessed and assessed the full‐text copies of each potentially relevant study for inclusion using an eligibility form based on the inclusion criteria. Any disagreements between the two review authors were resolved by discussion and consensus, with arbitration by the third review author when necessary. We ensured that multiple publications of the same study were included once. We listed excluded studies, together with their reasons for exclusion, in the Characteristics of excluded studies table. We illustrated the study selection process in a PRISMA diagram (Figure 1).
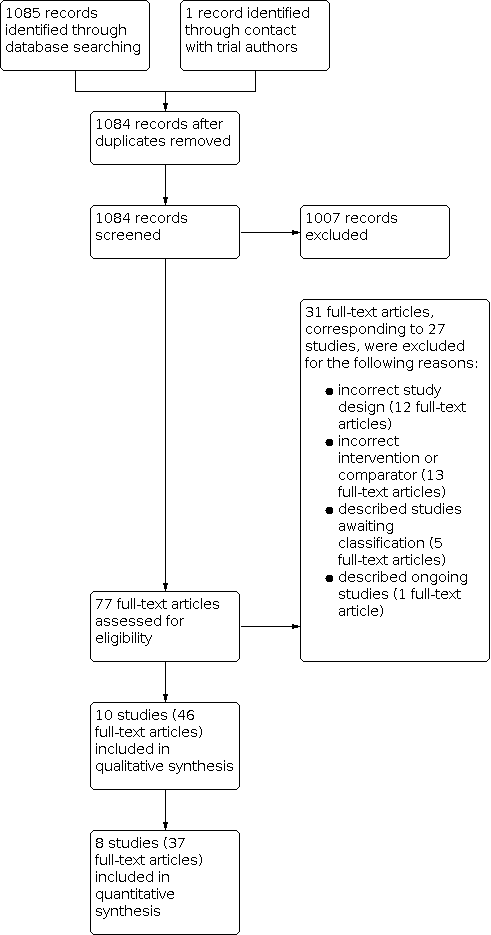
Study flow diagram.
Data extraction and management
Two of the three authors independently extracted information from the studies using prepiloted, electronic data extraction forms. In case of differences in extracted data, the two review authors discussed these differences to reach consensus. If unresolved, they consulted the third review author. In case of missing data, we contacted the original study author(s) for clarification.
We extracted data on the following.
-
Study design: type of study; method of participant selection; adjustment for clustering (for cRCTs); sample size; method of blinding of participants and personnel.
-
Participants: study settings and population characteristics; recruitment rates; withdrawal and loss to follow‐up.
-
Intervention: description of IRS (active ingredient, dose, formulation, method, frequency and timing of application, coverage – defined as proportion of eligible structures sprayed, buffer zone between clusters); description of ITNs (ITN type, timing of distribution, ITN ownership – defined as proportion of households owning at least one ITN – or other measurement of ITN coverage; ITN use – defined as proportion of individuals using an ITN the previous night – or other measurement of ITN use); description of cointerventions (type, frequency of application, compliance of cointervention).
-
Outcomes: definition of outcome; diagnostic method or surveillance method; passive or active case detection; duration of follow‐up; time points at which outcomes were assessed; number of events; number of participants or unit time; statistical power; unit of analysis; incomplete outcomes/missing data.
-
Other:
-
primary and secondary vector(s) species; vector(s) behaviour (nature, stability, adult habitat, peak biting times, exophilic/endophilic, exophagic/endophagic, anthropophilic/zoophilic); method of mosquito collection(s); phenotypic insecticide resistance (based on WHO definitions if supplementary WHO cylinder assays or CDC bottle bioassays, or both, were performed while the study was running); genotypic insecticide resistance profile (either performed during the study or if the study referenced data from previous studies done on the same local vector population within the previous five years);
-
malaria endemicity; eco‐epidemiological setting; human population proximity to mosquito aquatic habitats, human population density per area; Plasmodium spp.
-
For dichotomous outcomes, we extracted the number of participants experiencing each outcome and the number of participants in each treatment arm. For count/rate data outcomes, we extracted the number of outcomes in the treatment and control arms, and the total person time at risk in each arm or the rate ratio, and a measure of variance (e.g. standard error). For continuous outcomes, we extracted the mean and a measure of variance (standard deviation).
For cRCTs, we recorded the number of clusters randomized; number of clusters analyzed; measure of effect (such as risk ratio (RR), odds ratio, or mean difference (MD)) with 95% confidence intervals (CI) or standard deviations; number of participants; and the intracluster correlation coefficient (ICC) value. Where studies reported cluster‐adjusted odds ratios, we converted these to RRs following the methodology stated in Section 12.5.4.4 of the Cochrane Handbook for Systematic Reviews of Interventions (Higgins 2011a).
For quasi‐experimental design studies, we extracted adjusted measures of intervention effects that attempted to control for confounding.
Assessment of risk of bias in included studies
Two of the three review authors independently assessed the risk of bias for each included cRCT using the Cochrane risk of bias tool and the five additional criteria listed in Section 16.3.2 of the Cochrane Handbook for Systematic Reviews of Interventions that relate specifically to cRCTs (Higgins 2011a; Higgins 2011b). We assessed the risk of bias for CBA using Cochrane EPOC's 'Risk of bias criteria for studies with a separate control group' and for ITS studies we used 'Risk of bias criteria for interrupted time series studies' (EPOC 2017). We resolved any discrepancies through discussion or by consulting a third review author if necessary. We classified judgements of risk of bias as at low, high, or unclear risk of bias, and we used summary graphs (risk of bias summary and risk of bias graph) to display results.
Due to the nature of the IRS application, blinding of participants and study personnel was not possible. When assessing the risk of performance bias, we considered that the primary outcomes of malaria incidence and malaria parasite prevalence were unlikely to be affected by participant knowledge of the intervention. Therefore, we did not associate the lack of participant blinding with a high risk of performance bias. When assessing the risk of detection bias, we considered that measurements of incidence that depended on self‐reporting of fever may have been influenced by the participants' knowledge of the intervention. However, to meet the inclusion criteria for this review, such cases required confirmation of parasitaemia by blood smear microscopy or RDT, and the results of these objective tests were considered unlikely to be influenced by knowledge of the intervention arm. Therefore, where studies measured incidence using this method, we considered the lack of blinding to introduce an unclear risk of bias; this is consistent with the methods used by Pryce 2018.
Measures of treatment effect
We compared intervention and control data using RRs and for count/rate data, we used rate ratios. We used adjusted measures of effect to summarize treatment effect from quasi‐experimental design studies. We presented all results with their associated 95% CIs.
Unit of analysis issues
For cRCTs, or cluster quasi‐experimental design studies, we extracted adjusted measures of effect where possible. If included cRCTs had not adjusted for clustering in the analysis, we adjusted the data before combining it. We adjusted data by multiplying the standard errors by the square root of the design effect (Higgins 2011a), which was determined by the ICC. If the study did not report the ICC value, we estimated the ICC value using a range of 0.01, 0.05, and 0.1. When we estimated the ICC, we performed sensitivity analyses to investigate the robustness of our analyses.
If we identified studies for inclusion that had multiple intervention arms, we included data from these studies by either combining treatment arms, or by splitting the control arm so that we only included these participants in the meta‐analysis once.
Dealing with missing data
In case of missing data, we applied available‐case analysis, only including data on the known results. The denominator was the total number of participants who had data recorded for the specific outcome. For outcomes with no missing data, we planned to perform analyses on an intention‐to‐treat basis. We included all participants randomized to each arm in the analyses and analyzed participants in the arm to which they were randomized.
Assessment of heterogeneity
We inspected forest plots for overlapping CIs and assessed statistical heterogeneity in each meta‐analysis using the I² statistic and Chi² statistic. We regarded heterogeneity as moderate if the I² statistic was between 30% and 60%; substantial if it was between 59% and 90%; and considerable if it was between 75% and 100% (Deeks 2011). We regarded a Chi² test statistic with a P ≤ 0.10 indicative of statistically significant heterogeneity. We explored clinical and methodological heterogeneity through consideration of the study populations, methods, and interventions, and by visualization of study results.
Assessment of reporting biases
If there were 10 or more studies included in each meta‐analysis, we intended to investigate reporting biases (such as publication bias) using funnel plots. We would have assessed funnel plot asymmetry visually, and used formal tests for funnel plot asymmetry (Harbord 2006). If we detected asymmetry in any of these tests or by a visual assessment, we would have explored the reasons for asymmetry. However, we did not identify 10 or more studies contributing to any meta‐analysis, and, therefore, could not investigate reporting bias using a funnel plot. Instead, we compared the outcomes reported against the study protocols.
Data synthesis
We analyzed data using Review Manager 5 (Review Manager 2020). We used fixed‐effect meta‐analysis to combine data if heterogeneity was absent. For a meta‐analysis of reported effect sizes, we used a generic inverse variance model. Where raw data were used for a meta‐analysis of RRs, we used a Mantel‐Haenszel model. For meta‐analysis of RRs and odds ratios, if considerable heterogeneity was present, we combined data using random‐effects meta‐analysis and reported a mean treatment effect. We decided whether to use fixed‐effect or random‐effects models based on the consideration of clinical and methodological heterogeneity between studies, as described previously.
Subgroup analysis and investigation of heterogeneity
To explore reasons for substantial heterogeneity, we performed the following subgroup analysis.
-
Use of ITNs, defined as the proportion of individuals who slept under an ITN the previous night:
-
high (80% or more);
-
moderate (50% to 79%);
-
low (less than 50%);
-
note: studies that did not report this outcome, but instead reported an alternative measurement of ITN use (e. proportion of households in which one or more individuals slept under an ITN the previous night) were not included in this analysis.
-
-
Coverage of IRS, defined as the percentage of eligible structures in the intervention region that were sprayed:
-
high (80% or more);
-
moderate (50% to 79%);
-
low (less than 50%.
-
We assessed differences between the subgroups using the Chi² test, with a P value less than 0.1 indicating statistically significant differences between subgroups.
Sensitivity analysis
We performed sensitivity analyses on the primary outcomes to see the effect of exclusion of studies at high risk of bias. Where the exclusion of studies at high risk of bias led to significant changes in the pooled analysis, we excluded such studies from the meta‐analysis.
Summary of findings and assessment of the certainty of the evidence
We assessed the certainty of the evidence using the GRADE approach (Guyatt 2011). We rated each important outcome as described by Balshem 2011.
-
High: we are very confident that the true effect lies close to that of the estimate of the effect.
-
Moderate: we are moderately confident in the effect estimate. The true effect is likely to be close to the estimate of the effect.
-
Low: our confidence in the effect estimate is limited. The true effect may be substantially different from the estimate of the effect.
-
Very low: we have very little confidence in the effect estimate. The true effect is likely to be substantially different from the estimate of effect.
RCTs started as high‐certainty evidence and quasi‐experimental design studies started as low‐certainty evidence. The certainty of the evidence was downgraded if there were valid reasons within the following five categories: risk of bias, imprecision, inconsistency, indirectness, and publication bias. The evidence could also be upgraded if there was a large effect, a dose–response effect, and if all plausible residual confounding would reduce a demonstrated effect or would suggest a spurious effect if there was no effect observed (Balshem 2011). We summarized our findings in summary of findings Table 1 and summary of findings Table 2.
Results
Description of studies
We provided descriptions of the included and excluded studies in the Characteristics of included studies and Characteristics of excluded studies tables. Studies awaiting classification were described in the Characteristics of studies awaiting classification table, and ongoing studies in the Characteristics of ongoing studies table.
Results of the search
We identified 1085 reports through the electronic search and one additional report through contact with study authors. We removed two duplicates and screened the remaining 1084 abstracts against the review's inclusion criteria. Of these, we identified 77 unique reports for full‐text screening (Figure 1). We included 10 studies (46 articles) and excluded 21 studies (31 articles).
Included studies
Overall, 46 reports corresponding to 10 studies met the inclusion criteria, from which 12 comparisons were drawn. Seven studies (providing eight comparisons) used a non‐pyrethroid‐like IRS throughout the study (Chaccour 2021; Corbel 2012; Gogue 2020; Namuganga 2021; Loha 2019; Protopopoff 2018; West 2014). Two studies (providing two comparisons) used a pyrethroid‐like IRS throughout (Keating 2011; Pinder 2015). One study used a pyrethroid‐like insecticide in the first study year, but replaced it with a non‐pyrethroid‐like insecticide for the two subsequent years, and, therefore, provided two different comparisons (Kafy 2017). As the mean residual efficacy of the deltamethrin insecticide used in the first year is less than six months, it is not expected that any impact from the first year's intervention would carry over into the subsequent years' comparison. Consequently, overall, eight studies contributed to Comparison 1: IRS using non‐pyrethroid‐like insecticides, while three studies contributed to Comparison 2: IRS using pyrethroid‐like insecticides.
Comparison 1: indoor residual spraying using non‐pyrethroid‐like insecticides
The eight studies evaluating the effect of non‐pyrethroid‐like IRS comprised six cRCTs and two quasi‐experimental design studies. Four of the six cRCTs evaluated the effect of adding IRS to ITNs using a two‐armed study design (Chaccour 2021; Kafy 2017; Loha 2019; West 2014). The remaining two cRCTs had four arms. Corbel 2012 compared universal coverage of ITNs (defined as one ITN per sleeping unit); universal coverage of ITNs plus carbamate‐treated plastic sheeting; targeted ITNs (defined as one ITN per sleeping unit of children younger than 6 years or pregnant women); and targeted ITNs plus IRS. The latter two arms provide the comparison for this review. Protopopoff 2018 used a 2 × 2 factorial design which compared standard LLINs; standard LLINs plus IRS; pyrethroid‐PBO nets; and pyrethroid‐PBO nets plus IRS. The former and latter two arms each provide a comparison for this review. The two quasi‐experimental design studies included one CBA (Gogue 2020) and one ITS design (Namuganga 2021).
Each of the eight studies were conducted in sub‐Saharan Africa. Of the six cRCTs, one was conducted in Ethiopia (Loha 2019); one in south‐east Sudan (Kafy 2017), one in Mozambique (Chaccour 2021), one in Benin (Corbel 2012), and two in north‐west Tanzania (Protopopoff 2018; West 2014). The two quasi‐experimental design studies were conducted in Ghana (Gogue 2020) and Uganda (Namuganga 2021). All eight studies were conducted in areas where the primary vectors were described as resistant or highly resistant to pyrethroid insecticides. The study sites in Ethiopia and south‐east Sudan were described as experiencing seasonal transmission, while those in Benin, Ghana, Uganda, Mozambique, and north‐west Tanzania were described as perennial transmission areas. None of the studies were conducted in exclusively epidemic areas.
Interventions
Coverage
Three studies described IRS application coverage as between 80% and 90% of households in the study area (Chaccour 2021; Kafy 2017; West 2014), and the remaining five studies as above 90% (Corbel 2012; Gogue 2020; Loha 2019; Namuganga 2021; Protopopoff 2018).
Insecticide
Three studies implemented IRS using a wettable powder (WP) formulation of the carbamate bendiocarb, at a dose of 400 mg/m² (Corbel 2012; Namuganga 2021; West 2014). One study switched from a pyrethroid‐like IRS to bendiocarb in the second year of the study (Kafy 2017). One study stopped using bendiocarb in the third year of the study and began implementing IRS with another non‐pyrethroid‐like insecticide: Actellic 300CS (a commercial formulation of pirimiphos‐methyl) (Namuganga 2021). Three studies used Actellic 300CS throughout, at a dose of 1 g/m² (Chaccour 2021; Gogue 2020; Protopopoff 2018). The remaining study used Propoxur WP at a dose of 2 g/m² (Loha 2019).
Frequency
The frequency of spraying varied depending on the eco‐epidemiological conditions of each location and the type of insecticide used. Three studies conducted two rounds per year, approximately four months apart, preceding each of two annual transmission peaks (Kafy 2017; Namuganga 2021; West 2014), though Namuganga 2021 implemented Actellic 300CS IRS annually for the final two years of the study. Two studies repeated the IRS cycle annually (Chaccour 2021; Loha 2019), and two studies conducted only one spraying round (Gogue 2020; Protopopoff 2018). Full characteristics of the interventions are summarized in Table 4.
| Study | AI, formulation, and dose | Frequency of application | Coverage | Who carried out the spraying | Vector species |
|---|---|---|---|---|---|
| Comparison 1: IRS using non‐pyrethroid‐like insecticides plus ITNs vs ITNs alone | |||||
| Pirimiphos‐methyl (Actellic 300 CS) 1 g AI/m² | Annually, October–November 2016 and 2017 | 2016: 83% 2017: 85% | President's Malaria Initiative Africa Indoor Residual Spraying (PMI AIRS) | An gambiae s.l. and An funestus s.l. | |
| Bendiocarb 80% wettable powder (FICAM 80, Bayer) 400 mg/mU | Every 8 months, June 2008 to December 2009 | Aimed for 80%; actual coverage was 92% | Unreported | An gambiae s.l. and An funestus s.l. | |
| Pirimiphos‐methyl (Actellic 300 CS) 1 g AI/m² | Once, August–September 2017 | 95.6–96.9% | AngloGold Ashanti | An gambiae s.l. and An funestus | |
| Kafy 2017 | Bendiocarb 80% wettable powder (FICAM 80, Bayer) 200 mg/m² | Twice a year, August and late December, 2013 and 2014 | 2013: 82% 2014: 83% | Unreported | An arabiensis and An funestus s.l. |
| Namuganga 2021 | Bendiocarb | Twice a year, December 2014 to February 2015; June–July 2015; November–December 2015 | 96.9% (Nagongera district) | Unreported | An gambiae and An arabiensis
|
| Namuganga 2021 | Pirimiphos‐methyl (Actellic 300 CS) | Annually | Unreported | Unreported | An gambiae and An arabiensis
|
| Propoxur | Annually, prior to transmission season (September 2014, July 2015, July 2016) | 95–96% | Locally recruited spray personnel and supervisors | An arabiensis and An pharoensis | |
| Pirimiphos‐methyl 30% capsule suspension (Actellic 300CS) 1 g AI/m² | Once, February 2015 | Standard ITN arm: 0.5% (95% CI 0.1 to 2.0) Standard ITN + IRS arm: 94% (95% CI 92 to 96) Pyrethroid‐PBO net arm: 4% (95% CI 0.5 to 29) Pyrethroid‐PBO net + IRS arm: 94% (95% CI 87 to 97) Buffer size between clusters: minimum outer buffer zone of 300 m. Only the inner core area was used for the measurement of study outcomes | Unreported | An gambiae s.s., An arabiensis and An funestus | |
| Bendiocarb 80% wettable powder (FICAM 80, Bayer) 400 mg/m² | Twice, December 2011 to January 2012 and April 2012 to May 2012 | Aimed for 80% (actual coverage was 89.3–92.1%) | RTI International on behalf of PMI | An gambiae s.s. and An arabiensis | |
| Comparison 2: IRS using pyrethroid‐like insecticides plus ITNs vs ITNs alone | |||||
| Kafy 2017 | Deltamethrin (25 mg/m², formulation not reported, Chema Industries) | Twice, in August and late December 2012 | 99% | Unreported | An gambiae s.l. and An funestus s.l. |
| DDT wettable powder 1–2 g AI/m² | Once, June–July 2009 | Aimed for 80% (84.8% of households sampled sprayed within 12 months) | Unreported | An arabiensis and An gambiae s.s. | |
| DDT 75% wettable powder (Hindustan Insecticides) 2 g AI/m² | Once per year, July 2010 and July–August 2011 | Aimed for 80% (actual coverage was 83–86%) | Operators from the Gambian National Malaria Control Programme and team leaders from the regional health team | An gambiae s.l. | |
AI: active ingredient; An arabiensis: Anopheles arabiensis; An funestus: Anopheles funestus; Angambiae: Anopheles gambiae; An pharoensis: Anopheles pharoensis; CI: confidence interval; DDT: dichloro‐diphenyl‐trichlorethane; IRS: indoor residual spraying; ITN: insecticide‐treated net; PBO: piperonyl butoxide.
Insecticide‐treated nets in intervention and control arms
ITN ownership, defined as the proportion of households owning at least one ITN, was high (80% or higher) in six studies (Chaccour 2021; Gogue 2020; Kafy 2017; Loha 2019; Namuganga 2021; Protopopoff 2018). The remaining two studies reported alternative measures of coverage. West 2014 reported the proportion of households with at least one ITN per sleeping space (51.6% to 52.8%). Corbel 2012 reported the proportion of sleeping units protected by an ITN (38% to 45%). Notably, this study aimed to evaluate the use of targeted ITNs (covering pregnant women and children under six years old only) and, therefore, did not aim for full coverage of the population. Both West 2014 and Corbel 2012 were considered to have met the inclusion criteria of 50% of households owning at least one ITN, but as this specific proportion was not reported, these studies were not given a high, moderate, or low ownership rating. In each of the eight included studies, ITN distribution was equal between the intervention and control arms.
ITN use (defined as the proportion of individuals using an ITN the previous night) was high (80% or higher) in three studies (Chaccour 2021; Kafy 2017; Namuganga 2021), moderate (50% to 79%) in two studies (Gogue 2020; Protopopoff 2018), and low (less than 50%) in two studies (Corbel 2012; West 2014). Loha 2019 did not report the proportion of individuals using an ITN the previous night, and was, therefore, not given a high, moderate, or low rating for ITN use. Instead, Loha 2019 reported the proportion of households in which one or more individuals used an ITN the previous night. This proportion declined during the study, from 47% to 49% in the first six months of the study to less than 10% after one year. Specific measurements of ITN ownership and use for each study are summarized in Table 5.
| Study | Arm | ITN ownership: | ITN use: % individuals using an ITN the previous night (unless otherwise stated)a |
|---|---|---|---|
| Comparison 1: IRS using non‐pyrethroid‐like insecticides plus ITNs vs ITNs alone | |||
|
| Control | High 2017: 54% 2018: 95% | High 92 to 94% |
| Intervention | |||
| Control | Not rated Not reported. Proportion of sleeping spaces protected by ITN: 38% (95% CI 36 to 41) | Low 43% (40 to 45) | |
| Intervention | Not rated Not reported. Proportion of sleeping spaces protected by ITN: 45% (95% CI 43 to 48) | Low 43% (40 to 46) | |
| Both arms | High | Moderate 2016: 75.5% (children aged < 5 years) | |
|
| Control | High 2013: 82.1% 2014: 98.6% | High 2013: 74% 2014: 82% |
| Intervention | High 2013: 75% 2014: 82% | ||
| N/A. Measurements reported are for Nagongera study site. ITN ownership and use in the remaining 4 sites was not reported | High 2015: 95.5% | High 99% | |
| Control | High At baseline: 100% | Not rated Not reported. Proportion of households where ≥ 1 member used an ITN the previous night: weeks 1–26: 49%; weeks 26–53: 27%; weeks 53–79: 6%; weeks 79–121: 1% | |
| Intervention | Not rated Not reported. Proportion of households where ≥ 1 member used an ITN the previous night: weeks 1–26: 47%; weeks 26–53: 26%; weeks 53–79: 8%; weeks 79–121: 1% | ||
| Standard ITNs | High At 9 months' postintervention: 97% (95% CI 93 to 99) | High At 9 months' postintervention: 80% (95% CI 75 to 85) | |
| Standard ITNs + IRS | Moderate At 9 months' postintervention: 76% (95% CI 70 to 80) | Moderate At 9 months' postintervention: 76% (95% CI 70 to 80) | |
| Pyrethroid‐PBO net | High At 9 months' postintervention: 98% (95% CI 97 to 99) | Moderate At 9 months' postintervention: 78% (95% CI 73 to 82) | |
| Pyrethroid‐PBO net + IRS | High At 9 months' postintervention: 98% (95% CI 95 to 99) | Moderate At 9 months' postintervention: 77% (95% CI 70 to 83) | |
| Control | Not rated Not reported. Proportion of households with 1 ITN per sleeping space: February–March: 52.2 (95% CI 47.8 to 56.5); June–July: 51.6 (95% CI 47 to 56); October–December: 52.8 (95% CI 47.6 to 58) | Low February–March: 46.6 (95% CI 41.7 to 51.6); June–July: 40.7 (95% CI 34.7 to 47); October–December: 36 (95% CI 29.8 to 42.6)
| |
| Intervention | Not rated Not reported. Proportion of households with 1 ITN per sleeping space: February–March: 57.2 (95% CI 53.6 to 60.7) June–July: 57.4 (95% CI 54 to 60.9) October–December: 56.8 (95% CI 51.7 to 61.8) | Low February–March: 53 (95% CI 47.5 to 58.3) June–July: 44.1 (95% CI 39.2 to 49.2) October–December: 36.1 (95% CI 31 to 41.5) | |
| Comparison 2: IRS using pyrethroid‐like insecticides plus ITNs vs ITNs alone | |||
| Control | High 99.6%
| High 79% | |
| Intervention | High 79% | ||
| Control | Not rated Not reported. Proportion of people living in household with ≥ 1 ITN: 72% (95% CI 70.2 to 73.7) | Low Mean: 46.2 (95% CI 43.9 to 48.6)
| |
| Intervention | Not rated Not reported. Proportion of people living in household with ≥ 1 ITN: 75.8% (95% CI 74.2 to 77.4) | Moderate Mean: 50.7% (95% CI 48.6 to 52.8) | |
| Control | Not rated Not reported | High Mean average across all clusters: 2011: 92% 2012: 96% | |
| Intervention | High Mean average across all clusters: 2011: 89% 2012: 93% | ||
CI: confidence interval; IRS: indoor residual spraying; ITN: insecticide‐treated net; LLIN: long‐lasting insecticidal net.
aITN ownership and use rating cut‐offs prespecified in protocol (high: > 80%; moderate: 50–79%; low: < 50%).
In three studies, the ITN distributed was the deltamethrin‐based PermaNet 2.0 (Corbel 2012; Kafy 2017; Loha 2019), one study distributed alphacypermethrin‐treated nets (Chaccour 2021), while two studies involved distribution of the permethrin‐based Olyset Net (Protopopoff 2018; West 2014). In the two arms that evaluated the efficacy of pyrethroid‐PBO nets, Protopopoff 2018 used Olyset Plus instead of Olyset Net. The two quasi‐experimental design studies did not provide details of the ITN distributed but stated that a mass distribution campaign had recently taken place (Gogue 2020; Namuganga 2021).
Cointerventions
The studies did not report on any cointerventions.
Outcomes
Epidemiological
Two cRCTs and one quasi‐experimental design study reported clinical malaria outcomes in people of all ages (Chaccour 2021; Gogue 2020; Loha 2019), while four cRCTs and one quasi‐experimental design study measured these outcomes in children only; one in children under six years of age (Corbel 2012); one in children aged six months to 10 years (Namuganga 2021); one in children aged one to 10 years (Kafy 2017) and two in children aged between six months and 14 years (Protopopoff 2018; West 2014). Of the two primary outcomes, four cRCTs (Chaccour 2021; Corbel 2012; Kafy 2017; Loha 2019) and two quasi‐experimental design studies (Gogue 2020; Namuganga 2021) measured malaria incidence. Five cRCTs measured malaria parasite prevalence (Chaccour 2021; Corbel 2012; Kafy 2017; Protopopoff 2018; West 2014). Three studies also reported the prevalence of childhood anaemia (Loha 2019; Protopopoff 2018; West 2014). Protopopoff 2018 limited their analysis of anaemia to children aged six months to four years. We extracted the nine‐month postintervention cross‐sectional survey results only, as IRS was not conducted beyond this time point, which acted as their main endpoint for assessing the efficacy of IRS (Protopopoff 2018).
Entomological
Four cRCTs reported the estimated EIR (Chaccour 2021; Corbel 2012; Protopopoff 2018; West 2014), and two cRCTs reported the sporozoite rate (Protopopoff 2018; West 2014). Five cRCTs and one quasi‐experimental design study reported a measure of the adult mosquito density (Chaccour 2021; Corbel 2012; Loha 2019; Namuganga 2021; Protopopoff 2018; West 2014).
Mosquito insecticide resistance
One study additionally reported the prevalence in malaria vectors of alleles associated with resistance to pyrethroids (1014F kdr) and carbamates (G119S ace1) (Corbel 2012). One study reported the level of phenotypic resistance to pyrethroids (Kafy 2017).
Comparison 2: insecticide‐treated nets using pyrethroid‐like insecticides
The three cRCTs evaluating pyrethroid‐like IRS were conducted in sub‐Saharan Africa; in the west lowlands of Eritrea (Keating 2011), the upper river region of The Gambia (Pinder 2015), and in south‐east Sudan (Kafy 2017). Each study area was described as seasonal transmission areas.
Interventions
Coverage
IRS application coverage was described as consistently above 80% (Kafy 2017), 84.8% (Keating 2011), and 83% to 86% (Pinder 2015).
Insecticide
Two studies used a WP formulation of DDT, at a dose of 1 g/m² to 2 g/m² (Keating 2011; Pinder 2015). One study used the pyrethroid deltamethrin at a dose of 25mg/m² in the first study year (Kafy 2017).
Frequency
The frequency of spraying varied depending on the eco‐epidemiological conditions of each location. One study conducted IRS once per year to coincide with the start of the transmission season (Pinder 2015). One study conducted two rounds, four months apart, preceding each of two annual transmission peaks (Kafy 2017). One study conducted only one spraying round (Keating 2011). Full characteristics of the interventions have been summarized in Table 4.
Insecticide‐treated nets in intervention and control arms
ITN ownership, defined as the proportion of households owning at least one ITN, was reported as high (80% or higher) in two studies (Kafy 2017; Pinder 2015). The remaining study, Keating 2011, reported an alternative measure of ITN coverage; the proportion of people living in households with at least one ITN (72% to 75.8%). Consequently, although this study was considered to have met the inclusion criteria of 50% household ITN ownership, it was not given a high, moderate, or low ITN ownership rating. ITN distribution was equal between the intervention and control arms in all three studies.
ITN use (defined as the proportion of individuals using an ITN the previous night) was high (80% or higher) in two studies (Kafy 2017; Pinder 2015) and moderate (50 to 79%) in one study (Keating 2011).
Specific measurements of ITN ownership and use for each study are summarized in Table 5.
In one study, the ITN distributed was the deltamethrin‐based PermaNet 2.0 (Kafy 2017), while one study involved distribution of the permethrin‐based Olyset Net (Pinder 2015). One study did not distribute ITNs as the region already had high ITN ownership; any LLIN, or ITN that had been treated at least once in the last 11 months, was considered acceptable when measuring net ownership in this study (Keating 2011).
Cointerventions
One study listed larval habitat management and continued case management as cointerventions that were conducted in both intervention and control arms during the study period (Keating 2011). The remaining studies did not report on any cointerventions.
Outcomes
Epidemiological
Two studies measured clinical outcomes in children only; one in children aged one to 10 years of age (Kafy 2017), and one in children aged between six months and 14 years (Pinder 2015). The third study measured outcomes in participants of all ages (Keating 2011). Of the two primary outcomes, two studies measured malaria incidence (Kafy 2017; Pinder 2015), and all three studies measured malaria parasite prevalence. One study also reported the prevalence of childhood anaemia (Pinder 2015). For malaria parasite prevalence and anaemia prevalence, Pinder 2015 reported separately adjusted effect estimates for both years of the study, 2010 and 2011, so we included both estimates in the analysis separately.
Entomological
One study reported the estimated EIR, sporozoite rate, and adult mosquito density measured as the number of adult Anopheles gambiae s.l. collected per trap per night (Pinder 2015).
Mosquito insecticide resistance
One study measured the prevalence of alleles associated with pyrethroid resistance only (Kafy 2017).
Excluded studies
We excluded 25 full‐text articles, corresponding to 21 unique studies, for the following reasons:
-
study design did not meet the inclusion criteria (12 full‐text articles, 9 unique studies);
-
interventions in the experimental or comparator arms did not meet the inclusion criteria (13 full‐text articles, 12 unique studies).
Full details are provided in the Characteristics of excluded studies tables.
Studies awaiting classification
Five articles describing five studies are currently reported in the Characteristics of studies awaiting classification table. One described a study of stepped wedge design, for which the results are not presented in a form that can be used in this analysis; we have requested additional data from the study authors (Hamainza 2016). One article described a small entomological cross‐sectional survey but referred to an over‐arching RCT that may be measuring epidemiological outcomes; we have contacted the authors for further information regarding this RCT to determine whether it would meet the reviews' inclusion criteria (Soma 2021). The remaining three articles were conference abstracts for which there was insufficient information to determine whether the inclusion criteria are met; we have requested additional data from the study authors (Omondi 2019; Turnbull 2018; Zogo 2019).
Ongoing studies
We identified one study protocol published in 2020 for a randomized trial that is scheduled to take more than three years to complete (Zhou 2020). Further information regarding this ongoing study is provided in the Characteristics of ongoing studies table.
Risk of bias in included studies
Risk of bias in randomized controlled trials
Overall, the included cRCTs were well designed, with only one study causing concern over risk of bias (Figure 2). Details of the assessment are included in the risk of bias table of the Characteristics of included studies table.
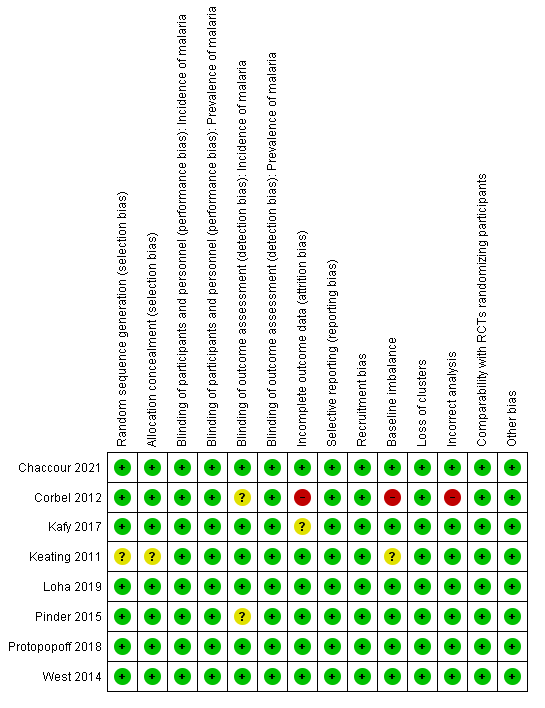
Risk of bias (randomized controlled trials): summary of review authors' judgements about each risk of bias item
Allocation
We assessed seven cRCTs at low risk of bias for random sequence generation and allocation concealment, as allocation was decided using a computerized randomization algorithm (Corbel 2012; Kafy 2017; Loha 2019; Pinder 2015; Protopopoff 2018; West 2014), or by drawing lots at a public ceremony (Chaccour 2021). One cRCT was at unclear risk of bias because the randomization procedure was not described (Keating 2011).
Blinding
Due to the nature of the IRS application, blinding of participants and study personnel was not possible. Participant and personnel knowledge of the intervention was not expected to have an influence on the outcomes included in this review.
One study blinded microscopists (Pinder 2015). However, all studies measured prevalence using either an RDT or blood smear examination. As these tests are objective, all seven studies were at low risk of detection bias. Two studies that measured malaria incidence depended on self‐reporting of fever, and as such the detection of this outcome may have been influenced by the participants' knowledge of the intervention (Corbel 2012; Pinder 2015). However, parasitaemia was confirmed using objective tests, and the study was, therefore, assessed as at unclear risk of bias.
Incomplete outcome data
One study reported a difference of more than 10% between the intervention and control arms in person‐days that were lost to follow‐up (Corbel 2012). This was judged at high risk of bias. Five studies had equivalent loss to follow‐up in intervention and control arms and were, therefore, at low risk of bias (Chaccour 2021; Keating 2011; Pinder 2015; Protopopoff 2018; West 2014). One study did not report numbers lost to follow‐up, but the authors stated that participants leaving the study area or moving homes between intervention and control arms were recorded and followed up to minimize the risk of attrition bias (Loha 2019). Therefore, the study was also considered at low risk of bias for this outcome. The remaining study did not report numbers lost to follow‐up or describe efforts to mitigate for this and was, therefore, considered at unclear risk of bias (Kafy 2017).
Selective reporting
The studies reported on each of their intended outcomes as specified in their registered protocols (low risk of reporting bias).
Other potential sources of bias
One study was at high risk of bias for incorrect analysis for the outcome of malaria parasite prevalence (Corbel 2012), due to concerns about repeated sampling of the same population leading to artificially narrower CIs for estimates of prevalence. To measure prevalence, the study authors conducted 12 cross‐sectional surveys at six‐week intervals, and reported the cumulative prevalence from across these 12 surveys, so that the unit of analysis was blood thick films rather than participants. The total number of registered children in the intervention villages was 890 and in control villages was 920, but the cumulative prevalence and 95% CI were calculated from sample sizes of 3649 in intervention villages and 4033 in control villages. This will result in narrower CIs for the RR estimate than would have been observed had the population been sampled once, introducing a bias in the meta‐analysis that exaggerated the weight of this study. Furthermore, Corbel 2012 was at high risk of bias for baseline imbalance, as the prevalence of malaria was significantly higher in the intervention group than control group at baseline (P < 0.01).
None of the studies were at risk of recruitment bias as the study participants were randomly selected. One study was at unclear risk of baseline imbalance, as the baseline data for prevalence were not reported (Keating 2011). No studies were at high or unclear risk of bias from loss of clusters or other biases.
Risk of bias in quasi‐experimental design studies
Randomization and allocation concealment are not applicable to Namuganga 2021 due to its ITS design. Gogue 2020 was at high risk of bias for these criteria due to its CBA design and because it was stated that districts were selected for IRS based on malaria burden and technical feasibility. Besides these inherent risks of bias, the two quasi‐experimental design studies were well‐designed with few other concerns over risk of bias (Figure 3).
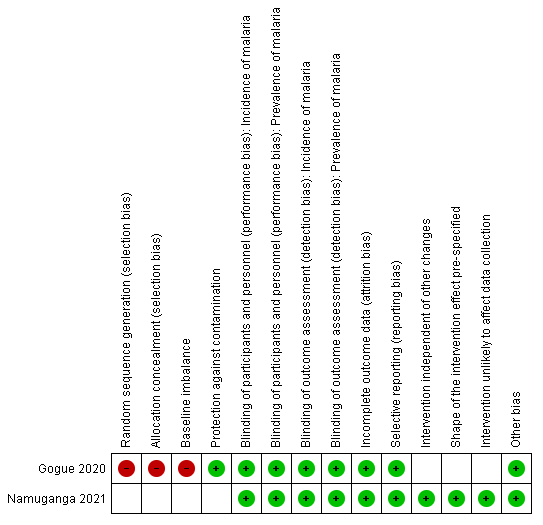
RIsk of bias (quasi‐experimental design studies): summary of review authors' judgements about each risk of bias item.
Due to the nature of the IRS application, blinding of participants and study personnel was not possible. Participant and personnel knowledge of intervention arm was not expected to have an influence on the objectively measured outcomes included in this review, and both studies were consequently considered at low risk of performance and detection bias. Both studies were also considered to be at low risk of attrition bias and selective reporting.
Gogue 2020 was at high risk of baseline imbalance as it was stated that districts malaria burden was higher in the arm receiving IRS. Namuganga 2021 was at low risk for each of the biases specifically relating to ITS design studies, as no other changes besides the introduction of IRS were implemented during the study period, the point of analysis was the time point that IRS was introduced, and the methods of data collection were the same before and after the intervention.
Effects of interventions
See: Summary of findings 1 Non‐pyrethroid‐like indoor residual spraying (IRS) plus insecticide‐treated nets (ITNs) versus ITNs alone for preventing malaria; Summary of findings 2 Pyrethroid‐like indoor residual spraying (IRS) + insecticide‐treated nets (ITNs) versus ITNs alone for preventing malaria
Comparison 1: adding indoor residual spraying using non‐pyrethroid‐like insecticides to insecticide‐treated nets
Eight studies investigated IRS using non‐pyrethroid‐like insecticides (Chaccour 2021; Corbel 2012; Gogue 2020; Kafy 2017; Loha 2019; Namuganga 2021; Protopopoff 2018; West 2014). See summary of findings Table 1.
Malaria incidence
Four cRCTs reported malaria incidence (Chaccour 2021; Corbel 2012; Kafy 2017; Loha 2019). Two studies reported a substantial benefit of IRS (Chaccour 2021; Kafy 2017), while two reported a slightly higher malaria incidence in the intervention arm (Corbel 2012; Loha 2019). This lack of consistency was reflected in the considerable heterogeneity (I² = 87%). Overall, the pooled analysis showed IRS may reduce malaria incidence (rate ratio 0.86, 95% CI 0.61 to 1.23; 4 cRCTs, 323,631 child‐years; Analysis 1.1; low‐certainty evidence; Figure 4).

Forest plot of comparison: 1 Non‐pyrethroid‐like indoor residual spraying (IRS) plus insecticide‐treated nets (ITNs) versus ITNs alone, outcome: 1.1 Malaria incidence.
We conducted a subgroup analysis by ITN usage, but this did not explain the heterogeneity observed between the studies (Analysis 1.2). Although the analysis showed that an effect was observed in each of the cRCTs with high ITN usage, while no effect was observed in the one cRCT with low ITN usage, this is counter‐intuitive, as IRS may be expected to have a greater impact on malaria transmission where ITNs are not being used. Of note, Loha 2019 was excluded from this subgroup analysis as it did not report ITN usage using a measurement that was comparable to the other studies. However, the use of ITNs in the study was also low and declined throughout the study. The proportion of houses where at least one individual had used an ITN the previous night fell from between 47% to 49% in the first 26 weeks of the study period to just 1% between weeks 79 and 121. Further subgroup analyses by IRS coverage and malaria transmission setting (seasonal/perennial) also failed to explain the cause of the heterogeneity.
A sensitivity analysis excluding Corbel 2012, the only study considered to have any high risks of bias, did not cause any significant changes to the results of the pooled analysis (Analysis 1.3), and, therefore, we did not exclude the study from the analysis.
The results from Kafy 2017 were noteworthy: the data from different years of the study appeared in both Comparison 1 and Comparison 2. The first year had shown the addition of IRS using a pyrethroid‐like insecticide had no effect on malaria incidence (rate ratio 1.00, 95% CI 0.36 to 2.78); in the second and third years, when a non‐pyrethroid‐like insecticide was used for IRS, there was a lower malaria incidence in the IRS arm (rate ratio 0.65, 95% CI 0.44 to 0.96).
Malaria incidence data from the two quasi‐experimental design studies are presented in Table 6. After four to five years of sustained IRS, Namuganga 2021 reported a dramatic reduction in the monthly number of cases of malaria per person relative to the pre‐intervention period (rate ratio 0.15, 95% CI 0.12 to 0.18). Gogue 2020 also reported a significant effect of IRS, with a difference‐in‐differences in cumulative malaria incidence across the six‐month peak malaria season between the IRS and non‐IRS arms of 37% (95% CI 18% to 57%).
| Study | Study design | Outcome | IRS + ITNs | ITNs alone | Measure of estimate of effect | Estimate of effect |
|---|---|---|---|---|---|---|
| Comparison 1: IRS using non‐pyrethroid‐like insecticides + ITNs vs ITNs alone | ||||||
| Controlled before‐after | Change in cumulative incidence from 6 months peak in 2016 (before intervention) to equivalent period in 2017 (after intervention) | −42% (95% CI 28% to 56%) | −5% (95% CI −6% to 15%) | Difference in differences | 37% (95% CI 18 to 57%) greater reduction in incidence observed in intervention arm; favouring IRS | |
| Interrupted time series | Mean monthly confirmed cases of malaria (adjusted for testing rate) | 894 (59 months post‐IRS | 2446 (12 months pre‐IRS) | Rate ratio | 0.15 (0.12 to 0.18); favouring IRS (fourth and fifth year post IRS) | |
IRS: indoor residual spraying.
Malaria parasite prevalence
Five cRCTs assessed the effect of IRS on malaria parasite prevalence. Four cRCTs showed a benefit of IRS with substantial reductions in prevalence. However, in one cRCT, the point estimates tended towards a higher prevalence in the IRS arm (25.6%; 95% CI 21.0% to 30.2%) than the control arm (19.5%; 95% CI 16.6% to 22.5%), with no difference demonstrated on statistical testing (Corbel 2012).
Across the included studies, the pooled analysis showed IRS was associated with a reduction in malaria parasite prevalence (RR 0.72, 95% CI 0.47 to 1.11; 5 cRCTs, Analysis 1.4). However, a sensitivity analysis excluding Corbel 2012, a study with two high risk of bias concerns relating to this outcome, led to significant changes in the results of the pooled analysis and, therefore, we excluded the results of this study from the analysis. Overall, after the exclusion of Corbel 2012, the pooled analysis showed IRS was associated with a large reduction in malaria parasite prevalence (RR 0.61, 95% CI 0.42 to 0.88; 4 cRCTs; 16,394 participants; Analysis 1.5; high‐certainty evidence; Figure 5).

Forest plot of comparison: 1 Non‐pyrethroid‐like indoor residual spraying (IRS) plus insecticide‐treated nets (ITNs) versus ITNs alone, outcome: 1.5 Malaria parasite prevalence (sensitivity analysis: exclusion of studies with high risk of bias; 1 study excluded; Corbel 2012).
One study provided two comparisons to the analysis, one comparing standard ITNs plus IRS versus standard ITNs alone, and one comparing pyrethroid‐PBO nets plus IRS versus pyrethroid‐PBO nets alone (Protopopoff 2018). In the comparison with standard ITNs, the addition of IRS was associated with a lower point estimate in malaria parasite prevalence (RR 0.52, 95% CI 0.18 to 1.52). In the comparison with PBO nets, the direction of effect was the same (RR 0.85, 95% CI 0.34 to 2.11). However, both analyses were underpowered and the confidence intervals included no effect. The smaller difference between the intervention and control arms in the second comparison may be explained by the improved effectiveness of pyrethroid‐PBO nets over standard ITNs seen in the study. Even in the absence of IRS, the pyrethroid‐PBO net arm had a prevalence of 31%, compared to 55% in the standard ITN arm.
Again, the results from Kafy 2017 were noteworthy: the data from different years of the study appeared in both Comparison 1 and Comparison 2. In the first year, following IRS implementation using a pyrethroid‐like insecticide, the point estimate tended towards higher prevalence in the IRS arm, with no difference demonstrated on statistical testing (RR 1.96, 95% CI 0.86 to 4.46). However, in the second and third years, when a non‐pyrethroid‐like insecticide was used for IRS, there was a large reduction in prevalence (RR 0.41, 95% CI 0.28 to 0.61).
Entomological inoculation rate
Four studies reported estimates of the EIR (Chaccour 2021; Corbel 2012; Protopopoff 2018; West 2014). Due to considerable differences between studies in the way the EIR was defined and estimated, and in the effect sizes reported, it was not possible to conduct a meta‐analysis. We presented the results of each study in Table 7.
| Trial | Methods of EIR measurement | Comparison | Mean EIR (95% CI) | |
|---|---|---|---|---|
| IRS + ITNs | ITNs alone | |||
| Comparison 1: IRS using non‐pyrethroid‐like insecticides + ITNs vs ITNs alone | ||||
| Mean number of infectious bites per household per month | IRS with standard ITN vs standard ITN alone | 0.28 (0.08 to 0.60) | 0.57 (0.28 to 1.00) | |
| Mean number of infected bites per person per year (estimated from the number of anopheline vectors caught using human landing catches and the proportion of anopheline vectors infective) | IRS with standard ITN vs standard ITN alone | 7.3 (3.8 to 14.2) | 9.4 (5.1 to 17.1) | |
| Mean number of infected bites per household per night (the number of infective anopheline vectors caught using light traps in 1 night per month was used as a proxy for this) | IRS with standard ITN vs standard ITN alone | 0.05 (n = 413) | 1.76 (n = 449) | |
| IRS with pyrethroid‐PBO net vs pyrethroid‐PBO net alone | 0.00 (n = 459) | 0.26 (n = 452) | ||
| Mean number of infected bites per household per month (estimated from the number of infective anopheline vectors caught using light traps in 1 night) | IRS with standard ITN vs standard ITN alone | 1.3 (0.4 to 4.4) | 1.1 (0.4 to 2.8) | |
| Comparison 2: IRS using pyrethroid‐like insecticides + ITNs vs ITNs alone | ||||
| Mean number of infected bites per person per transmission season (estimated from the number of anopheline vectors caught using light traps and the proportion of anopheline vectors infective) | IRS with standard ITN vs standard ITN alone: 2010 | 1.08 (0.16 to 4.02) | 2.44 (0.69 to 6.39) | |
| IRS with standard ITN vs standard ITN alone: 2011 | 0.29 (0.00 to 2.66) | 1.45 (0.15 to 5.69) | ||
CI: confidence interval; EIR: entomological inoculation rate; IRS: indoor residual spraying; ITN: insecticide‐treated net; n: number of participants; PBO: piperonyl butoxide.
In summary, in two of the four studies, the point estimates tended towards a reduction in EIR when IRS was added, but both analyses were underpowered and the confidence intervals included no effect. In the remaining two trials, little or no difference was observed. The results correlated with the reported epidemiological outcomes in three of the four studies.
-
Chaccour 2021 reported mean values for the number of infected bites per household per year that tended towards a reduction when IRS was added (0.28, 95% CI 0.08 to 0.60) compared to the control arm (0.57, 95% CI 0.28 to 1.00). This was concordant with the results the study reported for epidemiological outcomes.
-
Corbel 2012 reported the mean value for the number of infected bites per person per year when IRS was added (7.3, 95% CI 3.8 to 14.2) and in the control arm (9.4, 95% CI 5.1 to 17.1). This minor difference was concordant with the results the study reported for epidemiological outcomes, where there was no evidence of a lower malaria incidence or parasite prevalence in the combined arm.
-
In both comparisons of Protopopoff 2018, there was a much lower mean EIR when IRS was added to nets. Similarly to the above epidemiological outcomes, the lower EIR was more marked in the comparison with the standard ITNs; whereas the EIR in the ITN‐only arm was much lower with the pyrethroid‐PBO net arm. We could not calculate CIs as the standard errors were not given for the means.
-
West 2014 reported no reduction in the mean number of infected bites per household per month when IRS was added to ITNs (1.1, 95% CI 0.4 to 2.8 in the ITN‐only arm versus 1.3, 95% CI 0.4 to 4.4 in the IRS plus ITNs arm). This finding was inconsistent with the epidemiological outcomes, where the study reported a large reduction in both malaria parasite prevalence and anaemia prevalence.
Sporozoite rate
Two studies reported the effect on the sporozoite rate (Protopopoff 2018; West 2014). Both defined this outcome as the proportion of An gambiaes.l. caught from light traps with sporozoites. Table 8 summarizes the characteristics and effects of all studies reporting the sporozoite rate included in this review.
| Trial | Assessment method | Comparison | Reported results | Effect size (95% CIs) | ||
|---|---|---|---|---|---|---|
| IRS + ITNs | ITNs alone | IRS + ITNs | ITNs alone | |||
| Comparison 1: IRS using non‐pyrethroid‐like insecticides plus ITNs vs ITNs alone | ||||||
| % of An gambiae s.l. caught from human landing catches with sporozoites (ELISA) | IRS with standard ITN vs standard ITN alone | 3.22% (95% CI 1.76 to 4.68) | 2.83% (95% CI 1.69 to 3.97) | Not reported | ||
| % of An arabiensis caught from light trap catches, pyrethrum spray catches, artificial outdoor pit shelters and human landing catches with sporozoites (ELISA) | IRS with standard ITN vs standard ITN alone | 0% (0/238) | 0% (0/78) | |||
| % of An gambiae s.l. caught from light traps with sporozoites (ELISA) | IRS with standard ITN vs standard ITN alone | 0.4% (1/269) | 2.8% (19/683) | |||
| IRS with pyrethroid‐PBO net vs pyrethroid‐PBO net alone | 0.0% (0/343) | 0.7% (2/305) | ||||
| IRS with standard ITN vs standard ITN alone | 1.8% (95% CI 0.5 to 6.2; n = 717) | 2.5% (95% CI 2.1 to 3.1; n = 3059) | OR 0.72 (0.21 to 2.53) | |||
| Comparison 2: IRS using pyrethroid‐like insecticides plus ITNs vs ITNs alone | ||||||
| % of An gambiae s.l. caught from light traps with sporozoites (ELISA) | IRS with standard ITN vs standard ITN alone: 2010 | 0.19% (4/2131) | 0.32% (9/2829) | RR 0.59 (0.18 to 1.91) | ||
| IRS with standard ITN vs standard ITN alone: 2011 | 0.65% (5/773) | 0.09% (1/1131) | RR 7.32 (0.86 to 62.5) | |||
An arabiensis: Anopheles arabiensis; Angambiae: Anopheles gambiae; CI: confidence interval; ELISA: enzyme‐linked immunosorbent assay; IRS: indoor residual spraying; ITN: insecticide‐treated net; MD: mean difference; OR: odds ratio; PBO: piperonyl butoxide; RR: risk ratio.
aNot adjusted for clustering.
-
In both comparisons of Protopopoff 2018, the sporozoite rate was lower when IRS was added. In the IRS plus standard ITNs arm the proportion was 0.4% versus 2.8% in the standard ITNs alone comparison. In the IRS plus pyrethroid‐PBO net arm, the proportion was 0% versus 0.7% in the pyrethroid‐PBO net alone comparison. The study did not report 95% CIs for these measurements or an overall effect estimate.
-
West 2014 reported a 28% reduction in the odds of a mosquito being infected with sporozoites in the intervention arm compared to the control arm, but the CI included no effect (OR 0.72, 95% CI 0.21 to 2.53).
Adult mosquito density
Four studies reported the adult mosquito density as the number of adult mosquitoes caught per trap per night (Chaccour 2021; Loha 2019; Protopopoff 2018; West 2014). One study measured adult mosquito density as a biting rate (Corbel 2012), Loha 2019 additionally reported the indoor resting density (number of mosquitoes per house per night) and outdoor resting density (number of mosquitoes caught per artificial outdoor pit shelter per day). Namuganga 2021 reported a human biting rate, calculated as the number of female Anopheles mosquitoes captured per house per night. Differences in the measurement and reporting of these outcomes precluded a quantitative synthesis. Table 9 summarizes the characteristics and effects of all studies reporting adult mosquito density included in this review.
| Trial | Methods of adult mosquito density measurement | Comparison | Reported results Mean (95% CIs) | Effect size (95% CIs) | |
|---|---|---|---|---|---|
| IRS + ITNs | ITNs alone | ||||
| Comparison 1: IRS using non‐pyrethroid‐like insecticides + ITNs vs ITNs alone | |||||
| Average number of mosquitoes collected per trap night (CDC Light trap) | IRS with standard ITN vs standard ITN alone: An funestus | 0.57 (0.52 to 0.62) | 1.34 (1.22 to 2.46) | Rate ratio 0.52 (0.41 to 0.67) | |
| IRS with standard ITN vs standard ITN alone: An gambiae s.l. | 0.08 (0.07 to 0.10) | 0.15 (0.13 to 0.18) | Rate ratio 0.66 (0.47 to 0.93) | ||
| Mean number of bites per person per year from human landing catches (16 person‐nights per village (total 28 villages divided evenly into 4 arms) per survey (total 8 surveys)) | IRS with standard ITN vs standard ITN alone | 228 (149 to 348; n = 896) | 331 (218 to 504; n = 896) | Rate ratio 0.69 (0.38 to 1.25) | |
| Human biting rate (number of female Anopheles mosquitoes captured per house‐night of collection) | IRS with standard ITN vs standard ITN alone | 3.23 | 18.71 | Rate ratio 0.29 (0.17 to 0.50) | |
| Indoor host seeking density (mosquitoes per trap per night (592 person‐nights per arm) | IRS with standard ITN vs standard ITN alone | 0.09 (0.05 to 0.15) | 0.03 (0.01 to 0.08) | Not reported | |
| Indoor resting density (mosquitoes per house per night) (560 person‐nights per arm) | 0.34 (0.24 to 0.47) | 0.06 (0.03 to 0.12) | |||
| Outdoor resting density (mosquitoes per pit per day) (224 collection days per arm) | 0.43 (0.27 to 1.69) | 0.04 (0.01 to 0.15) | |||
| Indoor human biting rate (based on light trap catches) | 0.26 (0.19 to 0.37) | 0.10 (0.06 to 0.17) | |||
| Indoor human biting rate (based on human landing catches) | 3.95 (2.39 to 6.53) | 1.63 (0.92 to 2.89) | |||
| Outdoor human biting rate (based on artificial outdoor pit shelters) | 4.16 (2.52 to 6.86) | 1.68 (0.95 to 2.97) | |||
| Mean number of vectors caught in light traps per night per household (7 randomly selected houses per cluster (total 48 clusters divided evenly into 4 arms) for 1 night per month (total 8 months)) | IRS with standard ITN vs standard ITN alone | 2.37 (n = 425) | 2.83 (n = 471) | Not reported | |
| IRS with pyrethroid‐PBO net vs pyrethroid‐PBO net alone | 1.85 (n = 493) | 1.84 (n = 468) | |||
| Mean number of An gambiae s.l. per house per night (8 randomly selected houses per cluster (total 40 clusters divided evenly into 2 arms) for 1 night per month (total 21 months)) | IRS with standard ITN vs standard ITN alone | 0.4 (0.1 to 1.4; n = 1893) | 1.7 (0.5 to 6.4; n = 1892) | Rate ratio 0.23 (0.04 to 1.44) | |
| Comparison 2: IRS using pyrethroid‐like insecticides + ITNs vs ITNs alone | |||||
| Mean number of An gambiae s.l. per trap per night (6 sentinel rooms in 32 clusters) | IRS with standard ITN vs standard ITN alone: 2010 light traps | 3.70 (2.03 to 5.37) | 4.92 (3.05 to 6.79) | MD −1.22 (−3.58 to 1.14) | |
| IRS with standard ITN vs standard ITN alone: 2010 exit traps | 0.40 (−0.15 to 0.66) | 0.54 (0.18 to 0.89) | MD −0.13 (−0.54 to 0.28) | ||
| IRS with standard ITN vs standard ITN alone: 2011 light traps | 1.27 (0.39 to 2.15) | 1.96 (0.69 to 3.24) | MD −0.69 (−2.15 to 0.77) | ||
| IRS with standard ITN vs standard ITN alone: 2011 exit traps | 0.06 (0.01 to 0.10) | 0.46 (−0.23 to 1.15) | MD −0.40 (−1.05 to 0.25) | ||
An funestus: Anopheles funestus; Angambiae: Anopheles gambiae; CI: confidence interval; IRS: indoor residual spraying; ITNs: insecticide‐treated nets; MD: mean difference; PBO: piperonyl butoxide.
In summary, five studies reported a reduction in adult mosquito density when IRS was added, and one study did not (Loha 2019). In each case, the results correlated with the reported epidemiological outcomes.
-
Chaccour 2021 reported a reduction of approximately 50% in mosquitoes caught per trap per night in the intervention arm compared to the control arm (rate ratio 0.52, 95% CI 0.41 to 0.67).
-
Corbel 2012 reported a reduction of bites by 31% in the intervention arm compared to the control arm, but the CIs were wide and included no effect (rate ratio 0.69, 95% CI 0.38 to 1.25).
-
Loha 2019 reported the indoor resting density was significantly higher in the IRS arm (0.34, 95% CI 0.24 to 0.47) than the control arm (0.06, 95% CI 0.03 to 0.12). Similar, the outdoor resting density was higher in the IRS arm (0.43, 95% CI 0.27 to 1.69) than the control arm (0.04, 95% CI 0.01 to 0.15).
-
Namuganga 2021 reported a dramatic reduction in human biting rate from 18.71 female Anopheles per house per night in the control arm to 3.23 in the intervention arm (rate ratio 0.29, 95% CI 0.17 to 0.50).
-
In the IRS plus standard ITNs versus standard ITNs alone comparison, Protopopoff 2018 reported a mean number of 2.37 vectors caught per night per household in the intervention arm and 2.83 vectors per night per household in the control arm. In the IRS plus pyrethroid‐PBO nets arm, the mean number was 1.85 versus 1.84 in the pyrethroid‐PBO nets alone comparison. The study did not report 95% CIs for these measurements or an overall effect estimate.
-
West 2014 reported a 77% reduction of adult mosquitoes in the intervention arm compared to the control arm, but the CIs included no effect (rate ratio 0.23, 95% CI 0.04 to 1.44).
Anaemia prevalence
Three studies assessed the effect on anaemia prevalence. One study provided two comparisons to the analysis, one comparing standard ITNs plus IRS versus standard ITNs alone, and one comparing pyrethroid‐PBO nets plus IRS versus pyrethroid‐PBO nets alone. Similarly to the previous outcomes, the introduction of IRS with a standard ITN was associated with a reduction in the prevalence of anaemia compared to a standard ITN alone (RR 0.17, 95% CI 0.04 to 0.67), but the combination of IRS plus pyrethroid‐PBO net was not favourable to a pyrethroid‐PBO net alone (RR 1.18, 95% CI 0.09 to 15.08). Of the remaining two studies, neither West 2014 (RR 0.63, 95% CI 0.35 to 1.14) nor Loha 2019 (RR 0.94, 95% CI 0.72 to 1.22) showed a significantly reduced anaemia prevalence when IRS was added .
Across the included studies, the pooled analysis showed that the prevalence of anaemia may be lower when IRS is added to communities using ITNs (RR 0.71, 95% CI 0.38 to 1.31; 3 cRCTs, 4288 participants; Analysis 1.6; low‐certainty evidence), and the meta‐analysis showed moderate heterogeneity between studies (I² = 49%). A subgroup analysis by ITN usage did not resolve this heterogeneity (Analysis 1.7). All studies achieved high coverage of IRS and, therefore, we did not perform a subgroup analysis by this metric.
Level of insecticide resistance
Corbel 2012 reported the allelic frequency of 1014F kdr, a genetic marker associated with resistance to pyrethroid insecticide in mosquitoes. There was no difference detected in the frequency of 1014F kdr in the IRS plus ITNs arm (86%, 95% CI 80% to 92%) compared to the ITN‐only arm (86%, 95% CI 79% to 93%). The study did not report the individual frequency in each intervention arm of G119S ace1, a genetic marker associated with resistance to carbamate insecticides. However, it commented that the allele was almost absent across the study area during the study (less than 5%, 2123 participants). Kafy 2017 reported that there was less phenotypic pyrethroid resistance in the IRS plus ITNs arm, with 68% mosquito mortality after exposure to deltamethrin (95% CI 60.0% to 76.0%) compared to 56.1% mortality in the ITN‐only arm (95% CI 47.1% to 64.9%). Loha 2019 reported that, during the study period, the was no change in the primary vector's susceptibility to pyrethroids or the carbamate insecticides used for IRS.
Comparison 2: adding indoor residual spraying with pyrethroid‐like insecticides to insecticide‐treated nets
Three studies investigated IRS using pyrethroid‐like insecticides (Kafy 2017; Keating 2011; Pinder 2015). See summary of findings Table 2.
Malaria incidence
The two studies that reported the effect on malaria incidence found no evidence of an effect of IRS in communities that were using ITNs (rate ratio 1.07, 95% CI 0.80 to 1.43; 2 cRCTs, 15,717 child‐years; Analysis 2.1; moderate‐certainty evidence).
Malaria parasite prevalence
The three studies that reported the effect on malaria parasite prevalence found no evidence of an effect of IRS in communities that were using ITNs, with no heterogeneity between the studies (RR 1.11, 95% CI 0.86 to 1.44; 10,820 participants; Analysis 2.2; moderate‐certainty evidence).
Entomological inoculation rate
One study reported the effect on the estimated EIR (Pinder 2015). The authors defined the estimated EIR as the mean number of infected bites per person per transmission season. In the first year, the study reported a difference in the estimated EIR of 2.44 (95% CI 0.69 to 6.39) without IRS and 1.08 (95% CI 0.16 to 4.02) when IRS was added, but the CIs overlapped. The pattern in the point estimates was the same in the second year, with an estimated EIR of 1.45 (95% CI 0.15 to 5.69) without IRS and 0.29 (95% CI 0.00 to 2.66) when IRS was added. While the point estimates were not consistent with the human data, the wide CIs make no inference possible. Table 7 summarizes the characteristics and effects of all studies reporting the EIR included in this review.
Sporozoite rate
One study reported the effect on the sporozoite rate (Pinder 2015). The authors defined this as the proportion of An gambiaes.l. caught using light traps, with sporozoites. The actual number of infected mosquitoes detected was small (19 in both arms across the two years). In the first year of assessment, 0.19% (4/2131) of An gambiae s.l. were positive in the intervention arm and 0.32% (9/2829) were positive in the control arm. The risk of a mosquito being infected with sporozoites was 41% lower in the intervention arm compared to the control arm, but the analysis was underpowered (RR 0.59, 95% CI 0.18 to 1.91). In the second year of assessment, 0.65% (5/773) of An gambiae s.l. were positive in the intervention arm and 0.09% (1/1131) in the control arm. The risk of a mosquito being infected with sporozoites was more than seven times higher in the intervention arm compared to the control arm, but again this was underpowered (RR 7.32, 95% CI 0.86 to 62.5). Table 8 summarizes the characteristics and effects of all studies reporting the sporozoite rate included in this review.
Adult mosquito density
One study reported the effect on adult mosquito density (Pinder 2015). The authors defined this outcome as the number of An gambiae s.l. per trap per night. The study used both light and exit traps. There were no clear differences between the arms, and the CIs were wide (2010 using light traps: MD –1.22, 95% CI –3.58 to 1.14; 2010 using exit traps: MD –0.13, 95% CI –0.54 to 0.28; 2011 using light traps: MD –0.69, 95% CI –2.15 to 0.77; and 2011 using exit traps: MD –0.40, 95% CI –1.05 to 0.25). Table 9 summarizes the characteristics and effects of all studies reporting adult mosquito density included in this review.
Anaemia prevalence
The one study that reported the prevalence of anaemia found no evidence of an effect of IRS in communities that were using ITNs (RR 1.12, 95% CI 0.89 to 1.40; 4186 participants, 1 cRCT; Analysis 2.3; low‐certainty evidence).
Level of insecticide resistance
No studies reported level of insecticide resistance in such a way that an effect size could be calculated. However, Kafy 2017 reported that in the first year of the study there was no difference in mosquito deltamethrin mortality when IRS was added (65%, 95% CI 49% to 81%) compared to the control arm (60%, 95% CI 44% to 76%).
Discussion
Summary of main results
In communities using ITN, adding IRS with a non‐pyrethroid‐like insecticide may reduce malaria incidence on average, although there was qualitative heterogeneity between studies and it may be that the intervention is not always effective. IRS with a non‐pyrethroid‐like insecticide also appeared to reduce malaria parasite prevalence. However, the high certainty of this result depended on the exclusion of a study that was considered to be at high risk of bias for this outcome.
No additional benefit of adding IRS using a pyrethroid‐like insecticide to ITNs was detected for malaria outcomes. For both comparisons included in this review, entomological outcomes were reported inconsistently, and qualitative comparisons with the human malaria outcomes showed mixed correlation in relation to the presence or absence of an effect.
Overall completeness and applicability of evidence
There are two main reasons why the use of IRS in addition to ITNs may be a preferred policy option to the use of ITNs alone. First, it may improve malaria control simply because two interventions are better than one. Second, the addition of IRS may compensate for lower efficacy of ITNs due to pyrethroid resistance. Our review attempted to explore the relative importance of these two potential benefits by presenting separate analyses dependent on the target site of the insecticides used for IRS.
The rationale behind this was that if pyrethroid resistance is causing ITNs to fail, introducing a pyrethroid‐like IRS will be unlikely to have a benefit. The included studies that used pyrethroid‐like insecticides for IRS followed this rationale, showing no effect on epidemiological outcomes. In contrast, introducing a non‐pyrethroid‐like IRS should improve malaria disease outcomes, particularly in areas where vectors are resistant to pyrethroid insecticides. While the included studies that used non‐pyrethroid‐like insecticides did demonstrate a reduction in epidemiological outcomes on average, this effect was not always observed. More research will be needed to understand this heterogeneity in order to predict when and where the combination of IRS and ITNs will not have an impact.
A third justification for combining a non‐pyrethroid‐like IRS with ITNs is to restore susceptibility to pyrethroids in the vector or slow the emergence of resistance in the first place (WHO 2012). By this rationale, waiting to implement the combination of IRS with ITNs until incremental impact is demonstrated over ITNs alone may mean doing so far too late (Killeen 2018). While many studies characterized insecticide resistance (either phenotypically, genotypically, or both) at the start of the follow‐up period, only three studies continued to monitor the changes in insecticide resistance beyond the intervention roll‐out, though each used different outcomes to measure this (Corbel 2012; Kafy 2017; Loha 2019). Consequently, we were unable to adequately explore the effect that mass roll‐out of both core interventions would have on insecticide resistance. While standardized methods of measuring and reporting insecticide resistance would help to compare these results between studies, it remains a matter of conjecture whether a considerable change in resistance would be detected within the period of a typical RCT.
Given the wide geographical variety of malaria endemicities, transmission patterns, and insecticide resistance, we need to be cautious with inferences to policy from the limited number of studies conducted to date. Applicability of vector control interventions in different settings is always a point for discussion, as the ecology, behaviour, and insecticide‐resistance profiles of Anopheles mosquitoes can vary massively between and within species. The included studies in this review were all conducted in Sub‐Saharan Africa and the majority were conducted in areas where the primary vector species was An gambiae s.s. or An funestus, two highly anthropophagic and endophagic vectors that are potentially more susceptible to both IRS and ITNs (Okumu 2011). The partially zoophagic and exophagic vector Anopheles arabiensis acted as the primary vector in two studies (Kafy 2017; Loha 2019), and as a secondary vector in a further two studies (Namuganga 2021; West 2014). The effect of combining IRS with ITNs in the studies reported here will not necessarily apply to other target species in other settings, particularly those which are highly exophilic and exophagic.
Quality of the evidence
Details of the downgrading for GRADE are presented in summary of findings Table 1 and summary of findings Table 2.
Adding IRS using a non‐pyrethroid‐like insecticide to ITNs may reduce malaria incidence (low‐certainty evidence). While four included studies showed a beneficial effect of IRS on malaria incidence, two included studies showed no effect, leading to imprecision and inconsistency in the results. This decreased the certainty of the evidence and raised doubts about the generalizability to other settings. We found evidence that IRS using a non‐pyrethroid‐like insecticide reduces malaria parasite prevalence (high‐certainty evidence).
Adding IRS using a pyrethroid‐like insecticide to ITNs provided no improvement in malaria outcomes across the three studies (low‐ to moderate‐certainty evidence).
For both comparisons included in this review, entomological outcomes were reported inconsistently, and consequently we do not know whether IRS with either non‐pyrethroid‐like or pyrethroid‐like insecticides affect entomological indicators of malaria (very low‐certainty evidence)
Potential biases in the review process
As not all the included studies used standardized measures of ITN ownership and use, we were unable to directly compare these metrics between each of the studies. Any comparisons made between studies that used different measurements to one another are limited. The exclusion of certain studies that did not use standardized measurements reduce our understanding of the effect of IRS at high, moderate, or low ITN ownership and use. In future studies, the use of consistent measurements that follow defined criteria would alleviate this issue for later updates of the review.
We attempted to subgroup studies based on seasonal, perennial, or epidemic malaria transmission status, as per the review protocol, and this variable was not found to influence the effect of IRS. However, as all the study countries experience annual variation in transmission and epidemics can occur in areas with seasonal or perennial transmission, assigning study areas to single categories is challenging, and the value of comparisons made between these categories is, therefore, somewhat limited. In future updates to this review, a comparison between study areas of high or low transmission following WHO defined criteria may be more appropriate.
In order to include data from as many studies as possible into the meta‐analysis for malaria parasite prevalence, we converted the adjusted odds ratios reported in five studies into adjusted RRs. This conversion assumes that all subjects have the same outcome risk when not exposed and that all subjects experience the same change in outcome odds when exposed. Consequently, there is a risk that these conversions may lead to biased adjusted RRs where this is not the case.
Agreements and disagreements with other studies or reviews
Two reviews have been conducted on this topic: a narrative review published by the WHO (WHO 2014a) and a systematic review (Sherrard‐Smith 2018). The narrative review included the studies by Corbel 2012, Pinder 2015, and West 2014 (WHO 2014a) and concluded that West 2014, the only study of the three to show a reduction in malaria epidemiological outcomes favouring the intervention, differed from the other studies because the study area had low ITN usage, which the implementation of IRS compensated for. However, our review includes several studies that show a reduction in epidemiological outcomes even in areas with high ITN usage. Whether or not the IRS was conducted using a pyrethroid‐like insecticide appears to be a better predictor for success or failure of the intervention, although there remains some heterogeneity when a non‐pyrethroid‐like insecticide is used.
The systematic review meta‐analyzed results from experimental hut studies and found that IRS substantially reduced entomological indicators of malaria in these types of studies (Sherrard‐Smith 2018). The review also utilized a malaria transmission model incorporating this data to determine the impact on epidemiological indices, concluding that the impact of IRS was highly dependent on bednet use, seasonality, endemicity, and pyrethroid resistance status of local mosquito populations. Our review could not confirm an impact of IRS on entomological outcomes, and does not conclusively show whether bednet use or seasonality of malaria have any impact on the efficacy of IRS.

Study flow diagram.

Risk of bias (randomized controlled trials): summary of review authors' judgements about each risk of bias item

RIsk of bias (quasi‐experimental design studies): summary of review authors' judgements about each risk of bias item.

Forest plot of comparison: 1 Non‐pyrethroid‐like indoor residual spraying (IRS) plus insecticide‐treated nets (ITNs) versus ITNs alone, outcome: 1.1 Malaria incidence.

Forest plot of comparison: 1 Non‐pyrethroid‐like indoor residual spraying (IRS) plus insecticide‐treated nets (ITNs) versus ITNs alone, outcome: 1.5 Malaria parasite prevalence (sensitivity analysis: exclusion of studies with high risk of bias; 1 study excluded; Corbel 2012).

Comparison 1: Non‐pyrethroid‐like indoor residual spraying (IRS) plus insecticide‐treated nets (ITNs) versus ITNs alone, Outcome 1: Malaria incidence

Comparison 1: Non‐pyrethroid‐like indoor residual spraying (IRS) plus insecticide‐treated nets (ITNs) versus ITNs alone, Outcome 2: Malaria incidence (net usage subgroup analysis)

Comparison 1: Non‐pyrethroid‐like indoor residual spraying (IRS) plus insecticide‐treated nets (ITNs) versus ITNs alone, Outcome 3: Malaria incidence (sensitivity analysis: exclusion of studies with high risk of bias)

Comparison 1: Non‐pyrethroid‐like indoor residual spraying (IRS) plus insecticide‐treated nets (ITNs) versus ITNs alone, Outcome 4: Malaria parasite prevalence

Comparison 1: Non‐pyrethroid‐like indoor residual spraying (IRS) plus insecticide‐treated nets (ITNs) versus ITNs alone, Outcome 5: Malaria parasite prevalence (sensitivity analysis: exclusion of studies with high risk of bias)

Comparison 1: Non‐pyrethroid‐like indoor residual spraying (IRS) plus insecticide‐treated nets (ITNs) versus ITNs alone, Outcome 6: Anaemia prevalence

Comparison 1: Non‐pyrethroid‐like indoor residual spraying (IRS) plus insecticide‐treated nets (ITNs) versus ITNs alone, Outcome 7: Anaemia prevalence (net usage subgroup analysis)

Comparison 2: Pyrethroid‐like indoor residual spraying (IRS) plus insecticide‐treated nets (ITNs) versus ITNs alone, Outcome 1: Malaria incidence

Comparison 2: Pyrethroid‐like indoor residual spraying (IRS) plus insecticide‐treated nets (ITNs) versus ITNs alone, Outcome 2: Malaria parasite prevalence

Comparison 2: Pyrethroid‐like indoor residual spraying (IRS) plus insecticide‐treated nets (ITNs) versus ITNs alone, Outcome 3: Anaemia prevalence
| Patient or population: people at risk of malaria Setting: sub‐Saharan Africa (Ethiopia, Mozambique, Tanzania, Sudan, Ghana, Uganda) Intervention: combination of IRS + ITNs – using an insecticide for IRS that has a different target site to the pyrethroids used in ITNs Comparison: ITNs alone | ||||||
| Outcomes | Anticipated absolute effects* (95% CI) | Relative effect | Number of participants | Certainty of the evidence | Comments: the combination of IRS and ITNs, when the insecticide used for IRS has a different target site to the pyrethroids used in ITNs | |
|---|---|---|---|---|---|---|
| Risk with ITNs alone | Risk with IRS + ITNs | |||||
| Malaria incidence | 357 cases per 1000 years at risk | 307 cases per 1000 years at risk (218 to 439) | Rate ratio 0.86 | 323,631 person‐years at risk | ⊕⊕⊝⊝ | May reduce malaria incidence compared to ITNs alone. |
| Malaria parasite prevalence | 213 cases per 1000 | 119 cases per 1000 (90 to 158) | RR 0.61 (0.42 to 0.88) | 16,394 participants | ⊕⊕⊕⊕ | Reduces malaria parasite prevalence compared to ITNs alone. |
| EIR | — | — | Not estimable IRS was associated with a lower EIR in 2 of the 4 cRCTs | (5 comparisons, 4 cRCTs) | ⊕⊝⊝⊝ | We did not know if there was an effect on the EIR compared to ITNs alone. |
| Anaemia prevalence | 133 cases per 1000 | 94 cases per 1000 (50 to 174) | RR 0.71 | 4288 participants | ⊕⊕⊝⊝ | May have reduced anaemia prevalence compared to ITNs alone. |
| *The risk in the intervention arm (and its 95% CI) is based on the assumed risk in the comparison arm and the relative effect of the intervention (and its 95% CI). The assumed risk of the comparison arm is calculated from the total number of events/total number of participants in the control arms of the trials contributing to the meta‐analysis. CI: confidence interval; cRCT: cluster randomized controlled trial; EIR: entomological inoculation rate; IRS: indoor residual spraying; ITN: insecticide‐treated net; RR: risk ratio. | ||||||
| GRADE Working Group grades of evidence | ||||||
| aDowngraded one level for serious imprecision: the CIs were wide and included both a substantive decrease and no effect. | ||||||
| Patient or population: people at risk of malaria Setting: sub‐Saharan Africa (The Gambia, Sudan, Eritrea) Intervention: combination of IRS + ITNs – using an insecticide for IRS that has the same target site as the pyrethroids used in ITNs Comparison: ITNs alone | ||||||
| Outcomes | Anticipated absolute effects* (95% CI) | Relative effect | Number of participants | Certainty of the evidence | Comments: the combination of IRS and ITNs, when the insecticide used for IRS has the same target site as the pyrethroids used in ITNs | |
|---|---|---|---|---|---|---|
| Risk with ITNs alone | Risk with IRS + ITNs | |||||
| Malaria incidence | 215 cases per 1000 child‐years | 230 cases per 1000 child‐years (172 to 307) | Rate ratio 1.07 | 15,717 child‐years | ⊕⊕⊕⊝ | Probably had little or no effect on malaria incidence compared to ITNs alone. |
| Malaria parasite prevalence | 13.2 cases per 100 | 14.7 cases per 100 (11.4 to 19.0) | RR 1.11 (0.86 to 1.44) | 10,820 participants | ⊕⊕⊕⊝ | Probably had little or no effect on malaria parasite prevalence compared to ITNs alone. |
| EIR | — | — | Mean EIR was lower with IRS + ITNs than ITNs alone | (2 comparisons, 1 cRCT) | ⊕⊝⊝⊝ | We do not know if there was an effect on the EIR compared to ITNs alone. |
| Anaemia prevalence (haemoglobin < 8 g/dL) | 42.6 cases per 100 | 47.7 cases per 100 (37.9 to 59.6) | RR 1.12 | 4186 participants | ⊕⊕⊝⊝ | May have had little or no effect on anaemia prevalence compared to ITNs alone. |
| *The risk in the intervention arm (and its 95% CI) is based on the assumed risk in the comparison arm and the relative effect of the intervention (and its 95% CI). The assumed risk of the comparison arm is calculated from the total number of events/total number of participants in the control arms of the trials contributing to the meta‐analysis. CI: confidence interval; cRCT: cluster randomized controlled trial; IRS: indoor residual spraying; ITN: insecticide‐treated net; RR: risk ratio. | ||||||
| GRADE Working Group grades of evidence | ||||||
| aDowngraded one level for serious imprecision: the CIs were wide and included both an increase and decrease in the outcome. | ||||||
| Insecticides and formulations | Dosage (g AI/m²) |
|---|---|
| DDT WP | 1–2 |
| Malathion WP | 2 |
| Fenitrothion WP | 2 |
| Pirimiphos‐methyl WP, EC | 1–2 |
| Pirimiphos‐methyl CS | 1 |
| Bendiocarb WP, WP‐SB | 0.1–0.4 |
| Propoxur WP | 1–2 |
| Alpha‐cypermethrin WP, SC, WG‐SB | 0.02–0.03 |
| Bifenthrin WP | 0.025–0.05 |
| Cyfluthrin WP | 0.02–0.05 |
| Deltamethrin WP, WG, WG‐SB, SC‐PE | 0.02–0.025 |
| Etofenprox WP | 0.1–0.3 |
| Lambda‐cyhalothrin WP, CS | 0.02–0.03 |
| AI: active ingredient; CS: capsule suspension; DDT: dichloro‐diphenyl‐trichlorethane; EC: emulsifiable concentrate; SC: suspension concentrate; SC‐PE: polymer‐enhanced suspension concentrate; WG: water‐dispersible granule; WG‐SB: water‐dispersible granules packaged in water‐soluble bags; WP: wettable powder; WP‐SB: wettable powder in sealed water‐soluble bags. | |
| Product name | Product type | Status of WHO recommendation |
|---|---|---|
| DawaPlus 2.0 | Deltamethrin coated on polyester | Interim |
| Duranet | Alpha‐cypermethrin incorporated into polyethylene | Full |
| Interceptor | Alpha‐cypermethrin coated on polyester | Full |
| LifeNet | Deltamethrin incorporated into polypropylene | Interim |
| MAGNet | Alpha‐cypermethrin incorporated into polyethylene | Full |
| MiraNet | Alpha‐cypermethrin incorporated into polyethylene | Interim |
| Olyset Net | Permethrin incorporated into polyethylene | Full |
| Olyset Plus | Permethrin and PBO incorporated into polyethylene | Interim |
| Panda Net 2.0 | Deltamethrin incorporated into polyethylene | Interim |
| PermaNet 2.0 | Deltamethrin coated on polyester | Full |
| PermaNet 3.0 | Combination of deltamethrin coated on polyester with strengthened border (side panels), and deltamethrin and PBO incorporated into polyethylene (roof) | Interim |
| Royal Sentry | Alpha‐cypermethrin incorporated into polyethylene | Full |
| SafeNet | Alpha‐cypermethrin coated on polyester | Full |
| Veeralin | Alpha‐cypermethrin and PBO incorporated into polyethylene | Interim |
| Yahe | Deltamethrin coated on polyester | Interim |
| Yorkool | Deltamethrin coated on polyester | Full |
| LLIN: long‐lasting insecticidal nets; PBO: piperonyl butoxide. | ||
| Insecticide | Formulation | Dosage (mg AI/m² of netting) |
|---|---|---|
| Alpha‐cypermethrin | SC 10% | 20–40 |
| Cyfluthrin | EW 5% | 50 |
| Deltamethrin | SC 1%; WT 25%; and WT 25% + binder | 15–25 |
| Etofenprox | EW 10% | 200 |
| Lambda‐cyhalothrin | CS 2.5% | 10–15 |
| Permethrin | EC 10% | 200–500 |
| ICON MAXX (long‐lasting lambda‐cyhalothrin formulation) | CS 10% + binder | 50–83 |
| AI: active ingredient; EC: emulsifiable concentrate; EW: emulsion, oil in water; CS: capsule suspension; SC: suspension concentrate; WT: water dispersible tablet. | ||
| Study | AI, formulation, and dose | Frequency of application | Coverage | Who carried out the spraying | Vector species |
|---|---|---|---|---|---|
| Comparison 1: IRS using non‐pyrethroid‐like insecticides plus ITNs vs ITNs alone | |||||
| Pirimiphos‐methyl (Actellic 300 CS) 1 g AI/m² | Annually, October–November 2016 and 2017 | 2016: 83% 2017: 85% | President's Malaria Initiative Africa Indoor Residual Spraying (PMI AIRS) | An gambiae s.l. and An funestus s.l. | |
| Bendiocarb 80% wettable powder (FICAM 80, Bayer) 400 mg/mU | Every 8 months, June 2008 to December 2009 | Aimed for 80%; actual coverage was 92% | Unreported | An gambiae s.l. and An funestus s.l. | |
| Pirimiphos‐methyl (Actellic 300 CS) 1 g AI/m² | Once, August–September 2017 | 95.6–96.9% | AngloGold Ashanti | An gambiae s.l. and An funestus | |
| Kafy 2017 | Bendiocarb 80% wettable powder (FICAM 80, Bayer) 200 mg/m² | Twice a year, August and late December, 2013 and 2014 | 2013: 82% 2014: 83% | Unreported | An arabiensis and An funestus s.l. |
| Namuganga 2021 | Bendiocarb | Twice a year, December 2014 to February 2015; June–July 2015; November–December 2015 | 96.9% (Nagongera district) | Unreported | An gambiae and An arabiensis
|
| Namuganga 2021 | Pirimiphos‐methyl (Actellic 300 CS) | Annually | Unreported | Unreported | An gambiae and An arabiensis
|
| Propoxur | Annually, prior to transmission season (September 2014, July 2015, July 2016) | 95–96% | Locally recruited spray personnel and supervisors | An arabiensis and An pharoensis | |
| Pirimiphos‐methyl 30% capsule suspension (Actellic 300CS) 1 g AI/m² | Once, February 2015 | Standard ITN arm: 0.5% (95% CI 0.1 to 2.0) Standard ITN + IRS arm: 94% (95% CI 92 to 96) Pyrethroid‐PBO net arm: 4% (95% CI 0.5 to 29) Pyrethroid‐PBO net + IRS arm: 94% (95% CI 87 to 97) Buffer size between clusters: minimum outer buffer zone of 300 m. Only the inner core area was used for the measurement of study outcomes | Unreported | An gambiae s.s., An arabiensis and An funestus | |
| Bendiocarb 80% wettable powder (FICAM 80, Bayer) 400 mg/m² | Twice, December 2011 to January 2012 and April 2012 to May 2012 | Aimed for 80% (actual coverage was 89.3–92.1%) | RTI International on behalf of PMI | An gambiae s.s. and An arabiensis | |
| Comparison 2: IRS using pyrethroid‐like insecticides plus ITNs vs ITNs alone | |||||
| Kafy 2017 | Deltamethrin (25 mg/m², formulation not reported, Chema Industries) | Twice, in August and late December 2012 | 99% | Unreported | An gambiae s.l. and An funestus s.l. |
| DDT wettable powder 1–2 g AI/m² | Once, June–July 2009 | Aimed for 80% (84.8% of households sampled sprayed within 12 months) | Unreported | An arabiensis and An gambiae s.s. | |
| DDT 75% wettable powder (Hindustan Insecticides) 2 g AI/m² | Once per year, July 2010 and July–August 2011 | Aimed for 80% (actual coverage was 83–86%) | Operators from the Gambian National Malaria Control Programme and team leaders from the regional health team | An gambiae s.l. | |
| AI: active ingredient; An arabiensis: Anopheles arabiensis; An funestus: Anopheles funestus; Angambiae: Anopheles gambiae; An pharoensis: Anopheles pharoensis; CI: confidence interval; DDT: dichloro‐diphenyl‐trichlorethane; IRS: indoor residual spraying; ITN: insecticide‐treated net; PBO: piperonyl butoxide. | |||||
| Study | Arm | ITN ownership: | ITN use: % individuals using an ITN the previous night (unless otherwise stated)a |
|---|---|---|---|
| Comparison 1: IRS using non‐pyrethroid‐like insecticides plus ITNs vs ITNs alone | |||
|
| Control | High 2017: 54% 2018: 95% | High 92 to 94% |
| Intervention | |||
| Control | Not rated Not reported. Proportion of sleeping spaces protected by ITN: 38% (95% CI 36 to 41) | Low 43% (40 to 45) | |
| Intervention | Not rated Not reported. Proportion of sleeping spaces protected by ITN: 45% (95% CI 43 to 48) | Low 43% (40 to 46) | |
| Both arms | High | Moderate 2016: 75.5% (children aged < 5 years) | |
|
| Control | High 2013: 82.1% 2014: 98.6% | High 2013: 74% 2014: 82% |
| Intervention | High 2013: 75% 2014: 82% | ||
| N/A. Measurements reported are for Nagongera study site. ITN ownership and use in the remaining 4 sites was not reported | High 2015: 95.5% | High 99% | |
| Control | High At baseline: 100% | Not rated Not reported. Proportion of households where ≥ 1 member used an ITN the previous night: weeks 1–26: 49%; weeks 26–53: 27%; weeks 53–79: 6%; weeks 79–121: 1% | |
| Intervention | Not rated Not reported. Proportion of households where ≥ 1 member used an ITN the previous night: weeks 1–26: 47%; weeks 26–53: 26%; weeks 53–79: 8%; weeks 79–121: 1% | ||
| Standard ITNs | High At 9 months' postintervention: 97% (95% CI 93 to 99) | High At 9 months' postintervention: 80% (95% CI 75 to 85) | |
| Standard ITNs + IRS | Moderate At 9 months' postintervention: 76% (95% CI 70 to 80) | Moderate At 9 months' postintervention: 76% (95% CI 70 to 80) | |
| Pyrethroid‐PBO net | High At 9 months' postintervention: 98% (95% CI 97 to 99) | Moderate At 9 months' postintervention: 78% (95% CI 73 to 82) | |
| Pyrethroid‐PBO net + IRS | High At 9 months' postintervention: 98% (95% CI 95 to 99) | Moderate At 9 months' postintervention: 77% (95% CI 70 to 83) | |
| Control | Not rated Not reported. Proportion of households with 1 ITN per sleeping space: February–March: 52.2 (95% CI 47.8 to 56.5); June–July: 51.6 (95% CI 47 to 56); October–December: 52.8 (95% CI 47.6 to 58) | Low February–March: 46.6 (95% CI 41.7 to 51.6); June–July: 40.7 (95% CI 34.7 to 47); October–December: 36 (95% CI 29.8 to 42.6)
| |
| Intervention | Not rated Not reported. Proportion of households with 1 ITN per sleeping space: February–March: 57.2 (95% CI 53.6 to 60.7) June–July: 57.4 (95% CI 54 to 60.9) October–December: 56.8 (95% CI 51.7 to 61.8) | Low February–March: 53 (95% CI 47.5 to 58.3) June–July: 44.1 (95% CI 39.2 to 49.2) October–December: 36.1 (95% CI 31 to 41.5) | |
| Comparison 2: IRS using pyrethroid‐like insecticides plus ITNs vs ITNs alone | |||
| Control | High 99.6%
| High 79% | |
| Intervention | High 79% | ||
| Control | Not rated Not reported. Proportion of people living in household with ≥ 1 ITN: 72% (95% CI 70.2 to 73.7) | Low Mean: 46.2 (95% CI 43.9 to 48.6)
| |
| Intervention | Not rated Not reported. Proportion of people living in household with ≥ 1 ITN: 75.8% (95% CI 74.2 to 77.4) | Moderate Mean: 50.7% (95% CI 48.6 to 52.8) | |
| Control | Not rated Not reported | High Mean average across all clusters: 2011: 92% 2012: 96% | |
| Intervention | High Mean average across all clusters: 2011: 89% 2012: 93% | ||
| CI: confidence interval; IRS: indoor residual spraying; ITN: insecticide‐treated net; LLIN: long‐lasting insecticidal net. | |||
| Study | Study design | Outcome | IRS + ITNs | ITNs alone | Measure of estimate of effect | Estimate of effect |
|---|---|---|---|---|---|---|
| Comparison 1: IRS using non‐pyrethroid‐like insecticides + ITNs vs ITNs alone | ||||||
| Controlled before‐after | Change in cumulative incidence from 6 months peak in 2016 (before intervention) to equivalent period in 2017 (after intervention) | −42% (95% CI 28% to 56%) | −5% (95% CI −6% to 15%) | Difference in differences | 37% (95% CI 18 to 57%) greater reduction in incidence observed in intervention arm; favouring IRS | |
| Interrupted time series | Mean monthly confirmed cases of malaria (adjusted for testing rate) | 894 (59 months post‐IRS | 2446 (12 months pre‐IRS) | Rate ratio | 0.15 (0.12 to 0.18); favouring IRS (fourth and fifth year post IRS) | |
| IRS: indoor residual spraying. | ||||||
| Trial | Methods of EIR measurement | Comparison | Mean EIR (95% CI) | |
|---|---|---|---|---|
| IRS + ITNs | ITNs alone | |||
| Comparison 1: IRS using non‐pyrethroid‐like insecticides + ITNs vs ITNs alone | ||||
| Mean number of infectious bites per household per month | IRS with standard ITN vs standard ITN alone | 0.28 (0.08 to 0.60) | 0.57 (0.28 to 1.00) | |
| Mean number of infected bites per person per year (estimated from the number of anopheline vectors caught using human landing catches and the proportion of anopheline vectors infective) | IRS with standard ITN vs standard ITN alone | 7.3 (3.8 to 14.2) | 9.4 (5.1 to 17.1) | |
| Mean number of infected bites per household per night (the number of infective anopheline vectors caught using light traps in 1 night per month was used as a proxy for this) | IRS with standard ITN vs standard ITN alone | 0.05 (n = 413) | 1.76 (n = 449) | |
| IRS with pyrethroid‐PBO net vs pyrethroid‐PBO net alone | 0.00 (n = 459) | 0.26 (n = 452) | ||
| Mean number of infected bites per household per month (estimated from the number of infective anopheline vectors caught using light traps in 1 night) | IRS with standard ITN vs standard ITN alone | 1.3 (0.4 to 4.4) | 1.1 (0.4 to 2.8) | |
| Comparison 2: IRS using pyrethroid‐like insecticides + ITNs vs ITNs alone | ||||
| Mean number of infected bites per person per transmission season (estimated from the number of anopheline vectors caught using light traps and the proportion of anopheline vectors infective) | IRS with standard ITN vs standard ITN alone: 2010 | 1.08 (0.16 to 4.02) | 2.44 (0.69 to 6.39) | |
| IRS with standard ITN vs standard ITN alone: 2011 | 0.29 (0.00 to 2.66) | 1.45 (0.15 to 5.69) | ||
| CI: confidence interval; EIR: entomological inoculation rate; IRS: indoor residual spraying; ITN: insecticide‐treated net; n: number of participants; PBO: piperonyl butoxide. | ||||
| Trial | Assessment method | Comparison | Reported results | Effect size (95% CIs) | ||
|---|---|---|---|---|---|---|
| IRS + ITNs | ITNs alone | IRS + ITNs | ITNs alone | |||
| Comparison 1: IRS using non‐pyrethroid‐like insecticides plus ITNs vs ITNs alone | ||||||
| % of An gambiae s.l. caught from human landing catches with sporozoites (ELISA) | IRS with standard ITN vs standard ITN alone | 3.22% (95% CI 1.76 to 4.68) | 2.83% (95% CI 1.69 to 3.97) | Not reported | ||
| % of An arabiensis caught from light trap catches, pyrethrum spray catches, artificial outdoor pit shelters and human landing catches with sporozoites (ELISA) | IRS with standard ITN vs standard ITN alone | 0% (0/238) | 0% (0/78) | |||
| % of An gambiae s.l. caught from light traps with sporozoites (ELISA) | IRS with standard ITN vs standard ITN alone | 0.4% (1/269) | 2.8% (19/683) | |||
| IRS with pyrethroid‐PBO net vs pyrethroid‐PBO net alone | 0.0% (0/343) | 0.7% (2/305) | ||||
| IRS with standard ITN vs standard ITN alone | 1.8% (95% CI 0.5 to 6.2; n = 717) | 2.5% (95% CI 2.1 to 3.1; n = 3059) | OR 0.72 (0.21 to 2.53) | |||
| Comparison 2: IRS using pyrethroid‐like insecticides plus ITNs vs ITNs alone | ||||||
| % of An gambiae s.l. caught from light traps with sporozoites (ELISA) | IRS with standard ITN vs standard ITN alone: 2010 | 0.19% (4/2131) | 0.32% (9/2829) | RR 0.59 (0.18 to 1.91) | ||
| IRS with standard ITN vs standard ITN alone: 2011 | 0.65% (5/773) | 0.09% (1/1131) | RR 7.32 (0.86 to 62.5) | |||
| An arabiensis: Anopheles arabiensis; Angambiae: Anopheles gambiae; CI: confidence interval; ELISA: enzyme‐linked immunosorbent assay; IRS: indoor residual spraying; ITN: insecticide‐treated net; MD: mean difference; OR: odds ratio; PBO: piperonyl butoxide; RR: risk ratio. | ||||||
| Trial | Methods of adult mosquito density measurement | Comparison | Reported results Mean (95% CIs) | Effect size (95% CIs) | |
|---|---|---|---|---|---|
| IRS + ITNs | ITNs alone | ||||
| Comparison 1: IRS using non‐pyrethroid‐like insecticides + ITNs vs ITNs alone | |||||
| Average number of mosquitoes collected per trap night (CDC Light trap) | IRS with standard ITN vs standard ITN alone: An funestus | 0.57 (0.52 to 0.62) | 1.34 (1.22 to 2.46) | Rate ratio 0.52 (0.41 to 0.67) | |
| IRS with standard ITN vs standard ITN alone: An gambiae s.l. | 0.08 (0.07 to 0.10) | 0.15 (0.13 to 0.18) | Rate ratio 0.66 (0.47 to 0.93) | ||
| Mean number of bites per person per year from human landing catches (16 person‐nights per village (total 28 villages divided evenly into 4 arms) per survey (total 8 surveys)) | IRS with standard ITN vs standard ITN alone | 228 (149 to 348; n = 896) | 331 (218 to 504; n = 896) | Rate ratio 0.69 (0.38 to 1.25) | |
| Human biting rate (number of female Anopheles mosquitoes captured per house‐night of collection) | IRS with standard ITN vs standard ITN alone | 3.23 | 18.71 | Rate ratio 0.29 (0.17 to 0.50) | |
| Indoor host seeking density (mosquitoes per trap per night (592 person‐nights per arm) | IRS with standard ITN vs standard ITN alone | 0.09 (0.05 to 0.15) | 0.03 (0.01 to 0.08) | Not reported | |
| Indoor resting density (mosquitoes per house per night) (560 person‐nights per arm) | 0.34 (0.24 to 0.47) | 0.06 (0.03 to 0.12) | |||
| Outdoor resting density (mosquitoes per pit per day) (224 collection days per arm) | 0.43 (0.27 to 1.69) | 0.04 (0.01 to 0.15) | |||
| Indoor human biting rate (based on light trap catches) | 0.26 (0.19 to 0.37) | 0.10 (0.06 to 0.17) | |||
| Indoor human biting rate (based on human landing catches) | 3.95 (2.39 to 6.53) | 1.63 (0.92 to 2.89) | |||
| Outdoor human biting rate (based on artificial outdoor pit shelters) | 4.16 (2.52 to 6.86) | 1.68 (0.95 to 2.97) | |||
| Mean number of vectors caught in light traps per night per household (7 randomly selected houses per cluster (total 48 clusters divided evenly into 4 arms) for 1 night per month (total 8 months)) | IRS with standard ITN vs standard ITN alone | 2.37 (n = 425) | 2.83 (n = 471) | Not reported | |
| IRS with pyrethroid‐PBO net vs pyrethroid‐PBO net alone | 1.85 (n = 493) | 1.84 (n = 468) | |||
| Mean number of An gambiae s.l. per house per night (8 randomly selected houses per cluster (total 40 clusters divided evenly into 2 arms) for 1 night per month (total 21 months)) | IRS with standard ITN vs standard ITN alone | 0.4 (0.1 to 1.4; n = 1893) | 1.7 (0.5 to 6.4; n = 1892) | Rate ratio 0.23 (0.04 to 1.44) | |
| Comparison 2: IRS using pyrethroid‐like insecticides + ITNs vs ITNs alone | |||||
| Mean number of An gambiae s.l. per trap per night (6 sentinel rooms in 32 clusters) | IRS with standard ITN vs standard ITN alone: 2010 light traps | 3.70 (2.03 to 5.37) | 4.92 (3.05 to 6.79) | MD −1.22 (−3.58 to 1.14) | |
| IRS with standard ITN vs standard ITN alone: 2010 exit traps | 0.40 (−0.15 to 0.66) | 0.54 (0.18 to 0.89) | MD −0.13 (−0.54 to 0.28) | ||
| IRS with standard ITN vs standard ITN alone: 2011 light traps | 1.27 (0.39 to 2.15) | 1.96 (0.69 to 3.24) | MD −0.69 (−2.15 to 0.77) | ||
| IRS with standard ITN vs standard ITN alone: 2011 exit traps | 0.06 (0.01 to 0.10) | 0.46 (−0.23 to 1.15) | MD −0.40 (−1.05 to 0.25) | ||
| An funestus: Anopheles funestus; Angambiae: Anopheles gambiae; CI: confidence interval; IRS: indoor residual spraying; ITNs: insecticide‐treated nets; MD: mean difference; PBO: piperonyl butoxide. | |||||
| Protocol section | Changes | Justification |
|---|---|---|
| Criteria for considering studies for this review: types of interventions | Only studies with ≥ 50% ITN coverage (defined as the proportion of households owning ≥ 1 ITN) in both study arms were considered suitable for inclusion. | The review aims to evaluate the impact of IRS when added to communities that are currently using ITNs. With unreported or low coverage rates, it would be unclear if we are examining the effect of IRS added to communities using nets or of IRS added to failing net programmes. This change is in line with the WHO Guidelines for Malaria Vector Control which state that IRS should not be used to compensate for poor implementation of a second intervention (WHO 2019). |
| Search methods for identification of studies: electronic searches | The previous search strategy was dependent on study titles or abstracts referring to both ITNs and IRS. We revised our search strategy so that studies that referred to IRS but did not mention ITNs in the title or abstract were also detected, so long as they were published after 2000, when ITN programmes began to be implemented as policy. The use of ITNs remained an inclusion criterion, and was confirmed during full text screening. | As ITNs are a core vector control strategy that is implemented as standard in many malaria transmission areas, the previous search strategy led to the potential dismissal of studies that evaluated the impact of IRS in areas where high ITN use was considered a given and was therefore not described in the title or abstract.
|
| IRS: indoor residual spraying; ITN: insecticide‐treated net; WHO: World Health Organization. | ||
| Outcome or subgroup title | No. of studies | No. of participants | Statistical method | Effect size |
| 1.1 Malaria incidence Show forest plot | 4 | Rate Ratio (IV, Random, 95% CI) | 0.86 [0.61, 1.23] | |
| 1.2 Malaria incidence (net usage subgroup analysis) Show forest plot | 3 | Rate Ratio (IV, Random, 95% CI) | 0.80 [0.53, 1.22] | |
| 1.2.1 High (≥ 80%) | 2 | Rate Ratio (IV, Random, 95% CI) | 0.65 [0.60, 0.71] | |
| 1.2.2 Moderate (50–79%) | 0 | Rate Ratio (IV, Random, 95% CI) | Not estimable | |
| 1.2.3 Low (< 50%) | 1 | Rate Ratio (IV, Random, 95% CI) | 1.32 [0.90, 1.94] | |
| 1.3 Malaria incidence (sensitivity analysis: exclusion of studies with high risk of bias) Show forest plot | 3 | Rate Ratio (IV, Random, 95% CI) | 0.76 [0.55, 1.06] | |
| 1.4 Malaria parasite prevalence Show forest plot | 5 | Risk Ratio (IV, Random, 95% CI) | 0.72 [0.47, 1.11] | |
| 1.5 Malaria parasite prevalence (sensitivity analysis: exclusion of studies with high risk of bias) Show forest plot | 4 | Risk Ratio (IV, Random, 95% CI) | 0.61 [0.42, 0.88] | |
| 1.6 Anaemia prevalence Show forest plot | 3 | Risk Ratio (IV, Random, 95% CI) | 0.71 [0.38, 1.31] | |
| 1.7 Anaemia prevalence (net usage subgroup analysis) Show forest plot | 2 | Risk Ratio (IV, Random, 95% CI) | 0.50 [0.16, 1.60] | |
| 1.7.1 High (≥ 80%) | 0 | Risk Ratio (IV, Random, 95% CI) | Not estimable | |
| 1.7.2 Moderate (50–79%) | 1 | Risk Ratio (IV, Random, 95% CI) | 0.33 [0.05, 1.99] | |
| 1.7.3 Low (< 50%) | 1 | Risk Ratio (IV, Random, 95% CI) | 0.81 [0.37, 1.77] | |
| Outcome or subgroup title | No. of studies | No. of participants | Statistical method | Effect size |
| 2.1 Malaria incidence Show forest plot | 2 | Rate Ratio (IV, Random, 95% CI) | 1.07 [0.80, 1.43] | |
| 2.2 Malaria parasite prevalence Show forest plot | 3 | Risk Ratio (IV, Random, 95% CI) | 1.11 [0.86, 1.44] | |
| 2.3 Anaemia prevalence Show forest plot | 1 | Risk Ratio (IV, Random, 95% CI) | 1.12 [0.89, 1.40] | |