Intervenciones de formación para los profesionales sanitarios que tratan la enfermedad pulmonar obstructiva crónica en la atención primaria
Información
- DOI:
- https://doi.org/10.1002/14651858.CD012652.pub2Copiar DOI

- Base de datos:
-
- Cochrane Database of Systematic Reviews
- Versión publicada:
-
- 06 mayo 2022see what's new
- Tipo:
-
- Intervention
- Etapa:
-
- Review
- Grupo Editorial Cochrane:
-
Grupo Cochrane de Vías respiratorias
- Copyright:
-
- Copyright © 2022 The Cochrane Collaboration. Published by John Wiley & Sons, Ltd.
Cifras del artículo
Altmetric:
Citado por:
Autores
Contributions of authors
Screening of titles and abstracts: AC, JL, EZ, DT, JG
Assessment of studies for inclusion: AC, JL, EZ, DT, MA, JG
Quality assessment: AC, JL, EZ, DT, JG
Data extraction: AC, JL, EZ, DT, JG
Data entry into RevMan: AC, JL
Data analysis and interpretation: AC in consultation with JL, EZ, DT, MA, JG
Writing of review: AC, JL, MA, JG
Contributions of editorial team
Emma Dennett (Deputy Co‐ordinating Editor): co‐ordinated the editorial process; advised on interpretation and content; edited the review, signed off the review for publication.
Anne Holland (Contact Editor): edited the review; advised on methodology, interpretation and content, assisted with sign‐off.
Rebecca Fortescue (Co‐ordinating Editor) checked the data in the review.
Emma Jackson (Managing Editor): conducted peer review and edited the references and other sections of the protocol and the review.
Elizabeth Stovold (Information Specialist): designed the search strategy; ran the searches; edited the search methods section.
Sources of support
Internal sources
-
Victorian College of Pharmacy Foundation Board, Australia
Miss Liang is the recipient of the Cyril Tonkin Scholarship administered in 2014 by the Victorian College of Pharmacy Foundation Board at Monash University (Parkville campus), Australia.
External sources
-
National Institute for Health Research, UK
This project was supported by the National Institute for Health Research, via Cochrane Infrastructure funding to Cochrane Airways. The views and opinions expressed therein are those of the review authors and do not necessarily reflect those of the Systematic Reviews Programme, NIHR, NHS or the Department of Health and Social Care.
Declarations of interest
AJC: none known.
JL: declares funding from Boehringer Ingelheim via investigator‐initiated research grants.
DT: none known.
EZ: none known.
MJA: declares funding from Pfizer, Sanofi, GSK and Boehringer Ingelheim via investigator‐initiated research grants, and Sanofi for consultancies and travel, all for unrelated research.
JG: declares funding from Pfizer and Boehringer Ingelheim via an investigator‐initiated research grant and GSK via investigator‐sponsored grant and consultation fee for unrelated research. JG has received in‐kind support from Vitalograph®, the manufacturers of COPD‐6TM, for unrelated research.
Acknowledgements
We would like to acknowledge support and assistance received from the Cochrane Airways editors and staff, particularly Emma Dennett, Emma Jackson and Rebecca Fortescue.
We would like to acknowledge Gabriel Izbicki for assistance with reviewing potentially eligible studies published in French and German.
The authors and Airways Editorial Team are grateful to the following peer reviewers for their time and comments: Hilary Pinnock (The University of Edinburgh, UK); Biljana Cvetkovski (University of Sydney, Australia) and Bernard McCarthy (National University of Ireland, Galway, Ireland).
The Background and Methods sections of this review are based on a standard template used by Cochrane Airways.
This project was partially funded by a Lung Foundation Australia/Cochrane Airways Group scholarship 2019.
Version history
| Published | Title | Stage | Authors | Version |
| 2022 May 06 | Educational interventions for health professionals managing chronic obstructive pulmonary disease in primary care | Review | Amanda J Cross, Jenifer Liang, Dennis Thomas, Elida Zairina, Michael J Abramson, Johnson George | |
| 2017 May 03 | Educational interventions for health professionals managing COPD in primary care | Protocol | Jenifer Liang, Michael J Abramson, Johnson George | |
Differences between protocol and review
In the meta‐analysis of health‐related quality of life (HRQoL), we chose to present subgroups based on timing of outcome (6 months and 12 months). This was not specified in our protocol, but we believed these subgroups would help to describe and understand the findings and may be of interest to clinicians, policymakers and researchers.
We could not conduct other subgroup analyses as planned, due to an insufficient number of studies identified within each comparison and each outcome.
We could not conduct sensitivity analyses as planned, due to an insufficient number of studies identified with low risk of bias within each comparison and each outcome.
We could not conduct sensitivity analyses to explore the impact of including studies with missing data due to insufficient numbers of studies identified within each comparison and each outcome.
Keywords
MeSH
Medical Subject Headings (MeSH) Keywords
Medical Subject Headings Check Words
Humans;
PICO
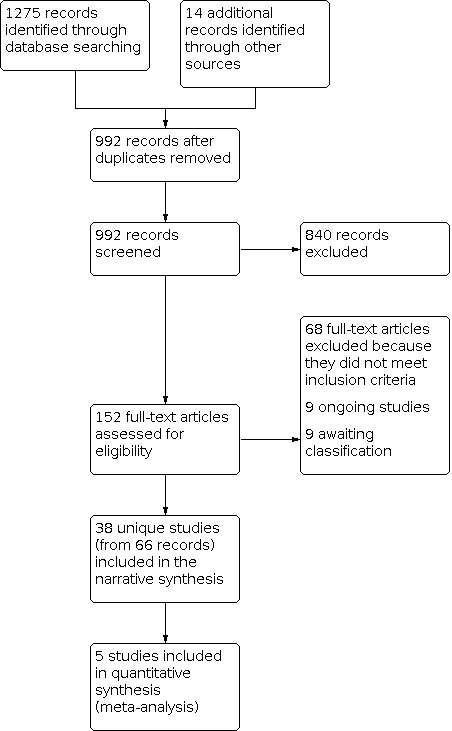
Study flow diagram.


Comparison 1: Health‐related quality of life (HRQoL): intervention versus usual care, Outcome 1: HRQoL using St George's Respiratory Questionnaire (SGRQ)
| Educational interventions for health professionals managing chronic obstructive pulmonary disease in primary care | ||||
|---|---|---|---|---|
| Patient or population: health professionals managing COPD | ||||
| Outcomes | Impacts | Number of studies (participants) | Quality of the evidence (GRADE) | Comment |
| Proportion of people with COPD diagnoses confirmed with spirometry | Two studies reported that the intervention may increase the number of new COPD diagnoses, whereas another showed no significant effect. One study reported that the intervention increased the number of patients who had spirometry performed. One study reported no significant effect on change in rate of spirometry in patients affiliated with the practice.a | 4 (1896b) | ⊕⊝⊝⊝ Very lowc | We are uncertain of the effects of educational interventions for health professionals on the proportion of COPD diagnoses confirmed with spirometry. |
| Proportion of patients with COPD referred to, participating in or having completed pulmonary rehabilitation | Two studies involving blended face‐to‐face and online education to physicians increased referral to pulmonary rehabilitation. Two studies targeting physicians and nurses or physicians and practice assistants with education related to team‐based COPD care showed no significant impact on referral.a | 4 (625)d | ⊕⊕⊝⊝ Lowe | We are uncertain of the effects of educational interventions for health professionals on the proportion of patients with COPD who are referred to, participate in or complete pulmonary rehabilitation. |
| Proportion of patients with COPD prescribed respiratory medication consistent with recommended guidelines | Six studies involving education for prescribers, guideline provision, central case management resources and/or increased prescribing provisions for nurse practitioners reported significant changes in prescribing. However, six studies showed no significant impact on prescribing.a | 12 (52,899)f | ⊕⊕⊝⊝ Lowg | We are uncertain of the effects of educational interventions for health professionals on the proportion of patients with COPD prescribed respiratory medication consistent with guideline recommendations. |
| Proportion of patients with COPD vaccinated against influenza/pneumococcal infections Follow‐up: 12 months | Two studies involving education on COPD management/guidelines to both general practitioners and nurses/practice assistants significantly improved influenza vaccination rates in the intervention group, but showed no significant impact on pneumococcal vaccination rates. One study involving education for physicians, use of COPD CareManager online module and access to central case management was uncertain. Two studies reported no clear impact on pneumococcal vaccination rates compared to usual care. | 4 (6846) | ⊕⊕⊕⊝ Moderateh | Educational interventions for health professionals probably improve the proportion of patients with COPD vaccinated against influenza, but probably have little impact on the proportion of patients vaccinated against pneumococcal infection. |
| HRQoL Follow‐up: 6, 12 months | Five studies using the SGRQ as a measure of HRQoL were included in meta‐analyses (at 6 months MD 0.87, 95% CI ‐2.51 to 4.26; 406 participants, and at 12 months MD ‐0.43, 95% CI ‐1.52 to 0.67; 1646 participants). Seven studies were excluded from the meta‐analysis due to alternative reporting of outcome data, six showed no significant impact on HRQoL. | 12 (6526) | ⊕⊕⊝⊝ Lowi | Educational interventions for health professionals may lead to little or no impact on the HRQoL of patients with COPD. The MCID of the SGRQ is 4 units. |
| Frequency of COPD exacerbations Follow‐up: 12, 24 months | Ten studies were identified, using various definitions of COPD exacerbations. One study reported reduced hospitalisations in people with COPD at 12 months, but no clear benefit at 24 months. Nine studies did not demonstrated a significant impact on the frequency of exacerbations.a | 10 (3128j) | ⊕⊕⊝⊝ Lowk | Educational interventions for health professionals may have little or no impact on the frequency of COPD exacerbations. |
| Patient satisfaction with health care | One intervention involving training for clinicians and a model of care in which patients received three dimensions of review of their health (by nurse, pharmacist and physician) resulted in a higher proportion of patients being “very satisfied with care” compared to usual care. | 1 (1222) | ⊕⊕⊕⊝ Moderatel | Educational interventions may improve patient satisfaction with care. |
| aMeta‐analysis was not possible due to differences in the definition of outcome and reporting of results. bTotal number of patient participants reported in three out of four studies only. cOne mark deducted due to high or unclear risk of bias across studies including blinding of outcome assessment. One mark deducted due to heterogeneity in the definition and reporting of outcome. One mark deducted due to imprecision with low event numbers in two of four studies. dTotal number of patient participants reported in three out of four studies only. eOne mark deducted due to high or unclear risk of bias across studies including allocation concealment and blinding of outcome assessment. One mark deducted due to imprecision with low event numbers in two of four studies. fTotal number of patient participants reported in eight out of 12 studies only. gOne mark deducted due to high or unclear risk of bias across studies with four of 11 studies having more than half of the domains as high or unclear risk of bias. One mark deducted due to heterogeneity in the definition of the outcome (including which respiratory medications were reported, whether it was the first, any or intensification of prescribing, and whether higher or lower prescribing was desirable). hOne mark deducted due to high or unclear risk of bias across studies, including randomisation, allocation concealment and baseline characteristics of participants. iOne mark deducted due to high or unclear risk of bias across studies, including blinding of outcome assessment and differences in baseline characteristics and outcome measurements. One mark deducted due to heterogeneity in outcome measures, timing of outcome measure and reporting of the outcome. jTotal number of patient participants reported in nine out of 10 studies only. kOne mark deducted due to most studies having high or unclear risk of bias across multiple domains. One mark deducted due to heterogeneity in outcome measures, timing of outcome measure and reporting of the outcome. lOne mark deducted due to imprecision as only one study was identified. CI: confidence interval; COPD: chronic obstructive pulmonary disease; HCP: healthcare professional; HRQoL: health‐related quality of life; MCID: minimal clinically important difference; MD: mean difference; SGRQ: St George's Respiratory Questionnaire | ||||
| Study ID | Study design | Number of study arms | Country | Unit of allocation | Health professional targeted |
|---|---|---|---|---|---|
| cRCT | 2 | Brazil | Clinic | Doctors and nurses | |
| RCT | 4 (2*) | Canada | Physician | Primary care providers | |
| RCT | 2 | Australia | Patient | GPs and practice nurses | |
| RCT | 3 | USA | Patient | Nurses | |
| RCT (parallel cross‐over) | 2 | Australia | Physician | GPs | |
| RCT (stepped‐wedge) | 2 | Denmark | Practice | GPs | |
| cRCT | 2 | South Africa | Practice | Nurse practitioners | |
| cRCT | 2 | South Africa | Clinic | Nurses | |
| cRCT | 2 | Germany | Practice | Medical assistants | |
| RCT | 2 | Europe (Austria, France, Germany, Ireland, UK) | Physician | Primary care physicians | |
| RCT | 3 | Netherlands | Practice | GPs | |
| cRCT | 2 | Switzerland | Physician | Primary care physicians | |
| cRCT | 2 | Pakistan | Facility | Doctors and allied staff | |
| cRCT | 2 | Netherlands | Practice | GPs, practice nurses, specialised physios | |
| RCT | 2 | USA | Practice | Physicians, medical assistants, registered nurses | |
| cRCT | 2 | Australia | Practice | Physicians | |
| RCT | 2 | China | Centre | GPs | |
| RCT | 2 | Italy | Patient | GPs | |
| cRCT | 2 | Switzerland | GP | GPs and practice assistants | |
| RCT | 2 | Netherlands | Physician | GPs | |
| RCT | 2 | USA | Clinic | Physicians | |
| cRCT | 2 | South Africa | Clinic | Nurses | |
| cRCT | 2 | Netherlands | GP | GPs | |
| cRCT | 2 | UK | Practice | Clinicians and receptionists | |
| cRCT | 3 (2*) | Sweden | Centre | GPs | |
| RCT | 2 | USA | Intern | Interns | |
| cRCT | 2 | Nepal | Facility | Health workers | |
| cRCT | 2 | Denmark | Practice | GPs | |
| RCT | 3 | Spain | GP | GPs | |
| cRCT | 5 | USA | Geographic clusters | GPs | |
| cRCT | 2 | Netherlands | GP | GPs | |
| cRCT | 2 | Italy | GP | GPs | |
| cRCT | 2 | Spain | Pharmacy | Pharmacists | |
| RCT | 2 | Bangladesh | GP | GPs | |
| cRCT | 2 | Australia | Practice | GPs | |
| cRCT | 2 | Australia | Practice | Nurses | |
| RCT | 3 | USA | Pharmacy | Pharmacists | |
| cRCT | 2 | Australia | Practice | GPs and practice nurses | |
| * indicates number of arms with data eligible for this review cRCT: cluster‐randomised controlled trial, GP: general practitioner, RCT: randomised controlled trial | |||||
| Study ID | Education | Tools, toolkit or algorithm | Guidelines | Spirometry training | Feedback/mentorship/ongoing support |
|---|---|---|---|---|---|
| ✔ | |||||
| ✔ | ✔ | ✔ | ✔ | ||
| ✔ | ✔ | ||||
| ✔ | ✔ | ||||
| ✔ | |||||
| ✔ | ✔ | ||||
| ✔ | |||||
| ✔ | |||||
| ✔ | |||||
| ✔ | |||||
| ✔ | ✔ | ||||
| ✔ | ✔ | ||||
| ✔ | ✔ | ✔ | |||
| ✔ | |||||
| ✔ | |||||
| ✔ | ✔ | ||||
| ✔ | |||||
| ✔ | |||||
| ✔ | ✔ | ||||
| ✔ | |||||
| ✔ | ✔ | ||||
| ✔ | ✔ | ||||
| ✔ | |||||
| ✔ | ✔ | ✔ | |||
| ✔ | |||||
| ✔ | ✔ | ||||
| ✔ | ✔ | ||||
| ✔ | |||||
| ✔ | ✔ | ✔ | |||
| ✔ | |||||
| ✔ | ✔ | ||||
| ✔ | ✔ | ||||
| ✔ | |||||
| ✔ | |||||
| ✔ | ✔ | ✔ | |||
| ✔ | ✔ | ||||
| ✔ | ✔ | ||||
| ✔ | * | * |
| Study ID | Definition(s) of outcome measure | Result(s) (intervention vs control unless specified) |
|---|---|---|
| Four definitions used: 1. For participants with COPD, the composite score comprised points awarded for (a) a first prescription of SABA, ICS or ICS + LABA; or a change in prescription, stepping up from SABA to LABA or from LABA to ICS + LABA, or stepping down from LABA + ICS to LABA, or from LABA to SABA (scoring one point if at least one of these occurred) over 12 months 2. First prescription of an ICS 3. First prescription of SABA 4. First prescription of LABA + ICS | Participants (%)
| |
| Two definitions used: 1. Prescriptions filled out for ICS after 3 months (higher = better) 2. Prescription for antibiotics after 3 months | Participants (%)
| |
| Treatment intensification over 14 months: 1) the addition or increase in dose of an ICS and/or 2) addition of a beta‐agonist and/or 3) addition of ipratropium bromide and/or 4) addition of theophylline | RR 1.08 (95% CI 0.75 to 1.55), P = 0.674, ICC = 0.011, n = 586 intervention vs n = 571 control | |
| Two definitions used: 1. Percentage prescriptions of penicillins over total number of patients treated with antibiotics for respiratory tract infections over 2 years 2. Percentage of quinolones over total number of patients treated with antibiotics for COPD exacerbations over 2 years | Participants (%)
| |
| Four definitions used: 1. Frequency of LABA use after 4 years 2. Frequency of ICS use after 4 years 3. Frequency of OCS use after 4 years 4. Frequency of theophylline use after 4 years | Percentage of total participants (3418 vs 2803)
| |
| Appropriate pharmacological treatment of COPD at 1 year | Non‐significant difference between groups (OR visually presented), 69 intervention and 92 control patients analysed | |
| Two definitions used: 1. Change in prescriptions for SABA for COPD per GP per year standardised per 1000 enlisted patients at 12 months and 24 months 2. Change in prescriptions for ICS for COPD per GP per year standardised per 1000 enlisted patients at 12 months and 24 months (reduction = better) |
| |
| Five definitions used: 1. Prescription of bronchodilator at 12 months 2. Prescription of ICS/tiotropium at 12 months 3. Prescription of LABA + ICS at 12 months 4. Prescription of LABA/ICS + TIO at 12 months 5. Prescription of tiotropium at 12 months | Participants (%)
| |
| Indicators of GP decision‐making process: probability of medication and non‐medication changes. Medication change included: stopping or lowering treatment with inhaled corticosteroids or bronchodilators; the commencement of bronchodilator, inhaled or oral corticosteroid treatment; or combination drug treatment. Non‐medication included giving smoking cessation advice. | 76.2% vs 69.1%, OR (CI) 1.44 (0.80 to 2.59) | |
| Number of prescriptions for COPD post intervention (lower better as indicates more rational prescribing) | 15 prescriptions vs 29 prescriptions | |
| Treatment regimens in patients classified moderate to severe COPD, expressed as percentage of total. Eight definitions used: 1. Anticholinergic + SABA 2. LABA + corticoid 3. SABA 4. LABA 5. Anticholinergic agents 6. Theophylline 7. ICS 8. Antibiotics | G3 vs G2 vs G1 1. 9.4 vs 6.0 vs 6.6 2. 51.2 vs 52.3 vs 50.0 3. 56.0 vs 52.3 vs 50.7 4. 20.2 vs 22.9 vs 27.9 5. 87.8 vs 86.9 vs 82.4 6. 21.8 vs 24.6 vs 28.7 7. 22.8 vs 24.6 vs 25.7 8. 14.2 vs 11.1 vs 19.9 | |
| Number of drugs prescribed by the GP for COPD during the 1‐year follow‐up (lower better as indicates rational prescribing as per guidelines) | Mean (SD) 3.63 (2.96) vs 4.12 (3.10) | |
| CI: confidence interval; COPD: chronic obstructive pulmonary disease; ICC: intra‐class correlation coefficient; ICS: inhaled corticosteroid; LABA: long acting beta agonist; OCS: oral corticosteroid; OR: odds ratio; RR: risk ratio; SABA: short‐acting beta agonist; SD: standard deviation; TIO: tiotropium | ||
| Study ID | HRQoL measure used | Results (intervention vs usual care), mean (SD) unless specified |
|---|---|---|
| SGRQ, change in total score from baseline SF‐36, change in physical functioning and mental health domains | MM Group vs UC Group at 6 months (n = 49 vs 51): SGRQ: 3.4 (14.9) vs 6.3 (15.5), MD ‐2.9 (95% CI ‐9.8 to 4.1) SF‐36‐physical: ‐2.1 (20.2) vs ‐1.2 (21.7) SF‐36‐ mental: ‐2.2 (18.6) vs ‐0.6 (17.7) CM Group vs UC Group at 6 months (n = 51 vs 51): SGRQ: 3.7 (13.6) vs 6.3 (15.5), MD ‐2.6 (95% CI ‐9.5 to 4.3) SF‐36‐physical: 1.6 (14) vs ‐1.2 (21.7) SF‐36‐ mental: ‐1.4 (20) vs ‐0.6 (17.7) | |
| SGRQ, proportion with score ≥ median score (dichotomous) | 14 months: 36/256 vs 34/273 | |
| SF‐12 EQ‐5D, physical component and mental component | 12 months: SF‐12‐physical (n = 801 vs 776): 36.5 (9.7) vs 35.9 (9.7), P = 0.162 SF‐12‐mental (n = 801 vs 776): 48.8 (10.9) vs 46.9 (11.1), P = 0.019 EQ‐5D (n = 918 vs 878): 0.64 (0.22) vs 0.61 (0.23), P = 0.085 24 months: SF‐12‐physical (n = 553 vs 590): 36.5 (10.6) vs 35.5 (10.2), P = 0.013 SF‐12‐mental (n = 553 vs 590): 48.9 (10.8) vs 46.9 (11.6), P = 0.002 EQ‐5D (n = 779 vs 806): 0.65 (0.22) vs 0.61 (0.23), P = 0.016 | |
| SGRQ, change in total score SF‐36, change in physical component and mental component CCQ, change in total score EQ‐5D‐3L and VAS change in total score (/100) | 12 months (n = 554 vs 532): reported as MD and 95% CI SGRQ: ‐0.40 (95% CI ‐1.46 to 0.65) vs 0.33 (95% CI ‐0.78 to 1.43) SF‐36‐physical: ‐1.1 (95% CI‐1.82 to ‐0.38) vs (‐0.48 (‐1.23 to 0.26) SF‐36‐mental: ‐.73 (‐0.07 to 1.54) vs 0.09 (‐0.74 to 0.92) CCQ: ‐0.03 (‐0.09 to 0.03) vs 0.03 (‐0.03 to 0.09) EQ‐5D‐3L: ‐0.04 (‐0.06 to ‐0.02) vs ‐0.01 (‐0.03 to 0.01) EQ‐5D VAS: ‐1.71 (‐2.95 to 0.46) vs ‐1.92 (‐3.21 to ‐0.63) | |
| SGRQ, change in total score from baseline CAT, change in total score from baseline | 6 months (n = 118 vs 94): reported as MD and 95% CI SGRQ: 3.07 (0.73 to 5.42) vs 1.54 (‐1.06 to 4.14), 2.45 (‐0.89 to 5.79) CAT: 2.06 (0.87 to 3.26) vs 1.50 (0.56 to 2.44) 12 months (n = 113 vs 77): SGRQ: 4.69 (1.96 to 7.41) vs 3.35 (0.57 to 6.14), MD 2.21 (‐2.86 to 7.28) CAT: 3.05 (1.80 to 4.31) vs 2.62 (1.58 to 3.67) | |
| CAT, mean change in total score from baseline | 12 months (n = 69 vs 92): ‐1.2 vs 1.1 | |
| EQ‐5D‐5L, total score | 15 months (n = 797 vs 749): mean 0.533 (SE 0.012) vs 0.504 (SE 0.012) | |
| CCQ (10 items), change in total score from baseline CAT, change in total score from baseline | 18 months (n = 209 vs 216): CCQ: mean 1.97 (95% CI 1.81 to 2.14) vs 1.97 (1.81 to 2.13) CAT: mean 16.2 (95% CI 15.1 to 17.4) vs mean 16.3 (95% CI 15.2 to 17.5) | |
| SF‐36, physical functioning and mental health domains | 12 months (n = 51 vs n = 33): mean total scores SF‐36‐physical: 57.4 vs 53.6 SF‐36‐mental: 63.8 vs 57.8 | |
| SGRQ, total score SF‐36, total score physical functioning and mental health domains | 6 months (n = 74 vs 83): SGRQ: 39.8 (20.5) vs 41.7 (17.8) SF‐36‐physical: 46.0 (7.5) vs 44.9 (8.7) SF‐36‐mental: 48.6 (10.9) vs 48.2 (10.9) 12 months (n = 74 vs 80): SGRQ: 41.9 (18.9) vs 40.5 (17.4) SF‐36‐physical: 44.2 (8.4) vs 45.5 (7.9) SF‐36‐mental: 50.1 (9.9) vs 49.2 (10.2) | |
| Disease‐specific HRQoL using COPD‐specific measures (7‐point Likert format, score 7 = best) | Pharmaceutical care programme vs PFM control vs usual care control 6 months (n = 146 vs 111 vs 119): 4.5 (1.0) vs 4.3 (1.0) vs 4.1 (1.2) 12 months (n = 149 vs 105 vs 111): 4.4 (1.1) vs 4.3 (1.0) vs 4.2 (1.2) | |
| SGRQ CAT | 12 months (n = 126 vs 96): SGRQ: 16.85 (15.2) vs 17.06 (14.9), MD ‐0.21 (95% CI ‐2.55 to 2.14), P = 0.86 CAT: 9.80 (6.78) vs 9.27 (6.78), P = 0.73 | |
| Abbreviations: CAT: COPD Assessment Tool; CI: confidence interval; CCQ: Clinical COPD Questionnaire; HRQoL: health‐related quality of life; MD: mean difference; PFM: peak flow meter; SD: standard deviation; SE: standard error; SF‐36: short‐form health survey, SGRQ: St George's Respiratory Questionnaire; VAS: visual analogue scale. | ||
| Study ID | Outcome measure | Results (intervention vs usual care) |
|---|---|---|
| Mean (SD) change in self‐reported healthcare utilisation for lung disease in past 6 months | n = 49 vs n = 51 Doctor visits: ‐1 (1.9) vs ‐0.04 (3.2) ED visits: 0 (0.4) vs ‐0.02 (0.3) Hospital visits: ‐0.04 (0.7) vs 0.04 (0.4) | |
| Mean (SD) COPD‐related hospitalisations, and mean (SD) hospital days at 12 and 24 months | 12 months (n = 321 vs 222): Hospitalisations: 0.03 (0.22) vs 0.11 (0.56), P = 0.011 Hospital days: 0.14 (1.62) vs 0.61 (4.20), P = 0.185 24 months (n = 321 vs 222): Hospitalisations: 0.14 (0.61) vs 0.26 (1.09), P = 0.086 Hospital days: 0.73 (3.97) vs 1.55 (8.09), P = 0.30 | |
| Mean (SD) moderate exacerbation rate at 12 months Mean (SD) severe exacerbation rate at 3 months Mean (SD) hospital admission days at 3 months | n = 554 vs 532 Moderate: 0.4 (0.8) vs 0.3 (0.8) Severe: 0.02 (0.2) vs 0.02 (0.2) Admissions: 6 (2.1) vs 8.6 (4.7) | |
| Assessment of exacerbation frequency at 12 months | Non‐significant, reported visually, n = 161 | |
| Percentage of patients with one or more exacerbations in past 6 months, measured at 18 months | 34.7% (n = 209) vs 34.1% (n = 216), P = 0.93 | |
| Odds ratio (95% CI) for patients who utilised out‐of‐hours GP services in last 3 months Odds ratio (95% CI) for patients who were hospitalised in last 3 months | Out‐of‐hours service: 0.4828 (‐0.733 to 1.698), P = 0.4307 Hospitalised: 0.797 (0.464 to 1.372), P = 0.4078 | |
| Number of episodes of exacerbations in 12 months, categorised as none, low (1 to 2) and high (3+) Number of admissions to hospital because of COPD in 12 months, categorised as none, low (1 to 2) and high (3+) | n = 72 vs n = 51 Exacerbations: none: 30.6% vs 39.2%; low: 48.6% vs 43.1%; high: 20.8% vs 17.6% Admissions: none: 70.8% vs 66.7%; low: 19.4% vs 23.5%; high: 9.7% vs 9.8% | |
| Number of patients with hospital admissions for COPD in 12 months | 12.2% (n = 90) vs 5.4% (n = 92) | |
| Percentage of patients with breathing‐related ED or hospital visits in 12 months | 22.9% (n = 149) vs 23.2% (n = 111) | |
| Proportion of patients reporting use of health services for lung condition in past 12 months | 17/126 vs 11/96, P = 0.67 | |
| ED: emergency department | ||
| Study ID | Outcome measure | Results (intervention vs usual care) |
|---|---|---|
| Morisky Medication Adherence Scale ‐ 8‐item | Mean (95% CI) at 15 months: 11.0 (8.0 to 15.0) vs 11.0 (8.0 to 15.0), P = 0.46 | |
| Morisky‐GreenLevine Medication Adherence Questionnaire, reported as mean percentage/100 | Mean percentage (95% CI) at 6 months for COPD patients only (n = 145 vs 154): 92.9% (87.0 to 962) vs 72.5 (62.3 to 80.7), P = 0.0001 | |
| Adherence to treatment as part of a larger questionnaire of self‐management capacity, scored 0 to 8 (8 = better adherence) | Mean (SD) at 12 months: 7.7 (0.8) vs 7.6 (1.3) | |
| Compliance with breathing medications, percentage of patients not compliant (includes both asthma and COPD patients) | 12 months: 22.5% vs 23.3% | |
| Correct inhaler technique, number of patients | 12 months: 45/126 vs 42/96, P = 0.25 | |
| CI: confidence interval; COPD: chronic obstructive pulmonary disease; SD: standard deviation | ||
| Outcome or subgroup title | No. of studies | No. of participants | Statistical method | Effect size |
| 1.1 HRQoL using St George's Respiratory Questionnaire (SGRQ) Show forest plot | 5 | Mean Difference (IV, Random, 95% CI) | Subtotals only | |
| 1.1.1 At 6 months | 2 | 406 | Mean Difference (IV, Random, 95% CI) | 0.87 [‐2.51, 4.26] |
| 1.1.2 At 12 months | 4 | 1646 | Mean Difference (IV, Random, 95% CI) | ‐0.43 [‐1.52, 0.67] |