Intervenciones de higiene bucodental en individuos con discapacidad intelectual
Resumen
Antecedentes
La enfermedad periodontal (encía) y la caries dental (caries) son las causas más comunes de la pérdida de dientes; la placa dental juega un papel importante en el desarrollo de estas enfermedades. La higiene bucodental efectiva incluye la eliminación de la placa dental, p.ej. mediante el cepillado de dientes regular. Los pacientes con discapacidades intelectuales (DI) pueden tener una higiene bucodental y resultados de salud bucodental deficientes.
Objetivos
Evaluar los efectos (beneficiosos y perjudiciales) de las intervenciones de higiene bucodental, específicamente la eliminación mecánica de la placa, en pacientes con discapacidades intelectuales (DI).
Métodos de búsqueda
El Especialista en Información del Grupo Cochrane de Salud Bucodental realizó búsquedas en las siguientes bases de datos hasta el 4 de febrero de 2019: Registro de Ensayos del Grupo Cochrane de Salud Oral (Cochrane Oral Health's Trials Register), Registro Cochrane Central de Ensayos Controlados (Cochrane Central Register of Controlled Trials) (CENTRAL), MEDLINE Ovid, Embase Ovid y PsycINFO Ovid. Se hicieron búsquedas de ensayos en curso en ClinicalTrials.gov y en la World Health Organization International Clinical Trials Registry Platform. La búsqueda en Embase estuvo restringida por fecha debido al Cochrane Centralised Search Project, que proporciona los ensayos clínicos indizados en Embase a través de CENTRAL. Se realizaron búsquedas manuales en resúmenes de congresos especializados de la International Association of Disability and Oral Health (2006 a 2016).
Criterios de selección
Se incluyeron ensayos controlados aleatorizados (ECA) y algunos tipos de estudios no aleatorizados (no ECA) (ensayos controlados no aleatorizados, estudios controlados tipo antes y después, estudios de series de tiempo interrumpido y estudios de medidas repetidas) que evaluaban intervenciones de higiene bucodental dirigidas a pacientes con DI o sus cuidadores, o ambos. Se utilizó la definición de DI de la International Statistical Classification of Diseases and Related Health Problems 10a revisión (ICD‐10). Se definió la higiene bucodental como la eliminación mecánica de la placa. Se excluyeron los estudios que evaluaban la eliminación química de la placa, o la eliminación mecánica y química de la placa combinadas.
Obtención y análisis de los datos
Al menos dos autores de revisión, de forma independiente, seleccionaron los registros de la búsqueda, identificaron los estudios relevantes, extrajeron los datos, evaluaron el riesgo de sesgo y juzgaron la certeza de la evidencia según los criterios GRADE. Se estableció contacto con los autores de los estudios para obtener la información adicional necesaria. Los ECA y los no ECA se informaron por separado.
Resultados principales
Se incluyeron 19 ECA y 15 no ECA con 1795 adultos y niños con DI y 354 cuidadores. Las intervenciones evaluadas fueron: cepillos de dientes manuales especiales, cepillos de dientes eléctricos, adiestramiento en higiene bucodental, visitas odontológicas programadas más cepillado de dientes supervisado, discusión de fotografías clínicas que mostraban la placa, variación en la frecuencia del cepillado de dientes, agentes reveladores de la placa y planes de atención individualizados. Los resultados se clasificaron como a corto plazo (seis semanas o menos), a medio plazo (entre seis semanas y 12 meses) y a largo plazo (más de 12 meses).
La mayoría de los estudios fueron pequeños, y en general todos tuvieron riesgo alto o incierto de sesgo. Ninguno de los estudios informó sobre la calidad de vida ni la caries dental. Más abajo se presenta la evidencia disponible de los ECA (o no ECA cuando la comparación no tuvo ECA) para la salud gingival (inflamación y placa) y los efectos adversos, así como el conocimiento y los resultados del comportamiento para los estudios del adiestramiento.
Evidencia de muy baja certeza indicó que un cepillo de dientes manual especial (el Superbrush) redujo la inflamación gingival (IG), y posiblemente la placa, más que un cepillo de dientes convencional a medio plazo (IG: diferencia de medias [DM] ‐12,40; IC del 95%: ‐24,31 a ‐0,49; placa: DM ‐0,44; IC del 95%: ‐0,93 a 0,05; un ECA, 18 participantes); el cepillado lo realizaron los cuidadores. A corto plazo, ningún cepillo de dientes mostró superioridad (IG: DM ‐0,10; IC del 95%: ‐0,77 a ‐0,57; placa: DM ‐0,20; IC del 95%: ‐0,45 a ‐0,85; un estudio; 25 participantes; evidencia de certeza baja a muy baja).
Evidencia de certeza moderada y baja no encontró diferencias entre los cepillos de dientes eléctricos y manuales para reducir la IG o la placa, respectivamente, a plazo medio (IG: DM 0,02; IC del 95%: ‐0,06 a 0,09; placa: diferencia de medias estandarizada 0,29; IC del 95%: ‐0,07 a 0,65; dos ECA, 120 participantes). Los resultados a corto plazo fueron inconsistentes (cuatro ECA; evidencia de certeza baja a muy baja).
Evidencia de certeza baja indicó que el adiestramiento de los cuidadores en la atención para la higiene bucodental no tuvo un efecto detectable sobre los niveles de IG o la placa a plazo medio (IG: DM ‐0,09; IC del 95%: ‐0,63 a ‐0,45; placa: DM ‐0,07; IC del 95%: ‐0,26 a 0,13; dos ECA, 99 participantes). Evidencia de baja certeza indicó que el conocimiento de la higiene bucodental de los cuidadores fue mejor a medio plazo después del entrenamiento (DM 0,69; IC del 95%: 0,31 a 1,06; dos ECA, 189 participantes); resultado que no se encontró a corto plazo, y los resultados de los cambios en la conducta, la actitud y la autoeficacia fueron mixtos.
Un ECA (diez participantes) encontró que el adiestramiento de los pacientes con DI en la atención para la higiene bucodental redujo la placa pero no la IG a corto plazo (IG: DM ‐0,28; IC del 95%: ‐0,90 a ‐0,34; placa: DM ‐0,47; IC del 95%: ‐0,92 a ‐0,02; evidencia de certeza muy baja).
Un ECA (304 participantes) halló que las visitas de control bucodental programadas (en intervalos de 1, 3 o seis meses) más el cepillado de dientes diario supervisado tuvieron una mayor probabilidad que la atención habitual de reducir la IG (formación de bolsas pero no hemorragia) y la placa a largo plazo (evidencia de certeza baja).
Un ECA (29 participantes) encontró que la posibilidad de motivar a los pacientes con DI acerca de la higiene bucodental al debatir sobre las fotografías de sus dientes con placa destacada mediante un agente revelador de la placa no redujo la placa a plazo medio (evidencia de muy baja certeza).
Un ECA (80 participantes) halló que el cepillado de dientes diario por parte de los estudiantes de odontología fue más efectivo para reducir la placa en pacientes con DI que el cepillado de dientes una vez o dos veces por semana a corto plazo (evidencia de certeza baja).
Un no ECA que evaluó el dentífrico con un agente revelador de la placa y uno que evaluó planes de atención bucodental individualizados (evidencia de muy baja certeza) encontraron un efecto beneficioso para la salud gingival.
La mayoría de los estudios no informaron sobre los efectos adversos; de los que lo hicieron, solo un estudio los consideró un resultado formal. Algunos estudios informaron las dificultades de los participantes al utilizar cepillos de dientes eléctricos o manuales especiales.
Conclusiones de los autores
Aunque algunas intervenciones de higiene bucodental en pacientes con DI mostraron efectos beneficiosos, su importancia clínica no está clara. La certeza de la evidencia fue en su mayoría baja o muy baja. Hubo evidencia de certeza moderada solo para un hallazgo: los cepillos de dientes eléctricos y manuales probablemente presentan una efectividad similar para reducir la inflamación gingival en pacientes con DI a medio plazo. Se recomienda la realización de ECA más grandes y de calidad más alta para respaldar o refutar los resultados de esta revisión. Mientras tanto, la atención para la higiene bucodental y el asesoramiento deben basarse en la experiencia profesional y las necesidades y las preferencias del individuo con DI y sus cuidadores.
PICO
Resumen en términos sencillos
Programas de higiene bucodental en individuos con discapacidad intelectual
Pregunta de la revisión
¿Cuán efectivos son los programas de higiene bucodental en pacientes con discapacidad intelectual?
Antecedentes
La eliminación de la placa dental mediante el cepillado diario de los dientes desempeña una función principal en la prevención de la caries dental y las enfermedades de las encías, las dos causas principales de la pérdida de dientes. Cepillarse los dientes es una habilidad que puede ser difícil para los pacientes con discapacidad intelectual (DI); pueden requerir ayuda y las personas que los cuidan pueden necesitar entrenamiento sobre cómo ayudarlos.
Características de los estudios
Se buscaron estudios hasta el 4 de febrero de 2019. Esta revisión incluyó 34 estudios con 1795 pacientes con discapacidad intelectual y 354 cuidadores. Diecinueve estudios asignaron al azar a los participantes a dos o más grupos (es decir ensayos controlados aleatorizados [ECA] y 15 eran estudios no aleatorizados [no ECA]).
Los estudios evaluaron diferentes maneras de mejorar la higiene bucodental de los pacientes con DI: cepillos de dientes manuales especiales; cepillos de dientes eléctricos; entrenamiento en higiene bucodental para los cuidadores; entrenamiento en higiene bucodental para los pacientes con DI; variación de los intervalos programados entre las visitas al odontólogo y la supervisión del cepillado de los dientes; uso de la discusión de fotografías clínicas como motivador; variación de la frecuencia de cepillado de los dientes de los pacientes con DI; uso de un agente revelador de placa y uso de planes de cuidado bucodental individualizados.
Los estudios evaluaron la inflamación gingival (encías rojas e hinchadas) y la placa. Algunos estudios evaluaron el conocimiento de los cuidadores, el comportamiento, la actitud y la autoeficacia (creencia en la competencia) en cuanto a la higiene bucodental, así como el comportamiento en cuanto a la higiene bucodental y las aptitudes de los pacientes con DI. No se midió la caries dental ni la calidad de vida. Los estudios se agruparon según el momento en el que se midieron los resultados: a corto plazo (seis semanas o menos), a medio plazo (entre seis semanas y 12 meses) y a largo plazo (más de 12 meses).
Resultados clave
Un cepillo de dientes manual especial (el Superbrush), usado por los cuidadores, puede ser mejor para reducir los niveles de inflamación gingival y posiblemente la placa en pacientes con DI que un cepillo de dientes manual estándar a plazo medio, aunque lo anterior no se observó a corto plazo.
No se encontró ninguna diferencia entre los cepillos de dientes eléctricos y manuales usados por los pacientes con DI o los cuidadores en cuanto a la inflamación gingival o la placa a plazo medio y los resultados a corto plazo fueron poco claros.
El adiestramiento de los cuidadores en cuanto al cepillado de los dientes de los pacientes con DI puede haber mejorado el conocimiento en higiene bucodental de los cuidadores a plazo medio.
El adiestramiento de los pacientes con DI en cuanto al cepillado de sus propios dientes puede haber reducido la cantidad de placa en los dientes a corto plazo.
Las visitas de control bucodental programadas regularmente y la posibilidad de que los cuidadores supervisen el cepillado de dientes entre las visitas pueden haber presentado una mayor probabilidad que la atención habitual de reducir la inflamación gingival y la placa a largo plazo.
El debate sobre las fotografías clínicas de la placa en los dientes de los participantes observada mediante un agente revelador para motivarlos a realizar un mejor cepillado de dientes no pareció reducir la placa.
El cepillado de dientes diario llevado a cabo por un estudiante de odontología puede ser más efectivo para la reducción de los niveles de placa a corto plazo que el cepillado de dientes por parte del profesional una vez o dos veces por semana.
El dentífrico con un agente revelador de la placa y los planes de atención bucodental individualizados fueron evaluados cada uno en un estudio no aleatorizado que indicó que pueden ser beneficiosos.
Solo un estudio se propuso medir formalmente los efectos secundarios negativos; sin embargo, la mayoría de los estudios comentaron que no se encontraron. Algunos estudios encontraron que algunos pacientes tenían dificultades con los cepillos de dientes eléctricos o manuales especiales.
Certeza de la evidencia
Aunque algunas intervenciones de higiene bucodental en pacientes con DI muestran evidencia científica de beneficios, no está claro qué significan en realidad estos beneficios para la higiene bucodental o la salud bucodental de un individuo. La certeza de la evidencia es principalmente baja o muy baja por lo que la investigación futura puede cambiar los resultados. Solo hay evidencia de certeza moderada para un hallazgo: los cepillos de dientes eléctricos y manuales probablemente presentan una efectividad similar para reducir la inflamación gingival en pacientes con DI a medio plazo. Se necesitan más y mejores estudios de investigación para evaluar completamente las intervenciones prometedoras para mejorar la higiene bucodental de los pacientes con DI y para confirmar qué intervenciones no son efectivas. Mientras tanto, los cambios en los hábitos actuales según esta revisión se deben realizar con cautela, y las decisiones acerca de la atención para la higiene bucodental se deben basar en la experiencia profesional y las necesidades y las preferencias de los pacientes con DI y sus cuidadores.
Authors' conclusions
Summary of findings
| Special manual toothbrush compared to conventional manual toothbrush for people with ID | ||||||
| Population: children and adults with mixed levels of ID Setting: home, residential, day care, school, mixed or not specified Intervention: special manual toothbrush (self, carer or carer‐assisted brushing) Comparison: conventional manual toothbrush (self, carer or carer‐assisted brushing) | ||||||
| Outcomes | Anticipated absolute effects* (95% CI) | Relative effect | Number of participants | Certainty of the evidence | Comments | |
| Risk with conventional manual toothbrush | Risk with special manual toothbrush | |||||
| Gingival inflammation short term (< 6 weeks) | Mean gingival inflammation short term was 1.21 (SD 0.85) | MD 0.10 lower | — | 25 | ⊕⊕⊝⊝ | There was no evidence of a difference between the toothbrushes in the short term. Two cross‐over RCTs (126 participants) showed similar results. |
| Gingival inflammation medium term (6 weeks to 12 months) | Mean gingival inflammation medium term was 18.3 (SD 16.2) | MD 12.4 lower | — | 18 | ⊕⊝⊝⊝ | Compared to a conventional toothbrush, a special manual toothbrush (Superbrush) may have reduced gingival inflammation medium term when used by a carer for people with ID who were reliant on other people to carry out their oral hygiene. |
| Plaque short term | Mean plaque short term was 1.02 (SD 0.85) | MD 0.2 higher | — | 25 | ⊕⊝⊝⊝ | There was no evidence of a difference between the toothbrushes in the short term. Three other short‐term RCTs (141 participants) that could not be combined in meta‐analysis, had inconsistent findings. |
| Plaque medium term (6 weeks to 12 months) | Mean plaque medium term was 0.78 (SD 0.7) | MD 0.44 lower | — | 18 | ⊕⊝⊝⊝ | There may have been no difference between the two toothbrushes in terms of plaque or the Superbrush may reduce plaque medium term.1 |
| Quality of life | Not assessed | — | ||||
| Dental caries | Not assessed | — | ||||
| Adverse effects | 1 RCT and 2 NRS did not assess or report adverse effects. 1 RCT assessed allergic reactions to a single‐use suction toothbrush at study outset and found none but this study was not summarised in this table (Table 6). 1 RCT and 1 NRS assessing the Superbrush found the size of the 3‐headed toothbrush caused some problems either when first used or for people with limited mouth opening. | — | ||||
| *The risk in the intervention group (and its 95% confidence interval) is based on the assumed risk in the comparison group and the relative effect of the intervention (and its 95% CI). CI: confidence interval; ID: intellectual disability; MD: mean difference; NRS: non‐randomised study; RCT: randomised controlled trial; SD: standard deviation. | ||||||
| GRADE Working Group grades of evidence | ||||||
| aDowngraded two levels due to imprecision: wide confidence intervals and findings were based on one study with only 25 participants. 1One NRS (24 participants) showed no evidence of a difference between toothbrushes for plaque in the medium term.. | ||||||
| Electric toothbrush compared to manual toothbrush for people with ID | ||||||
| Population: children and adults with mixed levels of ID Setting: home, residential, day care, school, mixed or not specified Intervention: electric toothbrush (self, carer or carer‐assisted brushing) Comparison: manual toothbrush (self, carer or carer‐assisted brushing) | ||||||
| Outcomes | Anticipated absolute effects* (95% CI) | Relative effect | Number of participants | Certainty of the evidence | Comments | |
| Risk with manual toothbrush | Risk with electric toothbrush | |||||
| Gingival inflammation short term (< 6 weeks) | — | — | — | 252 (4 RCTs) | ⊕⊕⊝⊝ | Four studies showed no significant differences between toothbrushes for gingival inflammation in the short term. Data from the 4 studies could not be combined in a meta‐analysis.1 |
| Gingival inflammation medium term (6 weeks to 12 months) | Mean gingival inflammation medium term ranged from 1.24 to 1.9 | MD 0.02 higher | — | 120 | ⊕⊕⊕⊝ | There was little to no difference between toothbrushes for gingival inflammation medium term. Another RCT (100 participants) showed findings in favour of the electric toothbrush (53% versus 31% improvement), but it used a more subjective assessment of GI.2 |
| Plaque short term (< 6 weeks) | — | — | — | 247 (4 RCTs) | ⊕⊝⊝⊝ | We were uncertain about the effect of using either toothbrush on plaque short term. None of the studies presented data that could be included in a meta‐analysis. 2 studies (69 participants) showed some benefit in favour of the electric toothbrush; 2 studies (178 participants) showed no difference between the two toothbrushes.3 |
| Plaque medium term (6 weeks to 12 months) | Mean plaque medium term ranged from 1.12 to 1.55 | SMD 0.29 higher | — | 120 | ⊕⊕⊝⊝ | There was no clear difference between the toothbrushes for plaque medium term. 1 RCT (100 participants) not included in the meta‐analysis, which used a subjective assessment of oral hygiene, showed an improvement in favour of the electric toothbrush.4 |
| Quality of life | Not assessed | No studies assessed quality of life changes formally, although some made comments in the results or discussion sections of the reports. | ||||
| Dental caries | Not assessed | — | ||||
| Adverse effects | Seven studies did not assess or report adverse effects and one reported no adverse effects. 1 NRS reported discomfort when brushing, difficulty controlling the force and position of the electric toothbrush, and the electric toothbrush being out of order; 2 RCTs and 1 NRS reported participants being frightened when the electric toothbrush was first used. 1 RCT reported participants being dismissed from the study, but no clear reason was provided. | — | ||||
| *The risk in the intervention group (and its 95% confidence interval) is based on the assumed risk in the comparison group and the relative effect of the intervention (and its 95% CI). CI: confidence interval; ID: intellectual disability; MD: mean difference; NRS: non‐randomised study; RCT: randomised controlled trial; SD: standard deviation; SMD: standardised mean difference. | ||||||
| GRADE Working Group grades of evidence | ||||||
| aDowngraded two levels due to study design as three studies at high risk of bias (blinding of participants and personnel was not possible in three of the studies; one study also had incomplete outcome data). 1One NRS (23 participants) similarly found no difference between toothbrushes for gingival inflammation in the short term. 2Four NRS (144 participants) had inconsistent findings at 5 to 9 months for gingival inflammation in the medium term; data not suitable for meta‐analysis. 1 NRS (23 participants) found no effect at 16 months (MD 0.00, 95% CI –0.15 to 0.15). 3One NRS (23 participants) found no difference between toothbrushes for plaque in the short term. 4Five NRS (173 participants) found broadly similar results to the meta‐analysis, showing little or no effect on plaque in the medium term. | ||||||
| Training of carers compared to no training of carers for people with ID | ||||||
| Population: people with mixed levels of ID (age range unclear) Setting: residential Intervention: training of carers Comparison: no training of carers | ||||||
| Outcomes | Anticipated absolute effects* (95% CI) | Relative effect | Number of participants | Certainty of the evidence | Comments | |
| Risk with no carer training | Risk with carer training | |||||
| Gingival inflammation short term (< 6 weeks) | Not assessed | ‐ | ||||
| Gingival inflammation medium term (6 weeks to 12 months) | Mean gingival inflammation medium term ranged from 1.2 to 2.47 | MD 0.09 lower | — | 99 | ⊕⊕⊝⊝ | Training of carers may not have made a difference to gingival inflammation. Findings for the 2 studies were inconsistent. |
| Plaque short term (< 6 weeks) | Not assessed | ‐ | ||||
| Plaque medium term (6 weeks to 12 months) | Mean plaque medium term ranged from 1.4 to 1.89 | MD 0.07 lower | — | 99 | ⊕⊕⊝⊝ | Training of carers may not have reduced the plaque levels for people with ID medium term.1 |
| Knowledge medium term (6 weeks to 12 months) | Mean knowledge medium term ranged from 6.8 to 7.86 | MD 0.69 higher | — | 189 | ⊕⊕⊝⊝ | Training of carers may have resulted in a moderate increase in oral healthcare knowledge medium term. 1 RCT (24 participants) not included in the meta‐analysis found no clear difference between groups. |
| Behaviour, attitude and self‐efficacy (BAS) medium term | Mean BAS ranged from 4.7 to 5.42 | MD 0.15 higher | — | 189 | ⊕⊝⊝⊝ | Training of carers may not have an effect on their BAS in the medium term. In the short term, 1 RCT (193 participants) assessed behaviour and reported a strong benefit for training.2 |
| Quality of life | Not assessed | No studies formally reported quality of life measures, though some studies commented on quality of life issues in the discussion and conclusion section of the reports. | ||||
| Dental caries | Not assessed | — | ||||
| Adverse effects | 1 RCT reported there were no adverse effects. The other studies did not report adverse effects. | — | ||||
| *The risk in the intervention group (and its 95% confidence interval) is based on the assumed risk in the comparison group and the relative effect of the intervention (and its 95% CI). BAS: behaviour, attitude and self‐efficacy; CI: confidence interval; ID: intellectual disability; ITS: interrupted time series; MD: mean difference; NRCT: non‐randomised controlled trial; NRS: non‐randomised study; RCT: randomised controlled trial; SD: standard deviation. | ||||||
| GRADE Working Group grades of evidence | ||||||
| aDowngraded one level due to study design as studies at high risk of bias (one study was a cluster RCT). 1One NRCT (34 participants) found plaque levels of people with ID were reduced after training of their carers, short term, particularly if carers were made accountable for their performance. 1 ITS (11 participants) found broadly consistent findings to the NRCT in the medium term. 2Two NRS (15 participants) assessing the behaviour of the carers and people with ID showed evidence in favour of training for all outcomes assessed. | ||||||
| Oral hygiene training compared to no oral hygiene training for people with ID | ||||||
| Population: children and adults with mild to profound ID Setting: residential or school Intervention: oral hygiene training (toothbrushing routine) Comparison: no oral hygiene training | ||||||
| Outcomes | Anticipated absolute effects* (95% CI) | Relative effect | Number of participants | Certainty of the evidence | Comments | |
| Risk with no oral hygiene training | Risk with oral hygiene training | |||||
| Gingival inflammation short term (< 6 weeks) | The mean gingival inflammation short term was 1.26 (SD 0.46) | MD 0.28 lower | — | 10 | ⊕⊝⊝⊝ | There was no evidence of a difference between the groups in the short term.1 |
| Gingival inflammation medium term (6 weeks to 12 months) | Not assessed | ‐ | ||||
| Plaque short term (< 6 weeks) | The mean plaque short term was 0.82 (0.24) | MD 0.47 lower | — | 10 | ⊕⊝⊝⊝ | Training of people with ID may have resulted in a moderate reduction in plaque short term. An RCT (26 participants) not included in the meta‐analysis had similar findings.1 |
| Plaque medium term (6 weeks to 12 months) | Not assessed | ‐ | ||||
| Knowledge | Not assessed | — | ||||
| Behaviour, attitude and self‐efficacy medium and long term (6 weeks to > 12 months) Assessed with: steps achieved in a toothbrushing routine Follow‐up: 100 days to 19 months | Results were not presented in a format that could be included in a meta‐analysis. | 59 (4 NRS) | ⊕⊝⊝⊝ | 3 NRS (56 participants) reported an increase in toothbrushing after training; 1 NRS (3 participants) had mixed results. | ||
| Quality of life | Not assessed | — | ||||
| Dental caries | Not assessed | — | ||||
| Adverse effects | 2 RCTs and 2 NRS reported no adverse effects. In 1 NRS, 1 participant had nausea (considered a delaying tactic by study investigators), and in another NRS, 2 participants showed sensitivity to having their mouths held open. | — | ||||
| *The risk in the intervention group (and its 95% confidence interval) is based on the assumed risk in the comparison group and the relative effect of the intervention (and its 95% CI). CI: confidence interval; ID: intellectual disability; MD: mean difference; NRS: non‐randomised study; RCT: randomised controlled trial; SD: standard deviation. | ||||||
| GRADE Working Group grades of evidence | ||||||
| aDowngraded two levels for imprecision and one for study design: based on the findings of one study at unclear risk of bias with only 10 participants and wide confidence intervals. bDowngraded three levels due to study design: based on NRS, with no control groups and all studies were at high risk of bias. 1Four NRS (59 participants) assessed toothbrushing behaviour following skills training of people with ID, 3 of which showed improved toothbrushing behaviour; no measures of gingival inflammation levels were recorded in these studies. | ||||||
| Scheduled dental recall intervals and supervised toothbrushing compared to usual care for people with ID | ||||||
| Population: adults (mean age 30.9 years) (level of ID unclear) Setting: day centre Intervention: scheduled dental visits (oral hygiene instruction, with or without scale and polish), with supervised daily toothbrushing by carers ("staff provided reminders, encouragement and motivation") Comparison: usual care ("no specific treatment") | ||||||
| Outcomes | Anticipated absolute effects* (95% CI) | Relative effect | Number of participants | Certainty of the evidence | Comments | |
| Risk with usual care | Risk with 1‐monthly dental recall intervals | |||||
| Gingival inflammation short term (< 6 weeks) | Not assessed | ‐ | ||||
| Gingival pocketing long term (> 12 months) | The mean gingival pocketing long term was 0.9 (SD 1.4) | MD 0.60 lower | — | 304 | ⊕⊕⊝⊝ | One‐monthly dental recall intervals and supervised toothbrushing may have reduced gingival pocketing long term. This was also found for the 3‐ and 6‐monthly recall intervals. Findings were broadly similar at 12 and 18 months. |
| Gingival bleeding long term (> 12 months) | The mean gingival bleeding long term was 2.4 (SD 2.0) | MD 0.20 lower | — | 304 | ⊕⊕⊝⊝ | One‐monthly dental recall intervals showed no evidence of benefit. This was also found for 3‐ and 6‐monthly recall intervals. Findings were broadly similar at 12 and 18 months. |
| Plaque short term (< 6 weeks) | Not assessed | ‐ | ||||
| Plaque long term (> 12 months) | The mean plaque long term was 2.0 (SD 1.9) | MD 0.70 lower | — | 304 | ⊕⊕⊝⊝ | 1‐monthly dental recall intervals may have reduced plaque levels long term (24 months). This was also found for 3‐monthly recall intervals, but not for 6‐monthly. Findings were broadly similar at 12 and 18 months. |
| Quality of life | Not assessed | — | ||||
| Dental caries | Not reported | The study assessed and reported dental caries using the DMFT Index at baseline but did not report assessing DMFT at any other time points. | ||||
| Adverse effects | None reported | — | ||||
| *The risk in the intervention group (and its 95% confidence interval) is based on the assumed risk in the comparison group and the relative effect of the intervention (and its 95% CI). CI: confidence interval; DMFT: Decayed, Missing or Filled Teeth; ID: intellectual disability; MD: mean difference; RCT: randomised controlled trial; SD: standard deviation; WHO: World Health Organization. | ||||||
| GRADE Working Group grades of evidence | ||||||
| aDowngraded one level for imprecision and one for study design: based on one study at unclear risk of bias, with wide confidence intervals. | ||||||
| Discussion of clinical photographs as OH motivators compared to no discussion of photographs for people with ID | ||||||
| Population: people with ID (level of ID and age unclear) Setting: day centre Intervention: discussion of clinical photographs as OH motivators and OH instruction at monthly intervals Comparison: no discussion of clinical photographs, but did receive OH instruction at monthly intervals | ||||||
| Outcomes | Anticipated absolute effects* (95% CI) | Relative effect | Number of participants | Certainty of the evidence | Comments | |
| Risk with oral hygiene instruction (OHI) only | Risk with discussion of clinical photographs plus OHI | |||||
| Gingival inflammation short term (< 6 weeks) | Not assessed | ‐ | ||||
| Gingival inflammation medium term (6 weeks to 12 months) | Not assessed | ‐ | ||||
| Plaque short term (< 6 weeks) | Not assessed | ‐ | ||||
| Plaque medium term (6 weeks to 12 months) | Mean plaque medium term was 7.4 (SD 2.0) | MD 0.1 lower | — | 29 | ⊕⊝⊝⊝ | There was no evidence of a difference in plaque levels medium term. Broadly similar findings were observed for extrinsic plaque levels. |
| Quality of life | Not assessed | — | ||||
| Dental caries | Not assessed | — | ||||
| Adverse effects | None reported | — | ||||
| *The risk in the intervention group (and its 95% confidence interval) is based on the assumed risk in the comparison group and the relative effect of the intervention (and its 95% CI). CI: confidence interval; ID: intellectual disability; MD: mean difference; OH: oral hygiene; RCT: randomised controlled trial; SD: standard deviation. | ||||||
| GRADE Working Group grades of evidence | ||||||
| aDowngraded two levels for imprecision and one for study design: single study at high risk of bias, with wide confidence intervals. | ||||||
| Daily compared to twice‐weekly or once‐weekly toothbrushing by dental students for people with ID | ||||
| Population: people aged 15 to 30 years with mixed levels of ID Setting: residential Intervention: daily toothbrushing by dental student Comparison: twice‐weekly or once‐weekly toothbrushing by dental student | ||||
| Outcomes | Impact | Number of participants | Certainty of the evidence | Comment |
| Gingival inflammation short term (< 6 weeks) | Not assessed | ‐ | ‐ | ‐ |
| Gingival inflammation medium term (6 weeks to 12 months) | Not assessed | ‐ | ‐ | ‐ |
| Plaque short term (< 6 weeks) | For people with ID whose teeth were brushed for them by dental professionals, brushing daily most likely reduced gingival inflammation more effectively than twice‐weekly and even more effectively than once‐weekly, in the short term. | 80 | ⊕⊕⊝⊝ | This study also compared electric and manual toothbrushes (findings reported above) |
| Plaque medium term (6 weeks to 12 months) | Not assessed | ‐ | ‐ | |
| Quality of life | Not assessed | — | — | — |
| Dental caries | Not assessed | — | — | — |
| Adverse effects | None reported | — | — | — |
| ID: intellectual disability; RCT: randomised controlled trial. | ||||
| GRADE Working Group grades of evidence | ||||
| aDowngraded two levels for imprecision: single small study with no standard deviation data reported. | ||||
| Toothpaste with a plaque‐disclosing agent compared to conventional toothpaste for children with ID | ||||
| Population: children aged 7 to 13 years with Down Syndrome (mild to moderate levels of ID) Setting: residential Intervention: toothpaste with a plaque‐disclosing agent Comparison: conventional toothpaste | ||||
| Outcomes | Impact | Number of participants | Certainty of the evidence | Comment |
| Gingival inflammation short term (< 6 weeks) | Using a toothpaste with a plaque‐disclosing agent may have reduced gingival inflammation slightly in the short term. | 80 | ⊕⊝⊝⊝ | Study was a non randomised cross over trial; only 2 of the 4 arms were relevant to this review. |
| Gingival inflammation medium term (6 weeks to 12 months) | Not assessed | ‐ | ‐ | ‐ |
| Plaque short term (< 6 weeks) | Using a toothpaste with a plaque‐disclosing agent may have reduced plaque levels in the short term. | 80 | ⊕⊝⊝⊝ | Study was a non randomised cross over trial; only 2 of the 4 arms were relevant to this review. |
| Plaque medium term (6 weeks to 12 months) | Not assessed | ‐ | ‐ | ‐ |
| Quality of life | Not assessed | — | — | — |
| Dental caries | Not assessed | — | — | — |
| Adverse effects | None reported | — | — | — |
| ID: intellectual disability | ||||
| GRADE Working Group grades of evidence | ||||
| aDowngraded three levels due to study design: single non‐randomised study at unclear risk of bias, with no standard deviation reported. | ||||
| Individualised care plans compared to usual care for people with ID | ||||
| Population: adults, aged 22 to 57 years with mixed levels of ID Setting: residential Intervention: individualised care plans based on a multidisciplinary assessment Comparison: usual care ‐ continued regular oral hygiene care, which was supported by a carer following institution's standard guidelines | ||||
| Outcomes | Impact | Number of participants | Certainty of the evidence | Comment |
| Gingival inflammation short term (< 6 weeks) | Not assessed | ‐ | ‐ | ‐ |
| Gingival inflammation medium term (6 weeks to 12 months) | Not assessed | ‐ | ‐ | ‐ |
| Plaque short term (< 6 weeks) | Not assessed | ‐ | ‐ | ‐ |
| Plaque medium term (6 weeks to 12 months) | The use of individualised oral care plans for people with ID may reduce plaque levels over 12 months.The "improvement differential" from baseline for the intervention group was 38% compared to 5% for the control group. | 79 | ⊕⊝⊝⊝ | NRCT |
| Quality of life | Not assessed | — | — | — |
| Dental caries | Not assessed | — | — | — |
| Adverse effects | None reported | — | — | — |
| ID: intellectual disability. | ||||
| GRADE Working Group grades of evidence | ||||
| aDowngraded three levels due to study design: non‐randomised study at high risk of bias, use of subjective assessment tool and no standard deviation data reported. | ||||
Background
Description of the condition
Oral hygiene is the process of cleaning the hard and soft tissues of the oral cavity (teeth, gums and tongue), fixed dental prostheses, oral appliances and dentures. Failure to perform regular and effective oral hygiene results in increased levels and varieties of the dental bacteria that make up dental plaque. Dental plaque has been shown to have a major role in the development of periodontal disease and dental caries, the two most common oral diseases (Axelsson 2004; Löe 2000)
Poor oral hygiene can affect a person's quality of life because of pain and discomfort when eating, poor self‐esteem or sleep disturbance as a result of dental caries (Bonetti 2015). Evidence also exists linking levels of oral hygiene and periodontal status to diabetes, aspiration pneumonia and rheumatoid arthritis and evidence is emerging of a link with other systemic diseases and conditions such as cardiovascular disease, liver disease and obesity (Borgnakke 2015; Horwitz 2000).
People with an intellectual disability (ID) have a higher prevalence and greater severity of periodontal disease than the general population (Anders 2010; Campanaro 2014). The prevalence of dental caries in children with ID is similar to those of the same age in the general population (Whelton 2009). However, their oral health deteriorates at a faster rate as they move into adulthood. There are more untreated dental caries, more missing teeth and fewer restorations found in adults with ID than in the general population (Anders 2010; Catteau 2011; Crowley 2005; De Jongh 2008; Hennequin 2008; Morgan 2012; Oliveira 2013).
In the general population, brushing regularly with fluoridated toothpaste plays an important role in preventing dental caries and periodontal disease (Axelsson 2004; Broadbent 2011; Chestnutt 1998; Löe 1965; Löe 2000; Van der Weijden 2011; Zimmermann 2015). Whether this also applies to people with an ID is less clear, as many research studies on oral health exclude people with disabilities (Glassman 2009).
The removal of dental plaque may reduce the prevalence of periodontal disease and dental caries (Axelsson 1978; Axelsson 2004; Löe 1965; Löe 2000). However, the plaque must be removed thoroughly and regularly to achieve this effect. This health‐related behaviour requires a person to have the relevant capabilities, opportunities and motivation to perform the necessary routines (Broadbent 2011; Stewart 1996; Watt 2005). For people with an ID, understanding the importance of removing dental plaque and developing the skills to do so requires more effort and achieving the standard of oral hygiene necessary for good oral health may require the support of others (Crowley 2005).
When considering the issues possibly influencing oral hygiene practices for the population with ID, it is important first to have a clear definition of ID; second, to consider the specific barriers to regular oral hygiene practices that might exist for people with ID; and third, to consider facilitators to promoting regular oral hygiene practices that might exist for people with ID.
Definition of intellectual disability
The most widely used current definition of disability comes from the World Health Organization's (WHO) International Classification of Functioning, Disability and Health (ICF), which incorporates the complex interactions between health conditions, environmental factors and personal factors. Regarding a person with an ID, this definition would consider how their personal factors, health condition and environment affect their lives (WHO 2001). Three elements are common for people with ID: a significant impairment of intelligence, a resultant significant reduction in adaptive behaviour/social functioning and the development of the condition (which persists throughout life) before the age of 18 years (Schalock 2010).
The WHO has also developed an operational definition of ID, which focuses mostly on the functional elements of ID, in the International Statistical Classification of Diseases and Related Health Problems, 10th version (ICD‐10) (WHO 2011). The ICF definition of disability is designed to complement the ICD‐10 definition.
The ICD‐10 describes the four levels of ID as follows.
-
Mild ID (ICD‐10 F70): intelligence quotient (IQ) range 50 to 69: "Ability to use speech in everyday situations; usually full independence in self care; Difficulties in identification of this population arise, as those with borderline disability may not be in contact with service providers."
-
Moderate ID (ICD‐10 F71): IQ between 35 and 49: "Slow in comprehension; supervision of self care, retarded motor skills."
-
Severe ID (ICD‐10 F72): IQ between 20 and 34: "Marked impairment of motor skills; clinically significant damage to Central Nervous System (CNS)."
-
Profound ID (ICD‐10 F73): IQ less than 20: "Severely limited understanding; Immobility or restricted mobility; Incontinence; requires constant supervision; usually organic aetiology."
We acknowledge that other terms and definitions have been used to describe people with ID, both historically and currently. Whilst we acknowledge that the ICF is currently accepted as the most holistic definition of disability, we considered it unlikely to have been used in the studies that were potentially eligible for this review. Therefore, we planned to use the ICD‐10 definition as the reference to determine the inclusion or exclusion of studies, as it provides a detailed nomenclature of diseases (Kurbasic 2008). In updates to this review, the ICF definition of ID will have become more commonly used in studies and will more accurately reflect the make‐up of the population with disabilities. In addition, the ICF definitions are a better representation of populations requiring targeted services. However, the definition used (ICD‐10) was considered by the team to accurately represent the population of interest in this review.
The heterogeneous nature of populations with ID adds further complexity to the assessment of interventions of relevance to these populations. An person's level of ID may impact their cognitive and physical abilities and personal and environmental factors, which may affect their response to an intervention. The response to an intervention therefore may be different for different people or groups of people with ID. We highlighted when studies provided details of the level of ID and personal and environmental factors of the participants.
Barriers to oral hygiene practice for people with intellectual disability
Capability, opportunity and motivation are required to achieve adequate oral hygiene. Oral hygiene tasks are more difficult for people with ID; they may lack the manual dexterity or cognitive skills to carry out or understand the need for effective oral hygiene (Anders 2010; Löe 2000). There may be other associated conditions such as sensory impairment, anxiety, or chronic medical or behavioural conditions that militate against carrying out oral hygiene effectively (Gordon 1998; Minihan 2014; Prangnell 2008). In one 2003 Irish study, carers of people with ID identified some of the physical barriers caused by the disability such as an inability to rinse, difficulty getting a toothbrush into someone's mouth, an oversensitive mouth and a tendency to gag (Taylor‐Dillon 2003). Nearly 10% of people with ID have dysphagia, which is associated with an increased tendency to choke or gag during toothbrushing (Chadwick 2009).
People with ID have chronic, poor oral hygiene and require more support with their oral hygiene. Carers for people with ID are often poorly trained (Crowley 2005). Oral hygiene is not seen as a priority for overstretched carers, particularly if it is not a personal priority (Kaye 2005; Rawlinson 2001). Lack of co‐operation and challenging behaviour on the part of the person with ID may add to this burden.
Facilitators for oral hygiene practice for people with intellectual disability
Behaviour management techniques may improve the co‐operation of people with ID when performing oral hygiene. Education may change carers' behaviour. Management techniques may improve the co‐operation of people with ID when performing oral hygiene. Education may change carers' attitudes and improve their skills (Faulks 2000; Mac Giolla Phadraig 2013). Management support and guidance, stakeholder engagement, policy documents and increased resources may improve levels of oral hygiene provision in community and institutionalised settings (Glassman 2003; Glassman 2006; Glassman 2009). Specially designed or adapted oral hygiene aids may improve the oral hygiene skills of people with ID or their carers (Dougall 2008).
Description of the intervention
The interventions evaluated in this Cochrane Review focused on two distinct groups: people with an ID and the carers supporting, assisting or providing oral hygiene care for them. The range of carers involved was expected to be diverse; formal and non‐formal personal carers with and without relevant training, with and without dental qualifications, and with and without psychology or related qualifications.
We defined oral hygiene in this review as the mechanical removal of plaque with manual or electric toothbrushes, interdental aids or other mechanical aids. Interventions designed to impact on levels of oral hygiene tend to categorise outcomes as clinical, such as reductions in plaque levels, periodontal diseases or dental caries, and behavioural/psychological, such as changes in comprehension, self‐efficacy or motivation (Cooper 2013; Cooper 2014). This review included interventions that assessed clinical or behavioural/psychological outcomes or both. We considered any intervention that may have impacted on any combination of duration, frequency and effectiveness of oral hygiene practices.
How the intervention might work
Behavioural change models are relevant to oral hygiene behaviour and effective when used in interventions for people with ID (Renz 2007; Willems 2017). In one systematic review, Newton 2015 found using the constructs themselves to be a more reliable way of predicting behavioural change. Michie 2013 identified a taxonomy of 93 behavioural change techniques (BCTs) that provides a standardisation of the terminology used. In order to make the taxonomy of BCTs more accessible for clinicians, the BCTs can be grouped into 16 labelled clusters (Cane 2015; Michie 2011; Michie 2013). These labels provide a means to identifying the elements in an intervention that are likely to improve adherence and make routines easier to establish in relation to oral hygiene, even if they are not formally identified as BCTs. To further assist the analysis of interventions, Michie developed the 'Behavioural Change Wheel', which characterises the elements at three levels: a behaviour system at the hub, encircled by intervention functions and then by policy categories.
The COM‐B system
We considered the interventions under the 'behaviour system' elements of Capability (which includes knowledge and skills), Opportunity (both physical and social) and Motivation (both automatic and reflexive), as outlined by Michie and colleagues as the COM‐B system for understanding behaviour and behavioural change (Michie 2011).
Capability‐based interventions, defined as the psychological and physical capacity to engage in the activity concerned, might be a knowledge‐based intervention in relation to the comprehension and reasoning around why oral hygiene is required or a skills‐based intervention that trains a person with ID in the physical skills of toothbrushing or that trains carers how to brush the teeth of a person with ID.
Opportunity‐based interventions, which include both physical and social opportunities, should consider the elements beyond the individual, that is contexts such as the variety of settings in which the intervention is delivered or undertaken, for example, home, school, dental clinic, day care or residential care setting or the influences of the families or carers' attitudes regarding oral hygiene practices.
Motivation‐based interventions, which include both automatic and reflective processes, might result in conscious decision‐making where a goal or reward is identified to instigate or perpetuate a daily oral hygiene routine.
An intervention may change one or more of these behavioural elements resulting in the desired behaviour of performing regular oral hygiene.
Why it is important to do this review
The difficulties of providing dental care for people with disabilities have been acknowledged (Al Kindi 2016). Access to care is known to be more difficult; resources are stretched for parents, carers and healthcare professionals (Dougall 2008; Kaye 2005; Prabhu 2010; Sagheri 2013). The consequences of oral diseases for people with ID are more profound. Interventions designed to suit people with disabilities must show benefit (WHO 2011). Whilst an increasing number of good‐quality systematic reviews of oral health interventions designed for the general population have been produced (Agnihotry 2016), Cochrane has not specifically reviewed the effectiveness of oral health interventions focused on people with disabilities (Cochrane Oral Health 2019).
One scoping review of interventions aimed at the wider population of people with disabilities has identified people with ID as being the most common target subpopulation (Waldron 2016). Oral hygiene status is one of the most common targets of oral health intervention for people with disabilities. This systematic review of oral hygiene interventions for people with ID allows us to draw conclusions about the effectiveness of these types of interventions. Furthermore, the review may increase dental professionals' understanding of behavioural change principles, inform the training of the dental team, and have an impact on the design and implementation of future oral health interventions for this population.
Cochrane Oral Health undertook an extensive prioritisation exercise in 2014 to identify a core portfolio of titles that were the most clinically important ones to maintain on the Cochrane Library (Worthington 2015). This exercise identified prevention and maintenance as priorities, which included oral hygiene adherence and caries prevention. Whilst not specifically identifying people with disabilities, the exercise also prioritised oral health promotion, specifically in institutionalised settings (Worthington 2015).
Objectives
To assess the effects (benefits and harms) of oral hygiene interventions, specifically the mechanical removal of plaque, for people with intellectual disabilities (ID).
Methods
Criteria for considering studies for this review
Types of studies
We included randomised controlled trials (RCTs), including cluster‐RCTs, evaluating interventions to promote oral hygiene, specifically the mechanical removal of plaque, that were targeted at people with ID and groups such as parents, carers and other healthcare professionals caring for people with ID.
As we anticipated that the number of RCTs was likely to be low, we included some types of non‐randomised studies (NRS): non‐randomised controlled trials (NRCTs), controlled before‐after studies, interrupted time series studies (ITS) and repeated measures studies.
ITS, where multiple data points are collected before and after the intervention and the intervention effect is measured against the preintervention trend and repeated measure studies, where these measures are taken on the same people at each time point, were only included if they had a clearly defined point in time when the intervention occurred and at least three data points before and three after the intervention.
We analysed RCTs and NRS separately, and presented RCT findings as the key evidence.
We applied no language restrictions.
Types of participants
People with an ID, living at home, in day care, in hospital or in a residential care setting. We considered all ID as defined by the ICD‐10 (WHO 2011).
Types of interventions
We considered all oral hygiene interventions that used or promoted the mechanical removal of plaque. Interventions may have included, but were not limited to, the following components.
-
Oral hygiene‐related knowledge‐based interventions for participants or their carers, for example, education in the care of the teeth and gums, diseases of the teeth and gums, and prevention of diseases of the teeth and gums.
-
Oral hygiene‐related behavioural interventions for participants or their carers that result in a behavioural change that can be observed and is replicable, for example, goal setting or positive reinforcement.
-
Oral hygiene‐related skills training for participants, for example, interventions related to toothbrushing skills or other oral hygiene routines.
-
Oral hygiene‐related skills training for carers, for example, interventions related to assessing toothbrushing skills or assisting participants with toothbrushing or other oral hygiene routines or providing oral hygiene care to participants.
To be eligible, controlled studies must have included a comparison with at least one of the following: usual care, no care or a similar alternative intervention. Examples of studies comparing similar alternative interventions might be a study comparing education provided in different formats, for example, face‐to‐face versus an information leaflet or a study comparing oral hygiene care provided after a training session versus oral hygiene care provided without training.
In relation to the definition of oral hygiene, we excluded interventions focusing on the chemical removal of plaque alone. The use of a chemical agent, which is used on a toothbrush and arguably removes plaque both mechanically and chemically, is complex, as the measurement of the resulting reduction of plaque cannot be assigned to either solely the mechanical or chemical action. We excluded these studies, except for those studies using a conventional non‐prescription toothpaste normally used by the participants or using a non‐conventional chemical agent for both the intervention and control in studies comparing the mechanical removal of plaque. For example, a study comparing a manual toothbrush with an electric toothbrush where both were used with a non‐conventional toothpaste such as chlorhexidine or extra‐strength fluoride toothpaste.
Types of outcome measures
Outcome measures included both behavioural and clinical measures.
We based the behavioural outcomes measured on the COM‐B system and included indicators such as improved toothbrushing skills, changes in knowledge of participants and carers with regard to oral health, and increased episodes and duration of toothbrushing. We accepted any reasonable instrument used in the included studies such as questionnaires, interviews, observational outcomes, video recordings, diaries, self‐reported outcomes or observational measures such as measuring toothpaste weight to check adherence with toothbrushing.
The clinical outcomes measured included indicators such as the prevalence/incidence of dental plaque, prevalence/incidence of periodontal disease (gum disease) and prevalence/incidence of dental caries. We used only published or validated assessments of the clinical outcomes or a comparable measure, for example, dental plaque measured using the Plaque Index, as outlined in Silness 1964 or Quigley‐Hein Plaque Index as modified by Turesky and colleagues (Turesky 1970). Gingivitis measured using an index such as the Gingival Index, as outlined in Löe 1963 and Löe 1967 or the Modified Gingival Index (Lobene 1986). Dental caries was to be measured using an index such as the Decayed, Missing or Filled Teeth/Surface Index (dmft/s; DMFT/S) (Petersen 2013).
We considered all time frames for the delivery and follow‐up of the intervention. The follow‐up time frames were grouped for analysis into short, medium and long term, for all outcomes. A systematic review of the effects of oral hygiene on chronic periodontitis in the general population excluded studies lasting less than nine months, in order to differentiate between gingivitis and periodontitis (Hujoel 2005). The three RCTs included in that review were followed up for over three years. Mombelli 1998 reflected on the limitations of longitudinal studies of periodontal disease when considering the issues of measurement error in periodontal probing and the impact of concepts such as bursts of disease activity versus a continuous disease process, in relation to the progression of periodontal disease. Mombelli 1998 concluded that studies of 20 years or more in length would be required to achieve sufficient confidence in the results. One systematic review on the effects of toothbrushing frequency on the prevention of dental caries showed that the eligible interventions were all followed up for between 11 months and 15 years (Kumar 2016). The division of time frames was guided by a review of the literature on the effects of oral hygiene interventions on the oral health of people with ID and the knowledge, behaviour, attitude and self‐efficacy of the people with ID or their carers.
-
Short‐term follow‐up (six weeks or less) may allow for some clinically visible signs of early changes in gingival health to become apparent, permitting the impact of possible differences in the microbial load, immune responses and environmental factors in this population group to manifest in clinically observable signs (Garmyn 1998). It may also be useful to observe the clinical changes resulting from an intervention without confounding the result with other variables, for example, the effect on oral hygiene following skills training without the variable of adherence to oral hygiene practices over time (Egelberg 1994). The early, clinically visible signs would include changes in plaque prevalence/incidence and changes in gingival bleeding or inflammation (Löe 1965).
-
Medium‐term follow‐up (six weeks to 12 months) may allow for some additional signs of changes in gingival health to be recorded compared to the baseline status, depending on the success of the intervention, such as gingival pocket probing depths, as well as consistent changes in knowledge and behaviour.
-
Long‐term follow‐up (greater than 12 months) would allow for some assessment of those measures that require a longer time frame to show change, such as dental caries prevalence/incidence or clinical attachment loss or bone loss in relation to gingival disease, as well as continued follow‐up on all other assessments. Long‐term studies would also allow for follow‐up on any short‐ or medium‐term success regarding changes in oral hygiene behaviour that is crucial to maintaining oral health (Schou 1998). It must be accepted that any findings from these long‐term interventions will be confounded by factors outside the study setting.
Primary outcomes
-
Gingival health of people with an ID, for example, plaque, gingival inflammation, calculus.
Secondary outcomes
-
Oral hygiene knowledge acquisition by people with an ID or the acquisition of knowledge by their carers with regard to oral hygiene.
-
Changes in behaviour, attitude and self‐efficacy of people with an ID or their carers.
-
Quality of life changes or long‐term, patient‐centred outcomes for people with an ID (e.g. tooth retention).
-
Dental caries levels of people with an ID.
-
Any unintended (positive or negative) effects of the interventions.
Outcome measures relating to clinical outcomes must have been published or validated or comparable to measurements such as dental plaque levels (e.g. Plaque Score), gingival health (e.g. Gingival Index) or dental caries prevalence/incidence (i.e. DMFT/S). Behavioural outcome assessments with regard to changes in capability, opportunity or motivation of the participant or carer for oral hygiene practices included any instrument used in the included studies that the review authors considered reasonable.
Search methods for identification of studies
Electronic searches
Cochrane Oral Health’s Information Specialist conducted systematic searches in the following databases for randomised controlled trials and controlled clinical trials:
-
Cochrane Oral Health's Trials Register (searched 4 February 2019);
-
Cochrane Central Register of Controlled Trials (CENTRAL; in the Cochrane Register of Studies; searched 4 February 2019);
-
MEDLINE Ovid (1946 to 4 February 2019);
-
Embase Ovid (12 October 2016 to 4 February 2019);
-
PsycINFO Ovid (1806 to 4 February 2019).
Details of the search strategies can be found in Appendix 1.
Subject strategies were modelled on the search strategy designed for MEDLINE Ovid. Due to the Cochrane Centralised Search Project to identify all clinical trials in the database and add them to CENTRAL, only the most recent months of the Embase database were searched. See the searching page on the Cochrane Oral Health website for more information. There were no other restrictions on the date of publication when searching the electronic databases; and searches were not limited by language or publication status.
Searching other resources
The following trial registries were searched for ongoing studies to 4 February 2019 (see details of search terms used in Appendix 1):
-
US National Institutes of Health Ongoing Trials Register ClinicalTrials.gov (clinicaltrials.gov/);
-
WHO International Clinical Trials Registry Platform (apps.who.int/trialsearch).
We handsearched the specialist conference abstracts from the International Association of Disability and Oral Health (2006 to 2016). Conference abstracts prior to 2006 were not published and were not available from other sources.
We checked the bibliographies of included studies and any relevant systematic reviews identified for further references to relevant trials (Horsley 2011).
We considered any unpublished studies discovered using the search methods described above if they met the inclusion criteria for this review.
We considered adverse effects described in included studies only.
Data collection and analysis
Selection of studies
Five review authors independently examined the studies identified by the searches and ensured that each study was examined by at least two review authors, firstly by the titles and abstracts and then by obtaining and reading the full text, if the study was considered potentially relevant. We used specific inclusion criteria in our decision‐making including the participants, interventions and study designs as outlined below. A sixth review author was the arbiter.
Inclusion criteria:
-
participants must have had an ID as defined by the ICD‐10 or be a carer of a person with an ID;
-
the intervention must have related to oral hygiene;
-
study design must have been either an RCT or one of the NRS outlined earlier. Non‐controlled studies had to have at least three before and three after measures;
-
complex interventions with an oral hygiene element were considered if the outcome from the oral hygiene component could be appraised separately.
Details such as keywords, authors, publication and institutions were available to the review authors. Any disagreements were discussed by the reviewing authors and the arbiter. We recorded justifications for all decisions. When we identified multiple reports of the same study, we linked these together as far as possible. We contacted study authors to clarify details regarding eligibility where necessary. We attempted to identify all relevant studies irrespective of language. Relevant non‐English language papers were translated. Any studies identified by the searches, involving any of the review authors, were examined by other review authors.
Data extraction and management
Two review authors independently extracted data for each study using a specially designed data collection sheet, which was piloted by four of the review authors. We extracted data under the following headings: profile of the participants, number of participants, settings, details of interventions including details of the carers or personnel delivering or supporting the intervention and any BCTs identified within the interventions, outcomes measured, duration of intervention and follow‐up, and study design. We designed a template for the Characteristics of included studies tables, based on the methods outlined in the protocol (Waldron 2017), and headings used in the data collection sheet, to highlight the important elements of the studies (Appendix 2).
Assessment of risk of bias in included studies
Two review authors independently assessed the risk of bias for each study, discussing any disagreements with the arbiter. We recorded justifications for decisions. To avoid any conflict of interest, we excluded team members who were authors of included studies from the 'Risk of bias' assessment of those studies and alternative review authors undertook this assessment.
We considered bias for RCTs and NRCT for the following domains: selection bias, performance bias, detection bias, attrition bias and reporting bias as per the Cochrane Handbook for Systematic Reviews of Interventions (Higgins 2011a). We considered bias for cluster‐RCTs under the two different units of measurement, the cluster and the participant, if provided and under the same domains as for RCTs (Campbell 2012).
We considered bias for non‐controlled trials using the Effective Practice and Organisation of Care (EPOC) criteria for assessing risk of bias under the following headings (EPOC 2016; Sterne 2016).
-
Was the intervention independent of other changes?
-
Was the shape of the intervention effect prespecified?
-
Was the intervention unlikely to affect data collection?
-
Was knowledge of the allocated interventions adequately prevented during the study?
-
Were incomplete outcome data adequately addressed?
-
Was the study free from selective outcome reporting?
We supplemented this with information on participant and study characteristics where appropriate.
We completed a 'Risk of bias' table for each included study and rated each study as high risk, low risk or unclear risk of bias for the separate domains and presented the results graphically (Figure 1; Figure 2). All domains were regarded as equally important in this review. The overall risk of bias within a study was determined across domains depending on the number of low, unclear and high ratings: if there was at least one rating of high risk of bias for the study, it was rated overall as high risk of bias; if all ratings were low risk of bias, the study was rated low overall; if there was a mix of low and unclear ratings, the study was rated overall as being at unclear risk of bias.
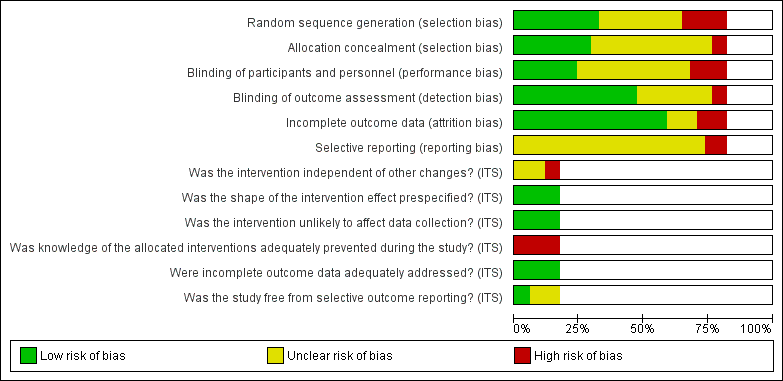
Risk of bias graph: review authors' judgements about each risk of bias item presented as percentages across all included studies.

Risk of bias summary: review authors' judgements about each risk of bias item for each included study.
Measures of treatment effect
For continuous data (e.g. plaque levels, self‐efficacy scale), we used the mean difference (MD) when the same scale was used or standardised mean difference (SMD) if more than one scale was used to measure the same outcome, along with the 95% confidence interval (CI). Had we found dichotomous data, we would have used risk ratios (RR) and 95% CI.
Unit of analysis issues
We considered the unit of analysis with regard to whether the intervention was targeted at individual or group level, whether there was more than one element to the intervention and whether there were different time points measured in the intervention. When possible, we planned to adjust for clustering if participants were allocated to the same intervention in groups (e.g. family members or care homes), for example, in cluster‐RCTs. To account for the effect of clustering, we planned to estimate inflated standard errors (SEs) (Deeks 2011).
With regard to RCTs and other comparative studies, we considered adjustments to avoid multiple use of participants in multiarm or cross‐over studies. If an intervention arm was included in more than one treatment comparison, we divided the number of participants in that arm and the number of events by the total number of treatment comparisons. This approach retained original information but reduced the precision of the pooled estimates.
We combined multiple arms when appropriate, for example, participants who brushed their own teeth and participants who required assistance or had their teeth brushed for them, or participants with different levels of disabilities. Findings for the separate arms are reported in the additional tables, but were pooled for the data analysis.
With regard to cross‐over trials, data from these need to be reported in a specific way to allow their inclusion in meta‐analyses (e.g. showing the data from each treatment period to allow calculation of the SE of the MD or data to approximate the correlation between results from different treatment periods). However, the necessary data were not available from the cross‐over trials that we identified.
Where multiple time points were presented in the studies, we selected the time point for each study that could be compared to another study in each of the time periods (short, medium or long term) or the longest time point in each time period or both.
Dealing with missing data
We made all reasonable efforts to contact authors for details and reasons for any missing outcome data (Young 2011). If data were missing and no information was available in the paper or was not obtainable by contacting the authors, we planned to assume, for dichotomous data, that dropout was due to the intervention being unsuccessful. No dichotomous data were reported in this review. We planned to perform sensitivity analyses to assess the effects of these assumptions, for example, missing data for intervention studies could have been dealt with by using intention‐to‐treat numbers. For continuous data, we planned to use this information if we were able to calculate the data from other data provided, for example, calculating standard deviation (SD) from SE and P values (Higgins 2011b).
Assessment of heterogeneity
We planned to assess levels of statistical heterogeneity by observing the CI within studies and, to a lesser extent, statistically by use of the Chi² test to determine whether observed differences in results were compatible with chance alone. Interpretation of the Chi² would take into consideration the sample size and number of studies included in the meta‐analysis.
We planned to quantify heterogeneity with the I² statistic, using the following guide. Some level of heterogeneity was expected (Higgins 2011a).
-
0% to 40%: might not be important.
-
30% to 60%: may represent moderate heterogeneity.
-
50% to 90%: may represent substantial heterogeneity.
-
75% to 100%: very substantial ('considerable') heterogeneity.
Assessment of reporting biases
Thorough searching of multiple databases should limit general reporting biases. We kept reporting biases due to such things as time lag bias (Hopewell 2007), selective outcome reporting (Dwan 2014), and publication bias (Hopewell 2009), to a minimum by inclusion of prospective trial registers; had we identified at least 10 studies in a comparison, we would have created funnel plots to explore publication bias and other biases related to study size. We made every effort to contact authors for results of outcomes included in their study objectives but not reported.
Data synthesis
We undertook meta‐analyses only when studies were sufficiently homogeneous in their participants, interventions and outcomes; otherwise, we presented a narrative of individual study findings. We planned to combine RRs for dichotomous data and MDs or SMDs for continuous data, using random‐effects models if at least four studies were included in a meta‐analysis. We used fixed‐effect models when there were fewer than four studies and when heterogeneity was reasonably low.
Subgroup analysis and investigation of heterogeneity
We planned to consider subgroup analysis for topics such as the following if sufficient data were available (Bender 2008).
-
Level of ID.
-
With versus without support of dental professionals.
-
Non‐formal carers (i.e. parents or siblings) versus formal carers.
-
Setting of the intervention (i.e. home‐based versus residential/institutional/school‐based interventions).
-
BCT used based on the COM‐B system.
-
Short‐term interventions versus long‐term interventions.
For this version of the review, the amount of data was too small to undertake any purposeful analysis.
Sensitivity analysis
We had planned to undertake sensitivity analyses based on risk of bias; however, there were insufficient studies for a sensitivity analysis of this type. We undertook post hoc analysis excluding two studies that included some participants with an IQ above 70 (Garcia‐Carrillo 2016; Gertenrich 1967a); no relevant effect was noticed.
Summarising findings and assessing the certainty of the evidence
We created 'Summary of findings' tables for the nine comparisons identified. We summarised the findings for the main outcomes measured: gingival inflammation or bleeding, and plaque (short, medium and long term); quality of life; dental caries; adverse effects. For training interventions, we also included oral health knowledge, and behaviour, attitude and self‐efficacy. We used GRADEpro software to assess the certainty of the evidence under the following headings: study design (risk of bias); inconsistency; indirectness; imprecision; publication bias; large effect; plausible confounding; dose response gradient (Schünemann 2013). We categorised the certainty of the body of evidence for each of the main outcomes for each comparison as high, moderate, low or very low.
Results
Description of studies
Results of the search
The searches from the databases resulted in 3805 records and an additional 41 records were identified from other sources. After removal of duplicates, review authors screened 3020 records by title and abstract using Covidence software (Covidence 2018), of which 2794 were judged to be irrelevant and rejected. Following this process, we attempted to source 226 full‐text records for assessment for eligibility against the inclusion and exclusion criteria outlined in the protocol (Waldron 2017). We rejected 153 records. We excluded 23 records (22 studies) for reasons listed in the Characteristics of excluded studies table; three studies are awaiting classification (see Characteristics of studies awaiting classification table), and one is ongoing (see Characteristics of ongoing studies table). Therefore, 34 studies (46 records) met the inclusion criteria for this review (Figure 3).

Study flow diagram. ID: intellectual disability; NRS: non‐randomised study; RCT: randomised controlled trial.
Three of the review authors piloted data extraction on a small number of records and some clarifications to the criteria were made following a team discussion (see the details in the Differences between protocol and review section). At least two review authors independently undertook screening and extraction: three review authors were involved in the screening of titles and abstracts (CW, JN, CMGP); five review authors were involved in the extraction process (CW, JN, CMGP, SG, CC).
Included studies
The study details are summarised in the Characteristics of included studies table.
Characteristics of the methodologies
Design
Thirty‐four studies met the inclusion criteria for this review: 19 RCTs and 15 NRSs. RCTs and NRSs are reported separately.
Fifteen studies were parallel‐group RCTs (Albino 1979; Bickley 1990; Bildt 2010; Christen 2007; Dôgan 2004; Ferozali 2007; Gonzalez 2013; Kaschke 2005; Kelner 1963; Lange 1985; Olmos 2016; Phlypo 2016; Sauvetre 1995; Shaw 1983; Swallow 1969), and four were cluster RCTs (Carr 1997; Garcia‐Carrillo 2016; Mac Giolla Phadraig 2015; Shaw 1991). Four RCTs were cross‐over trials: one trial had two arms (Shaw 1983), and the others had three arms (Christen 2007; Dôgan 2004; Kaschke 2005).
Of the NRS, nine studies were NRCTs (Altabet 2003; Bratel 1991; Gertenrich 1967a; Gertenrich 1967b; Gertenrich 1967c; Gertenrich 1967d; Lange 2000; Teitelbaum 2009; Williams 1988), three were ITS studies (Glassman 2006; Jarman 1983; Kissel 1983), and three were repeat measure (RM) studies (Abramson 1972; Bouter 1979; Snell 1989).
Date and duration
The 19 RCTs were reported between 1963 and 2016. One RCT included long‐term follow‐up (24 months) (Shaw 1991); eight included medium‐term follow‐up (greater than six weeks to less than 12 months) (Bickley 1990; Bildt 2010; Carr 1997; Ferozali 2007; Garcia‐Carrillo 2016; Kelner 1963; Mac Giolla Phadraig 2015; Phlypo 2016); and 10 had only short‐term follow‐up (six weeks or less) (Albino 1979; Christen 2007; Dôgan 2004; Gonzalez 2013; Kaschke 2005; Lange 1985; Olmos 2016; Sauvetre 1995; Shaw 1983; Swallow 1969).
The 15 NRS were reported between 1967 and 2009. Two NRS had long‐term follow‐up (16 to 19 months) (Bratel 1991; Snell 1989), 10 had medium‐term follow‐up (Altabet 2003; Bouter 1979; Gertenrich 1967a; Gertenrich 1967b; Gertenrich 1967c; Gertenrich 1967d; Glassman 2006; Jarman 1983; Kissel 1983; Williams 1988), and two had only short‐term follow‐up (Lange 2000; Teitelbaum 2009). The duration was unclear for one NRS (Abramson 1972).
Size
The number of participants in the studies was based on the number of participants recorded at baseline; some studies reported the intention‐to‐treat numbers.
The number of participants in the RCTs ranged from 18 to 329. Ten RCTs had fewer than 50 participants (Albino 1979; Bickley 1990; Bildt 2010; Christen 2007; Dôgan 2004; Ferozali 2007; Gonzalez 2013; Kaschke 2005; Lange 1985; Sauvetre 1995), five RCTs had between 50 and 100 participants (Carr 1997; Garcia‐Carrillo 2016; Phlypo 2016; Shaw 1983; Swallow 1969), and four RCTs had more than 100 participants (Kelner 1963; Mac Giolla Phadraig 2015; Olmos 2016; Shaw 1991). Most studies evaluated interventions aimed specifically at people with ID. Four of the RCTs included carers as participants: one assessed outcomes for the carers only (Gonzalez 2013), and three assessed outcomes for both people with ID and carers (Mac Giolla Phadraig 2015; Olmos 2016; Phlypo 2016). One did not report the number of carers involved (Olmos 2016).
The number of participants in the NRS ranged from three to 79. Four NRS had fewer than 20 participants (Abramson 1972; Bouter 1979; Kissel 1983; Snell 1989), eight NRS had between 20 and 50 participants (Bratel 1991; Gertenrich 1967a; Gertenrich 1967c; Gertenrich 1967d; Glassman 2006; Jarman 1983; Teitelbaum 2009; Williams 1988), and three NRS had more than 50 participants (Altabet 2003; Gertenrich 1967b; Lange 2000). Two NRS assessed outcomes for both people with ID and carers (Glassman 2006; Kissel 1983); one NRS involved carers in the study but only assessed outcomes for the people with ID (Lange 2000).
Location, language and setting
The studies were carried out in 10 different countries: Belgium (two RCTs: Phlypo 2016; Sauvetre 1995), Brazil (one NRS: Teitelbaum 2009), Germany (three RCTs: Christen 2007; Kaschke 2005; Olmos 2016), Ireland (one RCT: Mac Giolla Phadraig 2015), Spain (one RCT: Garcia‐Carrillo 2016), Sweden (one NRS: Bratel 1991), the Netherlands (one RCT: Bildt 2010; one NRS: Bouter 1979), Turkey (one RCT: Dôgan 2004), the UK (four RCTs: Bickley 1990; Shaw 1983; Shaw 1991; Swallow 1969), and the USA (six RCTs: Albino 1979; Carr 1997; Ferozali 2007; Gonzalez 2013; Lange 1985; Kelner 1963; 12 NRS: Abramson 1972; Altabet 2003; Gertenrich 1967a; Gertenrich 1967b; Gertenrich 1967c; Gertenrich 1967d; Glassman 2006; Jarman 1983; Kissel 1983; Lange 2000; Snell 1989; Williams 1988). Three studies were written in German (Christen 2007; Kaschke 2005; Olmos 2016), and one in Dutch (Bildt 2010).
The settings were residential (eight RCTs: Carr 1997; Ferozali 2007; Gonzalez 2013; Lange 1985; Mac Giolla Phadraig 2015; Olmos 2016; Phlypo 2016; Swallow 1969; 13 NRSs: Abramson 1972; Altabet 2003; Bouter 1979; Gertenrich 1967a; Gertenrich 1967b; Gertenrich 1967c; Gertenrich 1967d; Glassman 2006; Jarman 1983; Kissel 1983; Lange 2000; Teitelbaum 2009; Williams 1988); school (four RCTs: Albino 1979; Dôgan 2004; Garcia‐Carrillo 2016; Shaw 1983; one NRS: Snell 1989), day centre (three RCTs: Bickley 1990; Sauvetre 1995; Shaw 1991), or mixed (two RCTs: Christen 2007; Kelner 1963; one NRS (Bratel 1991). Two RCTs were unclear (Bildt 2010; Kaschke 2005).
Ethical approval and consent
Twenty‐one studies did not report having ethical approval; 11 RCTs (Bildt 2010; Christen 2007; Dôgan 2004; Ferozali 2007; Garcia‐Carrillo 2016; Gonzalez 2013; Kaschke 2005; Lange 1985; Mac Giolla Phadraig 2015; Phlypo 2016; Sauvetre 1995), and one NRS (Teitelbaum 2009) reported having received some form of ethical approval; the one quasi‐RCT was unclear on the issue (Lange 1985).
The participants or guardians gave consent in 14 RCTs (Bickley 1990; Carr 1997; Christen 2007; Dôgan 2004; Ferozali 2007; Garcia‐Carrillo 2016; Gonzalez 2013; Kelner 1963; Lange 1985; Mac Giolla Phadraig 2015; Phlypo 2016; Shaw 1983; Shaw 1991; Sauvetre 1995), and three of the NRS (Glassman 2006; Lange 2000; Teitelbaum 2009); four RCTs and 11 NRS did not report consent; one RCT (Bildt 2010) and one NRS (Kissel 1983) were unclear.
Characteristics of the participants
In relation to people with ID, the studies included 1795 participants at baseline. In some studies, the difference between intention‐to‐treat numbers and those actually included at baseline was not explained. A total of 92 participants were reported as lost to follow‐up; however, this number should be treated with caution as it is possible that those participants included at baseline were the more compliant participants and other potential participants were lost before baseline data could be collected. There were 17 studies that actively involved the carers of the people with ID in the delivery of the intervention, of these, seven focused on the carers as participants: six provided details of the number of carers (three RCTs: Gonzalez 2013; Mac Giolla Phadraig 2015; Phlypo 2016; three NRS: Glassman 2006; Kissel 1983; Lange 2000). A total of 354 carers provided baseline data; 92 were lost to follow‐up.
Twenty‐six studies had both males and females; one study had only males (Abramson 1972); seven studies did not report the sex of participants (Bickley 1990; Dôgan 2004; Kaschke 2005; Kelner 1963; Phlypo 2016; Sauvetre 1995; Shaw 1983).
Two RCTs (Dôgan 2004; Shaw 1983) and six NRS (Abramson 1972; Gertenrich 1967c; Gertenrich 1967d; Kissel 1983; Snell 1989; Teitelbaum 2009) involved only participants with ID who were less than 18 years old. Seven studies recruited both children and adults (Albino 1979; Gertenrich 1967a; Jarman 1983; Kelner 1963; Lange 1985; Swallow 1969; Williams 1988). Seventeen studies had participants who were aged 18 years or older, with an age range of 18 to 79 years. Bildt 2010 reported only mean age and three studies did not report the age profile (Bickley 1990; Gonzalez 2013; Phlypo 2016).
We converted study descriptions of the participants' level of ID to the ICD‐10 descriptors: mild, moderate, severe and profound.
| Interventions | Design | ICD‐10 category | Unclear |
| 1. Special toothbrush | RCT | Dôgan 2004: mild Bildt 2010: moderate to profound Ferozali 2007: profound | |
| NRS | Williams 1988: profound | — | |
| 2. Electric toothbrush | RCT | Dôgan 2004: mild Garcia‐Carrillo 2016: mild to moderate; and some participant IQs > 70 Shaw 1983: severe | |
| NRS | Gertenrich 1967d: mild (and some > IQ 70) Gertenrich 1967a: mild to severe (and some > IQ 70) Bratel 1991: moderate Gertenrich 1967b; Gertenrich 1967c: severe to profound | — | |
| 3. Training of carers | RCT | Mac Giolla Phadraig 2015: mild to profound Phlypo 2016: severe to profound | |
| NRS | Glassman 2006: mild to severe Lange 2000: moderate to profound Kissel 1983: severe to profound | — | |
| 4. Training of people with ID | RCT | Albino 1979: moderate to severe Lange 1985: mild to moderate | — |
| NRS | Bouter 1979: moderate Abramson 1972: severe Jarman 1983: severe Snell 1989: severe to profound | — | |
| 5. Scheduled dental recall intervals and supervised toothbrushing | RCT | — | |
| NRS | — | — | |
| 6. Clinical photographs | RCT | — | |
| NRS | — | — | |
| 7. Varying frequency of toothbrushing | RCT | — | |
| NRS | — | — | |
| 8. Plaque‐disclosing agent | RCT | — | — |
| NRS | Teitelbaum 2009: mild to moderate | — | |
| 9. Individualised care plan | RCT | — | — |
| NRS | Altabet 2003: mild to profound | — | |
| ICD‐10: International Statistical Classification of Diseases and Related Health Problems, 10th revision; ID: intellectual disability; IQ: intelligence quotient; NRS: non‐randomised study; RCT: randomised controlled trial. | |||
Two studies reported including some participants with an IQ above 70 (ranging as high as 87 (Garcia‐Carrillo 2016) and 94 (Gertenrich 1967a)). We undertook a sensitivity analysis to determine the effect on the effect size of the outcomes of excluding these studies. There was no relevant effect.
Fifteen studies reported that participants with ID had comorbidities: nine RCTs (Albino 1979; Bildt 2010; Carr 1997; Christen 2007; Ferozali 2007; Garcia‐Carrillo 2016; Kaschke 2005; Shaw 1983; Shaw 1991) and six NRS (Gertenrich 1967a; Gertenrich 1967b; Gertenrich 1967c; Glassman 2006; Jarman 1983; Snell 1989). The most frequent conditions reported were cerebral palsy (five studies), epilepsy (four studies), Down's syndrome (three studies), visual impairment (three studies) and hearing impairment (two studies). Other conditions included; anxiety disorder, asthma, autism, chronic bronchitis, depression, diabetes, emesis, enteral feeding, gastro‐oesophageal reflux disease, heart defect, hepatitis C, hiatal hernia, Hunter's syndrome, hydrocephaly, hypertension, hypothyroidism, muscular dystrophy, ocular tension, paranoid schizophrenia, phenylketonuria disorder, Prader‐Willi syndrome, speech difficulties, swallowing problems, Tay‐Sachs disorder, thyroid problems, Turner's syndrome, along with general terms to describe physical disabilities. One study reported that participants were excluded if they had any systemic disease (Teitelbaum 2009), and 18 studies did not report any comorbidities.
Characteristics of the interventions
More than one study evaluated each of the following comparisons.
-
Comparison 1: special manual toothbrushes versus conventional manual toothbrushes for people with ID.
-
Comparison 2: electric toothbrushes versus manual toothbrushes for people with ID.
-
Comparison 3: oral hygiene care training versus no oral hygiene care training or a placebo training session for carers of people with ID.
-
Comparison 4: oral hygiene training versus no oral hygiene training of people with ID.
One study evaluated each of the following comparisons.
-
Comparison 5: one‐, three‐ and six‐monthly dental recall intervals plus daily supervised brushing versus usual care for people with ID.
-
Comparison 6: discussion of individual clinical photographs as a toothbrushing motivator versus no discussion of photographs for people with ID.
-
Comparison 7: daily, twice‐weekly and once‐weekly frequencies of teeth brushing versus usual care for people with ID.
-
Comparison 8: use of a toothpaste with a plaque‐disclosing agent versus a conventional toothpaste for people with ID.
-
Comparison 9: individualised oral care plan versus usual care (according to guidelines) for people with ID.
Interventions involving electric and manual toothbrushes
Thirteen studies compared an electric toothbrush to a manual toothbrush, eight RCTs and five NRS (Bratel 1991; Gertenrich 1967a; Gertenrich 1967b; Gertenrich 1967c; Gertenrich 1967d). Four RCTs were cross‐over trials: one had two arms (Shaw 1983), and the others had three arms; the third arm being a special manual toothbrush (Christen 2007; Dôgan 2004; Kaschke 2005). The other four RCTs were Carr 1997; Garcia‐Carrillo 2016; Kelner 1963; and Swallow 1969.
Seven studies compared a special manual toothbrush with a conventional toothbrush. There were six RCTs: three, three‐armed cross‐over trials (Christen 2007; Dôgan 2004; Kaschke 2005), and three others (Bildt 2010; Ferozali 2007; Sauvetre 1995). One NRS compared a special manual toothbrush with a conventional toothbrush (Williams 1988).
The studies comparing electric toothbrushes to manual toothbrushes used a variety of electric toothbrushes: Oral B Braun (3D) (Bratel 1991; Dôgan 2004), Teledyne Waterpik Sonic Speed (Kaschke 2005), Panasonic Dentacare‐Sonodent (Christen 2007), Interplak (Carr 1997), Phillips Sonicare EasyClean (Garcia‐Carrillo 2016), Oral B Arcuate Action (Gertenrich 1967a; Gertenrich 1967b; Gertenrich 1967c), and Broxodent (Kelner 1963). Shaw 1983 did not identify the electric toothbrush used.
The studies comparing special manual toothbrushes also used a variety of toothbrushes: Collis Curve (Williams 1988), Superbrush (Bildt 2010; Christen 2007; Dôgan 2004; Kaschke 2005; Sauvetre 1995), and a single‐use suction toothbrush (Ferozali 2007).
Participants with ID brushed their own teeth in five of these studies (Dôgan 2004; Garcia‐Carrillo 2016; Gertenrich 1967d; Sauvetre 1995; Shaw 1983) and carers (or others) brushed the teeth of those with ID in seven studies (Bildt 2010; Ferozali 2007; Gertenrich 1967b; Gertenrich 1967c; Kelner 1963; Swallow 1969; Williams 1988). Five studies were mixed: they distinguished between "self‐brushers," "assisted brushers" and "carer brushed" (Bratel 1991; Carr 1997; Christen 2007; Gertenrich 1967a; Kaschke 2005); we combined these groups for meta‐analysis.
Interventions involving training of carers and people with intellectual disabilities
Four RCTs (Gonzalez 2013; Mac Giolla Phadraig 2015; Olmos 2016; Phlypo 2016) and three NRSs (Glassman 2006; Kissel 1983; Lange 2000) focused on the training of carers to improve the oral health of the people with ID for whom they cared. The descriptions of the training provided lacked detail; those that indicated the duration of the training delivered it in one session, which varied in length: 90 minutes (Gonzalez 2013), three hours (Glassman 2006), or one day (Mac Giolla Phadraig 2015). Some interventions provided training manuals for the carers (Mac Giolla Phadraig 2015; Phlypo 2016), while others provided continual feedback based on observation (Glassman 2006; Lange 2000), video recordings (Kissel 1983), or monitoring of daily plaque scores (Lange 2000). Some interventions included practical skills training as well as theory, which was either delivered as role play (Mac Giolla Phadraig 2015), demonstrated on one of the participants (Lange 2000), or individualised for each carer and person with ID (Kissel 1983). The timing of the evaluation of the intervention varied: immediately after the delivery of the training (Gonzalez 2013), four weeks (Olmos 2016), eight weeks (Phlypo 2016), 100 days (Kissel 1983), 156 days (Glassman 2006), and 11 months (Mac Giolla Phadraig 2015). The training was delivered by dental professionals except in Kissel 1983, where it was delivered by a psychologist.
Two RCTs (Albino 1979; Lange 1985) and four NRS (Abramson 1972; Bouter 1979; Jarman 1983; Snell 1989) focused on the training of people with ID to improve their oral health. The interventions focused on training people with ID in the practical skills of toothbrushing, with only one providing some theory in relation to the concepts of oral health (Albino 1979). The participants' levels of ID spanned the entire range: mild/moderate (Lange 1985), moderate (Bouter 1979), moderate/severe (Abramson 1972; Albino 1979), severe (Jarman 1983), and severe/profound (Snell 1989). Snell 1989 involved the participants in partial participation: the carers performed the toothbrushing and the participants were trained to assist where possible in the routine. In Jarman 1983, training in five other self‐care routines was included in the intervention.
The duration of the training for people with ID tended to be considerably longer than that for carers; the shortest period was two weeks (Lange 1985) and the longest 19 months (Snell 1989). However, this varied from participant to participant depending on their particular needs and some interventions included a maintenance phase, where the trainer prompted the participant to undertake the next step in the routine.
The description of the toothbrushing routine varied from "task completion" (Albino 1979; Jarman 1983), to broad stages (Lange 1985), to detailed step‐by‐step descriptions (Abramson 1972; Bouter 1979; Snell 1989). One study used disclosing tablets to indicate plaque as a teaching and monitoring aid (Lange 1985). All the interventions used praise as a motivator; three studies also included physical rewards or tokens (Abramson 1972; Albino 1979; Jarman 1983). Four studies led or delivered training by a psychologist (Abramson 1972; Albino 1979; Bouter 1979; Jarman 1983), one study by a dentist (Lange 1985), and one study by a teacher (Snell 1989).
Interventions assessed in one study only
One RCT evaluated dental recall intervals (one‐monthly, three‐monthly, six‐monthly) and daily supervised toothbrushing versus usual care (Shaw 1991), one RCT evaluated using an individual's clinical photographs to discuss oral hygiene performance versus not discussing them (Bickley 1990), and one RCT compared brushing daily by a dental professional to brushing twice weekly or once weekly (Swallow 1969). One NRS compared using a toothpaste with a plaque‐disclosing agent versus a conventional toothpaste (Teitelbaum 2009), and another NRS compared the use of an individualised oral care plan versus usual care (Altabet 2003).
Characteristics of outcomes
The clinical outcomes assessed for the participants in the RCTs were: plaque, oral hygiene status (subjective), gingival inflammation, gingival bleeding, calculus, oral assessment, total bacterial count and potential pathogenic bacteria count. The behavioural outcomes assessed for the participants or the carers (or both) were knowledge, behaviour, attitude and self‐efficacy.
The outcomes assessed for the participants in the NRS were: plaque, oral hygiene status, gingival inflammation, gingival bleeding, gingival pocketing, calculus, self‐efficacy (steps in a toothbrushing routine), duration of the toothbrushing episode, individually tailored expected toothbrushing performance and level of "self‐initiation." The outcomes assessed for the carers in the NRS were: need for verbal instruction and physical guidance, carer presence during toothbrushing by a person with ID and carer use of verbal instruction, physical guidance and rewards.
Timing of outcome measurement
Thirteen studies reported outcomes at more than one time point, which were, for the most part, within the same time frame: short term (Lange 1985; Lange 2000; Sauvetre 1995) or medium term (Carr 1997; Ferozali 2007; Garcia‐Carrillo 2016; Gertenrich 1967a; Gertenrich 1967b; Gertenrich 1967c; Gertenrich 1967d; Jarman 1983). We selected the longest time points for each study that were common among the studies for each of the time periods (short, medium or long term). Two studies reported findings across the time frames. Bratel 1991 reported findings in the short (one and four weeks), medium (12 weeks) and long term (16 months); we used the data from the four‐week, 12‐week and 16‐month time points for analysis. Shaw 1991 reported findings in the medium and long term (three, six, 12, 18 and 24 months); we used only data from the 24‐month time point for analysis as the participant numbers were not provided for any other time points.
Gingival health
Gingival inflammation
Twelve RCTs reported gingival inflammation, 11 of which used a validated gingival index. The indices used were Silness & Löe (Carr 1997; Garcia‐Carrillo 2016; Lange 1985; Phlypo 2016; Swallow 1969), Lobene (Mac Giolla Phadraig 2015), WHO Technical Report 621 Gingival Index (Shaw 1983), Saxer & Muhlemann Papillary Bleeding Index (Christen 2007; Kaschke 2005; Sauvetre 1995), and Ainamo & Bay (Bildt 2010). The other RCT used the subjective rating of "worse, same or better" (Kelner 1963).
Six NRS reported gingival inflammation; two studies used a validated gingival index: Silness & Löe (Bratel 1991) and the WHO Technical Report 621 Gingival Index (Shaw 1991). The four studies using a subjective rating of gingival inflammation used the terms "obvious gingivitis, decrease in gingivitis or absence of clinically observable gingivitis" (Gertenrich 1967a; Gertenrich 1967b; Gertenrich 1967c; Gertenrich 1967d).
Modifications to the gingival indices were made in several studies; the most common modification was in relation to the number of teeth and surfaces examined. Thirteen studies used six standard teeth on the following surfaces.
| Surfaces assessed on 6 standard teeth for gingival inflammation | Studies |
| 4 buccal and 2 lingual surfaces | Bildt 2010; Carr 1997; Mac Giolla Phadraig 2015; Phlypo 2016; Teitelbaum 2009 |
| The Bentley 1995 modification; 2 randomly selected (by coin toss) quadrants (1 in the upper jaw, 1 in the lower jaw, contralateral) | |
| 4 surfaces per tooth | |
| 3 surfaces per tooth; buccal, mesial and lingual | |
| 2 surfaces per tooth; on the buccal and lingual surfaces | |
| 2 surfaces per tooth; on the mesial and distal surfaces of each tooth | |
| The interdental papillae and the intervening gingiva on the buccal surfaces of all standing teeth | |
| Other modifications | Studies |
| No probe used and only teeth that were visible to the examiner | |
| If standard teeth were missing they were not substituted |
Only two studies (Shaw 1983; Shaw 1991) reported carrying out a periodontal pocket index assessment (WHO 1978) and only one of these, an NRS, reported the findings (Shaw 1991).
Plaque
Fourteen RCTs reported plaque as an outcome using a validated index. The indices used were Silness & Löe (Garcia‐Carrillo 2016; Phlypo 2016; Sauvetre 1995; Shaw 1983; Swallow 1969), Green & Vermillion (Bildt 2010; Carr 1997; Lange 1985), Quigley‐Hein (Christen 2007; Dôgan 2004; Kaschke 2005), Kobayashi & Ash (Albino 1979), the WHO Technical Report No 621 (Bickley 1990), Approximal Plaque Index (Christen 2007; Dôgan 2004; Kaschke 2005), and Shaw & Murray (Bickley 1990). One RCT used a subjective rating of oral hygiene describing the outcome using the terms "worse," "same" or "better" (Kelner 1963).
Six NRS reported plaque as an outcome using a validated index; the indices used were Silness & Löe (Bratel 1991), Green & Vermillion (Glassman 2006; Teitelbaum 2009; Williams 1988), Ramfjord (Lange 2000) and the WHO Technical Report No 621 (Shaw 1991). A further five NRS used a subjective rating describing the outcome using the following terms: "excellent," "good," "fair," "poor" or "very poor" (Altabet 2003); "good," "fair," "poor" or "very poor" (Gertenrich 1967a; Gertenrich 1967b; Gertenrich 1967c; Gertenrich 1967d).
Four studies used more than one measure of plaque. Modifications to the indices were made in several studies, most commonly in relation to the number of teeth and surfaces examined. Sixteen studies used six standard teeth on the following surfaces.
| Surfaces assessed on 6 standard teeth for plaque levels | Studies |
| 4 buccal and 2 lingual surfaces | Bickley 1990; Carr 1997; Glassman 2006; Mac Giolla Phadraig 2015; Phlypo 2016; Shaw 1983; Shaw 1991; Teitelbaum 2009; Williams 1988 |
| The Bentley 1995 modification; 2 randomly selected (by coin toss) quadrants (1 in the upper jaw, 1 in the lower jaw, contralateral) | |
| 4 surfaces per tooth | |
| 3 surfaces per tooth; buccal, mesial and lingual | |
| 2 surfaces per tooth; on the buccal and lingual surfaces | |
| 2 surfaces per tooth; on the mesial and distal surfaces of each tooth | |
| Other modifications | Studies |
| No probe used and only teeth that were visible to the examiner | |
| If standard teeth were missing they were not substituted |
Calculus
Four studies reported on calculus; three RCTs and one NRS. The indices used were: Green & Vermillion (Carr 1997; Garcia‐Carrillo 2016) and the WHO Technical Report 621 (Bickley 1990 (assessed but not reported); Shaw 1991). All three studies that reported their findings used the six standard teeth. Two studies assessed four buccal and two lingual surfaces and one study assessed four surfaces per tooth (buccal, lingual, mesial and distal).
Oral assessment
Ferozali 2007 used a tool to assess the health of four elements; lips, oral mucosa, gingivae and plaque, which was a modification of the Beck Total Oral Assessment Tool. This study also measured a total bacteria count and a potentially pathogenic bacteria count.
The following are the references for the clinical indices referred to in this section: Ainamo 1975; Beck 1993; Bentley 1995; Fleiss 1987; Greene 1960; Kobayashi 1964; Lange 1977; Lobene 1986; Löe 1967; Saxer 1975; Shaw 1977; WHO 1978.
Oral hygiene knowledge acquisition
Three RCTs assessed changes in oral healthcare knowledge of carers, all using multiple‐choice questionnaires, two of which were specifically designed by the investigators for the intervention (Gonzalez 2013; Mac Giolla Phadraig 2015), and the third (Phlypo 2016) used the questionnaire designed by Mac Giolla Phadraig 2015. Two studies had 10 questions on oral health‐related knowledge (Mac Giolla Phadraig 2015; Phlypo 2016), and one study had 20 basic oral hygiene questions (Gonzalez 2013).
The Mac Giolla Phadraig 2015 questionnaire was reported as having been tested for reliability, validity, responsiveness and reproducibility and found to be acceptable. Gonzalez 2013 used a different questionnaire pre‐ and postintervention, with the same content but different wording; the authors sought expert advice to assess the content.
Changes in behaviour, attitude and self‐efficacy
Two of the RCTs that assessed knowledge of carers also assessed changes in their behaviour, attitude, self‐efficacy or a combination of these at the same time: the studies had four questions on behaviour and five each on attitude and self‐efficacy (Mac Giolla Phadraig 2015; Phlypo 2016). One RCT assessed changes in self‐reported behaviour alone, using five questions (Olmos 2016). Four other NRS assessed behavioural changes in both carers and people with ID by monitoring of their behaviour using trained observers aided by specifically designed checklists (Bouter 1979; Glassman 2006; Jarman 1983; Kissel 1983). Reliability of the recorded observations was assessed by the study authors and was found to be acceptable in all four of these studies.
The methods used to assess changes in behaviour included: use of different methods of reinforcement by carers (Jarman 1983); assessing staff use of training methods when providing oral hygiene support (verbal instruction, physical guidance and reward) and participants' levels of self‐initiation and their need for verbal instruction and physical guidance (Kissel 1983); the effect of training on carers and levels of feedback and support to them (Abramson 1972); behavioural methods used by carers to assist people with ID (Bouter 1979); the type of toothbrush used, the type of toothpaste used, the frequency of fluoride application, the timing of toothbrushing and duration of toothbrushing (Olmos 2016); carers' presence during toothbrushing (Glassman 2006); and the number of training sessions required for the toothbrushing skill to be performed without prompting (Snell 1989).
Indirect measures of behaviour change included measuring wear and tear on toothbrushes and a diary kept by the parents/staff of the participants' brushing frequency (Bratel 1991). Bildt 2010 assessed ease of toothbrush use by carers and toothbrushing frequency, as well as degree of resistance to toothbrushing by people with ID.
Quality of life changes or long‐term, patient‐centred outcomes
No studies measured quality of life changes or long‐term, patient‐centred outcomes as formal outcomes.
Dental caries levels
No studies measured dental caries levels.
Any unintended (positive or negative) effects of the interventions
Positive effects
No studies reported any positive unintended effects.
Negative (adverse) effects
Twenty‐four studies did not report any unintended negative effects (or an intention to measure them from the beginning of the study). Ten studies investigated or reported negative unintended or adverse effects.
Subjective outcomes
Several subjective outcomes were reported narratively, in relation to possible benefits or harm, for example, interviews with people using an electric toothbrush to assess their experiences using it (Bratel 1991); feedback from carers on the toothbrushes used (Gertenrich 1967a; Gertenrich 1967b; Gertenrich 1967c; Gertenrich 1967d); carer questionnaire about experience of using a special three‐headed toothbrush (Bildt 2010); social validation of participants' abilities with regard to oral hygiene completed by their carers and carers' perception of training (Glassman 2006); a staff acceptability questionnaire (Kissel 1983); and questions on participants' skill retention (Snell 1989).
COM‐B system characteristics
Most studies did not define behavioural change theories in the interventions. Therefore, we assessed all of the studies using the COM‐B system to identify the BCTs inherent in the interventions (Michie 2011). We considered how the interventions affected Capability (physical strength, skill or stamina or psychological strength, knowledge, skill or stamina), Opportunity (physical opportunity afforded by the environment or the social opportunity afforded by social factors such as cultural norms or social cues) and Motivation (reflective brain process; evaluation and plans or automatic brain processes; desires, impulses, inhibitions, etc.).
The element we identified most often was capability: 29 studies had the potential to change the capability of either participants (11 studies) or carers (eight studies) or both (10 studies), either on a physical level (11 studies) or on a physical and psychological level (18 studies). These interventions included a focus on training, modelling or enablement of the participant or carer in the skill of toothbrushing.
In relation to the element of opportunity, physical opportunity was the more common potential element identified (26 studies). These interventions included elements such as specific time being set aside for the toothbrushing routine, environmental restructuring such as providing different oral hygiene or other aids or changing the setting where the toothbrushing took place. The potential for social opportunity (e.g. cultural norms or social cues) to impact on behaviour was identified in seven studies, which were predominantly targeted at carers and involved monitoring of their behaviour.
Nineteen studies had the potential for reflective motivation and these tended to include some element of feedback in relation to behaviour or performance which was seen predominantly in the interventions targeting carers. No studies had the potential for the behaviour change to become automatic.
We determined that 16/34 studies had all three elements of capability, opportunity and motivation inherent in the intervention.
The behavioural change elements and intervention functions are detailed in the Characteristics of included studies table.
Stakeholder involvement
The involvement of stakeholders may impact on the success of an intervention and so it was felt important to this review to capture the nature of the stakeholder involvement in the interventions. Twenty‐nine studies actively involved parents or carers of the participants in the intervention. Six studies involved both formal and non‐formal carers, 22 studies involved formal carers only and one study used non‐formal carers only. Three other studies were unclear if carers were involved. These studies were set in a school or day centre (Bickley 1990; Dôgan 2004; Sauvetre 1995). Two studies used a member of the research team to brush the participants' teeth (Swallow 1969; Williams 1988). Other stakeholders included administration staff, management staff, nursing or medical staff, speech and language therapists, an occupational therapist, a physical therapist and teachers. Eight studies reported no involvement of stakeholders, other than those directly involved in the research.
Twenty‐six studies had dental professionals on the research team, 21 studies involved dentists or dental students, 16 studies involved dental hygienists or therapists, four studies involved dental nurses or assistants and one study involved an oral health promotor. The dental professionals were mainly involved in the initial oral hygiene instruction and the clinical measurements throughout the intervention. Seven studies indicated that the dental professional provided ongoing support during the intervention (Albino 1979; Bickley 1990; Glassman 2006; Sauvetre 1995; Shaw 1991; Swallow 1969; Williams 1988); one other study indicated that this support was offered but not if the offer was taken up (Mac Giolla Phadraig 2015).
Funding
Nine studies reported receiving funding from their institution or health service (Abramson 1972; Bratel 1991; Gonzalez 2013; Jarman 1983; Olmos 2016; Kissel 1983; Mac Giolla Phadraig 2015; Shaw 1991; Teitelbaum 2009). Sixteen studies did not report on funding. Eight studies reporting receiving some funding from dental companies; all funding was stated as relating to the supply of either the toothbrushes or toothpaste required for the study (Albino 1979; Bickley 1990; Dôgan 2004; Garcia‐Carrillo 2016; Kelner 1963; Sauvetre 1995; Shaw 1991; Swallow 1969).
Excluded studies
Following full‐text reading, we rejected 158 reports for the following reasons: not an eligible study design (75 studies), not an oral hygiene intervention (39 studies), not mechanical removal of plaque (16 studies), a complex intervention in which the oral hygiene component could not be appraised separately (11 studies) and not relating to a person with ID or their carer (17 studies).
We excluded a further 20 reports after further consideration for the following reasons. We excluded two as only the title was available (Borglin 1969; Lopez 1994) and further five as only the abstract was available (Andrews 1990; Badra 1973; Ojeda 2010; Ribeiro 2011; Thornton 1991), and multiple efforts to contact the authors and source the full text were unsuccessful. A further three reports presented no data in the published reports or data were presented in a format that could not be used and attempts to contact the authors were unsuccessful (Brody 1975; Favell 1975; Meador 1979). The authors of three other reports with data in a format that could not be used were contacted but the data were no longer available (Gertenrich 1972; Lesmana 2014; Schmidt 1981). Two other reports were trial registers, one had been written up in a thesis but was unavailable and all attempts to contact the author were unsuccessful (ISRCTN10044161), and the authors of the second trial reported that the trial had not proceeded as yet, due to difficulties in recruiting participants (NCT03234231). One report was excluded as it was unclear if it met the inclusion criteria in relation to study design; all attempts to contact the authors were unsuccessful (Horner 1975). Three studies did not meet the required study design (Haran 2014; Kaschke 2008; Zaksek 2014). One of the authors of another study, with which might have had a subgroup of participants who may have been eligible for inclusion, confirmed that the study did not meet the study design criteria (Bui 2003) (see Characteristics of excluded studies table).
Two studies are awaiting classification (Akgun 2012; Birani 2008). We made contact with the authors as the theses for both are available, but, despite reminders, the information was not received before the deadline indicated for inclusion in this review.
Risk of bias in included studies
We assessed the RCTs and NRCTs for risk of bias using standardised risk of bias criteria (Higgins 2011a). We assessed the ITS and RM studies using the EPOC seven standard criteria (EPOC 2016) (Figure 1; Figure 2).
Of the 28 RCTs and NRCTs assessed, none were at overall low risk of bias. Eighteen were at overall high risk of bias (Albino 1979; Altabet 2003; Bickley 1990; Bratel 1991; Christen 2007; Dôgan 2004; Gertenrich 1967a; Gertenrich 1967b; Gertenrich 1967c; Gertenrich 1967d; Kaschke 2005; Kelner 1963; Lange 1985; Lange 2000; Mac Giolla Phadraig 2015; Phlypo 2016; Shaw 1983; Williams 1988); the remaining 10 were at unclear risk of bias overall.
All of the ITS and RM studies were at high risk of bias overall (Abramson 1972; Bouter 1979; Glassman 2006; Jarman 1983; Kissel 1983; Snell 1989).
Allocation
Of the 19 RCTs included in this review, 11 were at low risk of bias in relation to random sequence generation (Albino 1979; Bickley 1990; Bildt 2010; Christen 2007; Ferozali 2007; Garcia‐Carrillo 2016; Gonzalez 2013; Mac Giolla Phadraig 2015; Sauvetre 1995; Shaw 1983; Swallow 1969). These studies clearly indicated the method used for randomisation. A further 10 RCTs stated that the participants were randomised but gave no details of how this randomisation process was carried out. These studies were at unclear risk of bias. No RCTs were at high risk of bias. The allocation concealment rating for the RCTs was nine studies at low risk of bias and 10 studies were at unclear risk of bias.
The nine NRCTs were assessed using the RCT risk of bias criteria (Higgins 2011a). Six of these studies were at high risk of bias for random sequence generation as the participants were selected non‐randomly or the participants were selected for particular groups; the remaining three studies were at unclear risk of bias as there was no reference to randomisation. One NRCT was at low risk of bias (Lange 2000); two NRCTs were at high risk of bias for allocation concealment as participants were either assigned to groups based on the date they attended or based on their need for assistance (Altabet 2003; Bratel 1991). The remaining six NRCTs were at unclear risk of bias for allocation concealment as there were no details in the reports in relation to this element.
Blinding
Four RCTs were at high risk of bias in relation to blinding of participants or personnel (or both): all four were cross‐over trials (Christen 2007; Dôgan 2004; Kaschke 2005; Shaw 1983). We considered five RCTs to be at low risk as the control groups were asked to do something that was not usual care (Bildt 2010; Gonzalez 2013; Kelner 1963; Sauvetre 1995; Shaw 1991). The remaining 10 RCTs were at unclear risk of bias.
One NRCT was at high risk of bias in relation to blinding of participants or personnel (or both) (Williams 1988). Three NRCTs were at low risk of bias as some attempt was made to blind either the participants or personnel (Altabet 2003; Lange 2000; Teitelbaum 2009). The remaining five NRCTs were at unclear risk of bias for blinding of participants or personnel (or both) (Bratel 1991; Gertenrich 1967a; Gertenrich 1967b; Gertenrich 1967c; Gertenrich 1967d).
In relation to blinding of outcome assessors in the RCTs, 10 studies were at low risk of bias as the assessors were blinded to the group allocation (Bickley 1990; Bildt 2010; Christen 2007; Ferozali 2007; Garcia‐Carrillo 2016; Kaschke 2005; Kelner 1963; Sauvetre 1995; Shaw 1983; Swallow 1969); seven studies were at unclear risk of bias as there were insufficient details provided in the reports in relation to blinding (Carr 1997; Dôgan 2004; Gonzalez 2013; Mac Giolla Phadraig 2015; Olmos 2016; Phlypo 2016; Shaw 1991); two studies were at high risk of bias as the assessors were not blinded to the group allocation (Albino 1979; Lange 1985).
In the NRCTs, six studies were at low risk of bias as assessors were blinded to the group allocation; the remaining three studies were at unclear risk of bias as no mention of blinding of assessors was reported (Bratel 1991; Teitelbaum 2009; Williams 1988).
Incomplete outcome data
Four RCTs were at high risk of bias in relation to incomplete outcome data as either there were high attrition rates with no explanation as to the reasons for the dropouts (Mac Giolla Phadraig 2015; Phlypo 2016; Shaw 1983) or dropouts were due to lack of participation by the participants (Albino 1979). Three studies were at unclear risk of bias as either there was insufficient detail in relation to the reason or number of dropouts (Dôgan 2004), or the reasons provided may have impacted on the outcomes: participants lost or broke the electric toothbrush (Carr 1997), or the participants were unable to following the training (Sauvetre 1995). The remaining 12 studies were at low risk of bias for incomplete outcome data.
One NRCT was at unclear risk in relation to incomplete outcome data due to the lack of details provided (Gertenrich 1967b). The remaining eight NRCTs were at low risk of bias.
Selective reporting
Three RCTs were at high risk of bias in relation to selective reporting: one because the plaque index was modified during the intervention as it proved too difficult to complete (Albino 1979); two because all the outcomes outlined in the methodology were not reported (Bickley 1990; Kelner 1963). Fourteen studies were at unclear risk of bias as there was no protocol for the study but all listed outcomes were reported. Another study referred to mid‐term data but they were not reported (Shaw 1983), and one study had a protocol but it appeared to have been completed retrospectively (Garcia‐Carrillo 2016). No studies were at low risk of bias in relation to selective reporting.
All nine NRCTs were at unclear risk of bias for selective reporting as there was no protocol but all the expected outcomes reported in the methodology sections were reported as planned.
Other potential sources of bias
There were no other potential sources of bias.
Overall, there was a large element of 'unclear' risk of bias in many of the domains, reflecting the lack of detail provided in the published reports in relation to the methodology. This may be due to the large number of older studies included in this review. There were no studies at low risk of bias for the domain of selective reporting: many of the studies had no protocol and so were assessed at unclear risk of bias for this domain.
Risk of bias for interrupted time series and repeat measure studies
Three ITS studies (Glassman 2006; Jarman 1983; Kissel 1983) and three RM studies (Abramson 1972; Bouter 1979; Snell 1989) were assessed for risk of bias using the Effective Practice and Organisation of Care (EPOC) Group standards (EPOC 2016).
Was the intervention independent of other changes?
Of the six studies, two were independent of other changes (low risk) (Bouter 1979; Glassman 2006); three were unclear in relation to being independent of other changes as there was insufficient information (Abramson 1972; Kissel 1983; Snell 1989); and one was not independent (high risk), as the skill of toothbrushing was one of six other skills being taught at the same time (Jarman 1983).
Was the shape of the intervention effect prespecified?
All six ITS and RM studies had prespecified the shape of the intervention in relation to the methodology and expected outcomes (low risk).
Was the intervention unlikely to affect data collection?
The intervention in all six studies was unlikely to affect data collection (low risk).
Was knowledge of the allocated interventions adequately prevented during the study?
It was not possible to prevent knowledge of the allocated intervention in the six studies as the assessors in all cases were actively involved in the delivery of the intervention (high risk).
Were incomplete outcome data adequately addressed?
Incomplete data were explained in two studies and had no impact on the outcomes (Bouter 1979; Kissel 1983); there were no incomplete data in the other four studies (low risk).
Was the study free from selective outcome reporting?
Five studies were free from selective outcome reporting as all outcomes outlined in the methodology were reported (low risk). One study was unclear as it was difficult to extract the data from the figures provided (Glassman 2006).
Was the study free from other risks of bias?
No other risks of bias were identified.
Effects of interventions
See: Summary of findings for the main comparison Special manual toothbrush compared to conventional manual toothbrush for people with intellectual disabilities; Summary of findings 2 Electric toothbrush compared to manual toothbrush for people with intellectual disabilities; Summary of findings 3 Training of carers compared to no training of carers for people with intellectual disabilities; Summary of findings 4 Oral hygiene training compared to no oral hygiene training for people with intellectual disabilities; Summary of findings 5 Regularly scheduled dental visits and daily supervised toothbrushing compared to usual care for people with intellectual disabilities; Summary of findings 6 Discussion of clinical photographs as oral hygiene motivators compared to no discussion for people with intellectual disabilities; Summary of findings 7 Daily toothbrushing compared to twice‐weekly or once‐weekly toothbrushing for people with intellectual disabilities; Summary of findings 8 Toothpaste with a plaque‐disclosing agent compared to a conventional toothpaste for children with intellectual disabilities; Summary of findings 9 Individualised care plans compared to usual care for people with intellectual disabilities
Comparison 1: special manual toothbrushes versus conventional manual toothbrushes for people with intellectual disabilities
Six RCTs compared a special manual toothbrush with a conventional toothbrush (Bildt 2010; Christen 2007; Dôgan 2004; Ferozali 2007; Kaschke 2005; Sauvetre 1995). Five studies used the three‐headed Superbrush, while Ferozali 2007 used a single‐use suction toothbrush. One NRS evaluated a toothbrush with curved bristles (the Collis Curve) (Williams 1988). See summary of findings Table for the main comparison.
1.1 Gingival inflammation (short term)
Three RCTs, with 169 participants, compared using a special manual toothbrush with using a conventional manual toothbrush on gingival inflammation over two and three weeks (Christen 2007; Kaschke 2005; Sauvetre 1995; Table 1). Two studies were three‐armed cross‐over trials; the third arm compared an electric toothbrush (reported separately). The special brush used in all three studies was the Superbrush. The parallel‐group study showed no evidence of a difference between the two toothbrushes for people with ID in the short term (MD –0.10, 95% CI –0.77 to 0.57; Analysis 1.1; Sauvetre 1995). The two cross‐over RCTs also reported no difference between the toothbrushes. The level of participant ID was mixed or unclear. The certainty of the evidence was low.
| Duration | Study | Comparison | Index | Intervention mean (SD) | Control mean (SD) | Total | Country | Comments | Summary |
| 2 weeks | Superbrush vs Oral B manual TB | PBI (scale 0–4) | Mouth score 3.55 (0.40) Surface score 7.1 (0.8) | Mouth score 4.13 (0.35) Surface score 8.25 (0.7) | 54 | Germany | Cross‐over trial. Data presented for the 2 arms combined. Surface score mean and SD obtained from author. Mouth score calculated from this data. Median presented in published article. | Mean for the PBI for the Superbrush was below that of manual TB. However, no strong evidence of difference between the 2 TB. | |
| Superbrush vs Oral B manual TB | PBI (scale 0–4) | Pooled median 12.2 Self Br 10.5 Assist Br 11.5 Other Br 14.5 | Pooled median 12.6 Self Br 10.0 Assist Br 12.5 Other Br 15.5 | 72 | Germany | Cross‐over trial. Data presented for the 2 arms combined. Pooled median data calculated from reported data. | "Patients who brushed their teeth did not achieve significant changes in PBI levels with any of the three toothbrushes (Wilcoxon test: p > 0.05)," p. 63. | ||
| 21 days | Superbrush vs standard manual brush (Oral B) | S&MG (scale 0–3) | 1.21 (0.85) | 1.31 (0.87) | 25 | Belgium | Participant numbers not clearly reported, assumed to be 25. | "No significant difference was found when the results of bleeding indices were compared between the two toothbrushes," p. 117. |
Assist Br: assisted brusher; Other Br: other brusher; PBI: Papillary Bleeding Index; RCT: randomised controlled trial; SD: standard deviation; Self Br: self‐brusher; TB: toothbrush.
Kaschke 2005: three‐armed cross‐over trial; also compared the Teledyne Waterpik Sonic Speed electric TB, reported separately. Data for buccal and lingual surfaces, maxilla and mandible and Self Br, Assist Br and Other Br also reported. Christen 2007: three‐armed cross‐over trial; also compared the Dentacare‐Sonodont electric TB, reported separately. Median and percentile data only reported. Data presented for Self Br, Assist Br and Other Br; pooled data calculated from these data. Data for buccal and lingual surfaces, maxilla and mandible also reported.
1.2 Gingival inflammation (medium term)
One RCT, with 18 participants, compared the effect of carers using a special manual toothbrush (Superbrush) to brush the teeth of people with moderate‐to‐profound ID compared with a conventional manual toothbrush on gingival inflammation levels over four months (Bildt 2010; Table 2). It showed a large effect size in favour of the special manual toothbrush for adults with ID in the medium term (four months) when the toothbrushing was carried out by carers (MD –12.40, 95% CI –24.31 to –0.49; Analysis 1.2). The certainty of the evidence was very low.
| Duration | Study | Comparison | Index | Intervention mean (SD) | Control mean (SD) | Total | Country | Comments | Summary |
| 4 months | Superbrush vs Oral B manual TB | GBI (scale 0–1) | 18.3 (16.2) | 30.7 (9.5) | 18 | Germany | No calibration of assessors, participant's own dentist assessed clinical outcomes. The baseline scores were considerably lower for the intervention group (24.7 vs 32.7). | Author reported no strong evidence of a difference between the 2 toothbrushes for gingival inflammation. |
GBI: Gingival Bleeding Index Ainamo & Bay (0–1), 6 standard teeth, % of positive sites examined; SD: standard deviation.
1.3 Plaque (short term)
Four RCTs, with 189 participants aged between four and 79 years, compared using a special manual toothbrush with using a conventional manual toothbrush on plaque levels over periods of one, two and three weeks (Christen 2007; Dôgan 2004; Kaschke 2005; Sauvetre 1995). The special brush used in all four studies was the Superbrush. Three studies were three‐armed cross‐over trials; the third arm compared an electric toothbrush (reported separately) (Table 3).
| Duration | Study | Comparison | Index | Intervention mean (SD) | Control mean (SD) | Total | Country | Comments | Summary |
| 1 week | Superbrush vs Oral B Cross Action 35/40 manual TB | MQHPI (scale 0–5) | 1.77 (0.62) | 2.15 (0.58) | 15 | Turkey | Cross‐over trial. Data presented for the final time point only. | Strong evidence of a difference in PI between the Superbrush and Oral B Cross Action brush (P < 0.01) favouring the Superbrush. | |
| 2 weeks | Superbrush vs Oral B manual TB | MQHPI (scale 0–5) | Pooled median 27.7 | Pooled median 28.3 | 72 | Germany | Cross‐over trial. Data presented for the 2 arms combined. Median and percentile only reported. Pooled median data calculated from reported data. | No strong evidence of a difference in QH median plaque score across all participants between the 3 different toothbrushes in the final examination (Friedman test: P > 0.05), p. 55. | |
| Superbrush vs Oral B manual TB | MQHPI (scale 0–5) | Mouth score 2.98 (0.08) Surface score 35.8 (0.92) | Mouth score 3.24 (0.10)Surface score 38.9 (1.2) | 54 | Germany | Cross‐over trial. Data presented for the 2 arms combined. Surface score mean and SD obtained from author. Mouth score calculated from these data. Median presented in published article. Data for subgroups also presented. | Plaque score for the Superbrush lay below that of the conventional manual TB. The strength of the evidence was high. | ||
| 21 days | Superbrush (3‐headed) vs standard manual brush (Oral B) | S&LPI (scale 0–3) | 1.02 (0.85) | 0.82 (0.81) | 25 | Belgium | Participant numbers not clearly reported: assumed to be 25 | "No significant difference was found between the two toothbrushes in the means of day 0, 7 or 21," p. 117. |
Assist Br: assisted brusher; MQHPI: Modified Quigley‐Hein Plaque Index, scale of 0–5; Other Br: other brusher; PI: Plaque Index; QH: Quigley‐Hein; RCT: randomised controlled trial; S&LPI: Silness & Löe Plaque Index, scale 0–3; SD: standard deviation; Self Br: self‐brusher; TB: toothbrush.
Dôgan 2004: three‐armed cross‐over trial; also compared the Braun Plaque Control 3D electric TB, reported separately. Data for age groups, surfaces and approximal plaque also reported. Christen 2007: three‐armed cross‐over trial; also compared the Dentacare‐Sonodont electric TB, reported separately. Median and percentile data only reported. Data presented for Self Br, Assist Br and Other Br, pooled data were calculated from these data. Data for buccal and lingual surfaces, maxilla and mandible also reported. Kaschke 2005: three‐armed cross‐over trial; also compared the Teledyne Waterpik Sonic Speed electric TB, reported separately. Data for buccal and lingual surfaces, maxilla and mandible and Self Br, Assist Br and Other Br also reported. Some strong evidence of differences were reported in favour of the Superbrush in some of these subgroups.
One parallel‐group RCT measured plaque at 21 days and found no evidence that either toothbrush was better in the short term (MD 0.20, 95% CI –0.45 to 0.85; 25 participants; Analysis 1.3; Sauvetre 1995). The level of ID of the participants was unclear in this study. One cross‐over RCT, with participants who had mixed levels of ID, reached the same conclusion when measuring plaque at two weeks (Christen 2007). Some evidence favouring the special manual toothbrush was found in two RCTs: in Dôgan 2004, which measured plaque at one week in participants with mild ID, and in Kaschke 2005, a crossover study of participants with mixed levels of ID that measured plaque at two weeks. The certainty of the evidence was very low.
1.4 Plaque (medium term)
One RCT, with 18 participants with moderate to severe ID, compared the effect of formal carers using a special manual toothbrush (Superbrush) to brush the teeth of people with ID compared with a conventional manual toothbrush on plaque levels, over four months (Bildt 2010; Table 4). The baseline scores were not equal and the assessors were not calibrated introducing an element of indirectness in relation to certainty of the evidence. This study suggested there may be a greater reduction in plaque with the special manual toothbrush (Superbrush) for people with ID in the medium term, when the toothbrushing was carried out by formal carers; however, the result was also compatible with no difference between the interventions (MD –0.44, 95% CI –0.93 to 0.05; Analysis 1.4). The certainty of the evidence was very low.
| Duration | Study | Comparison | Index | Intervention mean (SD) | Control mean (SD) | Total | Country | Comments | Summary |
| 4 months | Superbrush vs Oral B manual TB | SG&VD (scale 0–3) | Mouth score 0.78 (0.7) Tooth score 4.7 (4.2) | Mouth score 1.22 (0.36) Tooth score 7.3 (2.2) | 18 | Germany | Whole mouth score calculated from tooth scores. No calibration of assessors, participant's own dentist assessed clinical outcomes. The baseline score was lower for the intervention group (8.3 vs 9.2) | Author reported no strong evidence of a difference between the 2 toothbrushes for plaque (F (2,15) = 1.20), P = 0.33). Thesis p. 5. |
RCT: randomised controlled trial; Indices: SG&VDI: Simplified Green & Vermillion Debris Index, scale 0–18, total of 0–3 for 6 standard teeth.
One NRS found no evidence of the superiority of either a special (Collis Curve toothbrush) or a conventional manual toothbrush (Williams 1988; Table 5). Participants in this study had profound ID and their teeth were brushed by a student dental assistant.
| Duration | Study | Comparison | Index | Intervention mean | Control | Total | Country | Comments | Summary |
| 3 months | Curved‐bristle manual toothbrush (Collis Curve) vs conventional manual toothbrush | SG&VOHI (scale 0–3) | 1.25 | 1.03 | 24 | USA | SD not reported. Contact with author – data no longer available. Brushing carried out by student dental assistants. | No strong evidence of a difference between the 2 toothbrushes for the oral hygiene index (t = –0.31, P < 0.76). |
NRS: non‐randomised study; SD: standard deviation; SG&VOHI: Simplified Green & Vermillion Oral Hygiene Index – plaque only.
1.5 Oral health assessment and bacteria levels (medium term)
One RCT, with 22 participants, compared using a special manual toothbrush (single‐use suction toothbrush with a therapeutic chemical agent) with using a conventional manual toothbrush (and the same therapeutic chemical agent) on general oral health and oral bacteria levels over 90 days (Ferozali 2007). All the participants had a profound level of ID and had their teeth brushed by a carer. None of the assessments provided evidence of one toothbrush being superior to the other (Analysis 1.5; Table 6). The certainty of the evidence was very low.
| Duration | Study | Comparison | Index | Intervention mean (SD) | Control mean (SD) | Total | Country | Comments | Summary |
| 90 days | Oral cleansing with single‐use suction brush vs a standard manual toothbrush | TOAS (scale 0–12) | 1.54 (1.0) | 1.99 (1.12) | 22 | USA | Both groups brushed with an additional chemical agent. A third group (not reported here) used a standard toothbrush and toothpaste. | "There was a significant main effect over time of assessment, F(2, 26)=5.89 (p < 0.01);" all groups showed improvement. Participants receiving oral hygiene with suctioning "had the greatest improvements" in oral assessment scores and greatest sustainability over time, p. 173. | |
| Oral cleansing with single‐use suction brush vs a standard manual toothbrush | TBC | 4.39 (0.63) | 4.07 (0.80) | 22 | USA | Both groups brushed with an additional chemical agent. A third group (not reported here) used a standard toothbrush and toothpaste. | No strong evidence of a difference between the 2 groups, but there was a large reduction in TBC in both groups, the suction toothbrush group reduced the TBC by almost 90%, the standard toothbrush group reduced the TBC by 81%. | ||
| Oral cleansing with single‐use suction brush vs a standard manual toothbrush | PPB (log base 10) | 0.41 (0.97) | 0.29 (0.92) | 22 | USA | Both groups brushed with an additional chemical agent. A third group (not reported here) used a standard toothbrush and toothpaste. | No significant changes in PPB between groups, all changes were reductions for pathogenic bacteria, p. 173. |
PPB: potentially pathogenic bacteria; RCT: randomised controlled trial; SD: standard deviation; TBC: Total Bacteria Count; TOAS: Total Oral Assessment Score.
1.6 Changes in behaviour, attitude and self‐efficacy
One RCT compared the effect of carers using a special manual toothbrush (Superbrush) to brush the teeth of people with moderate‐to‐profound ID compared with using a conventional manual toothbrush over four months (Bildt 2010; Table 7). The certainty of the evidence was very low. The analyses of the carer elements in this single trial found no significant difference between toothbrushes for the carer experience when handling the toothbrush and when brushing the teeth of people with ID in the medium term (handling the toothbrush: MD 0.50, 95% CI –0.35 to 1.35; brushing the teeth: MD 0.70, 95% CI –0.15 to 1.55). There was no evidence of a difference between the toothbrushes in terms of frequency of brushing by the carer (MD 0.20, 95% CI –2.13 to 2.53; Analysis 1.6). A meta‐analysis of the resistance of people with ID to toothbrushing found no evidence of a significant difference between the toothbrushes (MD –1.70, 95% CI –4.90 to 1.50; Analysis 1.7).
| Duration | Study | Comparison | Index | Intervention mean (SD) | Control mean (SD) | Total | Country | Comments | Summary |
| 4 months | Superbrush vs Oral B manual TB | Frequency of brushing by carer | 2.0 (0.7) | 2.2 (0.4) | 18 | Germany | Questionnaire not validated. | No strong evidence of a difference between TBs. | |
| Level of resistance by people with ID | 4.3 (3.2) | 6.0 (3.4) | 18 | Germany | Questionnaire not validated. | No strong evidence of a difference between TBs. | |||
| Experience of carer when brushing | 2.0 (1.0) | 1.3 (0.5) | 18 | Germany | Questionnaire not validated. | No strong evidence of a difference between toothbrushes "although the experiences appeared to be more positive" for the carers using the special manual TB, p. 16. | |||
| Handling of TB by carer | 2.3 (0.8) | 1.8 (1.0) | 18 | Germany | Questionnaire not validated. | No strong evidence of a difference between TB. |
ID: intellectual disability; RCT: randomised controlled trial; SD: standard deviation; TB: toothbrush.
1.7 Adverse effects
Bildt 2010, and Christen 2007 reported that the size of the three‐headed toothbrush caused problems when first used or for people with limited mouth opening. Ferozali 2007 considered the allergy potential of the chemical agents being used on the toothbrushes at the outset of the study and reported there were no allergic reactions. The other studies did not report any adverse effects.
Comparison 2: electric toothbrushes versus manual toothbrushes for people with intellectual disabilities
Eight RCTs (Carr 1997; Christen 2007; Dôgan 2004; Garcia‐Carrillo 2016; Kaschke 2005; Kelner 1963; Shaw 1983; Swallow 1969), and five NRSs (Bratel 1991; Gertenrich 1967a; Gertenrich 1967b; Gertenrich 1967c; Gertenrich 1967d) compared electric with manual toothbrushes. See summary of findings Table 2.
2.1 Gingival inflammation (short term)
Four RCTs, with 270 participants, compared using an electric toothbrush with using a manual toothbrush on gingival inflammation, over two, three or four weeks (Christen 2007; Kaschke 2005; Shaw 1983; Swallow 1969). The level of participant ID was mixed. Three studies were cross‐over trials, two included a third arm, which also compared a special manual toothbrush (reported earlier).
There was no strong evidence of a difference between the electric and manual toothbrushes for levels of gingival inflammation short term in any of the studies (Table 8). None of the studies presented data in a format that could be included in a meta‐analysis. The certainty of the evidence was low.
| Duration | Study | Comparison | Index | Intervention mean (SD) | Control mean (SD) | Total | Comments | Summary | |
| 2 weeks | Teledyne Waterpik Sonic Speed electric TB vs Oral B manual TB | PBI (scale 0–4) | Whole mouth 3.9 (0.35) Surface score 7.8 (0.7) | Whole mouth 4.3 (0.35) Surface score 8.25 (0.7) | 54 | Germany | Cross‐over trial. Data presented for the 2 arms combined. Surface score Mean and SD obtained from author. Data calculated from obtained data. Median data presented in published article. | Although there was a great reduction in inflammation for the intervention "No significance differences were found" for PBI between the 2 groups, p. 68. | |
| Dentacare‐Sonodont electric TB vs Oral B manual TB | PBI (scale 0–4) | Pooled median 12.3 Self Br 9.5 Assist Br 13.5 Other Br 14.0 | Pooled median 12.6 Self Br 10.0 Assist Br 12.5 Other Br 15.5 | 72 | Germany | Cross‐over trial. Data presented for the 2 arms combined. Pooled median data calculated from reported data. | No strong evidence of a difference in the PBI median at the final examination and at the initial examination (Friedman test: P > 0.05), p. 62. | ||
| 21 days | Daily brushing; Ronson electric TB vs Colgate‐Palmolive manual TB | B&LL&SGI (scale 0–3) | Pooled 1.24 Male: buccal 2.57, labial 2.08; female: buccal 0.14, labial 0.15 | Pooled 2.43 Male: buccal 2.07, labial 2.34; female: buccal 2.63, labial 2.65 | 20 | UK | Pooled mean calculated from reported data, no SD provided. | Both brushes seemed equally effective. "None of the other factors examined (except frequency) produced an F values approaching the 5% level of significance," p. 377. | |
| 4 weeks | Braun electric TB vs Oral B 30 manual TB | WHOGI (Scale 0 –3) | 1.7 (1.9) | 1.6 (1.7) | 106 | UK | Cross‐over trial. Data presented for the 2 arms combined. | No strong evidence of a difference in oral hygiene performance when comparing the use of electric and manual TBs. "There were no differences between the two groups. (t=0.0702, d.f. =/–52, p > 0.05)," p. 5. |
Assist Br: assisted brusher; B&LL&SGI: Buccal and Labial surfaces Löe & Silness: scale 0–3; Other Br: other brusher; PBI: Papillary Bleeding Index: scale 0–4; RCT: randomised controlled trial; SD: standard deviation; Self Br: self‐brusher; TB: toothbrush; WHOGI: World Health Organization Technical Report No 621 Gingival Index: scale 0–3.
Christen 2007: three‐armed cross‐over trial; also compared the Superbrush, reported separately. Median and percentile data only reported. Data presented for Self Br, Assist Br and Other Br; pooled data were calculated from these data. Data for buccal and lingual surfaces, maxilla and mandible, also reported. Kaschke 2005: 3‐armed cross‐over trial; also compared the Superbrush, reported separately. Data for buccal and lingual surfaces, maxilla and mandible and Self Br, Assist Br and Other Br also reported. Swallow 1969: means presented separately for labial and buccal surfaces for males and females with no SD; the pooled means were calculated from these data. Female data at 21 days appeared skewed. Study also compared brushing once a week and twice a week, reported separately.
2.2 Gingival inflammation (medium term)
Three RCTs, two of which were cluster RCTs, with 220 participants, compared using an electric toothbrush with using a manual toothbrush on gingival inflammation levels over periods of three, four, six and 12 months (Carr 1997; Garcia‐Carrillo 2016; Kelner 1963; Table 9).
| Duration | Study | Comparison | Index | Intervention mean (SD) | Control mean (SD) | Total | Country | Comments | Summary |
| 3 months | Interplak electric TB vs Oral B 40 manual TB | L&SGI (scale 0–3) | Pooled 1.80 (0.32) Self Br 1.81 (0.31) Assist Br 1.78 (0.33) | Pooled 1.84 (0.25) Self Br 1.81 (0.28) Assist Br 1.90 (0.21) | 56 | USA | Pooled mean and SD calculated from the reported data. Cluster RCT. | No strong evidence of a difference in gingival indices between toothbrushes at 3 months. | |
| Sonicare EasyClean, Philips electric TB vs Vitis Access, Dentaid manual TB | BDL&SGI (scale 0–3) | 1.31 (0.32) | 1.24 (0.32) | 64 | Spain | Description of ID in this study appeared to include some people with an IQ > 70. | No strong evidence of a difference in gingival indices between toothbrushes at 3 months. | ||
| 4 months | Automated electric TB (Broxodent) vs conventional TB | SGR | % Improvement 53% | % Improvement 31% | 100 | USA | % Improvement calculated from the reported data. | "The automatic electric toothbrush appeared significantly superior to the conventional toothbrush in improving gingival health," p. 108. | |
| 6 months | Interplak electric TB vs Oral B 40 manual TB | L&SGI (scale 0–3) | Pooled 1.90 (0.20) Self Br 1.92 (0.16) Assist Br 1.86 (0.23) | Pooled 1.90 (0.16) Self Br 1.88 (0.20) Assist Br 1.96 (0.12) | 56 | USA | Pooled mean and SD calculated from the reported data. Cluster RCT. | No strong evidence of a difference in gingival indices between toothbrushes at 6 months. | |
| Sonicare EasyClean, Philips electric TB vs Vitis Access, Dentaid manual TB | BDL&SGI (scale 0–3) | 1.24 (0.28) | 1.19 (0.28) | 64 | Spain | Description of ID in this study appeared to include some people with an IQ > 70. | No strong evidence of a difference in gingival indices between toothbrushes at 6 months (P = 0.37), p. 5. | ||
| 12 months | Interplak electric TB vs Oral B 40 manual TB | L&SGI (scale 0–3) | Pooled 1.25 (0.47) Self Br 1.72 (0.30) Assist Br 1.72 (0.42) | Pooled 1.73 (0.61) Self Br 1.87 (0.21) Assist Br 2.0 (0.0) | 56 | USA | Pooled mean and SD calculated from the reported data. Cluster RCT. | RM analysis of variance showed the Gingival Index at 12 months was significantly associated with the toothbrush used (P = 0.017) positive for the Interplak electric TB. |
Assist Br: assisted brusher; BDL&SGI: Bentley & Disney (four sites per tooth in two randomly (by coin toss) selected quadrants (one in the upper jaw, one in the lower jaw, contralateral); IQ: intelligence quotient; L&SGI: Löe & Silness Gingival Index, Scale 0–3; Other Br: other brusher; RCT: randomised controlled trial; RM: repeat measure; SD: standard deviation; Self Br: self‐brusher; SGR: Subjective Gingival Rating Scale, – worse, same, better; TB: toothbrush.
Kelner 1963: subjective data presented. Data also presented for frequency of brushing. Carr 1997: means and SDs presented separately for Self Br and Assist Br; the pooled means and SDs were calculated from these data for the different time points.
We combined the cluster RCTs in a meta‐analysis, which showed no evidence of a difference in gingival inflammation levels between toothbrushes at six months (MD 0.02, 95% CI –0.06 to 0.09; 120 participants (10 clusters); low heterogeneity; Chi² = 0.35, df = 1 (P = 0.56); I² = 0%; Analysis 2.1). The certainty of the evidence was moderate. An RCT not included in the meta‐analysis (Kelner 1963), which used a subjective assessment of gingival health and was at high risk of reporting bias, suggested a greater improvement for the electric toothbrush (53% versus 31% improvement in gingival health).
2.3 NRCT: gingival inflammation (short, medium and long term)
Five NRS, with 212 participants, compared using an electric toothbrush with using a manual toothbrush on gingival inflammation levels over four weeks to 16 months (Bratel 1991; Gertenrich 1967a; Gertenrich 1967b; Gertenrich 1967c; Gertenrich 1967d).
There was no evidence of a difference between brushes in one study evaluating gingival inflammation at four weeks (Table 10). When measured at time points between eight and 34 weeks, the studies varied but provided no strong evidence of a difference in levels of gingival inflammation between the electric and manual toothbrushes (Table 11). In the long term, one NRS with participants with moderate levels of ID showed no evidence of a difference for gingival inflammation at 16 months (MD 0.00, 95% CI –0.15 to 0.15; Analysis 2.3; Table 12). The certainty of the evidence was very low. The influence of other issues such as the level of ID, who was doing the brushing and the levels of assistance provided confounded the findings.
| Duration | Study | Comparison | Index | Intervention mean (SD) | Control mean (SD) | Total | Country | Comments | Summary |
| 4 weeks | Braun 3D Electric toothbrush vs Butler 411 manual toothbrush. | L&SGI (scale 0–3) | Pooled 1.55 (0.16) Unaided 1.5 (0.2), aided 1.6 (0.1) | Pooled 1.60(0.16) Unaided 1.6 (0.1), aided 1.6 (0.2) | 23 | Sweden | Pooled mean and SD calculated from the reported data. | No overall difference in Gingival Index between toothbrushes. |
L&SGI: Löe & Silness Gingival Index, Scale 0–3; NRS: non‐randomised study; SD: standard deviation.
Bratel 1991: mean and SD presented for aided and unaided brushing, pooled mean and SDs were calculated from these data.
| Duration | Study | Comparison | Index | Intervention mean (SD) | Control mean (SD) | Total | Country | Comments | Summary |
| 8 weeks | Oral B Automatic Toothbrush – Arcuate actions vs manual brush (Py‐co‐pay, Hard, Lactona Jr.) | SGR (scale 1–3) | Pooled 34% Group 1: 10%; Group 2: 58% | Pooled 43% Group 1: 50%; Group 2: 36% | 37 | USA | Data presented as mean level of "obvious gingivitis" by % in a graph, pooled % for the reported data were calculated. | General reduction in gingivitis in both groups and with both brushes. The greatest reduction was in Group 1 using the electric brush. | |
| Oral B Automatic Toothbrush – Arcuate actions vs manual brush (Py‐co‐pay, Hard, Lactona Jr.) | SGR (scale 1–3) | Pooled 83% Group 1: 74%; Group 2a: 85%; Group 2b: 100% | Pooled 54% Group 1: 50%; Group 2c: 50%; Group 2d:; 65% | 38 | USA | Data presented as mean level of "obvious gingivitis" by % in a graph, Pooled % for the reported data were calculated. | There was a general reduction in both groups and both brushes, with a tendency for greater reduction in those using a standard brush. | ||
| Oral B Automatic Toothbrush – Arcuate actions vs manual brush (Py‐co‐pay, Hard, Lactona Jr.) | SGR (scale 1–3) | 84% | 74% | 43 | USA | Data presented as mean level of "obvious gingivitis" by % in a graph. | A general reduction, with no difference between brushes. | ||
| 8/10 weeks | Oral B Automatic Toothbrush – Arcuate actions vs manual brush (Py‐co‐pay, Hard, Lactona Jr.) | SGR (scale 1–3) | Pooled 57.5% Group 1: 45%; Group 2: 70% | Pooled 77% Group 1: 54%; Group 2: 100% | 70 | USA | Data presented as mean level of "obvious gingivitis" by % in a graph, pooled % for the reported data were calculated. | General reduction in gingivitis with both brushes. A greater reduction in Group 1 (participants with Down's syndrome) for both brushes. | |
| 12 weeks | Braun 3D Electric toothbrush vs Butler 411 manual toothbrush | L&SGI (scale 0–3) | Pooled 1.65 (0.10) | Pooled 1.60 (0.16) | 23 | Sweden | Pooled mean and SD calculated from the reported data. | No strong evidence of a difference in Gingival Index between the 2 brushes. Group 1 (unaided) using the electric TB brush was the only subgroup with strong evidence of improvement from baseline at 12 weeks (P < 0.01), p. 25. | |
| 20 weeks | Oral B Automatic Toothbrush – Arcuate actions vs manual brush (Py‐co‐pay, Hard, Lactona Jr.) | SGR (scale 1–3) | Pooled 100% Group 1: 100%; Group 2a: 100%; Group 2b: 100% | Pooled 75% Group 1: 60%; Group 2a: 85%; Group 2b: 85% | 36 | USA | Data presented as mean level of "obvious gingivitis" by % in a graph, Pooled % for the reported data were calculated. | Levels of observable gingivitis regressed towards baseline levels, with slightly less regression in the those using the standard toothbrush. | |
| Oral B Automatic Toothbrush – Arcuate actions vs manual brush (Py‐co‐pay, Hard, Lactona Jr.) | SGR (scale 1‐3) | 100% | 100% | 42 | USA | Data presented as mean level of "obvious gingivitis" by % in a graph. | Regression to baseline levels of gingivitis in both groups, although a "decrease in severity" was noted. No difference between the brushes. | ||
| 21/28 weeks | Oral B Automatic Toothbrush – Arcuate actions vs manual brush (Py‐co‐pay, Hard, Lactona Jr.) | SGR (scale 1–3) | Pooled 53.5% Group 1: 37%; Group 2: 70% | Pooled 85% Group 1: 70%; Group 2: 100% | 72 | USA | Data presented as mean level of "obvious gingivitis" by % in a graph, Pooled % for the reported data were calculated. | The reduction in obvious gingivitis seen at 11 weeks was maintained for both Group 1 (Down's syndrome) and Group 2 (IQ < 20) using the electric TB at this time point. Both groups using the manual TB regressed to baseline levels. | |
| 34 weeks | Oral B Automatic Toothbrush – Arcuate actions vs manual brush (Py‐co‐pay, Hard, Lactona Jr.) | SGR (scale 1–3) | Pooled 42.5% Group 1: 40%; Group 2: 45% | Pooled 40% Group 1: 30%; Group 2: 50% | 36 | USA | Data presented as mean level of "obvious gingivitis" by % in a graph, Pooled % for the reported data were calculated. | Some reduction in gingivitis was maintained from baseline in both groups. No difference found between the 2 brushes. |
L&SGI: Löe & Silness Gingival Index, Scale 0–3; NRS: non‐randomised study; SD: standard deviation; SGR: Subjective Gingival Rating, measure of "periodontal involvement;" "obvious signs of gingivitis;" "decrease in severity" and "absence of clinical signs of gingivitis." "Obvious signs" and "decrease in severity" were combined on the graph. IQ: intelligence quotient; TB: toothbrush.
Group 1: unaided; Group 2: aided.
Gertenrich 1967b: data presented as % difference separately for two distinct ID groups (Group 1: Down's syndrome; Group 2: intelligence quotient (IQ): ≤ 20) the pooled % differences were calculated from these data. All teeth were brushed by attendants. Gertenrich 1967c: data presented as % difference separately for two distinct groups with ID (Group 1: hydrocephaly and seizure unit; Group 2: paediatric unit); the pooled % differences were calculated from these data. All teeth were brushed by attendants. Gertenrich 1967a: in Group 1 (people with cerebral palsy with IQ 30–95), all teeth were brushed by attendants. In Group 2 ("trainable patients" with IQ 30–50), teeth of half the participants were brushed by attendants (2a and 2c), the other half self‐brushed (2b and 2d). Gertenrich 1967d: all participants were self‐brushers with supervision and assistance from the attendants. Bratel 1991: mean and SD presented for unaided brushing (Group 1), aided brushing (Group 2), and pooled mean and SDs were calculated from these data. Wear and tear on toothbrushes was reported as having no difference, no data provided. Participants in the intervention group preferred the electric toothbrush, no data provided for the control group.
| Duration | Study | Comparison | Index | Intervention mean (SD) | Control mean (SD) | Total | Country | Comments | Summary |
| 16 months | Braun 3D Electric toothbrush vs Butler 411 manual toothbrush | L&SGI (scale 0–3) | Pooled 1.75 (0.16) | Pooled 1.70 (0.20) | 23 | Sweden | Data presented for aided and unaided with SD, overall pooled mean and SD calculated from the reported data. | No strong evidence of a difference in gingivitis between the brushes. The unaided electric TB subgroup showed greater improvement at 16 months (P < 0.05). The aided manual TB subgroup showed greater deterioration at 16 months (P < 0.01). |
Group 1: unaided; Group 2: aided; L&SGI: Löe & Silness Gingival Index, Scale 0–3; NRS: non‐randomised study; SD: standard deviation; TB: toothbrush.
Bratel 1991: mean and SD presented for unaided (Group 1) and aided (Group 2) brushing; pooled mean and SDs were calculated from these data.
2.4 Plaque (short term)
Four RCTs, with 270 participants, compared using an electric toothbrush with using a manual toothbrush, for people with ID, on plaque levels over one, two or four weeks (Christen 2007; Dôgan 2004; Kaschke 2005; Shaw 1983; Table 13). All of the studies were cross‐over trials, three included a third arm that compared a special manual toothbrush (reported above). None of the studies presented data in a format that could be included in a meta‐analysis. Two studies showed evidence in favour of the electric toothbrush short term; the other two studies showed no evidence of a difference between the two toothbrushes. The benefit of using an electric toothbrush versus a conventional manual toothbrush short term was unclear; the certainty of the evidence was very low.
| Duration | Study | Comparison | Index | Intervention mean (SD) | Control mean (SD) | Total | Country | Comments | Summary |
| 1 week | Braun Plaque Control 3D electric TB vs Oral B Cross Action 35/40 manual TB | MQHPI (scale 0–5) | 1.54 (0.71) | 2.15 (0.58) | 15 | Turkey | Cross‐over trial. Data presented for the 2 arms separately at the final examination. Participant number at baseline unclear: assumed to be the same as at final time point. | Strong evidence of a difference in the Plaque Index between the Braun 3D electric TB and Oral B Cross Action TB (P < 0.001) in favour of the electric TB. | |
| 2 weeks | Dentacare‐Sonodont electric TB vs Oral B manual TB | MQHPI (scale 0–5) | Pooled median 25.8 | Pooled median 28.3 | 72 | Germany | Cross‐over trial. Data presented for the 2 arms combined. Pooled median data calculated from reported data. | No strong evidence of a difference in the QH median across all participants between the 3 different toothbrushes in the final examination (Friedman test: P > 0.05), p. 55. | |
| Teledyne Waterpik Sonic Speed electric TB vs Oral B manual TB | MQHPI (scale 0–5) | Whole mouth 3.1 (0.09) Surface score 36.1(1.2) | Whole mouth 3.25 (0.10)Surface score 38.9 (1.9) | 54 | Germany | Cross‐over trial. Data presented for the 2 arms combined. Surface score Mean and SD obtained from author. Data calculated from tooth surface scores. Median presented in published article. | Strong evidence that the mean Plaque Index for the Teledyne Waterpik was lower than the Oral B manual toothbrush (P < 0.05), p. 68. | ||
| 4 weeks | Braun electric TB vs Oral B 30 manual TB | S&LPI (scale 0–3) | Total mouth 0.59 (0.26) Surface score 14.1 (6.2) | Total mouth 0.57 (0.2) Surface score 13.6 (4.7) | 106 | UK | Cross‐over trial. Data presented for the 2 arms combined. Data calculated from tooth surface scores. | No strong evidence of a difference in oral hygiene performance when comparing the use of electric and manual TBs. "There was no sig. diff between the groups (t=0.833, d.f.52, p > 0.05)," p. 5. |
Assist Br: assisted brusher; MQHPI: Modified Quigley‐Hein Plaque Index, scale 0–5; Other Br: other brusher; QH: Quigley‐Hein; RCT: randomised controlled trial; S&LPI: Silness & Löe Plaque Index, scale 0–3; SD: standard deviation; Self Br: self‐brusher; TB: toothbrush.
Dôgan 2004: three‐armed cross‐over trial; also compared the Superbrush, reported separately. Data presented were for the final examination, number of participants were adjusted accordingly. Data for age groups and surfaces also reported. Christen 2007: three‐armed cross‐over trial; also compared the Superbrush, reported separately. Median and percentile data only reported. Data presented for Self Br, Assist Br and Other Br, pooled data were calculated from these data. Data for buccal and lingual surfaces, maxilla and mandible also reported. Kaschke 2005: three‐armed cross‐over trial; also compared the Superbrush, reported separately. Data for buccal and lingual surfaces, maxilla and mandible and Self Br, Assist Br and Other Br also reported. Shaw 1983: two‐armed cross‐over trial. Data presented for tooth surfaces with SD, mean total mouth score and SD calculated.
2.5 Plaque (medium term)
Three RCTs (two of which were cluster RCTs), with 220 participants, compared using an electric toothbrush with using a manual toothbrush on plaque levels for people with ID, over three, four, six and 12 months (Carr 1997; Garcia‐Carrillo 2016; Kelner 1963; Table 14).
| Duration | Study | Comparison | Index | Intervention mean (SD) | Control mean (SD) | Total | Country | Comments | Summary |
| 3 months | Interplak electric TB vs Oral B 40 manual TB | SG&VDI (scale 0–3) | Pooled 1.31 (0.57) | Pooled 1.21 (0.68) | 56 | USA | Pooled mean and SD calculated from reported data. Cluster RCT. | No strong evidence of a difference in plaque levels between the tooth brushes at 3 months. | |
| Sonicare EasyClean, Philips electric TB vs Vitis Access, Dentaid manual TB | BDS&LPI (scale 0–3) | 1.02 (0.33) | 1.12 (0.33) | 64 | Spain | The description of ID in this study appeared to include some people with an IQ > 70. | No strong evidence of a difference in plaque levels between the toothbrushes at 3 months. | ||
| 4 months | Automated electric TB (Broxodent) vs conventional TB | SOHR | % improvement 27% | % improvement 18% | 100 | USA | % improvement calculated from the reported data. | "The automatic electric toothbrush appeared significantly superior to the conventional toothbrush in improving oral hygiene." | |
| 6 months | Interplak electric TB vs Oral B 40 manual TB | SG&VDI (scale 0–3) | Pooled 1.55 (0.67) | Pooled 1.34 (0.41) | 56 | USA | Pooled mean and SD calculated from reported data. Cluster RCT. | No strong evidence of a difference in plaque levels between the tooth brushes at 6 months. | |
| Sonicare EasyClean, Philips electric TB vs Vitis Access, Dentaid manual TB | BDS&LPI (scale 0–3) | 1.12 (0.35) | 1.04 (0.35) | 64 | Spain | The description of ID in this study appeared to include some people with an IQ > 70. | No strong evidence of a difference in plaque levels between toothbrushes at 6 months (P = 0.87), p. 4. | ||
| 12 months | Interplak electric TB vs Oral B 40 manual TB | SG&VDI (scale 0–3) | Pooled 1.35 (0.57) | Pooled 1.49 (0.51) | 56 | USA | Pooled mean and SD calculated from reported data. Cluster RCT. | No reported strong evidence of a difference in plaque levels between tooth brushes at 12 months. |
Assist Br: assisted brusher; BDS&LPI: Bentley & Disney Modified Silness & Löe Plaque Index, scale 0–3; ID: intellectual disability; IQ: intelligence quotient; RCT: randomised controlled trial; SD: standard deviation; Self Br: self‐brusher; SG&VDI: Simplified Green & Vermillion Debris Index, scale 0–3; SOHR: Subjective Oral Hygiene Rating, scale poor, fair, good; TB: toothbrush.
Kelner 1963: subjective data presented, % improvement has been calculated from the differences between the combined fair and good ratings pre and post. Data also presented by age groups (aged 4–14 years, 15–32 years). Carr 1997: means and SDs presented separately for Self Br and Assist Br, the pooled means and SDs were calculated from these data for the different time points. Some differences noted between Self Br and Assist Br. "There was a marginally significant difference in the pattern of debris index across time for the two brushing assistance status groups (p = 0.054)," p. 135. Garcia‐Carrillo 2016 reported the mean IQ as 60.6, ranging between 44 and 87.
Two cluster RCTs, with 120 participants, were included in a meta‐analysis and did not show clear evidence of a difference between electric and manual toothbrushes at six months for people with mild or moderate ID in one study and unclear levels of ID in the other (SMD 0.29, 95% CI –0.07 to 0.65; Analysis 2.2). The certainty of the evidence was low. The RCT not included in the meta‐analysis (Kelner 1963), which used a subjective assessment of oral hygiene and was at high risk of reporting bias, suggested a greater improvement in oral hygiene for the electric toothbrush (27% versus 18% improvement in oral hygiene).
2.6 NRCT: plaque (short, medium and long term)
Five NRS, with 193 participants, compared using an electric toothbrush with using a manual toothbrush, for people with ID, on plaque levels over four weeks to 16 months (Bratel 1991; Gertenrich 1967a; Gertenrich 1967b; Gertenrich 1967c; Gertenrich 1967d; Table 15; Table 16; Table 17).
| Duration | Study | Comparison | Index | Intervention mean (SD) | Control mean (SD) | Total | Country | Comments | Summary |
| 4 weeks | Braun 3D Electric toothbrush vs Butler 411 manual toothbrush | S&LPI (scale 0–3) | Pooled 1.5 (0.3) Unaided 0.8 (0.3); aided 1.3 (0.5) | Pooled 1.5 (0.35) Unaided 1.1 (0.4); aided 1.0 (0.3) | 23 | Sweden | Pooled mean and SD calculated from the reported data. | No overall difference in Plaque Index between toothbrushes. |
NRS: non‐randomised study; S&LPI: Silness & Löe Plaque Index, Scale 0–3; SD: standard deviation.
Bratel 1991: mean and SD presented for aided and unaided brushing, pooled mean and SDs were calculated from these data.
| Duration | Study | Comparison | Index | Intervention mean (SD) | Control mean (SD) | Total | Country | Comments | Summary |
| 0–8/10 weeks | Oral B Automatic Toothbrush – Arcuate actions vs manual brush (Py‐co‐pay, Hard, Lactona Jr.) | SOHR (scale 1–4) | Pooled MD 0.75 (0.64) | Pooled MD 0.59 (0.91) | 55 | USA | Pooled mean difference and SD calculated from the reported data. | The results showed that both groups reduced plaque levels during the supervised brushing period, with the electric TB being "somewhat better." | |
| 0–8 weeks | Oral B Automatic Toothbrush – Arcuate actions vs manual brush (Py‐co‐pay, Hard, Lactona Jr.) | SOHR (scale 1–4) | Pooled MD 1.26 (0.50) | Pooled MD 1.45 (0.73) | 37 | USA | Pooled MD and SD calculated from the reported data. | An improvement in oral hygiene in both ID groups and with both brushes (P 0.05–0.001). No strong evidence of a difference in oral hygiene between the 2 brushes. | |
| 0–8 weeks | Oral B Automatic Toothbrush – Arcuate actions vs manual brush (Py‐co‐pay, Hard, Lactona Jr.) | SOHR (scale 1–4) | Group 1 MD 2.21 (0.60) | Group 1 MD 1.72 (0.55) | Group 1: 15 | USA | MD and SD reported for Group 1. Mean square difference was reported for Group 2. Type of brush – mean Sq (F) 2.67 (10.35). Author reports raw data no longer available. | A reduction in plaque levels in both ID groups and with both brushes (P 0.05–0.001). No strong evidence of a difference between the 2 brushes. | |
| 0–8 weeks | Oral B Automatic Toothbrush – Arcuate actions vs manual brush (Py‐co‐pay, Hard, Lactona Jr.) | SOHR (scale 1–4) | MD 1.36 (0.88) | MD 1.33 (0.58) | 43 | USA | MD presented in this study. | There was an improvement in oral health with both brushes (P = 0.001) but no strong evidence of a difference in oral hygiene between the 2 brushes. | |
| 12 weeks | Braun 3D Electric toothbrush vs Butler 411 manual toothbrush. | S&LPI (scale 0–3) | Pooled 1.10 (0.14) | Pooled 1.11 (0.30) | 23 | Sweden | Pooled mean and SD calculated from the reported data. | Some strong evidence of a difference in subgroups (manual aided (P < 0.01) and electric unaided (P < 0.05); however, no strong overall difference in Plaque Index between toothbrushes. | |
| 8–20 weeks | Oral B Automatic Toothbrush – Arcuate actions vs manual brush (Py‐co‐pay, Hard, Lactona Jr.) | SOHR (scale 1–4) | Group 1: –0.71 (0.59) | Group 1: –0.79 (0.65) | 14 | USA | MD and SD reported for Group 1. Mean square difference was reported for Group 2. Type of brush – mean Sq (F) 1.05 (1.54), "not a significant change". Author reported raw data no longer available. | No strong evidence of a difference in oral hygiene between the 2 toothbrushes at this time point. "There was a significant regression in oral hygiene in both groups" at this time point. p. 158. | |
| 8–20 weeks | Oral B Automatic Toothbrush – Arcuate actions vs manual brush (Py‐co‐pay, Hard, Lactona Jr.) | SOHR (scale 1–4) | –0.57 (0.54) | –0.88 (0.65) | 42 | USA | MD presented in this study. | A slight regression in the improvements made in oral hygiene with both the electric and manual toothbrushes (P = 0.001), no strong evidence of a difference in oral hygiene between the 2 brushes. | |
| 10–28 weeks | Oral B Automatic Toothbrush – Arcuate actions vs manual brush (Py‐co‐pay, Hard, Lactona Jr.) | SOHR (scale 1–4) | Group 1: 0.24 (0.55) | Group 1: 0.03 (1.37) | 52 | USA | MD presented in this study for Group 1 only. Group 2 control joined Group 2 intervention after week 8. | No strong evidence of a difference in oral hygiene between the 2 brushes at this time point. | |
| 20–34 weeks | Oral B Automatic Toothbrush – Arcuate actions vs manual brush (Py‐co‐pay, Hard, Lactona Jr.) | SOHR (scale 1–4) | Pooled 0.36 (0.49) | Pooled 0.69 (0.47) | 36 | USA | Pooled MD and SD calculated from the reported data. | Strong evidence of an improvement in oral hygiene in Group 2 in both the electric and manual toothbrushes (P = 0.05). No strong evidence of an improvement in either brush in Group 1. |
MD: mean difference; NRS: non‐randomised study; S&LPI: Silness & Löe Plaque Index, scale 0–3; SD: standard deviation; SOHR: Subjective Oral Hygiene Rating (good, fair, poor and very poor), scale 1–4.
Gertenrich 1967b: means and SDs presented separately for two distinct groups with ID (Group 1: Down's syndrome; Group 2: intelligence quotient (IQ); ≤ 20), the pooled mean and SD were calculated from these data. All participants' teeth were brushed by attendants. "Although the results obtained using the automatic units in a controlled regime were more stable and generally some what better (Figure 1) compared to the results with the hand brushing on a controlled regime, it is clear that these added benefits can vanish soon after the controlled regime is discontinued," p. 148. Gertenrich 1967c: means and SDs presented separately for two distinct ID groups (Group 1: hydrocephaly and seizure unit; Group 2: paediatric unit) the pooled mean and SD were calculated from these data. All participants' teeth were brushed by attendants. Gertenrich 1967a: two distinct groups with ID (Group 1: participants with cerebral palsy with IQ 30–95; Group 2 "trainable patients" with IQ 30–50). In Group 1, all were brushed by attendants. In Group 2, half the participants were brushed by attendants the other half self‐brushed. In Group 2, "The most significant improvement occurred in the group that was brushed by attendants using the automated toothbrush," p. 157. Gertenrich 1967d: all participants were self‐brushers with supervision and assistance from the attendants. Bratel 1991: mean and SD presented for aided and unaided brushing, pooled mean and SDs were calculated from these data.
| Duration | Study | Comparison | Index | Intervention mean/SD | Control mean/SD | Total | Country | Comments | Summary |
| 16 months | Braun 3D Electric toothbrush vs Butler 411 manual toothbrush | S&LPI (scale 0–3) | Pooled 1.30 (0.35) | Pooled 1.40 (0.30) | 23 | Sweden | Pooled mean and SD calculated from the reported data. | "No significant changes concerning plaque index were found in or between groups after 16 months," p. 6. |
NRS: non‐randomised study; S&LPI: Silness & Löe Plaque Index, scale 0–3; SD: standard deviation.
Bratel 1991: mean and SD presented for aided and unaided brushing; pooled mean and SDs were calculated from these data.
The data provided at the longest time points by the five studies (ranging between eight and 34 weeks) were included in a meta‐analysis. There was no evidence of a difference between the electric and manual toothbrushes in the medium term (SMD 0.04, 95% CI –0.38 to 0.46; Analysis 2.4; moderate heterogeneity; Tau² = 0.10; Chi² = 6.97, df = 4 (P = 0.14); I² = 43%). The certainty of the evidence was very low.
2.7 Calculus (medium term)
Three RCTs, two of which were cluster RCTs, with 220 participants, compared using an electric toothbrush with using a manual toothbrush, for people with ID, on calculus levels over a periods of four, six and 12 months (Carr 1997; Garcia‐Carrillo 2016; Kelner 1963; Table 18).
| Duration | Study | Comparison | Index | Intervention Mean (SD) | Control Mean (SD) | Total No. | Country | Comments | Summary |
| 4 months | Automated electric TB (Broxodent) vs conventional TB | SCR | % Improvement 13% | % Improvement 10% | 100 | USA | % Improvement calculated from the reported data. | "The automatic electric toothbrush appeared significantly superior to the conventional toothbrush in improving deposits," p. 108. | |
| 6 months | Sonicare EasyClean, Philips electric TB vs Vitis Access, Dentaid manual TB | BDCI (scale 0–1) | 0.18 (0.12) | 0.16 (0.12) | 64 | Spain | The description of ID in this study appeared to include some people with an IQ > 70. | No strong evidence of a difference in the effect of toothbrush group on the Calculus iIndex (P = 0.40). | |
| 6 months | Interplak electric TB vs Oral B 40 manual TB. | SG&VCI (scale 0–3) | Pooled 0.78 (0.39) | Pooled 0.90 (0.47) | 56 | USA | Pooled mean and SD calculated from the reported data. Cluster RCT | No evidence of a difference between groups for the Calculus Index. | |
| 12 months | Interplak electric TB vs Oral B 40 manual TB. | SG&VCI (scale 0–3) | Pooled 0.76 (0.50) | Pooled 0.93 (0.40) | 56 | USA | Pooled mean and SD calculated from the reported data. Cluster RCT. | No evidence of a difference between groups could be found for the Calculus Index. |
Assist Br: assisted brusher; BDCI: Bentley & Disney Calculus Index, present or absent; ID: intellectual disability; IQ: intelligence quotient; RCT: randomised controlled trial; SD: standard deviation; SCR: Subjective Calculus Rating – none, moderate, extreme; Self Br: self‐brusher; SG&VCI: Simplified Green & Vermillion Calculus Index, scale 0–3.
Kelner 1963: subjective data presented; the term 'deposits' was described as "the presence and amount of stain, soft and hard deposits," p. 102. % improvement calculated from the differences between the combined 'extreme' ratings pre and post. Data also presented by age groups (aged 4–14 years, 15–32 years). Carr 1997: means and SDs presented separately for Self Br and Assist Br; the pooled means and SDs were calculated from these data for the different time points.
Two cluster RCTs, with 120 participants (10 clusters), were included in a meta‐analysis and showed no evidence of a difference for calculus levels between toothbrushes at six months (SMD –0.04, 95% CI –0.40 to 0.32; Analysis 2.5; low‐to‐moderate heterogeneity; Chi² = 1.44, df = 1 (P = 0.23); I² = 30%). The other RCT found in favour of the electric toothbrush. The certainty of the evidence was low.
2.8 Changes in behaviour, attitude and self‐efficacy
One NRS assessed participant and carer experiences via a questionnaire, and found no evidence of a difference between toothbrushes for ease of use (question: "Do you find it difficult to brush your patient's teeth?") (Bratel 1991). The study reported that 10/12 people with ID using the electric toothbrush reported a preference for it, finding the electric toothbrush easier to use and to have "better cleaning properties to the manual toothbrush" (Table 19). Answers to the other questions were reported narratively and only for participants in the intervention group.
| Duration | Study | Comparison | Index | Intervention (yes/no) | Control (yes/no) | Number of participants | Country | Comments | Summary |
| 16 months | Braun 3D Electric toothbrush vs Butler 411 manual toothbrush | SE (yes/no) | Pooled 4/8 | Pooled 3/7 | 23 | Sweden | Data calculated for pooled aided and unaided participants for each group. | No evidence of a difference between the groups. |
SE: self‐efficacy: "Do you find it difficult to brush your patient's teeth?"
2.9 Adverse effects
The adverse effects reported included discomfort when brushing, difficulty controlling the force and position of the electric toothbrush, and the electric toothbrush being out of order (Bratel 1991), and participants being frightened when the electric toothbrush was first used (Christen 2007; Gertenrich 1967b; Kaschke 2005). Carr 1997 reported participants being dismissed from the study, but gave no clear reason. Garcia‐Carrillo 2016 looked for adverse effects by regular visual inspection and there were none. The other studies did not report adverse effects.
Comparison 3: oral hygiene care training versus no oral hygiene care training or a placebo training session for carers of people with intellectual disabilities
Four RCTs and three NRSs evaluated oral hygiene care training for carers of people with ID. See summary of findings Table 3.
3.1 Gingival inflammation (medium term)
Two RCTs, with 99 participants, compared the effect of oral hygiene care training of formal carers with no training of formal carers, on the levels of gingival inflammation of the people with ID for whom they cared (people with mild‐to‐profound levels of ID in one study and severe‐to‐profound levels in the other study), over periods of eight weeks (Phlypo 2016) and six to nine months (Mac Giolla Phadraig 2015) (Table 20). Meta‐analysis of these two studies showed no evidence of a difference in the medium term (MD –0.09, 95% CI –0.63 to 0.45; Analysis 3.1; high heterogeneity; Chi² = 3.16, df = 1 (P = 0.08); I² = 68%). The certainty of the evidence was low.
| Duration | Study | Comparison | Index | Intervention mean (SD) | Control mean (SD) | Total | Country | Comments | Summary |
| 8 weeks | Carers provided with an Information booklet and information session with practical skills. | MGI (scale 0–3) | 1.2 (0.36) | 1.5 (0.24) | 36 | Belgium | MD data were reported; intervention 0.1 (SD 0.61); control 0.003 (SD 0.32) | No strong evidence of a difference was found in Gingival Index between the intervention and control group pre‐ and post‐test. (P = 0.14), However, when the individual post‐test data were considered, there was strong evidence of a difference (P = 0.02) in Gingival Index between the intervention and control group, p. 15. | |
| 6–9 months | Staff received training via a pyramidal training programme vs no training. | LMGI (scale 0–4) | 2.47 (1.21) | 2.20 (1.18) | 63 | Ireland | — | "The difference in mean MGI and PI between groups was not statistically significant (p > 0.05, ANCOVA)," p. 95. "In this instance distal outcomes such as residents oral health and hygiene did not improve in the presence of proximal improvements in oral health‐related knowledge, attitudes and self‐efficacy, and reported behaviours of carers," p. 96. |
ANCOVA: analysis of covariance; LMGI: Lobene Modified Gingival Index (non‐invasive); MD: mean difference; MGI: Modified Silness & Löe on buccal and lingual surfaces of 6 standard teeth; PI: Plaque Index; RCT: randomised controlled trial; SD: standard deviation.
3.2 Plaque (medium term)
Two RCTs, with 99 participants, living in residential settings, compared the effect of oral hygiene care training of formal carers with no training of formal carers, on the plaque levels of the people with ID for whom they cared (people with mild‐to‐profound levels of ID in one study and severe‐to‐profound levels in the other study), over periods of eight weeks (Phlypo 2016) and six to nine months (Mac Giolla Phadraig 2015) (Table 21). Meta‐analysis of these two studies showed little or no difference between the groups in the medium term (MD –0.07, 95% CI –0.26 to 0.13; Analysis 3.2). The certainty of the evidence was low.
| Duration | Study | Comparison | Index | Intervention mean (SD) | Control mean (SD) | Total | Country | Comments | Summary |
| 8 weeks | Carers provided with an Information booklet and information session with practical skills | MPI (scale 0–3) | 1.4 (0.38) | 1.5 (0.24) | 36 | Belgium | MD also reported (P = 0.50) | No strong evidence of a difference in MPI (P = 0.35), p. 15. | |
| 6–9 months | Staff received training via a pyramidal training programme on oral health and oral hygiene vs no training | MPI (scale 0–3) | 1.89 (1.05) | 1.78 (0.97) | 63 | Ireland | Brushing was carried out equally by the people with ID and the staff. | "The difference in mean MGI and PI between groups was not statistically significant (p > 0.05, ANCOVA)," p. 95. |
ANCOVA: analysis of covariance; ID: intellectual disability; MD: mean difference; MPI: Modified Silness & Löe Plaque Index (6 standard teeth, no probe used, surfaces visible to the researcher); RCT: randomised controlled trial; SD: standard deviation.
3.3 NRCT: plaque (short and medium term)
One NRCT, with 34 participants, living in a residential setting, compared the effect of oral hygiene care training of formal carers with no training of formal carers, on the plaque levels of the people with moderate‐to‐profound ID for whom they cared, over 21 days (Lange 2000; Table 22). Training carers resulted in reduced plaque levels in people with ID when compared to carers who were not trained (MD –0.69, 95% CI –0.97 to –0.41; Analysis 3.3). The NRCT reported that carers who had training with accountability showed strong evidence of lower plaque levels than the group of carers without accountability (MD –1.89, 95% CI –2.12 to –1.66). The certainty of the evidence was low.
| Duration | Study | Comparison | Index | Intervention mean (SD) | Control mean (SD) | Total | Country | Comments | Summary |
| 21 days | Training of carers with and without accountability (Group 1 + Group 2) vs no training (Group 3) | MRPDI (scale 0–3) | Pooled data 1.09 (0.26) | 1.78 (0.45) | 34 | USA | Pooled mean and SD calculated from reported data for Group 1 and Group 2. | The Plaque Index for Group 1 (with accountability) was lower than that of Group 2 (without accountability) (P = 0.004) and the control group (P = 0.0001). | |
| Training of carers with accountability (Group 1) vs training without (Group 2) accountability | MRPDI (scale 0–3) | 0.23 (0.02) | 2.12 (0.37) | 24 | USA | SD calculated from reported data for Group 1 and Group 2. | "Fisher's LSD indicted significantly lower plaque indexes for experimental Group I vs Group 2 (p=.00001)," p. 208. |
LSD: Least Significant Difference; MRPDI: Modified Ramfjord Periodontal Disease index – plaque only; SD: standard deviation.
Lange 2000: mean and standard error presented separately for "with accountability" (Group 1) and "without accountability" (Group 2) of trainers, and for control (Group 3); SDs calculated from these data, mean and SD pooled for Group 1 and Group 2 in Comparison 1 and compared in Comparison 2.
One ITS study with 11 participants compared the effect of oral hygiene care training of formal carers with no training of formal carers, on plaque levels of the people with ID for whom they cared, over five months (Glassman 2006). Training of carers in oral hygiene care for people with ID may have had a positive impact on the plaque levels of the people with ID for whom they cared in the medium term (five months) if the carers were supported and encouraged to apply the training in practice subsequently (Table 23). Meta‐analysis was not possible for this study due to the format of the data presented. The certainty of the evidence was very low.
| Duration | Study | Comparison | Index | Intervention mean | Control mean | Total | Country | Comments | Summary |
| 4–5 months | Effect of knowledge acquisition on carers behaviour and their clients oral hygiene behaviour | SOHI (scale 0–3) | Range 1.6–0.3 | N/A | 11 | USA | Data in published article unclear. Multiple attempts to contact authors failed. | "Improvement from baseline through the coaching phase of from 18.89% to 72.5%," p. 43. |
N/A: not available; NRS: non‐randomised study; SOHI: Simplified Green & Vermillion Oral Hygiene Index, debris only, scale 0–3.
3.4 and 3.5 Knowledge of carers (short and medium term)
Three RCTs, with 213 participants (156 of whom were in 35 clusters), compared oral hygiene care training for carers of people with ID, at follow‐up of one day, eight weeks, and six to 11 months, with no training for carers or a placebo training session, on their oral care knowledge (Gonzalez 2013; Mac Giolla Phadraig 2015; Phlypo 2016; Table 24).
| Duration | Study | Comparison | Index | Intervention mean (SD) | Control mean (SD) | Total | Country | Comments | Summary |
| 90 minutes | Oral health lecture with hands on training (90 minutes) vs oral health discussion (30 minutes) | Knowledge and comprehension (scale 0–1 for 20 questions) | 18.29 (1.98) MD 0.061 (0.086) | 17.7 (1.49) MD 0.035 (0.094) | 24 | USA | MD reported. Assessment was immediately pre‐ and postintervention. | Both groups improved their knowledge from baseline; however, there was no significant difference between the groups. | |
| 8 weeks | Carers provided with an information booklet and information session with practical skills | Knowledge (scale 0–1 for 10 questions) | 6.8 (1.43) | 5.9 (1.33) | 34 | Belgium | Subgroup analyses reported. | Post‐test, overall no strong evidence of differences were reported in K‐index scores between and within groups, p. 6. | |
| 6.5–11 months | Staff received training via a pyramidal training programme vs no training | Knowledge (scale 0–1 for 10 questions) | 7.86 (1.27) | 7.21 (1.32) | 155 | Ireland | Cluster RCT | Strong evidence of a difference in favour of the intervention was reported (P = 0.002). |
MD: mean difference; RCT: randomised controlled group; SD: standard deviation.
Gonzalez 2013: "Both groups show an increase in scores, however, the experimental group shows almost twice the increase as the control group (0.061 vs 0.035). The standard deviation of both of these groups is fairly large (around 0.09)," p. 296. Mean and SD calculated from individual data provided (Table 2, p. 296). Phlypo 2016: subgroup analysis of those in the intervention group who read the information booklet compared to those in the control group who did not showed strong evidence of an improvement in knowledge (P = 0.05). Mac Giolla Phadraig 2015: "Using independent‐samples t‐test, a significant difference between control and intervention is noted for K Index" (P = 0.002), p. 188 and Table 6, p. 189. The level of significance was adjusted to P = 0.026, using the approximate false discovery rate.
Indices: multiple‐choice questionnaires designed specifically for the studies for Gonzalez 2013 and Mac Giolla Phadraig 2015. Phlypo 2016 used the questionnaire used in Mac Giolla Phadraig 2015.
One RCT found no evidence that a 90‐minute training session increased carer oral health knowledge in the short term (MD 0.59, 95% CI –0.80 to 1.98; Analysis 3.4). The two RCTs measuring outcomes in the medium term, which used the same assessment questionnaire and had no heterogeneity, showed a moderate effect on oral health knowledge in favour of training formal carers (MD 0.69, 95% CI 0.31 to 1.06; Analysis 3.5). The certainty of the evidence was low.
3.6 Behaviour, attitude and self‐efficacy of carers (short and medium term)
Two RCTs, one of which was a cluster RCT, with 189 formal carer participants compared the effect of oral hygiene care training for carers with no training of carers on self‐reported changes in behaviour, attitude and self‐efficacy together, over eight weeks (Phlypo 2016) and six to 11 months (Mac Giolla Phadraig 2015). The two studies were combined in a meta‐analysis and showed no evidence of a difference (MD 0.15, 95% CI –0.80 to 1.10; moderate heterogeneity; Chi² = 2.50, df = 1 (P = 0.11); I² = 60%; Analysis 3.6; Table 25). The certainty of the evidence was very low.
| Duration | Study | Comparison | Index | Intervention mean (SD) | Control mean (SD) | Total | Country | Comments | Summary |
| 8 weeks | Carers provided with an Information booklet and information session with practical skills | BAS (14 questions) | 4.7 (1.72) | 5.2 (1.49) | 34 | Belgium | Subgroup analyses was reported on those who read the information booklet. | Post‐test, overall no strong evidence of differences were found in BAS scores between and within groups (P = 0.38), p. 6. | |
| 8–11 months | Staff received training via a pyramidal training programme vs no training | BAS (14 questions) | 5.42 (1.51) | 4.9 (1.55) | 155 | Ireland | Level of significance adjusted to P = 0.028, using the approximate false discovery rate. | "There was no difference in BAS scale scores (p = 0.040) between control and intervention at post‐test," p. 188. |
BAS: behaviour (rating of –2 or +2) 4 questions, attitude (rating of –2, –1, 1, 2) 5 questions, self‐efficacy (rating of –2, –1, 1, 2) 5 questions; RCT: randomised controlled trial; SD: standard deviation.
One RCT, with 193 formal carer participants, compared the effect of oral hygiene care training for carers versus no training, on behaviour only, over four weeks, on five specific self‐reported oral care behaviours (Olmos 2016; Table 26). The study reported strong evidence of positive differences for all five behaviours in the intervention group from baseline (P < 0.01; no mean or SD provided; % data only); there was no strong evidence of positive differences in the control group. Meta‐analysis was not possible due to the format of the data.
| Duration | Study | Comparison | Index | Intervention % | Control % | Total | Country | Comments | Summary |
| 4 weeks | Training of carers vs no training of carers | Pre and post survey of carers | 1. 61.10% 2. 70.40% 3. 54.10% 4. 78.60% 5. 98.90% | 1. 25.50% 2. 17.90% 3. 2.10% 4. 29.50% 5. 64.20% | 193 | Germany | 3‐headed toothbrush (Superbrush) used in this study. | Strong evidence of a difference in self‐reported behaviour from baseline in the intervention group (P < 0.01). |
RCT: randomised controlled trial.
Olmos 2016: changes in behaviour assessed: 1. use of a special toothbrush, 2. use of fluoride toothpaste, 3. application of fluoride weekly, 4. toothbrushing after breakfast, and 5. duration of toothbrushing.
Two ITS studies with 15 formal carer participants examined the effect of oral hygiene care training of carers on their oral hygiene care skills and behaviour as well as the behaviour of the people with ID for whom they cared (Glassman 2006; Kissel 1983; Table 27). One of these studies reported general increases in carers' use of training, a reduction in the level of assistance required and an "upward trend" in the level of self‐initiated steps in the toothbrushing routine for the people with ID (Kissel 1983). The other study reported an increase in the caregivers' presence during the toothbrushing session, an increase in the seconds spent brushing by the people with ID and a very slight increase in the aptitude of the person with ID in relation to toothbrushing (Glassman 2006). Meta‐analysis was not possible for these studies due to the format of the data presented. The certainty of the evidence was very low.
| Duration | Study | Comparison | Index | Intervention mean (SD) | Control mean (SD) | Total | Country | Comments | Summary |
| 100 days | Training of carers to assist people with ID to brush their teeth using verbal instruction, physical guidance, rewards and self‐management procedures | Carers' use of training | MD 44% on average (Increase) | N/A | 4 | USA | % MDs reported narratively. 2 other life skills were also taught to other residents by the staff in this study. | General increases in correct use of all assistance techniques during training; physical assistance, verbal instruction and rewards. All staff used all types of assistance correctly on average > 94% during the maintenance phase, p. 404. | |
| Training of carers to assist people with ID to brush their teeth using verbal instruction, physical guidance, rewards and self‐management procedures | Level of assistance with toothbrushing needed by person with ID | MD physical assistance 15.5% (reduction) self‐initiation "upward trend" | N/A | 4 | USA | 2 other life skills were also taught to other residents by the staff in this study. | Need for physical assistance – Baseline 47% – 60%, reduced to 38% at end of training. Verbal Instruction was inconsistent at end of training. 'Upward trends' in self‐initiated behaviour (varied by resident), p. 404. | ||
| 4–5 months | Effect of knowledge acquisition on carers' behaviour | Caregivers' presence (yes/no) during the brushing session | MD 37–89% (increase) | N/A | 11 | USA | Data in Figure 1 presented unclearly in published article. Multiple attempts to contact authors failed. Data presented as a mean for each phase of the training (classroom sessions and coaching sessions) in the text. | "The phase mean for caregiver presence during oral hygiene sessions was 100% for all clients after the coaching phase," p. 42. | |
| Duration of brushing | Seconds spent brushing | MD 484% (increase) | N/A | 11 | USA | Data presented in Figure 1 unclear in published article. Multiple attempts to contact authors failed. | Duration of brushing increased from a phase mean of 20.5–73.8 seconds at baseline to 57.9–215.4 seconds after coaching, p. 42. | ||
| Carers perception of client's aptitudes | Social Validation Questionnaire (scale 0–6) | MD 0.0–0.75 | N/A | 11 | USA | — | "The average scores showed only a slight increase," p. 43. |
ID: intellectual disability; N/A: not available; NRS: non‐randomised study.
Glassman 2006: carers received training in the classroom (training phase) and were also provided with ongoing coaching and feedback (coaching phase) during their oral hygiene care sessions with the people with ID for whom they cared.
3.7 Adverse effects
Gonzalez 2013 assessed stress and fatigue following carer completion of a questionnaire, and found there was none. The other studies did not report adverse effects.
Comparison 4: oral hygiene training versus no oral hygiene training for people with intellectual disabilities
Two RCTs and four NRSs assessed oral hygiene training for people with ID. See summary of findings Table 4.
4.1 Gingival inflammation (short term)
One RCT, with 10 participants, compared oral hygiene training for people with ID with no training, on gingival inflammation, over a six to seven weeks (Lange 1985). It found no evidence of a reduction in gingival inflammation due to training (MD –0.28, 95% CI –0.90 to 0.34; Analysis 4.1; Table 28). The certainty of the evidence was low.
| Duration | Study | Comparison | Index | Intervention mean (SD) | Control mean (SD) | Total | Country | Comments | Summary |
| 6/7 weeks | Self‐modelling training in oral hygiene skills with daily use of plaque disclosing agents vs no training but daily plaque scoring | S&LGI (scale 0–3) | Pooled data 0.98 (0.54) | Pooled data 1.26 (0.46) | 10 | USA | Mean and SD calculated from individual means | "The gingival indices [for those in treatment] improved from 12% to 50%," p. 260. The results of the Gingival Index for the control group was variable, with slight improvement, which was attributed to daily brushing. |
ID: intellectual disability; RCT: randomised controlled trial; S&LGI: Silness & Löe Gingival Index; SD: standard deviation.
Lange 1985: data presented by individuals, pooled mean and SD calculated from these data.
4.2 Plaque (short term)
Two RCTs, with 36 participants, compared oral hygiene training for people with ID with no training on plaque levels over five to seven weeks (Albino 1979; Lange 1985; Table 29). One study showed a moderate effect size on plaque levels in favour of oral hygiene training of people with ID in the short term (MD –0.47, 95% CI –0.92 to –0.02; Analysis 4.2). The certainty of the evidence was low.
| Duration | Study | Comparison | Index | Intervention mean (SD) | Control mean (SD) | Total | Country | Comments | Summary |
| 5 weeks | Desensitisation session and 11 practical training sessions in oral hygiene vs a desensitisation session only | K&API (scale 0–5) | 2.31 | 3.04 | 26 | USA | Data presented is the Adjusted Post Test scores. Some confusion re data between the 2 reports. | "Indicating a statistically significant change for the experimental group compared to the control group," Schwartz, p. 20. Analysis of covariance: F = 6.38; df = 1/23; P < 0.025. Albino, p. 27. | |
| 6/7 weeks | Self‐modelling training in oral hygiene skills with daily use of plaque disclosing agents vs no training but daily plaque scoring | G&VPI (scale 0–3) | Pooled data 0.35 (0.46) | Pooled data 0.82 (0.24) | 10 | USA | Mean and SD calculated from individual means. | The plaque level reduced for the intervention group from baseline to follow‐up by 30%, p. 260. There was a general increase in plaque levels from baseline in the control group. |
df: degrees of freedom; G&VPI: Green & Vermillion Plaque Index; ID: intellectual disability; K&API: Kobayashi & Ash Plaque Index (six teeth scored, facial and lingual surfaces only); RCT: randomised controlled trial; SD: standard deviation.
Lange 1985: data presented by individuals, pooled mean and SD calculated from these data.
4.3 NRCT: behaviour (medium and long term)
Four ITS studies, with 59 participants, examined oral hygiene training for people with ID on their toothbrushing behaviour over periods of 100 days, 30 weeks and 19 months (Bouter 1979; Jarman 1983; Snell 1989). One study was unclear in relation to the duration of the intervention (Abramson 1972; Table 30). Oral hygiene training of people with ID may have impacted on their toothbrushing behaviour but it was unclear how this would impact on their oral health. Meta‐analysis was not possible due to the format of the data presented. The certainty of the evidence was very low.
| Duration | Study | Comparison | Index | Intervention mean (SD) | Control mean (SD) | Total | Country | Comments | Summary |
| Unclear | Oral hygiene training for people with ID using discrimination, reinforcement and modelling | Steps in a toothbrushing routine (19) | Pooled data MD 6.3 steps (increase) | N/A | 8 | USA | Group mean and SD calculated from the reported data. | 1‐tailed t‐tests for correlated data showed strong evidence of positive MDs in toothbrushing behaviour (range P < 0.005 to P < 0.0005), Table 3, p. 8. | |
| 100 days | Oral hygiene training for people with ID using assistance, feedback and duration training | Steps in a toothbrushing routine (15) | 62.5% (increase) | N/A | 8 | The Netherlands | Number of training and duration training sessions varied considerably between participants. | 62.5% of participants learned to brush their teeth and continued to do so after 8–15 days of no training. | |
| 30 weeks | Oral hygiene training for people with ID using a token reinforcement programme with single and chained response contingency phases | Completing the toothbrushing skill | 60.2–71.9% of participants (increase) | N/A | 40 | USA | Individual performance criteria were determined at baseline. 5 other life skills were also taught in this study. | Mean weekly performance of tooth brushing increased by 60.2% using single contingency reinforcement and by 71.9% using chained contingency reinforcement. | |
| 19 months | Oral hygiene training for people with ID using verbal and physical prompts that were gradually faded | Steps in a toothbrushing routine (17) | Difference 5–12 steps (increase) | N/A | 3 | USA | Results reported narratively and are unclear. | "Training was not consistently followed by maintenance of effects. Although Sara's performance was durable, Jake and Frank did not maintain all their skills without receiving 'booster' training sessions," p. 224. |
ID: intellectual disability; MD: mean difference; N/A: not available; NRS: non‐randomised study; SD: standard deviation.
Abramson 1972: mean individual data reported (no SD reported), group mean and SD calculated from these data.
4.4 Adverse effects
Bouter 1979 reported one participant had nausea (the researchers considered it to be a delaying tactic by the participant), and Snell 1989 reported participants displaying sensitivity to mouths being held open. The other studies did not report any adverse events (Abramson 1972; Albino 1979; Jarman 1983; Lange 1985).
Comparison 5: scheduled dental recall intervals (1, 3 or 6 months) plus daily supervised toothbrushing versus usual care for people with intellectual disabilities
One cluster‐RCT, with 304 participants, compared the benefit of regular dental recalls plus daily supervised toothbrushing versus no supervision or planned dental professional intervention, for people with ID, on plaque, gingival inflammation, gingival bleeding and calculus over three, six, 12, 18 and 24 months (Shaw 1991). The recall intervals were 1‐, 3‐ and 6‐ monthly: the 1‐and 3‐monthly recalls involved reinforcement of oral hygiene and a professional prophylaxis; the 6‐monthly recall involved reinforcement of oral hygiene only. The findings at 24 months are reported here; at earlier timepoints, the number of participants was not reported (Table 31; Table 32; Table 33; Table 34). The certainty of the evidence for all reported outcomes was low. See summary of findings Table 5.
| Duration | Study | Comparison | Index | Intervention mean (SD) | Control mean (SD) | Total | Country | Comments | Summary |
| 24 months | 1‐, 3‐ and 6‐monthly dental recall vs no regular dental recall | WHOGPI (scale 0–2) | R1: 0.3 (0.8); R3: 0.4 (0.7); R6: 0.5 (0.9) | 0.9 (1.4) | 304 | UK | All participants also had supervised daily toothbrushing. | Strong evidence of differences between the groups for Code 1 GPI at 3, 6, 12 and 24 months (P < 0.01–0.05). |
GPI: Gingival Pocket Index; R1: one‐month recall; R3: three‐month recall; R6: six‐month recall; RCT: randomised controlled trial; SD: standard deviation; WHOGPI: World Health Organization Gingival Pocket Index, scale 0–2 (0: 0–3.5 mm; 1: > 3.5–5.5 mm; 2: > 5.5 mm).
Shaw 1991: data also reported for 3, 6, 12 and 18 months, not reported here as participant numbers were not provided. Data for "mean number of sextants scored as Code 1." No strong evidence of a difference for Code 2, but the actual number of effected sextants was very low.
| Duration | Study | Comparison | Index | Intervention mean (SD) | Control mean (SD) | Total | Country | Comments | Summary |
| 24 months | 1‐, 3‐ and 6‐monthly dental recall vs no regular dental recall | WHOBI (scale 0–1) | R1: 2.2 (1.9); R3: 2.3 (1.9); R6: 2.6 (1.8) | 2.4 (2.0) | 304 | UK | All participants also had supervised daily toothbrushing. | Strong evidence of differences in BI at the 3‐, 6‐ and 12‐month time points (P < 0.01) were not observed at 18 or 24 months |
BI: Bleeding Index; R1: one‐month recall; R3: three‐month recall; R6: six‐month recall; RCT: randomised controlled trial; SD: standard deviation; WHOBI: World Health Organization Bleeding Index, scale 0–1; presence or absence of bleeding after 20 seconds.
Shaw 1991: data also reported for 3, 6,12 and 18 months, not reported here as participant numbers not provided.
| Duration | Study | Comparison | Index | Intervention mean (SD) | Control mean (SD) | Total | Country | Comments | Summary |
| 24 months | 1‐, 3‐ and 6‐monthly dental recall vs no regular dental recall | WHOPI (scale 0–3) | R1: 1.2 (1.7); R3: 1.3 (1.7); R6: 1.3 (1.5) | 2.0 (1.9) | 304 | UK | All participants also had supervised daily toothbrushing. | Strong evidence of differences for Plaque Index at 12 (P < 0.01) and 24 months (P < 0.05); the greatest differences were seen in the 1‐ and 3‐monthly intervals. |
R1: one‐month recall; R3: three‐month recall; R6: six‐month recall; SD: standard deviation; WHOPI: World Health Organization Plaque Index; data were for "mean number of sextants scored as Code 2."
Shaw 1991: data also reported for 3, 6, 12 and 18 months, not reported here as participant numbers not provided. "The difference between the one‐monthly and three monthly hygienist input (Recall visit) were not clinically very apparent after two years," p. 144.
| Duration | Study | Comparison | Index | Intervention mean (SD) | Control mean (SD) | Total | Country | Comments | Summary |
| 24 months | 1‐, 3‐ and 6‐monthly dental recall vs no regular dental recall | WHOCI (scale 0–1) | R1: 1.6 (1.7); R3 2.2 (1.9); R6: 3.5 (2.0) | 3.6 (2.1) | 304 | UK | All participants also had supervised daily toothbrushing. | Strong evidence of differences in confidence intervals at 6, 12, 18 and 24 months (P < 0.01). |
R1: one‐month recall; R3: three‐month recall; R6: six‐month recall; RCT: randomised controlled trial; WHOCI: World Health Organization Calculus Index, scale 0–1 (presence or absence).
Shaw 1991: data also reported at 3, 6, 12 and 18 months, not reported here as participant numbers not provided.
5.1 Gingival pocketing (long term)
Meta‐analysis at 24 months showed effect sizes for the Code 1 gingival pockets were moderate in favour of regular dental recalls and supervised toothbrushing over usual care (1‐monthly: MD –0.60, 95% CI –0.97 to –0.23; 3‐monthly: MD –0.50, 95% CI –0.85 to –0.15; 6‐monthly: MD –0.40, 95% CI –0.76 to –0.04; Analysis 5.1).
5.2 Gingival bleeding (long term)
There was no evidence of a difference between regularly scheduled visits and supervised toothbrushing versus usual care for gingival bleeding at 24 months (1‐monthly: MD –0.20, 95% CI –0.86 to 0.46; 3‐monthly: MD –0.10, 95% CI –0.73 to 0.53; 6‐monthly: MD 0.20, 95% CI –0.38 to 0.78; Analysis 5.2).
5.3 Plaque (long term)
Meta‐analysis of data showed the effect size for plaque levels at 24 months was large in favour of regular dental recall intervals and supervised toothbrushing (1‐monthly: MD –0.70, 95% CI –1.30 to –0.10; 3‐monthly: MD –0.80, 95% CI –1.38 to –0.22; 6‐monthly: MD –0.70, 95% CI –1.22 to –0.18; Analysis 5.3).
5.4 Calculus (long term)
The effect size at 24 months for calculus levels was large in favour of regular dental recalls at one‐ and three‐monthly intervals (1‐monthly: MD –2.00, 95% CI –2.64 to –1.36; 3‐monthly: MD –1.40, 95% CI –2.04 to –0.76), but the difference was not seen in the six‐monthly interval group, which only received a scale and polish at baseline (MD –0.10, 95% CI –0.72 to 0.52; Analysis 5.4).
5.5 Caries
Although the study set out to measure caries, no results were reported.
5.6 Adverse effects
None reported.
Comparison 6: discussion of individual clinical photographs as a toothbrushing motivator versus no discussion of clinical photographs for people with intellectual disabilities
One RCT, with 29 participants, showed people with ID photographs of their dental plaque shown up by the disclosing agent, taken at monthly oral hygiene sessions during the intervention, and discussed these with the participants in the intervention group over six months (Bickley 1990). Both groups received general oral hygiene instruction. See summary of findings Table 6.
6.1 Plaque (medium term)
Meta‐analysis showed no evidence of a difference in plaque levels between intervention and control (MD –0.10, 95% CI –1.85 to 1.65), or in the extrinsic stain score (MD –2.60, 95% CI –19.45 to 14.25; Analysis 6.1; Table 35). The certainty of the evidence was very low.
| Duration | Study | Comparison | Index | Intervention mean (SD) | Control mean (SD) | Total | Country | Comments | Summary |
| 6 months | Discussion of clinical photographic records vs no discussion | WHOPI (scale 0–12) | 7.3 (2.8) | 7.4 (2.0) | 29 | UK | Disclosing solution was also used. | "There was no significant changes after 6 months in either of the groups," p. 4. | |
| ESI (%) | 37.7% (18.2) | 40.3% (26.4) | 29 | UK | Disclosing solution was also used. | "The test group was considerably lower but just failed to achieve statistical significance (t = 1.721, df =15)," p. 4. |
df: degrees of freedom; ESI: Extrinsic Stain Index Shaw & Murray (% plaque on anterior teeth); SD: standard deviation; WHOPI: World Health Organization Plaque Index (4 surfaces per tooth, scored 0–3 resulting in a scale of 0–12).
6.2 Adverse effects
None reported.
Comparison 7: daily, twice‐weekly and once‐weekly frequencies of toothbrushing versus usual care for people with intellectual disabilities
One RCT, with 80 participants, compared the frequency of brushing over 21 days on gingival inflammation (Swallow 1969). Daily brushing, carried out by dental students, was compared to twice weekly, once weekly or usual care. This study also compared the use of an electric toothbrush and a manual toothbrush (reported earlier). See summary of findings Table 7.
7.1 Gingival inflammation (short term)
For people with ID, who had their teeth brushed by a dental student, the more frequently the teeth were brushed the greater the reduction in gingival inflammation in the short term (21 days; Table 36). The certainty of the evidence was low.
| Duration | Study | Comparison | Index | Intervention mean | Control mean | Total | Country | Comments | Summary |
| 21 days | Daily vs twice weekly brushing | B&LL&SGI (scale 0–6) | Pooled 1.84 | Pooled 2.05 | 40 | UK | Pooled mean calculated from reported data | Brushing twice a week reduced gingival disease by approximately 46% and brushing daily by 51%, p. 378. | |
| Daily vs once weekly brushing | B&LL&SGI (scale 0–6) | Pooled 1.84 | Pooled 3.42 | 40 | UK | Pooled mean calculated from reported data | Brushing once a week reduced gingival disease by approximately 26% and brushing daily by 51%, p. 378. | ||
| Daily brushing vs usual care | B&LL&SGI (scale 0–6) | Pooled 1.84 | 4.27 | 60 | UK | Pooled mean calculated from reported data | Brushing daily differed strongly from usual care – decreasing levels of gingivitis by 51%, p. 378. |
B&LL&SGI: buccal and labial surfaces Löe & Silness, scale 0–6; RCT: randomised controlled trial.
Swallow 1969: data presented separately for electric and manual toothbrushes, labial and buccal surfaces, and males and females; no SD reported. The data for the females using the electric toothbrush daily and twice weekly appeared unrealistically low; author could not be contacted to clarify. Pooled means were calculated from these data. Usual care group "rarely received any regular form of oral hygiene."
7.2 Adverse effects
None reported.
Comparison 8: use of a toothpaste with a plaque‐disclosing agent versus a conventional toothpaste for people with intellectual disabilities
One non‐randomised, two‐armed cross‐over trial, with 40 participants aged 7 to 13 years with Down Syndrome, compared using a toothpaste containing a plaque‐disclosing agent with using a conventional toothpaste on plaque and gingival inflammation levels over 10 days (Teitelbaum 2009). See summary of findings Table 8.
8.1 Plaque and gingival inflammation (short term)
The toothpaste containing a plaque‐disclosing agent when brushing may have reduced plaque and gingival inflammation in the short term (10 days) (Table 37; Table 38). The certainty of the evidence was very low.
| Duration | Study | Comparison | Index | Intervention mean | Control mean | Total | Country | Comments | Summary |
| 10 days | Toothpaste with a disclosing agent vs a regular toothpaste | GBI (scale 0–1) | % mean difference 18 | % mean difference 8 | 40 | Brazil | Cross‐over trial. Data presented for 2 arms combined. | Strong evidence of a difference in Bleeding Index in favour of the intervention (P < 0.001), p. 466. |
GBI: Gingival Bleeding Index Ainamo & Bay (present or absent); NRS: non‐randomised study.
Teitelbaum 2009: included two other experimental groups using chlorhexidine, which are not relevant to this review. The toothpaste containing a plaque‐disclosing agent produced a reduction in gingival inflammation similar to the dentifrice with chlorhexidine (18%) (not reported here). Exact data in Figure 2 unclear; requested from authors, but no response.
| Duration | Study | Comparison | Index | Intervention mean | Control mean | Total | Country | Comments | Summary |
| 10 days | Toothpaste with a disclosing agent vs a regular toothpaste | SG&VOHI (scale 0–3) | % mean difference 65 | % mean difference 15 | 40 | Brazil | Cross‐over trial. Data presented for 2 arms combined. | Strong evidence of a difference in plaque levels in favour of the intervention (P < 0.0001), p. 466. |
NRS: non‐randomised study; SG&VOHI: Simplified Green & Vermillion Oral Hygiene Index – plaque only. Scoring of disclosed plaque on buccal surfaces of 4 teeth and lingual surfaces of 2 teeth.
Teitelbaum 2009: included two other experimental groups not relevant to this review. Exact data in Figure 2 unclear. Requested from authors, but no response.
8.2 Adverse effects
The study tested for an allergic reaction to any tested chemical agent; no adverse effects were reported.
Comparison 9: individualised oral care plan versus usual care (according to guidelines) for people with intellectual disabilities
One NRCT, with 79 participants, compared an individualised oral care plan with usual care, on plaque levels, over 12 months (Altabet 2003; Table 39). See summary of findings Table 9.
| Duration | Study | Comparison | Index | Intervention mean | Control mean | Total | Country | Comments | Summary |
| 12 months | Individualised oral care plan vs usual care (general oral care policy) | SOHR (scale 1–5) | 2.97 | 3.10 | 79 | USA | The intervention group was monitored, monthly – quarterly, with staff feedback and review as required. No monitoring of the control group. | "People in the treatment group showed statistically significant improvement, t (39) = 3.82, p < .001)," p. 442. | |
| Improvement differential | 38% | 5% | 79 | USA | The intervention group was monitored, monthly – quarterly, with staff feedback and review as required. No monitoring of the control group. | "The results indicate that practices can be implemented to improve oral hygiene in individuals with mental retardation living at a state residential facility," p. 442. |
NRS: non‐randomised study; SOHR: Subjective Oral Hygiene Rating, scale 1–5 (1 excellent: no plaque on teeth, 2 good; plaque present on less than 15% of total tooth surface (tts), 3 fair; plaque present on 15–50% of tts, 4 poor; plaque present on 50–90% of tts, 5 plaque present on greater than 90% of tts), p. 441. Numerical ratings were averaged over the two designated time periods. Improvement differential: difference between percentage of individuals with improvement rating minus the % individuals with poorer rating over same time period.
9.1 Plaque (medium term)
An individualised oral care plan may have reduced plaque levels for people with ID over 12 months. The certainty of the evidence was very low.
9.2 Adverse effects
None reported.
Discussion
Summary of main results
This review reported findings for nine comparisons of different types of oral hygiene interventions targeting people with ID or their carers. Four of the comparisons included between six and 13 studies. Only one study each assessed the remaining five comparisons. The individual studies were generally small; many studies having less than 50 participants, which resulted in most of the meta‐analyses having fewer than 100 participants in total. The main outcomes reported were gingival health, oral hygiene knowledge, and oral hygiene behaviour. Dental caries and quality of life were not reported in any of the studies.
Comparison 1: special manual toothbrushes versus conventional manual toothbrushes for people with intellectual disabilities (six RCTs and one NRS)
Very low‐certainty evidence from one RCT medium term (six weeks to 12 months) found a small effect size in favour of a special manual toothbrush (Superbrush) compared to a conventional manual toothbrush for reducing levels of gingival inflammation and possibly plaque. In this study, toothbrushing was carried out by formal carers for people with moderate‐to‐profound ID. There was no difference in effect size between the two toothbrushes for the other outcomes and time points measured.
One NRS study compared the Collis Curve toothbrush to a conventional toothbrush used by student dental nurses for people with profound ID and found no difference between the two toothbrushes in the medium term.
Comparison 2: electric toothbrushes versus manual toothbrushes for people with intellectual disabilities (eight RCTs and five NRS)
There was moderate‐certainty evidence from two RCTs in relation to the assessment of gingival inflammation in the medium term, indicating that there was little or no difference between the electric and manual toothbrushes when used by people with mild‐to‐moderate or unclear levels of ID, with and without some assistance from formal carers. Low‐certainty evidence found no difference between toothbrush types for medium‐term plaque.
The findings in the NRS were broadly similar to the findings of the RCT meta‐analysis, but the certainty of the evidence was very low. The plaque and gingival inflammation levels of the control group in all of these NRS studies improved from baseline, which was credited to the daily brushing routine instigated as part of the studies.
The evidence in relation to gingival inflammation and plaque, short term, was inconclusive as the findings were inconsistent between the four studies; the data could not be included in a meta‐analysis. The evidence was low‐ to very‐low certainty. The electric toothbrushes had a variety of modes of action. The difference in findings between the types of electric toothbrush used may have been relevant.
Comparison 3: oral hygiene care training of carers versus no oral hygiene care training for carers of people with intellectual disabilities (four RCTs and three NRS)
There was low‐certainty evidence that oral hygiene care training for formal carers had no beneficial effect on the level of gingival inflammation or plaque for people with mixed levels of ID for whom they cared, in the medium term, compared to no oral hygiene care training. One NRS showed strong evidence of a difference in plaque levels short term, in favour of the intervention, when the formal carers were made accountable for the level of care they provided for people with moderate‐to‐profound levels of ID (Table 22; Analysis 3.3).
Changes in formal carers' knowledge following training showed a moderate improvement in the medium term, but attitude, self‐efficacy and behaviour of carers did not seem to improve after training, though the findings across studies were inconsistent. The certainty of RCT evidence for these outcomes was low to very low. Issues such as level of attendance at training, use of the educational resources, instruction on how to apply the training in practice and levels of support provided to carers were identified by the study authors as possibly impacting on the outcomes.
Comparison 4: oral hygiene training versus no oral hygiene training of people with intellectual disabilities (two RCTs and four NRS)
There were moderate reductions in the levels of plaque (but not gingival inflammation) in favour of oral hygiene training of people with mixed levels of ID compared to no oral hygiene training in the short term (Table 28; Table 29; Analysis 4.1; Analysis 4.2). The certainty of the evidence was very low.
Three of the four NRS assessing changes in behaviour found in favour of the training as measured by an increase in the steps achieved in a toothbrushing routine for people with severe and profound levels of ID. The certainty of the evidence was very low (Table 30). It was unclear if the improvement in the toothbrushing routines in the NRS impacted on gingival health, as no clinical measurements were carried out.
Comparison 5: one‐, three‐ and six‐monthly dental recall intervals plus daily supervised toothbrushing versus usual care for people with intellectual disabilities (one RCT)
One RCT provided low‐certainty evidence that regular dental recall visits and supervised toothrbushing might have improved gingival health (gingival pocketing, plaque and calculus levels) in the long term for people with unclear levels of ID (Table 31; Table 32; Table 33; Table 34; Analysis 5.1; Analysis 5.2; Analysis 5.3; Analysis 5.4). The difference between one‐, three‐ and six‐monthly recall intervals was minimal and unlikely to be clinically significant.
Comparison 6: discussion of individual clinical photographs as a toothbrushing motivator versus no discussion of photographs for people with intellectual disabilities (one RCT)
One RCT provided very low‐certainty evidence demonstrating that the discussion of clinical photographs as an oral hygiene motivator most likely had no effect on plaque levels in the medium term (Table 35; Analysis 6.1).
Comparison 7: daily, twice‐weekly and once‐weekly frequencies of teeth brushing versus usual care for people with intellectual disabilities (one RCT)
One RCT provided low‐certainty evidence that brushing daily compared to brushing twice weekly, once weekly or usual care may reduce plaque levels in the short term. The brushing was carried out by a dental professional in this intervention (Table 36).
Comparison 8: use of a toothpaste with a plaque‐disclosing agent versus a conventional toothpaste for people with intellectual disabilities (one NRS)
One NRS found that the use of a toothpaste with a plaque‐disclosing agent might reduce plaque and gingival inflammation levels for children with Down Syndrome (mild and moderate levels of ID), more than conventional toothpaste, in the short term (Table 37; Table 38). The certainty of the evidence was very low.
Comparison 9: individualised oral care plan versus usual care (according to guidelines) for people with intellectual disabilities (one NRS)
One NRS found that individualised oral care plans might improve oral hygiene for people with mixed levels of ID, in the medium term (Table 39). The intervention involved the input of a multidisciplinary team. The certainty of the evidence was very low.
Adverse effects
Only one study considered adverse effects as a formal outcome. Most studies did not report adverse effects. Some studies that reported adverse effects informally, reported transient difficulties with the electric and special manual toothbrushes but did not quantify them. It should be noted that any persistent resistance to clinical assessments or interventions resulted in participants being excluded from the studies.
Overall completeness and applicability of evidence
The aim of this review was to determine the effects (benefits and harms) of oral hygiene interventions for people with ID. The clinical and behavioural outcomes focused predominately on the potential benefits. Any persistent resistance to the clinical assessments or to the intervention, by people with ID, resulted in them being excluded from the study. Any harms identified were not considered as a formal outcome, often not quantified and tended to be reported in the discussion section. Any formal qualitative assessments of the interventions were completed by the carers involved and were normally in the form of poststudy interviews.
None of the studies formally addressed quality of life changes and long‐term, patient‐centred outcomes. There were occasional comments in the discussion section of the studies regarding increases in self‐efficacy or confidence of the carers. The lack of qualitative outcomes may be linked to the age of many of the studies and lack of reporting standards. No studies provided data on dental caries. In relation to unintended effects, no studies reported any positive unintended effects. Negative unintended effects or adverse effects were reported only within the text; no formal assessments were reported.
All of the other primary and secondary outcomes outlined in our protocol were reported. The clinical outcomes reported were gingival inflammation, plaque and calculus. The tools used to assess these outcomes were modified or adapted for the ID population. Any differences observed in the clinical assessments must be considered in relation to their practical impact on gingival health long term. The non‐clinical outcomes reported for the carers were knowledge, behaviour, attitude and self‐efficacy. Changes in behaviour were reported for people with ID.
The topics considered for subgroup analysis, as outlined in the protocol, were recorded for the individual studies, but there were insufficient data to undertake these analyses.
Validity of assessments used
Most studies assessed clinical outcomes using validated tools, other than in six studies which used subjective assessments (Albino 1979; Gertenrich 1967a; Gertenrich 1967b; Gertenrich 1967c; Gertenrich 1967d; Kelner 1963). Many of the validated tools were modified, some to a considerable extent; some of these modifications had been validated and others had not. The level of modifications to the assessment tools highlighted the difficulties involved in carrying out clinical assessments for this population.
The use of subjective clinical assessments is most likely an historical issue and unlikely to occur in future interventions. Despite the subjective nature of these assessments, we considered these studies to add value to this review; their findings were graded with the quality of these assessments in mind.
The non‐clinical outcomes (knowledge, behaviour, attitude and self‐efficacy) were less well validated. The studies that included observations of behaviour were assessed for reliability. One study, using a questionnaire to assess knowledge, self‐efficacy, attitude and behaviour, reported that the tool had been validated; another study used the same tool. Another study, using a questionnaire, reported getting "expert advice on the content."
COM‐B characteristics identified in the interventions
We attempted to map the behavioural change elements of the interventions in this review using the COM‐B system for understanding behaviour and behavioural change (Michie 2011). These elements are: capability: defined as the psychological and physical capacity to engage in the activity; opportunity: both physical and social, which considers contexts beyond the individual; and motivation: both automatic and reflexive; which might result in conscious decision‐making. An intervention may change one or more of these elements resulting in the desired behaviour of performing regular oral hygiene.
Capability
The potential for increasing the physical capability of the participants was identified in interventions that focused on training, modelling or enablement in the skill of toothbrushing. The potential for increasing psychological capability was predominantly identified in interventions for people with mild or moderate ID as they could have the capability to reflect and to make the connections between any information provided and the benefit to them. Interventions targeting people with more severe levels of ID may benefit more from interventions that use incentivisation, persuasion, coercion or restriction as a psychological tool.
Opportunity
The element of opportunity to change behaviour was considered, for example, if the intervention attempted to provide additional time or resources to the oral hygiene routine (physical opportunity) or to make the oral hygiene routine socially expected or the cultural norm (social opportunity). Physical opportunity most often involved specific time being set aside for the toothbrushing routine, or environmental restructuring such as providing different oral hygiene or other aids and changing the setting where the toothbrushing took place. Social opportunities identified were monitoring or recording of the oral hygiene routine; such as a toothbrushing diary or staff monitoring. Social opportunity‐based interventions tended to focus on carers rather than people with ID. One example of an intervention that did focus on children with ID, involved a toothbrushing session using a plaque‐disclosing solution in a classroom setting; the children were aware of how their classmates were performing, which may act as a social cue in relation to the toothbrushing habit (Shaw 1983).
Motivation
The element of motivation to change behaviour was considered if the intervention included the potential to reflect on the benefit of changing behaviour or for the behavioural change to become an automatic process. It was the least common element identified in the interventions. Reflective motivation was identified in interventions that included some element of feedback in relation to behaviour or performance and was seen predominantly in the interventions targeting carers. No studies were identified as having the potential for the behavioural change to become automatic. This may have been due to the duration of the interventions, as the development of habit can take some time; 19 of the studies were followed up for three months or less, and only three for more than 12 months.
To ensure that an intervention that seems effective is successfully replicated in a new setting, the explicit causal processes that elicited the behavioural change must be identified and replicated. It is difficult to identify the COM‐B elements retrospectively; we can only claim that the intervention may have provided these elements. The decision to retrospectively identify these elements in our review provided valuable insight into the causal processes that were potentially in action. By mapping the behavioural change elements and intervention functions inherent in the interventions in this review, we hope we have assisted in the identification of the causal processes that should be replicated. These details are recorded in the Characteristics of included studies table.
Quality of the evidence
The certainty of the evidence varied from moderate to very low for comparisons with RCT evidence, and was very low for comparisons assessed only in NRS. The quality of reporting was poor; the lack of detail provided in relation to the methodology impacted on the assessment of risk of bias. Cross‐over studies were not reported in a way that made them amenable to meta‐analysis. More than half of the studies were pre‐2000; before the introduction of guidelines such as the CONSORT statement in relation to the standards for reporting trials (Moher 2001). A wide variety of outcome measures was used. The limited number of studies for each comparison, all with small sample sizes, led to imprecision in the effect estimates. There were many NRSs despite the fact that RCTs are feasible for all comparisons included in this review.
Better quality evidence is required for all the comparisons identified in this review. This could be achieved by modifying the inclusion criteria or by applying positive weighting for CONSORT‐compliant studies. For trials using cross‐over design, the MD or data from each treatment period should be reported to allow calculation of the standard error of the SD or to approximate the correlation between results from treatment periods, so that data from these studies can be combined in any meta‐analysis.
Potential biases in the review process
The most common element reducing the certainty of the evidence was the 'unclear' elements under all the risk of bias headings, most notably in relation to outcome reporting, which was predominantly as a consequence of the absence of study protocols. The level of 'high' risk in relation to randomisation was caused by the inclusion of NRSs.
We excluded 16 studies as we were unable to source the articles, unable to contact the authors for more details or the data were no longer available. These studies may have added to the review.
As the first review of this topic, we have worked hard to identify all relevant studies, but we acknowledge that some studies may not have been published, registered or presented anywhere, and we did not search every database. The study designs included in this review were wider than conventional Cochrane Reviews, but this allowed the consideration of interventions that might otherwise have been excluded. It was assumed at the protocol stage that before‐and‐after study designs would predominate, given the diverse nature of ID, related comorbidities, environments and level of supports available. However, this assumption was not borne out. RCTs were identified for all of the interventions except for the use of toothpaste with a plaque‐disclosing agent and individualised oral care plans, and there is no reason these interventions could not be assessed in RCTs.
Given the number of studies reporting little or no difference between intervention groups compared to controls, it is unlikely that there is a publication bias for positive findings in the studies being reported.
Agreements and disagreements with other studies or reviews
Special manual toothbrushes
A systematic review by Kalf‐Scholte 2018 evaluated triple‐headed toothbrushes compared to single‐headed toothbrushes, in a general population ("humans without fixed orthodontic appliances"), for prevalence of plaque. Kalf‐Scholte 2018 included three studies also in our review (Dôgan 2004; Kaschke 2005; Sauvetre 1995). The Kalf‐Scholte 2018 review conducted some subgroup analyses that suggested that when toothbrushing was assisted or carried out by a carer, there may have been a greater benefit to using a triple‐headed toothbrush (Superbrush). In our review, Bildt 2010 evaluated the impact of carer toothbrushing using a three‐headed or conventional toothbrush and found a small effect size in favour of the special manual toothbrush. The Kalf‐Scholte 2018 review concluded that the brushes were equally effective for self‐brushers; this matched the findings of our review.
Electric toothbrushes
The findings in our review appeared to conflict with the Yaacob 2014 Cochrane Review that evaluated powered versus manual toothbrushes in the general population (people with disabilities were excluded). Yaacob 2014 concluded that electric toothbrushes were more effective than manual toothbrushes in the short (one to three months) and long (greater than three months) term. It found a moderate effect size in favour of the electric toothbrush short term (SMD –0.50, 95% CI –0.70 to –0.31) and long term (SMD –0.47, 95% CI –0.82 to –0.11). Our review showed no evidence of a difference between toothbrushes for gingival inflammation levels at six months (MD 0.02, 95% CI –0.06 to 0.09; Analysis 2.1).
The greatest differences in the Yaacob 2014 review were seen in the studies that compared an electric toothbrush with a rotating oscillation mode of action. There were only two studies in our review that compared an electric toothbrush with a rotation oscillation mode of action (Braun Plaque Control 3D) to a manual toothbrush, one RCT and one NRS. The RCT found strong evidence of a difference in plaque levels in favour of the electric toothbrush after one week (P < 0.001; Dôgan 2004). The ITS found some strong evidence of differences in subgroups for plaque at 12 weeks (those using the electric toothbrush unaided) and gingivitis at 16 months (those using the electric toothbrush unaided) in favour of the electric toothbrush (P < 0.05; Bratel 1991). The data from these studies were not suitable for meta‐analyses.
Oral hygiene care training of carers
Comparisons in relation to changes in carer knowledge, attitude, self‐efficacy and behaviour in this review could be made to studies directed at carers in long‐term healthcare settings. A systematic review of the effectiveness of continuing education in long‐term care settings by Aylward 2003 found many of the same issues in their review in relation to the quality of the evidence, diversity of assessment tools, level of attrition, applying the training in practice and levels of support provided to carers at management level. Of the studies in their review that assessed both knowledge and behaviour, almost all showed an improvement in knowledge but no change in behaviour. Most of the evaluations took place immediately after the intervention, which ranged in length from 10 minutes to 52 hours.
The clinical outcomes assessed in this comparison can be compared to the Albrecht 2016 Cochrane Review, which evaluated oral health education interventions of nurses in nursing homes, and concluded that there was no difference in plaque levels compared to usual care. The two RCTs in our review similarly found no difference in plaque or gingivitis levels. Two NRS in our review found some reduction in plaque levels when staff were made accountable for the oral hygiene care of people with ID.
Oral hygiene care training for people with intellectual disabilities
The RCTs included in our review comparing oral hygiene care training for people with ID were all short‐term studies. The findings were in agreement with the systematic review by Watt 2005 in relation to oral health promotion in general, which concluded that short‐term interventions may have resulted in a reduction in plaque and gingivitis levels. However, they noted in their review that there was very limited evidence supporting long‐term reduction in plaque and gingival bleeding outcomes. The NRS in our review, which were medium‐ and long‐term interventions, showed some improvement in toothbrushing routines. However, these studies had small numbers of participants and were very labour intensive. Kay 1996 commented in her review, in relation to oral health promotion that the balance between input and output must be considered.
Recall intervals
Our review found one study that showed a benefit to gingival health of regular dental recall intervals (one‐, three‐ or six‐monthly) (combined with daily supervised toothbrushing); however, the certainty of the evidence was low. One Cochrane Review investigating dental recall intervals for the general population identified only one RCT, which was insufficient to draw any conclusions; this review was published in 2013 and is currently being updated (Riley 2013). Lamont 2018 found that gingivitis was not reduced more by regularly scheduled visits for scale and polish in the general population. Evidence for the value of oral hygiene instruction at dental visits in the general population is lacking (Soldani 2018).

Risk of bias graph: review authors' judgements about each risk of bias item presented as percentages across all included studies.

Risk of bias summary: review authors' judgements about each risk of bias item for each included study.

Study flow diagram. ID: intellectual disability; NRS: non‐randomised study; RCT: randomised controlled trial.

Comparison 1 Special manual toothbrush (TB) versus conventional manual TB (used by carers) for people with intellectual disabilities (ID), Outcome 1 Gingival inflammation short term (< 6 weeks).
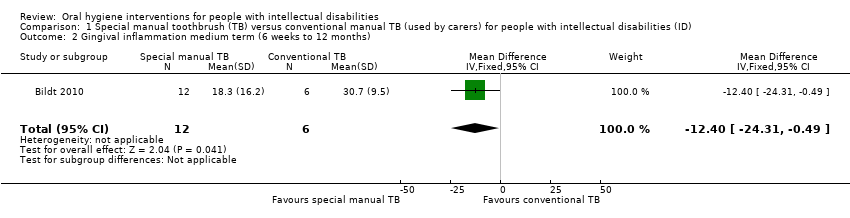
Comparison 1 Special manual toothbrush (TB) versus conventional manual TB (used by carers) for people with intellectual disabilities (ID), Outcome 2 Gingival inflammation medium term (6 weeks to 12 months).
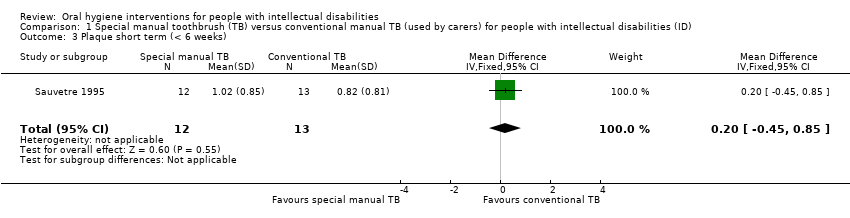
Comparison 1 Special manual toothbrush (TB) versus conventional manual TB (used by carers) for people with intellectual disabilities (ID), Outcome 3 Plaque short term (< 6 weeks).

Comparison 1 Special manual toothbrush (TB) versus conventional manual TB (used by carers) for people with intellectual disabilities (ID), Outcome 4 Plaque medium term (6 weeks to 12 months).

Comparison 1 Special manual toothbrush (TB) versus conventional manual TB (used by carers) for people with intellectual disabilities (ID), Outcome 5 Oral health assessments.

Comparison 1 Special manual toothbrush (TB) versus conventional manual TB (used by carers) for people with intellectual disabilities (ID), Outcome 6 Behaviour, attitude and self‐efficacy.

Comparison 1 Special manual toothbrush (TB) versus conventional manual TB (used by carers) for people with intellectual disabilities (ID), Outcome 7 Degree of resistance of person with ID.
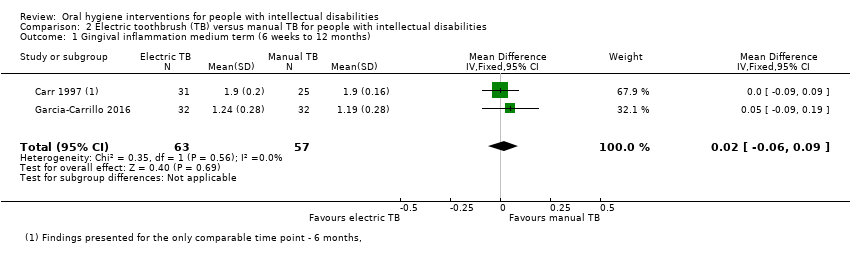
Comparison 2 Electric toothbrush (TB) versus manual TB for people with intellectual disabilities, Outcome 1 Gingival inflammation medium term (6 weeks to 12 months).

Comparison 2 Electric toothbrush (TB) versus manual TB for people with intellectual disabilities, Outcome 2 Plaque medium term (6 weeks to 12 months).

Comparison 2 Electric toothbrush (TB) versus manual TB for people with intellectual disabilities, Outcome 3 NRS Gingival inflammation long term (> 12 months).

Comparison 2 Electric toothbrush (TB) versus manual TB for people with intellectual disabilities, Outcome 4 NRS Plaque medium term (6 weeks to 12 months).

Comparison 2 Electric toothbrush (TB) versus manual TB for people with intellectual disabilities, Outcome 5 Calculus medium term (6 weeks to 12 months).
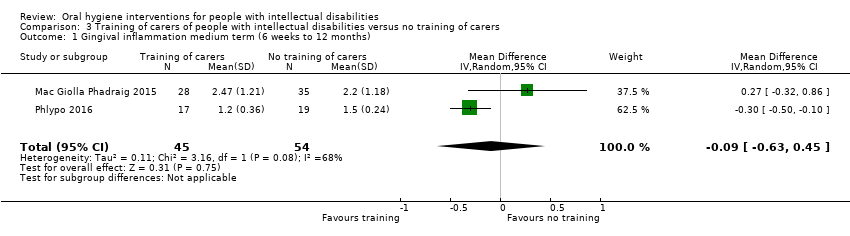
Comparison 3 Training of carers of people with intellectual disabilities versus no training of carers, Outcome 1 Gingival inflammation medium term (6 weeks to 12 months).
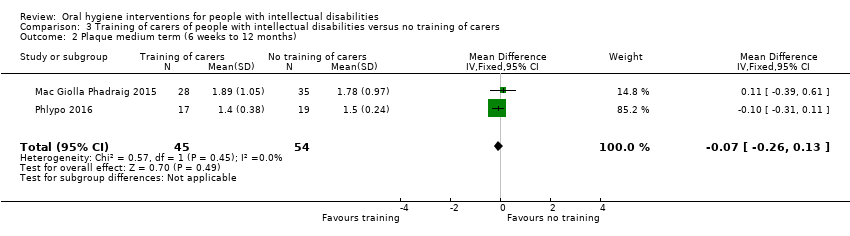
Comparison 3 Training of carers of people with intellectual disabilities versus no training of carers, Outcome 2 Plaque medium term (6 weeks to 12 months).

Comparison 3 Training of carers of people with intellectual disabilities versus no training of carers, Outcome 3 Non‐randomised study plaque short term (< 6 weeks).
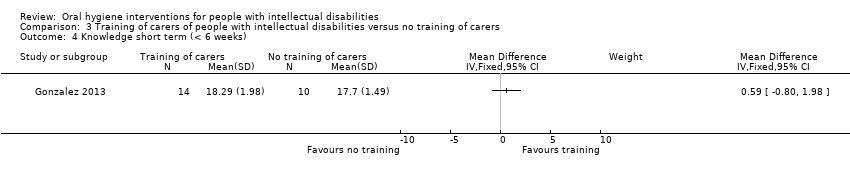
Comparison 3 Training of carers of people with intellectual disabilities versus no training of carers, Outcome 4 Knowledge short term (< 6 weeks).
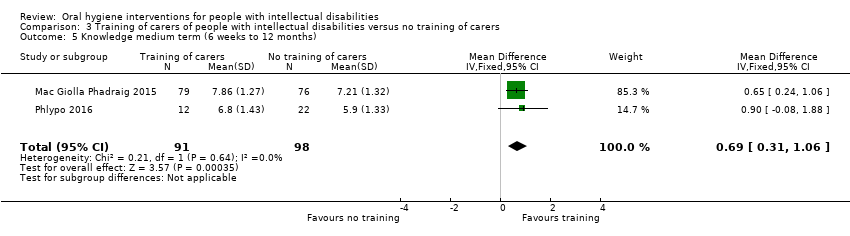
Comparison 3 Training of carers of people with intellectual disabilities versus no training of carers, Outcome 5 Knowledge medium term (6 weeks to 12 months).

Comparison 3 Training of carers of people with intellectual disabilities versus no training of carers, Outcome 6 Behaviour, attitude and self‐efficacy medium term.
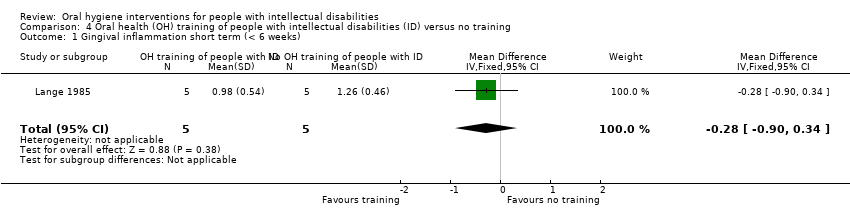
Comparison 4 Oral health (OH) training of people with intellectual disabilities (ID) versus no training, Outcome 1 Gingival inflammation short term (< 6 weeks).

Comparison 4 Oral health (OH) training of people with intellectual disabilities (ID) versus no training, Outcome 2 Plaque short term (< 6 weeks).
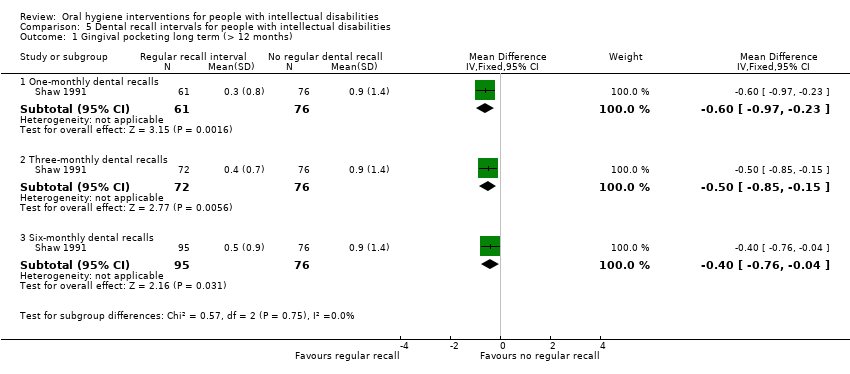
Comparison 5 Dental recall intervals for people with intellectual disabilities, Outcome 1 Gingival pocketing long term (> 12 months).
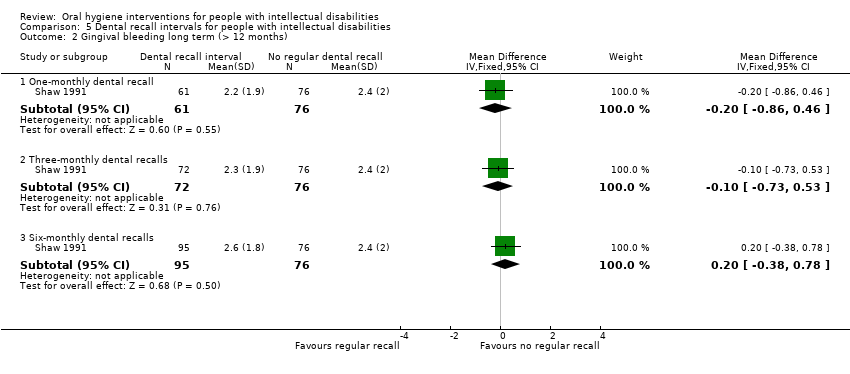
Comparison 5 Dental recall intervals for people with intellectual disabilities, Outcome 2 Gingival bleeding long term (> 12 months).
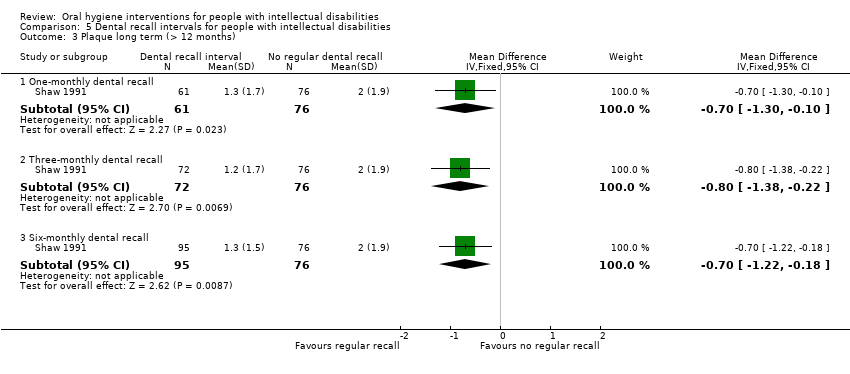
Comparison 5 Dental recall intervals for people with intellectual disabilities, Outcome 3 Plaque long term (> 12 months).
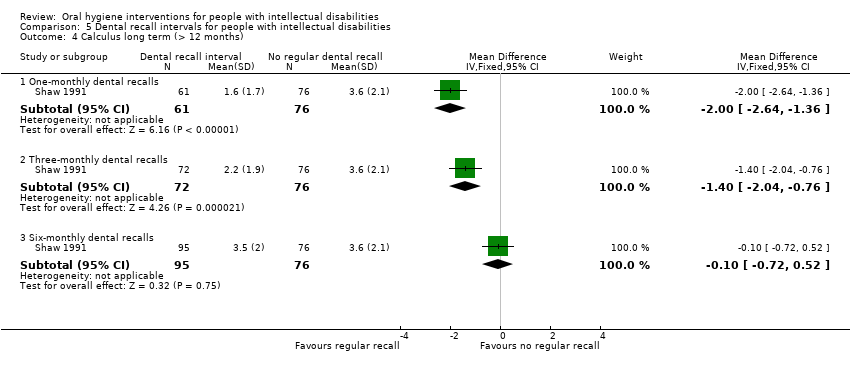
Comparison 5 Dental recall intervals for people with intellectual disabilities, Outcome 4 Calculus long term (> 12 months).

Comparison 6 Clinical photographs as motivators for oral hygiene in people with intellectual disabilities, Outcome 1 Plaque medium term (6 weeks to 12 months).
| Special manual toothbrush compared to conventional manual toothbrush for people with ID | ||||||
| Population: children and adults with mixed levels of ID Setting: home, residential, day care, school, mixed or not specified Intervention: special manual toothbrush (self, carer or carer‐assisted brushing) Comparison: conventional manual toothbrush (self, carer or carer‐assisted brushing) | ||||||
| Outcomes | Anticipated absolute effects* (95% CI) | Relative effect | Number of participants | Certainty of the evidence | Comments | |
| Risk with conventional manual toothbrush | Risk with special manual toothbrush | |||||
| Gingival inflammation short term (< 6 weeks) | Mean gingival inflammation short term was 1.21 (SD 0.85) | MD 0.10 lower | — | 25 | ⊕⊕⊝⊝ | There was no evidence of a difference between the toothbrushes in the short term. Two cross‐over RCTs (126 participants) showed similar results. |
| Gingival inflammation medium term (6 weeks to 12 months) | Mean gingival inflammation medium term was 18.3 (SD 16.2) | MD 12.4 lower | — | 18 | ⊕⊝⊝⊝ | Compared to a conventional toothbrush, a special manual toothbrush (Superbrush) may have reduced gingival inflammation medium term when used by a carer for people with ID who were reliant on other people to carry out their oral hygiene. |
| Plaque short term | Mean plaque short term was 1.02 (SD 0.85) | MD 0.2 higher | — | 25 | ⊕⊝⊝⊝ | There was no evidence of a difference between the toothbrushes in the short term. Three other short‐term RCTs (141 participants) that could not be combined in meta‐analysis, had inconsistent findings. |
| Plaque medium term (6 weeks to 12 months) | Mean plaque medium term was 0.78 (SD 0.7) | MD 0.44 lower | — | 18 | ⊕⊝⊝⊝ | There may have been no difference between the two toothbrushes in terms of plaque or the Superbrush may reduce plaque medium term.1 |
| Quality of life | Not assessed | — | ||||
| Dental caries | Not assessed | — | ||||
| Adverse effects | 1 RCT and 2 NRS did not assess or report adverse effects. 1 RCT assessed allergic reactions to a single‐use suction toothbrush at study outset and found none but this study was not summarised in this table (Table 6). 1 RCT and 1 NRS assessing the Superbrush found the size of the 3‐headed toothbrush caused some problems either when first used or for people with limited mouth opening. | — | ||||
| *The risk in the intervention group (and its 95% confidence interval) is based on the assumed risk in the comparison group and the relative effect of the intervention (and its 95% CI). CI: confidence interval; ID: intellectual disability; MD: mean difference; NRS: non‐randomised study; RCT: randomised controlled trial; SD: standard deviation. | ||||||
| GRADE Working Group grades of evidence | ||||||
| aDowngraded two levels due to imprecision: wide confidence intervals and findings were based on one study with only 25 participants. 1One NRS (24 participants) showed no evidence of a difference between toothbrushes for plaque in the medium term.. | ||||||
| Electric toothbrush compared to manual toothbrush for people with ID | ||||||
| Population: children and adults with mixed levels of ID Setting: home, residential, day care, school, mixed or not specified Intervention: electric toothbrush (self, carer or carer‐assisted brushing) Comparison: manual toothbrush (self, carer or carer‐assisted brushing) | ||||||
| Outcomes | Anticipated absolute effects* (95% CI) | Relative effect | Number of participants | Certainty of the evidence | Comments | |
| Risk with manual toothbrush | Risk with electric toothbrush | |||||
| Gingival inflammation short term (< 6 weeks) | — | — | — | 252 (4 RCTs) | ⊕⊕⊝⊝ | Four studies showed no significant differences between toothbrushes for gingival inflammation in the short term. Data from the 4 studies could not be combined in a meta‐analysis.1 |
| Gingival inflammation medium term (6 weeks to 12 months) | Mean gingival inflammation medium term ranged from 1.24 to 1.9 | MD 0.02 higher | — | 120 | ⊕⊕⊕⊝ | There was little to no difference between toothbrushes for gingival inflammation medium term. Another RCT (100 participants) showed findings in favour of the electric toothbrush (53% versus 31% improvement), but it used a more subjective assessment of GI.2 |
| Plaque short term (< 6 weeks) | — | — | — | 247 (4 RCTs) | ⊕⊝⊝⊝ | We were uncertain about the effect of using either toothbrush on plaque short term. None of the studies presented data that could be included in a meta‐analysis. 2 studies (69 participants) showed some benefit in favour of the electric toothbrush; 2 studies (178 participants) showed no difference between the two toothbrushes.3 |
| Plaque medium term (6 weeks to 12 months) | Mean plaque medium term ranged from 1.12 to 1.55 | SMD 0.29 higher | — | 120 | ⊕⊕⊝⊝ | There was no clear difference between the toothbrushes for plaque medium term. 1 RCT (100 participants) not included in the meta‐analysis, which used a subjective assessment of oral hygiene, showed an improvement in favour of the electric toothbrush.4 |
| Quality of life | Not assessed | No studies assessed quality of life changes formally, although some made comments in the results or discussion sections of the reports. | ||||
| Dental caries | Not assessed | — | ||||
| Adverse effects | Seven studies did not assess or report adverse effects and one reported no adverse effects. 1 NRS reported discomfort when brushing, difficulty controlling the force and position of the electric toothbrush, and the electric toothbrush being out of order; 2 RCTs and 1 NRS reported participants being frightened when the electric toothbrush was first used. 1 RCT reported participants being dismissed from the study, but no clear reason was provided. | — | ||||
| *The risk in the intervention group (and its 95% confidence interval) is based on the assumed risk in the comparison group and the relative effect of the intervention (and its 95% CI). CI: confidence interval; ID: intellectual disability; MD: mean difference; NRS: non‐randomised study; RCT: randomised controlled trial; SD: standard deviation; SMD: standardised mean difference. | ||||||
| GRADE Working Group grades of evidence | ||||||
| aDowngraded two levels due to study design as three studies at high risk of bias (blinding of participants and personnel was not possible in three of the studies; one study also had incomplete outcome data). 1One NRS (23 participants) similarly found no difference between toothbrushes for gingival inflammation in the short term. 2Four NRS (144 participants) had inconsistent findings at 5 to 9 months for gingival inflammation in the medium term; data not suitable for meta‐analysis. 1 NRS (23 participants) found no effect at 16 months (MD 0.00, 95% CI –0.15 to 0.15). 3One NRS (23 participants) found no difference between toothbrushes for plaque in the short term. 4Five NRS (173 participants) found broadly similar results to the meta‐analysis, showing little or no effect on plaque in the medium term. | ||||||
| Training of carers compared to no training of carers for people with ID | ||||||
| Population: people with mixed levels of ID (age range unclear) Setting: residential Intervention: training of carers Comparison: no training of carers | ||||||
| Outcomes | Anticipated absolute effects* (95% CI) | Relative effect | Number of participants | Certainty of the evidence | Comments | |
| Risk with no carer training | Risk with carer training | |||||
| Gingival inflammation short term (< 6 weeks) | Not assessed | ‐ | ||||
| Gingival inflammation medium term (6 weeks to 12 months) | Mean gingival inflammation medium term ranged from 1.2 to 2.47 | MD 0.09 lower | — | 99 | ⊕⊕⊝⊝ | Training of carers may not have made a difference to gingival inflammation. Findings for the 2 studies were inconsistent. |
| Plaque short term (< 6 weeks) | Not assessed | ‐ | ||||
| Plaque medium term (6 weeks to 12 months) | Mean plaque medium term ranged from 1.4 to 1.89 | MD 0.07 lower | — | 99 | ⊕⊕⊝⊝ | Training of carers may not have reduced the plaque levels for people with ID medium term.1 |
| Knowledge medium term (6 weeks to 12 months) | Mean knowledge medium term ranged from 6.8 to 7.86 | MD 0.69 higher | — | 189 | ⊕⊕⊝⊝ | Training of carers may have resulted in a moderate increase in oral healthcare knowledge medium term. 1 RCT (24 participants) not included in the meta‐analysis found no clear difference between groups. |
| Behaviour, attitude and self‐efficacy (BAS) medium term | Mean BAS ranged from 4.7 to 5.42 | MD 0.15 higher | — | 189 | ⊕⊝⊝⊝ | Training of carers may not have an effect on their BAS in the medium term. In the short term, 1 RCT (193 participants) assessed behaviour and reported a strong benefit for training.2 |
| Quality of life | Not assessed | No studies formally reported quality of life measures, though some studies commented on quality of life issues in the discussion and conclusion section of the reports. | ||||
| Dental caries | Not assessed | — | ||||
| Adverse effects | 1 RCT reported there were no adverse effects. The other studies did not report adverse effects. | — | ||||
| *The risk in the intervention group (and its 95% confidence interval) is based on the assumed risk in the comparison group and the relative effect of the intervention (and its 95% CI). BAS: behaviour, attitude and self‐efficacy; CI: confidence interval; ID: intellectual disability; ITS: interrupted time series; MD: mean difference; NRCT: non‐randomised controlled trial; NRS: non‐randomised study; RCT: randomised controlled trial; SD: standard deviation. | ||||||
| GRADE Working Group grades of evidence | ||||||
| aDowngraded one level due to study design as studies at high risk of bias (one study was a cluster RCT). 1One NRCT (34 participants) found plaque levels of people with ID were reduced after training of their carers, short term, particularly if carers were made accountable for their performance. 1 ITS (11 participants) found broadly consistent findings to the NRCT in the medium term. 2Two NRS (15 participants) assessing the behaviour of the carers and people with ID showed evidence in favour of training for all outcomes assessed. | ||||||
| Oral hygiene training compared to no oral hygiene training for people with ID | ||||||
| Population: children and adults with mild to profound ID Setting: residential or school Intervention: oral hygiene training (toothbrushing routine) Comparison: no oral hygiene training | ||||||
| Outcomes | Anticipated absolute effects* (95% CI) | Relative effect | Number of participants | Certainty of the evidence | Comments | |
| Risk with no oral hygiene training | Risk with oral hygiene training | |||||
| Gingival inflammation short term (< 6 weeks) | The mean gingival inflammation short term was 1.26 (SD 0.46) | MD 0.28 lower | — | 10 | ⊕⊝⊝⊝ | There was no evidence of a difference between the groups in the short term.1 |
| Gingival inflammation medium term (6 weeks to 12 months) | Not assessed | ‐ | ||||
| Plaque short term (< 6 weeks) | The mean plaque short term was 0.82 (0.24) | MD 0.47 lower | — | 10 | ⊕⊝⊝⊝ | Training of people with ID may have resulted in a moderate reduction in plaque short term. An RCT (26 participants) not included in the meta‐analysis had similar findings.1 |
| Plaque medium term (6 weeks to 12 months) | Not assessed | ‐ | ||||
| Knowledge | Not assessed | — | ||||
| Behaviour, attitude and self‐efficacy medium and long term (6 weeks to > 12 months) Assessed with: steps achieved in a toothbrushing routine Follow‐up: 100 days to 19 months | Results were not presented in a format that could be included in a meta‐analysis. | 59 (4 NRS) | ⊕⊝⊝⊝ | 3 NRS (56 participants) reported an increase in toothbrushing after training; 1 NRS (3 participants) had mixed results. | ||
| Quality of life | Not assessed | — | ||||
| Dental caries | Not assessed | — | ||||
| Adverse effects | 2 RCTs and 2 NRS reported no adverse effects. In 1 NRS, 1 participant had nausea (considered a delaying tactic by study investigators), and in another NRS, 2 participants showed sensitivity to having their mouths held open. | — | ||||
| *The risk in the intervention group (and its 95% confidence interval) is based on the assumed risk in the comparison group and the relative effect of the intervention (and its 95% CI). CI: confidence interval; ID: intellectual disability; MD: mean difference; NRS: non‐randomised study; RCT: randomised controlled trial; SD: standard deviation. | ||||||
| GRADE Working Group grades of evidence | ||||||
| aDowngraded two levels for imprecision and one for study design: based on the findings of one study at unclear risk of bias with only 10 participants and wide confidence intervals. bDowngraded three levels due to study design: based on NRS, with no control groups and all studies were at high risk of bias. 1Four NRS (59 participants) assessed toothbrushing behaviour following skills training of people with ID, 3 of which showed improved toothbrushing behaviour; no measures of gingival inflammation levels were recorded in these studies. | ||||||
| Scheduled dental recall intervals and supervised toothbrushing compared to usual care for people with ID | ||||||
| Population: adults (mean age 30.9 years) (level of ID unclear) Setting: day centre Intervention: scheduled dental visits (oral hygiene instruction, with or without scale and polish), with supervised daily toothbrushing by carers ("staff provided reminders, encouragement and motivation") Comparison: usual care ("no specific treatment") | ||||||
| Outcomes | Anticipated absolute effects* (95% CI) | Relative effect | Number of participants | Certainty of the evidence | Comments | |
| Risk with usual care | Risk with 1‐monthly dental recall intervals | |||||
| Gingival inflammation short term (< 6 weeks) | Not assessed | ‐ | ||||
| Gingival pocketing long term (> 12 months) | The mean gingival pocketing long term was 0.9 (SD 1.4) | MD 0.60 lower | — | 304 | ⊕⊕⊝⊝ | One‐monthly dental recall intervals and supervised toothbrushing may have reduced gingival pocketing long term. This was also found for the 3‐ and 6‐monthly recall intervals. Findings were broadly similar at 12 and 18 months. |
| Gingival bleeding long term (> 12 months) | The mean gingival bleeding long term was 2.4 (SD 2.0) | MD 0.20 lower | — | 304 | ⊕⊕⊝⊝ | One‐monthly dental recall intervals showed no evidence of benefit. This was also found for 3‐ and 6‐monthly recall intervals. Findings were broadly similar at 12 and 18 months. |
| Plaque short term (< 6 weeks) | Not assessed | ‐ | ||||
| Plaque long term (> 12 months) | The mean plaque long term was 2.0 (SD 1.9) | MD 0.70 lower | — | 304 | ⊕⊕⊝⊝ | 1‐monthly dental recall intervals may have reduced plaque levels long term (24 months). This was also found for 3‐monthly recall intervals, but not for 6‐monthly. Findings were broadly similar at 12 and 18 months. |
| Quality of life | Not assessed | — | ||||
| Dental caries | Not reported | The study assessed and reported dental caries using the DMFT Index at baseline but did not report assessing DMFT at any other time points. | ||||
| Adverse effects | None reported | — | ||||
| *The risk in the intervention group (and its 95% confidence interval) is based on the assumed risk in the comparison group and the relative effect of the intervention (and its 95% CI). CI: confidence interval; DMFT: Decayed, Missing or Filled Teeth; ID: intellectual disability; MD: mean difference; RCT: randomised controlled trial; SD: standard deviation; WHO: World Health Organization. | ||||||
| GRADE Working Group grades of evidence | ||||||
| aDowngraded one level for imprecision and one for study design: based on one study at unclear risk of bias, with wide confidence intervals. | ||||||
| Discussion of clinical photographs as OH motivators compared to no discussion of photographs for people with ID | ||||||
| Population: people with ID (level of ID and age unclear) Setting: day centre Intervention: discussion of clinical photographs as OH motivators and OH instruction at monthly intervals Comparison: no discussion of clinical photographs, but did receive OH instruction at monthly intervals | ||||||
| Outcomes | Anticipated absolute effects* (95% CI) | Relative effect | Number of participants | Certainty of the evidence | Comments | |
| Risk with oral hygiene instruction (OHI) only | Risk with discussion of clinical photographs plus OHI | |||||
| Gingival inflammation short term (< 6 weeks) | Not assessed | ‐ | ||||
| Gingival inflammation medium term (6 weeks to 12 months) | Not assessed | ‐ | ||||
| Plaque short term (< 6 weeks) | Not assessed | ‐ | ||||
| Plaque medium term (6 weeks to 12 months) | Mean plaque medium term was 7.4 (SD 2.0) | MD 0.1 lower | — | 29 | ⊕⊝⊝⊝ | There was no evidence of a difference in plaque levels medium term. Broadly similar findings were observed for extrinsic plaque levels. |
| Quality of life | Not assessed | — | ||||
| Dental caries | Not assessed | — | ||||
| Adverse effects | None reported | — | ||||
| *The risk in the intervention group (and its 95% confidence interval) is based on the assumed risk in the comparison group and the relative effect of the intervention (and its 95% CI). CI: confidence interval; ID: intellectual disability; MD: mean difference; OH: oral hygiene; RCT: randomised controlled trial; SD: standard deviation. | ||||||
| GRADE Working Group grades of evidence | ||||||
| aDowngraded two levels for imprecision and one for study design: single study at high risk of bias, with wide confidence intervals. | ||||||
| Daily compared to twice‐weekly or once‐weekly toothbrushing by dental students for people with ID | ||||
| Population: people aged 15 to 30 years with mixed levels of ID Setting: residential Intervention: daily toothbrushing by dental student Comparison: twice‐weekly or once‐weekly toothbrushing by dental student | ||||
| Outcomes | Impact | Number of participants | Certainty of the evidence | Comment |
| Gingival inflammation short term (< 6 weeks) | Not assessed | ‐ | ‐ | ‐ |
| Gingival inflammation medium term (6 weeks to 12 months) | Not assessed | ‐ | ‐ | ‐ |
| Plaque short term (< 6 weeks) | For people with ID whose teeth were brushed for them by dental professionals, brushing daily most likely reduced gingival inflammation more effectively than twice‐weekly and even more effectively than once‐weekly, in the short term. | 80 | ⊕⊕⊝⊝ | This study also compared electric and manual toothbrushes (findings reported above) |
| Plaque medium term (6 weeks to 12 months) | Not assessed | ‐ | ‐ | |
| Quality of life | Not assessed | — | — | — |
| Dental caries | Not assessed | — | — | — |
| Adverse effects | None reported | — | — | — |
| ID: intellectual disability; RCT: randomised controlled trial. | ||||
| GRADE Working Group grades of evidence | ||||
| aDowngraded two levels for imprecision: single small study with no standard deviation data reported. | ||||
| Toothpaste with a plaque‐disclosing agent compared to conventional toothpaste for children with ID | ||||
| Population: children aged 7 to 13 years with Down Syndrome (mild to moderate levels of ID) Setting: residential Intervention: toothpaste with a plaque‐disclosing agent Comparison: conventional toothpaste | ||||
| Outcomes | Impact | Number of participants | Certainty of the evidence | Comment |
| Gingival inflammation short term (< 6 weeks) | Using a toothpaste with a plaque‐disclosing agent may have reduced gingival inflammation slightly in the short term. | 80 | ⊕⊝⊝⊝ | Study was a non randomised cross over trial; only 2 of the 4 arms were relevant to this review. |
| Gingival inflammation medium term (6 weeks to 12 months) | Not assessed | ‐ | ‐ | ‐ |
| Plaque short term (< 6 weeks) | Using a toothpaste with a plaque‐disclosing agent may have reduced plaque levels in the short term. | 80 | ⊕⊝⊝⊝ | Study was a non randomised cross over trial; only 2 of the 4 arms were relevant to this review. |
| Plaque medium term (6 weeks to 12 months) | Not assessed | ‐ | ‐ | ‐ |
| Quality of life | Not assessed | — | — | — |
| Dental caries | Not assessed | — | — | — |
| Adverse effects | None reported | — | — | — |
| ID: intellectual disability | ||||
| GRADE Working Group grades of evidence | ||||
| aDowngraded three levels due to study design: single non‐randomised study at unclear risk of bias, with no standard deviation reported. | ||||
| Individualised care plans compared to usual care for people with ID | ||||
| Population: adults, aged 22 to 57 years with mixed levels of ID Setting: residential Intervention: individualised care plans based on a multidisciplinary assessment Comparison: usual care ‐ continued regular oral hygiene care, which was supported by a carer following institution's standard guidelines | ||||
| Outcomes | Impact | Number of participants | Certainty of the evidence | Comment |
| Gingival inflammation short term (< 6 weeks) | Not assessed | ‐ | ‐ | ‐ |
| Gingival inflammation medium term (6 weeks to 12 months) | Not assessed | ‐ | ‐ | ‐ |
| Plaque short term (< 6 weeks) | Not assessed | ‐ | ‐ | ‐ |
| Plaque medium term (6 weeks to 12 months) | The use of individualised oral care plans for people with ID may reduce plaque levels over 12 months.The "improvement differential" from baseline for the intervention group was 38% compared to 5% for the control group. | 79 | ⊕⊝⊝⊝ | NRCT |
| Quality of life | Not assessed | — | — | — |
| Dental caries | Not assessed | — | — | — |
| Adverse effects | None reported | — | — | — |
| ID: intellectual disability. | ||||
| GRADE Working Group grades of evidence | ||||
| aDowngraded three levels due to study design: non‐randomised study at high risk of bias, use of subjective assessment tool and no standard deviation data reported. | ||||
| Duration | Study | Comparison | Index | Intervention mean (SD) | Control mean (SD) | Total | Country | Comments | Summary |
| 2 weeks | Superbrush vs Oral B manual TB | PBI (scale 0–4) | Mouth score 3.55 (0.40) Surface score 7.1 (0.8) | Mouth score 4.13 (0.35) Surface score 8.25 (0.7) | 54 | Germany | Cross‐over trial. Data presented for the 2 arms combined. Surface score mean and SD obtained from author. Mouth score calculated from this data. Median presented in published article. | Mean for the PBI for the Superbrush was below that of manual TB. However, no strong evidence of difference between the 2 TB. | |
| Superbrush vs Oral B manual TB | PBI (scale 0–4) | Pooled median 12.2 Self Br 10.5 Assist Br 11.5 Other Br 14.5 | Pooled median 12.6 Self Br 10.0 Assist Br 12.5 Other Br 15.5 | 72 | Germany | Cross‐over trial. Data presented for the 2 arms combined. Pooled median data calculated from reported data. | "Patients who brushed their teeth did not achieve significant changes in PBI levels with any of the three toothbrushes (Wilcoxon test: p > 0.05)," p. 63. | ||
| 21 days | Superbrush vs standard manual brush (Oral B) | S&MG (scale 0–3) | 1.21 (0.85) | 1.31 (0.87) | 25 | Belgium | Participant numbers not clearly reported, assumed to be 25. | "No significant difference was found when the results of bleeding indices were compared between the two toothbrushes," p. 117. | |
| Assist Br: assisted brusher; Other Br: other brusher; PBI: Papillary Bleeding Index; RCT: randomised controlled trial; SD: standard deviation; Self Br: self‐brusher; TB: toothbrush. Kaschke 2005: three‐armed cross‐over trial; also compared the Teledyne Waterpik Sonic Speed electric TB, reported separately. Data for buccal and lingual surfaces, maxilla and mandible and Self Br, Assist Br and Other Br also reported. Christen 2007: three‐armed cross‐over trial; also compared the Dentacare‐Sonodont electric TB, reported separately. Median and percentile data only reported. Data presented for Self Br, Assist Br and Other Br; pooled data calculated from these data. Data for buccal and lingual surfaces, maxilla and mandible also reported. | |||||||||
| Duration | Study | Comparison | Index | Intervention mean (SD) | Control mean (SD) | Total | Country | Comments | Summary |
| 4 months | Superbrush vs Oral B manual TB | GBI (scale 0–1) | 18.3 (16.2) | 30.7 (9.5) | 18 | Germany | No calibration of assessors, participant's own dentist assessed clinical outcomes. The baseline scores were considerably lower for the intervention group (24.7 vs 32.7). | Author reported no strong evidence of a difference between the 2 toothbrushes for gingival inflammation. | |
| GBI: Gingival Bleeding Index Ainamo & Bay (0–1), 6 standard teeth, % of positive sites examined; SD: standard deviation. | |||||||||
| Duration | Study | Comparison | Index | Intervention mean (SD) | Control mean (SD) | Total | Country | Comments | Summary |
| 1 week | Superbrush vs Oral B Cross Action 35/40 manual TB | MQHPI (scale 0–5) | 1.77 (0.62) | 2.15 (0.58) | 15 | Turkey | Cross‐over trial. Data presented for the final time point only. | Strong evidence of a difference in PI between the Superbrush and Oral B Cross Action brush (P < 0.01) favouring the Superbrush. | |
| 2 weeks | Superbrush vs Oral B manual TB | MQHPI (scale 0–5) | Pooled median 27.7 | Pooled median 28.3 | 72 | Germany | Cross‐over trial. Data presented for the 2 arms combined. Median and percentile only reported. Pooled median data calculated from reported data. | No strong evidence of a difference in QH median plaque score across all participants between the 3 different toothbrushes in the final examination (Friedman test: P > 0.05), p. 55. | |
| Superbrush vs Oral B manual TB | MQHPI (scale 0–5) | Mouth score 2.98 (0.08) Surface score 35.8 (0.92) | Mouth score 3.24 (0.10)Surface score 38.9 (1.2) | 54 | Germany | Cross‐over trial. Data presented for the 2 arms combined. Surface score mean and SD obtained from author. Mouth score calculated from these data. Median presented in published article. Data for subgroups also presented. | Plaque score for the Superbrush lay below that of the conventional manual TB. The strength of the evidence was high. | ||
| 21 days | Superbrush (3‐headed) vs standard manual brush (Oral B) | S&LPI (scale 0–3) | 1.02 (0.85) | 0.82 (0.81) | 25 | Belgium | Participant numbers not clearly reported: assumed to be 25 | "No significant difference was found between the two toothbrushes in the means of day 0, 7 or 21," p. 117. | |
| Assist Br: assisted brusher; MQHPI: Modified Quigley‐Hein Plaque Index, scale of 0–5; Other Br: other brusher; PI: Plaque Index; QH: Quigley‐Hein; RCT: randomised controlled trial; S&LPI: Silness & Löe Plaque Index, scale 0–3; SD: standard deviation; Self Br: self‐brusher; TB: toothbrush. Dôgan 2004: three‐armed cross‐over trial; also compared the Braun Plaque Control 3D electric TB, reported separately. Data for age groups, surfaces and approximal plaque also reported. Christen 2007: three‐armed cross‐over trial; also compared the Dentacare‐Sonodont electric TB, reported separately. Median and percentile data only reported. Data presented for Self Br, Assist Br and Other Br, pooled data were calculated from these data. Data for buccal and lingual surfaces, maxilla and mandible also reported. Kaschke 2005: three‐armed cross‐over trial; also compared the Teledyne Waterpik Sonic Speed electric TB, reported separately. Data for buccal and lingual surfaces, maxilla and mandible and Self Br, Assist Br and Other Br also reported. Some strong evidence of differences were reported in favour of the Superbrush in some of these subgroups. | |||||||||
| Duration | Study | Comparison | Index | Intervention mean (SD) | Control mean (SD) | Total | Country | Comments | Summary |
| 4 months | Superbrush vs Oral B manual TB | SG&VD (scale 0–3) | Mouth score 0.78 (0.7) Tooth score 4.7 (4.2) | Mouth score 1.22 (0.36) Tooth score 7.3 (2.2) | 18 | Germany | Whole mouth score calculated from tooth scores. No calibration of assessors, participant's own dentist assessed clinical outcomes. The baseline score was lower for the intervention group (8.3 vs 9.2) | Author reported no strong evidence of a difference between the 2 toothbrushes for plaque (F (2,15) = 1.20), P = 0.33). Thesis p. 5. | |
| RCT: randomised controlled trial; Indices: SG&VDI: Simplified Green & Vermillion Debris Index, scale 0–18, total of 0–3 for 6 standard teeth. | |||||||||
| Duration | Study | Comparison | Index | Intervention mean | Control | Total | Country | Comments | Summary |
| 3 months | Curved‐bristle manual toothbrush (Collis Curve) vs conventional manual toothbrush | SG&VOHI (scale 0–3) | 1.25 | 1.03 | 24 | USA | SD not reported. Contact with author – data no longer available. Brushing carried out by student dental assistants. | No strong evidence of a difference between the 2 toothbrushes for the oral hygiene index (t = –0.31, P < 0.76). | |
| NRS: non‐randomised study; SD: standard deviation; SG&VOHI: Simplified Green & Vermillion Oral Hygiene Index – plaque only. | |||||||||
| Duration | Study | Comparison | Index | Intervention mean (SD) | Control mean (SD) | Total | Country | Comments | Summary |
| 90 days | Oral cleansing with single‐use suction brush vs a standard manual toothbrush | TOAS (scale 0–12) | 1.54 (1.0) | 1.99 (1.12) | 22 | USA | Both groups brushed with an additional chemical agent. A third group (not reported here) used a standard toothbrush and toothpaste. | "There was a significant main effect over time of assessment, F(2, 26)=5.89 (p < 0.01);" all groups showed improvement. Participants receiving oral hygiene with suctioning "had the greatest improvements" in oral assessment scores and greatest sustainability over time, p. 173. | |
| Oral cleansing with single‐use suction brush vs a standard manual toothbrush | TBC | 4.39 (0.63) | 4.07 (0.80) | 22 | USA | Both groups brushed with an additional chemical agent. A third group (not reported here) used a standard toothbrush and toothpaste. | No strong evidence of a difference between the 2 groups, but there was a large reduction in TBC in both groups, the suction toothbrush group reduced the TBC by almost 90%, the standard toothbrush group reduced the TBC by 81%. | ||
| Oral cleansing with single‐use suction brush vs a standard manual toothbrush | PPB (log base 10) | 0.41 (0.97) | 0.29 (0.92) | 22 | USA | Both groups brushed with an additional chemical agent. A third group (not reported here) used a standard toothbrush and toothpaste. | No significant changes in PPB between groups, all changes were reductions for pathogenic bacteria, p. 173. | ||
| PPB: potentially pathogenic bacteria; RCT: randomised controlled trial; SD: standard deviation; TBC: Total Bacteria Count; TOAS: Total Oral Assessment Score. | |||||||||
| Duration | Study | Comparison | Index | Intervention mean (SD) | Control mean (SD) | Total | Country | Comments | Summary |
| 4 months | Superbrush vs Oral B manual TB | Frequency of brushing by carer | 2.0 (0.7) | 2.2 (0.4) | 18 | Germany | Questionnaire not validated. | No strong evidence of a difference between TBs. | |
| Level of resistance by people with ID | 4.3 (3.2) | 6.0 (3.4) | 18 | Germany | Questionnaire not validated. | No strong evidence of a difference between TBs. | |||
| Experience of carer when brushing | 2.0 (1.0) | 1.3 (0.5) | 18 | Germany | Questionnaire not validated. | No strong evidence of a difference between toothbrushes "although the experiences appeared to be more positive" for the carers using the special manual TB, p. 16. | |||
| Handling of TB by carer | 2.3 (0.8) | 1.8 (1.0) | 18 | Germany | Questionnaire not validated. | No strong evidence of a difference between TB. | |||
| ID: intellectual disability; RCT: randomised controlled trial; SD: standard deviation; TB: toothbrush. | |||||||||
| Duration | Study | Comparison | Index | Intervention mean (SD) | Control mean (SD) | Total | Comments | Summary | |
| 2 weeks | Teledyne Waterpik Sonic Speed electric TB vs Oral B manual TB | PBI (scale 0–4) | Whole mouth 3.9 (0.35) Surface score 7.8 (0.7) | Whole mouth 4.3 (0.35) Surface score 8.25 (0.7) | 54 | Germany | Cross‐over trial. Data presented for the 2 arms combined. Surface score Mean and SD obtained from author. Data calculated from obtained data. Median data presented in published article. | Although there was a great reduction in inflammation for the intervention "No significance differences were found" for PBI between the 2 groups, p. 68. | |
| Dentacare‐Sonodont electric TB vs Oral B manual TB | PBI (scale 0–4) | Pooled median 12.3 Self Br 9.5 Assist Br 13.5 Other Br 14.0 | Pooled median 12.6 Self Br 10.0 Assist Br 12.5 Other Br 15.5 | 72 | Germany | Cross‐over trial. Data presented for the 2 arms combined. Pooled median data calculated from reported data. | No strong evidence of a difference in the PBI median at the final examination and at the initial examination (Friedman test: P > 0.05), p. 62. | ||
| 21 days | Daily brushing; Ronson electric TB vs Colgate‐Palmolive manual TB | B&LL&SGI (scale 0–3) | Pooled 1.24 Male: buccal 2.57, labial 2.08; female: buccal 0.14, labial 0.15 | Pooled 2.43 Male: buccal 2.07, labial 2.34; female: buccal 2.63, labial 2.65 | 20 | UK | Pooled mean calculated from reported data, no SD provided. | Both brushes seemed equally effective. "None of the other factors examined (except frequency) produced an F values approaching the 5% level of significance," p. 377. | |
| 4 weeks | Braun electric TB vs Oral B 30 manual TB | WHOGI (Scale 0 –3) | 1.7 (1.9) | 1.6 (1.7) | 106 | UK | Cross‐over trial. Data presented for the 2 arms combined. | No strong evidence of a difference in oral hygiene performance when comparing the use of electric and manual TBs. "There were no differences between the two groups. (t=0.0702, d.f. =/–52, p > 0.05)," p. 5. | |
| Assist Br: assisted brusher; B&LL&SGI: Buccal and Labial surfaces Löe & Silness: scale 0–3; Other Br: other brusher; PBI: Papillary Bleeding Index: scale 0–4; RCT: randomised controlled trial; SD: standard deviation; Self Br: self‐brusher; TB: toothbrush; WHOGI: World Health Organization Technical Report No 621 Gingival Index: scale 0–3. Christen 2007: three‐armed cross‐over trial; also compared the Superbrush, reported separately. Median and percentile data only reported. Data presented for Self Br, Assist Br and Other Br; pooled data were calculated from these data. Data for buccal and lingual surfaces, maxilla and mandible, also reported. Kaschke 2005: 3‐armed cross‐over trial; also compared the Superbrush, reported separately. Data for buccal and lingual surfaces, maxilla and mandible and Self Br, Assist Br and Other Br also reported. Swallow 1969: means presented separately for labial and buccal surfaces for males and females with no SD; the pooled means were calculated from these data. Female data at 21 days appeared skewed. Study also compared brushing once a week and twice a week, reported separately. | |||||||||
| Duration | Study | Comparison | Index | Intervention mean (SD) | Control mean (SD) | Total | Country | Comments | Summary |
| 3 months | Interplak electric TB vs Oral B 40 manual TB | L&SGI (scale 0–3) | Pooled 1.80 (0.32) Self Br 1.81 (0.31) Assist Br 1.78 (0.33) | Pooled 1.84 (0.25) Self Br 1.81 (0.28) Assist Br 1.90 (0.21) | 56 | USA | Pooled mean and SD calculated from the reported data. Cluster RCT. | No strong evidence of a difference in gingival indices between toothbrushes at 3 months. | |
| Sonicare EasyClean, Philips electric TB vs Vitis Access, Dentaid manual TB | BDL&SGI (scale 0–3) | 1.31 (0.32) | 1.24 (0.32) | 64 | Spain | Description of ID in this study appeared to include some people with an IQ > 70. | No strong evidence of a difference in gingival indices between toothbrushes at 3 months. | ||
| 4 months | Automated electric TB (Broxodent) vs conventional TB | SGR | % Improvement 53% | % Improvement 31% | 100 | USA | % Improvement calculated from the reported data. | "The automatic electric toothbrush appeared significantly superior to the conventional toothbrush in improving gingival health," p. 108. | |
| 6 months | Interplak electric TB vs Oral B 40 manual TB | L&SGI (scale 0–3) | Pooled 1.90 (0.20) Self Br 1.92 (0.16) Assist Br 1.86 (0.23) | Pooled 1.90 (0.16) Self Br 1.88 (0.20) Assist Br 1.96 (0.12) | 56 | USA | Pooled mean and SD calculated from the reported data. Cluster RCT. | No strong evidence of a difference in gingival indices between toothbrushes at 6 months. | |
| Sonicare EasyClean, Philips electric TB vs Vitis Access, Dentaid manual TB | BDL&SGI (scale 0–3) | 1.24 (0.28) | 1.19 (0.28) | 64 | Spain | Description of ID in this study appeared to include some people with an IQ > 70. | No strong evidence of a difference in gingival indices between toothbrushes at 6 months (P = 0.37), p. 5. | ||
| 12 months | Interplak electric TB vs Oral B 40 manual TB | L&SGI (scale 0–3) | Pooled 1.25 (0.47) Self Br 1.72 (0.30) Assist Br 1.72 (0.42) | Pooled 1.73 (0.61) Self Br 1.87 (0.21) Assist Br 2.0 (0.0) | 56 | USA | Pooled mean and SD calculated from the reported data. Cluster RCT. | RM analysis of variance showed the Gingival Index at 12 months was significantly associated with the toothbrush used (P = 0.017) positive for the Interplak electric TB. | |
| Assist Br: assisted brusher; BDL&SGI: Bentley & Disney (four sites per tooth in two randomly (by coin toss) selected quadrants (one in the upper jaw, one in the lower jaw, contralateral); IQ: intelligence quotient; L&SGI: Löe & Silness Gingival Index, Scale 0–3; Other Br: other brusher; RCT: randomised controlled trial; RM: repeat measure; SD: standard deviation; Self Br: self‐brusher; SGR: Subjective Gingival Rating Scale, – worse, same, better; TB: toothbrush. Kelner 1963: subjective data presented. Data also presented for frequency of brushing. Carr 1997: means and SDs presented separately for Self Br and Assist Br; the pooled means and SDs were calculated from these data for the different time points. | |||||||||
| Duration | Study | Comparison | Index | Intervention mean (SD) | Control mean (SD) | Total | Country | Comments | Summary |
| 4 weeks | Braun 3D Electric toothbrush vs Butler 411 manual toothbrush. | L&SGI (scale 0–3) | Pooled 1.55 (0.16) Unaided 1.5 (0.2), aided 1.6 (0.1) | Pooled 1.60(0.16) Unaided 1.6 (0.1), aided 1.6 (0.2) | 23 | Sweden | Pooled mean and SD calculated from the reported data. | No overall difference in Gingival Index between toothbrushes. | |
| L&SGI: Löe & Silness Gingival Index, Scale 0–3; NRS: non‐randomised study; SD: standard deviation. Bratel 1991: mean and SD presented for aided and unaided brushing, pooled mean and SDs were calculated from these data. | |||||||||
| Duration | Study | Comparison | Index | Intervention mean (SD) | Control mean (SD) | Total | Country | Comments | Summary |
| 8 weeks | Oral B Automatic Toothbrush – Arcuate actions vs manual brush (Py‐co‐pay, Hard, Lactona Jr.) | SGR (scale 1–3) | Pooled 34% Group 1: 10%; Group 2: 58% | Pooled 43% Group 1: 50%; Group 2: 36% | 37 | USA | Data presented as mean level of "obvious gingivitis" by % in a graph, pooled % for the reported data were calculated. | General reduction in gingivitis in both groups and with both brushes. The greatest reduction was in Group 1 using the electric brush. | |
| Oral B Automatic Toothbrush – Arcuate actions vs manual brush (Py‐co‐pay, Hard, Lactona Jr.) | SGR (scale 1–3) | Pooled 83% Group 1: 74%; Group 2a: 85%; Group 2b: 100% | Pooled 54% Group 1: 50%; Group 2c: 50%; Group 2d:; 65% | 38 | USA | Data presented as mean level of "obvious gingivitis" by % in a graph, Pooled % for the reported data were calculated. | There was a general reduction in both groups and both brushes, with a tendency for greater reduction in those using a standard brush. | ||
| Oral B Automatic Toothbrush – Arcuate actions vs manual brush (Py‐co‐pay, Hard, Lactona Jr.) | SGR (scale 1–3) | 84% | 74% | 43 | USA | Data presented as mean level of "obvious gingivitis" by % in a graph. | A general reduction, with no difference between brushes. | ||
| 8/10 weeks | Oral B Automatic Toothbrush – Arcuate actions vs manual brush (Py‐co‐pay, Hard, Lactona Jr.) | SGR (scale 1–3) | Pooled 57.5% Group 1: 45%; Group 2: 70% | Pooled 77% Group 1: 54%; Group 2: 100% | 70 | USA | Data presented as mean level of "obvious gingivitis" by % in a graph, pooled % for the reported data were calculated. | General reduction in gingivitis with both brushes. A greater reduction in Group 1 (participants with Down's syndrome) for both brushes. | |
| 12 weeks | Braun 3D Electric toothbrush vs Butler 411 manual toothbrush | L&SGI (scale 0–3) | Pooled 1.65 (0.10) | Pooled 1.60 (0.16) | 23 | Sweden | Pooled mean and SD calculated from the reported data. | No strong evidence of a difference in Gingival Index between the 2 brushes. Group 1 (unaided) using the electric TB brush was the only subgroup with strong evidence of improvement from baseline at 12 weeks (P < 0.01), p. 25. | |
| 20 weeks | Oral B Automatic Toothbrush – Arcuate actions vs manual brush (Py‐co‐pay, Hard, Lactona Jr.) | SGR (scale 1–3) | Pooled 100% Group 1: 100%; Group 2a: 100%; Group 2b: 100% | Pooled 75% Group 1: 60%; Group 2a: 85%; Group 2b: 85% | 36 | USA | Data presented as mean level of "obvious gingivitis" by % in a graph, Pooled % for the reported data were calculated. | Levels of observable gingivitis regressed towards baseline levels, with slightly less regression in the those using the standard toothbrush. | |
| Oral B Automatic Toothbrush – Arcuate actions vs manual brush (Py‐co‐pay, Hard, Lactona Jr.) | SGR (scale 1‐3) | 100% | 100% | 42 | USA | Data presented as mean level of "obvious gingivitis" by % in a graph. | Regression to baseline levels of gingivitis in both groups, although a "decrease in severity" was noted. No difference between the brushes. | ||
| 21/28 weeks | Oral B Automatic Toothbrush – Arcuate actions vs manual brush (Py‐co‐pay, Hard, Lactona Jr.) | SGR (scale 1–3) | Pooled 53.5% Group 1: 37%; Group 2: 70% | Pooled 85% Group 1: 70%; Group 2: 100% | 72 | USA | Data presented as mean level of "obvious gingivitis" by % in a graph, Pooled % for the reported data were calculated. | The reduction in obvious gingivitis seen at 11 weeks was maintained for both Group 1 (Down's syndrome) and Group 2 (IQ < 20) using the electric TB at this time point. Both groups using the manual TB regressed to baseline levels. | |
| 34 weeks | Oral B Automatic Toothbrush – Arcuate actions vs manual brush (Py‐co‐pay, Hard, Lactona Jr.) | SGR (scale 1–3) | Pooled 42.5% Group 1: 40%; Group 2: 45% | Pooled 40% Group 1: 30%; Group 2: 50% | 36 | USA | Data presented as mean level of "obvious gingivitis" by % in a graph, Pooled % for the reported data were calculated. | Some reduction in gingivitis was maintained from baseline in both groups. No difference found between the 2 brushes. | |
| L&SGI: Löe & Silness Gingival Index, Scale 0–3; NRS: non‐randomised study; SD: standard deviation; SGR: Subjective Gingival Rating, measure of "periodontal involvement;" "obvious signs of gingivitis;" "decrease in severity" and "absence of clinical signs of gingivitis." "Obvious signs" and "decrease in severity" were combined on the graph. IQ: intelligence quotient; TB: toothbrush. Group 1: unaided; Group 2: aided. Gertenrich 1967b: data presented as % difference separately for two distinct ID groups (Group 1: Down's syndrome; Group 2: intelligence quotient (IQ): ≤ 20) the pooled % differences were calculated from these data. All teeth were brushed by attendants. Gertenrich 1967c: data presented as % difference separately for two distinct groups with ID (Group 1: hydrocephaly and seizure unit; Group 2: paediatric unit); the pooled % differences were calculated from these data. All teeth were brushed by attendants. Gertenrich 1967a: in Group 1 (people with cerebral palsy with IQ 30–95), all teeth were brushed by attendants. In Group 2 ("trainable patients" with IQ 30–50), teeth of half the participants were brushed by attendants (2a and 2c), the other half self‐brushed (2b and 2d). Gertenrich 1967d: all participants were self‐brushers with supervision and assistance from the attendants. Bratel 1991: mean and SD presented for unaided brushing (Group 1), aided brushing (Group 2), and pooled mean and SDs were calculated from these data. Wear and tear on toothbrushes was reported as having no difference, no data provided. Participants in the intervention group preferred the electric toothbrush, no data provided for the control group. | |||||||||
| Duration | Study | Comparison | Index | Intervention mean (SD) | Control mean (SD) | Total | Country | Comments | Summary |
| 16 months | Braun 3D Electric toothbrush vs Butler 411 manual toothbrush | L&SGI (scale 0–3) | Pooled 1.75 (0.16) | Pooled 1.70 (0.20) | 23 | Sweden | Data presented for aided and unaided with SD, overall pooled mean and SD calculated from the reported data. | No strong evidence of a difference in gingivitis between the brushes. The unaided electric TB subgroup showed greater improvement at 16 months (P < 0.05). The aided manual TB subgroup showed greater deterioration at 16 months (P < 0.01). | |
| Group 1: unaided; Group 2: aided; L&SGI: Löe & Silness Gingival Index, Scale 0–3; NRS: non‐randomised study; SD: standard deviation; TB: toothbrush. Bratel 1991: mean and SD presented for unaided (Group 1) and aided (Group 2) brushing; pooled mean and SDs were calculated from these data. | |||||||||
| Duration | Study | Comparison | Index | Intervention mean (SD) | Control mean (SD) | Total | Country | Comments | Summary |
| 1 week | Braun Plaque Control 3D electric TB vs Oral B Cross Action 35/40 manual TB | MQHPI (scale 0–5) | 1.54 (0.71) | 2.15 (0.58) | 15 | Turkey | Cross‐over trial. Data presented for the 2 arms separately at the final examination. Participant number at baseline unclear: assumed to be the same as at final time point. | Strong evidence of a difference in the Plaque Index between the Braun 3D electric TB and Oral B Cross Action TB (P < 0.001) in favour of the electric TB. | |
| 2 weeks | Dentacare‐Sonodont electric TB vs Oral B manual TB | MQHPI (scale 0–5) | Pooled median 25.8 | Pooled median 28.3 | 72 | Germany | Cross‐over trial. Data presented for the 2 arms combined. Pooled median data calculated from reported data. | No strong evidence of a difference in the QH median across all participants between the 3 different toothbrushes in the final examination (Friedman test: P > 0.05), p. 55. | |
| Teledyne Waterpik Sonic Speed electric TB vs Oral B manual TB | MQHPI (scale 0–5) | Whole mouth 3.1 (0.09) Surface score 36.1(1.2) | Whole mouth 3.25 (0.10)Surface score 38.9 (1.9) | 54 | Germany | Cross‐over trial. Data presented for the 2 arms combined. Surface score Mean and SD obtained from author. Data calculated from tooth surface scores. Median presented in published article. | Strong evidence that the mean Plaque Index for the Teledyne Waterpik was lower than the Oral B manual toothbrush (P < 0.05), p. 68. | ||
| 4 weeks | Braun electric TB vs Oral B 30 manual TB | S&LPI (scale 0–3) | Total mouth 0.59 (0.26) Surface score 14.1 (6.2) | Total mouth 0.57 (0.2) Surface score 13.6 (4.7) | 106 | UK | Cross‐over trial. Data presented for the 2 arms combined. Data calculated from tooth surface scores. | No strong evidence of a difference in oral hygiene performance when comparing the use of electric and manual TBs. "There was no sig. diff between the groups (t=0.833, d.f.52, p > 0.05)," p. 5. | |
| Assist Br: assisted brusher; MQHPI: Modified Quigley‐Hein Plaque Index, scale 0–5; Other Br: other brusher; QH: Quigley‐Hein; RCT: randomised controlled trial; S&LPI: Silness & Löe Plaque Index, scale 0–3; SD: standard deviation; Self Br: self‐brusher; TB: toothbrush. Dôgan 2004: three‐armed cross‐over trial; also compared the Superbrush, reported separately. Data presented were for the final examination, number of participants were adjusted accordingly. Data for age groups and surfaces also reported. Christen 2007: three‐armed cross‐over trial; also compared the Superbrush, reported separately. Median and percentile data only reported. Data presented for Self Br, Assist Br and Other Br, pooled data were calculated from these data. Data for buccal and lingual surfaces, maxilla and mandible also reported. Kaschke 2005: three‐armed cross‐over trial; also compared the Superbrush, reported separately. Data for buccal and lingual surfaces, maxilla and mandible and Self Br, Assist Br and Other Br also reported. Shaw 1983: two‐armed cross‐over trial. Data presented for tooth surfaces with SD, mean total mouth score and SD calculated. | |||||||||
| Duration | Study | Comparison | Index | Intervention mean (SD) | Control mean (SD) | Total | Country | Comments | Summary |
| 3 months | Interplak electric TB vs Oral B 40 manual TB | SG&VDI (scale 0–3) | Pooled 1.31 (0.57) | Pooled 1.21 (0.68) | 56 | USA | Pooled mean and SD calculated from reported data. Cluster RCT. | No strong evidence of a difference in plaque levels between the tooth brushes at 3 months. | |
| Sonicare EasyClean, Philips electric TB vs Vitis Access, Dentaid manual TB | BDS&LPI (scale 0–3) | 1.02 (0.33) | 1.12 (0.33) | 64 | Spain | The description of ID in this study appeared to include some people with an IQ > 70. | No strong evidence of a difference in plaque levels between the toothbrushes at 3 months. | ||
| 4 months | Automated electric TB (Broxodent) vs conventional TB | SOHR | % improvement 27% | % improvement 18% | 100 | USA | % improvement calculated from the reported data. | "The automatic electric toothbrush appeared significantly superior to the conventional toothbrush in improving oral hygiene." | |
| 6 months | Interplak electric TB vs Oral B 40 manual TB | SG&VDI (scale 0–3) | Pooled 1.55 (0.67) | Pooled 1.34 (0.41) | 56 | USA | Pooled mean and SD calculated from reported data. Cluster RCT. | No strong evidence of a difference in plaque levels between the tooth brushes at 6 months. | |
| Sonicare EasyClean, Philips electric TB vs Vitis Access, Dentaid manual TB | BDS&LPI (scale 0–3) | 1.12 (0.35) | 1.04 (0.35) | 64 | Spain | The description of ID in this study appeared to include some people with an IQ > 70. | No strong evidence of a difference in plaque levels between toothbrushes at 6 months (P = 0.87), p. 4. | ||
| 12 months | Interplak electric TB vs Oral B 40 manual TB | SG&VDI (scale 0–3) | Pooled 1.35 (0.57) | Pooled 1.49 (0.51) | 56 | USA | Pooled mean and SD calculated from reported data. Cluster RCT. | No reported strong evidence of a difference in plaque levels between tooth brushes at 12 months. | |
| Assist Br: assisted brusher; BDS&LPI: Bentley & Disney Modified Silness & Löe Plaque Index, scale 0–3; ID: intellectual disability; IQ: intelligence quotient; RCT: randomised controlled trial; SD: standard deviation; Self Br: self‐brusher; SG&VDI: Simplified Green & Vermillion Debris Index, scale 0–3; SOHR: Subjective Oral Hygiene Rating, scale poor, fair, good; TB: toothbrush. Kelner 1963: subjective data presented, % improvement has been calculated from the differences between the combined fair and good ratings pre and post. Data also presented by age groups (aged 4–14 years, 15–32 years). Carr 1997: means and SDs presented separately for Self Br and Assist Br, the pooled means and SDs were calculated from these data for the different time points. Some differences noted between Self Br and Assist Br. "There was a marginally significant difference in the pattern of debris index across time for the two brushing assistance status groups (p = 0.054)," p. 135. Garcia‐Carrillo 2016 reported the mean IQ as 60.6, ranging between 44 and 87. | |||||||||
| Duration | Study | Comparison | Index | Intervention mean (SD) | Control mean (SD) | Total | Country | Comments | Summary |
| 4 weeks | Braun 3D Electric toothbrush vs Butler 411 manual toothbrush | S&LPI (scale 0–3) | Pooled 1.5 (0.3) Unaided 0.8 (0.3); aided 1.3 (0.5) | Pooled 1.5 (0.35) Unaided 1.1 (0.4); aided 1.0 (0.3) | 23 | Sweden | Pooled mean and SD calculated from the reported data. | No overall difference in Plaque Index between toothbrushes. | |
| NRS: non‐randomised study; S&LPI: Silness & Löe Plaque Index, Scale 0–3; SD: standard deviation. Bratel 1991: mean and SD presented for aided and unaided brushing, pooled mean and SDs were calculated from these data. | |||||||||
| Duration | Study | Comparison | Index | Intervention mean (SD) | Control mean (SD) | Total | Country | Comments | Summary |
| 0–8/10 weeks | Oral B Automatic Toothbrush – Arcuate actions vs manual brush (Py‐co‐pay, Hard, Lactona Jr.) | SOHR (scale 1–4) | Pooled MD 0.75 (0.64) | Pooled MD 0.59 (0.91) | 55 | USA | Pooled mean difference and SD calculated from the reported data. | The results showed that both groups reduced plaque levels during the supervised brushing period, with the electric TB being "somewhat better." | |
| 0–8 weeks | Oral B Automatic Toothbrush – Arcuate actions vs manual brush (Py‐co‐pay, Hard, Lactona Jr.) | SOHR (scale 1–4) | Pooled MD 1.26 (0.50) | Pooled MD 1.45 (0.73) | 37 | USA | Pooled MD and SD calculated from the reported data. | An improvement in oral hygiene in both ID groups and with both brushes (P 0.05–0.001). No strong evidence of a difference in oral hygiene between the 2 brushes. | |
| 0–8 weeks | Oral B Automatic Toothbrush – Arcuate actions vs manual brush (Py‐co‐pay, Hard, Lactona Jr.) | SOHR (scale 1–4) | Group 1 MD 2.21 (0.60) | Group 1 MD 1.72 (0.55) | Group 1: 15 | USA | MD and SD reported for Group 1. Mean square difference was reported for Group 2. Type of brush – mean Sq (F) 2.67 (10.35). Author reports raw data no longer available. | A reduction in plaque levels in both ID groups and with both brushes (P 0.05–0.001). No strong evidence of a difference between the 2 brushes. | |
| 0–8 weeks | Oral B Automatic Toothbrush – Arcuate actions vs manual brush (Py‐co‐pay, Hard, Lactona Jr.) | SOHR (scale 1–4) | MD 1.36 (0.88) | MD 1.33 (0.58) | 43 | USA | MD presented in this study. | There was an improvement in oral health with both brushes (P = 0.001) but no strong evidence of a difference in oral hygiene between the 2 brushes. | |
| 12 weeks | Braun 3D Electric toothbrush vs Butler 411 manual toothbrush. | S&LPI (scale 0–3) | Pooled 1.10 (0.14) | Pooled 1.11 (0.30) | 23 | Sweden | Pooled mean and SD calculated from the reported data. | Some strong evidence of a difference in subgroups (manual aided (P < 0.01) and electric unaided (P < 0.05); however, no strong overall difference in Plaque Index between toothbrushes. | |
| 8–20 weeks | Oral B Automatic Toothbrush – Arcuate actions vs manual brush (Py‐co‐pay, Hard, Lactona Jr.) | SOHR (scale 1–4) | Group 1: –0.71 (0.59) | Group 1: –0.79 (0.65) | 14 | USA | MD and SD reported for Group 1. Mean square difference was reported for Group 2. Type of brush – mean Sq (F) 1.05 (1.54), "not a significant change". Author reported raw data no longer available. | No strong evidence of a difference in oral hygiene between the 2 toothbrushes at this time point. "There was a significant regression in oral hygiene in both groups" at this time point. p. 158. | |
| 8–20 weeks | Oral B Automatic Toothbrush – Arcuate actions vs manual brush (Py‐co‐pay, Hard, Lactona Jr.) | SOHR (scale 1–4) | –0.57 (0.54) | –0.88 (0.65) | 42 | USA | MD presented in this study. | A slight regression in the improvements made in oral hygiene with both the electric and manual toothbrushes (P = 0.001), no strong evidence of a difference in oral hygiene between the 2 brushes. | |
| 10–28 weeks | Oral B Automatic Toothbrush – Arcuate actions vs manual brush (Py‐co‐pay, Hard, Lactona Jr.) | SOHR (scale 1–4) | Group 1: 0.24 (0.55) | Group 1: 0.03 (1.37) | 52 | USA | MD presented in this study for Group 1 only. Group 2 control joined Group 2 intervention after week 8. | No strong evidence of a difference in oral hygiene between the 2 brushes at this time point. | |
| 20–34 weeks | Oral B Automatic Toothbrush – Arcuate actions vs manual brush (Py‐co‐pay, Hard, Lactona Jr.) | SOHR (scale 1–4) | Pooled 0.36 (0.49) | Pooled 0.69 (0.47) | 36 | USA | Pooled MD and SD calculated from the reported data. | Strong evidence of an improvement in oral hygiene in Group 2 in both the electric and manual toothbrushes (P = 0.05). No strong evidence of an improvement in either brush in Group 1. | |
| MD: mean difference; NRS: non‐randomised study; S&LPI: Silness & Löe Plaque Index, scale 0–3; SD: standard deviation; SOHR: Subjective Oral Hygiene Rating (good, fair, poor and very poor), scale 1–4. Gertenrich 1967b: means and SDs presented separately for two distinct groups with ID (Group 1: Down's syndrome; Group 2: intelligence quotient (IQ); ≤ 20), the pooled mean and SD were calculated from these data. All participants' teeth were brushed by attendants. "Although the results obtained using the automatic units in a controlled regime were more stable and generally some what better (Figure 1) compared to the results with the hand brushing on a controlled regime, it is clear that these added benefits can vanish soon after the controlled regime is discontinued," p. 148. Gertenrich 1967c: means and SDs presented separately for two distinct ID groups (Group 1: hydrocephaly and seizure unit; Group 2: paediatric unit) the pooled mean and SD were calculated from these data. All participants' teeth were brushed by attendants. Gertenrich 1967a: two distinct groups with ID (Group 1: participants with cerebral palsy with IQ 30–95; Group 2 "trainable patients" with IQ 30–50). In Group 1, all were brushed by attendants. In Group 2, half the participants were brushed by attendants the other half self‐brushed. In Group 2, "The most significant improvement occurred in the group that was brushed by attendants using the automated toothbrush," p. 157. Gertenrich 1967d: all participants were self‐brushers with supervision and assistance from the attendants. Bratel 1991: mean and SD presented for aided and unaided brushing, pooled mean and SDs were calculated from these data. | |||||||||
| Duration | Study | Comparison | Index | Intervention mean/SD | Control mean/SD | Total | Country | Comments | Summary |
| 16 months | Braun 3D Electric toothbrush vs Butler 411 manual toothbrush | S&LPI (scale 0–3) | Pooled 1.30 (0.35) | Pooled 1.40 (0.30) | 23 | Sweden | Pooled mean and SD calculated from the reported data. | "No significant changes concerning plaque index were found in or between groups after 16 months," p. 6. | |
| NRS: non‐randomised study; S&LPI: Silness & Löe Plaque Index, scale 0–3; SD: standard deviation. Bratel 1991: mean and SD presented for aided and unaided brushing; pooled mean and SDs were calculated from these data. | |||||||||
| Duration | Study | Comparison | Index | Intervention Mean (SD) | Control Mean (SD) | Total No. | Country | Comments | Summary |
| 4 months | Automated electric TB (Broxodent) vs conventional TB | SCR | % Improvement 13% | % Improvement 10% | 100 | USA | % Improvement calculated from the reported data. | "The automatic electric toothbrush appeared significantly superior to the conventional toothbrush in improving deposits," p. 108. | |
| 6 months | Sonicare EasyClean, Philips electric TB vs Vitis Access, Dentaid manual TB | BDCI (scale 0–1) | 0.18 (0.12) | 0.16 (0.12) | 64 | Spain | The description of ID in this study appeared to include some people with an IQ > 70. | No strong evidence of a difference in the effect of toothbrush group on the Calculus iIndex (P = 0.40). | |
| 6 months | Interplak electric TB vs Oral B 40 manual TB. | SG&VCI (scale 0–3) | Pooled 0.78 (0.39) | Pooled 0.90 (0.47) | 56 | USA | Pooled mean and SD calculated from the reported data. Cluster RCT | No evidence of a difference between groups for the Calculus Index. | |
| 12 months | Interplak electric TB vs Oral B 40 manual TB. | SG&VCI (scale 0–3) | Pooled 0.76 (0.50) | Pooled 0.93 (0.40) | 56 | USA | Pooled mean and SD calculated from the reported data. Cluster RCT. | No evidence of a difference between groups could be found for the Calculus Index. | |
| Assist Br: assisted brusher; BDCI: Bentley & Disney Calculus Index, present or absent; ID: intellectual disability; IQ: intelligence quotient; RCT: randomised controlled trial; SD: standard deviation; SCR: Subjective Calculus Rating – none, moderate, extreme; Self Br: self‐brusher; SG&VCI: Simplified Green & Vermillion Calculus Index, scale 0–3. Kelner 1963: subjective data presented; the term 'deposits' was described as "the presence and amount of stain, soft and hard deposits," p. 102. % improvement calculated from the differences between the combined 'extreme' ratings pre and post. Data also presented by age groups (aged 4–14 years, 15–32 years). Carr 1997: means and SDs presented separately for Self Br and Assist Br; the pooled means and SDs were calculated from these data for the different time points. | |||||||||
| Duration | Study | Comparison | Index | Intervention (yes/no) | Control (yes/no) | Number of participants | Country | Comments | Summary |
| 16 months | Braun 3D Electric toothbrush vs Butler 411 manual toothbrush | SE (yes/no) | Pooled 4/8 | Pooled 3/7 | 23 | Sweden | Data calculated for pooled aided and unaided participants for each group. | No evidence of a difference between the groups. | |
| SE: self‐efficacy: "Do you find it difficult to brush your patient's teeth?" | |||||||||
| Duration | Study | Comparison | Index | Intervention mean (SD) | Control mean (SD) | Total | Country | Comments | Summary |
| 8 weeks | Carers provided with an Information booklet and information session with practical skills. | MGI (scale 0–3) | 1.2 (0.36) | 1.5 (0.24) | 36 | Belgium | MD data were reported; intervention 0.1 (SD 0.61); control 0.003 (SD 0.32) | No strong evidence of a difference was found in Gingival Index between the intervention and control group pre‐ and post‐test. (P = 0.14), However, when the individual post‐test data were considered, there was strong evidence of a difference (P = 0.02) in Gingival Index between the intervention and control group, p. 15. | |
| 6–9 months | Staff received training via a pyramidal training programme vs no training. | LMGI (scale 0–4) | 2.47 (1.21) | 2.20 (1.18) | 63 | Ireland | — | "The difference in mean MGI and PI between groups was not statistically significant (p > 0.05, ANCOVA)," p. 95. "In this instance distal outcomes such as residents oral health and hygiene did not improve in the presence of proximal improvements in oral health‐related knowledge, attitudes and self‐efficacy, and reported behaviours of carers," p. 96. | |
| ANCOVA: analysis of covariance; LMGI: Lobene Modified Gingival Index (non‐invasive); MD: mean difference; MGI: Modified Silness & Löe on buccal and lingual surfaces of 6 standard teeth; PI: Plaque Index; RCT: randomised controlled trial; SD: standard deviation. | |||||||||
| Duration | Study | Comparison | Index | Intervention mean (SD) | Control mean (SD) | Total | Country | Comments | Summary |
| 8 weeks | Carers provided with an Information booklet and information session with practical skills | MPI (scale 0–3) | 1.4 (0.38) | 1.5 (0.24) | 36 | Belgium | MD also reported (P = 0.50) | No strong evidence of a difference in MPI (P = 0.35), p. 15. | |
| 6–9 months | Staff received training via a pyramidal training programme on oral health and oral hygiene vs no training | MPI (scale 0–3) | 1.89 (1.05) | 1.78 (0.97) | 63 | Ireland | Brushing was carried out equally by the people with ID and the staff. | "The difference in mean MGI and PI between groups was not statistically significant (p > 0.05, ANCOVA)," p. 95. | |
| ANCOVA: analysis of covariance; ID: intellectual disability; MD: mean difference; MPI: Modified Silness & Löe Plaque Index (6 standard teeth, no probe used, surfaces visible to the researcher); RCT: randomised controlled trial; SD: standard deviation. | |||||||||
| Duration | Study | Comparison | Index | Intervention mean (SD) | Control mean (SD) | Total | Country | Comments | Summary |
| 21 days | Training of carers with and without accountability (Group 1 + Group 2) vs no training (Group 3) | MRPDI (scale 0–3) | Pooled data 1.09 (0.26) | 1.78 (0.45) | 34 | USA | Pooled mean and SD calculated from reported data for Group 1 and Group 2. | The Plaque Index for Group 1 (with accountability) was lower than that of Group 2 (without accountability) (P = 0.004) and the control group (P = 0.0001). | |
| Training of carers with accountability (Group 1) vs training without (Group 2) accountability | MRPDI (scale 0–3) | 0.23 (0.02) | 2.12 (0.37) | 24 | USA | SD calculated from reported data for Group 1 and Group 2. | "Fisher's LSD indicted significantly lower plaque indexes for experimental Group I vs Group 2 (p=.00001)," p. 208. | ||
| LSD: Least Significant Difference; MRPDI: Modified Ramfjord Periodontal Disease index – plaque only; SD: standard deviation. Lange 2000: mean and standard error presented separately for "with accountability" (Group 1) and "without accountability" (Group 2) of trainers, and for control (Group 3); SDs calculated from these data, mean and SD pooled for Group 1 and Group 2 in Comparison 1 and compared in Comparison 2. | |||||||||
| Duration | Study | Comparison | Index | Intervention mean | Control mean | Total | Country | Comments | Summary |
| 4–5 months | Effect of knowledge acquisition on carers behaviour and their clients oral hygiene behaviour | SOHI (scale 0–3) | Range 1.6–0.3 | N/A | 11 | USA | Data in published article unclear. Multiple attempts to contact authors failed. | "Improvement from baseline through the coaching phase of from 18.89% to 72.5%," p. 43. | |
| N/A: not available; NRS: non‐randomised study; SOHI: Simplified Green & Vermillion Oral Hygiene Index, debris only, scale 0–3. | |||||||||
| Duration | Study | Comparison | Index | Intervention mean (SD) | Control mean (SD) | Total | Country | Comments | Summary |
| 90 minutes | Oral health lecture with hands on training (90 minutes) vs oral health discussion (30 minutes) | Knowledge and comprehension (scale 0–1 for 20 questions) | 18.29 (1.98) MD 0.061 (0.086) | 17.7 (1.49) MD 0.035 (0.094) | 24 | USA | MD reported. Assessment was immediately pre‐ and postintervention. | Both groups improved their knowledge from baseline; however, there was no significant difference between the groups. | |
| 8 weeks | Carers provided with an information booklet and information session with practical skills | Knowledge (scale 0–1 for 10 questions) | 6.8 (1.43) | 5.9 (1.33) | 34 | Belgium | Subgroup analyses reported. | Post‐test, overall no strong evidence of differences were reported in K‐index scores between and within groups, p. 6. | |
| 6.5–11 months | Staff received training via a pyramidal training programme vs no training | Knowledge (scale 0–1 for 10 questions) | 7.86 (1.27) | 7.21 (1.32) | 155 | Ireland | Cluster RCT | Strong evidence of a difference in favour of the intervention was reported (P = 0.002). | |
| MD: mean difference; RCT: randomised controlled group; SD: standard deviation. Gonzalez 2013: "Both groups show an increase in scores, however, the experimental group shows almost twice the increase as the control group (0.061 vs 0.035). The standard deviation of both of these groups is fairly large (around 0.09)," p. 296. Mean and SD calculated from individual data provided (Table 2, p. 296). Phlypo 2016: subgroup analysis of those in the intervention group who read the information booklet compared to those in the control group who did not showed strong evidence of an improvement in knowledge (P = 0.05). Mac Giolla Phadraig 2015: "Using independent‐samples t‐test, a significant difference between control and intervention is noted for K Index" (P = 0.002), p. 188 and Table 6, p. 189. The level of significance was adjusted to P = 0.026, using the approximate false discovery rate. Indices: multiple‐choice questionnaires designed specifically for the studies for Gonzalez 2013 and Mac Giolla Phadraig 2015. Phlypo 2016 used the questionnaire used in Mac Giolla Phadraig 2015. | |||||||||
| Duration | Study | Comparison | Index | Intervention mean (SD) | Control mean (SD) | Total | Country | Comments | Summary |
| 8 weeks | Carers provided with an Information booklet and information session with practical skills | BAS (14 questions) | 4.7 (1.72) | 5.2 (1.49) | 34 | Belgium | Subgroup analyses was reported on those who read the information booklet. | Post‐test, overall no strong evidence of differences were found in BAS scores between and within groups (P = 0.38), p. 6. | |
| 8–11 months | Staff received training via a pyramidal training programme vs no training | BAS (14 questions) | 5.42 (1.51) | 4.9 (1.55) | 155 | Ireland | Level of significance adjusted to P = 0.028, using the approximate false discovery rate. | "There was no difference in BAS scale scores (p = 0.040) between control and intervention at post‐test," p. 188. | |
| BAS: behaviour (rating of –2 or +2) 4 questions, attitude (rating of –2, –1, 1, 2) 5 questions, self‐efficacy (rating of –2, –1, 1, 2) 5 questions; RCT: randomised controlled trial; SD: standard deviation. | |||||||||
| Duration | Study | Comparison | Index | Intervention % | Control % | Total | Country | Comments | Summary |
| 4 weeks | Training of carers vs no training of carers | Pre and post survey of carers | 1. 61.10% 2. 70.40% 3. 54.10% 4. 78.60% 5. 98.90% | 1. 25.50% 2. 17.90% 3. 2.10% 4. 29.50% 5. 64.20% | 193 | Germany | 3‐headed toothbrush (Superbrush) used in this study. | Strong evidence of a difference in self‐reported behaviour from baseline in the intervention group (P < 0.01). | |
| RCT: randomised controlled trial. Olmos 2016: changes in behaviour assessed: 1. use of a special toothbrush, 2. use of fluoride toothpaste, 3. application of fluoride weekly, 4. toothbrushing after breakfast, and 5. duration of toothbrushing. | |||||||||
| Duration | Study | Comparison | Index | Intervention mean (SD) | Control mean (SD) | Total | Country | Comments | Summary |
| 100 days | Training of carers to assist people with ID to brush their teeth using verbal instruction, physical guidance, rewards and self‐management procedures | Carers' use of training | MD 44% on average (Increase) | N/A | 4 | USA | % MDs reported narratively. 2 other life skills were also taught to other residents by the staff in this study. | General increases in correct use of all assistance techniques during training; physical assistance, verbal instruction and rewards. All staff used all types of assistance correctly on average > 94% during the maintenance phase, p. 404. | |
| Training of carers to assist people with ID to brush their teeth using verbal instruction, physical guidance, rewards and self‐management procedures | Level of assistance with toothbrushing needed by person with ID | MD physical assistance 15.5% (reduction) self‐initiation "upward trend" | N/A | 4 | USA | 2 other life skills were also taught to other residents by the staff in this study. | Need for physical assistance – Baseline 47% – 60%, reduced to 38% at end of training. Verbal Instruction was inconsistent at end of training. 'Upward trends' in self‐initiated behaviour (varied by resident), p. 404. | ||
| 4–5 months | Effect of knowledge acquisition on carers' behaviour | Caregivers' presence (yes/no) during the brushing session | MD 37–89% (increase) | N/A | 11 | USA | Data in Figure 1 presented unclearly in published article. Multiple attempts to contact authors failed. Data presented as a mean for each phase of the training (classroom sessions and coaching sessions) in the text. | "The phase mean for caregiver presence during oral hygiene sessions was 100% for all clients after the coaching phase," p. 42. | |
| Duration of brushing | Seconds spent brushing | MD 484% (increase) | N/A | 11 | USA | Data presented in Figure 1 unclear in published article. Multiple attempts to contact authors failed. | Duration of brushing increased from a phase mean of 20.5–73.8 seconds at baseline to 57.9–215.4 seconds after coaching, p. 42. | ||
| Carers perception of client's aptitudes | Social Validation Questionnaire (scale 0–6) | MD 0.0–0.75 | N/A | 11 | USA | — | "The average scores showed only a slight increase," p. 43. | ||
| ID: intellectual disability; N/A: not available; NRS: non‐randomised study. Glassman 2006: carers received training in the classroom (training phase) and were also provided with ongoing coaching and feedback (coaching phase) during their oral hygiene care sessions with the people with ID for whom they cared. | |||||||||
| Duration | Study | Comparison | Index | Intervention mean (SD) | Control mean (SD) | Total | Country | Comments | Summary |
| 6/7 weeks | Self‐modelling training in oral hygiene skills with daily use of plaque disclosing agents vs no training but daily plaque scoring | S&LGI (scale 0–3) | Pooled data 0.98 (0.54) | Pooled data 1.26 (0.46) | 10 | USA | Mean and SD calculated from individual means | "The gingival indices [for those in treatment] improved from 12% to 50%," p. 260. The results of the Gingival Index for the control group was variable, with slight improvement, which was attributed to daily brushing. | |
| ID: intellectual disability; RCT: randomised controlled trial; S&LGI: Silness & Löe Gingival Index; SD: standard deviation. Lange 1985: data presented by individuals, pooled mean and SD calculated from these data. | |||||||||
| Duration | Study | Comparison | Index | Intervention mean (SD) | Control mean (SD) | Total | Country | Comments | Summary |
| 5 weeks | Desensitisation session and 11 practical training sessions in oral hygiene vs a desensitisation session only | K&API (scale 0–5) | 2.31 | 3.04 | 26 | USA | Data presented is the Adjusted Post Test scores. Some confusion re data between the 2 reports. | "Indicating a statistically significant change for the experimental group compared to the control group," Schwartz, p. 20. Analysis of covariance: F = 6.38; df = 1/23; P < 0.025. Albino, p. 27. | |
| 6/7 weeks | Self‐modelling training in oral hygiene skills with daily use of plaque disclosing agents vs no training but daily plaque scoring | G&VPI (scale 0–3) | Pooled data 0.35 (0.46) | Pooled data 0.82 (0.24) | 10 | USA | Mean and SD calculated from individual means. | The plaque level reduced for the intervention group from baseline to follow‐up by 30%, p. 260. There was a general increase in plaque levels from baseline in the control group. | |
| df: degrees of freedom; G&VPI: Green & Vermillion Plaque Index; ID: intellectual disability; K&API: Kobayashi & Ash Plaque Index (six teeth scored, facial and lingual surfaces only); RCT: randomised controlled trial; SD: standard deviation. Lange 1985: data presented by individuals, pooled mean and SD calculated from these data. | |||||||||
| Duration | Study | Comparison | Index | Intervention mean (SD) | Control mean (SD) | Total | Country | Comments | Summary |
| Unclear | Oral hygiene training for people with ID using discrimination, reinforcement and modelling | Steps in a toothbrushing routine (19) | Pooled data MD 6.3 steps (increase) | N/A | 8 | USA | Group mean and SD calculated from the reported data. | 1‐tailed t‐tests for correlated data showed strong evidence of positive MDs in toothbrushing behaviour (range P < 0.005 to P < 0.0005), Table 3, p. 8. | |
| 100 days | Oral hygiene training for people with ID using assistance, feedback and duration training | Steps in a toothbrushing routine (15) | 62.5% (increase) | N/A | 8 | The Netherlands | Number of training and duration training sessions varied considerably between participants. | 62.5% of participants learned to brush their teeth and continued to do so after 8–15 days of no training. | |
| 30 weeks | Oral hygiene training for people with ID using a token reinforcement programme with single and chained response contingency phases | Completing the toothbrushing skill | 60.2–71.9% of participants (increase) | N/A | 40 | USA | Individual performance criteria were determined at baseline. 5 other life skills were also taught in this study. | Mean weekly performance of tooth brushing increased by 60.2% using single contingency reinforcement and by 71.9% using chained contingency reinforcement. | |
| 19 months | Oral hygiene training for people with ID using verbal and physical prompts that were gradually faded | Steps in a toothbrushing routine (17) | Difference 5–12 steps (increase) | N/A | 3 | USA | Results reported narratively and are unclear. | "Training was not consistently followed by maintenance of effects. Although Sara's performance was durable, Jake and Frank did not maintain all their skills without receiving 'booster' training sessions," p. 224. | |
| ID: intellectual disability; MD: mean difference; N/A: not available; NRS: non‐randomised study; SD: standard deviation. Abramson 1972: mean individual data reported (no SD reported), group mean and SD calculated from these data. | |||||||||
| Duration | Study | Comparison | Index | Intervention mean (SD) | Control mean (SD) | Total | Country | Comments | Summary |
| 24 months | 1‐, 3‐ and 6‐monthly dental recall vs no regular dental recall | WHOGPI (scale 0–2) | R1: 0.3 (0.8); R3: 0.4 (0.7); R6: 0.5 (0.9) | 0.9 (1.4) | 304 | UK | All participants also had supervised daily toothbrushing. | Strong evidence of differences between the groups for Code 1 GPI at 3, 6, 12 and 24 months (P < 0.01–0.05). | |
| GPI: Gingival Pocket Index; R1: one‐month recall; R3: three‐month recall; R6: six‐month recall; RCT: randomised controlled trial; SD: standard deviation; WHOGPI: World Health Organization Gingival Pocket Index, scale 0–2 (0: 0–3.5 mm; 1: > 3.5–5.5 mm; 2: > 5.5 mm). Shaw 1991: data also reported for 3, 6, 12 and 18 months, not reported here as participant numbers were not provided. Data for "mean number of sextants scored as Code 1." No strong evidence of a difference for Code 2, but the actual number of effected sextants was very low. | |||||||||
| Duration | Study | Comparison | Index | Intervention mean (SD) | Control mean (SD) | Total | Country | Comments | Summary |
| 24 months | 1‐, 3‐ and 6‐monthly dental recall vs no regular dental recall | WHOBI (scale 0–1) | R1: 2.2 (1.9); R3: 2.3 (1.9); R6: 2.6 (1.8) | 2.4 (2.0) | 304 | UK | All participants also had supervised daily toothbrushing. | Strong evidence of differences in BI at the 3‐, 6‐ and 12‐month time points (P < 0.01) were not observed at 18 or 24 months | |
| BI: Bleeding Index; R1: one‐month recall; R3: three‐month recall; R6: six‐month recall; RCT: randomised controlled trial; SD: standard deviation; WHOBI: World Health Organization Bleeding Index, scale 0–1; presence or absence of bleeding after 20 seconds. Shaw 1991: data also reported for 3, 6,12 and 18 months, not reported here as participant numbers not provided. | |||||||||
| Duration | Study | Comparison | Index | Intervention mean (SD) | Control mean (SD) | Total | Country | Comments | Summary |
| 24 months | 1‐, 3‐ and 6‐monthly dental recall vs no regular dental recall | WHOPI (scale 0–3) | R1: 1.2 (1.7); R3: 1.3 (1.7); R6: 1.3 (1.5) | 2.0 (1.9) | 304 | UK | All participants also had supervised daily toothbrushing. | Strong evidence of differences for Plaque Index at 12 (P < 0.01) and 24 months (P < 0.05); the greatest differences were seen in the 1‐ and 3‐monthly intervals. | |
| R1: one‐month recall; R3: three‐month recall; R6: six‐month recall; SD: standard deviation; WHOPI: World Health Organization Plaque Index; data were for "mean number of sextants scored as Code 2." Shaw 1991: data also reported for 3, 6, 12 and 18 months, not reported here as participant numbers not provided. "The difference between the one‐monthly and three monthly hygienist input (Recall visit) were not clinically very apparent after two years," p. 144. | |||||||||
| Duration | Study | Comparison | Index | Intervention mean (SD) | Control mean (SD) | Total | Country | Comments | Summary |
| 24 months | 1‐, 3‐ and 6‐monthly dental recall vs no regular dental recall | WHOCI (scale 0–1) | R1: 1.6 (1.7); R3 2.2 (1.9); R6: 3.5 (2.0) | 3.6 (2.1) | 304 | UK | All participants also had supervised daily toothbrushing. | Strong evidence of differences in confidence intervals at 6, 12, 18 and 24 months (P < 0.01). | |
| R1: one‐month recall; R3: three‐month recall; R6: six‐month recall; RCT: randomised controlled trial; WHOCI: World Health Organization Calculus Index, scale 0–1 (presence or absence). Shaw 1991: data also reported at 3, 6, 12 and 18 months, not reported here as participant numbers not provided. | |||||||||
| Duration | Study | Comparison | Index | Intervention mean (SD) | Control mean (SD) | Total | Country | Comments | Summary |
| 6 months | Discussion of clinical photographic records vs no discussion | WHOPI (scale 0–12) | 7.3 (2.8) | 7.4 (2.0) | 29 | UK | Disclosing solution was also used. | "There was no significant changes after 6 months in either of the groups," p. 4. | |
| ESI (%) | 37.7% (18.2) | 40.3% (26.4) | 29 | UK | Disclosing solution was also used. | "The test group was considerably lower but just failed to achieve statistical significance (t = 1.721, df =15)," p. 4. | |||
| df: degrees of freedom; ESI: Extrinsic Stain Index Shaw & Murray (% plaque on anterior teeth); SD: standard deviation; WHOPI: World Health Organization Plaque Index (4 surfaces per tooth, scored 0–3 resulting in a scale of 0–12). | |||||||||
| Duration | Study | Comparison | Index | Intervention mean | Control mean | Total | Country | Comments | Summary |
| 21 days | Daily vs twice weekly brushing | B&LL&SGI (scale 0–6) | Pooled 1.84 | Pooled 2.05 | 40 | UK | Pooled mean calculated from reported data | Brushing twice a week reduced gingival disease by approximately 46% and brushing daily by 51%, p. 378. | |
| Daily vs once weekly brushing | B&LL&SGI (scale 0–6) | Pooled 1.84 | Pooled 3.42 | 40 | UK | Pooled mean calculated from reported data | Brushing once a week reduced gingival disease by approximately 26% and brushing daily by 51%, p. 378. | ||
| Daily brushing vs usual care | B&LL&SGI (scale 0–6) | Pooled 1.84 | 4.27 | 60 | UK | Pooled mean calculated from reported data | Brushing daily differed strongly from usual care – decreasing levels of gingivitis by 51%, p. 378. | ||
| B&LL&SGI: buccal and labial surfaces Löe & Silness, scale 0–6; RCT: randomised controlled trial. Swallow 1969: data presented separately for electric and manual toothbrushes, labial and buccal surfaces, and males and females; no SD reported. The data for the females using the electric toothbrush daily and twice weekly appeared unrealistically low; author could not be contacted to clarify. Pooled means were calculated from these data. Usual care group "rarely received any regular form of oral hygiene." | |||||||||
| Duration | Study | Comparison | Index | Intervention mean | Control mean | Total | Country | Comments | Summary |
| 10 days | Toothpaste with a disclosing agent vs a regular toothpaste | GBI (scale 0–1) | % mean difference 18 | % mean difference 8 | 40 | Brazil | Cross‐over trial. Data presented for 2 arms combined. | Strong evidence of a difference in Bleeding Index in favour of the intervention (P < 0.001), p. 466. | |
| GBI: Gingival Bleeding Index Ainamo & Bay (present or absent); NRS: non‐randomised study. Teitelbaum 2009: included two other experimental groups using chlorhexidine, which are not relevant to this review. The toothpaste containing a plaque‐disclosing agent produced a reduction in gingival inflammation similar to the dentifrice with chlorhexidine (18%) (not reported here). Exact data in Figure 2 unclear; requested from authors, but no response. | |||||||||
| Duration | Study | Comparison | Index | Intervention mean | Control mean | Total | Country | Comments | Summary |
| 10 days | Toothpaste with a disclosing agent vs a regular toothpaste | SG&VOHI (scale 0–3) | % mean difference 65 | % mean difference 15 | 40 | Brazil | Cross‐over trial. Data presented for 2 arms combined. | Strong evidence of a difference in plaque levels in favour of the intervention (P < 0.0001), p. 466. | |
| NRS: non‐randomised study; SG&VOHI: Simplified Green & Vermillion Oral Hygiene Index – plaque only. Scoring of disclosed plaque on buccal surfaces of 4 teeth and lingual surfaces of 2 teeth. Teitelbaum 2009: included two other experimental groups not relevant to this review. Exact data in Figure 2 unclear. Requested from authors, but no response. | |||||||||
| Duration | Study | Comparison | Index | Intervention mean | Control mean | Total | Country | Comments | Summary |
| 12 months | Individualised oral care plan vs usual care (general oral care policy) | SOHR (scale 1–5) | 2.97 | 3.10 | 79 | USA | The intervention group was monitored, monthly – quarterly, with staff feedback and review as required. No monitoring of the control group. | "People in the treatment group showed statistically significant improvement, t (39) = 3.82, p < .001)," p. 442. | |
| Improvement differential | 38% | 5% | 79 | USA | The intervention group was monitored, monthly – quarterly, with staff feedback and review as required. No monitoring of the control group. | "The results indicate that practices can be implemented to improve oral hygiene in individuals with mental retardation living at a state residential facility," p. 442. | |||
| NRS: non‐randomised study; SOHR: Subjective Oral Hygiene Rating, scale 1–5 (1 excellent: no plaque on teeth, 2 good; plaque present on less than 15% of total tooth surface (tts), 3 fair; plaque present on 15–50% of tts, 4 poor; plaque present on 50–90% of tts, 5 plaque present on greater than 90% of tts), p. 441. Numerical ratings were averaged over the two designated time periods. Improvement differential: difference between percentage of individuals with improvement rating minus the % individuals with poorer rating over same time period. | |||||||||
| Outcome or subgroup title | No. of studies | No. of participants | Statistical method | Effect size |
| 1 Gingival inflammation short term (< 6 weeks) Show forest plot | 1 | 25 | Mean Difference (IV, Fixed, 95% CI) | ‐0.10 [‐0.77, 0.57] |
| 2 Gingival inflammation medium term (6 weeks to 12 months) Show forest plot | 1 | 18 | Mean Difference (IV, Fixed, 95% CI) | ‐12.40 [‐24.31, ‐0.49] |
| 3 Plaque short term (< 6 weeks) Show forest plot | 1 | 25 | Mean Difference (IV, Fixed, 95% CI) | 0.20 [‐0.45, 0.85] |
| 4 Plaque medium term (6 weeks to 12 months) Show forest plot | 1 | 18 | Mean Difference (IV, Fixed, 95% CI) | ‐0.44 [‐0.93, 0.05] |
| 5 Oral health assessments Show forest plot | 1 | Mean Difference (IV, Fixed, 95% CI) | Subtotals only | |
| 5.1 Oral assessment | 1 | 22 | Mean Difference (IV, Fixed, 95% CI) | ‐0.45 [‐1.35, 0.45] |
| 5.2 Total bacteria count | 1 | 22 | Mean Difference (IV, Fixed, 95% CI) | 0.32 [‐0.29, 0.93] |
| 5.3 Potentially pathogenic bacteria | 1 | 22 | Mean Difference (IV, Fixed, 95% CI) | 0.12 [‐0.67, 0.91] |
| 6 Behaviour, attitude and self‐efficacy Show forest plot | 1 | Mean Difference (IV, Fixed, 95% CI) | Subtotals only | |
| 6.1 Frequency of brushing | 1 | 18 | Mean Difference (IV, Fixed, 95% CI) | 0.20 [‐2.13, 2.53] |
| 6.2 Experience of carer when brushing for a person with ID | 1 | 18 | Mean Difference (IV, Fixed, 95% CI) | 0.7 [‐0.15, 1.55] |
| 6.3 Handling of TB by the carer | 1 | 18 | Mean Difference (IV, Fixed, 95% CI) | 0.50 [‐0.35, 1.35] |
| 7 Degree of resistance of person with ID Show forest plot | 1 | 18 | Mean Difference (IV, Fixed, 95% CI) | ‐1.70 [‐4.90, 1.50] |
| Outcome or subgroup title | No. of studies | No. of participants | Statistical method | Effect size |
| 1 Gingival inflammation medium term (6 weeks to 12 months) Show forest plot | 2 | 120 | Mean Difference (IV, Fixed, 95% CI) | 0.02 [‐0.06, 0.09] |
| 2 Plaque medium term (6 weeks to 12 months) Show forest plot | 2 | 120 | Std. Mean Difference (IV, Fixed, 95% CI) | 0.29 [‐0.07, 0.65] |
| 3 NRS Gingival inflammation long term (> 12 months) Show forest plot | 1 | 23 | Mean Difference (IV, Fixed, 95% CI) | 0.0 [‐0.15, 0.15] |
| 4 NRS Plaque medium term (6 weeks to 12 months) Show forest plot | 5 | 167 | Std. Mean Difference (IV, Random, 95% CI) | 0.04 [‐0.38, 0.46] |
| 5 Calculus medium term (6 weeks to 12 months) Show forest plot | 2 | 120 | Std. Mean Difference (IV, Fixed, 95% CI) | ‐0.04 [‐0.40, 0.32] |
| Outcome or subgroup title | No. of studies | No. of participants | Statistical method | Effect size |
| 1 Gingival inflammation medium term (6 weeks to 12 months) Show forest plot | 2 | 99 | Mean Difference (IV, Random, 95% CI) | ‐0.09 [‐0.63, 0.45] |
| 2 Plaque medium term (6 weeks to 12 months) Show forest plot | 2 | 99 | Mean Difference (IV, Fixed, 95% CI) | ‐0.07 [‐0.26, 0.13] |
| 3 Non‐randomised study plaque short term (< 6 weeks) Show forest plot | 1 | Mean Difference (IV, Fixed, 95% CI) | Subtotals only | |
| 3.1 Training of carers | 1 | 34 | Mean Difference (IV, Fixed, 95% CI) | ‐0.69 [‐0.97, ‐0.41] |
| 4 Knowledge short term (< 6 weeks) Show forest plot | 1 | Mean Difference (IV, Fixed, 95% CI) | Subtotals only | |
| 5 Knowledge medium term (6 weeks to 12 months) Show forest plot | 2 | 189 | Mean Difference (IV, Fixed, 95% CI) | 0.69 [0.31, 1.06] |
| 6 Behaviour, attitude and self‐efficacy medium term Show forest plot | 2 | 189 | Mean Difference (IV, Random, 95% CI) | 0.15 [‐0.80, 1.10] |
| Outcome or subgroup title | No. of studies | No. of participants | Statistical method | Effect size |
| 1 Gingival inflammation short term (< 6 weeks) Show forest plot | 1 | 10 | Mean Difference (IV, Fixed, 95% CI) | ‐0.28 [‐0.90, 0.34] |
| 2 Plaque short term (< 6 weeks) Show forest plot | 1 | 10 | Mean Difference (IV, Fixed, 95% CI) | ‐0.47 [‐0.92, ‐0.02] |
| Outcome or subgroup title | No. of studies | No. of participants | Statistical method | Effect size |
| 1 Gingival pocketing long term (> 12 months) Show forest plot | 1 | Mean Difference (IV, Fixed, 95% CI) | Subtotals only | |
| 1.1 One‐monthly dental recalls | 1 | 137 | Mean Difference (IV, Fixed, 95% CI) | ‐0.6 [‐0.97, ‐0.23] |
| 1.2 Three‐monthly dental recalls | 1 | 148 | Mean Difference (IV, Fixed, 95% CI) | ‐0.5 [‐0.85, ‐0.15] |
| 1.3 Six‐monthly dental recalls | 1 | 171 | Mean Difference (IV, Fixed, 95% CI) | ‐0.4 [‐0.76, ‐0.04] |
| 2 Gingival bleeding long term (> 12 months) Show forest plot | 1 | Mean Difference (IV, Fixed, 95% CI) | Subtotals only | |
| 2.1 One‐monthly dental recall | 1 | 137 | Mean Difference (IV, Fixed, 95% CI) | ‐0.20 [‐0.86, 0.46] |
| 2.2 Three‐monthly dental recalls | 1 | 148 | Mean Difference (IV, Fixed, 95% CI) | ‐0.10 [‐0.73, 0.53] |
| 2.3 Six‐monthly dental recalls | 1 | 171 | Mean Difference (IV, Fixed, 95% CI) | 0.20 [‐0.38, 0.78] |
| 3 Plaque long term (> 12 months) Show forest plot | 1 | Mean Difference (IV, Fixed, 95% CI) | Subtotals only | |
| 3.1 One‐monthly dental recall | 1 | 137 | Mean Difference (IV, Fixed, 95% CI) | ‐0.7 [‐1.30, ‐0.10] |
| 3.2 Three‐monthly dental recall | 1 | 148 | Mean Difference (IV, Fixed, 95% CI) | ‐0.8 [‐1.38, ‐0.22] |
| 3.3 Six‐monthly dental recall | 1 | 171 | Mean Difference (IV, Fixed, 95% CI) | ‐0.7 [‐1.22, ‐0.18] |
| 4 Calculus long term (> 12 months) Show forest plot | 1 | Mean Difference (IV, Fixed, 95% CI) | Subtotals only | |
| 4.1 One‐monthly dental recalls | 1 | 137 | Mean Difference (IV, Fixed, 95% CI) | ‐2.0 [‐2.64, ‐1.36] |
| 4.2 Three‐monthly dental recalls | 1 | 148 | Mean Difference (IV, Fixed, 95% CI) | ‐1.4 [‐2.04, ‐0.76] |
| 4.3 Six‐monthly dental recalls | 1 | 171 | Mean Difference (IV, Fixed, 95% CI) | ‐0.10 [‐0.72, 0.52] |
| Outcome or subgroup title | No. of studies | No. of participants | Statistical method | Effect size |
| 1 Plaque medium term (6 weeks to 12 months) Show forest plot | 1 | Mean Difference (IV, Fixed, 95% CI) | Subtotals only | |
| 1.1 Plaque | 1 | 29 | Mean Difference (IV, Fixed, 95% CI) | ‐0.10 [‐1.85, 1.65] |
| 1.2 Extrinsic stain | 1 | 29 | Mean Difference (IV, Fixed, 95% CI) | ‐2.60 [‐19.45, 14.25] |