Dialysate temperature reduction for intradialytic hypotension for people with chronic kidney disease requiring haemodialysis
Abstract
Background
Intradialytic hypotension (IDH) is a common complication of haemodialysis (HD), and a risk factor of cardiovascular morbidity and death. Several clinical studies suggested that reduction of dialysate temperature, such as fixed reduction of dialysate temperature or isothermal dialysate using a biofeedback system, might improve the IDH rate.
Objectives
This review aimed to evaluate the benefits and harms of dialysate temperature reduction for IDH among patients with chronic kidney disease requiring HD, compared with standard dialysate temperature.
Search methods
We searched Cochrane Kidney and Transplant's Specialised Register up to 14 May 2019 through contact with the Information Specialist using search terms relevant to this review. Studies in the Register are identified through searches of CENTRAL, MEDLINE, EMBASE, conference proceedings, the International Clinical Trials Register (ICTRP) Search Portal, and ClinicalTrials.gov.
Selection criteria
All randomised controlled trials (RCTs), cross‐over RCTs, cluster RCTs and quasi‐RCTs were included in the review.
Data collection and analysis
Two authors independently extracted information including participants, interventions, outcomes, methods of the study, and risks of bias. We used a random‐effects model to perform quantitative synthesis of the evidence. We assessed the risks of bias for each study using the Cochrane ’Risk of bias’ tool. We assessed the certainty of evidence using Grades of Recommendation, Assessment, Development and Evaluation (GRADE).
Main results
We included 25 studies (712 participants). Three studies were parallel RCTs and the others were cross‐over RCTs. Nineteen studies compared fixed reduction of dialysate temperature (below 36°C) and standard dialysate temperature (37°C to 37.5°C). Most studies were of unclear or high risk of bias. Compared with standard dialysate, it is uncertain whether fixed reduction of dialysate temperature improves IDH rate (8 studies, 153 participants: rate ratio 0.52, 95% CI 0.34 to 0.80; very low certainty evidence); however, it might increase the discomfort rate compared with standard dialysate (4 studies, 161 participants: rate ratio 8.31, 95% CI 1.86 to 37.12; very low certainty evidence). There were no reported dropouts due to adverse events. No study reported death, acute coronary syndrome or stroke.
Three studies compared isothermal dialysate and thermoneutral dialysate. Isothermal dialysate might improve the IDH rate compared with thermoneutral dialysate (2 studies, 133 participants: rate ratio 0.68, 95% CI 0.60 to 0.76; I2 = 0%; very low certainty evidence). There were no reports of discomfort rate (1 study) or dropouts due to adverse events (2 studies). No study reported death, acute coronary syndrome or stroke.
Authors' conclusions
Reduction of dialysate temperature may prevent IDH, but the conclusion is uncertain. Larger studies that measure important outcomes for HD patients are required to assess the effect of reduction of dialysate temperature. Six ongoing studies may provide much‐needed high quality evidence in the future.
PICO
Plain language summary
Dialysate temperature reduction for intradialytic hypotension for people with chronic kidney disease requiring haemodialysis
What is the issue?
An increasing number of patients with chronic kidney disease need haemodialysis (HD). When the kidneys are not able to remove enough waste from the blood, HD is used to clean the blood and to remove the excess water via a dialysis machine. Intradialytic hypotension (IDH) is a common complication of HD that is characterized by a sudden drop in blood pressure (BP) with hypotensive symptoms such as dizziness, weakness, nausea, and fatigue, and is a risk factor of cardiovascular morbidity and mortality. In general, a decrease in body temperature is associated with contraction of vessels, and an increase in BP. However, the widely used dialysate temperature is 37°C, and the body temperature is likely to increase during standard dialysis. Removal of heat with cool dialysate might be beneficial to haemodynamic stability. Additionally, fixed empirical reduction of dialysate temperature is simple and easy to adopt in daily practice, however it can increase patient discomfort such as cold sensations, shivering, and related symptoms.
What did we do?
We collected all data from studies of patients with CKD requiring HD that reported data on IDH, discomfort rate and other important outcomes. We included 25 studies comprising 712 participants in the review, and performed meta‐analysis to estimate the effect of cooling dialysate.
What did we find?
The quality of included studies was generally very low due to the risk of bias, small sample size, and a lack of information.
We found very low quality evidence that fixed reduction of dialysate temperature decreased the incidence of IDH compared with standard dialysate and increased the discomfort rate. When patient discomfort is minimal, reduction of the dialysate temperature may be an option to reduce IDH. However, no study reported the long‐term outcomes such as death or heart disorders.
Conclusions
There is limited data suggesting that the reduction of dialysate temperature may prevent IDH, but the conclusion is very uncertain. Larger studies that measure important outcomes such as IDH or mortality for HD patients are required to assess the effect of reducing dialysate temperature.
Authors' conclusions
Summary of findings
| Fixed reduction of dialysate temperature compared to standard dialysate temperature for patients requiring haemodialysis | |||||
| Patient or population: patients requiring haemodialysis | |||||
| Outcomes | Anticipated absolute effects* (95% CI) | Relative effect | No. of participants | Certainty of the evidence | |
| Risk with standard dialysate temperature | Risk with fixed reduction of dialysate temperature | ||||
| Intradialytic hypotension rate | 251 episodes per 1,000 person‐dialysis session | 131 episodes per 1,000 person‐dialysis session | RR 0.52 | 153 (8) | ⊕⊝⊝⊝ |
| Discomfort rate | 25 episodes per 1,000 person‐dialysis session | 208 episodes per 1,000 person‐dialysis session | Rate ratio 8.31 | 81 (4) | ⊕⊝⊝⊝ |
| Dropout due to adverse events | Nine studies (268 participants) reported there were no dropouts due to adverse events | ‐ | 268 (9) | Not graded | |
| Death (all causes) | No studies reported the outcome | ‐ | ‐ | ‐ | |
| Acute coronary syndrome | No studies reported the outcome | ‐ | ‐ | ‐ | |
| Stroke | No studies reported the outcome | ‐ | ‐ | ‐ | |
| *The risk in the intervention group (and its 95% confidence interval) is based on the assumed risk in the comparison group and the relative effect of the intervention (and its 95% CI). | |||||
| GRADE Working Group grades of evidence | |||||
| 1 Downgraded two levels due to serious risk of bias: all included studies were randomised cross‐over studies and carry‐over effects could be biased the result. Additionally, all studies were rated high or unclear risk of bias in at least four domains 2 Downgraded one level due to serious imprecision: the total sample size included in the analysis were less than optimal information size | |||||
| Isothermal dialysate compared to thermoneutral dialysate in patients requiring haemodialysis | |||||
| Patient or population: patients requiring haemodialysis | |||||
| Outcomes | Anticipated absolute effects* (95% CI) | Relative effect | No. of participants | Certainty of the evidence | |
| Risk with thermoneutral dialysate | Risk with Isothermal dialysate | ||||
| Intradialytic hypotension rate | 410 episodes per 1,000 person‐dialysis session | 279 episodes per 1,000 person‐dialysis session | Rate ratio 0.68 | 133 (2) | ⊕⊝⊝⊝ |
| Discomfort rate | One study reported that none of the patients allocated to isothermal or thermoneutral dialysate experienced shivering | ‐ | 17 (1) | Not graded | |
| Dropout due to adverse event | There were no reported dropouts due to adverse events in the 2 studies | ‐ | 133 (2) | Not graded | |
| Death (all causes) | No study reported the outcome | ‐ | ‐ | ‐ | |
| Acute coronary syndrome | No study reported the outcome | ‐ | ‐ | ‐ | |
| Stroke | No study reported the outcome | ‐ | ‐ | ‐ | |
| *The risk in the intervention group (and its 95% confidence interval) is based on the assumed risk in the comparison group and the relative effect of the intervention (and its 95% CI). | |||||
| GRADE Working Group grades of evidence | |||||
| 1 Downgraded two levels due to serious risk of bias: all included studies were randomised cross‐over studies and carry‐over effects could be biased the result. Additionally, all studies were rated high or unclear risk of bias in at least four domains 2 Downgraded one level due to serious imprecision: the total sample size included in the analysis were less than optimal information size | |||||
Background
Description of the condition
Chronic kidney disease (CKD) is a global concern. According to the 2010 Global Burden of Disease study, CKD was ranked 27th in the list of causes of total number of global deaths in 1990 (age‐standardized annual death rate of 15.7 per 100,000), but rose to 18th in 2010 (annual death rate 16.3 per 100,000) (Lozano 2012). The number of end‐stage kidney disease (ESKD) patients receiving renal replacement therapy (RRT) was more than 2 million in 2011, and increased approximately 8% annually (Couser 2011; White 2008). Haemodialysis (HD) is the main modality of RRT, with almost 90% of dialysis patients under maintenance HD (Jain 2012). Patients with maintenance HD gain weight because of their inability to excrete urine. The excess water is removed by ultrafiltration during HD.
Intradialytic hypotension (IDH) is a common complication of HD. There is no consensus on the definition of IDH, but IDH is commonly defined as a drop in blood pressure during dialysis procedure and/or hypotensive symptoms such as dizziness, weakness, nausea, cramps, blurred vision, and fatigue (Assimon 2017; K/DOQI 2005; Santoro 2002). The pathophysiology of IDH is diverse. It could be the result of an inadequate cardiovascular response to the reduction in blood volume that occurs when the ultrafiltration volume is large (Leypoldt 2002). One process may involve an imbalance between a reduced effective circulating volume and the compensatory plasma refilling mechanism, wherein fluid from the interstitial and intracellular space is translocated into the intravascular compartment (Nesrallah 2013). Additionally, IDH can also be induced by several vasoactive substances such as adenosine or nitric oxide, which may be synthesized or released during dialysis (Sulowicz 2006). Recent studies have shown that haemodynamic instability is associated with impaired baroreflex sensitivity; a decrease in asymmetric dimethylarginine (ADMA), a naturally occurring nitric oxide synthase inhibitor, and inadequate vasopressin response (Chesterton 2010; Csiky 2008; Dubin 2011; Thompson 2009). Another study using echocardiography suggests that a blood pressure (BP) drop within a HD session is associated with HD‐induced myocardial stunning (Burton 2009). Repeated decreases in organ perfusion due to IDH can introduce chronic organ injury over time (Nesrallah 2013). Moreover, several studies have shown an association between IDH and cardiovascular morbidity and mortality (Burton 2009; Sands 2014; Shoji 2004; Stefansson 2014; Tisler 2003). IDH is also associated with vascular access thrombosis, dysrhythmias, and mesenteric venous infarction (K/DOQI 2005). Risk factors associated with IDH include old age, female gender, Hispanic ethnicity, long dialysis vintage, high intradialytic weight gain, high dialysis dose, anaemia, diabetes, low predialysis BP, high osmolarity, and high body mass index (Mc Causland 2013; Mc Causland 2015; Sands 2014; Stefansson 2014; K/DOQI 2005).
Description of the intervention
Dialysate is heated by heating elements in the HD machine as the blood temperature decreases through an extracorporeal circuit. The widely used dialysate temperature is 37°C (Daugirdas 2007; K/DOQI 2005; Toth‐Manikowski 2016). The body temperature is likely to increase during standard dialysis with the dialysate temperature of 37°C (Rosales 2000). The dialysis procedure itself affects body temperature regulation. There have been several clinical studies that investigated the effect of reduction of dialysate temperature for haemodynamic stability (Jost 1993; Maggiore 2002; van der Sande 2009; Zitt 2008). A simple intervention for lowering blood temperature is fixed empirical reduction of dialysate temperature. Alternative interventions are implemented by monitoring blood temperature (core temperature) in the arterial and venous bloodline (Selby 2006). This biofeedback system can adjust the dialysate temperature in response to the calculated body temperature and enable the implementation of isothermic dialysis, in which arterial temperature remains unchanged from the patient’s baseline level (van der Sande 2009). In contrast, lower dialysate temperature may cause high frequency of discomfort, a cold sensation, or shivering (K/DOQI 2005).
How the intervention might work
Peripheral and cutaneous vasoconstriction is considered an important component for the ultrafiltration‐induced decrease in blood volume (Schneditz 2003). HD patients tend to be hypovolaemic as ultrafiltration progresses during HD (Bos 2000; Leypoldt 2002). Hypovolaemia causes underfilling in the cardiac chambers, then cardiovascular response increases the arteriolar or venous tone. However, patients with impaired cardiovascular response cannot offset the volume reduction, and suffer a drop in BP (Santoro 2002). In general, a decrease in body temperature is associated with a decrease in blood flow to the compliant cutaneous circulation, an increase in total peripheral resistance, and an increase in BP (Schneditz 2003). One study reported that left ventricular contractility increased during cool dialysis (Levy 1992), while another observed that SBP was higher in the cool dialysate group but core temperature remained stable during dialysis (van der Sande 1999). Removal of heat with cool dialysate might activate autoregulatory mechanisms to preserve core temperature, which results in beneficial haemodynamic stability. In addition, a recent study showed the protective effect of cooling dialysate on dialysis‐induced ischaemic brain injury (Eldehni 2015).
Why it is important to do this review
IDH remains an issue for chronic HD patients. The frequency of IDH was reported as 20% to 30% among patients undertaking HD (Davenport 2008a; Davenport 2008b). In addition, the incidence of IDH is likely to rise because an increasing number of older patients are expected to develop ESKD (K/DOQI 2005). Since IDH could introduce clinically relevant complications such as mortality and cardiovascular morbidity, evaluation of easy, cost‐effective, and safe interventions should be evaluated to address this problem. Reduction of dialysate temperature could be an easy intervention for preventing IDH. The intervention could also be applied to patients in various settings because standard dialysis consoles have a dialysate temperature regulator; therefore, it can be applied universally and reduce the need for nursing involvement (Eldehni 2015; Toth‐Manikowski 2016). Further, no additional cost is needed to conduct fixed reduction of dialysate temperature. While there are various methods of reducing dialysate temperature, optimal temperature or methods of temperature reduction to prevent IDH remain uncertain (Maggiore 2002; Santoro 2002; Selby 2006; Toth‐Manikowski 2016). A recent systematic review has reported the effect of cooling dialysis on IDH; however, the study has several limitations, including non‐reporting of the risk of bias judgment, assessment of the carry‐over effect for the cross‐over studies (if there was IDH in the session before cross‐over, the patients and medical staffs would try to prevent it in the session after cross‐over), exclusion of comparisons between different types of cooling methods, and exclusion of children and modalities other than HD (Mustafa 2016). To that end, we conducted a systematic review of the effects and harms of reduction of dialysate temperature.
Objectives
This review aimed to evaluate the benefits and harms of dialysate temperature reduction for IDH among patients with CKD requiring HD, compared with standard dialysate temperature. In addition, we compared the benefits and harms of different types of dialysate temperature reduction for IDH.
Methods
Criteria for considering studies for this review
Types of studies
We included all published, unpublished and ongoing randomised controlled trials (RCTs) to compare the reduction of dialysate temperature and normal temperature for IDH in HD patients.
Cluster RCTs were eligible if the number of clusters or the average size of each cluster, the outcome data regardless of cluster design for the total number of individuals, and an estimate of intracluster (or intraclass) correlation coefficient (ICC) were available.
We included data from cross‐over RCTs.
We included quasi‐RCTs (RCTs in which allocation to treatment was obtained by alternation, use of alternate medical records, date of birth or other predictable methods) but excluded observational studies. No language restriction was applied.
Types of participants
Inclusion criteria
All patients undergoing maintenance HD, haemofiltration (HF) and haemodiafiltration (HDF) with minimum dialysis vintage of three months.
Exclusion criteria
-
Patients on peritoneal dialysis
-
Patients undergoing continuous RRT
-
Patients undergoing sustained low‐efficiency dialysis (SLED)
-
Patients undergoing home HD.
Types of interventions
The experimental conditions were any methods of reduction of dialysate temperature. We considered the following comparisons.
-
Fixed reduction of dialysate temperature (below 36°C) versus standard dialysate temperature (37°C to 37.5°C)
-
Reduction of core temperature (below 36°C) using a biofeedback device versus standard dialysate temperature (37°C to 37.5°C)
-
Isothermic dialysis defined as maintenance of core temperature using a biofeedback device versus standard dialysate temperature (37°C to 37.5°C)
-
Reduction of arterial temperature using a biofeedback device versus fixed reduction of dialysate temperature (below 36°C)
-
Isothermic dialysis defined as maintenance of artery temperature using a biofeedback device versus fixed reduction of dialysate temperature (below 36°C)
-
Reduction of arterial temperature using biofeedback device versus isothermic dialysis defined as maintenance of arterial temperature using a biofeedback device
-
Any other methods of reduction of dialysate temperature versus standard dialysate temperature (37°C to 37.5°C).
Types of outcome measures
Primary outcomes
-
IDH rate (the proportion of dialysis sessions with episodes of IDH during follow‐up) was defined as follows.
-
Intradialytic decrease in systolic blood pressure (SBP) by 20 mmHg or more, or a decrease in mean arterial pressure (MAP) by 10 mmHg associated with symptoms that include abdominal discomfort, yawning, sighing, nausea, vomiting, muscle cramps, restlessness, dizziness, and anxiety (K/DOQI 2005).
-
Decrease in SBP by 20 mmHg or more, or in MAP by 10 mmHg or more, associated with a clinical event and the need for nursing intervention (Kooman 2007).
-
Drop in SBP to < 90 mmHg or an absolute value > 30 mmHg, associated with symptoms of hypotension and lack of response to the supine position, but necessitating resuscitation with intravenous normotonic or hypertonic fluid administration (Tisler 2003).
-
Decrease in SBP of at least 10 mmHg or a SBP of < 100 mmHg, with symptoms such as cramps, nausea, vomiting, and dizziness (Fortin 2010).
-
Drop in SBP < 90 mmHg or of at least 20 mmHg with accompanying clinical symptoms (Maheshwari 2015).
-
Hypotensive episode requiring either saline infusion, lowering of the ultrafiltration rate (UF) or reduction in blood flow during the HD session (Mc Causland 2013).
-
Intradialytic decrease in SBP by > 30 mmHg to a level of < 90 mmHg (Sands 2014).
-
40 mmHg drop in SBP (Shoji 2004).
-
We also accepted criteria that was similar to the above.
-
-
Death (all causes)
-
Discomfort rate defined as a cold sensation, shivering, and related symptoms.
Secondary outcomes
-
Acute coronary syndrome: diagnosis based on electrocardiographic changes, elevation of enzymes or confirmed during post‐mortem examination.
-
All strokes: sudden focal neurologic deficit caused by cerebrovascular thrombosis, and categorized as ischaemic, haemorrhagic, or unspecified.
-
Quality of life (QoL) measured by a validated scale system such as Kidney Disease Quality of Life (KDQoL), or Choices for Healthy Outcomes in Caring for ESRD (CHOICE) Health Experience Questionnaire (CHEQ) (Hays 1994; Wu 2001).
-
Dropout rate due to adverse events.
-
Rate of vasoconstrictor use (defined as any use of vasoconstrictor per dialysis session).
-
Lowest SBP during dialysis. If the authors reported any BP measure other than the lowest SBP during dialysis, we extracted it according to the following hierarchy: i) the lowest mean BP (MBP) during dialysis; ii) SBP at the end of dialysis; iii) MBP at the end of dialysis; iv) mean SBP during dialysis, and v) mean MBP during dialysis.
-
Lowest body temperature (BT) during dialysis.
-
Urea clearance‐based dialysis adequacy (Kt/Vurea).
-
Vascular thrombosis defined as an access that has clotted, without blood flow in patients with arteriovenous fistula or graft.
-
New onset dysrhythmias.
-
Mesenteric venous thrombosis.
-
Post‐HD fatigue measured by a validated scale system such as the Fatigue Severity Scale (Krupp 1989).
Search methods for identification of studies
Electronic searches
We searched the Cochrane Kidney and Transplant Specialised Register up to 14 May 2019 through contact with the Information Specialist using search terms relevant to this review. The Specialised Register contains studies identified from the following sources.
-
Monthly searches of the Cochrane Central Register of Controlled Trials (CENTRAL).
-
Weekly searches of MEDLINE OVID SP.
-
Handsearching of kidney‐related journals and the proceedings of major kidney conferences.
-
Searching of the current year of EMBASE OVID SP.
-
Weekly current awareness alerts for selected kidney and transplant journals.
-
Searches of the International Clinical Trials Register (ICTRP) Search Portal and ClinicalTrials.gov.
Studies contained in the Register are identified through searches of CENTRAL, MEDLINE, and EMBASE based on the scope of Cochrane Kidney and Transplant. Details of search strategies, as well as a list of handsearched journals, conference proceedings and current awareness alerts, are available on the Cochrane Kidney and Transplant website.
See Appendix 1 for search terms used in the strategies for this review.
Searching other resources
-
Reference lists of review articles, relevant studies and clinical practice guidelines.
-
Letters seeking information about unpublished or incomplete studies to investigators known to be involved in previous studies.
Data collection and analysis
Selection of studies
The search strategy described was used to obtain titles and abstracts of studies that may be relevant to the review. The titles and abstracts were screened independently by two authors, who discarded studies that were not applicable; however, studies and reviews that might include relevant data or information on studies were retained initially. Two authors independently assessed retrieved abstracts and, if necessary, the full text of these studies to determine which studies satisfied the inclusion criteria.
Data extraction and management
Two authors carried out data extraction independently using a structured, pilot‐tested Excel data extraction form. Any disagreements were resolved by discussion with a further author acting as an arbiter. The data extraction form included the following items.
-
General information: title, authors, year of publication, trial registration number, language, and country.
-
Study characteristics: design and setting.
-
Participants: total number, number of each age, sex, and comorbidity.
-
Interventions and comparisons: types of reduction of dialysate, duration, and co‐intervention.
-
Outcome: definition of outcomes, number of participants allocated, number of missing participants, number of events (dichotomous outcomes), standard deviation and mean (continuous outcomes).
-
Risk of bias and publication status.
We translated any studies reported in non‐English language journals before assessment. Where more than one publication of one study existed, we grouped reports together and used the publication with the most complete data in the analyses. Where relevant outcomes were only published in earlier versions, the authors used these data. The authors also highlighted any discrepancies between published versions.
Assessment of risk of bias in included studies
Two authors independently assessed the following items using the risk of bias assessment tool (Higgins 2011) (Appendix 2).
-
Was there adequate sequence generation (selection bias)?
-
Was allocation adequately concealed (selection bias)?
-
Was knowledge of the allocated interventions adequately prevented during the study?
-
Participants and personnel (performance bias)
-
Outcome assessors (detection bias)
-
-
Were incomplete outcome data adequately addressed (attrition bias)?
-
Are reports of the study free of suggestion of selective outcome reporting (reporting bias)?
-
Was the study apparently free of other problems that could put it at a risk of bias?
Measures of treatment effect
Dichotomous outcomes results were expressed as risk ratios (RR) with 95% confidence intervals (CI). For rate outcomes, results were expressed as rate ratios with 95% CI. In the case of zero events, we added 0.5 to each count according to the Cochrane Handbook for Systematic Reviews of Interventions (Higgins 2011).
Where continuous scales of measurement were used to assess the effects of treatment (BP, body temperature, and heart rate), we used the mean difference (MD).
If the studies included in a review included a mixture of change‐from‐baseline and final value scores, we used the MD method in RevMan according to Chapter 9.4.5.2 of the Cochrane Handbook for Systematic Reviews of Interventions (Higgins 2011).
Unit of analysis issues
Cluster randomised studies
For dichotomous data, we applied the design effect and calculated effective sample size and number of events using ICC and the average cluster size, as described in chapter 16.3.5 of the Cochrane Handbook for Systematic Reviews of Interventions (Higgins 2011).
If the ICC was not reported, we used the ICC of similar studies as a substitute. For continuous data, only the sample size was reduced; means and standard deviation remained unchanged (Higgins 2011).
Randomised cross‐over studies
In the protocol, we planned to consider only data from the first period.
However, there was no study that reported first period data, and we could not obtain the data from any included studies by contacting the authors. We therefore used paired data that were potentially affected by carry‐over effects, and judged the risk of bias due to carry‐over effects in the other bias domain.
For multiple‐arm studies, we included all intervention groups that were relevant to the review.
Dealing with missing data
We requested any further information required from the original author by written correspondence (e.g. emailing or writing to corresponding authors) and included any relevant information obtained in this manner in the review. We carefully evaluated important numerical data such as screened, randomised patients as well as intention‐to‐treat, as‐treated and per‐protocol population, and investigated attrition rates, e.g. drop‐outs, losses to follow‐up and withdrawals. The authors also critically appraised issues of missing data and imputation methods (e.g. last‐observation‐carried‐forward) (Higgins 2011).
Assessment of heterogeneity
We first assessed the heterogeneity by visual inspection of the forest plot. Heterogeneity was then analysed using a Chi² test on N‐1 degrees of freedom, with an alpha of 0.10 used for statistical significance, and with the I² test (Higgins 2003). We interpreted the I² values as follows.
-
0% to 40%: might not be important
-
30% to 60%: moderate heterogeneity
-
50% to 90%: might represent substantial heterogeneity
-
75% to 100%: considerable heterogeneity.
The importance of the observed value of I² depends on the magnitude and direction of treatment effects and the strength of evidence for heterogeneity (e.g. P‐value from the Chi² test, or a CI for I²) (Higgins 2011).
Assessment of reporting biases
We assessed heterogeneity by visual inspection of the forest plot.
If the number of eligible studies was 10 or more, we planned to use Egger’s test to assess the potential existence of reporting bias (Higgins 2011).
Data synthesis
Data were pooled using the random‐effects model.
Subgroup analysis and investigation of heterogeneity
Where possible, we used subgroup analyses for primary outcomes to explore possible sources of heterogeneity. We treated a study as a subgroup with a covariate if more than 80% of the included participants in a study had a covariate. We tested the following subgroups.
-
Age: children (< 18 years), adults (18 to 75 years), and elderly (≥ 75 years)
-
Comorbid conditions: history of diabetes mellitus, acute coronary syndrome, IDH, and current use of antihypertensive drugs
-
Dialysis vintage: < 10 years and ≥ 10 years
-
Dialysis modality: HD, HF, HDF
-
We performed the following subgroup analysis for IDH outcome:
-
IDH definition: IDH defined by symptoms or intervention for hypotensive episode (e.g. saline flush, or lowering of the UF), and IDH defined by SBP irrespective of symptoms or intervention
-
Sensitivity analysis
Where possible, we performed sensitivity analyses in order to explore the influence of the following factors on effect size.
-
Repeating the analysis excluding unpublished studies
-
Repeating the analysis restricted to studies with low risk of selection bias (i.e. adequate random sequence generation and random allocation)
-
Repeating the analysis excluding any very long or large studies to establish how much they dominated the results
-
Repeating the analysis using a fixed‐effect model instead of random‐effects model
-
Repeating the analysis restricted to a study protocol that excludes co‐interventions for IDH, such as mannitol, hypertonic saline, or vasoconstrictors.
'Summary of findings' tables
We presented the main results of the review in 'Summary of findings' tables. These tables presented key information concerning the quality of the evidence, the magnitude of the effects of the interventions examined, and the sum of the available data for the main outcomes (Schunemann 2011a). The 'Summary of findings' tables also included an overall grading of the evidence related to each of the main outcomes using the GRADE (Grades of Recommendation, Assessment, Development and Evaluation) approach (GRADE 2008).
The GRADE approach defines the quality of a body of evidence as the extent to which one can be confident that an estimate of effect or association is close to the true quantity of specific interest. The quality of a body of evidence involves consideration of within‐trial risk of bias (methodological quality), directness of evidence, heterogeneity, precision of effect estimates and risk of publication bias (Schunemann 2011b).
We presented the following outcomes in the 'Summary of findings' tables.
-
Death (all causes)
-
Acute coronary syndrome
-
Stroke
-
IDH rate
-
Rate of dropout due to adverse events
-
Discomfort rate.
Results
Description of studies
Results of the search
We identified 67 records. After screening titles and abstracts 52 records potentially met our inclusion criteria and after full‐text review 25 studies (38 records) were included and 7 studies (9 records) were excluded. Four ongoing studies were identified (IRCT201306268140N2; IRCT2016060228219N1; Maheshwari 2015; MY TEMP 2017). One study (Kuhlmann 1996) was potentially eligible but has not been incorporated into the review due to a lack of information. These studies and will be assessed in a future update of this review (Figure 1).
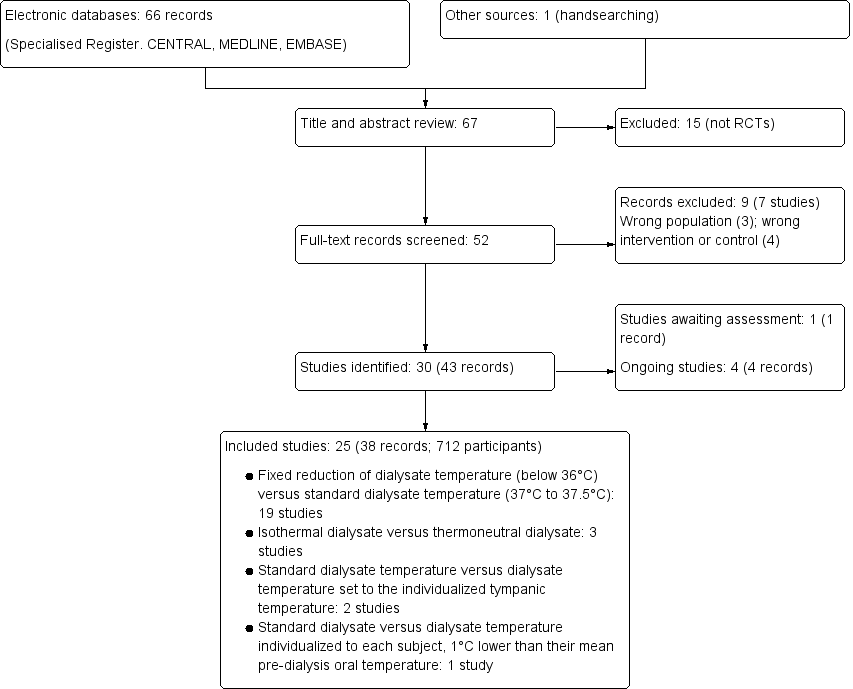
Study flow diagram
Included studies
See Characteristics of included studies.
Study design
Three studies were parallel RCTs (Niyyar 2006; Odudu 2012; Rad 2017) and 22 were cross‐over RCTs.
Sample size
Included studies were mainly small. Samples sizes ranged from 5 to 113 participants. Five studies included 50 or more participants (Ebrahimi 2017; Maggiore 2002; Odudu 2012; Rad 2017; Santoro 2002a).
Setting
Studies were mainly conducted in single centres. Twelve studies did not state the setting of participant recruitment (Beerenhout 2004; Gritters 2005; Manning 1995; Marants 2018; Niyyar 2006; Quereda 1988; Santoro 2002a; Selby 2006b; Shin 1994; Sterrett 1999; van der Sande 2009; Zitt 2008).
Participants
Different types of participants were included in different studies including stable, hypotension‐prone, or those not taking α‐ or β‐adrenergic blocking antihypertensive therapy. Eight studies did not report any eligibility criteria (Manning 1995; Marants 2018; Quereda 1988; Santoro 2002a; Sherman 1984; Sterrett 1999; van der Sande 2000; van der Sande 2001).
Interventions
Nineteen studies compared fixed reduction of dialysate temperature (below 36°C) and standard dialysate temperature (37°C to 37.5°C) (Ayoub 2004; Beerenhout 2004; Ebrahimi 2017; Gritters 2005; Jost 1993; Levy 1992; Manning 1995; Marants 2018; Odudu 2012; Parker 2007; Quereda 1988; Rad 2017; Sajadi 2016; Selby 2006b; Sherman 1984; Shin 1994; van der Sande 2000; van der Sande 2001; Zitt 2008). The differences in the prescribed dialysate temperature in the intervention and the control arms varied from 1°C to 2.2°C. Three studies used a biofeedback device and compared isothermal dialysate and thermoneutral dialysate (Maggiore 2002; Santoro 2002a; van der Sande 2009). In all studies, thermal balance was controlled by means of a Blood Temperature Monitor (BTM; Fresenius Medical Care, Bad Homberg, Germany). Of these, one study also compared reduction of arterial temperature using a biofeedback device, and isothermic dialysate and thermoneutral dialysate (van der Sande 2009). Two studies compared standard dialysate temperature and dialysate temperature set to the individualized tympanic temperature, measured by tympanic thermometer (Jefferies 2011; Sterrett 1999). One study compared standard dialysate and dialysate temperature individualized to each subject, 1°C lower than their mean pre‐dialysis oral temperature (Niyyar 2006).
Outcomes
We requested further information, including the first phase data of cross‐over studies such as baseline characteristics or outcomes, from the corresponding authors. The data were no longer available for Niyyar 2006, and we received no response from any other authors (Ayoub 2004; Beerenhout 2004; Ebrahimi 2017; Gritters 2005; Jefferies 2011; Jost 1993; Levy 1992; Maggiore 2002; Parker 2007; Quereda 1988; Sajadi 2016; Santoro 2002a; Selby 2006b; Sherman 1984; Shin 1994; Sterrett 1999; van der Sande 2000; van der Sande 2001; van der Sande 2009; Zitt 2008). The following reported outcomes included data based on paired comparisons.
-
IDH: 10 studies (286 participants) (Ayoub 2004; Ebrahimi 2017; Gritters 2005; Jost 1993; Levy 1992; Maggiore 2002; Quereda 1988; Selby 2006b; Sherman 1984; van der Sande 2009). The definition of IDH varied across studies. Five studies used the definition of a fall of systolic BP below 90 to 100 mmHg or a decrease of systolic BP by more than 10 mmHg, accompanied with hypotensive symptoms (Ayoub 2004; Jost 1993; Maggiore 2002; Sherman 1984; van der Sande 2009). Two studies defined IDH as systolic blood pressure < 90 mmHg irrespective of symptoms (Levy 1992; Quereda 1988), and two studies used a composite of those definitions above (Ebrahimi 2017; Selby 2006b). Gritters 2005 did not describe the definition of IDH
-
Discomfort rate due to cool dialysate: 7 studies (189 participants) (Ayoub 2004; Ebrahimi 2017; Jefferies 2011; Sajadi 2016; Selby 2006b; van der Sande 2000; van der Sande 2009).
-
QoL: one study (10 participants) examined QoL (Selby 2006b)
-
Dropout rate due to adverse events: 12 studies (412 participants) (Beerenhout 2004; Ebrahimi 2017; Jefferies 2011; Jost 1993; Levy 1992; Maggiore 2002; Odudu 2012; Parker 2007; Quereda 1988; Rad 2017; Selby 2006b; van der Sande 2009)
-
Blood pressure: 18 studies (415 participants) (Ayoub 2004; Beerenhout 2004; Ebrahimi 2017; Gritters 2005; Jefferies 2011; Jost 1993; Levy 1992; Manning 1995; Maggiore 2002; Parker 2007; Quereda 1988; Selby 2006b; Sherman 1984; Shin 1994; Sterrett 1999; van der Sande 2000; van der Sande 2001; van der Sande 2009; Zitt 2008).
-
Body temperature: 8 studies (205 participants) (Ayoub 2004; Beerenhout 2004; Jefferies 2011; Jost 1993; Maggiore 2002; van der Sande 2000; van der Sande 2001; van der Sande 2009).
-
Kt/Vurea: 2 studies (Ayoub 2004; Maggiore 2002).
-
Death (all causes), acute coronary syndrome, or all strokes were no reported by any of the included studies.
Excluded studies
Seven studies were excluded (see Characteristics of excluded studies).
Two studies (Lima 2006; Lima 2012) were of participants with acute kidney injury and one study (NCT02593526) was of HD‐naive participants. One study had a co‐intervention other than dialysate temperature in the intervention group (Veljancic 2011): one study (Maggiore 1987) compared standard dialysate and warmer dialysate, one study (Dheenan 2001) compared cold dialysate and different sodium concentration, and one study (Hecking 2012a) used blood volume‐monitored regulation as an intervention.
Risk of bias in included studies
Most studies were of unclear or high risk of bias. See Figure 2 and Figure 3.

Risk of bias graph: review authors' judgements about each risk of bias item presented as percentages across all included studies.
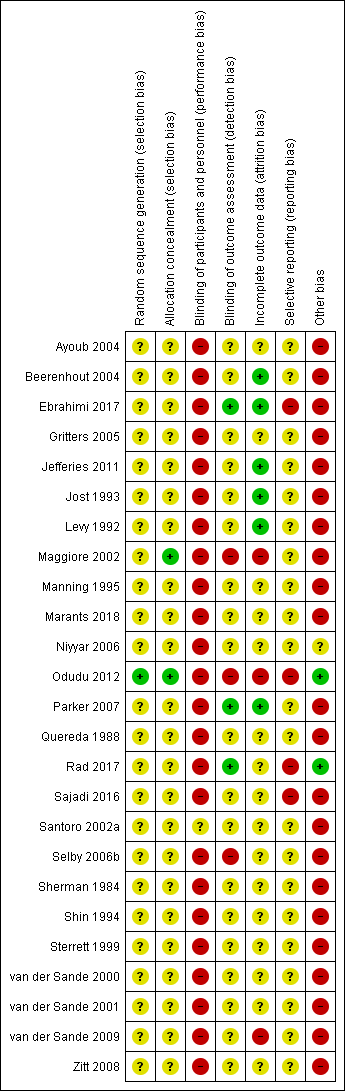
Risk of bias summary: review authors' judgements about each risk of bias item for each included study.
Allocation
Random sequence generation
One study (Odudu 2012) used a computer‐generated random sequence. The other studies gave no indication or stated only “block randomisation” and were categorized as unclear.
Allocation concealment
One study (Maggiore 2002) used central randomisation, and one study (Odudu 2012) used sealed envelopes. The other studies gave no description and were categorized as unclear.
Blinding
Performance bias
We judged that blinding of the intervention was broken due to the nature of the intervention when studies compared fixed reduction of dialysate temperature (below 36°C) and standard dialysate temperature. Santoro 2002a compared energetically neutral dialysis (a net thermal energy transfer from the dialysate to the blood circuit equal to zero) and thermally neutral dialysis (the pre‐dialysis patient core temperature was constant). This study was categorized as unclear because it was not clear whether the participants were aware of the intervention and there was no description about blinding.
Detection bias
Outcome assessors were blinded in two studies (Ebrahimi 2017; Rad 2017). Three studies were open label and were judged as high risk (Maggiore 2002; Odudu 2012; Selby 2006b). Other studies gave no description and were categorized as unclear.
Incomplete outcome data
Three studies were classified as high risk for incomplete outcomes because of the exclusion of more than 10% of participants from the final analysis (Maggiore 2002; Odudu 2012; van der Sande 2009). Six studies were classified as low risk (Beerenhout 2004; Ebrahimi 2017; Jefferies 2011; Jost 1993; Levy 1992; Parker 2007) as all or almost all participants were followed up, however, it should be noted that the first phase data of these studies were absent. Other studies were categorized as unclear.
Selective reporting
Five studies referred to their protocols (Ebrahimi 2017; Odudu 2012; Rad 2017; Sajadi 2016; Selby 2006b), but one was not accessible because the registry website was archived (Selby 2006b). Four studies with available protocols did not report pre‐defined outcomes, and did not pre‐define the cut‐off or reported outcomes with multiple cut‐offs (Ebrahimi 2017; Odudu 2012; Rad 2017; Sajadi 2016).
Other potential sources of bias
We judged cross‐over RCTs to be at high risk of bias due to the carry‐over effect. Moreover, we could not assess the baseline imbalance because these studies did not report the baseline characteristics classified by the interventions that the participants were allocated to in the first phase of the studies.
Effects of interventions
See: Summary of findings for the main comparison Fixed reduction of dialysate temperature compared to standard dialysate temperature for patients requiring haemodialysis; Summary of findings 2 Isothermal dialysate compared to thermoneutral dialysate in patients requiring haemodialysis
The random effects and fixed effect models gave similar results, therefore only the random effects results have been presented.
See: summary of findings Table for the main comparison and summary of findings Table 2 for the main comparisons
Fixed reduction of dialysate temperature versus standard dialysate temperature
Intradialytic hypotension rate
Fixed reduction of dialysate temperature might improve IDH rate compared with standard dialysate (Analysis 1.1 (8 studies, 153 participants): rate ratio 0.52, 95% CI 0.34 to 0.80; I2 = 19%; very low certainty evidence).
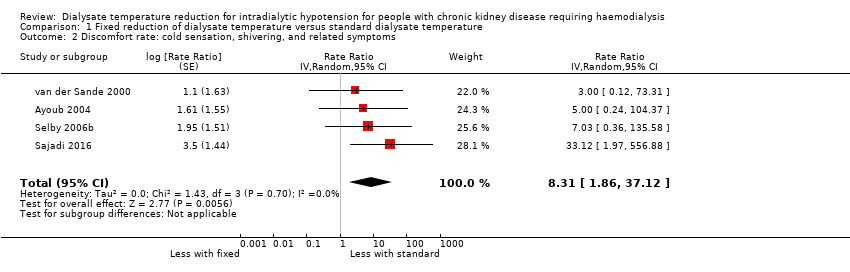
Discomfort rate
Fixed reduction of dialysate temperature might increase the discomfort rate compared with standard dialysate (Analysis 1.2 (4 studies, 161 participants): rate ratio 8.31, 95% CI 1.86 to 37.12; I2 = 0%; very low certainty evidence). However, we could not incorporate Ebrahimi 2017 into the meta‐analysis because it did not report the data but only mentioned that the discomfort rate did not differ between the cool dialysate and standard dialysate groups. The discomfort rate in the fixed reduction of the dialysate temperature group varied across the studies and ranged from 6.7% to 34.8%.
Death (all causes)
Death was no reported by any of the included studies.
Quality of life
Selby 2006b (10 participants) reported no differences in QoL between fixed reduction and standard dialysate as rated by the SF‐36 questionnaire (median 62 (IQR 50 to 73) with 35°C and median 61 (IQR 39 to 78) with 37°C)
Dropouts due to adverse events
Nine studies (268 participants) reported the number of dropouts, and showed that there were no dropouts due to adverse events (Beerenhout 2004; Ebrahimi 2017; Jost 1993; Levy 1992; Odudu 2012; Parker 2007; Quereda 1988; Rad 2017; Selby 2006b).
Mean blood pressure at the end of haemodialysis
We used mean BP at the end of dialysis because it was the most frequently reported BP measure in the included studies. Fixed reduction of dialysate temperature might improve the mean BP at the end of dialysis (Analysis 1.3 (8 studies, 94 participants): MD 6.46 mmHg, 95% CI 2.84 to 10.08; I2 = 0%; very low certainty evidence).
All seven studies that did not report the mean BP at the end of dialysis but reported other measures of BP, reported that systolic BP or mean BP was higher in the fixed reduction of dialysate temperature group (Beerenhout 2004; Ebrahimi 2017; Gritters 2005; Parker 2007; Quereda 1988; Selby 2006b; Shin 1994).
Change in body temperature during haemodialysis
We examined change in body temperature during dialysis because the lowest body temperature was not available. Fixed reduction of dialysate temperature might decrease body temperature (Analysis 1.4 (4 studies, 46 participants): MD ‐0.44°C, 95% CI ‐0.56 to ‐0.32; I2 = 0%; very low certainty evidence). We could not incorporate the results from van der Sande 2000 as the data were only presented as a graph (Figure 1, page 1514).
Urea clearance‐based dialysis adequacy (Kt/Vurea)
Ayoub 2004 reported that there was no significant difference in Kt/Vurea between the cool dialysate and standard dialysate groups.
Post‐haemodialysis fatigue
Sajadi 2016 (46 participants) reported isothermal dialysate might reduce post‐HD fatigue scores using the Piper Fatigue Scale.
Ebrahimi 2017 (80 participants) reported no difference in fatigue between cool dialysate and standard dialysate (data not provided).
Isothermal dialysate versus thermoneutral dialysate
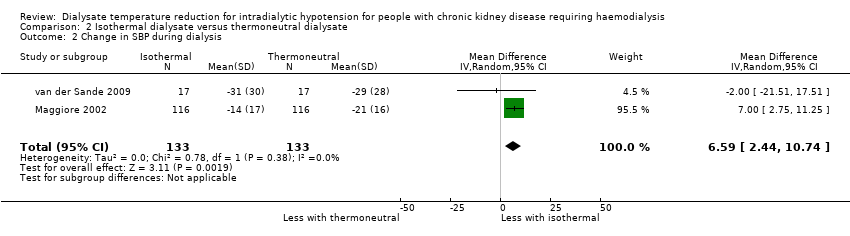
Intradialytic hypotension rate
Isothermal dialysate might improve the IDH rate compared with thermoneutral dialysate (Analysis 2.1 (2 studies, 133 participants): rate ratio 0.68, 95% CI 0.60 to 0.76; I2 = 0%; very low certainty evidence).
Discomfort rate
Maggiore 2002 (116 participants) reported that none of the participants allocated to isothermal or thermoneutral dialysate experienced shivering.
Death (all causes)
No study reported death.
Dropouts due to adverse events
Two studies (133 participants) reported there were no dropouts due to adverse events (Maggiore 2002; van der Sande 2009).
Changes in systolic blood pressure during haemodialysis
We used change in SBP during dialysis because it was the most frequently reported BP measures in the included studies. Isothermal dialysate might improve SBP during dialysis (Analysis 2.2 (2 studies, 133 participants): MD 6.59 mmHg, 95% CI 2.44 to 10.74; I2 = 0%; very low certainty evidence).
Change in body temperature during haemodialysis
We examined change in body temperature during dialysis because the lowest body temperature was not available. Isothermal dialysate might decrease the body temperature compared with thermoneutral dialysate (Analysis 2.3 (2 studies, 133 participants); MD ‐0.40°C, 95% CI ‐0.60 to ‐0.21; I2 = 95%; very low certainty evidence).
Urea clearance‐based dialysis adequacy (Kt/Vurea)
Maggiore 2002 (116 participants) reported isothermal dialysate did not decrease dialysis efficiency.
Reduction of arterial temperature using biofeedback device versus isothermal dialysate
van der Sande 2009 compared reduction of arterial temperature using biofeedback device and isothermal dialysate.
Intradialytic hypotension rate
There were three episodes of hypotension in the cooling group and three episodes in the isothermal group.
Discomfort rate
Three of 17 participants (17.6%) allocated to the reduction of arterial temperature group complained of shivering, however none of the participants allocated to the isothermal dialysate group reported shivering.
Lowest blood pressure during haemodialysis
It was unclear whether reduction of arterial temperature using a biofeedback device improved lowest BP during HD compared with isothermal dialysis.
Other methods of reduction of dialysate temperature versus standard dialysate temperature
Two studies evaluated the effect of dialysate temperature set to the individualized temperature of each individual participant compared with standard dialysate (Jefferies 2011; Sterrett 1999).
One study compared dialysate temperature individualized to each participant 1°C lower than their mean pre‐dialysis oral temperature and standard dialysate temperature (Niyyar 2006).
One study compared reduction of arterial temperature using a biofeedback device with thermoneutral dialysis (van der Sande 2009).
Intradialytic hypotension rate
van der Sande 2009 reported one episode of hypotension in the cooling group and three episodes in the thermoneutral group.
Discomfort rate
van der Sande 2009 reported three patients in the reduction of arterial temperature group complained of shivering and no patients experienced shivering in the thermoneutral group.
Jefferies 2011 reported that 4/11 patients (36.4%) felt cold and used blankets or extra clothing at least once during the week in the individualized temperature group and 1/11 (9.1%) reported shivering, and no patients allocated to standard dialysate experienced discomfort.
Dropouts due to adverse events
Two studies reported that there were no dropouts due to adverse events (Jefferies 2011; van der Sande 2009).
Lowest blood pressure during haemodialysis
Jefferies 2011 and Sterrett 1999 only reported statistical significance or displayed BP in figures. Both studies reported that the SBP was higher among those with a dialysate temperature set to the individualized temperature of each individual patient.
It was unclear whether reduction of arterial temperature using a biofeedback device improved lowest BP during HD compared with thermoneutral dialysis (van der Sande 2009).
Lowest body temperature during haemodialysis
van der Sande 2009 reported reduction of arterial temperature using a biofeedback device might reduce body temperature compared with thermoneutral dialysis.
Jefferies 2011 reported that body temperature was decreased in the group allocated to dialysate temperature set to the individualized temperature of each individual participant, compared with the standard dialysate group (data not provided).
Discussion
Summary of main results
We found very low quality evidence that fixed reduction of dialysate temperature decreased the incidence of IDH compared with standard dialysate and increased the discomfort rate compared with standard dialysate. However, no study reported the long‐term outcomes such as death (all causes) or coronary artery syndrome. Based on very low evidence, isothermal dialysate might reduce the IDH rate without discomfort. It should be noted that these results were not based on parallel comparisons. These results were drawn from comparisons between before and after data from cross‐over studies.
Overall completeness and applicability of evidence
Seventeen of the 23 included studies were conducted over a decade ago. Practice in the treatment of patients undergoing HD has changed significantly over the years, and the difference in practice may lower external validity. Notably, dialysed patients with IDH risk factors such as older age, type II diabetes, and higher dialysate dose are increasing (Mc Causland 2013; National Kidney Foundation 2015; Pippias 2016; Sands 2014). For example, the incidence of patients older than 75 requiring HD has increased in Europe (Pippias 2016). The National Kidney Foundation’s Kidney Disease Outcomes Quality Initiative (KDOQI) recommended a target single pool Kt/V (spKt/V) of 1.4/HD session for patients treated three times/week (Mc Causland 2013; National Kidney Foundation 2015). The changes in reimbursement policies might also affect the practice. In 2011, the Centers for Medicare & Medicaid Services (CMS) administered the End‐Stage Renal Disease (ESRD) Quality Incentive Program (QIP) that proposed the target dialysis dose or anaemia level to promote high‐quality care through outpatient dialysis centres (Centers for Medicare & Medicaid Services 2016). In Europe, age at the start of RRT has risen over the last decade and the prevalence of cardiovascular co‐morbidities has decreased, while the prevalence of DM and malignancy has increased (Ceretta 2018).
Additionally, as shown in the Characteristics of included studies table, some studies did not report the eligibility criteria (Manning 1995; Marants 2018; Quereda 1988; Santoro 2002a; Sherman 1984; Sterrett 1999; van der Sande 2000; van der Sande 2001), and most studies did not report whether they used consecutive sampling. We therefore concluded that our evidence had low external validity.
Quality of the evidence
We graded the certainty of the evidence using the Grading of Recommendations Assessment, Development and Evaluation (GRADE) approach (GRADE 2008). As shown in the summary of findings Table for the main comparison, and summary of findings Table 2 for the main comparison, we rated the overall certainty of evidence in this review as very low because of the serious issues with risks of bias, and the number of participants that comprised quantitative syntheses was less than the optimal information size of 400 (Guyatt 2011). As shown in Figure 3, most studies had high or unclear risks of bias for most domains of the study reporting that we assessed. The design, conduct, and analysis of the included studies were difficult to assess in most studies due to a lack of important methodological detail.
Potential biases in the review process
This review has several limitations. First, the results we have presented were not based on parallel group comparisons but a within‐person comparison. We should note the presence of a carry‐over effect when interpreting the results. For example, if there was an IDH in the first phase, clinicians or medical staff would attempt to prevent the event again. Most studies were cross‐over RCTs and data from the first phase were not available, even though we tried to contact the authors three times. Secondly, as many of the included studies were old, we could not check whether unpublished studies existed, especially those conducted before the compulsory policy of trial registration adopted by the International Committee of Medical Journals in 2004 (De Angelis 2004). Additionally, most studies did not report any information about trial registration. Publication bias might potentially exist even though we performed a comprehensive systematic search strategy of the Cochrane Kidney and Transplant's Specialised Register.
Agreements and disagreements with other studies or reviews
Our findings showed similar results with the findings from a previous systematic review (Mustafa 2016). Cool dialysate might reduce the incidence of IDH, but it might increase the discomfort rate. Additionally, no study reported other serious adverse events, or dropouts due to adverse events. However, most studies that did not report IDH events introduced the effect of cool dialysate on IDH in their background section. From a clinical perspective, IDH events should be routinely noted in medical records, and reported in the publication. The frequency of IDH in the standard dialysate group of the included studies was consistent with previous reports (Davenport 2008a; Davenport 2008b).

Study flow diagram
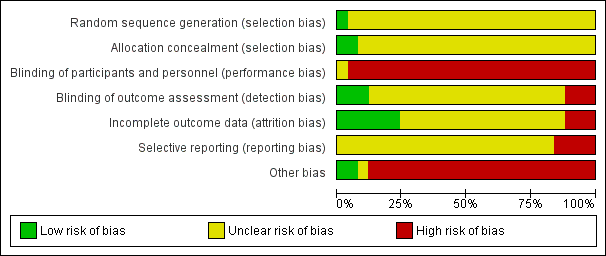
Risk of bias graph: review authors' judgements about each risk of bias item presented as percentages across all included studies.

Risk of bias summary: review authors' judgements about each risk of bias item for each included study.

Comparison 1 Fixed reduction of dialysate temperature versus standard dialysate temperature, Outcome 1 Intradialytic hypotension.
Comparison 1 Fixed reduction of dialysate temperature versus standard dialysate temperature, Outcome 2 Discomfort rate: cold sensation, shivering, and related symptoms.
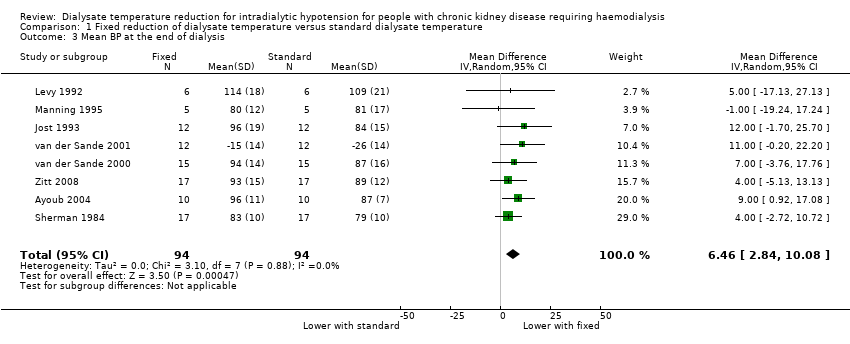
Comparison 1 Fixed reduction of dialysate temperature versus standard dialysate temperature, Outcome 3 Mean BP at the end of dialysis.
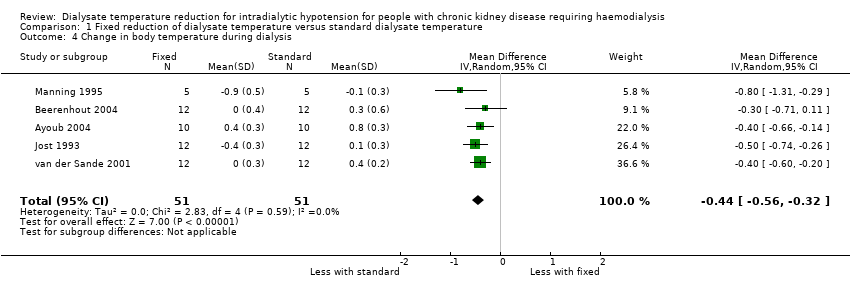
Comparison 1 Fixed reduction of dialysate temperature versus standard dialysate temperature, Outcome 4 Change in body temperature during dialysis.

Comparison 2 Isothermal dialysate versus thermoneutral dialysate, Outcome 1 Intradialytic hypotension.
Comparison 2 Isothermal dialysate versus thermoneutral dialysate, Outcome 2 Change in SBP during dialysis.
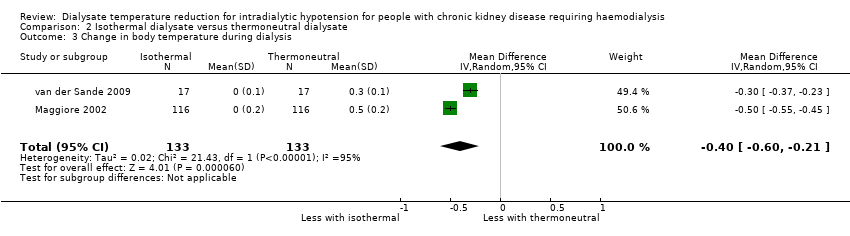
Comparison 2 Isothermal dialysate versus thermoneutral dialysate, Outcome 3 Change in body temperature during dialysis.
| Fixed reduction of dialysate temperature compared to standard dialysate temperature for patients requiring haemodialysis | |||||
| Patient or population: patients requiring haemodialysis | |||||
| Outcomes | Anticipated absolute effects* (95% CI) | Relative effect | No. of participants | Certainty of the evidence | |
| Risk with standard dialysate temperature | Risk with fixed reduction of dialysate temperature | ||||
| Intradialytic hypotension rate | 251 episodes per 1,000 person‐dialysis session | 131 episodes per 1,000 person‐dialysis session | RR 0.52 | 153 (8) | ⊕⊝⊝⊝ |
| Discomfort rate | 25 episodes per 1,000 person‐dialysis session | 208 episodes per 1,000 person‐dialysis session | Rate ratio 8.31 | 81 (4) | ⊕⊝⊝⊝ |
| Dropout due to adverse events | Nine studies (268 participants) reported there were no dropouts due to adverse events | ‐ | 268 (9) | Not graded | |
| Death (all causes) | No studies reported the outcome | ‐ | ‐ | ‐ | |
| Acute coronary syndrome | No studies reported the outcome | ‐ | ‐ | ‐ | |
| Stroke | No studies reported the outcome | ‐ | ‐ | ‐ | |
| *The risk in the intervention group (and its 95% confidence interval) is based on the assumed risk in the comparison group and the relative effect of the intervention (and its 95% CI). | |||||
| GRADE Working Group grades of evidence | |||||
| 1 Downgraded two levels due to serious risk of bias: all included studies were randomised cross‐over studies and carry‐over effects could be biased the result. Additionally, all studies were rated high or unclear risk of bias in at least four domains 2 Downgraded one level due to serious imprecision: the total sample size included in the analysis were less than optimal information size | |||||
| Isothermal dialysate compared to thermoneutral dialysate in patients requiring haemodialysis | |||||
| Patient or population: patients requiring haemodialysis | |||||
| Outcomes | Anticipated absolute effects* (95% CI) | Relative effect | No. of participants | Certainty of the evidence | |
| Risk with thermoneutral dialysate | Risk with Isothermal dialysate | ||||
| Intradialytic hypotension rate | 410 episodes per 1,000 person‐dialysis session | 279 episodes per 1,000 person‐dialysis session | Rate ratio 0.68 | 133 (2) | ⊕⊝⊝⊝ |
| Discomfort rate | One study reported that none of the patients allocated to isothermal or thermoneutral dialysate experienced shivering | ‐ | 17 (1) | Not graded | |
| Dropout due to adverse event | There were no reported dropouts due to adverse events in the 2 studies | ‐ | 133 (2) | Not graded | |
| Death (all causes) | No study reported the outcome | ‐ | ‐ | ‐ | |
| Acute coronary syndrome | No study reported the outcome | ‐ | ‐ | ‐ | |
| Stroke | No study reported the outcome | ‐ | ‐ | ‐ | |
| *The risk in the intervention group (and its 95% confidence interval) is based on the assumed risk in the comparison group and the relative effect of the intervention (and its 95% CI). | |||||
| GRADE Working Group grades of evidence | |||||
| 1 Downgraded two levels due to serious risk of bias: all included studies were randomised cross‐over studies and carry‐over effects could be biased the result. Additionally, all studies were rated high or unclear risk of bias in at least four domains 2 Downgraded one level due to serious imprecision: the total sample size included in the analysis were less than optimal information size | |||||
| Outcome or subgroup title | No. of studies | No. of participants | Statistical method | Effect size |
| 1 Intradialytic hypotension Show forest plot | 8 | Rate Ratio (Random, 95% CI) | 0.52 [0.34, 0.80] | |
| 2 Discomfort rate: cold sensation, shivering, and related symptoms Show forest plot | 4 | Rate Ratio (Random, 95% CI) | 8.31 [1.86, 37.12] | |
| 3 Mean BP at the end of dialysis Show forest plot | 8 | 188 | Mean Difference (IV, Random, 95% CI) | 6.46 [2.84, 10.08] |
| 4 Change in body temperature during dialysis Show forest plot | 5 | 102 | Mean Difference (IV, Random, 95% CI) | ‐0.44 [‐0.56, ‐0.32] |
| Outcome or subgroup title | No. of studies | No. of participants | Statistical method | Effect size |
| 1 Intradialytic hypotension Show forest plot | 2 | Rate Ratio (Random, 95% CI) | 0.68 [0.60, 0.76] | |
| 2 Change in SBP during dialysis Show forest plot | 2 | 266 | Mean Difference (IV, Random, 95% CI) | 6.59 [2.44, 10.74] |
| 3 Change in body temperature during dialysis Show forest plot | 2 | 266 | Mean Difference (IV, Random, 95% CI) | ‐0.40 [‐0.60, ‐0.21] |