Intervenciones para reducir los efectos adversos gastrointestinales agudos y tardíos de la radioterapia pélvica para el cáncer pélvico primario
Resumen
Antecedentes
Un número cada vez mayor de pacientes sobreviven al cáncer, pero una proporción significativa tiene efectos secundarios gastrointestinales como resultado de la radioterapia (RT), que deterioran su calidad de vida (CdV).
Objetivos
Determinar qué intervenciones profilácticas reducen la incidencia, la gravedad o ambos, de los efectos adversos gastrointestinales entre pacientes adultos que reciben radioterapia para tratar el cáncer pélvico primario.
Métodos de búsqueda
Se hicieron búsquedas en CENTRAL, MEDLINE y Embase en Septiembre 2016 y se actualizaron el 2 noviembre 2017. También se hicieron búsquedas en registros de ensayos clínicos.
Criterios de selección
Se incluyeron los ensayos controlados aleatorizados (ECA) de intervenciones para prevenir los efectos adversos gastrointestinales de la radioterapia pélvica en adultos que recibieron radioterapia para tratar el cáncer pélvico primario, incluidas las técnicas de radioterapia, otros aspectos de la administración de la radioterapia, las intervenciones farmacológicas y las intervenciones no farmacológicas. Los estudios debían tener un tamaño muestral de 20 o más participantes y debían evaluar desenlaces de toxicidad gastrointestinal. Se excluyeron los estudios que evaluaron sólo los parámetros dosimétricos. También se excluyeron los ensayos de intervenciones para tratar los síntomas gastrointestinales agudos, los ensayos de esquemas de dosis fraccionadas modificadas y de aumento gradual, y los ensayos de regímenes de radioterapia preoperatorios versus posoperatorios, para limitar el alcance tan amplio de la revisión.
Obtención y análisis de los datos
Se utilizó la metodología Cochrane estándar. Se utilizó el modelo estadístico de efectos aleatorios para todos los metanálisis y el sistema GRADE para calificar la fiabilidad de la evidencia.
Resultados principales
Se incluyeron 92 ECA con más de 10 000 hombres y mujeres que recibieron radioterapia pélvica. Los ensayos incluyeron 44 intervenciones diferentes como técnicas de radioterapia (11 ensayos, cuatro intervenciones / comparaciones), otros aspectos de la administración de la radioterapia (14 ensayos, diez intervenciones), intervenciones farmacológicas (38 ensayos, 16 intervenciones) e intervenciones no farmacológicas (29 ensayos, 13 intervenciones). La mayoría de los estudios (79/92) tenía limitaciones de diseño. Trece estudios tenían un bajo riesgo de sesgo, 50 estudios tenían un riesgo poco claro de sesgo y 29 estudios tenían un alto riesgo de sesgo. Los principales hallazgos incluyen lo siguiente:
Técnicas de radioterapia: La radioterapia de intensidad modulada (RTIM) versus RT conformada 3D (RTC3D) puede reducir la toxicidad gastrointestinal (GI) aguda (razón de riesgos de riesgos [RR] 0,48; intervalo de confianza [IC] del 95%: 0,26 a 0,88; participantes = 444; estudios = cuatro; I2 = 77%; evidencia de certeza baja) y tardía (GI) grado 2+ (RR 0,37; IC del 95%: 0,21 a 0,65; participantes = 332; estudios = dos; I2 = 0%; evidencia de certeza baja). La RT conformada (RTC3D o RTIM) versus la RT convencional reduce la toxicidad GI aguda grado 2+ (RR 0,57; IC del 95%: 0,40 a 0,82; participantes = 307; estudios = dos; I2 = 0%; evidencia de certeza alta) y probablemente da lugar a menos toxicidad GI tardía grado 2+ (RR 0,49; IC del 95%: 0,22 a 1,09; participantes = 517; estudios = tres; I2 = 44%; evidencia de certeza moderada). Cuando se utiliza braquiterapia (BT) en lugar de radioterapia de haz externo (RTHE) en el cáncer endometrial temprano, la evidencia indica que reduce la toxicidad GI aguda (grado 2+) (RR 0,02; IC del 95%: 0,00 a 0,18; participantes = 423; estudios = uno; evidencia de certeza alta).
Otros aspectos de la administración de la radioterapia: Probablemente hay poca o ninguna diferencia en la toxicidad GI aguda grado 2+ con la reducción del volumen de la dosis de radiación (RR 1,21; IC del 95%: 0,81 a 1,81; participantes = 211; estudios = uno; evidencia de certeza moderada) y podría no haber diferencias en la toxicidad GI tardía grado 2+ (RR 1,02; IC del 95%: 0,15 a 6,97; participantes = 107; estudios = uno; evidencia de certeza baja). La administración vespertina de la RT puede reducir la toxicidad GI aguda (diarrea) grado 2+ durante la RT en comparación con la administración matutina de la RT (RR 0,51; IC del 95%: 0,34 a 0,76; participantes = 294; estudios = dos; I2 = 0%; evidencia de certeza baja). Puede no haber diferencias en la toxicidad GI aguda (RR 2,22; IC del 95%: 0,62 a 7,93; participantes = 110; estudios = uno) y tardía grado 2+ (RR 0,44; IC del 95%: 0,12 a 1,65; participantes = 81; estudios = uno) entre una preparación del volumen vesical de 1080 ml y de 540 ml (evidencia de certeza baja). La evidencia de certeza baja sobre los separadores de globo o de hidrogel indica que estas intervenciones en la RT del cáncer de próstata pueden lograr poco o ningún cambio en los desenlaces GI.
Intervenciones farmacológicas: La evidencia de cualquier efecto beneficioso de los aminosalicilatos, el sucralfato, la amifostina, los enemas de corticosteroides, los secuestradores de ácidos biliares, la famotidina y el selenio es de certeza baja o muy baja. Sin embargo, la evidencia sobre algunos aminosalicilatos (mesalazina, olsalazina), los supositorios de misoprostol, el óxido de magnesio oral y las inyecciones de octreotide indica que estos agentes podrían empeorar los síntomas GI como la diarrea o la hemorragia rectal.
Intervenciones no farmacológicas: La evidencia de certeza baja indica que los suplementos de proteínas (RR 0,23; IC del 95%: 0,07 a 0,74; participantes = 74; estudios = uno), el asesoramiento dietético (RR 0,04; IC del 95%: 0,00 a 0,60; participantes = 74; estudios = uno) y los probióticos (CR 0,43; IC del 95%: 0,22 a 0,82; participantes = 923; estudios = cinco; I2 = 91%) podrían reducir la diarrea aguda relacionada con la RT (grado 2+). El asesoramiento dietético también puede reducir los síntomas diarreicos a largo plazo (a los cinco años, RR 0,05; IC del 95%: 0,00 a 0,78; participantes = 61, estudios = uno). Evidencia de certeza baja de un estudio (108 participantes) indica que una dieta rica en fibra puede tener un efecto beneficioso sobre los síntomas GI (diferencia de medias [DM] 6,10; IC del 95%: 1,71 a 10,49) y la calidad de vida (DM 20,50; IC del 95%: 9,97 a 31,03) al año. Evidencia de certeza alta indica que los suplementos de glutamina no previenen la diarrea inducida por la RT. Falta evidencia en otras intervenciones no farmacológicas como los comprimidos de té verde.
La calidad de vida se informó pocas veces y de manera no consistente en los estudios incluidos, y los datos disponibles rara vez fueron adecuados para el metanálisis.
Conclusiones de los autores
Las técnicas de radioterapia conformada representan una mejoría con respecto a las técnicas más antiguas de radioterapia. La RTIM podría ser mejor que la RTC3D en cuanto a la toxicidad GI, pero la evidencia para apoyarla no está clara. No existe evidencia de alta calidad para apoyar el uso de otras intervenciones profilácticas evaluadas. Sin embargo, la evidencia sobre algunas posibles intervenciones indica que probablemente no tienen una función en la reducción de la toxicidad GI relacionada con la RT. Se necesitan más ECA sobre intervenciones con evidencia limitada que indique posibles efectos beneficiosos.
PICO
Resumen en términos sencillos
Intervenciones para reducir los efectos secundarios digestivos del la radioterapia pélvica
Antecedentes
La radioterapia (RT; tratamiento con rayos X) es un tratamiento anticancerígeno habitual que a menudo cura a las personas de su cáncer, pero puede dañar el sistema gastrointestinal (digestivo) y da lugar a efectos secundarios gastrointestinales molestos a corto (agudos) y largo (tardíos) plazo, que pueden aparecer muchos meses o años después de haber finalizado la radioterapia. Estos efectos secundarios como la diarrea, la urgencia fecal (la necesidad súbita de defecar) y la incontinencia fecal (pérdida de heces del recto) pueden dañar la calidad de vida (CdV) de las personas. Esta revisión se realizó para establecer si hay tratamientos que se les puedan administrar a las personas que reciben radioterapia (RT) pélvica para reducir los efectos secundarios gastrointestinales.
Métodos
Se buscó en la bibliografía médica hasta el 2 de noviembre de 2017 y se seleccionaron los ensayos controlados aleatorizados (ECA) de cualquier tratamiento preventivo (intervención) administrado a las personas sometidos a RT para el cáncer pélvico (como cánceres de vejiga, de endometrio, de cuello uterino, de recto y de próstata). Se combinaron los datos de ECA similares para proporcionar una estimación general del efecto de una intervención, y la fiabilidad (certeza) de los resultados se evaluó mediante los métodos establecidos (GRADE).
Resultados
Se identificaron 92 ECA que incluyeron 44 intervenciones diferentes para reducir los efectos secundarios gastrointestinales relacionados con la RT. Se incluyeron los métodos nuevos (técnicas de RT) y otros aspectos de la administración de la RT (dosis más bajas de RT, diferentes volúmenes vesicales, administración matutina o vespertina de la RT, geles inyectados o globos [separadores] insertados por el recto para protegerlo, y otras opciones), tratamientos farmacológicos (aminosalicilatos, amifostina, corticosteroides, famotidina, octreotide, óxido de magnesio, misoprostol, selenio, butirato de sodio, esmectita, sucralfato, superóxido dismutasa) y no farmacológicos (diferentes tipos de dietas, glutamina, asesoramiento, té verde y otras opciones). Se encontró alguna evidencia que indicó que ciertas intervenciones no tienen una función en la reducción de los efectos secundarios gastrointestinales (en particular la administración de suplementos de glutamina, los supositorios de misoprostol, el óxido de magnesio oral y las inyecciones de octreotide). Sin embargo, se encontró poca evidencia de calidad (fiabilidad moderada o alta) que mostrara que cualquiera de las opciones es útil. La excepción a lo anterior es la evidencia sobre las técnicas de RT, que muestra que las técnicas de RT conformada (modernas) son mejores que las técnicas más antiguas de RT, y la evidencia de que la braquiterapia vaginal (pequeñas esferas radiactivas colocadas en la vagina) para el cáncer endometrial temprano reduce los efectos secundarios gastrointestinales agudos en comparación con la radioterapia de haz externo.
Conclusiones
Los métodos modernos de RT (conformada) son útiles para reducir los efectos secundarios relacionados con la RT. No hay evidencia suficiente para apoyar de manera consistente el uso de cualquier fármaco concreto u opción no farmacológica u otro dispositivo/opción de administración de la RT para reducir los efectos gastrointestinales relacionados con la RT. Se necesitan más estudios de investigación de calidad alta.
Authors' conclusions
Summary of findings
| Conformal RT compared with conventional RT to reduce adverse GI effects of radiotherapy | ||||||
| Patient or population: People with urological (prostate) gynaecological (cervical) cancer Settings: Tertiary care setting Intervention: Conformal RT (3DCRT and IMRT) Comparison: Conventional RT | ||||||
| Outcomes | Illustrative comparative risks* (95% CI) | Relative effect | No of Participants | Quality/certainty of the evidence | Comments | |
|---|---|---|---|---|---|---|
| Assumed risk | Corresponding risk | |||||
| Conventional RT | Conformal RT (3DCRT and IMRT) | |||||
| Mean GI symptom scores | ‐ | ‐ | Not estimable | 0 | ‐ | No data |
| Acute and late GI toxicity grade 2+ | Acute toxicity (up to 3 months post‐RT): 365 per 1000 | Acute toxicity (up to 3 months post‐RT): 208 per 1000 | RR 0.57 (0.40 to 0.82) | 307 | ⊕⊕⊕⊕ | The effects in 3DCRT and IMRT subgroups were consistent with the overall effect estimate |
| Late toxicity (from 6 months post‐RT): 155 per 1000 | Late toxicity (from 6 months post‐RT): 76 per 1000 | RR0.49 (0.22 to 1.09) | 517 | ⊕⊕⊕⊝ | The effects in 3DCRT and IMRT subgroups were consistent with the overall effect estimate but there was substantial heterogeneity within the 3DCRT subgroup (I2 = 60%) | |
| Diarrhoea (grade 2+) | ‐ | ‐ | Not estimable | 0 | ‐ | No data |
| QoL scores | ‐ | ‐ | Not estimable | 0 | ‐ | No data |
| *The basis for the assumed risk is the mean control group risk across studies. The corresponding risk (and its 95% confidence interval) is based on the assumed risk in the comparison group and the relative effect of the intervention (and its 95% CI). | ||||||
| GRADE Working Group grades of evidence | ||||||
| 1Downgraded one level due to imprecision (wide confidence interval crossing the line of no effect). | ||||||
| IMRT compared with 3DCRT to reduce adverse GI effects of radiotherapy | ||||||
| Patient or population: People with urological (prostate) and gynaecological (cervical) cancer Settings: Tertiary care setting Intervention: IMRT Comparison: 3DCRT | ||||||
| Outcomes | Illustrative comparative risks* (95% CI) | Relative effect | No of Participants | Quality/certainty of the evidence | Comments | |
|---|---|---|---|---|---|---|
| Assumed risk | Corresponding risk | |||||
| 3DCRT | IMRT | |||||
| Mean GI symptom scores (EORTC‐QLQPR25 scale; lower scores better) | At 6 months post‐RT, the mean GI symptom score in the control group was | At 6 months post‐RT, the mean GI symptom score in the intervention group was | MD ‐5.00 (‐9.06 to ‐0.94) | 181 | ⊕⊕⊝⊝ | ‐ |
| Acute and late GI toxicity Grade 2+ | Acute toxicity (up to 3 months post‐RT): 445 per 1000 | Acute toxicity (up to 3 months post‐RT): 214 per 1000 | RR 0.48 (0.26 to 0.88) | 444 | ⊕⊕⊝⊝ | Inconsistency was present between studies in the gynaecological cancer subgroup but not between gynaecological and urological subgroups |
| Late toxicity (from 6 months post‐RT): 228 per 1000 | Late toxicity (from 6 months post‐RT): 84 per 1000 | RR0.37 (0.21 to 0.65) | 332 | ⊕⊕⊝⊝ | Findings were consistent across gynaecological and urological subgroups. | |
| Diarrhoea (grade 2+) | Acute toxicity (up to 3 months post‐RT): 720 per 1000 | Acute toxicity (up to 3 months after RT): 273 per 1000 | RR 0.38 (0.22 to 0.68) | 72 | ⊕⊕⊝⊝ low1, 5 | ‐ |
| QoL scores | ‐ | ‐ | Not estimable | 0 | ‐ | No data |
| *The basis for the assumed risk is the mean control group risk across studies. The corresponding risk (and its 95% confidence interval) is based on the assumed risk in the comparison group and the relative effect of the intervention (and its 95% CI). | ||||||
| GRADE Working Group grades of evidence | ||||||
| 1Downgraded one level for design limitations (unclear risk of bias). | ||||||
| BT compared with EBRT to reduce adverse GI effects of radiotherapy | ||||||
| Patient or population: People with urological (prostate) and gynaecological (endometrial) cancer Settings: Tertiary care settings Intervention: BT Comparison: EBRT | ||||||
| Outcomes | Illustrative comparative risks* (95% CI) | Relative effect | No of Participants | Quality/certainty of the evidence | Comments | |
|---|---|---|---|---|---|---|
| Assumed risk | Corresponding risk | |||||
| EBRT | BT | |||||
| Mean GI symptom scores | ‐ | ‐ | Not estimable | 348 (1) | ‐ | 1 high‐quality study reported data on GI symptom scores at various time points after radiotherapy up to 5 years. Due to the numberous time points and domains, we could not use these data in the review meta‐analysis in a meaningful way. However, the findings favoured BT for 'limitation in daily activities due to bowel symptoms' (P < 0.001), faecal leakage (P < 0.001) and rectal blood loss (P = 0.04) at most time points up to 5 years post‐radiotherapy |
| Acute and late GI toxicity (grade 2+) | Acute GI toxicity (Up to 3 months after RT): ‐ | Acute GI toxicity (Up to 3 months after RT): ‐ | not pooled | not pooled | ‐ | Due to clinical and statistical heterogeneity, data from the two relevant studies were not pooled for this outcome and subgroup evidence was graded separately. Evidence from the urological (prostate) cancer was graded as very low certainty. However, the evidence in favour of BT from the one study in the 'gynaecological cancer' subgroup was graded as high‐certainty (RR 0.02, 95% CI 0.00 to 0.18; participants = 423; studies = 1). |
| Late GI toxicity (from 6 months post‐RT): 26 per 1000 | Late GI toxicity (from 6 months post‐RT): 4 per 1000 | RR 0.16 (0.02 to 1.33) | 423 | ⊕⊕⊝⊝ | ‐ | |
| Diarrhoea (grade 2+) | Acute diarrhoea (Up to 3 months after RT) | ‐ | Not estimable | 0 | ‐ | No data |
| QoL scores (EORTC Q30) | Measured in one study at various time points up to 5 years and beyond | ‐ | Not estimable | 348 (1) | ‐ | 1 high‐quality study reported data on QoL scores at various time points after radiotherapy to 5 years and found no clear difference in global health status between BT and EBRT groups |
| *The basis for the assumed risk is the mean control group risk across studies. The corresponding risk (and its 95% confidence interval) is based on the assumed risk in the comparison group and the relative effect of the intervention (and its 95% CI). | ||||||
| GRADE Working Group grades of evidence | ||||||
| 1Downgraded for inconsistency (I2 = 74%). | ||||||
| Reduced radiation dose volume compared with standard dose volume to reduce adverse GI effects of radiotherapy | ||||||
| Patients/population: People undergoing RT for pelvic cancer1 Settings: Tertiary care Intervention: Reduced radiation dose‐volume Comparison: Standard radiation dose‐volume | ||||||
| Outcomes | Illustrative comparative risks* (95% CI) | Relative effect | No of Participants | Quality/certainty of the evidence | Comments | |
|---|---|---|---|---|---|---|
| Assumed risk | Corresponding risk | |||||
| standard radiation dose volume | reduced radiation dose volume | |||||
| Mean GI symptom scores | ‐ | ‐ | not estimable | ‐ | ‐ | No data |
| Acute and late GI toxicity (grade 2+) | Acute (up to 3 months post‐RT) : 282 per 1000 | Acute (up to 3 months post‐RT): 341 per 1000 (228 to 510) | RR 1.21 (0.81 to 1.81) | 211 (1) | ⊕⊕⊕⊝ | ‐ |
| Late (1 year post‐RT): 37 per 1000 | Late (1 year post RT): 38 per 1000 (6 to 258) | RR 1.02 (0.15 to 6.97) | 107 (1) | ⊕⊕⊝⊝ | ‐ | |
| Late (2 years post‐RT): 71 per 1000 | Late (2 years post RT): 27 per 1000 (3 to 247) | RR 0.38 (0.04 to 3.48) | 79 (1) | ⊕⊕⊝⊝ | ‐ | |
| Diarrhoea (grade 2+) | ‐ | ‐ | not estimable | ‐ | ‐ | No data |
| QOL scores | ‐ | ‐ | not estimable | ‐ | ‐ | no data |
| *The basis for the assumed risk is the mean control group risk across studies. The corresponding risk (and its 95% confidence interval) is based on the assumed risk in the comparison group and the relative effect of the intervention (and its 95% CI). | ||||||
| GRADE Working Group grades of evidence | ||||||
| 1All evidence in the SOF was derived from participants undergoing treatment for bladder cancer. | ||||||
| Higher bladder volume (BV) compared with lower BV preparation to reduce adverse GI effects of radiotherapy | ||||||
| Patients/population: Men undergoing RT for prostate cancer Settings: Tertiary care Intervention: BV prep of 1080 mls Comparison: BV prep of 540 mls | ||||||
| Outcomes | Illustrative comparative risks* (95% CI) | Relative effect | No of Participants | Quality/certainty of the evidence | Comments | |
|---|---|---|---|---|---|---|
| Assumed risk | Corresponding risk | |||||
| 540 mls BV prep | 1080 mls BV prep | |||||
| Mean GI symptom scores (during RT) | ‐ | ‐ | not estimable | ‐ | ‐ | No data |
| Acute and late GI toxicity (grade 2+) | Acute (up to 3 months post RT): 60 per 1000 | Acute (up to 3 months post‐RT): 133 per 1000 (37 to 476) | RR 2.22 (0.62 to 7.93) | 110 (1) | ⊕⊕⊝⊝ | ‐ |
| Late (up to 1 year post‐RT): 158 per 1000 | Late (up to 1 year post‐RT): 70 per 1000 (19 to 261) | RR 0.44 (0.12 to 1.65) | 81 (1) | ⊕⊕⊝⊝ | ‐ | |
| Diarrhoea (grade 2+) | ‐ | ‐ | not estimable | ‐ | ‐ | No data |
| QOL scores | ‐ | ‐ | not estimable | ‐ | ‐ | Insufficient data for meta‐analysis; however, authors stated that "There were no statistically significant associations between bladder filling preparations...and median QOL scores." |
| *The basis for the assumed risk is the mean control group risk across studies. The corresponding risk (and its 95% confidence interval) is based on the assumed risk in the comparison group and the relative effect of the intervention (and its 95% CI). | ||||||
| GRADE Working Group grades of evidence | ||||||
| 1Downgraded due to imprecision (wide CI crossing the line of no effect). | ||||||
| Evening RT compared with morning RT to reduce adverse GI effects of radiotherapy | ||||||
| Patients/population: Women undergoing RT for cervical cancer Settings: Tertiary care Intervention: Evening RT Comparison: Morning RT | ||||||
| Outcomes | Illustrative comparative risks* (95% CI) | Relative effect | No of Participants | Quality/certainty of the evidence | Comments | |
|---|---|---|---|---|---|---|
| Assumed risk | Corresponding risk | |||||
| morning RT | evening RT | |||||
| Mean GI symptom scores | ‐ | ‐ | not estimable | ‐ | ‐ | No data |
| Acute and late GI toxicity (grade 2+) | Acute (during RT): 349 per 1000 | Acute (during RT): 178 per 1000 (119 to 265) | RR 0.51 (0.34 to 0.76) | 294 (2) | ⊕⊕⊝⊝ | Measured as diarrhoea grade 2+ |
| Late: ‐ | Late: ‐ | not estimable | ‐ | ‐ | No data | |
| Diarrhoea (grade 2+) (during RT) | See evidence on acute toxicity (grade 2+) | ‐ | ||||
| QOL scores | ‐ | ‐ | not estimable | ‐ | ‐ | no data |
| *The basis for the assumed risk is the mean control group risk across studies. The corresponding risk (and its 95% confidence interval) is based on the assumed risk in the comparison group and the relative effect of the intervention (and its 95% CI). | ||||||
| GRADE Working Group grades of evidence | ||||||
| 1Downgraded for study design limitations (most weight derived from one study assessed as having a high risk of bias). | ||||||
| Transperineal hydrogel spacer/injection compared with no intervention to reduce adverse GI effects of radiotherapy | ||||||
| Patients/population: Men undergoing RT for prostate cancer Settings: Tertiary care Intervention: Transperineal hydrogel spacer/injection Comparison: No intervention | ||||||
| Outcomes | Illustrative comparative risks* (95% CI) | Relative effect | No of Participants | Quality/certainty of the evidence | Comments | |
|---|---|---|---|---|---|---|
| Assumed risk | Corresponding risk | |||||
| no intervention | hydrogel spacer | |||||
| Mean GI symptom scores | ‐ | ‐ | not estimable | ‐ | ‐ | No data available |
| Acute and late GI toxicity (grade 2+) | Acute (up to 3 months post‐RT): 65 per 1000 | Acute (up to 3 months post‐RT): 33 per 1000 (5 to 220) | RR 0.51 (0.08 to 3.38) | 289 (2) | ⊕⊕⊝⊝ | Events in these contributing studies were few |
| Late (up to 15 months post‐RT): 14 per 1000 | Late (up to 15 months post‐RT): 2 per 1000 (0 to 55) | RR 0.16 (0.01 to 3.96) | 220 (1) | ⊕⊕⊝⊝ | Events in this contributing study were few | |
| Late (median of 3 years): 67 per 1000 | Late (median of 3 years): 15 per 1000 (0 to 88) | RR 0.07 (0.00 to 1.31) | 139 (1) | ⊕⊕⊝⊝ | Events in this contributing study were few | |
| Diarrhoea (grade 2+) | ‐ | ‐ | not estimable | ‐ | ‐ | No data available |
| QOL scores | ‐ | ‐ | not estimable | ‐ | ‐ | Data could not be meta‐analysed, but findings from 2 studies suggested beneficial effects on bowel‐related QOL with the hydrogel spacer (see Effects of interventions section). |
| *The basis for the assumed risk is the mean control group risk across studies. The corresponding risk (and its 95% confidence interval) is based on the assumed risk in the comparison group and the relative effect of the intervention (and its 95% CI). | ||||||
| GRADE Working Group grades of evidence | ||||||
| 1Downgraded for study design limitations (contributing study judged to have unclear risk of bias). 2Downgraded for imprecision (very few events and wide CI crossing the line of no effect). | ||||||
| Endorectal balloon compared with no intervention to reduce adverse GI effects of radiotherapy | ||||||
| Patients/population: Men undergoing RT for prostate cancer Settings: Tertiary care Intervention: Endorectal balloon Comparison: No intervention | ||||||
| Outcomes | Illustrative comparative risks* (95% CI) | Relative effect | No of Participants | Quality/certainty of the evidence | Comments | |
|---|---|---|---|---|---|---|
| Assumed risk | Corresponding risk | |||||
| no intervention | endorectal balloon | |||||
| Mean GI symptom scores | ‐ | ‐ | not estimable | ‐ | ‐ | No data |
| Acute and late GI toxicity (grade 2+) | Acute (during RT): 292 per 1000 | Acute (during RT): 292 per 1000 (120 to 707) | RR 1.00 (0.41 to 2.42) | 48 (1) | ⊕⊝⊝⊝ | Evidence on acute grade 1+ GI toxicity was of low certainty and suggested little or no difference in acute toxicity with ERB (see Effects of interventions section) |
| Late (up to 1 year): 83 per 1000 | Late (up to 1 year): 17 per 1000 (1 to 329) | RR 0.20 (0.01 to 3.96) | 48 (1) | ⊕⊝⊝⊝ | Evidence on late grade 1+ toxicity was of low certainty and suggested a reduction in late toxicity with ERB (see Effects of interventions section) | |
| Diarrhoea (grade 2+) | Late (2 to 4 years): 565 per 1000 | Late (2 to 4 years): 401 per 1000 (209 to 723) | RR 0.71 (0.37 to 1.35) | 43 (1) | ⊕⊝⊝⊝ | ‐ |
| QOL scores | ‐ | ‐ | not estimable | ‐ | ‐ | No data |
| *The basis for the assumed risk is the mean control group risk across studies. The corresponding risk (and its 95% confidence interval) is based on the assumed risk in the comparison group and the relative effect of the intervention (and its 95% CI). | ||||||
| GRADE Working Group grades of evidence | ||||||
| 1Downgraded for study design limitations (contributing study judged to have unclear risk of bias). | ||||||
| Aminosalicylates compared with placebo administered prophylactically to reduce adverse GI effects of radiotherapy | ||||||
| Patient or population: People undergoing pelvic radiotherapy for urological, gynaecological or colorectal cancer Settings: Tertiary care Intervention: Aminosalicylates Comparison: Placebo | ||||||
| Outcomes | Illustrative comparative risks* (95% CI) | Relative effect | No of Participants | Quality/certainty of the evidence | Comments | |
|---|---|---|---|---|---|---|
| Assumed risk | Corresponding risk | |||||
| placebo | aminosalicylates | |||||
| Mean GI symptom scores (IBDQ‐B) | ‐ | ‐ | not estimable | ‐ | ‐ | No data |
| Acute and late GI toxicity (grade 2+) | Acute (during treatment) (mesalazine): 380 per 1000 | Acute (during treatment) (mesalazine): 388 (464 to 551) | RR 1.02 (1.22 to 1.45) | 143 | ⊕⊕⊕⊝ | Formulations appear to differ in effects on this outcome; therefore subgroup data were not pooled. The sulfasalazine findings were very inconsistent (I2 = 73%) across the 2 contributing studies, with the better‐quality study showing no reduction in acute toxicity |
| Acute (during treatment) (sulphasalazine): 447 per 1000 | Acute (during treatment) (sulphasalazine): 130 (49 to 335) | RR 0.29 (0.11 to 0.75) | 182 (2) | ⊕⊕⊝⊝ low1,2 | ||
| Late: ‐ | Late: ‐ | not estimable | ‐ | ‐ | No data | |
| Diarrhoea (grade 2+) | ‐ | ‐ | not pooled | ‐ | ‐ | As above, subgroup data were not pooled and findings were as follows:
Downgrading of these findings by 1 level was due to study design limitations (unclear risk of bias) in all subgroups, and also due to inconsistency for the sulfasalazine subgroup |
| QOL scores | ‐ | ‐ | not estimable | ‐ | ‐ | No data |
| *The basis for the assumed risk is the mean control group risk across studies. The corresponding risk (and its 95% confidence interval) is based on the assumed risk in the comparison group and the relative effect of the intervention (and its 95% CI). | ||||||
| GRADE Working Group grades of evidence | ||||||
| 1Downgraded for study design limitations (analysis included studies at an unclear risk of bias). 2Downgraded for inconsistency across studies (I2 > 60%). | ||||||
| Superoxide dismutase compared with no intervention to reduce adverse GI effects of radiotherapy | ||||||
| Patient or population: People with rectal cancer Settings: Tertiary care Intervention: Superoxide dismutase (IM) Comparison: No intervention | ||||||
| Outcomes | Illustrative comparative risks* (95% CI) | Relative effect | No of Participants | Quality/certainty of the evidence | Comments | |
|---|---|---|---|---|---|---|
| Assumed risk | Corresponding risk | |||||
| no intervention | superoxide dismutase | |||||
| Mean GI symptom scores | ‐ | ‐ | not estimable | ‐ | ‐ | No data |
| Acute and late GI toxicity (grade 2+) | Acute (3 months): 217 per 1000 | Acute (3 months): 43 per 1000 | RR 0.20 (0.05 to 0.86) | 92 | ⊕⊕⊝⊝ | ‐ |
| Late: (1 year): 135 per 1000 | Late (1 year): 12 per 1000 (1 to 209) | RR 0.09 (0.01 to 1.55) | 75 (1) | ⊕⊝⊝⊝ | ‐ | |
| Late (2 to 4 years): 193 per 1000 | Late (2 to 4 years): 12 per 1000 (0 to 225) | RR 0.06 (0.00 to 1.11) | 68 (1) | ⊕⊝⊝⊝ | ‐ | |
| Diarrhoea (grade 2+) | ‐ | ‐ | not estimable | ‐ | ‐ | No data |
| QOL scores | ‐ | ‐ | not estimable | ‐ | ‐ | No data |
| *The basis for the assumed risk is the mean control group risk across studies. The corresponding risk (and its 95% confidence interval) is based on the assumed risk in the comparison group and the relative effect of the intervention (and its 95% CI). | ||||||
| GRADE Working Group grades of evidence | ||||||
| 1Downgraded due to design limitations (study assessed as unclear risk of bias as it lacked methodological details). | ||||||
| Corticosteroid enema compared with placebo to reduce adverse GI effects of radiotherapy | ||||||
| Patients/population: Men with prostate cancer Settings: Tertiary care Intervention: Corticosteroid enema Comparison: Placebo | ||||||
| Outcomes | Illustrative comparative risks* (95% CI) | Relative effect | No of Participants | Quality/certainty of the evidence | Comments | |
|---|---|---|---|---|---|---|
| Assumed risk | Corresponding risk | |||||
| placebo | corticosteroid enema | |||||
| Mean GI symptom scores | ‐ | ‐ | not estimable | ‐ | ‐ | No data |
| Acute and late GI toxicity (grade 2+) | Acute (3 months): 619 per 1000 | Acute (3 months): 526 per 1000 | RR 0.85 (0.62 to 1.15) | 126 | ⊕⊝⊝⊝ | ‐ |
| Late: (1 year): 136 per 1000 | Late (1 year): 91 per 1000 (31 to 262) | RR0.67 (0.23 to 1.93) | 114 (1) | ⊕⊕⊝⊝ | ‐ | |
| Diarrhoea (grade 2+) | Acute: ‐ | Acute: ‐ | not estimable | ‐ | ‐ | No data |
| Late (1 year): 68 per 1000 | Late (1 year): 73 per 1000 (19 to 277) | RR1.07 (0.28 to 4.08) | 114 (1) | ⊕⊕⊝⊝ | ‐ | |
| QOL scores | ‐ | ‐ | not estimable | ‐ | ‐ | No data |
| *The basis for the assumed risk is the mean control group risk across studies. The corresponding risk (and its 95% confidence interval) is based on the assumed risk in the comparison group and the relative effect of the intervention (and its 95% CI). | ||||||
| GRADE Working Group grades of evidence | ||||||
| 1Downgraded due to design limitations (study assessed as unclear risk of bias as it lacked methodological details). | ||||||
| Sucralfate compared with placebo administered prophylactically to reduce adverse GI effects of radiotherapy | ||||||
| Patient or population: People undergoing pelvic radiotherapy for urological, gynaecological or colorectal cancer Settings: Tertiary care Intervention: Sucralfate Comparison: Placebo | ||||||
| Outcomes | Illustrative comparative risks* (95% CI) | Relative effect | No of Participants | Quality/certainty of the evidence | Comments | |
|---|---|---|---|---|---|---|
| Assumed risk | Corresponding risk | |||||
| placebo | sucralfate | |||||
| Mean GI symptom scores | ‐ | ‐ | not estimable | ‐ | ‐ | No data |
| Acute and late GI toxicity (grade 2+) [acute = during RT; late = 6 months post‐RT] | Acute (oral route): 398 per 1000 | Acute (oral route): 426 per 1000 (330 to 553) | RR 1.07 (0.83 to 1.39) | 335 (1) | ⊕⊕⊕⊝ | ‐ |
| Acute (rectal route): 524 per 1000 | Acute (rectal route): 618 per 1000 (456 to 838) | RR 1.18 (0.87 to 1.60) | 126 (1) | ⊕⊕⊝⊝ | ‐ | |
| Late (oral route): 284 per 1000 | Late (oral route): 216 per 1000 | RR 0.76 (0.51 to 1.14) | 298 | ⊕⊕⊕⊝ | No data on rectal route | |
| Diarrhoea (grade 2+) [during RT] | Acute (oral route): 490 per 1000 | Acute (oral route): 397 per 1000 | RR 0.81 (0.41 to 1.62 | )284 | ⊕⊕⊝⊝ | ‐ |
| Acute (rectal route): 357 per 1000 | Acute (rectal route): 293 per 1000 (143 to 546) | RR 0.82 (0.44 to 1.53) | 83 (1) | ⊕⊝⊝⊝ verylow1,2,4 | ‐ | |
| QOL scores | ‐ | ‐ | not estimable | ‐ | ‐ | No data |
| *The basis for the assumed risk is the mean control group risk across studies. The corresponding risk (and its 95% confidence interval) is based on the assumed risk in the comparison group and the relative effect of the intervention (and its 95% CI). | ||||||
| GRADE Working Group grades of evidence | ||||||
| 1Downgraded for imprecision (wide CI crossing the line of no effect). | ||||||
| Amifostine compared with no intervention to reduce adverse GI effects of radiotherapy | ||||||
| Patient or population: People with urological, gynaecological or colorectal cancer Settings: Tertiary care Intervention: Amifostine (subcutaneous or intravenously administered) Comparison: No intervention | ||||||
| Outcomes | Illustrative comparative risks* (95% CI) | Relative effect | No of Participants | Quality/certainty of the evidence | Comments | |
|---|---|---|---|---|---|---|
| Assumed risk | Corresponding risk | |||||
| no intervention | amifostine | |||||
| Mean GI symptom scores | ‐ | ‐ | not estimable | ‐ | ‐ | No data |
| Acute and late GI toxicity (grade 2+) | Acute (during RT): 398 per 1000 | Acute (during RT: 100 per 1000 | RR 0.25 0.15 to 0.42 | 278 | ⊕⊕⊝⊝ | ‐ |
| Acute (up to 3 months): 174 per 1000 | Acute (up to 3 months): 21 per 1000 (2 to 369) | RR 0.12 (0.01 to 2.12) | 44 (1) | ⊕⊝⊝⊝ | ‐ | |
| Late (up to 1 year): 59 per 1000 | Late (up to 1 year): 87 per 1000 (38 to 204) | RR 1.48 (0.64 to 3.45) | 249 (2) | ⊕⊕⊝⊝ | ‐ | |
| Diarrhoea (grade 2+) during treatment | Acute (during RT): 500 per 1000 | Acute (during RT):125 per 1000 | RR 0.25 (0.06 to 0.98) | 36 | ⊕⊝⊝⊝ | ‐ |
| QOL scores | ‐ | ‐ | not estimable | ‐ | ‐ | No data |
| *The basis for the assumed risk is the mean control group risk across studies. The corresponding risk (and its 95% confidence interval) is based on the assumed risk in the comparison group and the relative effect of the intervention (and its 95% CI). | ||||||
| GRADE Working Group grades of evidence | ||||||
| 1Downgraded twice due to design limitations (two studies that contribute >95% of the weight in the meta‐analysis were assessed as high risk of bias). | ||||||
| Sodium butyrate compared with placebo to reduce adverse GI effects of radiotherapy | ||||||
| Patients/population: Men undergoing RT for prostate cancer Settings: Tertiary care Intervention: Sodium butyrate enema Comparison: Placebo | ||||||
| Outcomes | Illustrative comparative risks* (95% CI) | Relative effect | No of Participants | Quality/certainty of the evidence | Comments | |
|---|---|---|---|---|---|---|
| Assumed risk | Corresponding risk | |||||
| placebo | sodium butyrate enema (2 g daily) | |||||
| Mean GI symptom scores | ‐ | ‐ | not estimable | ‐ | ‐ | No data |
| Acute and late GI toxicity (grade 2+) | Acute (during RT): 179 per 1000 | Acute (during RT): 163 per 1000 (74 to 354) | RR 0.91 (0.41 to 1.98) | 79 (1) | ⊕⊕⊕⊝ | ‐ |
| ‐ | ‐ | not estimable | ‐ | ‐ | No data | |
| Diarrhoea (grade 2+) | ‐ | ‐ | not estimable | ‐ | ‐ | No data |
| QOL scores | ‐ | ‐ | not estimable | ‐ | ‐ | No data |
| *The basis for the assumed risk is the mean control group risk across studies. The corresponding risk (and its 95% confidence interval) is based on the assumed risk in the comparison group and the relative effect of the intervention (and its 95% CI). | ||||||
| GRADE Working Group grades of evidence | ||||||
| 1Downgraded due to imprecision (wide CI crossing the line of no effect). We did not downgrade twice for imprecision as this evidence was from a good study evaluating three different doses of sodium butyrate (only the 2 g dose is represented here) and none of the doses showed a clear difference in effect. | ||||||
| Selenium compared with placebo to reduce adverse GI effects of radiotherapy | ||||||
| Patients/population: Women undergoing RT for gynecological cancer Settings: Tertiary care Intervention: Oral selenium Comparison: No intervention | ||||||
| Outcomes | Illustrative comparative risks* (95% CI) | Relative effect | No of Participants | Quality/certainty of the evidence | Comments | |
|---|---|---|---|---|---|---|
| Assumed risk | Corresponding risk | |||||
| placebo | oral selenium | |||||
| Mean GI symptom scores | ‐ | ‐ | not estimable | ‐ | ‐ | No data |
| Acute and late GI toxicity (grade 2+) | Acute: ‐ | ‐ | not estimable | ‐ | ‐ | No data |
| Late: ‐ | ‐ | not estimable | ‐ | ‐ | No data | |
| Diarrhoea (grade 2+) | Acute (during RT): 190 per 1000 | Acute (during RT): 76 per 1000 ( 23 to 268) | RR 0.40 0.12 to 1.41 | 81 (1) | ⊕⊕⊝⊝ | ‐ |
| QOL scores | ‐ | ‐ | not estimable | ‐ | ‐ | No data |
| *The basis for the assumed risk is the mean control group risk across studies. The corresponding risk (and its 95% confidence interval) is based on the assumed risk in the comparison group and the relative effect of the intervention (and its 95% CI). | ||||||
| GRADE Working Group grades of evidence | ||||||
| 1Downgraded due to design limitations (both studies at unclear risk of bias). 2Downgraded due to imprecision (wide CI crossing the line of no effect). | ||||||
| Bile acid sequestrants compared with placebo to reduce adverse GI effects of radiotherapy | ||||||
| Patients/population: People with pelvic cancer Settings: Tertiary care Intervention: Bile acid sequestrants Comparison: Placebo | ||||||
| Outcomes | Illustrative comparative risks* (95% CI) | Relative effect | No of Participants | Quality/certainty of the evidence | Comments | |
|---|---|---|---|---|---|---|
| Assumed risk | Corresponding risk | |||||
| placebo | bile acid sequestrants | |||||
| Mean GI symptom scores (during RT) | The mean (diarrhoea) score in the single study evaluating this outcome was 1.5 | Corresponding mean score of 2 (1.5 to 2.5) | MD 0.50 (‐0.00 to 1.00) | 33 (1) | ⊕⊝⊝⊝ | ‐ |
| Acute and late GI toxicity (grade 2+) | Acute (during RT): 125 per 1000 | Acute (during RT): 530 per 1000 (134 to 1000) | RR 4.24 (1.07 to 16.70) | 33 | ⊕⊕⊝⊝ | Findings suggest potential for harm |
| ‐ | ‐ | not estimable | ‐ | ‐ | No data | |
| Diarrhoea (grade 2+) | Acute (during RT: 125 per 1000 | Acute (during RT): 353 per 1000 (83 to 1000) | RR 2.82 (0.66 to 12.01) | 33 (1) | ⊕⊝⊝⊝ | ‐ |
| QOL scores | ‐ | ‐ | not estimable | ‐ | ‐ | No data |
| *The basis for the assumed risk is the mean control group risk across studies. The corresponding risk (and its 95% confidence interval) is based on the assumed risk in the comparison group and the relative effect of the intervention (and its 95% CI). | ||||||
| GRADE Working Group grades of evidence | ||||||
| 1Downgraded due to design limitations (study had unclear risk of bias overall and unvalidated diarrhoea symptom scale was used for this outcome). | ||||||
| Misoprostol compared with placebo to reduce adverse GI effects of radiotherapy | ||||||
| Patients/population: Men with prostate cancer Settings: Tertiary care Intervention: Misoprostol suppository Comparison: Placebo | ||||||
| Outcomes1 | Illustrative comparative risks* (95% CI) | Relative effect | No of Participants | Quality/certainty of the evidence | Comments | |
|---|---|---|---|---|---|---|
| Assumed risk | Corresponding risk | |||||
| placebo | misoprostol suppository | |||||
| Mean GI symptom scores | ‐ | ‐ | not estimable | ‐ | ‐ | No data |
| Acute and late GI toxicity (grade 2+) | Acute (during RT): 217 per 1000 | Acute (during RT): 340 per 1000 (165 to 545) | RR 1.38 (0.76 to 2.51) | 100 | ⊕⊕⊝⊝ | See footnote 1 below |
| Late: ‐ | Late: ‐ | not estimable | ‐ | ‐ | No data | |
| Diarrhoea (grade 2+) | Acute (during RT): 217 per 1000 | Acute (during RT): 217 per 1000 (100 to 475) | RR 1.00 (0.46 to 2.19) | 100 (1) | ⊕⊝⊝⊝ | Late effects on diarrhoea at 1+ years post‐RT were also reported in this single study and the evidence was also of a very low certainty, mainly due to few events |
| QOL scores | ‐ | ‐ | not estimable | ‐ | ‐ | No data |
| *The basis for the assumed risk is the mean control group risk across studies. The corresponding risk (and its 95% confidence interval) is based on the assumed risk in the comparison group and the relative effect of the intervention (and its 95% CI). | ||||||
| GRADE Working Group grades of evidence | ||||||
| 1Also see Effects of interventions section for findings on rectal bleeding, which suggest the potential for harm with this intervention. | ||||||
| Magnsium oxide compared with placebo to reduce adverse GI effects of radiotherapy | ||||||
| Patients/population: Men with prostate cancer Settings: Tertiary care Intervention: Oral magnesium oxide Comparison: Placebo | ||||||
| Outcomes | Illustrative comparative risks* (95% CI) | Relative effect | No of Participants | Quality/certainty of the evidence | Comments | |
|---|---|---|---|---|---|---|
| Assumed risk | Corresponding risk | |||||
| placebo | magnesium oxide | |||||
| Mean GI symptom scores (during RT) | ‐ | ‐ | not estimable | ‐ | ‐ | No data |
| Acute and late GI toxicity (grade 2+) | Acute (during RT): 217 per 1000 | Acute (during RT): 369 per 1000 (189 to 718) | RR 1.70 (0.87 to 3.31) | 92 | ⊕⊕⊕⊝ | Findings indicate potential for harm |
| ‐ | ‐ | not estimable | ‐ | ‐ | No data | |
| Diarrhoea (grade 2+) | ‐ | ‐ | not estimable | ‐ | ‐ | No data |
| QOL scores | ‐ | ‐ | not estimable | ‐ | ‐ | No data for meta‐analysis. The only included study presents these data graphically and concludes that there was "a trend to worsened quality of life" in the magnesium oxide arm |
| *The basis for the assumed risk is the mean control group risk across studies. The corresponding risk (and its 95% confidence interval) is based on the assumed risk in the comparison group and the relative effect of the intervention (and its 95% CI). | ||||||
| GRADE Working Group grades of evidence | ||||||
| 1Downgraded due to imprecision (wide CI crossing the line of no effect). | ||||||
| Octreotide compared with placebo to reduce adverse GI effects of radiotherapy | ||||||
| Patients/population: People undergoing RT for pelvic cancer Settings: Tertiary care Intervention: Octreotide injection Comparison: Placebo | ||||||
| Outcomes1 | Illustrative comparative risks* (95% CI) | Relative effect | No of Participants | Quality/certainty of the evidence | Comments | |
|---|---|---|---|---|---|---|
| Assumed risk | Corresponding risk | |||||
| placebo | octreotide injection | |||||
| Mean GI symptom scores | ‐ | ‐ | not estimable | ‐ | ‐ | No data |
| Acute and late GI toxicity (grade 2+) | Acute: ‐ | ‐ | not estimable | ‐ | ‐ | No data |
| Late: ‐ | ‐ | not estimable | ‐ | ‐ | No data | |
| Diarrhoea (grade 2+) | Acute (during RT): 491 per 1000 | Acute (during RT): 496 per 1000 (373 to 663) | RR 1.01 (0.76 to 1.35) | 340 (2) | ⊕⊕⊕⊝ | ‐ |
| QOL scores | ‐ | ‐ | not estimable | ‐ | ‐ | No data |
| *The basis for the assumed risk is the mean control group risk across studies. The corresponding risk (and its 95% confidence interval) is based on the assumed risk in the comparison group and the relative effect of the intervention (and its 95% CI). | ||||||
| GRADE Working Group grades of evidence | ||||||
| 1Also see Effects of interventions section for findings on rectal bleeding, which suggest the potential for harm with this intervention. 2Downgraded due to design limitations (both studies at unclear risk of bias). | ||||||
| Diet interventions compared with usual practice to reduce adverse GI effects of radiotherapy | ||||||
| Patient or population: People undergoing pelvic radiotherapy for urological, gynaecological or colorectal cancer Settings: Tertiary care Intervention: Dietary intervention Comparison: Control (usual on‐treatment diet) | ||||||
| Outcomes | Illustrative comparative risks* (95% CI) | Relative effect | No of Participants | Quality/certainty of the evidence | Comments | |
|---|---|---|---|---|---|---|
| Assumed risk | Corresponding risk | |||||
| control | diet | |||||
| Elemental diet | ||||||
| Mean GI symptom scores (IBDQ‐B) (higher scores better) | Acute (during RT): median score 60 (35 ‐ 69) Acute effect (3 months post RT): median score 69 (34 ‐ 70) | Acute (during RT): median score 57 (23‐66) Acute effect (3 months post‐RT): median score 68 (42 ‐ 70) | not estimable | 50 | ⊕⊕⊝⊝ | There was poor compliance in this study and only a third of daily calories substituted with elemental diet |
| Acute and late GI toxicity (grade 2+) | Acute: ‐ | Acute: ‐ | not estimable | ‐ | ‐ | No data |
| Late: ‐ | Late: ‐ | not estimable | ‐ | ‐ | No data | |
| Diarrhoea (grade 2+) | Acute (during RT): 560 per 1000 | Acute (during RT): 442 per 1000 (252 to 773) | RR 0.79 (0.45 to 1.38) | 50 | ⊕⊕⊝⊝ | ‐ |
| QOL scores (IBDQ) (higher scores better) | During RT the mean QOL score in the control group was 186.4 | During RT the mean QOL score in the diet group 4.6 points higher (12.4 points lower to 21.6 points higher) | MD 4.60 (‐12.40 to 21.60) | 50 | ⊕⊕⊝⊝ | ‐ |
| Lactose‐restricted diet | ||||||
| Mean GI symptom scores (IBDQ‐B) (higher scores better) | ‐ | ‐ | not estimable | ‐ | ‐ | No data |
| Acute and late GI toxicity (grade 2+) | Acute: ‐ | Acute: ‐ | not estimable | ‐ | ‐ | No data |
| Late: ‐ | Late: ‐ | not estimable | ‐ | ‐ | No data | |
| Diarrhoea (grade 1+) | Acute (during RT): 397 per 1000 | Acute (during RT): 294 per 1000 (179 to 488) | RR 0.74 (0.45 to 1.23) | 119 (1) | ⊕⊕⊝⊝ | This study intervention included low insoluble fibre. No grade 2+ events occurred. |
| QOL scores (QLQ‐PR25) | ‐ | ‐ | not estimable | 119 (1) | ‐ | In 1 study, QOL was reported for many time points and domains up to 24 months post‐RT and study authors found little difference between study arms at any time point evaluated; however, these data could not be extracted and analysed for review purposes in a meaningful way |
| High‐fibre diet | ||||||
| Mean GI symptom scores (IBDQ‐B) (higher scores better) | Acute (at end of RT): The mean IBDQ‐B score in the control group was 48.7 | Acute: At the end of RT, the mean IBDQ‐B score in the diet group was 2.80 points higher (from 1.81 points lower to 7.41 points higher) | MD 2.80 (‐1.81 to 7.41) | 108 (1) | ⊕⊕⊝⊝ | Mean change in GI symptom scores from baseline to end of RT was also reported in 1 study (Wedlake 2017) and the evidence suggests that the change in IBDQ‐B scores from baseline may be reduced with a high‐fibre diet (see Results section) |
| Late (at 1 year post‐RT): At 1 year post‐RT, the mean IBDQ‐B score was 55.7 | At 1 year post‐RT, the mean IBDQ‐B score in the diet group was 6.1 points higher (1.71 to 10.49 points higher) | MD 6.10 (1.71 to 10.49) | 108 (1) | ⊕⊕⊝⊝ | As above, findings on mean change in GI symptom scores from 1 study suggests that IBDQ‐B scores are less likely to be reduced at 1 year post‐RT from baseline with a high‐fibre diet than with a usual diet (see Results section). | |
| Acute and late GI toxicity (grade 2+) | ‐ | ‐ | not estimable | ‐ | ‐ | No data |
| Diarrhoea (grade 2+) | Acute (during RT): 540 per 1000 | Acute (during RT): 351 per 1000 (205 to 594 ) | RR 0.65 (0.38 to 1.10; participants) | 74 (2) | ⊕⊕⊝⊝ | ‐ |
| QOL scores (IBDQ) (higher scores better) | During RT the mean QOL score in the control group was 162 | During RT, the mean QOL score in the diet group was 6.5 points higher (6 lower to 19 higher) | MD 6.50 (‐5.88 to 18.88) | 108 (1) | ⊕⊕⊝⊝ | ‐ |
| At 1 year post‐RT the mean QOL score was 173 | At 1 year post‐RT, the mean QOL score in the diet group was 20.5 points higher (10 to 31 higher) | MD 20.50 (9.97 to 31.03) | 108 (1) | ⊕⊕⊝⊝ | ‐ | |
| Low‐fibre diet | ||||||
| Mean GI symptom scores (IBDQ‐B) (higher scores better) | Acute (at end of RT): The mean IBDQ‐B score in the control group was 48.7 | At the end of RT, the mean IBDQ‐B score in the diet group was 3.5 points higher (from 0.93 points lower to 7.93 points higher) | MD 3.50 (‐0.93 to 7.93) | 107 (1) | ⊕⊕⊝⊝ | Mean change in GI symptom scores from baseline to end of RT was also reported in 1 study (Wedlake 2017) and findings suggest that there may be little or no difference between diet and control groups (see Results section) |
| Late (at 1 year post RT): At 1 year post RT, the mean IBDQ‐B score was 55.7 | At 1 year post‐RT, the mean IBDQ‐B score in the diet group was 3.30 points higher (from 0.94 points lower to 7.54 points higher) | MD 3.30 (‐0.94 to 7.54) | 107 (1) | ⊕⊕⊝⊝ | As above, mean change in GI symptom scores from baseline to 1 year post‐RT was also reported in one study (Wedlake 2017) and findings suggest that there may be little or no difference between diet and control groups (see Results section) | |
| Acute and late GI toxicity (grade 2+) | ‐ | ‐ | not estimable | ‐ | ‐ | No data |
| Diarrhoea (grade 1+) | Acute (during RT): 397 per 1000 | Acute (during RT): 294 per 1000 (179 to 488) | RR 0.74 (0.45 to 1.23) | 119 (1) | ⊕⊕⊝⊝ | This study intervention included lactose‐restriction |
| QOL scores (IBDQ) (higher scores better) | Acute (during RT): During RT the mean QOL score in the control group was 161.5 | Acute (during RT): During RT, the mean QOL score in the diet group was 9.80 points higher (1.91 lower to 21.51 points higher) | MD 9.80 (‐1.91 to 21.51) | 107 (1) | ⊕⊕⊝⊝ | ‐ |
| Late (1 year post‐RT): At 6 months post‐RT, the mean QOL score in the control group was 173.6 | Late: At 1 year post‐RT, the mean QOL score in the diet group was 9.4 points higher (1.78 lower to 20.58 points higher) | MD 9.40 (‐1.78 to 20.58) | 107 (1) | ⊕⊕⊝⊝ | ‐ | |
| Low‐fat diet | ||||||
| Mean GI symptom scores (Vaizey scale) (higher scores better) | Acute: During RT the mean GI symptom score in the control group was 4.6 | Acute: During RT, the mean GI symptom score in the diet group was 4.4 (2.4 to 6.5) | MD ‐0.20 (‐2.29 to 1.89) | 70 (1) | ⊕⊕⊝⊝ | ‐ |
| Acute and late GI toxicity (grade 2+) | 436 per 1000 | 50 per 1000 (310 to 802) | RR 1.15 (0.71 to 1.84) | 79 (1) | ⊕⊕⊝⊝ | ‐ |
| Diarrhoea | ‐ | ‐ | not estimable | ‐ | ‐ | No data |
| QOL scores (IBDQ) | During RT the mean QOL score in the control group was 187 | During RT, the mean QOL score in the diet group was 189 (177 to 201) | MD 2.40 (‐9.52 to 14.32) | 76 (1) | ⊕⊕⊝⊝ | ‐ |
| Prebiotic diet | ||||||
| Mean GI symptom scores (IBDQ‐B) (higher scores better) | ‐ | ‐ | not estimable | ‐ | ‐ | No data |
| Acute and late GI toxicity (grade 2+) | ‐ | ‐ | not estimable | ‐ | ‐ | No data |
| Diarrhoea | ‐ | ‐ | not estimable | ‐ | ‐ | No data |
| QOL scores (IBDQ) | ‐ | ‐ | not estimable | ‐ | ‐ | No data |
| *The basis for the assumed risk is the mean control group risk across studies. The corresponding risk (and its 95% confidence interval) is based on the assumed risk in the comparison group and the relative effect of the intervention (and its 95% CI). | ||||||
| GRADE Working Group grades of evidence | ||||||
| 1Downgraded ‐1 for design limitations (risk of bias due to poor compliance) and ‐1 for indirectness (intervention involved substituting a third of calories instead of 100%, which might have a different effect on outcomes). 2Downgraded ‐1 for design limitations (risk of bias) and ‐1 imprecision (wide CI crosses the line of no effect). 3Downgraded ‐1 for indirectness (dietary intervention involved both lactose‐restriction and low insoluble fibre) and ‐1 for imprecision (wide CI crosses the line of no effect). 4Downgraded for design limitations and imprecision. 5Downgraded ‐2 for design limitations (no assessor blinding for this outcome and potential risk of performance bias). | ||||||
| Protein supplements compared with no intervention to reduce adverse GI effects of radiotherapy | ||||||
| Patients/population: Individuals undergoing RT for pelvic cancer Settings: Tertiary care Intervention: Protein supplements Comparison: No intervention | ||||||
| Outcomes | Illustrative comparative risks* (95% CI) | Relative effect | No of Participants | Quality/certainty of the evidence | Comments | |
|---|---|---|---|---|---|---|
| Assumed risk | Corresponding risk | |||||
| no intervention | protein supplements | |||||
| Mean GI symptom scores (lower is better) | ‐ | ‐ | not estimable | ‐ | ‐ | Data were insufficient for meta‐analysis. However, diarrhoea scores significantly deteriorated from baseline to end of RT in both the protein supplement and the control groups, and mean diarrhoea scores (without standard deviations) were similar at 3‐month follow‐up |
| Acute and late GI toxicity (grade 2+) | Acute: ‐ | Acute: ‐ | not estimable | ‐ | ‐ | See evidence on diarrhoea |
| Late: ‐ | Late: ‐ | not estimable | ‐ | ‐ | See evidence on diarrhoea | |
| Diarrhoea (grade 2+) | Acute (end of RT): 459 per 1000 | Acute (end of RT): 243 per 1000 (124 to 473) | RR 0.53 (0.27 to 1.03) | 74 (1) | ⊕⊝⊝⊝ | ‐ |
| Acute (3 months post‐RT): 351 per 1000 | Acute (3 months post‐RT): 14 per 1000 (0 to 211) | RR 0.23 (0.07 to 0.74) | 74 (1) | ⊕⊕⊝⊝ | ‐ | |
| Late (5 years post‐RT): 296 per 1000 | Late (5 years post‐RT):15 per 1000 (0 to 231) | RR 0.60 (0.23 to 1.51) | 61 (1) | ⊕⊝⊝⊝ | ‐ | |
| QOL scores | ‐ | ‐ | not estimable | ‐ | ‐ | Data were insufficient for meta‐analysis. However, mean global QOL scores (without standard deviations) were reported to be significantly different (better) compared with baseline scores in the protein supplement group at the end or RT and at 3 months post‐RT, but were significantly worse than baseline scores at these time points in the control group |
| *The basis for the assumed risk is the mean control group risk across studies. The corresponding risk (and its 95% confidence interval) is based on the assumed risk in the comparison group and the relative effect of the intervention (and its 95% CI). | ||||||
| GRADE Working Group grades of evidence | ||||||
| 1Downgraded due to design limitations (control group received no intervention). 2Downgraded due to imprecision (small study with few events). 3Downgraded due to imprecision (wide CI crossing the line of no effect). | ||||||
| Probiotics compared with no probiotics to reduce adverse GI effects of radiotherapy | ||||||
| Patients/population: People undergoing RT for pelvic cancer Settings: Tertiary care Intervention: probiotics Comparison: placebo or no intervention | ||||||
| Outcomes | Illustrative comparative risks* (95% CI) | Relative effect | No of Participants | Quality/certainty of the evidence | Comments | |
|---|---|---|---|---|---|---|
| Assumed risk | Corresponding risk | |||||
| placebo or no intervention | probiotics | |||||
| Mean GI symptom scores | ‐ | ‐ | not estimable | ‐ | ‐ | No data |
| Acute and late GI toxicity (grade 2+) | Acute: ‐ | Acute: ‐ | not estimable | ‐ | ‐ | No data |
| Late: ‐ | Late: ‐ | not estimable | ‐ | ‐ | No data | |
| Diarrhoea (grade 2+) | Acute (during RT): 440 per 1000 | Acute (during RT): 194 per 1000 (92 to 414) | RR 0.43 (0.22 to 0.82) | 923 (5) | ⊕⊕⊝⊝ | |
| QOL scores | ‐ | ‐ | not estimable | ‐ | ‐ | Very limited narrative data available; see Effects of interventions section. |
| *The basis for the assumed risk is the mean control group risk across studies. The corresponding risk (and its 95% confidence interval) is based on the assumed risk in the comparison group and the relative effect of the intervention (and its 95% CI). | ||||||
| GRADE Working Group grades of evidence | ||||||
| 1Downgraded due to design limitations (4 studies assessed as having unclear risk of bias, and one study assessed as having high risk of bias overall). | ||||||
| Proteolytic enzymes compared with control to reduce adverse GI effects of radiotherapy | ||||||
| Patients/population: People undergoing RT for pelvic cancer Settings: Tertiary care Intervention: Proteolytic enzymes Comparison: Placebo or no intervention | ||||||
| Outcomes | Illustrative comparative risks* (95% CI) | Relative effect | No of Participants | Quality/certainty of the evidence | Comments | |
|---|---|---|---|---|---|---|
| Assumed risk | Corresponding risk | |||||
| placebo or no intervention | proteolytic enzymes | |||||
| Mean GI symptom scores | ‐ | ‐ | not estimable | ‐ | ‐ | No data |
| Acute and late GI toxicity (grade 2+) | Acute (3 months post‐RT): 367 per 1000 | Acute (3 months post RT): 165 per 1000 (88 to 323) | RR 0.45 (0.24 to 0.88) | 120 (1) | ⊕⊕⊝⊝ | When grade 1 data were included, the evidence suggested that there may be little or no difference in acute toxicity. |
| Late: ‐ | Late: ‐ | not estimable | ‐ | ‐ | No data | |
| Diarrhoea (grade 2+) | Acute (during RT): 357 per 1000 | Acute (during RT): 571 per 1000 (317 to 1000) | RR 1.60 (0.89 to 2.89) | 56 (1) | ⊕⊝⊝⊝ | This study also reported that more participants in the proteolytic enzyme group required medication for diarrhoea symptom control (see Effects of interventions section) |
| QOL scores | ‐ | ‐ | not estimable | ‐ | ‐ | No data |
| *The basis for the assumed risk is the mean control group risk across studies. The corresponding risk (and its 95% confidence interval) is based on the assumed risk in the comparison group and the relative effect of the intervention (and its 95% CI). | ||||||
| GRADE Working Group grades of evidence | ||||||
| 1Downgraded ‐2 due to design limitations (only one contributing study assessed as having high risk of bias). | ||||||
| Glutamine compared with placebo to reduce adverse GI effects of radiotherapy | ||||||
| Patients/population: People undergoing RT for pelvic cancer Settings: Tertiary care Intervention: Oral glutamine Comparison: Placebo | ||||||
| Outcomes | Illustrative comparative risks* (95% CI) | Relative effect | No of Participants | Quality/certainty of the evidence | Comments | |
|---|---|---|---|---|---|---|
| Assumed risk | Corresponding risk | |||||
| placebo | glutamine | |||||
| Mean GI symptom scores | ‐ | ‐ | not estimable | ‐ | ‐ | No data |
| Acute and late GI toxicity (grade 2+) | Acute (during RT): 86 per 1000 | Acute (during RT): 206 per 1000 (58 to 734) | RR 2.40 (0.68 to 8.53) | 69 (1) | ⊕⊕⊝⊝ | ‐ |
| Late (1 year): 74 per 1000 | Late (1 year): 334 per 1000 (17 to 1000) | RR 4.52 (0.23 to 90.08) | 57 (1) | ⊕⊕⊝⊝ | ‐ | |
| Diarrhoea (grade 2+) | Acute (during RT): 500 per 1000 | Acute (during RT): 495 per 1000 (395 to 625) | RR 0.98 (0.78 to 1.24) | 289 (4) | ⊕⊕⊕⊕ | We did not downgrade this evidence for design limitations as the findings of the studies with unclear risk of bias were consistent with the low risk of bias study and did not show benefit in favour of the intervention |
| QOL scores | ‐ | ‐ | not estimable | ‐ | ‐ | 1 study reported that median QOL scores were similar for glutamine and placebo groups at 12 months and 24 months; however these data were not in a usable form for meta‐analysis |
| *The basis for the assumed risk is the mean control group risk across studies. The corresponding risk (and its 95% confidence interval) is based on the assumed risk in the comparison group and the relative effect of the intervention (and its 95% CI). | ||||||
| GRADE Working Group grades of evidence | ||||||
| 1Downgraded ‐2 for imprecision (small study with few events, and wide CI crossing the line of no effect). | ||||||
| Counselling compared with no intervention to reduce adverse GI effects of radiotherapy | ||||||
| Patients/population: Individuals undergoing RT for pelvic cancer Settings: Tertiary care Intervention: Dietary or other counselling Comparison: No intervention | ||||||
| Outcomes | Illustrative comparative risks* (95% CI) | Relative effect | No of Participants | Quality/certainty of the evidence | Comments | |
|---|---|---|---|---|---|---|
| Assumed risk | Corresponding risk | |||||
| no intervention | counselling | |||||
| Mean GI symptom scores (lower is better) | At 3 months post‐RT, the mean GI symptom score (diarrhoea) in the control group was 1.6 | At 3 months post‐RT, the mean GI symptom score (diarrhoea) in the control group was 1.68 (1.22 to 2.14) | MD 0.08 (‐0.38 to 0.54) | 152 (1) | ⊕⊕⊝⊝ | ‐ |
| Acute and late GI toxicity (grade 2+) | Acute: ‐ | Acute: ‐ | not estimable | ‐ | ‐ | See evidence on diarrhoea |
| Late: ‐ | Late: ‐ | not estimable | ‐ | ‐ | See evidence on diarrhoea | |
| Diarrhoea (grade 2+) | Acute (end of RT): 459 per 1000 | 55 per 1000 (14 to 165) | RR 0.12 (0.03 to 0.47) | 74 (1) | ⊕⊕⊝⊝ | ‐ |
| Acute (3 months post‐RT): 351 per 1000 | 14 per 1000 (0 to 211) | RR 0.04 (0.00 to 0.60) | 74 (1) | ⊕⊕⊝⊝ | ‐ | |
| Late (5 years post‐RT): 296 per 1000 | 15 per 1000 (0 to 231) | RR 0.05 (0.00 to 0.78) | 61 (1) | ⊕⊕⊝⊝ | ‐ | |
| QOL scores (5‐point VAS; lower is better) | At 3 months post‐RT, the mean QOL (fatigue) score in the control group was 2.17 | At 3 months post‐RT, the mean QOL (fatigue) score in the control group was 1.76 (1.37 to 2.18) | MD ‐0.41 (‐0.83 to 0.01) | 152 (1) | ⊕⊝⊝⊝ | In another included study with no usable data for meta‐analysis, authors reported that, "at 3 months GI [counselling group] patients maintained/improved function, symptoms and single‐item scores (P<0.02)" compared with baseline scores, whereas "QOL remained as poor as after radiotherapy" in the control group |
| At 3 months post RT, the mean QOL (sleeping problem) score in the control group was 1.04 | At 3 months post RT, the mean QOL (sleeping problem) score in the control group was 0.58 (0.15 to 1.01) | MD ‐0.46 (‐0.89 to ‐0.03) | 152 (1) | ⊕⊕⊝⊝ | ||
| *The basis for the assumed risk is the mean control group risk across studies. The corresponding risk (and its 95% confidence interval) is based on the assumed risk in the comparison group and the relative effect of the intervention (and its 95% CI). | ||||||
| GRADE Working Group grades of evidence | ||||||
| 1Downgraded due to imprecision (small study; continuous data). | ||||||
Background
Description of the condition
In 2012, 14.1 million people worldwide were diagnosed with cancer and 32.6 million people were living with cancer (within five years of diagnosis) (GLOBOCAN 2012). The number of people surviving cancer has increased significantly over the past few decades, due to earlier diagnosis and advances in multimodal treatment (Andreyev 2012; Cancer Res 2016). Radiotherapy (RT) is a key component of anti‐cancer treatment and approximately four out of every 10 people with cancer have radiotherapy as part of their treatment (Cancer Res 2016). Whilst anti‐cancer treatment is not always curative, it enables many people with a diagnosis of cancer to live for significantly extended periods.
Pelvic radiotherapy is used to treat various urological, gynaecological and gastrointestinal cancers, where it might be given alone as primary treatment, combined with chemotherapy, or given before or after surgery. During treatment, pelvic radiotherapy inevitably exposes the surrounding normal gastrointestinal tract (small and large bowel) to some degree of radiation. Depending on various factors, such as the type of radiotherapy, the size and site of the treatment field, and the dose delivered, irradiation of normal tissue can lead to bowel injury (Andreyev 2007). In addition, other factors may influence the risk of bowel injury, including chemotherapy, previous abdominal surgery, smoking, co‐existing medical conditions or their treatments (such as diabetes, hypertension and HIV), concurrent medication, genetic factors, and psychological issues (Andreyev 2007; Theis 2010).
Pelvic radiation disease (PRD), the term used for non‐cancerous tissue injury secondary to radiotherapy, is increasingly being recognised as an unacceptable consequence of radiotherapy treatment (Morris 2015). Radiation‐induced gastrointestinal tissue injury is brought about initially by an acute inflammatory process that leads to blood vessel damage, ischaemia (inadequate blood supply to the tissue), fibrosis (thickening and scarring), and loss of stem cells (Denham 2002). With repeated exposures over the course of radiotherapy treatment, the cycle of tissue injury and disrupted healing leads to progressive alteration in the affected tissue architecture and function. Gastrointestinal symptoms can be acute (occurring during radiotherapy or within three months), or chronic (persisting or appearing after three months) (Frazzoni 2015). Acute symptoms, including diarrhoea, abdominal pain, nausea, bloating, rectal bleeding, and urgency, typically begin during the second week of treatment and peak at four to five weeks (Khalid 2006). Acute symptoms usually resolve upon cessation of radiotherapy; however, they can necessitate dose reductions and treatment interruption, which can have a negative impact on the curative effect of treatment (Morris 2015; Stacey 2014). In addition, their occurrence may increase the risk of late gastrointestinal effects (Barnett 2011; O'Brien 2002). Chronic symptoms, including faecal incontinence, urgency, rectal bleeding, flatulence, and abdominal pain, can follow acute symptoms or arise on their own some time later (Andreyev 2012). Incontinence can be particularly distressing and may be caused by injury to the anal sphincter and rectal tissue, leading to decreased rectal distensibility and storage capacity (Krol 2014). However, as widely‐separate parts of the gastrointestinal tract that lie in the path of the radiotherapy beam can be affected, symptoms associated with injury can have more than one physiological cause (Andreyev 2007). In addition, bile acid malabsorption, carbohydrate intolerances, and small bowel bacterial overgrowth occurring as a result of radiation‐induced impaired bowel motility may exacerbate bowel symptoms (Andreyev 2007; Muls 2014). Chronic symptoms are very common, with up to 90% of patients reporting a permanent change in their bowel habits (Olopade 2005), and up to 30%, 40% and 66% respectively of urological, gynaecological and colorectal cancer survivors experiencing chronic gastrointestinal symptoms that negatively affect their quality of life (Andreyev 2012). Rarely, severe intestinal failure can occur as a result of RT damage; furthermore, RT‐exposed intestine has an increased risk of needing surgery (Gavazzi 2006; Kalaiselvan 2014).
Description of the intervention
Radiotherapy is a cancer treatment involving the use of high‐energy radiation, usually x‐rays or similar beams (such as electrons or protons), to destroy cancer cells. The aim of modern radiotherapy is to ensure a high level of accuracy in tumour targeting, to reduce normal tissue exposure, and to minimise side effects (NCAT 2012). A variety of different strategies have been proposed to reduce its impact on normal tissues and prevent adverse gastrointestinal effects. These include improved radiotherapy delivery techniques, other aspects of radiotherapy delivery (e.g. timing of delivery, patient positioning or positioning devices), pharmacological interventions, and non‐pharmacological interventions:
Radiotherapy delivery techniques
Conventional radiotherapy is delivered as external beam radiotherapy (EBRT). Conformal radiotherapy is the type of EBRT that is commonly used in high‐income countries (Cancer Res 2016; CCS 2016). There are two types:
-
3D conformal radiotherapy (3DCRT) is intended to improve tumour targeting and reduce the amount of radiation to the surrounding tissues by aiming shaped radiotherapy beams from several different directions at the tumour (CCS 2016). It uses pretreatment imaging with computerised tomography (CT) or other types of scans to plan the radiotherapy treatment area in three dimensions (width, height and depth), matching the radiation beams to the 3D shape of the tumour. With 3DCRT, the radiation beams are all the same intensity;
-
Intensity‐modulated radiotherapy (IMRT) uses computerised methods to orientate multiple small beams of different intensities to the volume of tumour tissue that needs to be treated (Cancer Res 2016; NCAT 2012). IMRT may potentially conform more precisely to the tumour than 3DCRT, as it allows the dose of radiation to be adjusted for different parts of the treatment area and can create concave edges to reduce exposure to adjacent normal tissues. Volumetric modulated arc therapy (VMAT) is a type of IMRT in which the machine rotates around the patient during treatment, continuously adapting the radiation beam to the tumour volume as it moves.
All radiation doses quoted in this review assume a fraction size of 1.8 to 2.0 Gy, unless otherwise stated. It is currently unclear whether the occurrence or severity of adverse gastrointestinal effects in patients undergoing radiotherapy differ between these techniques.
Image‐guided radiotherapy (IGRT)
IGRT includes any imaging performed at pretreatment and treatment delivery that improves or verifies the accuracy of radiotherapy (NCAT 2012). It encompasses a wide variety of techniques ranging from simple visual field alignment checks through to CT imaging that enables direct visualisation of the radiotherapy target volume and surrounding anatomy (NCAT 2012). If sufficiently accurate, IGRT has the potential to allow a reduction in the setup margin for a particular cancer site, reducing the radiation exposure to normal tissue. Four‐dimensional adaptive radiotherapy (4D‐ART) combines IMRT and IGRT to take into account the 3D tumour shape over time (the fourth dimension) by tracking tumour motion during treatment (NCAT 2012).
Stereotactic body radiotherapy (SBRT)
SBRT involves the use of a high and precise radiation dose in a small number of fractions (NCAT 2012). Radiotherapy beams are orientated from many different positions around the body to minimise the radiation dose to the surrounding tissues (Cancer Res 2016). SBRT is currently mainly used for small tumours of the brain, liver, lung and spinal cord; however, its use could potentially be extended to prostate cancer (Lischalk 2016; Moon 2017).
Brachytherapy (BT)
BT involves the placement of radioactive seeds within the tumour (interstitial brachytherapy), or within a cavity adjacent to the tumour (intracavitary brachytherapy) (Shadad 2013). Irradiation may be over a prolonged period of time (low dose) or temporary and short‐term (high dose). BT is often used in combination with EBRT. Where evaluated as an alternative to EBRT‐based treatments, it has been associated with lower gastrointestinal toxicity (Nout 2010; Sorbe 2012).
Gastrointestinal injury is more likely with higher prescribed radiation doses (Barnett 2011; Michalski 2010). Therefore, limiting the volume of normal tissue exposed to intermediate (45 to 60 Gy) and high doses (60 or more Gy) by using dose‐volume constraints is an important part of treatment planning (Michalski 2010). Such parameters need adaptation and validation for different EBRT techniques (Michalski 2010). Irrespective of the radiotherapy technique used, effective immobilisation both in the patient's bony anatomy and of internal organ motion during treatment is critical to avoid ‘geographical miss’, which will underdose the tumour and overdose the surrounding normal tissues (NCAT 2012).
Other aspects of radiotherapy delivery
Patient positioning or positioning devices
The position of a patient during radiotherapy delivery might influence the dose of radiation delivered to normal pelvic structures and subsequent gastrointestinal injury. A systematic review of prospective and retrospective studies of patient positioning and the use of belly boards suggests that delivering radiotherapy to patients positioned in the prone position (lying on their front) rather that the supine position (lying on their back), and using positioning devices such as belly boards, might facilitate displacement of the small bowel away from the treatment field and reduce the volume of small bowel irradiated (Weisendanger‐Wittmer 2012).
Timing of delivery
Physiological 'clocks' that regulate the timing of physiological processes through gene expression exist in every organ and cell of the human body (Fuhr 2015). The circadian clock or day‐night cycle is the core clock that might influence response to anti‐cancer treatments and the development of treatment side effects (Fuhr 2015). It has been suggested that radiotherapy delivered in the morning may be more likely to cause damage to gastrointestinal mucosal cells than radiotherapy delivered in the evening, due to limited evidence that gastrointestinal cellular proliferation follows a circadian rhythm, with bowel mucosal proliferation (DNA synthesis) being greatest in the morning and lowest in the evening (Buchi 1991; Ijiri 1990).
Fractionation
Curative pelvic radiotherapy treatment comprises a number of doses or fractions (usually 2 Gy or less per fraction), usually given over a period of about four to eight weeks to make up the total prescribed radiotherapy dose. Certain cancers such as prostate cancer have been shown to be more sensitive to fraction size than other tumours, behaving more like normal tissues; therefore, increasing the fraction size (hypofractionation) for each treatment, which allows the total dose to be delivered in fewer treatments, might improve the treatment outcome or therapeutic ratio (Bossi 2016; Soh 2015). Several randomised trials of hypofractionation in prostate cancer have been conducted (Aluwini 2015; Arcangeli 2010; CHHiP 2016; Hoffman 2014; Norkus 2013; Pollack 2013). A 2015 systematic review concludes that moderate fractionation (2.5 to 4 Gy per fraction) is associated with late gastrointestinal toxicity similar to conventional fractionation; however, extreme fractionation (5 to 10 Gy per fraction) may have greater toxicity than conventional fractionation (Koontz 2015). Whilst potential benefits of hypofractionation include patient convenience, reduced treatment time and cost reduction (Moon 2017; Soh 2015), hypofractionation is not expected to reduce toxicity and might increase it; most trials of hypofractionation therefore hope to show that it is safe and non‐inferior to conventional fractionation in terms of toxicity. We therefore consider interventions dealing with altered fractionation schedules to be outside the scope of this review. A separate Cochrane Review to evaluate the efficacy and toxicity of altered fractionation schedules for prostate cancer is currently underway (Soh 2015).
Other interventions
Various surgical techniques have been proposed, such as the surgical placement of absorbable mesh slings to exclude the small bowel from the field of radiation, to reduce the gastrointestinal effects of pelvic radiotherapy (Devereux 1988; Rodier 1991); however, the clinical effectiveness of such techniques remains uncertain (Stacey 2014). Using daily endorectal balloons filled with air or water, which aim to reduce the volume of normal tissues being irradiated, might be beneficial for men undergoing prostate radiotherapy; findings from a non‐Cochrane review suggest that such devices might reduce prostate motion, improve dosimetry and reduce early gastrointestinal toxicity (Both 2012). Similarly, gel or balloon spacers inserted into the prerectal space before RT might protect the rectum from adverse effects of this treatment.
Pharmacological interventions
Mucosal protectants
Drugs that might protect the mucosa of the gastrointestinal tract from damage due to pelvic radiotherapy include sucralfate (a sucrose sulfate‐aluminium complex) and various agents with antioxidant properties:
-
Sucralfate binds to tissue proteins, creating a physical barrier over damaged mucosal surfaces and facilitating epithelial healing (Van de Wetering 2016). Low‐ to moderate‐certainty Cochrane evidence suggests that it may be useful in the treatment of acute radiation‐induced rectal bleeding, but it remains unclear whether it can prevent rectal bleeding or other gastrointestinal symptoms of PRD when administered prophylactically (Van de Wetering 2016).
-
Amifostine is thought to mediate a protective effect within normal cells by free‐radical scavenging, DNA protection and repair acceleration, and induction of cellular hypoxia (Kouvaris 2007). It is used to protect renal cells from the effects of platinum chemotherapy in ovarian cancer, and in people undergoing radiotherapy for head and neck cancers to reduce xerostomia (dryness of the mouth) (Kouvaris 2007).
-
Antioxidants, such as vitamins C, D, and E, might reduce radiotherapy‐induced injury by reducing antioxidant stress within gastrointestinal cells and facilitating tissue repair. Glutamine, a non‐essential amino acid, selenium, and other agents with antioxidant properties could also potentially be protective (Hall 2016).
Anti‐inflammatory agents
5‐aminosalicylates (e.g. sulfasalazine, balsalazide) are used in the treatment of certain inflammatory bowel conditions, e.g. ulcerative colitis, and therefore might have a role in preventing acute inflammatory gastrointestinal effects of radiation, as suggested by the findings of some small trials (Jahraus 2005; Kilic 2001). Other anti‐inflammatory agents that could potentially reduce gastrointestinal damage include other nonsteroidal anti‐inflammatories and corticosteroids.
Statins (3‐hydroxy‐methylglutaryl coenzyme‐a reductase inhibitors) and angiotensin‐converting enzyme (ACE) inhibitors
A retrospective study of the effects of statins and ACE inhibitors on gastrointestinal effects in a cohort of people undergoing radiotherapy for pelvic malignancies reported better acute and long‐term gastrointestinal symptom scores among those receiving statins (with or without ACE inhibitors) (Wedlake 2012); however, retrospective studies have a high risk of bias. Theoretically, statins might counteract some effects of radiation on normal tissues, due to their vasculoprotective properties (Wang 2007).
Other agents
Octreotide is an analogue of the hypothalamic release‐inhibiting hormone somatostatin (BNF 2016). It is mainly used to relieve diarrhoeal symptoms associated with neuroendocrine tumours, but it may have a role to play in reducing chemoradiotherapy‐related diarrhoea, through inhibitory effects on gastrointestinal secretions and hormones, and on gastrointestinal motility (Sun 2014; Yavuz 2002). However, weak evidence from a 2014 review of octreotide (given subcutaneously or intramuscularly) compared with placebo among people undergoing chemotherapy or radiotherapy suggests that octreotide might reduce diarrhoea when used therapeutically but not preventively in this context (Sun 2014). Various other pharmacological agents, such as bile acid sequestrants (e.g. cholestyramine), sodium butyrate, and smectite, have also been investigated. Bile acid sequestrants act by binding bile acids, which are normally reabsorbed in the terminal ileum and might cause diarrhoea if reabsorption is disrupted, for example, by radiotherapy‐induced dysfunction (Stryker 1983). Sodium butyrate is a short chain fatty acid that has been shown to have anti‐inflammatory properties and trophic effects on colonic mucosa (Maggio 2014); and smectite is a natural aluminomagnesium clay that has anti‐diarrhoeal properties (Dupont 2009).
Non‐pharmacological interventions
Probiotics
Probiotic preparations contain live and defined micro‐organisms (usually lactobacilli and bifidobacteria) which, when administered in sufficiently large amounts, alter the host's microflora and potentially confer a health benefit (Kligler 2008). The potential mechanism/s of action of probiotics include epithelial cell proliferation, enhancing secretion of protective mucins, inhibiting bacterial translocation and stimulating the immune response (Van de Wetering 2013). Several clinical studies have investigated the role of probiotics for radiation‐induced gastrointestinal injury, but the role of probiotics in preventing or reducing PRD remains uncertain (Stacey 2014; Wedlake 2013).
Nutritional interventions
Malnutrition can occur as a consequence of radiotherapy‐induced impaired gastrointestinal absorption and digestive functioning, and can also influence the development of gastrointestinal toxicity (Henson 2013). A 2013 Cochrane Review evaluated the evidence for various nutritional interventions in improving the nutritional status of people undergoing radiotherapy, and found that dietary modification of fat, lactose, or non‐starch polysaccharides (fibre) intake, or combinations of these dietary modifications, probably reduces diarrhoea at the end of radiotherapy (Henson 2013). However, another review concluded that there was insufficient evidence on nutritional interventions to guide clinical practice (Wedlake 2013).
Why it is important to do this review
The focus of cancer and anti‐cancer treatment is usually on survival. However, an increasing number of people survive cancer and can develop distressing side effects as a result of treatment. The impact of treatment on the cancer survivor's quality of life has been a much‐neglected area of research in cancer treatment. In addition, clinicians tend to focus on ruling out cancer recurrence and progression at follow‐up appointments, rather than asking about and addressing quality‐of‐life‐related symptoms. These factors together suggest to cancer survivors that the side effects of radiotherapy treatment are a necessary trade‐off against survival. Those affected may therefore be embarrassed to discuss their gastrointestinal symptoms with healthcare professionals, may delay seeking help for them, and may try to manage these problems themselves (Muls 2014).
To our knowledge, there is no comprehensive systematic review of prophylactic interventions to reduce the gastrointestinal toxicity of radiotherapy. Systematic reviews of endorectal balloons (Both 2012), patient positioning (Weisendanger‐Wittmer 2012) and IMRT (Yu 2016) have included prospective and retrospective studies and have not graded the quality or certainty of evidence; two systematic reviews on nutritional interventions have reached slightly different conclusions (Henson 2013; Wedlake 2013); a systematic review of octreotide pooled data from prevention and treatment studies (Sun 2014), and a Cochrane Review of selenium supplements is out of date (Dennert 2006). These factors make interpretation of existing evidence difficult. The aim of this review is therefore to systematically and critically appraise the evidence from randomised controlled trials on prophylactic interventions that might reduce the incidence or severity of gastrointestinal symptoms caused by pelvic radiotherapy, and to bring them all together in one comprehensive review, in order to highlight those interventions that will lead to improvements in the quality of life of cancer survivors, and to direct the much‐needed research in this field.
Objectives
To determine which prophylactic interventions reduce the incidence, severity, or both of adverse gastrointestinal effects among adults receiving radiotherapy to treat primary pelvic cancers.
Methods
Criteria for considering studies for this review
Types of studies
Randomised controlled trials (RCTs). We excluded quasi‐RCTs and cross‐over designs.
Types of participants
Adults aged 18 years and older undergoing primary, adjuvant or neoadjuvant radiotherapy as part of anti‐cancer treatment for primary pelvic cancers, including urological, gynaecological and gastrointestinal (GI) cancers. We excluded studies of participants receiving palliative radiotherapy or radiotherapy for recurrent cancer, and studies of participants with stomas. Where we found studies that include mixed groups that include some ineligible participants, we attempted to extract data for the relevant participant subgroups only. If this was not possible, we included the study if at least 80% of the participants were eligible, and indicated our concerns related to the types of participants in the 'Risk of bias' assessment of the study. We excluded studies in which fewer than 80% of participants were eligible. Included studies needed to include at least 20 participants.
Types of interventions
Interventions to prevent adverse gastrointestinal effects of pelvic radiotherapy, including:
-
Radiotherapy techniques (e.g. 3DCRT, IMRT, BT);
-
Interventions related to radiotherapy delivery, including radiotherapy timing (e.g. evening radiotherapy schedules), patient positioning and positioning devices (e.g. belly boards), and other interventions (e.g. endorectal balloons);
-
Pharmacological interventions (e.g. sucralfate, 5‐aminosalicylates, antioxidants, statins, ACE inhibitors);
-
Non‐pharmacological interventions, including dietary modification of macronutrients (carbohydrate, fats, protein, with or without micronutrients) and/or non‐starch polysaccharides (dietary fibre), probiotics, and other interventions.
Comparators for radiotherapy techniques or timing are other radiotherapy techniques or timing, whereas comparators for other types of interventions are placebos, no intervention, or alternative interventions. We excluded trials of interventions to treat patients with acute symptoms, as these are not preventive interventions in the first instance. We also excluded trials of altered fractionation and dose escalation schedules, and trials of pre‐ versus postoperative radiotherapy regimens.
Types of outcome measures
Included studies needed to evaluate gastrointestinal toxicity.
Primary outcomes
-
Gastrointestinal symptom score, according to the Inflammatory Bowel Disease Questionnaire‐bowel function dimension (IBDQ‐BD), Gastrointestinal Symptom Rating Scale (GSRS), or another scale.
-
Moderate or severe GI symptoms (toxicity), according to the Common Terminology Criteria for Adverse Events (CTCAE 2010), European Organisation for Research and Treatment of Cancer (EORTC) and Radiation Therapy Oncology Group (RTOG) scoring system, IBDQ, GSRS, or another scale, including:
-
Overall GI symptoms (grade 2+ toxicity);
-
Diarrhoea (the passing of frequent, loose stool);
-
Faecal incontinence (leakage of stool from the rectum);
-
Faecal urgency (a sudden, almost uncontrollable, need to pass stool);
-
Rectal bleeding;
-
Tenesmus (a feeling of incomplete evacuation and a constant urge to pass stool);
-
Abdominal pain/cramps;
-
Nausea;
-
Vomiting;
-
Flatulence;
-
Weight loss.
-
-
Quality of life (QoL) score, according to EORTC QLQ‐C30, QLQ‐PR25, Prostate Cancer Quality of Life Scale (PC‐QOL), IBDQ or another scale.
We assessed these outcomes at specific time points to reflect acute (during and up to three months after radiotherapy) and late (six months post‐radiotherapy and longer) effects.
Secondary outcomes
-
GI toxicity grade 1+;
-
Toxicity‐related discontinuation;
-
Medication use for GI symptom control;
-
Patient satisfaction (as measured by investigators);
-
Total mean bowel dose (Gy) (for studies evaluating radiotherapy techniques, patient positioning or positioning devices).
We excluded studies that evaluated dosimetric parameters only.
Search methods for identification of studies
Electronic searches
We searched the following databases up to September 2016:
-
Cochrane Central Register of Controlled Trials (CENTRAL): Issue 9, 2016
-
MEDLINE: 1946 to September Week 3 2016
-
Embase: 1980 to 2016 week 39
In November 2017, we updated the search as follows:
-
CENTRAL: Issue 11, 2017
-
MEDLINE: September 2016 to October Week 4, 2017
-
Embase: September 2016 to 2017 week 44
We present the CENTRAL, MEDLINE and Embase search strategies in Appendix 1, Appendix 2. Appendix 3 respectively.
We did not apply language restrictions to any of the searches.
Searching other resources
We searched the following databases for ongoing trials:
-
ClinicalTrials.gov (clinicaltrials.gov/)
-
International Clinical Trials Registry Platform (ICTRP) (apps.who.int/trialsearch/)
If we found ongoing trials that had not been published through these searches, we approached the principal investigators for an update on the trial status. We tabulated details of the ongoing trials, including any information acquired from investigators on the trial status, in the Characteristics of ongoing studies section of the review.
We used the 'Related articles' feature of PubMed and the reference lists of included studies to identify newly‐published articles and relevant additional studies. We did not handsearch conference proceedings for conference abstracts due to resource limitations and because we considered that we would find most relevant records by the electronic searches, so that any additional yield would be negligible. See Potential biases in the review process for comment on handsearching.
Data collection and analysis
Selection of studies
The Information Specialist at the Cochrane Gynaecological, Neuro‐oncology and Orphan Cancer Group downloaded all titles and abstracts retrieved by electronic searching to Endnote® and removed duplicates and those studies that clearly did not meet the inclusion criteria. Two review authors (Theresa Lawrie (TL) and John Green (JG)) independently screened the remaining records by title and abstract using Covidence (www.covidence.org/). We obtained the full texts of the short list of potentially eligible references. TL and JG independently assessed the eligibility of the full‐text records, with the help of a third review author (Mark Beresford (MB)), who assisted when necessary to resolve disagreements and uncertainties. We documented the reasons for exclusion of all excluded studies.
Data extraction and management
Two review authors (from TL, JG, MB, Susan Davidson (SD), Linda Wedlake (LW) and Sorrel Burden (SB)) independently extracted data from included studies to a predesigned Excel® data extraction form, to include the following:
-
Author contact details;
-
Country;
-
Setting;
-
Funding source;
-
Inclusion and exclusion criteria;
-
Study design, methodology;
-
Study population and baseline characteristics:
-
Number of participants enrolled;
-
Number of participants analysed;
-
Mean (SD) or median (range) age of participants;
-
Numbers of male and female participants;
-
Number of participants with urological, gynaecological, colorectal, and other cancer;
-
Number of participants who received primary, adjuvant, or neoadjuvant radiotherapy;
-
Other anti‐cancer treatment;
-
Radiotherapy type, total dose and dose‐volume;
-
Baseline gastrointestinal symptoms.
-
-
Intervention details:
-
Type of intervention, i.e. radiotherapy techniques, pharmacological interventions, treatment schedules, patient positioning and positioning devices, nutritional and other interventions, including dose, frequency, and timing;
-
Type of comparator, e.g. other intervention, no active intervention (observation or placebo).
-
-
Risk of bias in study (see below);
-
Duration of follow‐up;
-
Study outcomes;
-
Review outcomes:
-
time point/s for collection;
-
type of scale used, scale thresholds used for determining severity of symptoms;
-
For dichotomous outcomes (e.g. number of participants with moderate or severe gastrointestinal symptoms), the number of participants in each treatment arm who experienced the outcome of interest and the number of participants assessed at the time point;
-
For continuous outcomes (e.g. QoL scores), the value and standard deviation of the outcome of interest and the number of participants assessed at the relevant time point in each treatment arm. We also extracted change‐from‐baseline score data where reported;
-
Where possible, all data extracted were those relevant to an intention‐to‐treat analysis, in which participants were analysed in the groups to which they were assigned. We resolved differences between review authors by discussion or by appeal to a third review author when necessary;
-
We anticipated inter‐study heterogeneity in the measurement and reporting of gastrointestinal symptoms. We therefore prespecified that we would consider acute and late GI effects to be ‘severe’ if they were classified as grade 3 or higher according to CTCAE or EORTC RTOG criteria, or determined to be ‘severe’ by investigators according to investigator‐interview or self‐report questionnaires, such as the Gastrointestinal Symptom Rating Scale (GSRS). Similarly, we considered ‘moderate’ GI effects to be the equivalent of CTCAE or RTOG grade 2 assessments or as determined by investigators according to the measurement scale used, and 'mild' effects to be the equivalent of grade 1 (Table 1). In the event that symptom events were reported but not graded, we extracted the available symptom data from the report and noted the potential risk of bias for these data.
-
| Common gastrointestinal toxicity scoring systems | ||||
|---|---|---|---|---|
| Grade 1 | Grade 2 | Grade 3 | Grade 4 | |
| EORTC/RTOG small/large intestine: acute morbidity | Increased frequency or change in quality of bowel habits not requiring medication / rectal discomfort not requiring analgesics | Diarrhoea requiring medication / mucous discharge not necessitating sanitary pads / rectal or abdominal pain requiring analgesics | Diarrhoea requiring parenteral support / severe mucous or blood discharge necessitating sanitary pads / abdominal distention (flat plate radiograph demonstrates distended bowel loops) | Acute or subacute obstruction, fistula or perforation; GI bleeding requiring transfusion; abdominal pain or tenesmus requiring tube decompression or bowel diversion |
| EORTC/RTOG small/large intestine: late morbidity | ‐ Mild diarrhoea ‐ Mild cramping ‐ Bowel movement 5 times daily ‐ Slight rectal discharge or bleeding | ‐ Moderate diarrhoea and colic ‐ Bowel movement > 5 times daily ‐ Excessive rectal mucus or intermittent bleeding | Obstruction or bleeding requiring surgery | Necrosis / Perforation Fistula |
| CTCAE version 4.0 (diarrhoea) | Increase of < 4 stools a day over baseline | Increase of 4 ‐ 6 stools per day over baseline | Increase of ≥ 7 stools a day over baseline; incontinence; hospitalisation indicated | Life‐threatening consequences; urgent intervention indicated |
| CTCAE version 4.0 (rectal bleeding) | Mild; intervention not indicated | Moderate symptoms; medical intervention or minor cauterisation indicated | Transfusion, radiologic, endoscopic, or elective operative intervention indicated | Life‐threatening consequences; urgent intervention indicated |
Grade 0 = no symptoms; Grade 5 = death. Toxicity grade should reflect the most severe symptoms occurring during a period of evaluation.
Abbreviations: EORTC = European Organisation for Research and Treatment of Cancer; RTOG = Radiation Treatment Oncology Group; CTCAE = Common Terminology Criteria for Adverse Events
For more details, refer to www.rtog.org/ResearchAssociates/AdverseEventReporting/ (accessed 03/02/2017) and Cox 1995.
Assessment of risk of bias in included studies
We assessed the risks of bias of included studies using Cochrane's tool and the criteria specified in the Cochrane Handbook for Systematic Reviews of Interventions (Higgins 2011). This included assessment of:
-
random sequence generation;
-
allocation concealment;
-
blinding of participants and healthcare providers;
-
blinding of outcome assessors;
-
incomplete outcome data;
-
selective reporting of outcomes;
-
other possible sources of bias;
-
overall judgement.
For details, see Appendix 4.
Blinding of participants and healthcare providers was not feasible for certain interventions, e.g. radiotherapy techniques or patient positioning. If we rated a study at high risk of bias for this domain due to a lack of this type of blinding, but at low or unclear risk for the other domains, we usually judged the study to be at low or unclear risk of bias overall. Several outcomes were measured by self‐reported scales. In general, we did not consider self‐reported symptom and QoL outcomes to represent a high risk of bias in the context of this review, as these were our primary outcomes. However, where the outcome had been investigator‐assessed and where the investigator had been non‐blind (i.e. aware of the group allocation), we assessed the study as being at high risk of bias for the 'blinding of outcome assessor' domain and at a potentially high risk of bias overall, depending on the other risk‐of‐bias judgements.
Two review authors applied the 'Risk of bias' tool independently and resolved differences by discussion or by appeal to a third review author. We summarised judgements in 'Risk of bias' tables along with the characteristics of the included studies. We interpreted results of meta‐analyses in light of the overall risk‐of‐bias assessment.
Measures of treatment effect
-
For dichotomous outcomes (e.g. incidence of acute GI toxicity), we calculated the effect size as a risk ratio (RR) with its 95% confidence interval (CI).
-
For continuous outcomes (e.g. QoL scores) we assumed that study authors would use different measurement scales and estimated the standardised mean difference (SMD) and its 95% CI using the pooled data in this instance. However, if the same measurement scale was used, we estimated the mean difference (MD) and its 95% CI. In the event that studies did not report total values but instead reported change‐from‐baseline outcomes, we would have combined these change values with total measurement outcomes by using the (unstandardised) mean difference method in Review Manager 5 (RevMan) (RevMan 2014). We planned to use subgroups to distinguish between MDs of change scores and MDs of final values, and to pool the subgroups in an overall analysis where data were reported in both of these ways (Higgins 2011). However, this scenario did not occur.
-
We did not use time‐to‐event data.
Unit of analysis issues
Two review authors (TL and JG or MB) reviewed unit of analysis issues according to Higgins 2011 and resolved differences by discussion. These included reports where:
-
There were multiple observations for the same outcome (e.g. repeated measurements with different scales or at different time points, recurring events).
We have discussed the implications of our unit of analysis decisions in the section on 'Potential biases in the review process' in the Discussion.
Dealing with missing data
We did not impute missing data. In the event of missing data, such as missing standard deviations or individual outcome denominators, where possible, we attempted to derive these data using calculations provided in the Cochrane Handbook for Systematic Reviews of Interventions (Higgins 2011). Despite various attempts to contact study authors to request missing data, we could not obtain any study data in this way. We described in the Characteristics of included studies tables how we acquired any missing data. Where denominators were estimated we reflected this limitation in the 'Risk of bias' table for the study concerned and in the subsequent grading of the evidence.
Assessment of heterogeneity
We assessed heterogeneity between studies in each meta‐analysis by visual inspection of forest plots, by estimation of the percentage of heterogeneity between trials which cannot be ascribed to sampling variation (Higgins 2003), by a formal statistical test of the significance of the heterogeneity (Deeks 2001), and, where possible, by subgroup analyses. If there was evidence of substantial heterogeneity (I2>60%), we investigated and reported the possible reasons for this.
Assessment of reporting biases
We had planned to investigate reporting biases if there were 10 or more studies in meta‐analyses using funnel plots, but all meta‐analyses included fewer than 10 studies. Our approach would have been to assess funnel plots visually for asymmetry and if we found asymmetry, we would have performed exploratory analyses to investigate it.
Data synthesis
We conducted meta‐analyses if we judged participants, interventions, comparisons and outcomes to be sufficiently similar to ensure an answer that was clinically meaningful. We used the random‐effects model with inverse variance weighting for all meta‐analysis, due to anticipated heterogeneity in the study population and outcome measurements. If any trials had multiple treatment groups, we divided the ‘shared’ comparison group into the number of treatment groups and comparisons between each treatment group and treated the split comparison group as independent comparisons. We performed meta‐analysis of the results assuming that included studies were sufficiently similar for the findings to be clinically meaningful.
'Summary of findings' table and results reporting
Based on the methods described in Chapter 11 of the Cochrane Handbook for Systematic Reviews of Interventions (Higgins 2011), we prepared 'Summary of findings' (SoF) tables to present the results of the meta‐analyses. Where there were sufficient data, we present results for the following outcomes for early (at end of treatment or up to three months or both) and late effects (six months to one year, two to four years, and/or five year time points):
-
Mean GI symptom score;
-
Moderate or severe GI events (Grade 2+ GI toxicity);
-
Moderate or severe diarrhoea (Grade 2+ diarrhoea);
-
QoL score.
We used the GRADE system to rate the certainty of the evidence (Schünemann 2011), which was downgraded for inconsistency, design limitations (risk of bias), imprecision, indirectness and other factors, such as publication bias, where appropriate. Where the evidence was based on single studies, or where there was no evidence on a specific outcome, we included the prespecified outcome in the SoF tables and graded or explained accordingly. We downgraded evidence from single studies for imprecision related to small sample size. Two review authors (TL and JG) conducted the grading, resolving differences by discussion and, if necessary, by involving a third review author (MB or Jervoise Andreyev (JA)). Reporting of results in the text was based on the guidance from the Cochrane Effective Practice and Organisation of Care group on review results reporting and interpretation (EPOC 2015).
Subgroup analysis and investigation of heterogeneity
Provided there were sufficient data, we performed subgroup analysis by the type of cancer (urological, gynaecological, and colorectal). This was only practical for comparisons of radiotherapy technique interventions. For other types of interventions, e.g. pharmacological interventions, we subgrouped studies according to the type of drug formulations or the route of administration, where such differences could lead to heterogeneity in the findings. We used formal tests for subgroup differences to determine whether the effect of interventions differed according to these subgroups. If the I2 for subgroup differences was more than 60%, we considered whether an overall summary was meaningful. We consider factors such as age, gender, type and dose of radiotherapy, previous treatments (abdominal surgery and chemotherapy, or both), and study 'Risk of bias' assessment in interpretation of any heterogeneity. When we identified substantial heterogeneity, we investigated the source using sensitivity analyses.
Sensitivity analysis
We performed some sensitivity analyses by excluding studies at high risk of bias overall, and those at unclear or high risk of bias for specific outcomes (e.g. if we included data on ungraded symptom events). We also performed sensitivity analysis to investigate substantial heterogeneity identified in meta‐analyses of primary outcomes.
Results
Description of studies
Results of the search
The Cochrane Gynaecological, Neuro‐oncology and Orphan Cancer Review Group's Information Specialist ran electronic searches in September 2016 and November 2017.
1. The September 2016 search produced a list of 8402 references. This list was reduced to 7981 by removing duplicates, and then to 3476 references by applying RCT and pelvic cancer filters. Two review authors (TL and JG) independently screened the 3476 references by title and abstract, leading to the identification of 189 references for classification. We found three additional references from other sources (via PubMed and personal communication). Of the total of 192 references identified, we excluded 57 and included 135 references; these were references related to 90 RCTs (Figure 1).

192Study flow diagram
2. Clinical trial registry searches in September 2016 identified 11 ongoing unpublished trials.
3. The top‐up search conducted in November 2017 produced a list of 984 references. Following screening by title and abstract by TL and JG, we obtained the full texts of seven of these references, and examined them for eligibility. Two studies were included, two studies were excluded, one record was added to an already included study, one study was added to Ongoing studies, and one Chinese language article was added to the Studies awaiting classification pending translation.
The review therefore comprises 92 Included studies (involving 138 articles), 59 Excluded studies, 12 Ongoing studies, and one study in Studies awaiting classification.
Included studies
We included 92 RCTs involving 44 different interventions to reduce the GI toxicity of pelvic radiotherapy, and grouped them according to intervention type, namely: radiotherapy techniques, other aspects of radiotherapy delivery, pharmacological interventions, and non‐pharmacological interventions. Altogether, more than 10,000 men and women undergoing radiotherapy treatment (primary, adjuvant or neoadjuvant) were randomised to the interventions. GI toxicity was most commonly recorded by investigators according to CTCAE or EORTC RTOG criteria; however, a variety of unvalidated patient questionnaires was also used. More details of the individual studies can be found in the Characteristics of included studies tables. All radiation doses quoted in this review assume a fraction size of 1.8 to 2.0 Gy, unless otherwise stated.
Radiotherapy techniques
This group of 11 studies evaluated four comparisons:
3DCRT versus conventional radiotherapy (conRT)
Three studies randomising approximately 619 participants compared 3DCRT versus conventional radiotherapy (conRT) (Dearnaley 1999; Koper 1999; Tait 1997). Most (79%) of the participants in these studies were men with prostate cancer, except for 128 participants in Tait 1997 with bladder (110), rectal (14) or other (4) cancer. Forty participants (6.5%) in this comparison were women. All participants received RT as primary treatment. Cohorts in Dearnaley 1999 and Tait 1997 overlapped, such that there were an estimated 138 participants common to both studies. Sixty‐eight per cent of participants (154/225) in Dearnaley 1999 received hormone treatment, whereas participants in Koper 1999 did not; the proportion of participants receiving hormone treatment was not reported in Tait 1997. The median age of participants reported for Dearnaley 1999 and Tait 1997 ranged from 68 to 72 years (range 50 to 81). Koper 1999 reported similar mean ages for the two study arms (66 and 69 years, respectively). Participants were followed up for at least two years in Dearnaley 1999 and Koper 1999; however, the intended duration of follow‐up was unclear in Tait 1997, which only reported early outcomes up to three months post‐radiotherapy. Tait 1997 contributed no data to meta‐analysis.
IMRT versus conRT
Two studies randomised 94 participants to this comparison (Gandhi 2013; Gudipudi 2014). Participants in both studies were women with cervical cancer who received RT as primary treatment. All participants also received concurrent weekly platinum‐based chemotherapy and subsequent vaginal brachytherapy. In Gandhi 2013, the median age of participants was 50 and 45 years for the two study arms (range 35 to 65). Gudipudi 2014 was available only as a conference abstract, with limited methodological, baseline and outcome data. Median duration of follow‐up in Gandhi 2013 was approximately 22 months.
IMRT versus 3DCRT
Four studies evaluated this comparison in 447 participants: three studies were conducted in 232 women with cervical cancer (Chopra 2015; Naik 2016; Yu 2015); one was conducted in 215 men with prostate cancer (Viani 2016). Participants in all four studies received RT as primary treatment. Most female participants (94%) additionally received concurrent platinum‐based chemotherapy and subsequent vaginal brachytherapy, and 56% of male participants additionally received hormone treatment. The median age of female participants in Naik 2016 and Yu 2015 ranged from 45 to 57, whereas the mean age among men in Viani 2016 was 72 and 71 for each study arm, respectively. Duration of follow‐up was 90 days post‐radiotherapy for Naik 2016 and three years for Viani 2016 and Yu 2015. Chopra 2015 reported interim results for half of its target sample size in the form of a conference abstract and extractable data were sparse; we understand that follow‐up to a median duration of three years is planned (personal communication).
Brachytherapy (BT) versus external beam radiotherapy (EBRT)
Two studies evaluated this comparison. One was a large multicentre study (Nout 2009) involving 427 women with early‐stage endometrial cancer; the other was a small study (Manikandan 2015) conducted in 20 men with prostate cancer. In Nout 2009, women with endometrial cancer underwent adjuvant RT following surgery, which consisted of total abdominal hysterectomy (TAH), bilateral salpingo‐oophorectomy (BSO), node sampling of suspicious nodes, and peritoneal washings. Vaginal BT delivered as high‐dose rate BT of 21 Gy in three fractions of 7 Gy over two weeks (90% of participants) or low‐dose rate BT delivered as 30 Gy in one fraction was compared with EBRT of 46 Gy in conventional fractionation. The median age of participants in Nout 2009 was approximately 70 years and participants in this study were followed up for more than seven years. Participants in Manikandan 2015 received RT as primary cancer treatment, in addition to hormone treatment. Both arms of this study received initial treatment of IMRT (45 Gy), and were thereafter randomised to BT or IMRT. At the time of writing, Manikandan 2015 was only available as a conference abstract and extractable data were sparse. This study appears to be ongoing, as a subsequent 2016 conference abstract reported on 30 participants; however, this abstract lacked sufficient detail for data extraction. Furthermore, the target sample size and duration of follow‐up are unclear.
Other aspects of radiotherapy delivery
This diverse group of studies comprised 10 different comparisons/interventions evaluated in 14 trials:
Proton versus carbon ion technique
One study (Habl 2016: 92 participants) compared proton ion versus carbon ion techniques in male participants undergoing primary radiotherapy for localised prostate cancer. Twenty‐three per cent of participants also received hormone treatment. The radiotherapy dose in both arms of the study was 66 Gy in 20 fractions, alternating between 5 and 6 fractions a week for 3½ weeks. Participants were followed up for 24 months.
Reduced radiation dose volume
Two studies (289 participants: Arafat 2016; Huddart 2013) evaluated the effect of reduced radiation dose volumes compared with standard dose volumes on participants undergoing radiotherapy for bladder cancer. In Arafat 2016, all participants (60) underwent transurethral resection of the bladder tumour (TURBT) before randomisation. Participants in the intervention group received 64 Gy whole bladder radiotherapy alone compared with standard treatment (44 Gy whole pelvis radiotherapy followed by 20 Gy bladder boost). Huddart 2013 (219 participants) was a multicentre study in which centres opted at the outset to use a radiotherapy dose of either 55 Gy/20 fractions over four weeks or 64 Gy/32 fractions over 6½ weeks for all participants. Approximately 90% of participants in Huddart 2013 underwent tumour resection before randomisation. In the standard arm, the planning target volume (PTV) was the outer bladder wall plus the extravesical extent of the tumour with a margin of 1.5 cm. In the experimental arm, two PTVs were defined: PTV1 was the same as for the standard arm, and PTV2 comprised the gross tumour plus a 1.5 cm margin. In this arm, the aim was to deliver 100% of the reference dose to PTV2 and 80% of the reference dose to PTV1. 3DCRT was used. All participants in Arafat 2016 and 30% of participants in Huddart 2013 underwent concurrent chemotherapy. Most participants in these studies (90% and 82%, respectively) were men over the age of 55 years; follow‐up was two years in both studies.
A third study (Gupta 2009) compared a four‐field radiotherapy technique (anterior, posterior and two lateral fields) with a two‐field technique (anterior and posterior fields only) in 100 women with cervical cancer. The radiotherapy dose in this study was 40 Gy to whole pelvis, then 10 Gy with midline shield, in conventional fractionation, followed by BT. All participants received radiotherapy as primary treatment. The average age of participants was 48 years and 51 years in four‐field and two‐field arms, respectively. Participants were followed up for one year.
Belly boards and positioning tables
Two studies evaluated different immobilisation devices (Gaya 2013; Ljubenkovic 2002). Gaya 2013 (30 participants) evaluated a belly board device for RT delivery in the prone position for patients undergoing neoadjuvant chemoradiation for rectal cancer. The radiotherapy dose comprised 45 Gy in 25 fractions over five weeks in both arms, with 5‐fluorouracil chemotherapy on weeks 1 and 5 as a radiosensitiser. Ljubenkovic 2002 (183 participants) evaluated a customised positioning table in women with cervical cancer. Comparator arms were standard radiotherapy protocols in both studies. The median age of participants was 64 years in Gaya 2013. This study reported mainly dosimetric parameters and both studies had little to no usable review data; findings are therefore briefly described in Table 2.
| Study ID | Intervention (I) | Comparator (C) | Participants | Cancer type | Primary or adjuvant radiotherapy | Findings | Risk of bias judgement (study limitations) | Study conclusions | Reviewer comments | |
|---|---|---|---|---|---|---|---|---|---|---|
| Acute gastrointestinal toxicity | Late gastrointestinal toxicity | |||||||||
| Pharmacological interventions | ||||||||||
| smectite | placebo | 176 men and women | mainly pelvic, plus some abdominal cancers | primary and adjuvant | NR Reported time to development of diarrhoea | NR | Unclear risk | "Prophylactic smectite can delay the development of RT‐induced diarrhoea. A statistical significance could not be verified..." | No usable data for review purposes | |
| tropisetron (oral) | placebo | 33 men and women | various pelvic | primary | 5/? vs 4/? No difference in number of bowel actions | NR | High risk | Tropisetron showed no anti‐diarrhoeal effect | Poorly‐reported study that suggests no benefit | |
| simethicone (oral) | placebo | 78 men | prostate | primary | NR | NR | Unclear risk | "standardized bowel preparation education alone may be sufficient to limit the variation in rectal size over a course of radiation treatment." | GI toxicity was not reported by study arm in this conference abstract, but authors noted no benefits with this anti‐flatulence treatment | |
| famotidine (oral) | placebo | 36 men | prostate | primary | G2+ GI toxicity 2/16 (I) and 10/18 (C) | NR | Unclear risk | "We demonstrated that famotidine significantly reduces radiation‐induced injury on rectal mucosa..." Famotidine inhibits gastric acid secretion and is a powerful free radical scavenger. | Pilot study ‐ more research needed | |
| ibuprofen (oral) | no intervention | 31 women/1 man | gynaecological/prostate | primary | NR Reported no. of participants reporting 4 or more stools a day at least once: 10/17 (I) vs 8/15 (C) Vomiting: 0/17 (I) vs 4/15 (C) | NR | High risk | "The incidence and severity of diarrhoea was the same." "Prophylactic ibuprofen may be beneficial in reducing the severity of nausea and preventing radiation‐induced vomiting..." | Older study with very uncertain evidence and applicability | |
| Non‐pharmacological interventions | ||||||||||
| soy diet | regular diet | 42 men (26 analysed) | prostate | primary | cramping or diarrhoea: 2/13 (I) vs 1/13 (C) pain with bowel movements: 1/13 (I) vs 0/13 (C) | cramping or diarrhoea: 1/13 (I) vs 3/13 (C) pain with bowel movements: 1/13 (I) vs 2/13 (C) | High risk | Soy isoflavones might reduce GI and other radiation‐induced toxicity | High attrition was a problem in this underpowered study, so findings are inconclusive/very uncertain | |
| steady diet | control (exclusion diet) | 29 | rectal | primary | NR | NR | High risk | "control group showed a significant increase in incidence and grade of acute diarrhoea > G2 at end of treatment" | Available as abstract only with scant details of the intervention and data | |
| green tea (oral tablet) | placebo | 23 men and 19 women | various pelvic | primary and adjuvant | G1+ diarrhoea: 7/21 (I) vs 12/21 (C) | NR | High risk | "Green tea...could be effective in decreasing the frequency and severity of radiotherapy induced diarrhoea" | Underpowered study, so findings are inconclusive/very uncertain ‐ more research needed | |
| curcumin (oral tablet) | placebo | 40 men | prostate | primary | Mean GI symptom score: 25 (12.4) (I) vs 20.0 (18.0) (C) | NR | High risk | Curcumin "could not reduce the severity of bowel symptoms" but "could confer radioprotective effect...through reducing severity of radiotherapy related urinary symptoms" | Underpowered study, so findings are inconclusive/very uncertain ‐ more research needed | |
| Other aspects of radiotherapy delivery | ||||||||||
| belly board | standard practice | 30 | rectal | NR | Poorly‐reported toxicity data could not be extracted according to treatment arms | NR | High risk | "Set‐up reproducibility, small bowel V15, patient comfort and satisfaction were all significantly improved by the use of the Belly Board" | Interim analysis with serious design limitations | |
| proton technique | carbon ion technique | 92 men | prostate | primary | G2+ diarrhoea occurred in 4/46 (I) vs 0/45 (C) participants, respectively. 2 participants in the proton arm developed G3 rectal fistulas | NR | Unclear risk | Authors attributed the fistulas to the use of spacer gel, which they have stopped using. Diarrhoea scores and bowel symptoms tended to be worse in the proton arm than the carbon ion arm at end of treatment, 6 weeks and 6‐month assessments. Authors concluded that hypofractionation with "either carbon ions or protons results in comparable acute toxicities and QoL parameters." | More evidence is needed | |
| patient table | standard practice | 183 women | cervix | NR | G2+ "stool frequency" during RT occurred in 7/90 (I) and 34/93 (C) participants; 8/90 (I) vs 39/93 (C) required anti‐diarrhoeal medication; G2+ cramping occurred in 4/90 (I) vs 32/93 (C) | NR | High risk | "Use of the unique patient‐table led to protection of the small bowel during radiotherapy for uterine malignancies..." | Serious study design limitations undermine the usefulness of these findings | |
| HBOT** | no HBOT | 65 women | cervix | NR | Change from baseline in LENT‐SOMA scores were reported but data were not usable (reported as percentages) | Change from baseline in LENT‐SOMA scores were reported but data were not usable (reported as percentages) | High risk | "The HBOT procedure yield hyperoxia, hypervascular and hypercellular that improved the tissue damage after pelvic radiation. This condition will decrease acute and late side effect showed by LENT SOMA scale and improved QoL shown by Karnofsky score." | Serious study design limitations undermine the usefulness of these findings | |
* For more details, please see individual Characteristics of Studies tables in Characteristics of included studies.
**Details of the timing of this intervention were sparse; however, it appeared that HBOT in this study was administered to women after they had completed their course of pelvic RT.
Abbreviations: C = control; HBOT = hyperbaric oxygen therapy; I = intervention; NR = not reported
Evening radiotherapy treatment
Two studies (Shukla 2010; Chang 2016) evaluated evening radiotherapy delivery compared with morning radiotherapy delivery in 229 women and 67 women, respectively, receiving primary RT for cervical cancer. Mean participant age in these studies ranged from 47 to 50 years in the study arms, and both groups also received intracavitatory brachytherapy. Follow‐up in these studies was limited to the period of RT.
Bladder volume preparation
Mullaney 2014 compared pre‐RT bladder‐filling protocols of 1080 ml compared with 540 ml in 110 men receiving primary RT for prostate cancer. The policy at the institution in which the study was conducted was to instruct patients to empty their bladder, drink 1080 ml of water and wait 30 to 40 minutes prior to undergoing RT.
Hyperbaric oxygen
Sidik 2007 compared hyperbaric oxygen therapy (HBOT) with no HBOT in 65 women undergoing primary RT for cervical cancer. This study reported scant data on review outcomes, and findings are summarised in Table 2.
Prerectal spacers
Two studies evaluated a transperitoneal hydrogel spacer/injection (Mariados 2015; Prada 2009) compared with no spacer in 229 and 69 men undergoing RT for prostate cancer, respectively. The mean age across study groups ranged from 66 to 69 years. The RT technique employed in Mariados 2015 was IG‐IMRT (79.2 Gy in 1.8‐Gy fractions) and in Prada 2009 was BT, with the duration of follow‐up in Mariados 2015 of up to 15 months in the main report, and in Prada 2009 a median of 26 months. A follow‐up study of Mariados 2015 (Hamstra 2017) involved 63% of the original sample at a median of approximately three years post‐enrolment.
Endorectal balloons (ERBs)
Two studies evaluated ERBs in men undergoing primary RT for prostate cancer (Botten 2015; Van Lin 2007). Botten 2015 at the time of writing has only been reported as conference abstracts with little usable data. Mean age of the men in this study was 72 years but other details are scant, including the RT regimen used. In Van Lin 2007 (48 participants), participant characteristics are lacking in the report, but the RT regimen described was 67.5 Gy delivered in 7½ weeks (four fractions a week) in 2.25‐Gy daily fractions. Participants were followed up for 30 months in Van Lin 2007 and for one year in Botten 2015.
Pharmacological interventions
This group of studies comprised 16 different interventions evaluated in 38 trials:
Anti‐inflammatory agents
Aminosalicylates
Seven studies (583 participants) evaluated different formulations of aminosalicylates (5‐ASAs) including balsalazide (Jahraus 2005; 27 participants), sulfasalazine (Kilic 2000; Miller 2016; Pal 2013; 272 participants altogether), olsalazine (Martenson 1996; 58 participants) and mesalazine (Resbeut 1997; 153 participants; Baughan 1993; 73 participants). Jahraus 2005 and Pal 2013 exclusively enrolled men with prostate cancer and women with cervical cancer, respectively. The other studies enrolled both men and women with pelvic cancer in whom mostly primary radiotherapy treatment was indicated. Radiotherapy doses ranged from 30 Gy to 60 Gy in conventional fractionation over three to seven weeks. Overall, women comprised 23% (137/583) of participants enrolled in all seven studies. Aminosalicylates versus placebo were administered orally in all studies. The dose of sulfasalazine in three studies was 1000 mg twice daily (Kilic 2000; Miller 2016; Pal 2013); the dose of balsalzide was 2250 g twice daily (Jahraus 2005); the dose of olsalazine was 500 mg twice daily (Martenson 1996); the equivalent dose of 5‐ASA was 2000 mg twice daily in Resbeut 1997 and 800 mg three times daily in Baughan 1993. The intervention began at the start of radiotherapy and was continued daily throughout radiotherapy treatment. In five studies, the intervention continued after radiotherapy for a variable period of one to four weeks. The longest follow‐up among this group of studies was three months (Resbeut 1997). The olsalazine study (Martenson 1996) closed early as more participants in the experimental arm suffered severe toxicity (diarrhoea grade 3) attributed to the study medication.
One other three‐arm study (Sanguineti 2003) compared a hydrocortisone 100 mg foam enema with sucralfate 3 g suspension enema and mesalazine 4 g gel enema in 134 men undergoing primary radiotherapy at a dose of 76 Gy in conventional fractionation; however, the mesalazine arm was discontinued early in the study, following an unplanned interim analysis that indicated drug‐related toxicity with mesalazine in seven out of the eight participants recruited to this study arm.
Ibuprofen
One study (Stryker 1979) evaluated oral ibuprofen (400 mg six‐hourly) compared with no intervention in 32 participants (31 with gynaecological cancer and one with prostate cancer) undergoing primary radiotherapy. The mean age of participants was 60 years and 56 years for study and control groups, respectively. The intervention began at the start of radiotherapy and continued for the duration (five to six weeks) of radiation treatment. Participants were followed up during radiotherapy only (See Table 2).
Corticosteroids
Two studies (Fuccio 2011; Sanguineti 2003) evaluated corticosteroid enemas in men undergoing radiotherapy for prostate cancer. Fuccio 2011 evaluated rectal beclomethasone dipropionate versus placebo in 120 men with a mean age of approximately 70 years. Just over half of these participants had undergone primary surgery (prostatectomy), with 30% receiving hormone therapy. The radiotherapy dose ranged from 66 to 74 Gy in conventional fractionation. The intervention was administered as a 3 mg enema during the radiotherapy treatment period and as a twice‐daily 3 mg suppository for four weeks after radiotherapy. Participants were followed up for 12 months and the study reported cumulative incidence of GI toxicity up to 12 months. Sanguineti 2003 was a three‐arm study that compared a hydrocortisone 100 mg foam enema with sucralfate 3 g suspension enema and mesalazine 4 g gel enema in 134 men undergoing primary radiotherapy for prostate cancer at a dose of 76 Gy in conventional fractionation. The mean/median age of participants was not reported. The mesalazine arm was discontinued early in the study following an unplanned interim analysis that indicated drug‐related toxicity with mesalazine. The investigators chose to compare hydrocortisone to sucralfate "because it (sucralfate) had not shown any benefit over placebo in a previous double‐blind randomised study".
Orgotein (superoxide dismutase)
Two studies evaluated this agent in participants undergoing radiotherapy for rectal (Esco 2004) and bladder cancer (Menander‐Huber 1978). Participants in Esco 2004 received adjuvant radiotherapy at a dose of 50 Gy in conventional fractionation, and in Menander‐Huber 1978 received primary radiotherapy treatment using an outdated technique. Orgotein was administered by subcutaneous (SC) and intramuscular (IM) injection in these studies, respectively. In Esco 2004, IM injections were given three times weekly during treatment and, in Menander‐Huber 1978, SC injections were administered after each daily radiotherapy fraction. Participants were followed up for two years in both studies.
Amifostine
Five studies evaluated amifostine administered before radiotherapy; four compared subcutaneously (SC) (Katsanos 2010; Koukourakis 2000) or intravenously (IV) (Athanassiou 2003; Kouvaris 2003) administered amifostine versus no intervention, and one compared SC amifostine (500mg) with a 1500 mg amifostine enema (Kouloulias 2005). Amifostine regimens were usually a 500 mg single dose daily before RT, except for Athanassiou 2003, which administered an IV dose of 340 mg/m2. Participants in four of the studies were men and women undergoing primary or adjuvant radiotherapy for pelvic cancers; however, one study (Koukourakis 2000) included a subgroup of participants with pelvic cancer (40 out of 140 male and female participants) and reported outcomes separately by subgroup. Radiotherapy doses ranged from 44 Gy to 72 Gy in conventional fractionation in these studies, depending on the type of cancer. Follow‐up reportedly ranged from six to 12 months post‐radiotherapy in these studies; however, most studies reported acute effects only.
Bile acid sequestrants
Two small older studies evaluated these agents (Chary 1984; Stryker 1983). Chary 1984 compared cholestyramine with placebo during and for two months after radiotherapy; Stryker 1983 compared colestipol with no intervention during radiotherapy treatment only. Both involved a mixed group of participants with pelvic cancers; Chary 1984 involved mainly male participants (23/33; 70%) whereas Stryker 1983 involved mainly female participants (28/31; 89%). Most participants (27/33) in Chary 1984 were undergoing primary radiotherapy, whereas most (25/31) in Stryker 1983 were undergoing adjuvant radiotherapy. A radiotherapy dose of 50 Gy in standard fractions over five days for a period of five to six weeks was delivered to participants in Chary 1984, and 'standard whole pelvic radiation' was given to participants in Stryker 1983. The mean age of participants was approximately 68 years in Chary 1984 and 57 years in Stryker 1983. Follow‐up in Chary 1984 was up to two months post‐radiotherapy and for Stryker 1983 was during treatment only.
Famotidine
One pilot study (Razzaghdoust 2014) randomised 36 men with prostate cancer to the H2 receptor antagonist famotidine (40 mg orally before each radiotherapy fraction) or placebo. Primary radiotherapy treatment comprised a dose of 70 Gy in conventional fractions. Participants also received hormone treatment. The mean age of participants was approximately 68 years and 66 years in the intervention and placebo arms, respectively. Participants were followed up during radiotherapy only.
Magnesium oxide
One study (Lips 2011: 92 participants) evaluated oral magnesium oxide (500 mg twice daily) versus placebo in men undergoing primary radiotherapy (77 Gy in 35 fractions) for prostate cancer. The median age of participants was approximately 71 years and approximately half of participants also received hormonal treatment. Follow‐up was conducted up to four weeks post‐radiotherapy.
Misoprostol
One study (Hille 2005) evaluated the effects of misoprostol rectal suppositories (400 µg) versus placebo in 100 men undergoing primary radiotherapy treatment for prostate cancer. The radiotherapy dose ranged from 45 Gy to 72 Gy in standard fractionation and boost delivered using the 3DCRT technique. Most participants (82%) also received concurrent hormone therapy. Suppositories were administered one hour before each radiotherapy fraction. Mean age of participants was approximately 68 years. Participants were followed up for a median of 50 months.
Octreotide
Two studies (363 participants) compared long‐acting octreotide acetate with placebo in patients undergoing radiotherapy for pelvic (Martenson 2008) and anorectal cancer (Zachariah 2010), respectively. Martenson 2008 included participants with rectal (45/125; 36%), prostate (38/125; 30%), gynaecological (36/125; 29%) and other (6/125; 5%) cancers. Sixty‐one per cent of participants in Martenson 2008 and 82% of those in Zachariah 2010 also received concurrent chemotherapy. Octreotide was delivered as 100 µg SC test dose on Day 1 of radiotherapy, followed by 20 mg intramuscularly (IM) on Day 2 (if tolerant) and Day 29 in Martenson 2008; in Zachariah 2010 a dose of 30 mg was given IM four to seven days before the start of radiotherapy and again on Day 22 of radiotherapy treatment. The planned radiotherapy dose was 45 Gy in conventional fractionation for both studies; however, the proportion of participants receiving adjuvant and primary radiotherapy was not stated. Women comprised 37% of the sample in Zachariah 2010, and the gender of participants in Martenson 2008 was not stated. Follow‐up in Martenson 2008 occurred during radiotherapy only, whereas in Zachariah 2010 follow‐up was conducted for 15 months post‐radiotherapy.
Selenium
One study (Muecke 2010: 81 participants) evaluated the effects of oral selenium supplements (500 mg on the days of radiotherapy and 300 mg on the rest days) compared with no intervention in women undergoing adjuvant radiotherapy for gynaecological cancers. External radiotherapy was delivered in conventional fractionation, with optional brachytherapy according to German guidelines. Median age of participants in the intervention and control groups was 64.8 years and 63.8 years, respectively. Participants were followed up for six weeks after radiotherapy.
Simethicone
This agent was evaluated in one study (McGuffin 2016) conducted among 78 participants undergoing primary radiotherapy for prostate cancer. At the time of writing, the report was available as a conference abstract only.
Smectite
One study (Hombrink 2000: 176 participants) evaluated oral smectite (6 g twice daily) compared with placebo in a mixed population undergoing radiotherapy for mainly pelvic cancers.
Sodium butyrate
One study (Maggio 2014: 166 participants) evaluated this agent in men undergoing radiotherapy for prostate cancer. Sodium butyrate was administered as an enema in different doses (1 g, 2 g and 4 g) to three study arms and compared with a placebo arm. Half the total sodium butyrate dose in the intervention arm was administered after radiotherapy and the other half was administered eight to 12 hours later. Radiotherapy was indicated as primary treatment and the radiotherapy dose was 70 Gy in conventional fractionation using a 3DCRT technique; 61% of participants also received hormone therapy. The mean age of participants was not stated. Participants were followed up for six weeks post‐radiotherapy.
Sucralfate
Sucralfate was evaluated in 10 studies (1115 participants) altogether, either as an oral (Henriksson 1990; Henriksson 1991; Hovdenak 2005; Kneebone 2001; Martenson 2000; Stellermans 2002; Valls 1991; Valls 1999) or rectal preparation (O'Brien 1997; Sanguineti 2003). Three of the studies were conducted in men undergoing primary radiotherapy for prostate cancer (Kneebone 2001; O'Brien 1997; Sanguineti 2003), one was conducted in women requiring adjuvant radiotherapy for gynaecological cancers (Henriksson 1990), and the rest were conducted in a mixed population undergoing primary radiotherapy for various pelvic cancers. Women comprised 25.7% (219/851) of the seven studies that reported participant gender; three studies (Hovdenak 2005; Henriksson 1991; Stellermans 2002) with 70, 52 and 108 participants respectively did not report gender characteristics of their samples. Oral doses ranged from 4 g to 8 g a day in three or four divided doses. Enemas consisted of a 3 g sucralfate dose given daily before radiotherapy fractions. Interventions were compared with placebos in all studies except for Henriksson 1990 (which compared sucralfate with no treatment) and Sanguineti 2003 (which compared sucralfate with mesalazine or hydrocortisone). In the latter study, the mesalazine arm was discontinued due to toxicity. Standard radiotherapy doses and fractionation were used in these studies. Follow‐up was fairly short‐term in most of the studies, but four studies followed up participants for a year or more.
Tropisetron
One three‐arm study (Kardamakis 1995: 33 participants) evaluated this serotonin 5‐HT3 receptor antagonist (25 mg daily tropisetron orally) given for six or three weeks from the start of radiotherapy treatment versus placebo in a mixed patient population undergoing primary radiotherapy for various pelvic cancers. This study was reported briefly in letter format and contained little study information or extractable data.
Non‐pharmacological interventions
This group of studies comprised 13 interventions evaluated in 29 trials.
Probiotics
Eight studies (983 participants) evaluated probiotic preparations that included lactobacilli, with or without bifidobacteria and other probiotic strains (Chitapanarux 2010; Delia 2007; Demers 2014; Giralt 2008; Nascimento 2014; Mansouri‐Tehrani 2016; Salminen 1988; Timko 2010). Nascimento 2014 and Salminen 1988 combined the probiotic intervention with a prebiotic diet (synbiotic interventions). Mansouri‐Tehrani 2016 compared a probiotic preparation administered with or without honey to placebo in a three‐arm study. Doses and strains of probiotics varied widely across the studies. Three of the studies were conducted in women with gynaecological cancers (Chitapanarux 2010; Giralt 2008; Salminen 1988), in which radiotherapy was the primary treatment in Chitapanarux 2010, and was primary or adjuvant treatment in Giralt 2008 and Salminen 1988. One small study was conducted in men undergoing primary radiotherapy for prostate cancer (Nascimento 2014), and the other four were conducted in men and women undergoing primary or adjuvant radiotherapy for various pelvic cancers. One large study (Delia 2007) did not report baseline characteristics of the participants. Of the other seven studies, women comprised 60% (300/501) of the participants evaluated, with the mean or median age reported for each study group ranging from 47 to 70 years. Follow‐up of participants in most studies was limited to the period of radiotherapy treatment and a few weeks thereafter; however, one study (Timko 2010) followed up participants for six months after radiotherapy.
Nutritional interventions
Studies evaluated various types of nutritional interventions including:
Elemental diet
One small study (McGough 2008: 50 participants) evaluated the effect of an elemental diet versus a regular diet in participants undergoing primary or adjuvant radiotherapy for various pelvic cancers. The sample comprised 28 women and 22 men. Mean radiotherapy dose ranged from 50.4 Gy to 54 Gy in conventional fractionation. Some participants also received concomitant chemotherapy. Participants in the elemental intervention group were asked to replace one meal a day, equivalent to 33% of total caloric requirements, with elemental diet (E028) with calories from fat sources comprising 35% of formula provided in the form of ready‐to‐drink 250 mL cartons and powder sachets. Overall compliance was only 21% of replacement of total caloric requirement. Participants were followed up for 10 weeks.
Lactose‐restricted diet
One small three‐arm study (Stryker 1986: 64 participants) evaluated a lactose‐restricted diet versus a modified lactose or regular diet in participants undergoing primary or adjuvant radiotherapy for various pelvic cancers. Most participants (89%) were women with gynaecological cancers. Standard radiotherapy doses and fractions were used. Follow‐up occurred during the period of radiotherapy only.
Fibre‐modified diets
Four studies (318 participants) evaluated fibre‐modified diets compared with regular diets, including Garcia‐Peris 2016 (6 g mixed fibre twice daily from one week before radiotherapy to three weeks after versus placebo); Itoh 2015 (1 g hydrolyzed rice bran three times a day versus placebo); Murphy 2000 (psyllium agent versus no intervention); and Wedlake 2017 (high‐fibre (> 18 g per day) versus low‐fibre (< 10 g per day) versus regular diet). Participants in Itoh 2015 (20 participants) and Wedlake 2017 (166 participants) were undergoing primary radiotherapy treatment for various pelvic cancers, those in Garcia‐Peris 2016 (48 participants) were undergoing adjuvant radiotherapy for gynaecological cancers, and the type of radiotherapy treatment (primary or adjuvant) was not stated in Murphy 2000 (84 participants). All participants in Itoh 2015 and 72% of participants in Wedlake 2017 received concomitant chemotherapy. Women comprised all participants in Itoh 2015 and Garcia‐Peris 2016, and 58% and 15% of participants in Wedlake 2017 and Murphy 2000, respectively. Follow‐up in these studies was limited to the radiotherapy period only in Itoh 2015, and to three months (Garcia‐Peris 2016), six months (Murphy 2000) or one year (Wedlake 2017) post‐radiotherapy in the other studies.
Low‐fat diets
One three‐arm study ( Wedlake 2012: 117 participants) evaluated a low‐fat (less than 20% of dietary energy from fat) versus a modified‐fat (40% of dietary energy from fat, with 50% to be derived from a liquid supplement) versus a normal‐fat diet (40% of dietary energy from fat). Participants included a mixed population undergoing primary radiotherapy (54 Gy to 64 Gy in conventional fractionation) for various pelvic cancers; 50% of participants also received concomitant chemotherapy. Approximate two‐thirds of participants were men. Follow‐up was conducted up to one year post‐radiotherapy.
Prebiotic diet
The one study included in this group was also included in the fibre‐modified diet comparison above as the intervention (inulin and fructo‐oligosaccharide added to restrictive diet) could be classed as both or either. Participants in Garcia‐Peris 2016 (48 participants) were women undergoing adjuvant radiotherapy for gynaecological cancers, as described above.
'Steady' diet
One small study (Arregui Lopez 2012: 29 participants) evaluated a 'steady diet' versus a 'diet based on general recommendations'. At the time of writing, the report of this Spanish study was available as a conference abstract only and it was not clear what was meant by a 'steady' diet. We included this study anticipating that the full report would contain details of the dietary intervention. Participants in this study were undergoing adjuvant radiotherapy (median dose of 45 Gy) for rectal cancer and they also appear to have received neoadjuvant chemotherapy. Follow‐up was conducted up to three weeks post‐radiotherapy.
Soy diet
One small study (Ahmad 2010: 42 participants) evaluated a 'soy diet' versus a regular diet among male participants undergoing primary radiotherapy for prostate cancer. The intervention (100 mg tablet of soy isoflavones twice daily), which began on the first day of radiation and continued for six months, was compared with placebo. The radiotherapy dose, ranging from 73.8 Gy to 77.5 Gy, was delivered in conventional fractionation. No participants received chemotherapy or hormone therapy. Median ages of participants were 60 and 65 years for intervention and placebo groups, respectively. Attrition was high in this study, which aimed to follow up participants for six months.
High‐protein supplements
One three‐arm study (Ravasco 2005) compared a high‐protein supplement in addition to the usual diet, with usual diet or an individualised dietary counselling intervention among 111 participants (60% male) undergoing primary or adjuvant radiotherapy for colorectal cancer. The protein supplement was a commercial product available in a 200 ml can providing 20 g protein and 200 kcal; participants in the protein supplement arm received two cans a day. Radiotherapy consisted of 50.4 Gy in conventional fractionation, with an initial study follow‐up of three months (Also see 'Counselling' interventions below).
Glutamine
Five studies (358 participants) evaluated the effects of oral glutamine (Kozelsky 2003; Manir 2014; Rotovnik Kozjek 2011; Vidal‐Casariego 2014) or glutathione (De Maria 1992) versus placebo in people undergoing primary or adjuvant radiotherapy for pelvic cancer. Participants in these studies included both men and women, except for De Maria 1992 which included only women with endometrial cancer. Overall, women comprised 48% of all participants and the mean or median age across study groups ranged from 57 years to 67.5 years. The radiotherapy doses used in these studies ranged from 45 Gy to 60 Gy in conventional fractionation. Most studies evaluated outcomes during radiotherapy only. One study (Kozelsky 2003) apparently followed up participants for two years but contributed very little long‐term data.
Other non‐pharmacological interventions
Counselling
Two studies evaluated counselling interventions: Kim 2002 evaluated a counselling intervention on what to expect with radiotherapy treatment among 184 male participants undergoing primary radiotherapy for prostate cancer; Ravasco 2005 evaluated a dietary counselling intervention among 111 participants (60% male) undergoing primary or adjuvant radiotherapy for colorectal cancer. In this study, individualised dietary counselling based on a person's regular diet was compared with a high‐protein supplement in addition to a regular diet, or a regular diet only. Participants in the dietary counselling arm received a prescription diet using regular foods and adjusted to the individual's usual diet, "thereby recognizing personal eating patterns and preferences". The dose of radiotherapy in Ravasco 2005 was 50.4 Gy in conventional fractionation but was not stated in Kim 2002. Duration of follow‐up in Ravasco 2005 was three months initially, but a subsequent report included follow‐up at a median of 6½ months. Follow‐up in Kim 2002 was conducted during radiotherapy treatment only.
Curcumin
A pilot study (Hejazi 2013) of 45 participants (40 analysed) evaluated curcumin (turmeric) tablets versus placebo in men undergoing radiotherapy for prostate cancer. Curcumin tablets (1 g three times a day with meals) or placebo tablets were started one week before radiotherapy and continued throughout the treatment period. The radiotherapy dose was 74 Gy in conventional fractionation. Participants with a mean age of 69.7 years and 71.9 years in intervention and placebo arms, respectively, were followed up for three months after radiotherapy.
Green tea
One small study (Emami 2014: 42 participants) evaluated green tea tablets versus placebo in a mixed population undergoing primary or adjuvant radiotherapy for various pelvic cancers. The dose of green tea was 450 mg daily for five weeks (duration of radiotherapy treatment). Forty‐five per cent of evaluated participants were women and the mean age in the green tea and placebo groups was 65.7 years and 58.7 years, respectively. The radiotherapy dose was 50 Gy in conventional fractionation. Follow‐up occurred for four weeks post‐radiotherapy.
Proteolytic enzymes
Two studies (176 participants) evaluated capsules containing papain, trypsin and chymotrypsin enzymes (Dale 2001; Martin 2002); Dale 2001 compared the enzymes with no intervention and Martin 2002 compared the enzymes with placebo. Participants in Dale 2001 (120 women) were undergoing primary radiotherapy (50 Gy to 60 Gy in conventional fractionation, plus brachytherapy) for cervical cancer. Participants in Martin 2002 (56 participants) were women (73%) and men (27%) undergoing adjuvant radiotherapy (50.4 Gy in conventional fractionation) for various pelvic cancers. Mean age of participants in Dale 2001 was 49.9 years in the intervention group and 49.3 years in the control group, and for Martin 2002 were 53.8 years and 57.3 years, respectively. Dale 2001 followed participants up for three months after radiotherapy, whereas follow‐up in Martin 2002 occurred during radiotherapy treatment only.
Excluded studies
Fifty‐nine studies were excluded (57 from September 2016 and two from the November 2017 full texts assessed) for the following reasons:
-
Ineligible study design, e.g. observational study (29 studies)
-
Ineligible intervention, e.g. dose escalation study (13 studies)
-
Ineligible comparator, e.g. chemotherapy (4 studies)
-
Ineligible patient population, e.g. people with non‐pelvic cancers (4 studies)
-
Ineligible outcomes, e.g. dosimetric parameters only (3 studies)
-
Published editorial or review (3 publications)
-
Fewer than 20 participants (3 studies)
For a complete list of excluded studies with reasons, please refer to the Characteristics of excluded studies section.
Also see Potential biases in the review process where we discuss some of the more difficult decisions taken.
Risk of bias in included studies
Overall 'Risk of bias' judgements are reported below. For individual judgements for each of the 'Risk of bias' domains for each included study that informed the overall 'Risk of bias' judgement, please refer to the 'Risk of bias' tables in the Characteristics of included studies section and Figure 2.

Risk of bias summary: review authors' judgements about each risk of bias item for each included study.
Studies of radiotherapy techniques (11 studies)
We judged the risk of bias of three of these RCTs as low risk (Dearnaley 1999; Koper 1999; Nout 2009), seven as unclear risk (Chopra 2015; Gudipudi 2014; Manikandan 2015; Naik 2016; Tait 1997; Viani 2016; Yu 2015) and one as high risk overall (Gandhi 2013). We assigned an overall assessment of unclear risk when study methods had not been described in sufficient detail to make a judgement in several domains, in the absence of serious risk of bias concerns for any specific domain (apart from blinding). Two of these study reports were conference abstracts (Gudipudi 2014; Manikandan 2015), with scant methodological information and outcome data. We rated Gandhi 2013 at high risk of bias potential as this trial did not have a prespecified and adequately‐powered sample size and its positive findings could have influenced the decision to stop the trial.
Studies of other aspects of radiotherapy delivery (14 studies)
We judged most of these studies as having an unclear risk of bias overall, due to insufficient information on study methods or due to methodological limitations. However, we rated the two studies evaluating belly boards or positioning devices (Gaya 2013; Ljubenkovic 2002), the study evaluating a transperineal hyaluronic acid injection (Prada 2009) and the study on hyperbaric oxygen (Sidik 2007) at high risk of bias. Huddart 2013, evaluating a reduced radiation dose volume intervention, was the only study assessed as having a low risk of bias overall.
Studies of pharmacological interventions (38 studies)
Aminosalicylates: We rated the seven aminosalicylate studies at low (Baughan 1993; Jahraus 2005; Miller 2016) or unclear risk of bias overall (Kilic 2000; Pal 2013; Martenson 2000; Resbeut 1997). Methodology was poorly described in Kilic 2000; Pal 2013; Martenson 2000 and Resbeut 1997, making judgement of overall risk of bias impossible.
Amifostine: We judged these five studies either as high risk of bias overall (Athanassiou 2003; Katsanos 2010; Kouloulias 2005) or unclear risk (Koukourakis 2000; Kouvaris 2003), mainly due to methodological or reporting limitations, or both.
Sucralfate: We rated these 10 studies at low (Kneebone 2001), unclear (Henriksson 1990; Henriksson 1991; Martenson 2000; O'Brien 1997; Sanguineti 2003; Stellermans 2002; Valls 1991; Valls 1999) or high risk of bias (Hovdenak 2005). In addition to lacking details on randomisation and allocation methods in the report, the high risk of bias study was stopped early following an unplanned interim analysis of 44 evaluable participants that showed significantly increased diarrhoea in the sucralfate group. Studies judged to be at unclear risk of bias mostly lacked methodological details in their reports or there were inconsistencies that cast some doubt on the findings (e.g. Henriksson 1990) or the baseline characteristics of the participants were imbalanced (e.g. Valls 1991, which included seven participants with colostomies in the intervention arm and three in the control arm).
Corticosteroids: We rated Fuccio 2011 at low risk of bias and Sanguineti 2003 at unclear risk of bias overall.
Octreotide: We judged Martenson 2008 as having unclear risk of bias overall, due to imbalances in baseline characteristics between intervention and placebo groups. We rated Zachariah 2010 at unclear risk of bias, as the report lacked certain methodological details on which we could base risk of bias judgements.
Other pharmacological interventions: The methodology of most of these studies was poorly described in the available reports and led to judgements of unclear risk of bias overall (bile acid sequestrants: Chary 1984; Stryker 1983; ibuprofen: Stryker 1979; misoprostol: Hille 2005; orgotein: Esco 2004; Menander‐Huber 1978; selenium: Muecke 2010; simethcone: McGuffin 2016; smectite: Hombrink 2000; sodium butyrate: Maggio 2014; tropisetron: Kardamakis 1995). We judged two studies (famotidine: Razzaghdoust 2014; magnesium oxide: Lips 2011) as having low risk of bias overall.
Non‐pharmacological interventions (29 studies)
Dietary interventions: We rated most RCTs at high risk of bias overall (Ahmad 2010; Arregui Lopez 2012; Garcia‐Peris 2016; Itoh 2015; McGough 2008; Murphy 2000; Stryker 1986; Wedlake 2012). We judged one individual RCT as being at low risk of bias overall (Wedlake 2017; fibre diet) and one at unclear risk of bias (Pettersson 2012).
Probiotics: We rated most of these studies at unclear risk of bias (Chitapanarux 2010; Demers 2014; Giralt 2008; Nascimento 2014; Mansouri‐Tehrani 2016; Salminen 1988; Timko 2010), and high risk of bias overall (Delia 2007).
Glutamine: We judged two studies to have a low risk of bias overall (Rotovnik Kozjek 2011; Vidal‐Casariego 2014) and three studies to have an unclear risk of bias overall (De Maria 1992; Kozelsky 2003; Manir 2014).
Counselling: We judged Ravasco 2005 (dietary counselling) to be at low risk of bias overall, whereas Kim 2002 (counselling on what to expect with RT) was at unclear risk of bias.
Protein supplements: See Ravasco 2005 above (counselling).
Other interventions: We rated the two studies of proteolytic enzymes to be at high risk of bias overall (Dale 2001; Martin 2002), and Emami 2014 (green tea) and Hejazi 2013 (curcumin) to be at unclear and high risks of bias, respectively.
Effects of interventions
See: Summary of findings 1 Summary of findings: Conformal RT vs conventional RT; Summary of findings 2 Summary of findings: IMRT vs 3DCRT; Summary of findings 3 Summary of findings: BT vs EBRT; Summary of findings 4 Summary of findings: Reduced dose volume vs standard dose volume; Summary of findings 5 Summary of findings: Higher bladder volume vs lower bladder volume; Summary of findings 6 Summary of findings: Evening RT vs morning RT; Summary of findings 7 Summary of findings: Hydrogel spacer vs no intervention; Summary of findings 8 Summary of findings: Endorectal balloon vs no intervention; Summary of findings 9 Summary of findings: Aminosalicylates vs placebo; Summary of findings 10 Summary of findings: Superoxide dismutase vs no intervention; Summary of findings 11 Summary of findings: Corticosteroids vs placebo; Summary of findings 12 Summary of findings: Sucralfate vs placebo; Summary of findings 13 Summary of findings: Amifostine vs no intervention; Summary of findings 14 Summary of findings: Sodium butyrate vs placebo; Summary of findings 15 Summary of findings: Selenium vs no intervention; Summary of findings 16 Summary of findings: Bile acid sequestrants vs no intervention; Summary of findings 17 Summary of findings: Misoprostol vs placebo; Summary of findings 18 Summary of findings: Magnesium oxide vs placebo; Summary of findings 19 Summary of findings: Octreotide vs placebo; Summary of findings 20 Summary of findings: Diet interventions vs usual on‐treatment diet; Summary of findings 21 Summary of findings: Protein supplements vs no intervention; Summary of findings 22 Summary of findings: Probiotics vs control (placebo or no intervention); Summary of findings 23 Summary of findings: Proteolytic enzymes vs control (placebo or no intervention); Summary of findings 24 Summary of findings: Glutamine vs placebo; Summary of findings 25 Summary of findings: Counselling vs no intervention
We summarise the findings of certain interventions that have been evaluated in only a single small (underpowered) study or in a study with no usable data on review outcomes in Table 2.
Radiotherapy techniques
Conformal RT (3DCRT and/or IMRT) compared with conventional radiotherapy (conRT)
Study participants in the 3DCRT subgroup (n = 473) were mostly men with prostate cancer and those in the IMRT subgroup (n = 44) were women with cervical cancer.
-
GI symptom scores: No evidence was found.
-
GI toxicity (grade 2+): High‐certainty evidence shows that conformal RT is associated with less acute GI toxicity (grade 2+) than conventional RT (risk ratio (RR) 0.57, 95% confidence interval (CI) 0.40 to 0.82; participants = 307; studies = 2; I2 = 0%; Analysis 1.1); however, moderate‐certainty evidence suggests that there is probably little or no difference in late GI toxicity grade 2+ (RR 0.49, 95% CI 0.22 to 1.09; participants = 517; studies = 3; I2 = 44%; Analysis 1.2). Subgroup findings for these outcomes were consistent with the pooled estimates. When the grade 1 events are included in the analysis, low‐certainty evidence suggests that there may be little or no difference between conformal and conventional RT with regard to acute grade 1+ GI toxicity (RR 0.75, 95% CI 0.42 to 1.36; participants = 307; studies = 2; I2 = 68%; Analysis 1.3) and late grade 1+ GI toxicity (RR 0.55, 95% CI 0.19 to 1.59; participants = 292; studies = 2; I2 = 72%; Analysis 1.4).
-
Diarrhoea (grade 2+): No evidence was found.
-
Other GI symptoms (grade 2+): Evidence on vomiting is of a very low certainty (Analysis 1.5) and we found no evidence on other GI symptoms.
-
Medication use for GI symptom control: Moderate‐certainty evidence suggests that there is probably little or no difference in the use of medication for symptom control (RR 0.86, 95% CI 0.44 to 1.66; participants = 263; studies = 1; Analysis 1.6).
-
Other review outcomes: There were no data for meta‐analysis on QoL or other review outcomes.
IMRT compared with 3DCRT
-
GI symptom scores: Low‐certainty evidence suggests that GI symptom scores on the EORTC QLQ25 scale may be better with IMRT at various time points, including six months (mean difference (MD) ‐5.00, 95% CI ‐9.06 to ‐0.94; participants = 181; studies = 1; Analysis 2.1) and two years (MD ‐7.00, 95% CI ‐13.45 to ‐0.55; participants = 165; studies = 1; Analysis 2.2).
-
GI toxicity (grade 2+): Low‐certainty evidence suggests that IMRT may be associated with less acute GI toxicity grade 2+ than 3DCRT (RR 0.48, 95% CI 0.26 to 0.88; participants = 444; studies = 4; I2 = 77%; Analysis 2.3) and less late GI toxicity grade 2+ (RR 0.37, 95% CI 0.21 to 0.65; participants = 332; studies = 2; I2 = 0%; Analysis 2.4). Including grade 1 GI toxicity data, the evidence suggesting a benefit with IMRT remains low certainty for acute toxicity grade 1+ (RR 0.59, 95% CI 0.41 to 0.86; participants = 444; studies = 4; I2 = 69%; Analysis 2.5) and late grade 1+ toxicity (RR 0.65, 95% CI 0.46 to 0.93; participants = 332; studies = 2; I2 = 0%; Analysis 2.6).
-
Diarrhoea (grade 2+): Low‐certainty evidence suggests that IMRT may be associated with less diarrhoea (RR 0.38, 95% CI 0.22 to 0.68; participants = 72; studies = 1; Analysis 2.7).
-
Vomiting (grade 2+): Moderate‐certainty evidence suggests that there is probably little or no difference in the effect of IMRT and 3DCRT on vomiting (RR 0.60, 95% CI 0.29 to 1.24; participants = 112; studies = 2; I2 = 0%; Analysis 2.8)
-
Other review outcomes: There were no data for meta‐analysis on QoL or other review outcomes.
BT compared with EBRT
-
GI symptom scores: One high‐quality study (Nout 2009) reported findings on various bowel symptom domains at different time points. Substantial differences between BT and ERBT in favour of BT were found for 'limitation in daily activities due to bowel symptoms' (P < 0.001), faecal leakage (P < 0.001) and rectal blood loss (P = 0.04) at most time points up to five years post‐radiotherapy; however these data were difficult to use in review meta‐analysis due to the numerous time points and domains reported.
-
Acute GI toxicity (grade 2+): We did not pool these subgroup data due to statistical heterogeneity. Evidence on acute grade 2+ toxicity from one study conducted among men with prostate cancer is of a very low certainty, mainly due to sparse data. However, evidence from a study among women with endometrial cancer (Nout 2009), indicates that BT for the treatment of early‐stage endometrial cancer compared with EBRT reduces acute grade 2+ toxicity (RR 0.02, 95% CI 0.00 to 0.18; participants = 423; studies = 1; high‐certainty evidence; Analysis 3.1) .
-
Late GI toxicity (grade 2+): Low‐certainty evidence suggests that there may be little or no difference in effects of BT and EBRT on late toxicity grade 2+ (RR 0.16, 95% CI 0.02 to 1.33; participants = 423; studies = 1; Analysis 3.2).
-
Quality of life:Nout 2009 also reported data on QoL scores at various time points after radiotherapy to five years and found no clear difference in global health status between BT and EBRT groups at any time point; however, social functioning scores were significantly higher for the BT group (P = 0.005).
-
Other review outcomes: There were no data on other review outcomes.
Other aspects of radiotherapy delivery
This group of studies comprises 10 diverse interventions, mostly evaluated in single small RCTs (13 studies altogether). We summarise the findings of four studies in Table 2, and consider them to have very low‐certainty evidence in general. The following interventions had sufficient data on review outcomes and we used them in analyses:
Reduced radiation dose‐volume
Reduced radiation dose volume compared with standard radiation dose volume.
Three studies (Arafat 2016; Gupta 2009; Huddart 2013) contributed data to toxicity outcomes; most data were derived from two studies (Arafat 2016; Huddart 2013) conducted in people undergoing RT for bladder cancer.
-
Acute GI toxicity: Moderate‐certainty evidence suggests that there is probably little or no difference in acute GI toxicity grade 2+ with reduced radiation dose volume (RR 1.21, 95% CI 0.81 to 1.81; participants = 211; studies = 1; Analysis 4.1) and low‐certainty evidence suggests that there may be little or no difference in acute GI toxicity grade 1+ (RR 0.61, 95% CI 0.34 to 1.10; participants = 354; studies = 3; I2 = 87%; Analysis 4.2).
-
Late GI toxicity: Low‐certainty evidence suggests that there may be little or no difference in late GI toxicity grade 2+ at one year (RR 1.02, 95% CI 0.15 to 6.97; participants = 107; studies = 1; Analysis 4.3) and two years post‐radiotherapy (RR 0.38, 95% CI 0.04 to 3.48; participants = 79; studies = 1; Analysis 4.4), and little or no difference in late GI toxicity grade 1+ (RR 1.15, 95% CI 0.49 to 2.68; participants = 154; studies = 2; I2 = 0%; Analysis 4.5).
-
Other review outcomes: No evidence on QoL or other review outcomes was found.
Bladder‐filling protocols
One study (Mullaney 2014) involving 110 participants compared a 1080 ml bladder‐filling protocol with a 540 ml bladder‐filling protocol.
-
GI symptom scores: No evidence was found.
-
Acute GI toxicity: Low‐certainty evidence suggests that there may be little or no difference in a 1080 ml bladder‐filling protocol compared with a 540 ml protocol on acute grade 2+ GI toxicity (RR 2.22, 95% CI 0.62 to 7.93; participants = 110; studies = 1; Analysis 5.1) and acute grade 1+ GI toxicity (RR 1.10, 95% CI 0.87 to 1.40; participants = 110; studies = 1; Analysis 5.2).
-
Late GI toxicity: Low‐certainty evidence suggests that there may be little or no difference in a 1080 ml bladder‐filling protocol compared with a 540 ml protocol on late grade 2+ GI toxicity (RR 0.44, 95% CI 0.12 to 1.65; participants = 81; studies = 1; Analysis 5.3) and late grade 1+ GI toxicity (RR 0.83, 95% CI 0.51 to 1.37; participants = 81; studies = 1; Analysis 5.4).
-
Quality of life: We were unable to extract data from the report for this outcome. However the authors stated that "There were no statistically significant associations between bladder filling preparations...and median QoL scores."
-
Other review outcomes: There were no data on other review outcomes. This study also compared median comfort scores and reported "no statistically significant association" with the bladder‐filling preparations.
Evening radiotherapy
Evening RT compared with morning RT
Two studies (Shukla 2010) involving 294 participants contributed data.
-
GI symptom scores: No evidence was found.
-
Acute GI toxicity (grade 2+): GI toxicity was evaluated in terms of diarrhoea during RT. Low‐certainty evidence suggests that radiotherapy delivered in the evening may reduce acute GI toxicity (diarrhoea) grade 2+ during RT (RR 0.51, 95% CI 0.34 to 0.76; participants = 294; studies = 2; I2 = 0%; Analysis 6.1) and grade 1+ GI toxicity (RR 0.78, 95% CI 0.68 to 0.89; participants = 294; studies = 2; I2 = 0%; Analysis 6.2).
-
Diarrhoea: see evidence on acute GI toxicity.
-
Other GI symptoms: Evidence on vomiting is of a very low certainty (RR 0.43, 95% CI 0.09 to 2.18; participants = 229; studies = 1; Analysis 6.3).
-
Late GI toxicity: We found no evidence on late toxicity.
-
Other review outcomes: There were no data on QoL or other review outcomes.
Perineal hydrogel spacers
Hydrogel injection/spacer compared with no intervention
Two studies (Mariados 2015; Prada 2009) conducted in men undergoing RT for prostate cancer contributed data.
-
GI symptom scores: No evidence was found.
-
Acute GI toxicity: Low‐certainty evidence suggests that hydrogel spacers may make little or no difference to acute GI (rectal) toxicity grade 2+ (RR 0.51, 95% CI 0.08 to 3.38; participants = 289; studies = 2; Analysis 7.1) and acute grade 1+ GI toxicity (RR 0.85, 95% CI 0.55 to 1.30; participants = 220; studies = 1; Analysis 7.2).
-
Late GI toxicity: Low‐certainty evidence suggests that hydrogel spacers may make little or no difference to late GI (rectal) toxicity grade 2+ up to 15 months post‐RT (RR 0.16, 95% CI 0.01 to 3.96; participants = 220; studies = 1; Analysis 7.3) and at a median of three years (RR 0.07, 95% CI 0.00 to 1.34, participants = 140, studies = 1; Analysis 7.3). Evidence on late GI toxicity grade 1+ up to 15 months post‐RT (RR 0.29, 95% CI 0.07 to 1.19; participants = 220; studies = 1; Analysis 7.4) and at a median of three years (RR 0.24, 95% CI 0.05 to 1.29; participants = 140; studies = 1; Analysis 7.4) is also low certainty.
-
Other GI symptoms: Low‐certainty evidence suggests that perineal hydrogel (spacer) may make little or no difference to late rectal bleeding (grade 1+) (RR 0.25, 95% CI 0.03 to 1.84; participants = 289; studies = 2; I2 = 0%; Analysis 7.5). Evidence on acute rectal pain is of a very low certainty (RR 0.24, 95% CI 0.08 to 0.78; participants = 220; studies = 1; Analysis 7.6).
-
Quality of life: We found no (continuous) data that could be included in meta‐analysis. However, Prada 2009 included a bowel domain QoL question on rectal pain at six months and 12 months and reported 'statistically significant' reductions in favour of the hydrogel (P < 0.05). The other study (Mariados 2015) reported that fewer participants in the hydrogel group "reported declines in QoL relative to those of the control, with 11.6% and 21.4% of (hydrogel) and control patients, respectively, experiencing 10‐point declines at 15 months" post‐RT (P = 0.087). In the follow‐up report of this study, which involved 63% of the original participants, at three years men in the spacer group were less likely to have a detectable change (five‐point or 10‐point reduction) in bowel QoL score on the expanded prostate cancer index composite (EPIC) scale than controls (five‐point reduction: 41% versus 14%, P = 0.002; 10‐point reduction: 21% versus 5%, P = 0.02).
-
Other review outcomes: There were no data on other review outcomes. Late rectal urgency occurred in one participant in each arm of Mariados 2015, but these were classed as grade 1 events only.
Endorectal balloons (ERBs)
ERB compared with no intervention
Two studies (Botten 2015; Van Lin 2007) conducted among men undergoing RT for prostate cancer contributed data on toxicity outcomes.
-
GI symptom scores: No evidence was found.
-
Acute GI toxicity: Evidence on acute GI toxicity grade 2 + is of very low certainty (RR 1.00, 95% CI 0.41 to 2.42; participants = 48; studies = 1; Analysis 8.1). Low‐certainty evidence suggests that ERBs may make little or no difference to acute GI toxicity grade 1+ (RR 0.95, 95% CI 0.70 to 1.29; participants = 48; studies = 1; Analysis 8.2).
-
Late GI toxicity: Evidence on late GI toxicity grade 2 + is of very low certainty (RR 0.20, 95% CI 0.01 to 3.96; participants = 48; studies = 1; Analysis 8.3). Low‐certainty evidence suggests that ERBs may reduce late grade 1 + GI toxicity (RR 0.31, 95% CI 0.14 to 0.72; participants = 48; studies = 1; Analysis 8.4)
-
Diarrhoea: One study provided limited data on diarrhoea at one year post‐RT and the evidence is of a very low certainty (RR 0.71, 95% CI 0.37 to 1.35; participants = 43; studies = 1; Analysis 8.5).
-
Other GI symptoms: Evidence on acute rectal bleeding is of very low certainty (RR 5.00, 95% CI 0.25 to 98.96; participants = 48; studies = 1; Analysis 8.6). Low‐certainty evidence suggests that ERBs may reduce late rectal bleeding (RR 0.53, 95% CI 0.25 to 1.09; participants = 91; studies = 2; I2 = 0%).
-
Other review outcomes: There were no data on QoL or other review outcomes.
Pharmacological interventions
The different types of pharmacological agents are listed in alphabetical order:
Anti‐inflammatory agents
Aminosalicylates compared with placebo
-
Acute GI toxicity (grade 2+): We analysed this by subgroup only because of differences in subgroup effects of the different aminosalicylic acid formulations (Test for subgroup differences: Chi2 = 8.28, df = 1, P = 0.004, I2 = 88.2%; Analysis 9.1). The evidence suggests that:
-
Mesalazine probably increases acute grade 2+ GI toxicity during RT (RR 1.22, 95% CI 1.02 to 1.45; participants = 143; studies = 2; I2 = 15%; Analysis 9.1.1; moderate‐certainty evidence);
-
Sulfasalazine may reduce acute grade 2+ GI toxicity during RT (RR 0.29, 95% CI 0.11 to 0.75; participants = 182; studies = 2; I2 = 73%; Analysis 9.1.2; low‐certainty evidence).
-
-
It should also be noted that the mesalazine arm of a study from which data could not be extracted for this meta‐analysis (Sanguineti 2003) was discontinued early following an unplanned interim analysis that indicated drug‐related toxicity with rectally‐administered mesalazine in seven out of the eight participants recruited to this study arm.
-
Late GI toxicity (grade 2+): No data found/meta‐analysis performed.
-
Acute GI symptom scores: (diarrhoea only) were reported in one study of balsalazide versus placebo (Jahraus 2005) as having no statistically significant difference; however, these data lacked standard deviations and P values and could not be used in review analyses.
-
Diarrhoea (grade 2+): As with the acute GI toxicity data, we did not pool these subgroup data. Subgroup findings suggest that some aminosalicylates, namely mesalazine and olsalazine, probably increase diarrhoea during RT (moderate‐certainty evidence), whereas low‐certainty evidence suggests that sulfasaline may have little or no effect on diarrhoea during RT:
-
Mesalazine: RR 1.55, 95% CI 1.14 to 2.10; participants = 191; studies = 2; I2 = 0%; Analysis 9.3.1.
-
Osalazine: RR 1.70, 95% CI 1.00 to 2.87; participants = 58; studies = 1; Analysis 9.3.3. This study closed early due to increased diarrhoea grade 3/4 in the osalazine arm.
-
-
Sulfasalazine: RR 0.80, 95% CI 0.41 to 1.59; participants = 171; studies = 2; I2 = 69%; Analysis 9.3.2.
-
Other GI symptoms (grade 2+): Low‐certainty evidence suggests that aminosalicylates may have little or no effect on rectal bleeding during RT (RR 0.76, 95% CI 0.47 to 1.24; participants = 142; studies = 2; I2 = 0%; Analysis 9.5) or up to three months after RT (RR 0.80, 95% CI 0.49 to 1.32; participants = 84; studies = 1; Analysis 9.6); it may have little or no effect on abdominal pain/cramps during RT (RR 1.08, 95% CI 0.50 to 2.33; participants = 261; studies = 3; I2 = 54%; Analysis 9.7) or up to three months after RT (RR 0.16, 95% CI 0.01 to 3.04; participants = 54; studies = 1; Analysis 9.8); it may have little or no effect on tenesmus during RT (RR 2.10, 95% CI 0.73 to 6.03; participants = 142; studies = 2; I2 = 3%; Analysis 9.9) and up to three months after RT (RR 0.38, 95% CI 0.02 to 9.04; participants = 54; studies = 1; Analysis 9.10); and it may have little or no effect on vomiting grade 2+ during RT (Analysis 9.11; Test for subgroup differences: Chi2 = 3.05, df = 1, P = 0.08, I2 = 67.3%; we therefore did not pool subgroup data). One study (Miller 2016) also reported data on grade 1+ abdominal pain after RT, which was more frequent in the sulfasalazine arm (32% versus 17%), and participants apparently discontinued the study medication as a result.
-
Medication for symptom control: Moderate‐certainty evidence based on pooled mesalazine and sulfasalazine subgroup data suggests that aminosalicylates probably increase the use of medication for symptom control (antidiarrhoeals) (RR 1.91, 95% CI 1.26 to 2.90; participants = 156; studies = 2; I2 = 0%; Analysis 9.12).
-
Discontinuation of study medication: Moderate‐certainty evidence from Miller 2016 (sulfasalazine) suggests that aminosalicylates are probably more likely to be discontinued than placebo (RR 3.40, 95% CI 1.38 to 8.37; participants = 84; studies = 1; Analysis 9.13).
-
No data on other review outcomes, including participant satisfaction and QoL, were found in the included studies.
Ibuprofen compared with no intervention
A single small study (Stryker 1979) contributed data, and the evidence is very uncertain (see Table 2).
Corticosteroids compared with placebo
One study (Fuccio 2011) of a beclomethasone dipropionate enema involving 114 men undergoing RT for prostate cancer contributed data to this comparison. Also relevant to this comparison is Sanguineti 2003, comparing a hydrocortisone enema with a sucralfate enema (study authors considered the latter to be equivalent to placebo). Outcomes in Fuccio 2011 were assessed cumulatively for the 12‐month study duration. The effects of the rectally‐administered corticosteroid compared with placebo were as follows:
-
Acute GI toxicity (grade 2+): We used data from Sanguineti 2003 here, and downgraded them for indirectness. Low‐certainty evidence suggests that there may be little or no difference between corticosteroid enemas and placebo on acute GI toxicity grade 2+ (RR 0.85, 95% CI 0.62 to 1.15; participants = 126; studies = 1; Analysis 10.1).
-
Late GI toxicity (grade 2+): Low‐certainty evidence suggests that corticosteroids may make little or no difference to GI toxicity grade 2+ (RR 0.67, 95% CI 0.23 to 1.93; participants = 114; studies = 1; Analysis 10.2) or GI toxicity grade 1+ (RR 0.92, 95% CI 0.61 to 1.38; participants = 114; studies = 1; Analysis 10.3).
-
Late GI symptom scores: The study authors presented data for mean change in IBDQ scores at one year graphically, with better scores in the corticosteroid arm (P = 0.034); however, we could not extract these data for meta‐analysis.
-
Diarrhoea (grade 2+): Low‐certainty evidence suggests that corticosteroids may make little or no difference to grade 2+ diarrhoea up to 12 months (RR 1.07, 95% CI 0.28 to 4.08; participants = 114; studies = 1; Analysis 10.4)
-
Other GI symptoms: We acquired unpublished data from study authors for review purposes on rectal bleeding (RR 0.51, 95% CI 0.29 to 0.92; participants = 114; studies = 1; Analysis 10.5) and faecal urgency (any severity grade) (RR 0.91, 95% CI 0.44 to 1.85; participants = 114; studies = 1; Analysis 10.6), which suggests that rectally‐administered corticosteroids may reduce rectal bleeding in the 12 months after radiotherapy (low‐certainty evidence) but may have little or no effect on faecal urgency (low‐certainty evidence).
-
Other review outcomes: No data on QoL or other review outcomes were found in the included study.
Fuccio 2011 also evaluated rectosigmoidoscopy findings (see Potential biases in the review process section).
Superoxide dismutase (orgotein) compared with no intervention
Two studies evaluated this agent (Esco 2004; Menander‐Huber 1978); however, only Esco 2004, with design limitations, contributed data to GI toxicity review outcomes:
-
Acute GI toxicity (grade 2+): Low‐certainty evidence suggests that superoxide dismutase may reduce grade 2+ GI toxicity (RR 0.20, 95% CI 0.05 to 0.86; participants = 92; studies = 1; Analysis 11.1).
-
Late GI toxicity (grade 2+): The evidence on late effects at one year (RR 0.09, 95% CI 0.01 to 1.55; participants = 75; studies = 1; Analysis 11.2) and two years after radiotherapy (RR 0.06, 95% CI 0.00 to 1.11; participants = 68; studies = 1; Analysis 11.3) is very uncertain (i.e. very low‐certainty evidence).
-
Other review outcomes: There is a lack of data on other review outcomes, making the evidence on this anti‐inflammatory agent very uncertain overall.
Amifostine
Amifostine compared with no intervention
Five studies evaluated amifostine (Athanassiou 2003; Katsanos 2010; Koukourakis 2000; Kouloulias 2005; Kouvaris 2003); however all studies had design limitations.
-
GI symptom scores: No data for meta‐analysis.
-
Acute GI toxicity (grade 2+): This outcome was usually reported for the time point 'during RT'; however one study reported acute GI toxicity at 3 months' post‐RT. Low‐certainty evidence suggests that amifostine may reduce acute grade 2+ GI toxicity experienced during RT (RR 0.25, 95% CI 0.15 to 0.42; participants = 278; studies = 3; I2 = 0%; Analysis 12.1). Evidence on acute grade 2+ GI toxicity at 3 months is of a very low certainty (RR 0.12, 95% CI 0.01 to 2.12; participants = 44).
-
Late GI toxicity (grade 2+): Low‐certainty evidence suggests that amifostine may have little or no effect on late grade 2+ GI toxicity (RR 1.48, 95% CI 0.64 to 3.45; participants = 249; studies = 2; I2 = 0%; Analysis 12.4).
-
Diarrhoea (grade 2+): The evidence on diarrhoea is very uncertain (RR 0.25, 95% CI 0.06 to 0.98; participants = 36; studies = 1; Analysis 12.6).
-
Other GI symptoms: No evidence on other GI symptoms was found in the included studies.
-
Discontinuation of RT: The evidence on discontinuation of RT with amifostine is very uncertain (RR 0.43, 95% CI 0.04 to 4.69; participants = 205; studies = 1; Analysis 12.7).
-
Discontinuation of amifostine: This could not be meta‐analysed because the control group received no intervention and data on discontinuation were reported for the experimental arms only. However, one study (Athanassiou 2003) reported that 3 participants had moderate to severe complications related to amifostine: two had severe hypotension and one had an allergic reaction; two of these patients discontinued amifostine. In another study (Koukourakis 2000), 4 participants in the amifostine arm had amifostine treatment interrupted due either to allergic reactions or severe weakness. Kouvaris 2003 reported that one participant had amifostine treatment interrupted due to an allergic reaction; in this study, 2/18 participants receiving amifostine had moderate hypotension. Similarly, side effects were also reported in Katsanos 2010 (2 participants had injection site erythema and pruritis and 2 participants had nausea and/or vomiting), however, this did not appear to lead to amifostine interruption or discontinuation.
-
Other interventions for symptom control: One person in the amifostine arm of Athanassiou 2003 was reported to have had surgery for small bowel obstruction during the median follow up of 12 months.
-
Other review outcomes: No data on other review outcomes, including QoL, were found in the included studies. Evidence from one study on acute grade 2+ GI toxicity according to route of administration (rectal or subcutaneous) of amifostine is of a very low‐certainty (RR 0.32, 95% CI 0.01 to 7.55; participants = 53; Analysis 12.1).
Bile acid sequestrants
Bile acid sequestrants compared with placebo
Two small studies evaluated these agents (Chary 1984; Stryker 1983) and data were sparse. Most data are derived from Chary 1984, which compared cholestyramine with placebo. One outcome (medication for symptom control) includes data from Stryker 1983, which compared colestipol with no intervention:
-
GI symptom scores: Evidence on GI symptom (diarrhoea) scores is of very low‐certainty (MD 0.50, 95% CI ‐0.00 to 1.00; participants = 33; studies = 1; Analysis 13.1). These diarrhoea scores were based on an unvalidated investigator‐designed scale.
-
Acute GI toxicity (grade 2+): Low‐certainty evidence suggests that bile acid sequestrants (cholestyramine) may increase grade 2+ GI toxicity (RR 4.24, 95% CI 1.07 to 16.70; participants = 33; studies = 1; Analysis 13.2).
-
Late GI toxicity (grade 2+): No data for meta‐analysis were found.
-
Diarrhoea (grade 2+): Evidence on effect of bile acid sequestrants on diarrhoea is of very low‐certainty (RR 2.82, 95% CI 0.66 to 12.01; participants = 33; studies = 1; Analysis 13.3)
-
Medication for symptom control: The evidence on the effect of bile acid sequestrants on use of medication for symptom control is of a very low certainty (RR 2.49, 95% CI 0.29 to 21.34; participants = 64; studies = 2; I2 = 77%; Analysis 13.4)
-
Discontinuation of study medication: Meta‐analysis was not possible for this outcome. However, Stryker 1983 reports that "Seven of the patients [in the intervention arm] ingested less than 70% of the prescribed dose and eight discontinued the drug. The most common reason given for discontinuing the drug was that it caused intestinal cramps."
-
Other review outcomes: No evidence on QoL and other review outcomes was found.
The evidence on bile acid sequestrants is very uncertain overall.
Famotidine
We summarise findings from a small pilot study of famotidine compared with placebo (Razzaghdoust 2014) in Table 2.
Magnesium oxide
Magnesium oxide compared with placebo
One study (Lips 2011) contributed data on acute effects (during RT) of oral magnesium oxide compared with placebo.
-
GI symptom scores: No data for meta‐analysis were found.
-
Acute GI toxicity (grade 2+): Moderate‐certainty evidence suggests that magnesium oxide probably does not reduce acute GI toxicity grade 2+ and may increase it (RR 1.70, 95% CI 0.87 to 3.31; participants = 92; studies = 1; Analysis 14.1).
-
Late GI toxicity (grade 2+): No data for meta‐analysis were found.
-
Diarrhoea (grade 2+): No data for meta‐analysis were found.
-
Medication for symptom control: Low‐certainty evidence suggests that magnesium oxide may make little or no difference to use of medication for symptom control (RR 1.75, 95% CI 0.55 to 5.57; participants = 92; studies = 1; Analysis 14.2).
-
Discontinuation of study medication: Low‐certainty evidence suggests that magnesium oxide may make little or no difference to discontinuation of study medication (RR 4.00, 95% CI 0.46 to 34.44; participants = 92; studies = 1; Analysis 14.3).
-
Quality of life: This was presented graphically in the Lips 2011 report and findings were interpreted by the authors as "a trend towards worsened QoL" in the magnesium oxide arm.
-
Other review outcomes: No data for meta‐analysis were found.
The limited evidence above suggests the potential for harm with oral magnesium oxide administered prophylactically during RT in men with prostate cancer.
Misoprostol
Misoprostol suppository compared with placebo
One study (Hille 2005) comparing a misoprostol rectal suppository (400 μg) with placebo contributed acute‐phase data to this comparison. A follow‐up study in 2009 reported late effects at a median follow‐up of 50 months (9 to 59 months).
-
GI symptom scores: No data for meta‐analysis were found.
-
Acute GI toxicity (grade 2+): Low‐certainty evidence suggests that misoprostol may make little or no difference to acute GI toxicity grade 2+ during RT (RR 1.38, 95% CI 0.76 to 2.51; participants = 100; studies = 1; Analysis 15.1).
-
Late GI toxicity (grade 2+): No data for meta‐analysis were found.
-
Diarrhoea (grade 2+): Evidence on acute (RR 1.00, 95% CI 0.46 to 2.19; participants = 100; studies = 1; Analysis 15.2) and late diarrhoea (RR 2.00, 95% CI 0.19 to 21.36; participants = 100; studies = 1; Analysis 15.3) is of a very low certainty.
-
Other GI symptoms: Moderate‐certainty evidence suggests that misoprostol probably increases acute rectal bleeding (RR 2.29, 95% CI 1.03 to 5.07; participants = 100; studies = 1; Analysis 15.4), but the evidence on late rectal bleeding is very uncertain (RR 4.00, 95% CI 0.46 to 34.54; participants = 100; studies = 1; low‐certainty evidence; Analysis 15.5). Evidence on other GI symptoms is very uncertain, mainly due to sparse data, including acute tenesmus (RR 1.60, 95% CI 0.56 to 4.56; participants = 100; studies = 1; Analysis 15.6), late tenesmus (RR 2.00, 95% CI 0.19 to 21.36; participants = 100; studies = 1; Analysis 15.7), acute faecal urgency (RR 1.50, 95% CI 0.67 to 3.35; participants = 100; studies = 1; Analysis 15.8), late faecal incontinence (RR 1.00, 95% CI 0.06 to 15.55; participants = 100; studies = 1; Analysis 15.9), and acute abdominal pain or cramps (RR 1.60, 95% CI 0.56 to 4.56; participants = 100; studies = 1; Analysis 15.10).
-
Other review outcomes: No evidence on QoL or other review outcomes was found.
The limited evidence above suggests the potential for harm with misoprostol suppositories administered prophylactically during RT in men with prostate cancer.
Octreotide
Octreotide acetate injection compared with placebo
Two studies contributed data (Martenson 2008; Zachariah 2010).
-
GI symptom scores: No data for meta‐analysis were found. Also see QoL outcome below.
-
Acute GI toxicity (grade 2+): No data for meta‐analysis were found.
-
Late GI toxicity (grade 2+): No data for meta‐analysis were found.
-
Acute diarrhoea (grade 2+): Moderate‐certainty evidence suggests that there may be little or no difference in acute diarrhoea grade 2+ with octreotide (RR 1.01, 95% CI 0.76 to 1.35; participants = 340; studies = 2; I2 = 33%; Analysis 16.1).
-
Other GI symptoms: Moderate‐certainty evidence suggests that octreotide probably increases acute rectal bleeding (RR 1.65, 95% CI 1.21 to 2.24; participants = 340; studies = 2; I2 = 0%; Analysis 16.2). Low‐certainty evidence on other GI symptoms suggests that there may be little or no difference between octreotide and placebo on acute tenesmus (RR 2.29, 95% CI 0.74 to 7.04; participants = 125; studies = 1; Analysis 16.3), vomiting (RR 0.89, 95% CI 0.48 to 1.66; participants = 125; studies = 1;Analysis 16.4), abdominal pain/cramps (RR 2.29, 95% CI 0.74 to 7.04; participants = 125; studies = 1; Analysis 16.5), and faecal incontinence (RR 1.34, 95% CI 0.87 to 2.06; participants = 125; studies = 1; Analysis 16.6).
-
Medication for symptom control: Moderate‐certainty evidence suggests that there may be little or no difference in this outcome (RR 1.03, 95% CI 0.83 to 1.28; participants = 219; studies = 1; Analysis 16.7).
-
Discontinuation of study medication: This evidence is of a very low certainty (RR 1.30, 95% CI 0.30 to 5.66; participants = 219; studies = 1; Analysis 16.8).
-
Quality of life: We could not extract these data from the reports. However, one study (Zachariah 2010) stated that "We did not observe a statistically significant difference between treatment groups in the proportion of patients who reported improved QoL or bowel function at 3 months (among evaluable patients) in any of the four assessments". The other study (Martenson 2008) reported that median QoL scores were similar, as measured on a scale of 0 to 10 (7.8 versus 7.7 for octreotide and placebo groups, respectively) (P = 0.29).
The limited evidence above suggests the potential for harm with octreotide administered prophylactically to people undergoing RT for pelvic cancer.
Selenium
Oral selenium compared with no intervention
Only one study contributed data to this comparison (Muecke 2010).
-
Acute diarrhoea (grade 2+) during RT: Low‐certainty evidence suggests that oral selenium may have little or no effect on this outcome (RR 0.40, 95% CI 0.12 to 1.41; participants = 81; studies = 1; Analysis 17.1).
-
Other review outcomes: No evidence on other review outcomes was found.
Smectite
Smectite compared with placebo
One study (Hombrink 2000) involving 176 people with various pelvic cancers evaluated this comparison; however, we could extract no usable data for meta‐analysis. Details and findings of this study are described in Table 2.
Sodium butyrate
Sodium butyrate enemas compared with placebo
One study (Maggio 2014) evaluated three different doses of sodium butyrate enemas versus placebo in men with prostate cancer. We combined the data for the different doses and compared them with placebo, as tests for subgroup differences indicated that there was no difference between these subgroup findings.
-
Acute GI toxicity: Moderate‐certainty evidence suggests that sodium butyrate enemas probably make little or no difference to grade 2+ acute GI toxicity (RR 0.91, 95% CI 0.41 to 1.98; participants = 162; studies = 1; Analysis 18.1) and grade 1+ acute GI toxicity (RR 1.08, 95% CI 0.61 to 1.91; participants = 157; studies = 1; Analysis 18.2).
-
Other review outcomes: No evidence on other review outcomes was found.
This study also evaluated rectosigmoidoscopy findings (see Potential biases in the review process section of the Discussion).
Simethicone
A single small study (McGuffin 2016) was reported as a conference abstract and the evidence is very uncertain (see Table 2).
Sucralfate
Oral sucralfate compared with placebo
-
GI symptom scores: No data for meta‐analysis.
-
Acute GI toxicity (grade 2+): Moderate‐certainty evidence suggests that oral sucralfate probably has little or no effect on acute GI toxicity grade 2+ (RR 1.07, 95% CI 0.83 to 1.39; participants = 335; studies = 1; Analysis 19.1) or on acute grade 1+ toxicity (RR 1.04, 95% CI 0.95 to 1.13; participants = 335; studies = 1; Analysis 19.2).
-
Late GI toxicity (grade 2+): Moderate‐certainty evidence suggests that sucralfate probably has little or no effect on late GI toxicity grade 2+ (RR 0.76, 95% CI 0.51 to 1.14; participants = 298; studies = 1; Analysis 19.3).
-
Diarrhoea (grade 2+): Low‐certainty evidence suggests that sucralfate may have little or no effect on acute diarrhoea grade 2+ (RR 0.81, 95% CI 0.41 to 1.62; participants = 284; studies = 4; I2 = 82%; Analysis 19.4).
-
Other GI symptoms (grade 2+): Oral sucralfate may increase acute rectal bleeding (RR 1.32, 95% CI 1.10 to 1.60; participants = 604; studies = 4; I2 = 0%; Analysis 19.5; low‐certainty evidence), but probably has little or no effect on abdominal pain/cramps (RR 0.97, 95% CI 0.58 to 1.60; participants = 269; studies = 3; I2 = 0%; Analysis 19.6moderate‐certainty evidence) and may have little or no effect on faecal urgency (RR 1.14, 95% CI 0.93 to 1.40; participants = 123; studies = 1; Analysis 19.7; low‐certainty evidence) or tenesmus (RR 3.44, 95% CI 0.74 to 15.92; participants = 123; studies = 1; Analysis 19.9; low‐certainty evidence). Low‐certainty evidence suggests that faecal incontinence may be increased with oral sucralfate (RR 2.07, 95% CI 1.06 to 4.02; participants = 123; studies = 1; I2 = 0%; Analysis 19.8).
-
Medication for symptom control: Low‐certainty evidence suggests that oral sucralfate may make little or no difference to use of medication for symptom control (RR 0.84, 95% CI 0.49 to 1.42; participants = 313; studies = 4; I2 = 58%; Analysis 19.10).
-
Discontinuation of study medication: Moderate‐certainty evidence suggests that there is probably little or no difference between oral sucralfate and placebo in discontinuation rates (RR 1.02, 95% CI 0.48 to 2.18; participants = 348; studies = 4; I2 = 17%; Analysis 19.11).
-
Quality of life: no evidence found.
Rectal sucralfate (enema) compared with placebo
-
GI symptom scores: No data for meta‐analysis.
-
Acute GI toxicity (grade 2+): Low‐certainty evidence suggests that rectal sucralfate may have little or no effect on acute GI toxicity grade 2+ (RR 1.18, 95% CI 0.87 to 1.60; participants = 126; studies = 1; Analysis 19.1).
-
Late GI toxicity (grade 2+): No data for meta‐analysis.
-
Diarrhoea (grade 2+): Low‐certainty evidence suggests that rectal sucralfate may have little or no effect on acute diarrhoea grade 2+ (RR 0.82, 95% CI 0.44 to 1.53; participants = 83; studies = 1; Analysis 19.4).
-
Other GI symptoms (grade 2+): Evidence on acute rectal bleeding (RR 0.87, 95% CI 0.61 to 1.24; participants = 83; studies = 1; Analysis 19.5); pain/cramps (RR 1.02, 95% CI 0.15 to 6.93; participants = 83; studies = 1; Analysis 19.6); faecal urgency (RR 1.02, 95% CI 0.52 to 2.01; participants = 83; studies = 1; Analysis 19.7); faecal incontinence (RR 0.68, 95% CI 0.12 to 3.88; participants = 83; studies = 1; Analysis 19.8); and tenesmus (RR 0.98, 95% CI 0.69 to 1.41; participants = 83; studies = 1; Analysis 19.9) is of a very low‐certainty.
-
Other review outcomes: No evidence is available on QoL or other review outcomes.
Tropisetron
Findings from this single small study (Kardamakis 1995) are summarised in Table 2.
Non‐pharmacological interventions
Diet
Elemental diet compared with usual diet
Data on review outcomes were sparse for this dietary intervention (we could only extract data on GI symptom scores and QoL) and were derived from one small study (McGough 2008; 50 participants). This evidence is based on unpublished findings from week three of RT.
-
GI symptom score (IBDQ‐B): Low‐certainty evidence suggests that IBDQ‐B scores with an elemental diet (during RT)) may be worse than with usual diet (MD ‐5.80, 95% CI ‐11.32 to ‐0.28; Analysis 20.6.2) (high scores are better, with a maximum of 70 and minimum of 10).
-
Diarrhoea during RT: Low‐certainty evidence suggests that an elemental diet may make little or no difference to diarrhoea grade 2+ (RR 0.79, 95% CI 0.45 to 1.38; participants = 50; studies = 1; Analysis 20.5).
-
Quality of life (IBDQ): Low‐certainty evidence suggests that there may be little or no difference in QoL scores during RT with an elemental diet (MD 4.60, 95% CI ‐12.40 to 21.60; participants = 50; studies = 1; Analysis 20.11) (high scores are better, with a maximum of 224 and minimum of 32).
-
Other review outcomes: No evidence on other review outcomes was found.
Lactose‐restricted diet compared with usual diet
Two studies evaluated a lactose‐restricted diet (Stryker 1986; Pettersson 2012) but only the latter contributed data to meta‐analysis. This study evaluated a lactose‐restricted plus low insoluble fibre diet.
-
Acute GI toxicity: Low‐certainty evidence suggests that a lactose‐restricted diet may make little or no difference to acute GI toxicity grade 1+ (RR 0.89, 95% CI 0.62 to 1.27; participants = 119; studies = 1; Analysis 20.2.1). There were no reported instances of grade 2+ acute GI toxicity.
-
Late GI toxicity: Low‐certainty evidence suggests that a lactose‐restricted diet may make little or no difference to late GI toxicity grade 1+ (RR 0.99, 95% CI 0.64 to 1.53; participants = 106; studies = 1; Analysis 20.3.1). There were no reported instances of grade 2+ late GI toxicity.
-
Diarrhoea during RT: Low‐certainty evidence suggests that a lactose‐restricted diet may make little or no difference to diarrhoea grade 1+ (RR 0.74, 95% CI 0.45 to 1.23; participants = 119; studies = 1; Analysis 20.4.1).
-
Quality of life: QoL was reported using QLQ‐PR25 for many time points and domains up to 24 months post‐RT, with study authors finding little difference between study arms at any time point; however we could not extract these data in a usable way.
-
Other review outcomes: No evidence on other review outcomes was found.
Stryker 1986 reported weekly stool frequency (instead of diarrhoea) and found no difference between a lactose‐restricted diet and a usual diet for this outcome, or in the number of anti‐diarrhoeal tablets taken by participants in each group each week. This study contributed no usable data to review outcomes.
High‐fibre diet compared with usual diet
Three studies of different high‐fibre interventions contributed data (Itoh 2015 ‐ hydrolysed rice bran; Murphy 2000 ‐ psyllium husk; Wedlake 2017 ‐ fibre > 18 g/day). The resulting evidence is mainly of a low to very low certainty.
-
GI symptom scores: Low‐certainty evidence from one study suggests that a high‐fibre diet may make little difference to GI symptom scores (IBDQ‐B) at the end of RT (MD 2.80, 95% CI ‐1.81 to 7.41; participants = 108; studies = 1; Analysis 20.6.3), but may improve GI symptom scores at one year post‐RT (MD 6.10, 95% CI 1.71 to 10.49; participants = 108; studies = 1; Analysis 20.7.2). In addition, low‐certainty findings suggest that a high‐fibre diet may be associated with less of a change in IBDQ‐B symptom scores from baseline at the end of RT (MD 7.10, 95% CI 2.14 to 12.06; participants = 108; studies = 1; Analysis 20.8) and at one year post‐RT (MD 8.50, 95% CI 3.25 to 13.75; participants = 108; studies = 1; Analysis 20.9.1) compared with usual diet.
-
Diarrhoea during RT: Low‐certainty evidence suggests that high fibre may make little or no difference to diarrhoea grade 2+ (RR 0.65, 95% CI 0.38 to 1.10; participants = 74; studies = 2; I2 = 0%; Analysis 20.5.3) or grade 1+ (RR 1.00, 95% CI 0.94 to 1.07; participants = 74; studies = 2; Analysis 20.4.2).
-
Quality of life (IBDQ): Low‐certainty evidence suggests that there may be little or no difference in QoL scores during RT with a high‐fibre diet (MD 6.50, 95% CI ‐5.88 to 18.88; participants = 108; studies = 1; Analysis 20.11.1); however, it may improve QoL scores at one year after RT (MD 20.50, 95% CI 9.97 to 31.03; participants = 108; studies = 1; Analysis 20.12.1; low‐certainty evidence).
-
Medication for symptom control: Meta‐analysis was not possible for this outcome. Wedlake 2017 reported the number of days upon which medication was used (according to self‐reported participant diaries): use of median scores masks differences in individuals' usage; median scores in both groups were 0 (with ranges 0 ‐ 7 in both groups). The small study on hydrolysed rice bran (Itoh 2015) also reported an 'anti‐diarrhoeal agent score' based on administration of probiotics and antidiarrhoeal agents; however, these results are difficult to interpret.
-
Other review outcomes: No evidence on other review outcomes was found.
Low‐fibre diet compared with usual diet
One study contributed data (Wedlake 2017).
-
GI symptom scores: Low‐certainty findings suggest that a low‐fibre diet may make little or no difference to GI symptom scores at the end of RT (MD 3.50, 95% CI ‐0.93 to 7.93; participants = 107; studies = 1; Analysis 20.6.4) or at one year after RT (MD 3.30, 95% CI ‐0.94 to 7.54; participants = 107; studies = 1; Analysis 20.7.2). Low‐certainty evidence on the change in IBDQ‐B symptom scores from baseline at the end of RT and at one year also suggests little or no difference with low fibre compared with usual diet (Analysis 20.8 and Analysis 20.9).
-
Acute GI toxicity: Low‐certainty evidence suggests that there may be little or no difference in acute GI toxicity grade 1+ with a low‐fibre diet (RR 0.89, 95% CI 0.62 to 1.27; participants = 119; studies = 1; Analysis 20.2.2). There were no reported instances of grade 2+ acute GI toxicity.
-
Late GI toxicity: Low‐certainty evidence suggests that a low‐fibre diet may make little or no difference to late GI toxicity grade 1+ (RR 0.99, 95% CI 0.64 to 1.53; participants = 106; studies = 1; Analysis 20.3). There were no reported instances of grade 2+ acute GI toxicity.
-
Diarrhoea during RT: Low‐certainty evidence suggests that a low‐fibre diet may make little or no difference to diarrhoea grade 1+ during RT (RR 0.74, 95% CI 0.45 to 1.23; participants = 119; studies = 1; Analysis 20.4.3).
-
Quality of life (IBDQ): Low‐certainty evidence suggests that a low‐fibre diet may make little or no difference to QoL scores during RT (MD 9.80, 95% CI ‐1.91 to 21.51; participants = 107; studies = 1; Analysis 20.11.2) or at one year after RT (MD 9.40, 95% CI ‐1.78 to 20.58; participants = 107; studies = 1; Analysis 20.12).
-
Other review outcomes: No evidence on other review outcomes was found.
Low‐fat diet compared with usual diet
One study contributed data to this comparison (Wedlake 2012).
-
Acute GI toxicity grade 2+: Low‐certainty evidence suggests that a low‐fat diet may make little or no difference to acute GI toxicity grade 2+ (RR 1.15, 95% CI 0.71 to 1.84; participants = 79; studies = 1; Analysis 20.1).
-
GI symptom scores (Vaizey scale): Low‐certainty evidence suggests that a low‐fat diet may make little or no difference to GI symptom scores (MD ‐0.20, 95% CI ‐2.29 to 1.89; participants = 70; studies = 1; Analysis 20.6.1).
-
Diarrhoea during RT: Low‐certainty evidence suggests that a low‐fat diet may make little or no difference to diarrhoea grade 2+ during RT (RR 0.61, 95% CI 0.33 to 1.13; participants = 76; studies = 1; Analysis 20.5.2).
-
Quality of life (IBDQ): Low‐certainty evidence suggests that a low‐fat diet may make little or no difference to QoL scores (MD 2.40, 95% CI ‐9.52 to 14.32; participants = 76; studies = 1; Analysis 20.11.3).
-
Other review outcomes: No evidence on other review outcomes was found.
Prebiotic diet compared with usual diet
One study (Garcia‐Peris 2016) evaluated prebiotics in addition to the usual on‐treatment diet (low‐fibre, lactose‐restricted), compared with the usual on‐treatment diet; however, data were not in a usable form for review meta‐analyses. The prebiotic group experienced a decrease in the number of days with watery stools compared with the control group (P = 0.08). The study also reported "no significant difference" in global health scores and symptom scores, including diarrhoea, nausea/vomiting and pain, and antidiarrhoeal use (loperimide).
Counselling
Counselling (dietary or other) compared with no intervention
Two studies (Kim 2002; Ravasco 2005) contributed data on counselling interventions.
-
GI symptom scores: Low‐certainty evidence from one study (Kim 2002) suggests that counselling may have little or no effect on GI symptom scores (MD 0.08, 95% CI ‐0.38 to 0.54; participants = 152; Analysis 21.1). However, Ravasco 2005 reported that diarrhoea scores significantly deteriorated from baseline to end of RT in the control group but did not do so in the counselling group. With insufficient data, it was not possible to perform meta‐analysis.
-
Acute GI toxicity grade 2+: No evidence was found (see diarrhoea grade 2+ below).
-
Late GI toxicity (grade 2+): No evidence was found (see diarrhoea grade 2+ below).
-
Diarrhoea (grade 2+): Low‐certainty evidence suggests that counselling may have reduce diarrhoea grade 2 + during RT (RR 0.12, 95% CI 0.03 to 0.47; participants = 74; studies = 1; Analysis 21.2), at three months post‐RT (RR 0.04, 95% CI 0.00 to 0.60; participants = 74; studies = 1; Analysis 21.3) and at five year post‐RT (RR 0.05, 95% CI 0.00 to 0.78; participants = 61; studies = 1; Analysis 21.4).
-
Other GI symptoms: Evidence on the effect of counselling on weight loss at the end of RT is of a very low certainty (RR 0.76, 95% CI 0.44 to 1.34; participants = 74; studies = 1; Analysis 21.5); however, counselling may reduce nausea and vomiting at the end of RT (RR 0.44, 95% CI 0.20 to 0.94; participants = 74; studies = 1; Analysis 21.7). Counselling may reduce weight loss at three months post‐RT (RR 0.10, 95% CI 0.01 to 0.74; participants = 74; studies = 1; Analysis 21.8; low‐certainty evidence). Evidence on nausea and vomiting at three months after RT is of a very low certainty (RR 0.08, 95% CI 0.00 to 1.32; participants = 74; studies = 1; Analysis 21.8).
-
Medication for symptom control: Counselling may reduce the use of medication (anti‐diarrhoeals) for symptom control at the end of RT (RR 0.10, 95% CI 0.03 to 0.31; participants = 74; studies = 1; Analysis 21.9; low‐certainty evidence) and at three months post‐RT (RR 0.02, 95% CI 0.00 to 0.39; participants = 74; studies = 1; Analysis 21.10).
-
Quality of life: Evidence on QoL, derived from one study (Kim 2002), is of a low certainty. This study evaluated QoL according to a five‐point visual analogue scales for single items, the findings of which suggest that counselling may reduce fatigue (MD ‐0.41, 95% CI ‐0.83 to 0.01; participants = 152; studies = 1; Analysis 21.11.1) and sleeping problems (MD ‐0.46, 95% CI ‐0.89 to ‐0.03; participants = 152; studies = 1; Analysis 21.11.2) (lower scores mean better). Similarly, Ravasco 2005 reported that "at 3 months, Group I [counselling group] patients maintained/improved function, symptoms and single‐item scores (P<0.02)" compared with baseline scores, whereas in the control group "QoL remained as poor as after radiotherapy".
Protein supplement compared with no intervention
One study contributed data (Ravasco 2005).
-
GI symptom scores: There were insufficient data to analyse (mean scores were reported without standard deviations or P values). However, diarrhoea scores significantly deteriorated from baseline to end of RT in both the protein supplement and the control groups, and mean diarrhoea scores were similar at three‐month follow‐up (72 and 78 for supplement and control, respectively).
-
Acute GI toxicity grade 2+: No evidence was found (see diarrhoea grade 2+ below).
-
Late GI toxicity (grade 2+): No evidence was found (see diarrhoea grade 2+ below).
-
Diarrhoea (grade 2+): Protein supplements may reduce diarrhoea at three months post‐RT (RR 0.23, 95% CI 0.07 to 0.74; participants = 74; studies = 1; low‐certainty evidence;Analysis 22.2). Evidence on diarrhoea at other time points is very uncertain: end of RT (RR 0.53, 95% CI 0.27 to 1.03; participants = 74; studies = 1; Analysis 22.1; very low‐certainty evidence); five years post‐RT (RR 0.60, 95% CI 0.23 to 1.51; participants = 61; studies = 1; Analysis 22.3; very low‐certainty evidence).
-
Other GI symptoms: Evidence is of a very low certainty for effects on vomiting at the end of RT (RR 0.63, 95% CI 0.33 to 1.19; participants = 74; studies = 1; Analysis 22.4) and at three months post‐RT (RR 0.50, 95% CI 0.14 to 1.85; participants = 74; studies = 1; Analysis 22.5). Similarly, evidence on weight loss at the end of RT is of a very low certainty (RR 0.82, 95% CI 0.48 to 1.41; participants = 74; studies = 1). However, at three months weight loss may be reduced with protein supplements (RR 0.30, 95% CI 0.09 to 1.00; participants = 74; studies = 1; Analysis 22.7; low‐certainty evidence).
-
Medication for symptom control: Protein supplements may reduce use of medication for symptom control at the end of RT (RR 0.69, 95% CI 0.49 to 0.97; participants = 74; studies = 1;Analysis 22.8; low‐certainty evidence) and at three months post‐RT (RR 0.30, 95% CI 0.14 to 0.66; participants = 74; studies = 1; Analysis 22.9; low‐certainty evidence).
-
Quality of life: There were insufficient data to analyse. Mean global QoL scores (without standard deviations) were reported to be significantly different (better) compared with baseline scores in the protein supplement group at the end or RT and at three months post‐RT, but were significantly worse than baseline scores at these time points in the control group. In addition, a few function and single‐item symptom scores (measured on five‐point visual analogue scales) improved at the end of three months in the protein supplement group, whereas in the control group all QoL domains remained as poor at the three‐month follow‐up as at the end of RT.
Glutamine
Glutamine compared with placebo
Five studies contributed data (De Maria 1992; Kozelsky 2003; Manir 2014; Rotovnik Kozjek 2011; Vidal‐Casariego 2014).
-
GI symptom scores: no evidence was found for this outcome.
-
Acute GI toxicity (grade 2+): Low‐certainty evidence suggests that glutamine may have little or no effect on acute GI toxicity grade 2+ (RR 2.40, 95% CI 0.68 to 8.53; participants = 69; studies = 1; Analysis 23.1) or grade 1+ (RR 1.72, 95% CI 0.70 to 4.20; participants = 69; studies = 1; Analysis 23.2) during RT.
-
Late GI toxicity (grade 2+): Low‐certainty evidence suggests that glutamine may have little or no effect on late GI toxicity grade 2+ (RR 4.52, 95% CI 0.23 to 90.80; participants = 57; studies = 1; Analysis 23.3) or grade 1+ (RR 1.50, 95% CI 0.40 to 5.69; participants = 57; studies = 1; Analysis 23.4) at one year post‐RT.
-
Diarrhoea (grade 2+): High‐certainty evidence indicates that glutamine has little or no effect on diarrhoea grade 2+ during RT (RR 0.98, 95% CI 0.78 to 1.24; participants = 287; studies = 4; I2 = 0%; Analysis 23.5).
-
Other GI symptoms (grade 2+): Low‐certainty evidence suggests that glutamine may have little or no effect on tenesmus (RR 2.23, 95% CI 0.82 to 6.07; participants = 129; studies = 1; Analysis 23.6); abdominal pain/cramps (RR 0.97, 95% CI 0.58 to 1.60; Analysis 23.7); rectal bleeding (RR 1.02, 95% CI 0.51 to 2.02; participants = 129; studies = 1; Analysis 23.8), vomiting (RR 1.02, 95% CI 0.32 to 3.28; participants = 85; studies = 1; Analysis 23.9) or nausea (RR 1.37, 95% CI 0.32 to 5.73; participants = 85; studies = 1; Analysis 23.10) during RT or faecal incontinence (Analysis 23.12) during RT. Similarly findings from a single study with follow up at one and two years post RT suggests that glutamine may make little or no difference to faecal incontinence (Analysis 23.13, Analysis 23.14), to abdominal pain or cramps (Analysis 23.16; Analysis 23.17), or to rectal bleeding (Analysis 23.18; Analysis 23.19), at one and two years post RT, respectively.
-
Medication for symptom control: Low‐certainty evidence suggests that glutamine may increase the use of medication for symptom control (RR 2.82, 95% CI 1.05 to 7.58; participants = 198; studies = 2; I2 = 0%; Analysis 23.11).
-
Discontinuation of study medication: no evidence was found.
-
Quality of life: One study (Kozelsky 2003) reported similar median QoL scores in the glutamine and placebo arms at 12 months (P = 0.94) and 24 months (P = 0.13), respectively; however, these data were not in a usable form for our meta‐analysis. Study authors concluded that "Quality‐of‐life scores and the mean number of problems reported on the bowel function questionnaire were virtually identical for both treatment groups."
Probiotics
Probiotics compared with control (placebo or no intervention)
Most studies compared probiotics with placebo (Chitapanarux 2010; Delia 2007; Demers 2014; Giralt 2008; Nascimento 2014), but two studies compared probiotics with no probiotics (Salminen 1988; Timko 2013), and one three‐arm study compared probiotics with probiotics plus honey or placebo (Mansouri‐Tehrani 2016). For the latter study, we combined data for the two probiotic arms. Doses (colony‐forming units) and strains of probiotic preparations varied across studies, and usable data were generally sparse, such that subgrouping according to these variables was not possible.
-
GI symptom scores: No evidence for meta‐analysis was found. One small pilot study (Nascimento 2014; 20 participants) of synbiotics (probiotics plus prebiotics) reported GI symptom scores (using EORTC QLQ PR23) as medians (IQR); median scores were lower with probiotics during the second week of treatment (16.5, IQR 15 ‐ 23) than with placebo (19.5, IQR 15 ‐ 26) (P < 0.05) and in the third week of treatment (P < 0.01).
-
Acute GI toxicity (grade 2+): No evidence was found on acute GI toxicity grade 2+, but most studies reported acute diarrhoea grade 2+ (see below).
-
Late GI toxicity (grade 2+): No evidence was found.
-
Diarrhoea (grade 2+): Low‐certainty evidence suggests that probiotics may reduce acute diarrhoea grade 2+ during or at the end of RT (RR 0.43, 95% CI 0.22 to 0.82; participants = 923; studies = 5; I2 = 91%; Analysis 24.1).
-
Other GI symptoms (grade 2+): The evidence on weight loss is of a very low certainty (RR 0.91, 95% CI 0.37 to 2.23; participants = 21; studies = 1; Analysis 24.2); no evidence on other symptoms was found.
-
Medication for symptom control: Low‐certainty evidence suggests that probiotics may reduce the use of medication for symptom control (RR 0.53, 95% CI 0.32 to 0.88; participants = 507; studies = 6; I2 = 57%; Analysis 24.3).
-
Discontinuation of study medication: no evidence was found.
-
Quality of life: No evidence was found for meta‐analysis. One small pilot study (Nascimento 2014; 20 participants) of synbiotics (probiotics plus prebiotics) reported better (lower) median QoL scores for proctitis (using EORTC QLQ PR23) with probiotics during the second week of treatment (23, IQR 21 ‐ 30) than with placebo (26.5, IQR 22 ‐ 34) (P < 0.05) and in the third week of treatment (P < 0.01).
Proteolytic enzymes
Two studies contributed data (Dale 2001; Martin 2002); Martin 2002 compared oral proteolytic enzymes with placebo and Dale 2001 compared the enzymes with no intervention.
-
GI symptom scores:Dale 2001 evaluated mean RTOG scores, which could not be used in a meaningful way in this review.
-
Acute GI toxicity: Low‐certainty evidence suggests that proteolytic enzymes may reduce acute GI toxicity grade 2+ (RR 0.45, 95% CI 0.24 to 0.88; participants = 120; studies = 1; Analysis 25.1); but not grade 1 toxicity (acute GI toxicity grade 1+: RR 1.04, 95% CI 0.91 to 1.18; participants = 120; studies = 1; Analysis 25.2).
-
Late GI toxicity (grade 2+): No evidence was found.
-
Diarrhoea (grade 2+): The evidence on diarrhoea grade 2+ during RT is of a very low certainty (RR 1.60, 95% CI 0.89 to 2.89; participants = 56; studies = 1; Analysis 25.3).
-
Other GI symptoms (grade 2+): Evidence on vomiting (RR 0.33, 95% CI 0.01 to 7.85; participants = 56; studies = 1; Analysis 25.4) and rectal bleeding (RR 1.00, 95% CI 0.21 to 4.76; participants = 120; studies = 1; Analysis 25.5) is of a very low certainty.
-
Medication for symptom control: Low‐certainty evidence suggests that proteolytic enzymes may increase the use of medication for diarrhoea symptom control (RR 2.00, 95% CI 1.21 to 3.30; participants = 56; studies = 1; Analysis 25.6).
-
Other review outcomes: No evidence on QoL or other review outcomes was found.
The evidence overall is of a low to very low certainty; and evidence from one small study suggests a potential for harm.
Another type of enzyme (lactase) was evaluated in an older study (Stryker 1986), but we could extract no data for review outcomes. Authors reported no clear difference between the lactase group and other study groups in mean weekly stool frequency and anti‐diarrhoeals taken by participants. More details about this study can be found in Table 2.
Discussion
Summary of main results
The review included 92 studies involving more than 10,000 participants and 44 different interventions to reduce adverse gastrointestinal (GI) effects. The participants were mostly men with localised prostate cancer, women with cervical cancer or endometrial cancer, and men and women with bladder or colorectal cancers who were undergoing primary or adjuvant radiotherapy (RT). Evidence on quality of life (QoL) was very sparse overall, and often not presented in a form that could be meta‐analysed, making interpretation difficult. The main findings of the review are as follows:
Delivery techniques:
Conformal RT: Evidence on delivery techniques shows that, whilst conformal RT (3DCRT and IMRT) leads to less acute toxicity and probably less late GI toxicity than conventional RT (summary of findings Table 1), evidence on beneficial effects of IMRT compared with 3DCRT on GI toxicity is of a low certainty (summary of findings Table 2).
Brachytherapy (BT): In early endometrial cancer, BT techniques reduce acute GI toxicity (summary of findings Table 3).
Other aspects of radiotherapy delivery:
Reduced radiation dose volume: In general, the evidence on toxicity outcomes is of a low certainty and further evidence is likely to change the estimates of effect (summary of findings Table 4); evidence on other outcomes is lacking.
Bladder‐volume preparation: The evidence suggesting no difference in acute and late GI toxicity between a bladder‐volume preparation of 1080 ml and that of 540 ml for men undergoing RT for prostate cancer is of a low certainty, and evidence on other outcomes is lacking (summary of findings Table 5).
Evening radiotherapy: Low‐certainty evidence suggests that radiotherapy delivered in the evening may reduce acute GI toxicity; however, there is little evidence on other review outcomes (summary of findings Table 6).
Hydrogel injections/spacers: Low‐certainty evidence suggests that transperineal hydrogel spacers for men undergoing RT for prostate cancer may make little or no difference to acute and late GI (rectal) toxicity (summary of findings Table 7).
Endorectal balloons (ERBs): Low‐certainty evidence suggests that an ERB may reduce grade 1+ GI toxicity and late rectal bleeding; however, the evidence on other outcomes is very uncertain (summary of findings Table 8).
Other interventions related to radiotherapy delivery: Findings from single studies of proton versus carbon ions, a belly board device, a positioning table, and hyperbaric oxygen had little usable data for review purposes, and the evidence on these can be considered very low certainty (Table 2).
Pharmacological interventions:
Aminosalicylates: Various aminosalicylates were evaluated in several small studies. Whilst low‐certainty evidence suggests that sulfasalazine may reduce grade 2+ GI toxicity, this finding was very inconsistent across the two contributing studies. In general, the evidence on aminosalicylates suggests that these types of pharmacological agents may, in fact, be associated with increased acute GI toxicity and GI symptoms, such as diarrhoea and abdominal pain/cramps, and that they probably increase the need for additional medication for GI symptom control (summary of findings Table 9)
Superoxide dismutase (orgotein): Overall, the evidence on this anti‐inflammatory agent is very uncertain (summary of findings Table 10).
Corticosteroid enemas: The evidence on whether these make any difference to grade 2+ GI toxicity in men undergoing RT for prostate cancer is uncertain (summary of findings Table 11). However, low‐certainty evidence suggests that beclomethasone dipropionate enemas may reduce rectal bleeding during the 12 months post‐RT.
Sucralfate: Moderate‐certainty evidence, mainly derived from studies of oral sucralfate, suggests that this drug probably has little or no effect on acute GI toxicity (summary of findings Table 12). The evidence on rectally‐administered sucralfate (enemas) is limited, mainly due to a lack of power to determine effects.
Amifostine: Evidence suggesting a reduction in acute grade 2+ GI toxicity during RT among people with various pelvic cancers is of low certainty, with evidence on most other outcomes is very uncertain (summary of findings Table 13).
Sodium butyrate: Moderate‐certainty evidence suggests that this agent administered as an enema to men undergoing RT for prostate cancer probably makes little or no difference to acute GI toxicity grade 2+ (summary of findings Table 14).
Selenium: Overall, the evidence on selenium is very uncertain (summary of findings Table 15).
Other pharmacological interventions: Certain other agents show potential to reduce adverse GI effects (e.g. famotidine), but the evidence is sparse and the possible role of these agents needs further investigation (Table 2). The limited evidence on bile acid sequestrants (summary of findings Table 16), misoprostol suppositories (summary of findings Table 17), oral magnesium oxide (summary of findings Table 18), and octreotide injections (summary of findings Table 19) suggests the potential for harm with these agents, without any evidence of benefit. We found no RCT evidence on statins and ACE inhibitors.
Non‐pharmacological interventions:
Diet: Evidence on diet interventions to prevent or reduce GI toxicity is generally of a low or very low certainty (or absent). Low‐certainty evidence suggesting that a high‐fibre diet may lead to better GI symptom scores at the end of RT and at one year post‐RT, and better QoL scores at one year post‐RT needs corroboration. The evidence on prophylactic elemental diet is of a very low certainty, due to sparse data and design limitations of the only available study (summary of findings Table 20)
Protein supplements: Low‐certainty evidence suggests that protein supplements may reduce acute diarrhoea at three months post‐RT (summary of findings Table 21).
Probiotics: Low‐certainty evidence suggests that probiotics may reduce diarrhoea during or at the end of RT, and may reduce the use of medication for symptom control (summary of findings Table 22).
Proteolytic enzymes: The evidence on proteolytic enzymes is of a very low certainty overall (summary of findings Table 23).
Glutamine: The evidence shows that glutamine does not reduce RT‐related diarrhoea and may have little or no impact on other review outcomes (summary of findings Table 24).
Counselling: Low‐certainty evidence suggests that individualised dietary counselling may reduce acute diarrhoea at the end of RT, at three months and at five years post‐RT (summary of findings Table 25). It may also improve some QoL measures.
Other non‐pharmacological interventions: Certain other interventions, such as green tea tablets and curcumin (turmeric), had only one small study contributing sparse data.
Overall completeness and applicability of evidence
Evidence of effectiveness for most interventions evaluated is incomplete, particularly for late effects. In addition, we found very little evidence on QoL. Even where data were available, it was often incompletely reported (e.g. missing standard deviations of the mean), which made it difficult to perform meta‐analyses for this outcome. The limited opportunities for meta‐analysis might give an incomplete picture of the effects of certain interventions on QoL. We have tried to report these data narratively wherever possible; however, we have not graded this evidence.
In terms of specific interventions, there is notably no compelling evidence that IMRT leads to better GI or QoL outcomes than 3DCRT. Ongoing studies of IMRT compared with 3DCRT (NCT00326638; NCT01164150; NCT01641497; NCT01672892; NCT02151019) should increase the certainty of the relative effects of these two techniques.
Despite evidence being incomplete, for certain interventions we found sufficient evidence to support a conclusion that the intervention is not helpful, e.g. octreotide injections, misoprostol suppositories, magnesium oxide, sodium butyrate enemas, oral glutamine. For other interventions, including probiotics, corticosteroid enemas, sucralfate enemas, amifostine, bile acid sequestrants, famotidine, green tea and aspects of radiotherapy delivery, such as reduced dose volume interventions, evening radiotherapy, endorectal balloons and perineal hydrogel injections (spacers), more evidence is required.
With regard to spacers, a follow‐up study of Mariados 2015 was published in 2017 and is discussed below. We found no evidence on statins and ACE inhibitors.
Quality of the evidence
The evidence is generally of a low or very low certainty, with most studies not evaluating interventions for key review outcomes, particularly GI symptom scores and QoL. Evidence was often undermined by unclear study methodology or study design limitations and small sample sizes, which led to a downgrading of the evidence due to the imprecision of the estimates. Outcomes were often assessed using unvalidated scales and were poorly controlled in terms of definition and judgements, particularly for self‐reported outcomes. In addition, compliance with interventions was seldom reported. Adequate reporting of compliance with interventions is particularly problematic with dietary intervention studies. Furthermore, administering a placebo or sham diet to control arms in dietary studies might not be possible or ethical.
We found few instances of high‐certainty evidence. Evidence that we rated as high‐certainty included evidence on conformal versus conventional RT, which indicates that modern conformal RT techniques reduce acute GI toxicity compared with older RT techniques; evidence on brachytherapy, which indicated that brachytherapy leads to less acute grade 2+ GI toxicity compared with EBRT in early endometrial cancer; and evidence on glutamine, which indicated that it has little or no effect on diarrhoea.
Potential biases in the review process
Our pragmatic approach, due to the huge scope of the review topic, might have led to limitations in the review findings, even though most of the points highlighted below were prespecified in the protocol:
Search methods
We did not handsearch journals and conference proceedings, which might have led to some studies being missed. This was a pragmatic decision taken at protocol stage, when we felt that electronic searches would identify most relevant studies and the additional resources and time invested in handsearches could not be justified and would not add much to the yield.
Study selection
We excluded three RCTs on the basis that they randomised fewer than 20 participants (an exclusion criterion prespecified in the protocol). One study that we excluded on this basis (Khan 2000) was a pilot study evaluating the effect of misoprostol suppositories compared with placebo in 16 men undergoing primary radiotherapy for prostate cancer. This study produced statistically significant results (P < 0.05) in favour of improved GI toxicity scores (proctitis) with misoprostol up to 36 weeks post‐RT. We found no benefit of misoprostol suppositories on GI toxicity based on one included study (Hille 2005). However, due to the limitations of the pilot study, it seems unlikely that our conclusions on misoprostol suppositories would have been significantly different had we included it.
Another small study of a nutritional intervention (Itoh 2015) randomised 20 participants and, as such, was included at study selection stage; however, investigators only reported data for 14 participants. We retained the study as 'included' and downgraded the certainty of the evidence based on these data. It is unlikely that including this study had an impact on the review findings, but other review authors might have chosen to exclude it based on the small sample size.
In the protocol we stated that we would exclude studies evaluating dose escalation. This decision was clear‐cut for most studies excluded on this basis, but the eligibility of one study needed discussion before we excluded it. The study concerned (Tacev 2005) compared hypoxy‐radiotherapy (RT delivered in hypoxic conditions) versus standard RT delivery in 307 women with cervical cancer. Unfortunately the RT doses in the study differed such that the hypoxic condition was not the only difference between intervention and control arms, with a higher dose (dose escalation) given to participants in the hypoxy‐RT arm. Despite the higher RT dose, gastrointestinal toxicity was reduced with hypoxy‐RT; for example, acute grade 2+ diarrhoea occurred in 8/155 versus 18/152 in the intervention and control arms, respectively. Similar reductions in late effects were also reported. Therefore, whilst we excluded this study, we felt that the potential benefit of hypoxy‐RT (without dose escalation) on GI toxicity and survival needs further evaluation in RCTs.
In one included study of sucralfate versus placebo (Valls 1991), 10/34 (29%) participants had colostomies (7 and 3 participants in the sucralfate and placebo groups, respectively). Whilst we had specified in the protocol that we would exclude studies with more than 20% ineligible participants, excluding this study with a majority of eligible participants did not seem justifiable, as we considered that the direction of bias would most likely favour the placebo group and that the magnitude of bias in this instance would be relatively small. After discussion, we therefore decided to include the study and assessed it as having a high risk of bias. However, this study ended up contributing no data to the review meta‐analyses.
Whilst toxicity outcomes were reported in all included studies, not all studies reported toxicity outcomes in a form that we could use in our meta‐analyses. In most instances, this was due to the studies not being fully reported and available as conference abstracts only. However, Valls 1999, for example, reported toxicity in terms of mean number of stools and anti‐diarrhoeal tablets required during the assessment period. In the absence of a study reporting our specific review outcomes, we attempted to capture these other GI toxicity outcomes narratively.
One study identified by the November 2017 top‐up search (Ni 2017) remains in the Studies awaiting classification section of the review. This Chinese paper is awaiting translation and will be evaluated in the next update of the review, along with any other newly‐reported IMRT studies, at least five of which are currently ongoing (see Ongoing studies).
Data extraction and analysis
Where studies reported toxicity data for numerous time points during RT, we used the data from the time point with the most events in the intervention arm (worst outcome), to ensure that any evidence of harm was not underestimated. (For the purposes of this review, we considered overestimation of toxicity preferable to underestimation). Missing denominators and standard deviations were a common feature of many studies, as was the reporting of results as percentages. Where possible we calculated these missing data from the available information, e.g. percentages reported, and Cochrane tools. We noted all instances in which we did this and considered the data to be at high risk of bias for the outcome concerned. We also took this into account when grading the evidence.
We used the random‐effects model for all meta‐analysis, irrespective of the statistical heterogeneity, as at the protocol stage we anticipated that clinical heterogeneity with respect to study population and interventions would be high across the included studies. Had we used a fixed‐effect model, certain analyses would have had a more precise effect estimate that demonstrated benefit, as opposed to an effect showing no clear difference. An example of this is in Analysis 1.2 (conformal RT vs conventional RT, late grade 2+ GI toxicity), for which a fixed‐effect model would have given a RR of 0.59 (0.36 to 0.97).
The doses and strains in the probiotic preparations evaluated varied quite widely across studies, but data were generally very sparse. Where more than one study contributed data to an analysis, we pooled the data because we found the evidence to be of a low to very low certainty, whether we pooled the data or not. Future versions of this review or other probiotic reviews that include the pending data from ongoing trials might find meaningful differences between probiotic preparations according to the strain and number of colony‐forming units if the studies are subgrouped accordingly.
We had planned to extract continuous data for QoL meta‐analysis, but subsequently found that it was occasionally reported as a categorical variable (e.g. Mariados 2015 reported the proportion of participants experiencing a minimally‐important difference in QoL). Where this was the case, we described these data narratively.
Limitations of our outcome measures
Whilst we extracted data on acute and late toxicity according to severity grades where they were reported separately, we did not analyse these data according to the different grades, but rather grouped grades 2, 3, and 4 together in the outcome 'acute grade 2+ GI toxicity'. As a secondary outcome, we also grouped grades 1 or higher in the outcome 'acute grade 1+ GI toxicity'. We had prespecified this approach in the protocol. However, it might be considered a rather blunt approach for those wishing to know relative differences in severe (grade 3 or 4) GI toxicity, for example. Our impression, following data extraction and evidence synthesis, was that although certain studies in which the overall number of grade 1+ (or grade 2+) GI toxicity events were similar between groups but in which fewer severe (grade 3 or 4) events were experienced in one of the groups, these data were generally sparse and unlikely to have substantially impacted the review findings on GI toxicity; i.e. evidence on grade 3 or grade 4 toxicity would probably have been graded very low‐certainty evidence due to imprecision.
With regard to the evidence on the outcomes for individual GI symptoms (grade 2+), e.g. rectal bleeding, we found that many studies reported 'any grade' of these symptoms and we included these in our analyses where grade 2+ data were lacking, noting in the footnotes to the forest plots the fact that these data were ungraded. Depending on whether one considers 'any grade' to be more clinically meaningful than grade 2+, one might consider these estimates of effect to be under‐ or overestimated. However, the grading of the overall evidence, which would have been downgraded for design limitations (risk of bias), should have adequately captured the uncertainty introduced due to these outcome reporting differences.
Given the vast scope of the review, we focused on person‐centred outcomes. However, these findings were limited by a lack of consistency between studies in the use of validated scales and tools. Certain other outcomes not included in the review might have provided useful additional information on some interventions. For example, certain objective measures of GI toxicity, such as faecal calprotectin, endoscopic findings and gastrointestinal histology, have also been studied. We discuss below, in Agreements and disagreements with other studies or reviews those included studies evaluating endoscopic findings. It is also important to note that some of the included interventions might have important effects on non‐GI‐related outcomes that we have not evaluated, e.g. effects on urinary or sexual outcomes.
Interpretation of the evidence
We reported the evidence in a systematic way using EPOC guidance (EPOC 2015) and presenting only the prespecified outcomes in the 'Summary of findings' tables. Thus, in a few instances, evidence suggesting potential harms or benefits does not appear in the 'Summary of Findings' table. This is in accordance with standard Cochrane methodology, but it does mean that not all important outcomes are reflected in the tables (although they are reported in the review text). We have summarised the findings of small (underpowered) single studies in Table 2.
Lastly, as mentioned in the Overall completeness and applicability of evidence, we did not grade narrative evidence on GI symptom scores and QoL outcomes, and not doing so might have underestimated the overall completeness of some of the evidence on specific interventions (e.g. counselling interventions and prerectal spacers).
Agreements and disagreements with other studies or reviews
Some individual studies have drawn conclusions about the possible benefit of interventions that are not consistent with our findings. This occurred often with small underpowered studies, such as those documented in Table 2. For example, in Muecke 2010 authors concluded that selenium "reduces the number of episodes and severity of RT‐induced diarrhoea". As the number of episodes of diarrhoea was not an outcome for our review, it is possible that this effect was not captured by review analyses and therefore our conclusions about selenium differ from Muecke 2010 (we found limited evidence suggesting no difference in diarrhoea). Several included studies also covered objective outcomes which were not included in the review, particularly endoscopic findings (Fuccio 2011; Hovdenak 2005; Katsanos 2010; Kouloulias 2005; Kouvaris 2003; Maggio 2014; Prada 2009; Van Lin 2007); however, most studies did not correlate the objective findings with participant‐reported outcomes (GI symptoms). Various scoring measures for endoscopic findings were used, including the Vienna Rectoscopy Score (VRS) and scales based on the World Organization for Digestive Endoscopy terminology, with severity grading from 0 to 4. Two studies graded telangiectasia according to Wachter 2000 criteria (Prada 2009; Van Lin 2007). Two studies reported histology in addition to endoscopic findings (Hovdenak 2005; Katsanos 2010). Katsanos 2010 evaluated amifostine compared with no amifostine and found little difference between groups with regard to late grade 2+ mucositis at least six months after RT (7/21 versus 6/23 for amifostine and control groups respectively), but reported more acute grade 2+ mucositis in the control group at the completion of RT (0/21 versus 4/23 for amifostine and control groups, respectively). This study reported that correlation between histology and endoscopic scores was poor, and that endoscopy underestimated mucosal injury identified by histology. Another study of amifostine (Kouvaris 2003) reported "more severe rectal mucositis" in the control group at one to two days after RT, but this was not quantified in the report. Similarly, a study of different routes of administration of amifostine (subcutaneous versus rectal routes) (Kouloulias 2005) gave no quantitative data but reported that rectosigmoidoscopy revealed greater rectal mucositis with the subcutaneous route than the rectal route at one to two days after completion of RT. Positive findings were reported by Prada 2009 (transperineal hydrogel compared with no intervention) for moderate to severe (T2 ‐ 3) telangiectasia (2/36 versus 12/33 at 13 to 24 months; median 18 months; P = 0.002). Fuccio 2011 reported no difference at three months post‐RT, but at 12 months post‐RT fewer participants in the beclomethasone group had VRSs of grade 2 or more (22/55 versus 40/59, P = 0.028). The VRS was significant lower (better) in the beclomethasone group of the study. Hovdenak 2005 (oral sucralfate versus placebo) reported that there was no difference between study arms in endoscopy findings or histology during and at two weeks post‐RT. Maggio 2014 (sodium butyrate enemas) also reported no difference in endoscopy findings, assessed at week six of RT, between treatment and placebo arms. A study of endorectal balloons (ERBs) (Van Lin 2007) reported that high‐grade telangiectasia (T2 ‐ 3) was significantly less common in the ERB group compared with no intervention at one and two years post‐RT; however, overall rates of T2 ‐ 3 during the two‐year follow‐up were not significantly different (22/24 versus 21/24 for ERB and no‐ERB groups, respectively). This study also reported a trend towards less rectal bleeding in the ERB group (3/24 versus 8/24; P = 0.088). These objective findings are interesting and could have added to the body of review evidence.
A Cochrane Review of diet interventions (Henson 2013) used a different approach to ours, by pooling the data of the different diet interventions. Authors concluded that any diet intervention improved patient outcomes and graded these findings as moderate‐certainty, which is an interesting interpretation of existing evidence on diet. It could well be that the intensive dietary monitoring and guidance associated with any of the diet interventions evaluated has a positive effect on patient outcomes. This interpretation is partly supported by our review findings on counselling interventions, which suggested that individualised dietary counselling might have a positive impact on toxicity and QoL outcomes.
There have also been non‐Cochrane reviews conducted on probiotics (Fuccio 2011; Hamad 2013). Hamad 2013 performed meta‐analysis and concluded that probiotics may have a beneficial effect in the prevention of radiation‐induced diarrhoea, which is in agreement with our findings on probiotics. However the evidence in Hamad 2013 was not formally graded and the text conclusions differ slightly from the abstract conclusions in the certainty of the evidence, with the text stating "may have a role" and the abstract stating that probiotics have a "probable beneficial effect" on diarrhoea prevention.
A 2015 review on preventative medical therapies to reduce radiotherapy‐related toxicity (Fuccio 2015) did not perform meta‐analysis or grade the evidence. Despite the limitations of our review, as discussed in Potential biases in the review process, its strength lies in the systematic approach that we have taken to a wide and diverse range of interventions. By including the same person‐centred outcomes for all interventions and having the evidence graded systematically by the same team of review authors using the GRADE approach, this review should enable researchers, clinicians, funders and other stakeholders to readily compare evidence on the individual interventions. We hope that it will also help to stimulate person‐centred research appropriate to different settings and contexts, and that it will prevent resource wastage by directing research towards interventions that have the potential to make a difference to people's lives.
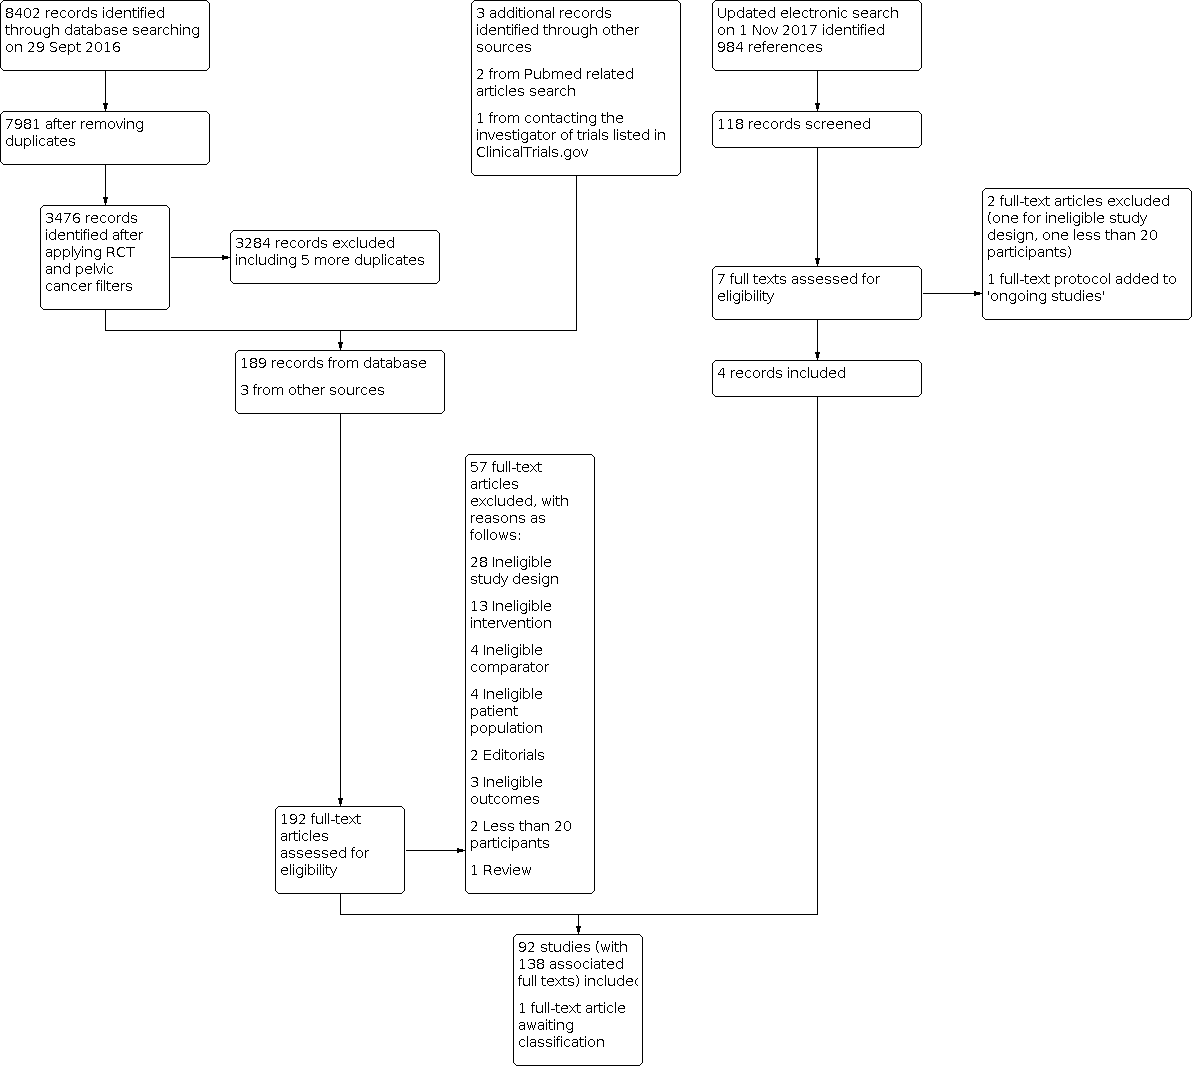
192Study flow diagram

Risk of bias summary: review authors' judgements about each risk of bias item for each included study.

Comparison 1: Conformal RT vs conventional RT, Outcome 1: Acute GI toxicity: grade 2+

Comparison 1: Conformal RT vs conventional RT, Outcome 2: Late GI toxicity: grade 2+

Comparison 1: Conformal RT vs conventional RT, Outcome 3: Acute GI toxicity: grade 1+

Comparison 1: Conformal RT vs conventional RT, Outcome 4: Late GI toxicity: grade 1+

Comparison 1: Conformal RT vs conventional RT, Outcome 5: Vomiting: grade 2+

Comparison 1: Conformal RT vs conventional RT, Outcome 6: Medication for GI symptom control

Comparison 2: IMRT vs 3DCRT, Outcome 1: GI symptom score (6 months)

Comparison 2: IMRT vs 3DCRT, Outcome 2: GI symptom score (2 years)

Comparison 2: IMRT vs 3DCRT, Outcome 3: Acute GI toxicity: grade 2+

Comparison 2: IMRT vs 3DCRT, Outcome 4: Late GI toxicity: grade 2+

Comparison 2: IMRT vs 3DCRT, Outcome 5: Acute GI toxicity: grade 1+

Comparison 2: IMRT vs 3DCRT, Outcome 6: Late GI toxicity: grade 1+

Comparison 2: IMRT vs 3DCRT, Outcome 7: Diarrhoea: grade 2+

Comparison 2: IMRT vs 3DCRT, Outcome 8: Vomiting: grade 2+

Comparison 3: Brachytherapy vs EBRT, Outcome 1: Acute GI toxicity: grade 2+

Comparison 3: Brachytherapy vs EBRT, Outcome 2: Late GI toxicity: grade 2+

Comparison 3: Brachytherapy vs EBRT, Outcome 3: Acute GI toxicity: grade 1

Comparison 3: Brachytherapy vs EBRT, Outcome 4: Late GI toxicity: grade 1

Comparison 3: Brachytherapy vs EBRT, Outcome 5: Treatment discontinuation

Comparison 4: Reduced dose volume vs standard dose volume, Outcome 1: Acute GI toxicity: grade 2+

Comparison 4: Reduced dose volume vs standard dose volume, Outcome 2: Acute GI toxicity: grade 1+

Comparison 4: Reduced dose volume vs standard dose volume, Outcome 3: Late GI toxicity: grade 2+ (1 year post‐RT)

Comparison 4: Reduced dose volume vs standard dose volume, Outcome 4: Late GI toxicity: grade 2+ (2 years post‐RT)

Comparison 4: Reduced dose volume vs standard dose volume, Outcome 5: Late GI toxicity: grade 1+

Comparison 5: Higher BV prep vs lower BV prep, Outcome 1: Acute GI toxicity: grade 2+

Comparison 5: Higher BV prep vs lower BV prep, Outcome 2: Acute GI toxicity: grade 1+

Comparison 5: Higher BV prep vs lower BV prep, Outcome 3: Late GI toxicity: grade 2+

Comparison 5: Higher BV prep vs lower BV prep, Outcome 4: Late GI toxicity: grade 1+

Comparison 6: Evening RT vs morning RT, Outcome 1: Acute GI toxicity (diarrhoea): grade 2+ (during RT)

Comparison 6: Evening RT vs morning RT, Outcome 2: Acute GI toxicity (diarrhoea): grade 1+ (during RT)

Comparison 6: Evening RT vs morning RT, Outcome 3: Vomiting grade 2+ (during RT)

Comparison 7: Perineal hydrogel spacer vs no intervention, Outcome 1: Acute GI toxicity: grade 2+

Comparison 7: Perineal hydrogel spacer vs no intervention, Outcome 2: Acute GI toxicity: grade 1+

Comparison 7: Perineal hydrogel spacer vs no intervention, Outcome 3: Late GI toxicity: grade 2+

Comparison 7: Perineal hydrogel spacer vs no intervention, Outcome 4: Late GI toxicity: grade 1+

Comparison 7: Perineal hydrogel spacer vs no intervention, Outcome 5: Rectal bleeding (late)

Comparison 7: Perineal hydrogel spacer vs no intervention, Outcome 6: Rectal pain (acute)

Comparison 8: Endorectal balloon vs no intervention, Outcome 1: Acute GI toxicity: grade 2+

Comparison 8: Endorectal balloon vs no intervention, Outcome 2: Acute GI toxicity: grade 1+

Comparison 8: Endorectal balloon vs no intervention, Outcome 3: Late GI toxicity: grade 2+

Comparison 8: Endorectal balloon vs no intervention, Outcome 4: Late GI toxicity: grade 1+

Comparison 8: Endorectal balloon vs no intervention, Outcome 5: Diarrhoea (late)

Comparison 8: Endorectal balloon vs no intervention, Outcome 6: Rectal bleeding (acute)

Comparison 8: Endorectal balloon vs no intervention, Outcome 7: Rectal bleeding (late)

Comparison 9: Aminosalicylates vs placebo, Outcome 1: Acute GI toxicity: grade 2+ (during RT)

Comparison 9: Aminosalicylates vs placebo, Outcome 2: Acute GI toxicity: grade 1+ (during RT)

Comparison 9: Aminosalicylates vs placebo, Outcome 3: Diarrhoea grade 2+(during RT)

Comparison 9: Aminosalicylates vs placebo, Outcome 4: Diarrhoea grade 2+(up to 3 months)

Comparison 9: Aminosalicylates vs placebo, Outcome 5: Rectal bleeding grade 2+ (during RT)

Comparison 9: Aminosalicylates vs placebo, Outcome 6: Rectal bleeding grade 2+ (up to 3 months)

Comparison 9: Aminosalicylates vs placebo, Outcome 7: Pain/cramps grade 2+(during RT)

Comparison 9: Aminosalicylates vs placebo, Outcome 8: Pain/cramps grade 2+(up to 3 months)

Comparison 9: Aminosalicylates vs placebo, Outcome 9: Tenesmus grade 2+(during RT)

Comparison 9: Aminosalicylates vs placebo, Outcome 10: Tenesmus grade 2+(up to 3 months)

Comparison 9: Aminosalicylates vs placebo, Outcome 11: Vomiting grade 2+(during RT)

Comparison 9: Aminosalicylates vs placebo, Outcome 12: Medication for GI symptom control

Comparison 9: Aminosalicylates vs placebo, Outcome 13: Discontinuation of study medication

Comparison 10: Corticosteroids vs placebo, Outcome 1: Acute GI toxicity: grade 2+

Comparison 10: Corticosteroids vs placebo, Outcome 2: Late GI toxicity: grade 2+

Comparison 10: Corticosteroids vs placebo, Outcome 3: Late GI toxicity: grade 1+

Comparison 10: Corticosteroids vs placebo, Outcome 4: Diarrhoea: grade 2+ (up to 12 months)

Comparison 10: Corticosteroids vs placebo, Outcome 5: Rectal bleeding (up to 12 months, ungraded)

Comparison 10: Corticosteroids vs placebo, Outcome 6: Faecal urgency (up to 12 months, ungraded)

Comparison 11: Superoxide dismutase vs no intervention, Outcome 1: Acute GI toxicity: grade 2+ (3 months)

Comparison 11: Superoxide dismutase vs no intervention, Outcome 2: Late GI toxicity: grade 2+ (1 year)

Comparison 11: Superoxide dismutase vs no intervention, Outcome 3: Late GI toxicity: grade 2+ (2 years)

Comparison 12: Amifostine vs no intervention, Outcome 1: Acute GI toxicity: grade 2+(during RT)

Comparison 12: Amifostine vs no intervention, Outcome 2: Acute GI toxicity: grade 2+(up to 3 months)

Comparison 12: Amifostine vs no intervention, Outcome 3: Acute GI toxicity: grade 1+(up to 3 months)

Comparison 12: Amifostine vs no intervention, Outcome 4: Late GI toxicity: grade 2+

Comparison 12: Amifostine vs no intervention, Outcome 5: Late GI toxicity: grade 1+

Comparison 12: Amifostine vs no intervention, Outcome 6: Diarrhoea grade 2+ (during treatment)

Comparison 12: Amifostine vs no intervention, Outcome 7: Discontinuation of RT

Comparison 13: Bile acid sequestrants vs no intervention, Outcome 1: GI symptom scores

Comparison 13: Bile acid sequestrants vs no intervention, Outcome 2: Acute GI toxicity: grade 2+ (during RT)

Comparison 13: Bile acid sequestrants vs no intervention, Outcome 3: Diarrhoea: grade 2+ (during RT)

Comparison 13: Bile acid sequestrants vs no intervention, Outcome 4: Medication for symptom control

Comparison 14: Magnesium oxide vs placebo, Outcome 1: Acute GI toxicity: grade 2+ (during RT)

Comparison 14: Magnesium oxide vs placebo, Outcome 2: Medication for symptom control

Comparison 14: Magnesium oxide vs placebo, Outcome 3: Discontinuation of study medication

Comparison 15: Misoprostol vs placebo, Outcome 1: Acute GI toxicity: grade 2+ (during RT)

Comparison 15: Misoprostol vs placebo, Outcome 2: Diarrhoea grade 2+ (during RT)

Comparison 15: Misoprostol vs placebo, Outcome 3: Diarrhoea grade 2+ (1+ years post‐RT)

Comparison 15: Misoprostol vs placebo, Outcome 4: Rectal bleeding grade 2+ (during RT)

Comparison 15: Misoprostol vs placebo, Outcome 5: Rectal bleeding grade 2+ (1+ years post‐RT)

Comparison 15: Misoprostol vs placebo, Outcome 6: Tenesmus 2+ (during RT)

Comparison 15: Misoprostol vs placebo, Outcome 7: Tenesmus 2+ (1+ years post‐RT)

Comparison 15: Misoprostol vs placebo, Outcome 8: Faecal urgency 2+ (during RT)

Comparison 15: Misoprostol vs placebo, Outcome 9: Faecal incontinence (1+ years post‐RT)

Comparison 15: Misoprostol vs placebo, Outcome 10: Pain/cramps 2+ (during RT)

Comparison 16: Octreotide vs placebo, Outcome 1: Diarrhoea grade 2+ (acute)

Comparison 16: Octreotide vs placebo, Outcome 2: Rectal bleeding grade 2+ (acute)

Comparison 16: Octreotide vs placebo, Outcome 3: Tenesmus grade 2+ (during RT)

Comparison 16: Octreotide vs placebo, Outcome 4: Vomiting grade 2+ (during RT)

Comparison 16: Octreotide vs placebo, Outcome 5: Pain/cramps grade 2+ (during RT)

Comparison 16: Octreotide vs placebo, Outcome 6: Faecal incontinence grade 2+ (during RT)

Comparison 16: Octreotide vs placebo, Outcome 7: Medication for GI symptom control

Comparison 16: Octreotide vs placebo, Outcome 8: Discontinuation of study medication

Comparison 17: Selenium vs no intervention, Outcome 1: Diarrhoea grade 2+ (acute)

Comparison 18: Sodium butyrate enema vs placebo, Outcome 1: Acute GI toxicity grade 2+ (during RT)

Comparison 18: Sodium butyrate enema vs placebo, Outcome 2: Acute GI toxicity grade 1+ (during RT)

Comparison 19: Sucralfate vs placebo, Outcome 1: Acute GI toxicity: grade 2+(during RT)

Comparison 19: Sucralfate vs placebo, Outcome 2: Acute GI toxicity: grade 1+ (during RT)

Comparison 19: Sucralfate vs placebo, Outcome 3: Late GI toxicity: grade 2+

Comparison 19: Sucralfate vs placebo, Outcome 4: Diarrhoea grade 2+ (during RT)

Comparison 19: Sucralfate vs placebo, Outcome 5: Rectal bleeding grade 2+(during RT)

Comparison 19: Sucralfate vs placebo, Outcome 6: Pain/cramps grade 2+(during RT)

Comparison 19: Sucralfate vs placebo, Outcome 7: Faecal urgency grade 2+ (during RT)

Comparison 19: Sucralfate vs placebo, Outcome 8: Faecal incontinence grade 2+(during RT)

Comparison 19: Sucralfate vs placebo, Outcome 9: Tenesmus grade 2+(during RT)

Comparison 19: Sucralfate vs placebo, Outcome 10: Medication for symptom control

Comparison 19: Sucralfate vs placebo, Outcome 11: Discontinuation of study medication

Comparison 20: Diet vs control (usual on‐treatment diet), Outcome 1: Acute GI toxicity: grade 2+ (during RT)

Comparison 20: Diet vs control (usual on‐treatment diet), Outcome 2: Acute GI toxicity: grade 1+ (during RT)

Comparison 20: Diet vs control (usual on‐treatment diet), Outcome 3: Late GI toxicity: grade 1+

Comparison 20: Diet vs control (usual on‐treatment diet), Outcome 4: Diarrhoea grade 1+ (during RT)

Comparison 20: Diet vs control (usual on‐treatment diet), Outcome 5: Diarrhoea grade 2+ (during RT)

Comparison 20: Diet vs control (usual on‐treatment diet), Outcome 6: GI symptom score (during RT)

Comparison 20: Diet vs control (usual on‐treatment diet), Outcome 7: GI symptom score (1 year after RT)

Comparison 20: Diet vs control (usual on‐treatment diet), Outcome 8: GI symptom score ‐ mean change from baseline (at end of RT)

Comparison 20: Diet vs control (usual on‐treatment diet), Outcome 9: GI symptom score ‐ mean change from baseline (1 year after RT)

Comparison 20: Diet vs control (usual on‐treatment diet), Outcome 10: RT discontinuation

Comparison 20: Diet vs control (usual on‐treatment diet), Outcome 11: QoL (during RT)

Comparison 20: Diet vs control (usual on‐treatment diet), Outcome 12: QoL (1 year after RT)

Comparison 21: Counselling vs no intervention, Outcome 1: GI symptom score (acute)

Comparison 21: Counselling vs no intervention, Outcome 2: Diarrhoea: grade 2+ (end of RT)

Comparison 21: Counselling vs no intervention, Outcome 3: Diarrhoea grade 2+ (3 months post‐RT)

Comparison 21: Counselling vs no intervention, Outcome 4: Diarrhoea grade 2+ (5 years post‐RT)

Comparison 21: Counselling vs no intervention, Outcome 5: Weight loss: grade 2+ (end of RT)

Comparison 21: Counselling vs no intervention, Outcome 6: Weight loss: grade 2+ (3 months post‐RT)

Comparison 21: Counselling vs no intervention, Outcome 7: Vomiting: grade 2+ (end of RT)

Comparison 21: Counselling vs no intervention, Outcome 8: Vomiting: grade 2+ (3 months post‐RT)

Comparison 21: Counselling vs no intervention, Outcome 9: Medication for symptom control (end of RT)

Comparison 21: Counselling vs no intervention, Outcome 10: Medication for symptom control (3 months post‐RT)

Comparison 21: Counselling vs no intervention, Outcome 11: QOL

Comparison 22: Protein supplement vs no intervention, Outcome 1: Diarrhoea: grade 2+ (end of RT)

Comparison 22: Protein supplement vs no intervention, Outcome 2: Diarrhoea grade 2+ (3 months post‐RT)

Comparison 22: Protein supplement vs no intervention, Outcome 3: Diarrhoea grade 2+ (5 years post‐RT)

Comparison 22: Protein supplement vs no intervention, Outcome 4: Vomiting: grade 2+ (end of RT)

Comparison 22: Protein supplement vs no intervention, Outcome 5: Vomiting: grade 2+ (3 months post‐RT)

Comparison 22: Protein supplement vs no intervention, Outcome 6: Weight loss: grade 2+ (end of RT)

Comparison 22: Protein supplement vs no intervention, Outcome 7: Weight loss: grade 2+ (3 months post‐RT)

Comparison 22: Protein supplement vs no intervention, Outcome 8: Medication for symptom control (end of RT)

Comparison 22: Protein supplement vs no intervention, Outcome 9: Medication for symptom control (3 months post‐RT)

Comparison 23: Glutamine vs placebo, Outcome 1: Acute GI toxicity: grade 2+(during RT)

Comparison 23: Glutamine vs placebo, Outcome 2: Acute GI toxicity: grade 1+ (during RT)

Comparison 23: Glutamine vs placebo, Outcome 3: Late GI toxicity: grade 2+ (1 year)

Comparison 23: Glutamine vs placebo, Outcome 4: Late GI toxicity: grade 1+ (1 year)

Comparison 23: Glutamine vs placebo, Outcome 5: Diarrhoea grade 2+(during RT)

Comparison 23: Glutamine vs placebo, Outcome 6: Tenesmus grade 2+(during RT)

Comparison 23: Glutamine vs placebo, Outcome 7: Pain/cramps grade 2+(during RT)

Comparison 23: Glutamine vs placebo, Outcome 8: Rectal bleeding grade 2+ (during RT)

Comparison 23: Glutamine vs placebo, Outcome 9: Vomiting grade 2+ (during RT)

Comparison 23: Glutamine vs placebo, Outcome 10: Nausea grade 2+ (during RT)

Comparison 23: Glutamine vs placebo, Outcome 11: Medication for GI symptom control

Comparison 23: Glutamine vs placebo, Outcome 12: Faecal incontinence (during RT)

Comparison 23: Glutamine vs placebo, Outcome 13: Faecal incontinence (1 year post RT)

Comparison 23: Glutamine vs placebo, Outcome 14: Faecal incontinence (2 year post RT)

Comparison 23: Glutamine vs placebo, Outcome 15: Pain/cramps grade 2+(during RT)

Comparison 23: Glutamine vs placebo, Outcome 16: Pain/cramps grade 2+(1 year post RT)

Comparison 23: Glutamine vs placebo, Outcome 17: Pain/cramps grade 2+(2 year post RT)

Comparison 23: Glutamine vs placebo, Outcome 18: Rectal bleeding grade 2+ (1 year post RT)

Comparison 23: Glutamine vs placebo, Outcome 19: Rectal bleeding grade 2+ (2 year post RT)

Comparison 24: Probiotics vs control (placebo or no intervention), Outcome 1: Diarrhoea: grade 2+ (during RT)

Comparison 24: Probiotics vs control (placebo or no intervention), Outcome 2: Weight loss grade 2+

Comparison 24: Probiotics vs control (placebo or no intervention), Outcome 3: Medication for GI symptom control

Comparison 25: Proteolytic enzymes vs control (placebo or no intervention), Outcome 1: Acute GI toxicity: grade 2+ (during RT)

Comparison 25: Proteolytic enzymes vs control (placebo or no intervention), Outcome 2: Acute GI toxicity: grade 1+ (during RT)

Comparison 25: Proteolytic enzymes vs control (placebo or no intervention), Outcome 3: Diarrhoea: grade 2+ (during RT)

Comparison 25: Proteolytic enzymes vs control (placebo or no intervention), Outcome 4: Vomiting grade 2+ (during RT)

Comparison 25: Proteolytic enzymes vs control (placebo or no intervention), Outcome 5: Rectal bleeding grade 2+ (during RT)

Comparison 25: Proteolytic enzymes vs control (placebo or no intervention), Outcome 6: Medication for GI symptom control
| Conformal RT compared with conventional RT to reduce adverse GI effects of radiotherapy | ||||||
| Patient or population: People with urological (prostate) gynaecological (cervical) cancer Settings: Tertiary care setting Intervention: Conformal RT (3DCRT and IMRT) Comparison: Conventional RT | ||||||
| Outcomes | Illustrative comparative risks* (95% CI) | Relative effect | No of Participants | Quality/certainty of the evidence | Comments | |
|---|---|---|---|---|---|---|
| Assumed risk | Corresponding risk | |||||
| Conventional RT | Conformal RT (3DCRT and IMRT) | |||||
| Mean GI symptom scores | ‐ | ‐ | Not estimable | 0 | ‐ | No data |
| Acute and late GI toxicity grade 2+ | Acute toxicity (up to 3 months post‐RT): 365 per 1000 | Acute toxicity (up to 3 months post‐RT): 208 per 1000 | RR 0.57 (0.40 to 0.82) | 307 | ⊕⊕⊕⊕ | The effects in 3DCRT and IMRT subgroups were consistent with the overall effect estimate |
| Late toxicity (from 6 months post‐RT): 155 per 1000 | Late toxicity (from 6 months post‐RT): 76 per 1000 | RR0.49 (0.22 to 1.09) | 517 | ⊕⊕⊕⊝ | The effects in 3DCRT and IMRT subgroups were consistent with the overall effect estimate but there was substantial heterogeneity within the 3DCRT subgroup (I2 = 60%) | |
| Diarrhoea (grade 2+) | ‐ | ‐ | Not estimable | 0 | ‐ | No data |
| QoL scores | ‐ | ‐ | Not estimable | 0 | ‐ | No data |
| *The basis for the assumed risk is the mean control group risk across studies. The corresponding risk (and its 95% confidence interval) is based on the assumed risk in the comparison group and the relative effect of the intervention (and its 95% CI). | ||||||
| GRADE Working Group grades of evidence | ||||||
| 1Downgraded one level due to imprecision (wide confidence interval crossing the line of no effect). | ||||||
| IMRT compared with 3DCRT to reduce adverse GI effects of radiotherapy | ||||||
| Patient or population: People with urological (prostate) and gynaecological (cervical) cancer Settings: Tertiary care setting Intervention: IMRT Comparison: 3DCRT | ||||||
| Outcomes | Illustrative comparative risks* (95% CI) | Relative effect | No of Participants | Quality/certainty of the evidence | Comments | |
|---|---|---|---|---|---|---|
| Assumed risk | Corresponding risk | |||||
| 3DCRT | IMRT | |||||
| Mean GI symptom scores (EORTC‐QLQPR25 scale; lower scores better) | At 6 months post‐RT, the mean GI symptom score in the control group was | At 6 months post‐RT, the mean GI symptom score in the intervention group was | MD ‐5.00 (‐9.06 to ‐0.94) | 181 | ⊕⊕⊝⊝ | ‐ |
| Acute and late GI toxicity Grade 2+ | Acute toxicity (up to 3 months post‐RT): 445 per 1000 | Acute toxicity (up to 3 months post‐RT): 214 per 1000 | RR 0.48 (0.26 to 0.88) | 444 | ⊕⊕⊝⊝ | Inconsistency was present between studies in the gynaecological cancer subgroup but not between gynaecological and urological subgroups |
| Late toxicity (from 6 months post‐RT): 228 per 1000 | Late toxicity (from 6 months post‐RT): 84 per 1000 | RR0.37 (0.21 to 0.65) | 332 | ⊕⊕⊝⊝ | Findings were consistent across gynaecological and urological subgroups. | |
| Diarrhoea (grade 2+) | Acute toxicity (up to 3 months post‐RT): 720 per 1000 | Acute toxicity (up to 3 months after RT): 273 per 1000 | RR 0.38 (0.22 to 0.68) | 72 | ⊕⊕⊝⊝ low1, 5 | ‐ |
| QoL scores | ‐ | ‐ | Not estimable | 0 | ‐ | No data |
| *The basis for the assumed risk is the mean control group risk across studies. The corresponding risk (and its 95% confidence interval) is based on the assumed risk in the comparison group and the relative effect of the intervention (and its 95% CI). | ||||||
| GRADE Working Group grades of evidence | ||||||
| 1Downgraded one level for design limitations (unclear risk of bias). | ||||||
| BT compared with EBRT to reduce adverse GI effects of radiotherapy | ||||||
| Patient or population: People with urological (prostate) and gynaecological (endometrial) cancer Settings: Tertiary care settings Intervention: BT Comparison: EBRT | ||||||
| Outcomes | Illustrative comparative risks* (95% CI) | Relative effect | No of Participants | Quality/certainty of the evidence | Comments | |
|---|---|---|---|---|---|---|
| Assumed risk | Corresponding risk | |||||
| EBRT | BT | |||||
| Mean GI symptom scores | ‐ | ‐ | Not estimable | 348 (1) | ‐ | 1 high‐quality study reported data on GI symptom scores at various time points after radiotherapy up to 5 years. Due to the numberous time points and domains, we could not use these data in the review meta‐analysis in a meaningful way. However, the findings favoured BT for 'limitation in daily activities due to bowel symptoms' (P < 0.001), faecal leakage (P < 0.001) and rectal blood loss (P = 0.04) at most time points up to 5 years post‐radiotherapy |
| Acute and late GI toxicity (grade 2+) | Acute GI toxicity (Up to 3 months after RT): ‐ | Acute GI toxicity (Up to 3 months after RT): ‐ | not pooled | not pooled | ‐ | Due to clinical and statistical heterogeneity, data from the two relevant studies were not pooled for this outcome and subgroup evidence was graded separately. Evidence from the urological (prostate) cancer was graded as very low certainty. However, the evidence in favour of BT from the one study in the 'gynaecological cancer' subgroup was graded as high‐certainty (RR 0.02, 95% CI 0.00 to 0.18; participants = 423; studies = 1). |
| Late GI toxicity (from 6 months post‐RT): 26 per 1000 | Late GI toxicity (from 6 months post‐RT): 4 per 1000 | RR 0.16 (0.02 to 1.33) | 423 | ⊕⊕⊝⊝ | ‐ | |
| Diarrhoea (grade 2+) | Acute diarrhoea (Up to 3 months after RT) | ‐ | Not estimable | 0 | ‐ | No data |
| QoL scores (EORTC Q30) | Measured in one study at various time points up to 5 years and beyond | ‐ | Not estimable | 348 (1) | ‐ | 1 high‐quality study reported data on QoL scores at various time points after radiotherapy to 5 years and found no clear difference in global health status between BT and EBRT groups |
| *The basis for the assumed risk is the mean control group risk across studies. The corresponding risk (and its 95% confidence interval) is based on the assumed risk in the comparison group and the relative effect of the intervention (and its 95% CI). | ||||||
| GRADE Working Group grades of evidence | ||||||
| 1Downgraded for inconsistency (I2 = 74%). | ||||||
| Reduced radiation dose volume compared with standard dose volume to reduce adverse GI effects of radiotherapy | ||||||
| Patients/population: People undergoing RT for pelvic cancer1 Settings: Tertiary care Intervention: Reduced radiation dose‐volume Comparison: Standard radiation dose‐volume | ||||||
| Outcomes | Illustrative comparative risks* (95% CI) | Relative effect | No of Participants | Quality/certainty of the evidence | Comments | |
|---|---|---|---|---|---|---|
| Assumed risk | Corresponding risk | |||||
| standard radiation dose volume | reduced radiation dose volume | |||||
| Mean GI symptom scores | ‐ | ‐ | not estimable | ‐ | ‐ | No data |
| Acute and late GI toxicity (grade 2+) | Acute (up to 3 months post‐RT) : 282 per 1000 | Acute (up to 3 months post‐RT): 341 per 1000 (228 to 510) | RR 1.21 (0.81 to 1.81) | 211 (1) | ⊕⊕⊕⊝ | ‐ |
| Late (1 year post‐RT): 37 per 1000 | Late (1 year post RT): 38 per 1000 (6 to 258) | RR 1.02 (0.15 to 6.97) | 107 (1) | ⊕⊕⊝⊝ | ‐ | |
| Late (2 years post‐RT): 71 per 1000 | Late (2 years post RT): 27 per 1000 (3 to 247) | RR 0.38 (0.04 to 3.48) | 79 (1) | ⊕⊕⊝⊝ | ‐ | |
| Diarrhoea (grade 2+) | ‐ | ‐ | not estimable | ‐ | ‐ | No data |
| QOL scores | ‐ | ‐ | not estimable | ‐ | ‐ | no data |
| *The basis for the assumed risk is the mean control group risk across studies. The corresponding risk (and its 95% confidence interval) is based on the assumed risk in the comparison group and the relative effect of the intervention (and its 95% CI). | ||||||
| GRADE Working Group grades of evidence | ||||||
| 1All evidence in the SOF was derived from participants undergoing treatment for bladder cancer. | ||||||
| Higher bladder volume (BV) compared with lower BV preparation to reduce adverse GI effects of radiotherapy | ||||||
| Patients/population: Men undergoing RT for prostate cancer Settings: Tertiary care Intervention: BV prep of 1080 mls Comparison: BV prep of 540 mls | ||||||
| Outcomes | Illustrative comparative risks* (95% CI) | Relative effect | No of Participants | Quality/certainty of the evidence | Comments | |
|---|---|---|---|---|---|---|
| Assumed risk | Corresponding risk | |||||
| 540 mls BV prep | 1080 mls BV prep | |||||
| Mean GI symptom scores (during RT) | ‐ | ‐ | not estimable | ‐ | ‐ | No data |
| Acute and late GI toxicity (grade 2+) | Acute (up to 3 months post RT): 60 per 1000 | Acute (up to 3 months post‐RT): 133 per 1000 (37 to 476) | RR 2.22 (0.62 to 7.93) | 110 (1) | ⊕⊕⊝⊝ | ‐ |
| Late (up to 1 year post‐RT): 158 per 1000 | Late (up to 1 year post‐RT): 70 per 1000 (19 to 261) | RR 0.44 (0.12 to 1.65) | 81 (1) | ⊕⊕⊝⊝ | ‐ | |
| Diarrhoea (grade 2+) | ‐ | ‐ | not estimable | ‐ | ‐ | No data |
| QOL scores | ‐ | ‐ | not estimable | ‐ | ‐ | Insufficient data for meta‐analysis; however, authors stated that "There were no statistically significant associations between bladder filling preparations...and median QOL scores." |
| *The basis for the assumed risk is the mean control group risk across studies. The corresponding risk (and its 95% confidence interval) is based on the assumed risk in the comparison group and the relative effect of the intervention (and its 95% CI). | ||||||
| GRADE Working Group grades of evidence | ||||||
| 1Downgraded due to imprecision (wide CI crossing the line of no effect). | ||||||
| Evening RT compared with morning RT to reduce adverse GI effects of radiotherapy | ||||||
| Patients/population: Women undergoing RT for cervical cancer Settings: Tertiary care Intervention: Evening RT Comparison: Morning RT | ||||||
| Outcomes | Illustrative comparative risks* (95% CI) | Relative effect | No of Participants | Quality/certainty of the evidence | Comments | |
|---|---|---|---|---|---|---|
| Assumed risk | Corresponding risk | |||||
| morning RT | evening RT | |||||
| Mean GI symptom scores | ‐ | ‐ | not estimable | ‐ | ‐ | No data |
| Acute and late GI toxicity (grade 2+) | Acute (during RT): 349 per 1000 | Acute (during RT): 178 per 1000 (119 to 265) | RR 0.51 (0.34 to 0.76) | 294 (2) | ⊕⊕⊝⊝ | Measured as diarrhoea grade 2+ |
| Late: ‐ | Late: ‐ | not estimable | ‐ | ‐ | No data | |
| Diarrhoea (grade 2+) (during RT) | See evidence on acute toxicity (grade 2+) | ‐ | ||||
| QOL scores | ‐ | ‐ | not estimable | ‐ | ‐ | no data |
| *The basis for the assumed risk is the mean control group risk across studies. The corresponding risk (and its 95% confidence interval) is based on the assumed risk in the comparison group and the relative effect of the intervention (and its 95% CI). | ||||||
| GRADE Working Group grades of evidence | ||||||
| 1Downgraded for study design limitations (most weight derived from one study assessed as having a high risk of bias). | ||||||
| Transperineal hydrogel spacer/injection compared with no intervention to reduce adverse GI effects of radiotherapy | ||||||
| Patients/population: Men undergoing RT for prostate cancer Settings: Tertiary care Intervention: Transperineal hydrogel spacer/injection Comparison: No intervention | ||||||
| Outcomes | Illustrative comparative risks* (95% CI) | Relative effect | No of Participants | Quality/certainty of the evidence | Comments | |
|---|---|---|---|---|---|---|
| Assumed risk | Corresponding risk | |||||
| no intervention | hydrogel spacer | |||||
| Mean GI symptom scores | ‐ | ‐ | not estimable | ‐ | ‐ | No data available |
| Acute and late GI toxicity (grade 2+) | Acute (up to 3 months post‐RT): 65 per 1000 | Acute (up to 3 months post‐RT): 33 per 1000 (5 to 220) | RR 0.51 (0.08 to 3.38) | 289 (2) | ⊕⊕⊝⊝ | Events in these contributing studies were few |
| Late (up to 15 months post‐RT): 14 per 1000 | Late (up to 15 months post‐RT): 2 per 1000 (0 to 55) | RR 0.16 (0.01 to 3.96) | 220 (1) | ⊕⊕⊝⊝ | Events in this contributing study were few | |
| Late (median of 3 years): 67 per 1000 | Late (median of 3 years): 15 per 1000 (0 to 88) | RR 0.07 (0.00 to 1.31) | 139 (1) | ⊕⊕⊝⊝ | Events in this contributing study were few | |
| Diarrhoea (grade 2+) | ‐ | ‐ | not estimable | ‐ | ‐ | No data available |
| QOL scores | ‐ | ‐ | not estimable | ‐ | ‐ | Data could not be meta‐analysed, but findings from 2 studies suggested beneficial effects on bowel‐related QOL with the hydrogel spacer (see Effects of interventions section). |
| *The basis for the assumed risk is the mean control group risk across studies. The corresponding risk (and its 95% confidence interval) is based on the assumed risk in the comparison group and the relative effect of the intervention (and its 95% CI). | ||||||
| GRADE Working Group grades of evidence | ||||||
| 1Downgraded for study design limitations (contributing study judged to have unclear risk of bias). 2Downgraded for imprecision (very few events and wide CI crossing the line of no effect). | ||||||
| Endorectal balloon compared with no intervention to reduce adverse GI effects of radiotherapy | ||||||
| Patients/population: Men undergoing RT for prostate cancer Settings: Tertiary care Intervention: Endorectal balloon Comparison: No intervention | ||||||
| Outcomes | Illustrative comparative risks* (95% CI) | Relative effect | No of Participants | Quality/certainty of the evidence | Comments | |
|---|---|---|---|---|---|---|
| Assumed risk | Corresponding risk | |||||
| no intervention | endorectal balloon | |||||
| Mean GI symptom scores | ‐ | ‐ | not estimable | ‐ | ‐ | No data |
| Acute and late GI toxicity (grade 2+) | Acute (during RT): 292 per 1000 | Acute (during RT): 292 per 1000 (120 to 707) | RR 1.00 (0.41 to 2.42) | 48 (1) | ⊕⊝⊝⊝ | Evidence on acute grade 1+ GI toxicity was of low certainty and suggested little or no difference in acute toxicity with ERB (see Effects of interventions section) |
| Late (up to 1 year): 83 per 1000 | Late (up to 1 year): 17 per 1000 (1 to 329) | RR 0.20 (0.01 to 3.96) | 48 (1) | ⊕⊝⊝⊝ | Evidence on late grade 1+ toxicity was of low certainty and suggested a reduction in late toxicity with ERB (see Effects of interventions section) | |
| Diarrhoea (grade 2+) | Late (2 to 4 years): 565 per 1000 | Late (2 to 4 years): 401 per 1000 (209 to 723) | RR 0.71 (0.37 to 1.35) | 43 (1) | ⊕⊝⊝⊝ | ‐ |
| QOL scores | ‐ | ‐ | not estimable | ‐ | ‐ | No data |
| *The basis for the assumed risk is the mean control group risk across studies. The corresponding risk (and its 95% confidence interval) is based on the assumed risk in the comparison group and the relative effect of the intervention (and its 95% CI). | ||||||
| GRADE Working Group grades of evidence | ||||||
| 1Downgraded for study design limitations (contributing study judged to have unclear risk of bias). | ||||||
| Aminosalicylates compared with placebo administered prophylactically to reduce adverse GI effects of radiotherapy | ||||||
| Patient or population: People undergoing pelvic radiotherapy for urological, gynaecological or colorectal cancer Settings: Tertiary care Intervention: Aminosalicylates Comparison: Placebo | ||||||
| Outcomes | Illustrative comparative risks* (95% CI) | Relative effect | No of Participants | Quality/certainty of the evidence | Comments | |
|---|---|---|---|---|---|---|
| Assumed risk | Corresponding risk | |||||
| placebo | aminosalicylates | |||||
| Mean GI symptom scores (IBDQ‐B) | ‐ | ‐ | not estimable | ‐ | ‐ | No data |
| Acute and late GI toxicity (grade 2+) | Acute (during treatment) (mesalazine): 380 per 1000 | Acute (during treatment) (mesalazine): 388 (464 to 551) | RR 1.02 (1.22 to 1.45) | 143 | ⊕⊕⊕⊝ | Formulations appear to differ in effects on this outcome; therefore subgroup data were not pooled. The sulfasalazine findings were very inconsistent (I2 = 73%) across the 2 contributing studies, with the better‐quality study showing no reduction in acute toxicity |
| Acute (during treatment) (sulphasalazine): 447 per 1000 | Acute (during treatment) (sulphasalazine): 130 (49 to 335) | RR 0.29 (0.11 to 0.75) | 182 (2) | ⊕⊕⊝⊝ low1,2 | ||
| Late: ‐ | Late: ‐ | not estimable | ‐ | ‐ | No data | |
| Diarrhoea (grade 2+) | ‐ | ‐ | not pooled | ‐ | ‐ | As above, subgroup data were not pooled and findings were as follows:
Downgrading of these findings by 1 level was due to study design limitations (unclear risk of bias) in all subgroups, and also due to inconsistency for the sulfasalazine subgroup |
| QOL scores | ‐ | ‐ | not estimable | ‐ | ‐ | No data |
| *The basis for the assumed risk is the mean control group risk across studies. The corresponding risk (and its 95% confidence interval) is based on the assumed risk in the comparison group and the relative effect of the intervention (and its 95% CI). | ||||||
| GRADE Working Group grades of evidence | ||||||
| 1Downgraded for study design limitations (analysis included studies at an unclear risk of bias). 2Downgraded for inconsistency across studies (I2 > 60%). | ||||||
| Superoxide dismutase compared with no intervention to reduce adverse GI effects of radiotherapy | ||||||
| Patient or population: People with rectal cancer Settings: Tertiary care Intervention: Superoxide dismutase (IM) Comparison: No intervention | ||||||
| Outcomes | Illustrative comparative risks* (95% CI) | Relative effect | No of Participants | Quality/certainty of the evidence | Comments | |
|---|---|---|---|---|---|---|
| Assumed risk | Corresponding risk | |||||
| no intervention | superoxide dismutase | |||||
| Mean GI symptom scores | ‐ | ‐ | not estimable | ‐ | ‐ | No data |
| Acute and late GI toxicity (grade 2+) | Acute (3 months): 217 per 1000 | Acute (3 months): 43 per 1000 | RR 0.20 (0.05 to 0.86) | 92 | ⊕⊕⊝⊝ | ‐ |
| Late: (1 year): 135 per 1000 | Late (1 year): 12 per 1000 (1 to 209) | RR 0.09 (0.01 to 1.55) | 75 (1) | ⊕⊝⊝⊝ | ‐ | |
| Late (2 to 4 years): 193 per 1000 | Late (2 to 4 years): 12 per 1000 (0 to 225) | RR 0.06 (0.00 to 1.11) | 68 (1) | ⊕⊝⊝⊝ | ‐ | |
| Diarrhoea (grade 2+) | ‐ | ‐ | not estimable | ‐ | ‐ | No data |
| QOL scores | ‐ | ‐ | not estimable | ‐ | ‐ | No data |
| *The basis for the assumed risk is the mean control group risk across studies. The corresponding risk (and its 95% confidence interval) is based on the assumed risk in the comparison group and the relative effect of the intervention (and its 95% CI). | ||||||
| GRADE Working Group grades of evidence | ||||||
| 1Downgraded due to design limitations (study assessed as unclear risk of bias as it lacked methodological details). | ||||||
| Corticosteroid enema compared with placebo to reduce adverse GI effects of radiotherapy | ||||||
| Patients/population: Men with prostate cancer Settings: Tertiary care Intervention: Corticosteroid enema Comparison: Placebo | ||||||
| Outcomes | Illustrative comparative risks* (95% CI) | Relative effect | No of Participants | Quality/certainty of the evidence | Comments | |
|---|---|---|---|---|---|---|
| Assumed risk | Corresponding risk | |||||
| placebo | corticosteroid enema | |||||
| Mean GI symptom scores | ‐ | ‐ | not estimable | ‐ | ‐ | No data |
| Acute and late GI toxicity (grade 2+) | Acute (3 months): 619 per 1000 | Acute (3 months): 526 per 1000 | RR 0.85 (0.62 to 1.15) | 126 | ⊕⊝⊝⊝ | ‐ |
| Late: (1 year): 136 per 1000 | Late (1 year): 91 per 1000 (31 to 262) | RR0.67 (0.23 to 1.93) | 114 (1) | ⊕⊕⊝⊝ | ‐ | |
| Diarrhoea (grade 2+) | Acute: ‐ | Acute: ‐ | not estimable | ‐ | ‐ | No data |
| Late (1 year): 68 per 1000 | Late (1 year): 73 per 1000 (19 to 277) | RR1.07 (0.28 to 4.08) | 114 (1) | ⊕⊕⊝⊝ | ‐ | |
| QOL scores | ‐ | ‐ | not estimable | ‐ | ‐ | No data |
| *The basis for the assumed risk is the mean control group risk across studies. The corresponding risk (and its 95% confidence interval) is based on the assumed risk in the comparison group and the relative effect of the intervention (and its 95% CI). | ||||||
| GRADE Working Group grades of evidence | ||||||
| 1Downgraded due to design limitations (study assessed as unclear risk of bias as it lacked methodological details). | ||||||
| Sucralfate compared with placebo administered prophylactically to reduce adverse GI effects of radiotherapy | ||||||
| Patient or population: People undergoing pelvic radiotherapy for urological, gynaecological or colorectal cancer Settings: Tertiary care Intervention: Sucralfate Comparison: Placebo | ||||||
| Outcomes | Illustrative comparative risks* (95% CI) | Relative effect | No of Participants | Quality/certainty of the evidence | Comments | |
|---|---|---|---|---|---|---|
| Assumed risk | Corresponding risk | |||||
| placebo | sucralfate | |||||
| Mean GI symptom scores | ‐ | ‐ | not estimable | ‐ | ‐ | No data |
| Acute and late GI toxicity (grade 2+) [acute = during RT; late = 6 months post‐RT] | Acute (oral route): 398 per 1000 | Acute (oral route): 426 per 1000 (330 to 553) | RR 1.07 (0.83 to 1.39) | 335 (1) | ⊕⊕⊕⊝ | ‐ |
| Acute (rectal route): 524 per 1000 | Acute (rectal route): 618 per 1000 (456 to 838) | RR 1.18 (0.87 to 1.60) | 126 (1) | ⊕⊕⊝⊝ | ‐ | |
| Late (oral route): 284 per 1000 | Late (oral route): 216 per 1000 | RR 0.76 (0.51 to 1.14) | 298 | ⊕⊕⊕⊝ | No data on rectal route | |
| Diarrhoea (grade 2+) [during RT] | Acute (oral route): 490 per 1000 | Acute (oral route): 397 per 1000 | RR 0.81 (0.41 to 1.62 | )284 | ⊕⊕⊝⊝ | ‐ |
| Acute (rectal route): 357 per 1000 | Acute (rectal route): 293 per 1000 (143 to 546) | RR 0.82 (0.44 to 1.53) | 83 (1) | ⊕⊝⊝⊝ verylow1,2,4 | ‐ | |
| QOL scores | ‐ | ‐ | not estimable | ‐ | ‐ | No data |
| *The basis for the assumed risk is the mean control group risk across studies. The corresponding risk (and its 95% confidence interval) is based on the assumed risk in the comparison group and the relative effect of the intervention (and its 95% CI). | ||||||
| GRADE Working Group grades of evidence | ||||||
| 1Downgraded for imprecision (wide CI crossing the line of no effect). | ||||||
| Amifostine compared with no intervention to reduce adverse GI effects of radiotherapy | ||||||
| Patient or population: People with urological, gynaecological or colorectal cancer Settings: Tertiary care Intervention: Amifostine (subcutaneous or intravenously administered) Comparison: No intervention | ||||||
| Outcomes | Illustrative comparative risks* (95% CI) | Relative effect | No of Participants | Quality/certainty of the evidence | Comments | |
|---|---|---|---|---|---|---|
| Assumed risk | Corresponding risk | |||||
| no intervention | amifostine | |||||
| Mean GI symptom scores | ‐ | ‐ | not estimable | ‐ | ‐ | No data |
| Acute and late GI toxicity (grade 2+) | Acute (during RT): 398 per 1000 | Acute (during RT: 100 per 1000 | RR 0.25 0.15 to 0.42 | 278 | ⊕⊕⊝⊝ | ‐ |
| Acute (up to 3 months): 174 per 1000 | Acute (up to 3 months): 21 per 1000 (2 to 369) | RR 0.12 (0.01 to 2.12) | 44 (1) | ⊕⊝⊝⊝ | ‐ | |
| Late (up to 1 year): 59 per 1000 | Late (up to 1 year): 87 per 1000 (38 to 204) | RR 1.48 (0.64 to 3.45) | 249 (2) | ⊕⊕⊝⊝ | ‐ | |
| Diarrhoea (grade 2+) during treatment | Acute (during RT): 500 per 1000 | Acute (during RT):125 per 1000 | RR 0.25 (0.06 to 0.98) | 36 | ⊕⊝⊝⊝ | ‐ |
| QOL scores | ‐ | ‐ | not estimable | ‐ | ‐ | No data |
| *The basis for the assumed risk is the mean control group risk across studies. The corresponding risk (and its 95% confidence interval) is based on the assumed risk in the comparison group and the relative effect of the intervention (and its 95% CI). | ||||||
| GRADE Working Group grades of evidence | ||||||
| 1Downgraded twice due to design limitations (two studies that contribute >95% of the weight in the meta‐analysis were assessed as high risk of bias). | ||||||
| Sodium butyrate compared with placebo to reduce adverse GI effects of radiotherapy | ||||||
| Patients/population: Men undergoing RT for prostate cancer Settings: Tertiary care Intervention: Sodium butyrate enema Comparison: Placebo | ||||||
| Outcomes | Illustrative comparative risks* (95% CI) | Relative effect | No of Participants | Quality/certainty of the evidence | Comments | |
|---|---|---|---|---|---|---|
| Assumed risk | Corresponding risk | |||||
| placebo | sodium butyrate enema (2 g daily) | |||||
| Mean GI symptom scores | ‐ | ‐ | not estimable | ‐ | ‐ | No data |
| Acute and late GI toxicity (grade 2+) | Acute (during RT): 179 per 1000 | Acute (during RT): 163 per 1000 (74 to 354) | RR 0.91 (0.41 to 1.98) | 79 (1) | ⊕⊕⊕⊝ | ‐ |
| ‐ | ‐ | not estimable | ‐ | ‐ | No data | |
| Diarrhoea (grade 2+) | ‐ | ‐ | not estimable | ‐ | ‐ | No data |
| QOL scores | ‐ | ‐ | not estimable | ‐ | ‐ | No data |
| *The basis for the assumed risk is the mean control group risk across studies. The corresponding risk (and its 95% confidence interval) is based on the assumed risk in the comparison group and the relative effect of the intervention (and its 95% CI). | ||||||
| GRADE Working Group grades of evidence | ||||||
| 1Downgraded due to imprecision (wide CI crossing the line of no effect). We did not downgrade twice for imprecision as this evidence was from a good study evaluating three different doses of sodium butyrate (only the 2 g dose is represented here) and none of the doses showed a clear difference in effect. | ||||||
| Selenium compared with placebo to reduce adverse GI effects of radiotherapy | ||||||
| Patients/population: Women undergoing RT for gynecological cancer Settings: Tertiary care Intervention: Oral selenium Comparison: No intervention | ||||||
| Outcomes | Illustrative comparative risks* (95% CI) | Relative effect | No of Participants | Quality/certainty of the evidence | Comments | |
|---|---|---|---|---|---|---|
| Assumed risk | Corresponding risk | |||||
| placebo | oral selenium | |||||
| Mean GI symptom scores | ‐ | ‐ | not estimable | ‐ | ‐ | No data |
| Acute and late GI toxicity (grade 2+) | Acute: ‐ | ‐ | not estimable | ‐ | ‐ | No data |
| Late: ‐ | ‐ | not estimable | ‐ | ‐ | No data | |
| Diarrhoea (grade 2+) | Acute (during RT): 190 per 1000 | Acute (during RT): 76 per 1000 ( 23 to 268) | RR 0.40 0.12 to 1.41 | 81 (1) | ⊕⊕⊝⊝ | ‐ |
| QOL scores | ‐ | ‐ | not estimable | ‐ | ‐ | No data |
| *The basis for the assumed risk is the mean control group risk across studies. The corresponding risk (and its 95% confidence interval) is based on the assumed risk in the comparison group and the relative effect of the intervention (and its 95% CI). | ||||||
| GRADE Working Group grades of evidence | ||||||
| 1Downgraded due to design limitations (both studies at unclear risk of bias). 2Downgraded due to imprecision (wide CI crossing the line of no effect). | ||||||
| Bile acid sequestrants compared with placebo to reduce adverse GI effects of radiotherapy | ||||||
| Patients/population: People with pelvic cancer Settings: Tertiary care Intervention: Bile acid sequestrants Comparison: Placebo | ||||||
| Outcomes | Illustrative comparative risks* (95% CI) | Relative effect | No of Participants | Quality/certainty of the evidence | Comments | |
|---|---|---|---|---|---|---|
| Assumed risk | Corresponding risk | |||||
| placebo | bile acid sequestrants | |||||
| Mean GI symptom scores (during RT) | The mean (diarrhoea) score in the single study evaluating this outcome was 1.5 | Corresponding mean score of 2 (1.5 to 2.5) | MD 0.50 (‐0.00 to 1.00) | 33 (1) | ⊕⊝⊝⊝ | ‐ |
| Acute and late GI toxicity (grade 2+) | Acute (during RT): 125 per 1000 | Acute (during RT): 530 per 1000 (134 to 1000) | RR 4.24 (1.07 to 16.70) | 33 | ⊕⊕⊝⊝ | Findings suggest potential for harm |
| ‐ | ‐ | not estimable | ‐ | ‐ | No data | |
| Diarrhoea (grade 2+) | Acute (during RT: 125 per 1000 | Acute (during RT): 353 per 1000 (83 to 1000) | RR 2.82 (0.66 to 12.01) | 33 (1) | ⊕⊝⊝⊝ | ‐ |
| QOL scores | ‐ | ‐ | not estimable | ‐ | ‐ | No data |
| *The basis for the assumed risk is the mean control group risk across studies. The corresponding risk (and its 95% confidence interval) is based on the assumed risk in the comparison group and the relative effect of the intervention (and its 95% CI). | ||||||
| GRADE Working Group grades of evidence | ||||||
| 1Downgraded due to design limitations (study had unclear risk of bias overall and unvalidated diarrhoea symptom scale was used for this outcome). | ||||||
| Misoprostol compared with placebo to reduce adverse GI effects of radiotherapy | ||||||
| Patients/population: Men with prostate cancer Settings: Tertiary care Intervention: Misoprostol suppository Comparison: Placebo | ||||||
| Outcomes1 | Illustrative comparative risks* (95% CI) | Relative effect | No of Participants | Quality/certainty of the evidence | Comments | |
|---|---|---|---|---|---|---|
| Assumed risk | Corresponding risk | |||||
| placebo | misoprostol suppository | |||||
| Mean GI symptom scores | ‐ | ‐ | not estimable | ‐ | ‐ | No data |
| Acute and late GI toxicity (grade 2+) | Acute (during RT): 217 per 1000 | Acute (during RT): 340 per 1000 (165 to 545) | RR 1.38 (0.76 to 2.51) | 100 | ⊕⊕⊝⊝ | See footnote 1 below |
| Late: ‐ | Late: ‐ | not estimable | ‐ | ‐ | No data | |
| Diarrhoea (grade 2+) | Acute (during RT): 217 per 1000 | Acute (during RT): 217 per 1000 (100 to 475) | RR 1.00 (0.46 to 2.19) | 100 (1) | ⊕⊝⊝⊝ | Late effects on diarrhoea at 1+ years post‐RT were also reported in this single study and the evidence was also of a very low certainty, mainly due to few events |
| QOL scores | ‐ | ‐ | not estimable | ‐ | ‐ | No data |
| *The basis for the assumed risk is the mean control group risk across studies. The corresponding risk (and its 95% confidence interval) is based on the assumed risk in the comparison group and the relative effect of the intervention (and its 95% CI). | ||||||
| GRADE Working Group grades of evidence | ||||||
| 1Also see Effects of interventions section for findings on rectal bleeding, which suggest the potential for harm with this intervention. | ||||||
| Magnsium oxide compared with placebo to reduce adverse GI effects of radiotherapy | ||||||
| Patients/population: Men with prostate cancer Settings: Tertiary care Intervention: Oral magnesium oxide Comparison: Placebo | ||||||
| Outcomes | Illustrative comparative risks* (95% CI) | Relative effect | No of Participants | Quality/certainty of the evidence | Comments | |
|---|---|---|---|---|---|---|
| Assumed risk | Corresponding risk | |||||
| placebo | magnesium oxide | |||||
| Mean GI symptom scores (during RT) | ‐ | ‐ | not estimable | ‐ | ‐ | No data |
| Acute and late GI toxicity (grade 2+) | Acute (during RT): 217 per 1000 | Acute (during RT): 369 per 1000 (189 to 718) | RR 1.70 (0.87 to 3.31) | 92 | ⊕⊕⊕⊝ | Findings indicate potential for harm |
| ‐ | ‐ | not estimable | ‐ | ‐ | No data | |
| Diarrhoea (grade 2+) | ‐ | ‐ | not estimable | ‐ | ‐ | No data |
| QOL scores | ‐ | ‐ | not estimable | ‐ | ‐ | No data for meta‐analysis. The only included study presents these data graphically and concludes that there was "a trend to worsened quality of life" in the magnesium oxide arm |
| *The basis for the assumed risk is the mean control group risk across studies. The corresponding risk (and its 95% confidence interval) is based on the assumed risk in the comparison group and the relative effect of the intervention (and its 95% CI). | ||||||
| GRADE Working Group grades of evidence | ||||||
| 1Downgraded due to imprecision (wide CI crossing the line of no effect). | ||||||
| Octreotide compared with placebo to reduce adverse GI effects of radiotherapy | ||||||
| Patients/population: People undergoing RT for pelvic cancer Settings: Tertiary care Intervention: Octreotide injection Comparison: Placebo | ||||||
| Outcomes1 | Illustrative comparative risks* (95% CI) | Relative effect | No of Participants | Quality/certainty of the evidence | Comments | |
|---|---|---|---|---|---|---|
| Assumed risk | Corresponding risk | |||||
| placebo | octreotide injection | |||||
| Mean GI symptom scores | ‐ | ‐ | not estimable | ‐ | ‐ | No data |
| Acute and late GI toxicity (grade 2+) | Acute: ‐ | ‐ | not estimable | ‐ | ‐ | No data |
| Late: ‐ | ‐ | not estimable | ‐ | ‐ | No data | |
| Diarrhoea (grade 2+) | Acute (during RT): 491 per 1000 | Acute (during RT): 496 per 1000 (373 to 663) | RR 1.01 (0.76 to 1.35) | 340 (2) | ⊕⊕⊕⊝ | ‐ |
| QOL scores | ‐ | ‐ | not estimable | ‐ | ‐ | No data |
| *The basis for the assumed risk is the mean control group risk across studies. The corresponding risk (and its 95% confidence interval) is based on the assumed risk in the comparison group and the relative effect of the intervention (and its 95% CI). | ||||||
| GRADE Working Group grades of evidence | ||||||
| 1Also see Effects of interventions section for findings on rectal bleeding, which suggest the potential for harm with this intervention. 2Downgraded due to design limitations (both studies at unclear risk of bias). | ||||||
| Diet interventions compared with usual practice to reduce adverse GI effects of radiotherapy | ||||||
| Patient or population: People undergoing pelvic radiotherapy for urological, gynaecological or colorectal cancer Settings: Tertiary care Intervention: Dietary intervention Comparison: Control (usual on‐treatment diet) | ||||||
| Outcomes | Illustrative comparative risks* (95% CI) | Relative effect | No of Participants | Quality/certainty of the evidence | Comments | |
|---|---|---|---|---|---|---|
| Assumed risk | Corresponding risk | |||||
| control | diet | |||||
| Elemental diet | ||||||
| Mean GI symptom scores (IBDQ‐B) (higher scores better) | Acute (during RT): median score 60 (35 ‐ 69) Acute effect (3 months post RT): median score 69 (34 ‐ 70) | Acute (during RT): median score 57 (23‐66) Acute effect (3 months post‐RT): median score 68 (42 ‐ 70) | not estimable | 50 | ⊕⊕⊝⊝ | There was poor compliance in this study and only a third of daily calories substituted with elemental diet |
| Acute and late GI toxicity (grade 2+) | Acute: ‐ | Acute: ‐ | not estimable | ‐ | ‐ | No data |
| Late: ‐ | Late: ‐ | not estimable | ‐ | ‐ | No data | |
| Diarrhoea (grade 2+) | Acute (during RT): 560 per 1000 | Acute (during RT): 442 per 1000 (252 to 773) | RR 0.79 (0.45 to 1.38) | 50 | ⊕⊕⊝⊝ | ‐ |
| QOL scores (IBDQ) (higher scores better) | During RT the mean QOL score in the control group was 186.4 | During RT the mean QOL score in the diet group 4.6 points higher (12.4 points lower to 21.6 points higher) | MD 4.60 (‐12.40 to 21.60) | 50 | ⊕⊕⊝⊝ | ‐ |
| Lactose‐restricted diet | ||||||
| Mean GI symptom scores (IBDQ‐B) (higher scores better) | ‐ | ‐ | not estimable | ‐ | ‐ | No data |
| Acute and late GI toxicity (grade 2+) | Acute: ‐ | Acute: ‐ | not estimable | ‐ | ‐ | No data |
| Late: ‐ | Late: ‐ | not estimable | ‐ | ‐ | No data | |
| Diarrhoea (grade 1+) | Acute (during RT): 397 per 1000 | Acute (during RT): 294 per 1000 (179 to 488) | RR 0.74 (0.45 to 1.23) | 119 (1) | ⊕⊕⊝⊝ | This study intervention included low insoluble fibre. No grade 2+ events occurred. |
| QOL scores (QLQ‐PR25) | ‐ | ‐ | not estimable | 119 (1) | ‐ | In 1 study, QOL was reported for many time points and domains up to 24 months post‐RT and study authors found little difference between study arms at any time point evaluated; however, these data could not be extracted and analysed for review purposes in a meaningful way |
| High‐fibre diet | ||||||
| Mean GI symptom scores (IBDQ‐B) (higher scores better) | Acute (at end of RT): The mean IBDQ‐B score in the control group was 48.7 | Acute: At the end of RT, the mean IBDQ‐B score in the diet group was 2.80 points higher (from 1.81 points lower to 7.41 points higher) | MD 2.80 (‐1.81 to 7.41) | 108 (1) | ⊕⊕⊝⊝ | Mean change in GI symptom scores from baseline to end of RT was also reported in 1 study (Wedlake 2017) and the evidence suggests that the change in IBDQ‐B scores from baseline may be reduced with a high‐fibre diet (see Results section) |
| Late (at 1 year post‐RT): At 1 year post‐RT, the mean IBDQ‐B score was 55.7 | At 1 year post‐RT, the mean IBDQ‐B score in the diet group was 6.1 points higher (1.71 to 10.49 points higher) | MD 6.10 (1.71 to 10.49) | 108 (1) | ⊕⊕⊝⊝ | As above, findings on mean change in GI symptom scores from 1 study suggests that IBDQ‐B scores are less likely to be reduced at 1 year post‐RT from baseline with a high‐fibre diet than with a usual diet (see Results section). | |
| Acute and late GI toxicity (grade 2+) | ‐ | ‐ | not estimable | ‐ | ‐ | No data |
| Diarrhoea (grade 2+) | Acute (during RT): 540 per 1000 | Acute (during RT): 351 per 1000 (205 to 594 ) | RR 0.65 (0.38 to 1.10; participants) | 74 (2) | ⊕⊕⊝⊝ | ‐ |
| QOL scores (IBDQ) (higher scores better) | During RT the mean QOL score in the control group was 162 | During RT, the mean QOL score in the diet group was 6.5 points higher (6 lower to 19 higher) | MD 6.50 (‐5.88 to 18.88) | 108 (1) | ⊕⊕⊝⊝ | ‐ |
| At 1 year post‐RT the mean QOL score was 173 | At 1 year post‐RT, the mean QOL score in the diet group was 20.5 points higher (10 to 31 higher) | MD 20.50 (9.97 to 31.03) | 108 (1) | ⊕⊕⊝⊝ | ‐ | |
| Low‐fibre diet | ||||||
| Mean GI symptom scores (IBDQ‐B) (higher scores better) | Acute (at end of RT): The mean IBDQ‐B score in the control group was 48.7 | At the end of RT, the mean IBDQ‐B score in the diet group was 3.5 points higher (from 0.93 points lower to 7.93 points higher) | MD 3.50 (‐0.93 to 7.93) | 107 (1) | ⊕⊕⊝⊝ | Mean change in GI symptom scores from baseline to end of RT was also reported in 1 study (Wedlake 2017) and findings suggest that there may be little or no difference between diet and control groups (see Results section) |
| Late (at 1 year post RT): At 1 year post RT, the mean IBDQ‐B score was 55.7 | At 1 year post‐RT, the mean IBDQ‐B score in the diet group was 3.30 points higher (from 0.94 points lower to 7.54 points higher) | MD 3.30 (‐0.94 to 7.54) | 107 (1) | ⊕⊕⊝⊝ | As above, mean change in GI symptom scores from baseline to 1 year post‐RT was also reported in one study (Wedlake 2017) and findings suggest that there may be little or no difference between diet and control groups (see Results section) | |
| Acute and late GI toxicity (grade 2+) | ‐ | ‐ | not estimable | ‐ | ‐ | No data |
| Diarrhoea (grade 1+) | Acute (during RT): 397 per 1000 | Acute (during RT): 294 per 1000 (179 to 488) | RR 0.74 (0.45 to 1.23) | 119 (1) | ⊕⊕⊝⊝ | This study intervention included lactose‐restriction |
| QOL scores (IBDQ) (higher scores better) | Acute (during RT): During RT the mean QOL score in the control group was 161.5 | Acute (during RT): During RT, the mean QOL score in the diet group was 9.80 points higher (1.91 lower to 21.51 points higher) | MD 9.80 (‐1.91 to 21.51) | 107 (1) | ⊕⊕⊝⊝ | ‐ |
| Late (1 year post‐RT): At 6 months post‐RT, the mean QOL score in the control group was 173.6 | Late: At 1 year post‐RT, the mean QOL score in the diet group was 9.4 points higher (1.78 lower to 20.58 points higher) | MD 9.40 (‐1.78 to 20.58) | 107 (1) | ⊕⊕⊝⊝ | ‐ | |
| Low‐fat diet | ||||||
| Mean GI symptom scores (Vaizey scale) (higher scores better) | Acute: During RT the mean GI symptom score in the control group was 4.6 | Acute: During RT, the mean GI symptom score in the diet group was 4.4 (2.4 to 6.5) | MD ‐0.20 (‐2.29 to 1.89) | 70 (1) | ⊕⊕⊝⊝ | ‐ |
| Acute and late GI toxicity (grade 2+) | 436 per 1000 | 50 per 1000 (310 to 802) | RR 1.15 (0.71 to 1.84) | 79 (1) | ⊕⊕⊝⊝ | ‐ |
| Diarrhoea | ‐ | ‐ | not estimable | ‐ | ‐ | No data |
| QOL scores (IBDQ) | During RT the mean QOL score in the control group was 187 | During RT, the mean QOL score in the diet group was 189 (177 to 201) | MD 2.40 (‐9.52 to 14.32) | 76 (1) | ⊕⊕⊝⊝ | ‐ |
| Prebiotic diet | ||||||
| Mean GI symptom scores (IBDQ‐B) (higher scores better) | ‐ | ‐ | not estimable | ‐ | ‐ | No data |
| Acute and late GI toxicity (grade 2+) | ‐ | ‐ | not estimable | ‐ | ‐ | No data |
| Diarrhoea | ‐ | ‐ | not estimable | ‐ | ‐ | No data |
| QOL scores (IBDQ) | ‐ | ‐ | not estimable | ‐ | ‐ | No data |
| *The basis for the assumed risk is the mean control group risk across studies. The corresponding risk (and its 95% confidence interval) is based on the assumed risk in the comparison group and the relative effect of the intervention (and its 95% CI). | ||||||
| GRADE Working Group grades of evidence | ||||||
| 1Downgraded ‐1 for design limitations (risk of bias due to poor compliance) and ‐1 for indirectness (intervention involved substituting a third of calories instead of 100%, which might have a different effect on outcomes). 2Downgraded ‐1 for design limitations (risk of bias) and ‐1 imprecision (wide CI crosses the line of no effect). 3Downgraded ‐1 for indirectness (dietary intervention involved both lactose‐restriction and low insoluble fibre) and ‐1 for imprecision (wide CI crosses the line of no effect). 4Downgraded for design limitations and imprecision. 5Downgraded ‐2 for design limitations (no assessor blinding for this outcome and potential risk of performance bias). | ||||||
| Protein supplements compared with no intervention to reduce adverse GI effects of radiotherapy | ||||||
| Patients/population: Individuals undergoing RT for pelvic cancer Settings: Tertiary care Intervention: Protein supplements Comparison: No intervention | ||||||
| Outcomes | Illustrative comparative risks* (95% CI) | Relative effect | No of Participants | Quality/certainty of the evidence | Comments | |
|---|---|---|---|---|---|---|
| Assumed risk | Corresponding risk | |||||
| no intervention | protein supplements | |||||
| Mean GI symptom scores (lower is better) | ‐ | ‐ | not estimable | ‐ | ‐ | Data were insufficient for meta‐analysis. However, diarrhoea scores significantly deteriorated from baseline to end of RT in both the protein supplement and the control groups, and mean diarrhoea scores (without standard deviations) were similar at 3‐month follow‐up |
| Acute and late GI toxicity (grade 2+) | Acute: ‐ | Acute: ‐ | not estimable | ‐ | ‐ | See evidence on diarrhoea |
| Late: ‐ | Late: ‐ | not estimable | ‐ | ‐ | See evidence on diarrhoea | |
| Diarrhoea (grade 2+) | Acute (end of RT): 459 per 1000 | Acute (end of RT): 243 per 1000 (124 to 473) | RR 0.53 (0.27 to 1.03) | 74 (1) | ⊕⊝⊝⊝ | ‐ |
| Acute (3 months post‐RT): 351 per 1000 | Acute (3 months post‐RT): 14 per 1000 (0 to 211) | RR 0.23 (0.07 to 0.74) | 74 (1) | ⊕⊕⊝⊝ | ‐ | |
| Late (5 years post‐RT): 296 per 1000 | Late (5 years post‐RT):15 per 1000 (0 to 231) | RR 0.60 (0.23 to 1.51) | 61 (1) | ⊕⊝⊝⊝ | ‐ | |
| QOL scores | ‐ | ‐ | not estimable | ‐ | ‐ | Data were insufficient for meta‐analysis. However, mean global QOL scores (without standard deviations) were reported to be significantly different (better) compared with baseline scores in the protein supplement group at the end or RT and at 3 months post‐RT, but were significantly worse than baseline scores at these time points in the control group |
| *The basis for the assumed risk is the mean control group risk across studies. The corresponding risk (and its 95% confidence interval) is based on the assumed risk in the comparison group and the relative effect of the intervention (and its 95% CI). | ||||||
| GRADE Working Group grades of evidence | ||||||
| 1Downgraded due to design limitations (control group received no intervention). 2Downgraded due to imprecision (small study with few events). 3Downgraded due to imprecision (wide CI crossing the line of no effect). | ||||||
| Probiotics compared with no probiotics to reduce adverse GI effects of radiotherapy | ||||||
| Patients/population: People undergoing RT for pelvic cancer Settings: Tertiary care Intervention: probiotics Comparison: placebo or no intervention | ||||||
| Outcomes | Illustrative comparative risks* (95% CI) | Relative effect | No of Participants | Quality/certainty of the evidence | Comments | |
|---|---|---|---|---|---|---|
| Assumed risk | Corresponding risk | |||||
| placebo or no intervention | probiotics | |||||
| Mean GI symptom scores | ‐ | ‐ | not estimable | ‐ | ‐ | No data |
| Acute and late GI toxicity (grade 2+) | Acute: ‐ | Acute: ‐ | not estimable | ‐ | ‐ | No data |
| Late: ‐ | Late: ‐ | not estimable | ‐ | ‐ | No data | |
| Diarrhoea (grade 2+) | Acute (during RT): 440 per 1000 | Acute (during RT): 194 per 1000 (92 to 414) | RR 0.43 (0.22 to 0.82) | 923 (5) | ⊕⊕⊝⊝ | |
| QOL scores | ‐ | ‐ | not estimable | ‐ | ‐ | Very limited narrative data available; see Effects of interventions section. |
| *The basis for the assumed risk is the mean control group risk across studies. The corresponding risk (and its 95% confidence interval) is based on the assumed risk in the comparison group and the relative effect of the intervention (and its 95% CI). | ||||||
| GRADE Working Group grades of evidence | ||||||
| 1Downgraded due to design limitations (4 studies assessed as having unclear risk of bias, and one study assessed as having high risk of bias overall). | ||||||
| Proteolytic enzymes compared with control to reduce adverse GI effects of radiotherapy | ||||||
| Patients/population: People undergoing RT for pelvic cancer Settings: Tertiary care Intervention: Proteolytic enzymes Comparison: Placebo or no intervention | ||||||
| Outcomes | Illustrative comparative risks* (95% CI) | Relative effect | No of Participants | Quality/certainty of the evidence | Comments | |
|---|---|---|---|---|---|---|
| Assumed risk | Corresponding risk | |||||
| placebo or no intervention | proteolytic enzymes | |||||
| Mean GI symptom scores | ‐ | ‐ | not estimable | ‐ | ‐ | No data |
| Acute and late GI toxicity (grade 2+) | Acute (3 months post‐RT): 367 per 1000 | Acute (3 months post RT): 165 per 1000 (88 to 323) | RR 0.45 (0.24 to 0.88) | 120 (1) | ⊕⊕⊝⊝ | When grade 1 data were included, the evidence suggested that there may be little or no difference in acute toxicity. |
| Late: ‐ | Late: ‐ | not estimable | ‐ | ‐ | No data | |
| Diarrhoea (grade 2+) | Acute (during RT): 357 per 1000 | Acute (during RT): 571 per 1000 (317 to 1000) | RR 1.60 (0.89 to 2.89) | 56 (1) | ⊕⊝⊝⊝ | This study also reported that more participants in the proteolytic enzyme group required medication for diarrhoea symptom control (see Effects of interventions section) |
| QOL scores | ‐ | ‐ | not estimable | ‐ | ‐ | No data |
| *The basis for the assumed risk is the mean control group risk across studies. The corresponding risk (and its 95% confidence interval) is based on the assumed risk in the comparison group and the relative effect of the intervention (and its 95% CI). | ||||||
| GRADE Working Group grades of evidence | ||||||
| 1Downgraded ‐2 due to design limitations (only one contributing study assessed as having high risk of bias). | ||||||
| Glutamine compared with placebo to reduce adverse GI effects of radiotherapy | ||||||
| Patients/population: People undergoing RT for pelvic cancer Settings: Tertiary care Intervention: Oral glutamine Comparison: Placebo | ||||||
| Outcomes | Illustrative comparative risks* (95% CI) | Relative effect | No of Participants | Quality/certainty of the evidence | Comments | |
|---|---|---|---|---|---|---|
| Assumed risk | Corresponding risk | |||||
| placebo | glutamine | |||||
| Mean GI symptom scores | ‐ | ‐ | not estimable | ‐ | ‐ | No data |
| Acute and late GI toxicity (grade 2+) | Acute (during RT): 86 per 1000 | Acute (during RT): 206 per 1000 (58 to 734) | RR 2.40 (0.68 to 8.53) | 69 (1) | ⊕⊕⊝⊝ | ‐ |
| Late (1 year): 74 per 1000 | Late (1 year): 334 per 1000 (17 to 1000) | RR 4.52 (0.23 to 90.08) | 57 (1) | ⊕⊕⊝⊝ | ‐ | |
| Diarrhoea (grade 2+) | Acute (during RT): 500 per 1000 | Acute (during RT): 495 per 1000 (395 to 625) | RR 0.98 (0.78 to 1.24) | 289 (4) | ⊕⊕⊕⊕ | We did not downgrade this evidence for design limitations as the findings of the studies with unclear risk of bias were consistent with the low risk of bias study and did not show benefit in favour of the intervention |
| QOL scores | ‐ | ‐ | not estimable | ‐ | ‐ | 1 study reported that median QOL scores were similar for glutamine and placebo groups at 12 months and 24 months; however these data were not in a usable form for meta‐analysis |
| *The basis for the assumed risk is the mean control group risk across studies. The corresponding risk (and its 95% confidence interval) is based on the assumed risk in the comparison group and the relative effect of the intervention (and its 95% CI). | ||||||
| GRADE Working Group grades of evidence | ||||||
| 1Downgraded ‐2 for imprecision (small study with few events, and wide CI crossing the line of no effect). | ||||||
| Counselling compared with no intervention to reduce adverse GI effects of radiotherapy | ||||||
| Patients/population: Individuals undergoing RT for pelvic cancer Settings: Tertiary care Intervention: Dietary or other counselling Comparison: No intervention | ||||||
| Outcomes | Illustrative comparative risks* (95% CI) | Relative effect | No of Participants | Quality/certainty of the evidence | Comments | |
|---|---|---|---|---|---|---|
| Assumed risk | Corresponding risk | |||||
| no intervention | counselling | |||||
| Mean GI symptom scores (lower is better) | At 3 months post‐RT, the mean GI symptom score (diarrhoea) in the control group was 1.6 | At 3 months post‐RT, the mean GI symptom score (diarrhoea) in the control group was 1.68 (1.22 to 2.14) | MD 0.08 (‐0.38 to 0.54) | 152 (1) | ⊕⊕⊝⊝ | ‐ |
| Acute and late GI toxicity (grade 2+) | Acute: ‐ | Acute: ‐ | not estimable | ‐ | ‐ | See evidence on diarrhoea |
| Late: ‐ | Late: ‐ | not estimable | ‐ | ‐ | See evidence on diarrhoea | |
| Diarrhoea (grade 2+) | Acute (end of RT): 459 per 1000 | 55 per 1000 (14 to 165) | RR 0.12 (0.03 to 0.47) | 74 (1) | ⊕⊕⊝⊝ | ‐ |
| Acute (3 months post‐RT): 351 per 1000 | 14 per 1000 (0 to 211) | RR 0.04 (0.00 to 0.60) | 74 (1) | ⊕⊕⊝⊝ | ‐ | |
| Late (5 years post‐RT): 296 per 1000 | 15 per 1000 (0 to 231) | RR 0.05 (0.00 to 0.78) | 61 (1) | ⊕⊕⊝⊝ | ‐ | |
| QOL scores (5‐point VAS; lower is better) | At 3 months post‐RT, the mean QOL (fatigue) score in the control group was 2.17 | At 3 months post‐RT, the mean QOL (fatigue) score in the control group was 1.76 (1.37 to 2.18) | MD ‐0.41 (‐0.83 to 0.01) | 152 (1) | ⊕⊝⊝⊝ | In another included study with no usable data for meta‐analysis, authors reported that, "at 3 months GI [counselling group] patients maintained/improved function, symptoms and single‐item scores (P<0.02)" compared with baseline scores, whereas "QOL remained as poor as after radiotherapy" in the control group |
| At 3 months post RT, the mean QOL (sleeping problem) score in the control group was 1.04 | At 3 months post RT, the mean QOL (sleeping problem) score in the control group was 0.58 (0.15 to 1.01) | MD ‐0.46 (‐0.89 to ‐0.03) | 152 (1) | ⊕⊕⊝⊝ | ||
| *The basis for the assumed risk is the mean control group risk across studies. The corresponding risk (and its 95% confidence interval) is based on the assumed risk in the comparison group and the relative effect of the intervention (and its 95% CI). | ||||||
| GRADE Working Group grades of evidence | ||||||
| 1Downgraded due to imprecision (small study; continuous data). | ||||||
| Common gastrointestinal toxicity scoring systems | ||||
|---|---|---|---|---|
| Grade 1 | Grade 2 | Grade 3 | Grade 4 | |
| EORTC/RTOG small/large intestine: acute morbidity | Increased frequency or change in quality of bowel habits not requiring medication / rectal discomfort not requiring analgesics | Diarrhoea requiring medication / mucous discharge not necessitating sanitary pads / rectal or abdominal pain requiring analgesics | Diarrhoea requiring parenteral support / severe mucous or blood discharge necessitating sanitary pads / abdominal distention (flat plate radiograph demonstrates distended bowel loops) | Acute or subacute obstruction, fistula or perforation; GI bleeding requiring transfusion; abdominal pain or tenesmus requiring tube decompression or bowel diversion |
| EORTC/RTOG small/large intestine: late morbidity | ‐ Mild diarrhoea ‐ Mild cramping ‐ Bowel movement 5 times daily ‐ Slight rectal discharge or bleeding | ‐ Moderate diarrhoea and colic ‐ Bowel movement > 5 times daily ‐ Excessive rectal mucus or intermittent bleeding | Obstruction or bleeding requiring surgery | Necrosis / Perforation Fistula |
| CTCAE version 4.0 (diarrhoea) | Increase of < 4 stools a day over baseline | Increase of 4 ‐ 6 stools per day over baseline | Increase of ≥ 7 stools a day over baseline; incontinence; hospitalisation indicated | Life‐threatening consequences; urgent intervention indicated |
| CTCAE version 4.0 (rectal bleeding) | Mild; intervention not indicated | Moderate symptoms; medical intervention or minor cauterisation indicated | Transfusion, radiologic, endoscopic, or elective operative intervention indicated | Life‐threatening consequences; urgent intervention indicated |
| Grade 0 = no symptoms; Grade 5 = death. Toxicity grade should reflect the most severe symptoms occurring during a period of evaluation. Abbreviations: EORTC = European Organisation for Research and Treatment of Cancer; RTOG = Radiation Treatment Oncology Group; CTCAE = Common Terminology Criteria for Adverse Events For more details, refer to www.rtog.org/ResearchAssociates/AdverseEventReporting/ (accessed 03/02/2017) and Cox 1995. | ||||
| Study ID | Intervention (I) | Comparator (C) | Participants | Cancer type | Primary or adjuvant radiotherapy | Findings | Risk of bias judgement (study limitations) | Study conclusions | Reviewer comments | |
|---|---|---|---|---|---|---|---|---|---|---|
| Acute gastrointestinal toxicity | Late gastrointestinal toxicity | |||||||||
| Pharmacological interventions | ||||||||||
| smectite | placebo | 176 men and women | mainly pelvic, plus some abdominal cancers | primary and adjuvant | NR Reported time to development of diarrhoea | NR | Unclear risk | "Prophylactic smectite can delay the development of RT‐induced diarrhoea. A statistical significance could not be verified..." | No usable data for review purposes | |
| tropisetron (oral) | placebo | 33 men and women | various pelvic | primary | 5/? vs 4/? No difference in number of bowel actions | NR | High risk | Tropisetron showed no anti‐diarrhoeal effect | Poorly‐reported study that suggests no benefit | |
| simethicone (oral) | placebo | 78 men | prostate | primary | NR | NR | Unclear risk | "standardized bowel preparation education alone may be sufficient to limit the variation in rectal size over a course of radiation treatment." | GI toxicity was not reported by study arm in this conference abstract, but authors noted no benefits with this anti‐flatulence treatment | |
| famotidine (oral) | placebo | 36 men | prostate | primary | G2+ GI toxicity 2/16 (I) and 10/18 (C) | NR | Unclear risk | "We demonstrated that famotidine significantly reduces radiation‐induced injury on rectal mucosa..." Famotidine inhibits gastric acid secretion and is a powerful free radical scavenger. | Pilot study ‐ more research needed | |
| ibuprofen (oral) | no intervention | 31 women/1 man | gynaecological/prostate | primary | NR Reported no. of participants reporting 4 or more stools a day at least once: 10/17 (I) vs 8/15 (C) Vomiting: 0/17 (I) vs 4/15 (C) | NR | High risk | "The incidence and severity of diarrhoea was the same." "Prophylactic ibuprofen may be beneficial in reducing the severity of nausea and preventing radiation‐induced vomiting..." | Older study with very uncertain evidence and applicability | |
| Non‐pharmacological interventions | ||||||||||
| soy diet | regular diet | 42 men (26 analysed) | prostate | primary | cramping or diarrhoea: 2/13 (I) vs 1/13 (C) pain with bowel movements: 1/13 (I) vs 0/13 (C) | cramping or diarrhoea: 1/13 (I) vs 3/13 (C) pain with bowel movements: 1/13 (I) vs 2/13 (C) | High risk | Soy isoflavones might reduce GI and other radiation‐induced toxicity | High attrition was a problem in this underpowered study, so findings are inconclusive/very uncertain | |
| steady diet | control (exclusion diet) | 29 | rectal | primary | NR | NR | High risk | "control group showed a significant increase in incidence and grade of acute diarrhoea > G2 at end of treatment" | Available as abstract only with scant details of the intervention and data | |
| green tea (oral tablet) | placebo | 23 men and 19 women | various pelvic | primary and adjuvant | G1+ diarrhoea: 7/21 (I) vs 12/21 (C) | NR | High risk | "Green tea...could be effective in decreasing the frequency and severity of radiotherapy induced diarrhoea" | Underpowered study, so findings are inconclusive/very uncertain ‐ more research needed | |
| curcumin (oral tablet) | placebo | 40 men | prostate | primary | Mean GI symptom score: 25 (12.4) (I) vs 20.0 (18.0) (C) | NR | High risk | Curcumin "could not reduce the severity of bowel symptoms" but "could confer radioprotective effect...through reducing severity of radiotherapy related urinary symptoms" | Underpowered study, so findings are inconclusive/very uncertain ‐ more research needed | |
| Other aspects of radiotherapy delivery | ||||||||||
| belly board | standard practice | 30 | rectal | NR | Poorly‐reported toxicity data could not be extracted according to treatment arms | NR | High risk | "Set‐up reproducibility, small bowel V15, patient comfort and satisfaction were all significantly improved by the use of the Belly Board" | Interim analysis with serious design limitations | |
| proton technique | carbon ion technique | 92 men | prostate | primary | G2+ diarrhoea occurred in 4/46 (I) vs 0/45 (C) participants, respectively. 2 participants in the proton arm developed G3 rectal fistulas | NR | Unclear risk | Authors attributed the fistulas to the use of spacer gel, which they have stopped using. Diarrhoea scores and bowel symptoms tended to be worse in the proton arm than the carbon ion arm at end of treatment, 6 weeks and 6‐month assessments. Authors concluded that hypofractionation with "either carbon ions or protons results in comparable acute toxicities and QoL parameters." | More evidence is needed | |
| patient table | standard practice | 183 women | cervix | NR | G2+ "stool frequency" during RT occurred in 7/90 (I) and 34/93 (C) participants; 8/90 (I) vs 39/93 (C) required anti‐diarrhoeal medication; G2+ cramping occurred in 4/90 (I) vs 32/93 (C) | NR | High risk | "Use of the unique patient‐table led to protection of the small bowel during radiotherapy for uterine malignancies..." | Serious study design limitations undermine the usefulness of these findings | |
| HBOT** | no HBOT | 65 women | cervix | NR | Change from baseline in LENT‐SOMA scores were reported but data were not usable (reported as percentages) | Change from baseline in LENT‐SOMA scores were reported but data were not usable (reported as percentages) | High risk | "The HBOT procedure yield hyperoxia, hypervascular and hypercellular that improved the tissue damage after pelvic radiation. This condition will decrease acute and late side effect showed by LENT SOMA scale and improved QoL shown by Karnofsky score." | Serious study design limitations undermine the usefulness of these findings | |
| * For more details, please see individual Characteristics of Studies tables in Characteristics of included studies. **Details of the timing of this intervention were sparse; however, it appeared that HBOT in this study was administered to women after they had completed their course of pelvic RT. Abbreviations: C = control; HBOT = hyperbaric oxygen therapy; I = intervention; NR = not reported | ||||||||||
| Outcome or subgroup title | No. of studies | No. of participants | Statistical method | Effect size |
| 1.1 Acute GI toxicity: grade 2+ Show forest plot | 2 | 307 | Risk Ratio (IV, Random, 95% CI) | 0.57 [0.40, 0.82] |
| 1.1.1 3DCRT vs conRT | 1 | 263 | Risk Ratio (IV, Random, 95% CI) | 0.60 [0.39, 0.93] |
| 1.1.2 IMRT vs conRT | 1 | 44 | Risk Ratio (IV, Random, 95% CI) | 0.50 [0.25, 1.00] |
| 1.2 Late GI toxicity: grade 2+ Show forest plot | 3 | 517 | Risk Ratio (IV, Random, 95% CI) | 0.49 [0.22, 1.09] |
| 1.2.1 3DCRT vs conRT | 2 | 473 | Risk Ratio (IV, Random, 95% CI) | 0.56 [0.23, 1.35] |
| 1.2.2 IMRT vs conRT | 1 | 44 | Risk Ratio (IV, Random, 95% CI) | 0.20 [0.03, 1.58] |
| 1.3 Acute GI toxicity: grade 1+ Show forest plot | 2 | 307 | Risk Ratio (IV, Random, 95% CI) | 0.75 [0.42, 1.36] |
| 1.3.1 3DCRT vs conRT | 1 | 263 | Risk Ratio (IV, Random, 95% CI) | 0.94 [0.85, 1.04] |
| 1.3.2 IMRT vs conRT | 1 | 44 | Risk Ratio (IV, Random, 95% CI) | 0.50 [0.25, 1.00] |
| 1.4 Late GI toxicity: grade 1+ Show forest plot | 2 | 292 | Risk Ratio (IV, Random, 95% CI) | 0.55 [0.19, 1.59] |
| 1.4.1 3DCRT vs conRT | 1 | 248 | Risk Ratio (IV, Random, 95% CI) | 0.84 [0.68, 1.04] |
| 1.4.2 IMRT vs conRT | 1 | 44 | Risk Ratio (IV, Random, 95% CI) | 0.27 [0.09, 0.85] |
| 1.5 Vomiting: grade 2+ Show forest plot | 1 | Risk Ratio (IV, Random, 95% CI) | Totals not selected | |
| 1.5.1 IMRT vs conRT | 1 | Risk Ratio (IV, Random, 95% CI) | Totals not selected | |
| 1.6 Medication for GI symptom control Show forest plot | 1 | Risk Ratio (IV, Random, 95% CI) | Totals not selected | |
| 1.6.1 3DCRT vs conRT | 1 | Risk Ratio (IV, Random, 95% CI) | Totals not selected | |
| Outcome or subgroup title | No. of studies | No. of participants | Statistical method | Effect size |
| 2.1 GI symptom score (6 months) Show forest plot | 1 | Mean Difference (IV, Random, 95% CI) | Totals not selected | |
| 2.1.1 Urological cancer | 1 | Mean Difference (IV, Random, 95% CI) | Totals not selected | |
| 2.2 GI symptom score (2 years) Show forest plot | 1 | Mean Difference (IV, Random, 95% CI) | Totals not selected | |
| 2.2.1 Urological cancer | 1 | Mean Difference (IV, Random, 95% CI) | Totals not selected | |
| 2.3 Acute GI toxicity: grade 2+ Show forest plot | 4 | 444 | Risk Ratio (IV, Random, 95% CI) | 0.48 [0.26, 0.88] |
| 2.3.1 Gynaecological cancer | 3 | 229 | Risk Ratio (IV, Random, 95% CI) | 0.54 [0.28, 1.07] |
| 2.3.2 Urological cancer | 1 | 215 | Risk Ratio (IV, Random, 95% CI) | 0.31 [0.15, 0.66] |
| 2.4 Late GI toxicity: grade 2+ Show forest plot | 2 | 332 | Risk Ratio (IV, Random, 95% CI) | 0.37 [0.21, 0.65] |
| 2.4.1 Gynaecological cancer | 1 | 117 | Risk Ratio (IV, Random, 95% CI) | 0.46 [0.20, 1.05] |
| 2.4.2 Urological cancer | 1 | 215 | Risk Ratio (IV, Random, 95% CI) | 0.30 [0.13, 0.66] |
| 2.5 Acute GI toxicity: grade 1+ Show forest plot | 4 | 444 | Risk Ratio (IV, Random, 95% CI) | 0.59 [0.41, 0.86] |
| 2.5.1 Gynaecological cancer | 3 | 229 | Risk Ratio (IV, Random, 95% CI) | 0.67 [0.48, 0.95] |
| 2.5.2 Urological cancer | 1 | 215 | Risk Ratio (IV, Random, 95% CI) | 0.31 [0.15, 0.66] |
| 2.6 Late GI toxicity: grade 1+ Show forest plot | 2 | 332 | Risk Ratio (IV, Random, 95% CI) | 0.65 [0.46, 0.93] |
| 2.6.1 Urological cancer | 1 | 215 | Risk Ratio (IV, Random, 95% CI) | 0.71 [0.47, 1.05] |
| 2.6.2 Gynaecological cancer | 1 | 117 | Risk Ratio (IV, Random, 95% CI) | 0.46 [0.20, 1.05] |
| 2.7 Diarrhoea: grade 2+ Show forest plot | 1 | Risk Ratio (IV, Random, 95% CI) | Totals not selected | |
| 2.7.1 Gynaecological cancer | 1 | Risk Ratio (IV, Random, 95% CI) | Totals not selected | |
| 2.8 Vomiting: grade 2+ Show forest plot | 2 | 112 | Risk Ratio (IV, Random, 95% CI) | 0.60 [0.29, 1.24] |
| 2.8.1 Gynaecological cancer | 2 | 112 | Risk Ratio (IV, Random, 95% CI) | 0.60 [0.29, 1.24] |
| Outcome or subgroup title | No. of studies | No. of participants | Statistical method | Effect size |
| 3.1 Acute GI toxicity: grade 2+ Show forest plot | 2 | Risk Ratio (IV, Random, 95% CI) | Subtotals only | |
| 3.1.1 Gynaecological cancer | 1 | 423 | Risk Ratio (IV, Random, 95% CI) | 0.02 [0.00, 0.18] |
| 3.1.2 Urological cancer | 1 | 20 | Risk Ratio (IV, Random, 95% CI) | 0.33 [0.04, 2.69] |
| 3.2 Late GI toxicity: grade 2+ Show forest plot | 1 | Risk Ratio (IV, Random, 95% CI) | Totals not selected | |
| 3.2.1 Gynaecological cancer | 1 | Risk Ratio (IV, Random, 95% CI) | Totals not selected | |
| 3.3 Acute GI toxicity: grade 1 Show forest plot | 2 | Risk Ratio (IV, Random, 95% CI) | Subtotals only | |
| 3.3.1 Gynaecological cancer | 1 | 423 | Risk Ratio (IV, Random, 95% CI) | 0.33 [0.22, 0.50] |
| 3.3.2 Urological cancer | 1 | 20 | Risk Ratio (IV, Random, 95% CI) | 0.75 [0.22, 2.52] |
| 3.4 Late GI toxicity: grade 1 Show forest plot | 1 | Risk Ratio (IV, Random, 95% CI) | Totals not selected | |
| 3.4.1 Gynaecological cancer | 1 | Risk Ratio (IV, Random, 95% CI) | Totals not selected | |
| 3.5 Treatment discontinuation Show forest plot | 1 | Risk Ratio (IV, Random, 95% CI) | Totals not selected | |
| 3.5.1 Gynaecological cancer | 1 | Risk Ratio (IV, Random, 95% CI) | Totals not selected | |
| Outcome or subgroup title | No. of studies | No. of participants | Statistical method | Effect size |
| 4.1 Acute GI toxicity: grade 2+ Show forest plot | 1 | Risk Ratio (IV, Random, 95% CI) | Totals not selected | |
| 4.2 Acute GI toxicity: grade 1+ Show forest plot | 3 | 354 | Risk Ratio (IV, Random, 95% CI) | 0.61 [0.34, 1.10] |
| 4.3 Late GI toxicity: grade 2+ (1 year post‐RT) Show forest plot | 1 | Risk Ratio (IV, Random, 95% CI) | Totals not selected | |
| 4.4 Late GI toxicity: grade 2+ (2 years post‐RT) Show forest plot | 1 | Risk Ratio (IV, Random, 95% CI) | Totals not selected | |
| 4.5 Late GI toxicity: grade 1+ Show forest plot | 2 | 154 | Risk Ratio (IV, Random, 95% CI) | 1.15 [0.49, 2.68] |
| Outcome or subgroup title | No. of studies | No. of participants | Statistical method | Effect size |
| 5.1 Acute GI toxicity: grade 2+ Show forest plot | 1 | Risk Ratio (IV, Random, 95% CI) | Totals not selected | |
| 5.2 Acute GI toxicity: grade 1+ Show forest plot | 1 | Risk Ratio (IV, Random, 95% CI) | Totals not selected | |
| 5.3 Late GI toxicity: grade 2+ Show forest plot | 1 | Risk Ratio (IV, Random, 95% CI) | Totals not selected | |
| 5.4 Late GI toxicity: grade 1+ Show forest plot | 1 | Risk Ratio (IV, Random, 95% CI) | Totals not selected | |
| Outcome or subgroup title | No. of studies | No. of participants | Statistical method | Effect size |
| 6.1 Acute GI toxicity (diarrhoea): grade 2+ (during RT) Show forest plot | 2 | 294 | Risk Ratio (IV, Random, 95% CI) | 0.51 [0.34, 0.76] |
| 6.2 Acute GI toxicity (diarrhoea): grade 1+ (during RT) Show forest plot | 2 | 294 | Risk Ratio (IV, Random, 95% CI) | 0.78 [0.68, 0.89] |
| 6.3 Vomiting grade 2+ (during RT) Show forest plot | 1 | Risk Ratio (IV, Random, 95% CI) | Totals not selected | |
| Outcome or subgroup title | No. of studies | No. of participants | Statistical method | Effect size |
| 7.1 Acute GI toxicity: grade 2+ Show forest plot | 2 | 289 | Risk Ratio (IV, Random, 95% CI) | 0.51 [0.08, 3.38] |
| 7.2 Acute GI toxicity: grade 1+ Show forest plot | 1 | Risk Ratio (IV, Random, 95% CI) | Totals not selected | |
| 7.3 Late GI toxicity: grade 2+ Show forest plot | 1 | Risk Ratio (IV, Random, 95% CI) | Totals not selected | |
| 7.3.1 15 months | 1 | Risk Ratio (IV, Random, 95% CI) | Totals not selected | |
| 7.3.2 3 years | 1 | Risk Ratio (IV, Random, 95% CI) | Totals not selected | |
| 7.4 Late GI toxicity: grade 1+ Show forest plot | 1 | Risk Ratio (IV, Random, 95% CI) | Totals not selected | |
| 7.4.1 15 months | 1 | Risk Ratio (IV, Random, 95% CI) | Totals not selected | |
| 7.4.2 3 years | 1 | Risk Ratio (IV, Random, 95% CI) | Totals not selected | |
| 7.5 Rectal bleeding (late) Show forest plot | 2 | 289 | Risk Ratio (IV, Random, 95% CI) | 0.25 [0.03, 1.84] |
| 7.6 Rectal pain (acute) Show forest plot | 1 | Risk Ratio (IV, Random, 95% CI) | Totals not selected | |
| Outcome or subgroup title | No. of studies | No. of participants | Statistical method | Effect size |
| 8.1 Acute GI toxicity: grade 2+ Show forest plot | 1 | Risk Ratio (IV, Random, 95% CI) | Totals not selected | |
| 8.2 Acute GI toxicity: grade 1+ Show forest plot | 1 | Risk Ratio (IV, Random, 95% CI) | Totals not selected | |
| 8.3 Late GI toxicity: grade 2+ Show forest plot | 1 | Risk Ratio (IV, Random, 95% CI) | Totals not selected | |
| 8.4 Late GI toxicity: grade 1+ Show forest plot | 1 | Risk Ratio (IV, Random, 95% CI) | Totals not selected | |
| 8.5 Diarrhoea (late) Show forest plot | 1 | Risk Ratio (IV, Random, 95% CI) | Totals not selected | |
| 8.6 Rectal bleeding (acute) Show forest plot | 1 | Risk Ratio (IV, Random, 95% CI) | Totals not selected | |
| 8.7 Rectal bleeding (late) Show forest plot | 2 | 91 | Risk Ratio (IV, Random, 95% CI) | 0.53 [0.25, 1.09] |
| Outcome or subgroup title | No. of studies | No. of participants | Statistical method | Effect size |
| 9.1 Acute GI toxicity: grade 2+ (during RT) Show forest plot | 4 | Risk Ratio (IV, Random, 95% CI) | Subtotals only | |
| 9.1.1 Mesalazine | 2 | 143 | Risk Ratio (IV, Random, 95% CI) | 1.22 [1.02, 1.45] |
| 9.1.2 Sulfasalazine | 2 | 182 | Risk Ratio (IV, Random, 95% CI) | 0.29 [0.11, 0.75] |
| 9.2 Acute GI toxicity: grade 1+ (during RT) Show forest plot | 2 | 182 | Risk Ratio (IV, Random, 95% CI) | 0.74 [0.52, 1.05] |
| 9.2.1 Sulfasalazine | 2 | 182 | Risk Ratio (IV, Random, 95% CI) | 0.74 [0.52, 1.05] |
| 9.3 Diarrhoea grade 2+(during RT) Show forest plot | 5 | Risk Ratio (IV, Random, 95% CI) | Subtotals only | |
| 9.3.1 Mesalazine | 2 | 191 | Risk Ratio (IV, Random, 95% CI) | 1.55 [1.14, 2.10] |
| 9.3.2 Sulfasalazine | 2 | 171 | Risk Ratio (IV, Random, 95% CI) | 0.80 [0.41, 1.58] |
| 9.3.3 Olsalazine | 1 | 58 | Risk Ratio (IV, Random, 95% CI) | 1.70 [1.00, 2.87] |
| 9.4 Diarrhoea grade 2+(up to 3 months) Show forest plot | 1 | Risk Ratio (IV, Random, 95% CI) | Totals not selected | |
| 9.4.1 Sulfasalazine | 1 | Risk Ratio (IV, Random, 95% CI) | Totals not selected | |
| 9.5 Rectal bleeding grade 2+ (during RT) Show forest plot | 2 | 142 | Risk Ratio (IV, Random, 95% CI) | 0.76 [0.47, 1.24] |
| 9.5.1 Sulfasalazine | 1 | 84 | Risk Ratio (IV, Random, 95% CI) | 0.80 [0.49, 1.32] |
| 9.5.2 Olsalazine | 1 | 58 | Risk Ratio (IV, Random, 95% CI) | 0.31 [0.03, 2.82] |
| 9.6 Rectal bleeding grade 2+ (up to 3 months) Show forest plot | 1 | 84 | Risk Ratio (IV, Random, 95% CI) | 0.80 [0.49, 1.32] |
| 9.6.1 Sulfasalazine | 1 | 84 | Risk Ratio (IV, Random, 95% CI) | 0.80 [0.49, 1.32] |
| 9.7 Pain/cramps grade 2+(during RT) Show forest plot | 3 | 261 | Risk Ratio (IV, Random, 95% CI) | 1.08 [0.50, 2.33] |
| 9.7.1 Mesalazine | 1 | 119 | Risk Ratio (IV, Random, 95% CI) | 0.67 [0.43, 1.04] |
| 9.7.2 Sulfasalazine | 1 | 84 | Risk Ratio (IV, Random, 95% CI) | 1.50 [0.46, 4.93] |
| 9.7.3 Olsalazine | 1 | 58 | Risk Ratio (IV, Random, 95% CI) | 2.18 [0.62, 7.61] |
| 9.8 Pain/cramps grade 2+(up to 3 months) Show forest plot | 1 | Risk Ratio (IV, Random, 95% CI) | Totals not selected | |
| 9.8.1 Sulfasalazine | 1 | Risk Ratio (IV, Random, 95% CI) | Totals not selected | |
| 9.9 Tenesmus grade 2+(during RT) Show forest plot | 2 | 142 | Risk Ratio (IV, Random, 95% CI) | 2.10 [0.73, 6.03] |
| 9.9.1 Sulfasalazine | 1 | 84 | Risk Ratio (IV, Random, 95% CI) | 3.00 [0.87, 10.31] |
| 9.9.2 Olsalazine | 1 | 58 | Risk Ratio (IV, Random, 95% CI) | 0.93 [0.14, 6.18] |
| 9.10 Tenesmus grade 2+(up to 3 months) Show forest plot | 1 | Risk Ratio (IV, Random, 95% CI) | Totals not selected | |
| 9.10.1 Sulfasalazine | 1 | Risk Ratio (IV, Random, 95% CI) | Totals not selected | |
| 9.11 Vomiting grade 2+(during RT) Show forest plot | 3 | Risk Ratio (IV, Random, 95% CI) | Subtotals only | |
| 9.11.1 Mesalazine | 2 | 144 | Risk Ratio (IV, Random, 95% CI) | 0.73 [0.43, 1.25] |
| 9.11.2 Olsalazine | 1 | 58 | Risk Ratio (IV, Random, 95% CI) | 2.18 [0.62, 7.61] |
| 9.12 Medication for GI symptom control Show forest plot | 2 | 156 | Risk Ratio (IV, Random, 95% CI) | 1.91 [1.26, 2.90] |
| 9.12.1 Mesalazine | 1 | 72 | Risk Ratio (IV, Random, 95% CI) | 2.12 [1.15, 3.91] |
| 9.12.2 Sulfasalazine | 1 | 84 | Risk Ratio (IV, Random, 95% CI) | 1.75 [0.99, 3.08] |
| 9.13 Discontinuation of study medication Show forest plot | 1 | Risk Ratio (IV, Random, 95% CI) | Totals not selected | |
| 9.13.1 Sulfasalazine | 1 | Risk Ratio (IV, Random, 95% CI) | Totals not selected | |
| Outcome or subgroup title | No. of studies | No. of participants | Statistical method | Effect size |
| 10.1 Acute GI toxicity: grade 2+ Show forest plot | 1 | Risk Ratio (IV, Random, 95% CI) | Totals not selected | |
| 10.2 Late GI toxicity: grade 2+ Show forest plot | 1 | Risk Ratio (IV, Random, 95% CI) | Totals not selected | |
| 10.3 Late GI toxicity: grade 1+ Show forest plot | 1 | Risk Ratio (IV, Random, 95% CI) | Totals not selected | |
| 10.4 Diarrhoea: grade 2+ (up to 12 months) Show forest plot | 1 | Risk Ratio (IV, Random, 95% CI) | Totals not selected | |
| 10.5 Rectal bleeding (up to 12 months, ungraded) Show forest plot | 1 | Risk Ratio (IV, Random, 95% CI) | Totals not selected | |
| 10.6 Faecal urgency (up to 12 months, ungraded) Show forest plot | 1 | Risk Ratio (IV, Random, 95% CI) | Totals not selected | |
| Outcome or subgroup title | No. of studies | No. of participants | Statistical method | Effect size |
| 11.1 Acute GI toxicity: grade 2+ (3 months) Show forest plot | 1 | Risk Ratio (IV, Random, 95% CI) | Totals not selected | |
| 11.2 Late GI toxicity: grade 2+ (1 year) Show forest plot | 1 | Risk Ratio (IV, Random, 95% CI) | Totals not selected | |
| 11.3 Late GI toxicity: grade 2+ (2 years) Show forest plot | 1 | Risk Ratio (IV, Random, 95% CI) | Totals not selected | |
| Outcome or subgroup title | No. of studies | No. of participants | Statistical method | Effect size |
| 12.1 Acute GI toxicity: grade 2+(during RT) Show forest plot | 4 | Risk Ratio (IV, Random, 95% CI) | Subtotals only | |
| 12.1.1 Amifostine vs no treatment | 3 | 278 | Risk Ratio (IV, Random, 95% CI) | 0.25 [0.15, 0.42] |
| 12.1.2 Rectal amifostine vs SC amifostine | 1 | 53 | Risk Ratio (IV, Random, 95% CI) | 0.32 [0.01, 7.55] |
| 12.2 Acute GI toxicity: grade 2+(up to 3 months) Show forest plot | 1 | Risk Ratio (IV, Random, 95% CI) | Totals not selected | |
| 12.3 Acute GI toxicity: grade 1+(up to 3 months) Show forest plot | 2 | Risk Ratio (IV, Random, 95% CI) | Subtotals only | |
| 12.3.1 Amifostine vs no treatment | 1 | 44 | Risk Ratio (IV, Random, 95% CI) | 0.12 [0.01, 2.12] |
| 12.3.2 Rectal amifostine vs SC amifostine | 1 | 53 | Risk Ratio (IV, Random, 95% CI) | 0.26 [0.08, 0.84] |
| 12.4 Late GI toxicity: grade 2+ Show forest plot | 2 | 249 | Risk Ratio (IV, Random, 95% CI) | 1.48 [0.64, 3.45] |
| 12.5 Late GI toxicity: grade 1+ Show forest plot | 1 | Risk Ratio (IV, Random, 95% CI) | Totals not selected | |
| 12.6 Diarrhoea grade 2+ (during treatment) Show forest plot | 1 | Risk Ratio (IV, Random, 95% CI) | Totals not selected | |
| 12.7 Discontinuation of RT Show forest plot | 1 | Risk Ratio (IV, Random, 95% CI) | Totals not selected | |
| Outcome or subgroup title | No. of studies | No. of participants | Statistical method | Effect size |
| 13.1 GI symptom scores Show forest plot | 1 | Mean Difference (IV, Random, 95% CI) | Totals not selected | |
| 13.2 Acute GI toxicity: grade 2+ (during RT) Show forest plot | 1 | Risk Ratio (IV, Random, 95% CI) | Totals not selected | |
| 13.3 Diarrhoea: grade 2+ (during RT) Show forest plot | 1 | Risk Ratio (IV, Random, 95% CI) | Totals not selected | |
| 13.4 Medication for symptom control Show forest plot | 2 | 64 | Risk Ratio (IV, Random, 95% CI) | 2.49 [0.29, 21.34] |
| Outcome or subgroup title | No. of studies | No. of participants | Statistical method | Effect size |
| 14.1 Acute GI toxicity: grade 2+ (during RT) Show forest plot | 1 | Risk Ratio (IV, Random, 95% CI) | Totals not selected | |
| 14.2 Medication for symptom control Show forest plot | 1 | Risk Ratio (IV, Random, 95% CI) | Totals not selected | |
| 14.3 Discontinuation of study medication Show forest plot | 1 | Risk Ratio (IV, Random, 95% CI) | Totals not selected | |
| Outcome or subgroup title | No. of studies | No. of participants | Statistical method | Effect size |
| 15.1 Acute GI toxicity: grade 2+ (during RT) Show forest plot | 1 | Risk Ratio (IV, Random, 95% CI) | Totals not selected | |
| 15.2 Diarrhoea grade 2+ (during RT) Show forest plot | 1 | Risk Ratio (IV, Random, 95% CI) | Totals not selected | |
| 15.3 Diarrhoea grade 2+ (1+ years post‐RT) Show forest plot | 1 | Risk Ratio (IV, Random, 95% CI) | Totals not selected | |
| 15.4 Rectal bleeding grade 2+ (during RT) Show forest plot | 1 | Risk Ratio (IV, Random, 95% CI) | Totals not selected | |
| 15.5 Rectal bleeding grade 2+ (1+ years post‐RT) Show forest plot | 1 | Risk Ratio (IV, Random, 95% CI) | Totals not selected | |
| 15.6 Tenesmus 2+ (during RT) Show forest plot | 1 | Risk Ratio (IV, Random, 95% CI) | Totals not selected | |
| 15.7 Tenesmus 2+ (1+ years post‐RT) Show forest plot | 1 | Risk Ratio (IV, Random, 95% CI) | Totals not selected | |
| 15.8 Faecal urgency 2+ (during RT) Show forest plot | 1 | Risk Ratio (IV, Random, 95% CI) | Totals not selected | |
| 15.9 Faecal incontinence (1+ years post‐RT) Show forest plot | 1 | Risk Ratio (IV, Random, 95% CI) | Totals not selected | |
| 15.10 Pain/cramps 2+ (during RT) Show forest plot | 1 | Risk Ratio (IV, Random, 95% CI) | Totals not selected | |
| Outcome or subgroup title | No. of studies | No. of participants | Statistical method | Effect size |
| 16.1 Diarrhoea grade 2+ (acute) Show forest plot | 2 | 340 | Risk Ratio (IV, Random, 95% CI) | 1.01 [0.76, 1.35] |
| 16.2 Rectal bleeding grade 2+ (acute) Show forest plot | 2 | 340 | Risk Ratio (IV, Random, 95% CI) | 1.65 [1.21, 2.24] |
| 16.3 Tenesmus grade 2+ (during RT) Show forest plot | 1 | Risk Ratio (IV, Random, 95% CI) | Totals not selected | |
| 16.4 Vomiting grade 2+ (during RT) Show forest plot | 1 | Risk Ratio (IV, Random, 95% CI) | Totals not selected | |
| 16.5 Pain/cramps grade 2+ (during RT) Show forest plot | 1 | Risk Ratio (IV, Random, 95% CI) | Totals not selected | |
| 16.6 Faecal incontinence grade 2+ (during RT) Show forest plot | 1 | Risk Ratio (IV, Random, 95% CI) | Totals not selected | |
| 16.7 Medication for GI symptom control Show forest plot | 1 | Risk Ratio (IV, Random, 95% CI) | Totals not selected | |
| 16.8 Discontinuation of study medication Show forest plot | 1 | Risk Ratio (IV, Random, 95% CI) | Totals not selected | |
| Outcome or subgroup title | No. of studies | No. of participants | Statistical method | Effect size |
| 17.1 Diarrhoea grade 2+ (acute) Show forest plot | 1 | Risk Ratio (IV, Random, 95% CI) | Totals not selected | |
| Outcome or subgroup title | No. of studies | No. of participants | Statistical method | Effect size |
| 18.1 Acute GI toxicity grade 2+ (during RT) Show forest plot | 1 | Risk Ratio (IV, Random, 95% CI) | Totals not selected | |
| 18.2 Acute GI toxicity grade 1+ (during RT) Show forest plot | 1 | Risk Ratio (IV, Random, 95% CI) | Totals not selected | |
| Outcome or subgroup title | No. of studies | No. of participants | Statistical method | Effect size |
| 19.1 Acute GI toxicity: grade 2+(during RT) Show forest plot | 2 | Risk Ratio (IV, Random, 95% CI) | Subtotals only | |
| 19.1.1 Oral | 1 | 335 | Risk Ratio (IV, Random, 95% CI) | 1.07 [0.83, 1.39] |
| 19.1.2 Rectal | 1 | 126 | Risk Ratio (IV, Random, 95% CI) | 1.18 [0.87, 1.60] |
| 19.2 Acute GI toxicity: grade 1+ (during RT) Show forest plot | 1 | Risk Ratio (IV, Random, 95% CI) | Totals not selected | |
| 19.2.1 Oral | 1 | Risk Ratio (IV, Random, 95% CI) | Totals not selected | |
| 19.3 Late GI toxicity: grade 2+ Show forest plot | 1 | Risk Ratio (IV, Random, 95% CI) | Totals not selected | |
| 19.3.1 Oral | 1 | Risk Ratio (IV, Random, 95% CI) | Totals not selected | |
| 19.4 Diarrhoea grade 2+ (during RT) Show forest plot | 5 | Risk Ratio (IV, Random, 95% CI) | Subtotals only | |
| 19.4.1 Oral | 4 | 284 | Risk Ratio (IV, Random, 95% CI) | 0.81 [0.41, 1.62] |
| 19.4.2 Rectal | 1 | 83 | Risk Ratio (IV, Random, 95% CI) | 0.82 [0.44, 1.53] |
| 19.5 Rectal bleeding grade 2+(during RT) Show forest plot | 5 | Risk Ratio (IV, Random, 95% CI) | Subtotals only | |
| 19.5.1 Oral | 4 | 604 | Risk Ratio (IV, Random, 95% CI) | 1.32 [1.10, 1.60] |
| 19.5.2 Rectal | 1 | 83 | Risk Ratio (IV, Random, 95% CI) | 0.87 [0.61, 1.24] |
| 19.6 Pain/cramps grade 2+(during RT) Show forest plot | 4 | Risk Ratio (IV, Random, 95% CI) | Subtotals only | |
| 19.6.1 Oral | 3 | 269 | Risk Ratio (IV, Random, 95% CI) | 0.97 [0.58, 1.60] |
| 19.6.2 Rectal | 1 | 83 | Risk Ratio (IV, Random, 95% CI) | 1.02 [0.15, 6.93] |
| 19.7 Faecal urgency grade 2+ (during RT) Show forest plot | 2 | Risk Ratio (IV, Random, 95% CI) | Totals not selected | |
| 19.7.1 Oral | 1 | Risk Ratio (IV, Random, 95% CI) | Totals not selected | |
| 19.7.2 Rectal | 1 | Risk Ratio (IV, Random, 95% CI) | Totals not selected | |
| 19.8 Faecal incontinence grade 2+(during RT) Show forest plot | 2 | Risk Ratio (IV, Random, 95% CI) | Totals not selected | |
| 19.8.1 Oral | 1 | Risk Ratio (IV, Random, 95% CI) | Totals not selected | |
| 19.8.2 Rectal | 1 | Risk Ratio (IV, Random, 95% CI) | Totals not selected | |
| 19.9 Tenesmus grade 2+(during RT) Show forest plot | 2 | Risk Ratio (IV, Random, 95% CI) | Totals not selected | |
| 19.9.1 Oral | 1 | Risk Ratio (IV, Random, 95% CI) | Totals not selected | |
| 19.9.2 Rectal | 1 | Risk Ratio (IV, Random, 95% CI) | Totals not selected | |
| 19.10 Medication for symptom control Show forest plot | 4 | 313 | Risk Ratio (IV, Random, 95% CI) | 0.84 [0.49, 1.42] |
| 19.10.1 Oral | 4 | 313 | Risk Ratio (IV, Random, 95% CI) | 0.84 [0.49, 1.42] |
| 19.11 Discontinuation of study medication Show forest plot | 4 | 348 | Risk Ratio (IV, Random, 95% CI) | 1.02 [0.48, 2.18] |
| 19.11.1 Oral | 4 | 348 | Risk Ratio (IV, Random, 95% CI) | 1.02 [0.48, 2.18] |
| Outcome or subgroup title | No. of studies | No. of participants | Statistical method | Effect size |
| 20.1 Acute GI toxicity: grade 2+ (during RT) Show forest plot | 1 | Risk Ratio (M‐H, Random, 95% CI) | Totals not selected | |
| 20.1.1 Low‐fat diet | 1 | Risk Ratio (M‐H, Random, 95% CI) | Totals not selected | |
| 20.2 Acute GI toxicity: grade 1+ (during RT) Show forest plot | 2 | Risk Ratio (IV, Random, 95% CI) | Totals not selected | |
| 20.2.1 Lactose‐restricted diet | 1 | Risk Ratio (IV, Random, 95% CI) | Totals not selected | |
| 20.2.2 Low‐fibre diet | 1 | Risk Ratio (IV, Random, 95% CI) | Totals not selected | |
| 20.2.3 Low‐fat diet | 1 | Risk Ratio (IV, Random, 95% CI) | Totals not selected | |
| 20.3 Late GI toxicity: grade 1+ Show forest plot | 1 | Risk Ratio (M‐H, Random, 95% CI) | Totals not selected | |
| 20.3.1 Lactose‐restricted diet | 1 | Risk Ratio (M‐H, Random, 95% CI) | Totals not selected | |
| 20.3.2 Low‐fibre diet | 1 | Risk Ratio (M‐H, Random, 95% CI) | Totals not selected | |
| 20.4 Diarrhoea grade 1+ (during RT) Show forest plot | 3 | Risk Ratio (IV, Random, 95% CI) | Subtotals only | |
| 20.4.1 Lactose‐restricted diet | 1 | 119 | Risk Ratio (IV, Random, 95% CI) | 0.74 [0.45, 1.23] |
| 20.4.2 High‐fibre diet | 2 | 74 | Risk Ratio (IV, Random, 95% CI) | 1.00 [0.94, 1.07] |
| 20.4.3 Low‐fibre diet | 1 | 119 | Risk Ratio (IV, Random, 95% CI) | 0.74 [0.45, 1.23] |
| 20.5 Diarrhoea grade 2+ (during RT) Show forest plot | 4 | Risk Ratio (IV, Random, 95% CI) | Subtotals only | |
| 20.5.1 Elemental diet | 1 | 50 | Risk Ratio (IV, Random, 95% CI) | 0.79 [0.45, 1.38] |
| 20.5.2 Low‐fat | 1 | 76 | Risk Ratio (IV, Random, 95% CI) | 0.61 [0.33, 1.13] |
| 20.5.3 High‐fibre diet | 2 | 74 | Risk Ratio (IV, Random, 95% CI) | 0.65 [0.38, 1.10] |
| 20.6 GI symptom score (during RT) Show forest plot | 3 | Mean Difference (IV, Random, 95% CI) | Totals not selected | |
| 20.6.1 Low‐fat diet | 1 | Mean Difference (IV, Random, 95% CI) | Totals not selected | |
| 20.6.2 Elemental diet | 1 | Mean Difference (IV, Random, 95% CI) | Totals not selected | |
| 20.6.3 High‐fibre diet | 1 | Mean Difference (IV, Random, 95% CI) | Totals not selected | |
| 20.6.4 Low‐fibre diet | 1 | Mean Difference (IV, Random, 95% CI) | Totals not selected | |
| 20.7 GI symptom score (1 year after RT) Show forest plot | 1 | Mean Difference (IV, Random, 95% CI) | Totals not selected | |
| 20.7.1 High‐fibre diet | 1 | Mean Difference (IV, Random, 95% CI) | Totals not selected | |
| 20.7.2 Low‐fibre diet | 1 | Mean Difference (IV, Random, 95% CI) | Totals not selected | |
| 20.8 GI symptom score ‐ mean change from baseline (at end of RT) Show forest plot | 1 | Mean Difference (IV, Random, 95% CI) | Totals not selected | |
| 20.8.1 High‐fibre diet | 1 | Mean Difference (IV, Random, 95% CI) | Totals not selected | |
| 20.8.2 Low‐fibre diet | 1 | Mean Difference (IV, Random, 95% CI) | Totals not selected | |
| 20.9 GI symptom score ‐ mean change from baseline (1 year after RT) Show forest plot | 1 | Mean Difference (IV, Random, 95% CI) | Totals not selected | |
| 20.9.1 High‐fibre diet | 1 | Mean Difference (IV, Random, 95% CI) | Totals not selected | |
| 20.9.2 Low‐fibre diet | 1 | Mean Difference (IV, Random, 95% CI) | Totals not selected | |
| 20.10 RT discontinuation Show forest plot | 2 | 187 | Risk Ratio (IV, Random, 95% CI) | Not estimable |
| 20.10.1 High‐fibre diet | 1 | 108 | Risk Ratio (IV, Random, 95% CI) | Not estimable |
| 20.10.2 Low‐fat diet | 1 | 79 | Risk Ratio (IV, Random, 95% CI) | Not estimable |
| 20.11 QoL (during RT) Show forest plot | 3 | Mean Difference (IV, Random, 95% CI) | Totals not selected | |
| 20.11.1 High‐fibre diet | 1 | Mean Difference (IV, Random, 95% CI) | Totals not selected | |
| 20.11.2 Low‐fibre diet | 1 | Mean Difference (IV, Random, 95% CI) | Totals not selected | |
| 20.11.3 Low‐fat diet | 1 | Mean Difference (IV, Random, 95% CI) | Totals not selected | |
| 20.11.4 Elemental diet | 1 | Mean Difference (IV, Random, 95% CI) | Totals not selected | |
| 20.12 QoL (1 year after RT) Show forest plot | 1 | Mean Difference (IV, Random, 95% CI) | Totals not selected | |
| 20.12.1 High‐fibre diet | 1 | Mean Difference (IV, Random, 95% CI) | Totals not selected | |
| 20.12.2 Low‐fibre diet | 1 | Mean Difference (IV, Random, 95% CI) | Totals not selected | |
| Outcome or subgroup title | No. of studies | No. of participants | Statistical method | Effect size |
| 21.1 GI symptom score (acute) Show forest plot | 1 | Mean Difference (IV, Random, 95% CI) | Totals not selected | |
| 21.2 Diarrhoea: grade 2+ (end of RT) Show forest plot | 1 | Risk Ratio (IV, Random, 95% CI) | Totals not selected | |
| 21.3 Diarrhoea grade 2+ (3 months post‐RT) Show forest plot | 1 | Risk Ratio (IV, Random, 95% CI) | Totals not selected | |
| 21.4 Diarrhoea grade 2+ (5 years post‐RT) Show forest plot | 1 | Risk Ratio (IV, Random, 95% CI) | Totals not selected | |
| 21.5 Weight loss: grade 2+ (end of RT) Show forest plot | 1 | Risk Ratio (IV, Random, 95% CI) | Totals not selected | |
| 21.6 Weight loss: grade 2+ (3 months post‐RT) Show forest plot | 1 | Risk Ratio (IV, Random, 95% CI) | Totals not selected | |
| 21.7 Vomiting: grade 2+ (end of RT) Show forest plot | 1 | Risk Ratio (IV, Random, 95% CI) | Totals not selected | |
| 21.8 Vomiting: grade 2+ (3 months post‐RT) Show forest plot | 1 | Risk Ratio (IV, Random, 95% CI) | Totals not selected | |
| 21.9 Medication for symptom control (end of RT) Show forest plot | 1 | Risk Ratio (IV, Random, 95% CI) | Totals not selected | |
| 21.10 Medication for symptom control (3 months post‐RT) Show forest plot | 1 | Risk Ratio (IV, Random, 95% CI) | Totals not selected | |
| 21.11 QOL Show forest plot | 1 | Mean Difference (IV, Random, 95% CI) | Totals not selected | |
| 21.11.1 Fatigue (5‐point VAS) | 1 | Mean Difference (IV, Random, 95% CI) | Totals not selected | |
| 21.11.2 Sleeping problem (5‐point VAS) | 1 | Mean Difference (IV, Random, 95% CI) | Totals not selected | |
| Outcome or subgroup title | No. of studies | No. of participants | Statistical method | Effect size |
| 22.1 Diarrhoea: grade 2+ (end of RT) Show forest plot | 1 | Risk Ratio (IV, Random, 95% CI) | Totals not selected | |
| 22.2 Diarrhoea grade 2+ (3 months post‐RT) Show forest plot | 1 | Risk Ratio (IV, Random, 95% CI) | Totals not selected | |
| 22.3 Diarrhoea grade 2+ (5 years post‐RT) Show forest plot | 1 | Risk Ratio (IV, Random, 95% CI) | Totals not selected | |
| 22.4 Vomiting: grade 2+ (end of RT) Show forest plot | 1 | Risk Ratio (IV, Random, 95% CI) | Totals not selected | |
| 22.5 Vomiting: grade 2+ (3 months post‐RT) Show forest plot | 1 | Risk Ratio (IV, Random, 95% CI) | Totals not selected | |
| 22.6 Weight loss: grade 2+ (end of RT) Show forest plot | 1 | Risk Ratio (IV, Random, 95% CI) | Totals not selected | |
| 22.7 Weight loss: grade 2+ (3 months post‐RT) Show forest plot | 1 | Risk Ratio (IV, Random, 95% CI) | Totals not selected | |
| 22.8 Medication for symptom control (end of RT) Show forest plot | 1 | Risk Ratio (IV, Random, 95% CI) | Totals not selected | |
| 22.9 Medication for symptom control (3 months post‐RT) Show forest plot | 1 | Risk Ratio (IV, Random, 95% CI) | Totals not selected | |
| Outcome or subgroup title | No. of studies | No. of participants | Statistical method | Effect size |
| 23.1 Acute GI toxicity: grade 2+(during RT) Show forest plot | 1 | Risk Ratio (IV, Random, 95% CI) | Totals not selected | |
| 23.2 Acute GI toxicity: grade 1+ (during RT) Show forest plot | 1 | Risk Ratio (IV, Random, 95% CI) | Totals not selected | |
| 23.3 Late GI toxicity: grade 2+ (1 year) Show forest plot | 1 | Risk Ratio (IV, Random, 95% CI) | Totals not selected | |
| 23.4 Late GI toxicity: grade 1+ (1 year) Show forest plot | 1 | Risk Ratio (IV, Random, 95% CI) | Totals not selected | |
| 23.5 Diarrhoea grade 2+(during RT) Show forest plot | 4 | 287 | Risk Ratio (IV, Random, 95% CI) | 0.98 [0.78, 1.24] |
| 23.6 Tenesmus grade 2+(during RT) Show forest plot | 1 | Risk Ratio (IV, Random, 95% CI) | Totals not selected | |
| 23.7 Pain/cramps grade 2+(during RT) Show forest plot | 1 | Risk Ratio (IV, Random, 95% CI) | Totals not selected | |
| 23.8 Rectal bleeding grade 2+ (during RT) Show forest plot | 1 | Risk Ratio (IV, Random, 95% CI) | Totals not selected | |
| 23.9 Vomiting grade 2+ (during RT) Show forest plot | 1 | Risk Ratio (IV, Random, 95% CI) | Totals not selected | |
| 23.10 Nausea grade 2+ (during RT) Show forest plot | 1 | Risk Ratio (IV, Random, 95% CI) | Totals not selected | |
| 23.11 Medication for GI symptom control Show forest plot | 2 | 198 | Risk Ratio (IV, Random, 95% CI) | 2.82 [1.05, 7.58] |
| 23.12 Faecal incontinence (during RT) Show forest plot | 1 | Risk Ratio (IV, Random, 95% CI) | Totals not selected | |
| 23.13 Faecal incontinence (1 year post RT) Show forest plot | 1 | Risk Ratio (IV, Random, 95% CI) | Totals not selected | |
| 23.14 Faecal incontinence (2 year post RT) Show forest plot | 1 | Risk Ratio (IV, Random, 95% CI) | Totals not selected | |
| 23.15 Pain/cramps grade 2+(during RT) Show forest plot | 1 | Risk Ratio (IV, Random, 95% CI) | Totals not selected | |
| 23.16 Pain/cramps grade 2+(1 year post RT) Show forest plot | 1 | Risk Ratio (IV, Random, 95% CI) | Totals not selected | |
| 23.17 Pain/cramps grade 2+(2 year post RT) Show forest plot | 1 | Risk Ratio (IV, Random, 95% CI) | Totals not selected | |
| 23.18 Rectal bleeding grade 2+ (1 year post RT) Show forest plot | 1 | Risk Ratio (IV, Random, 95% CI) | Totals not selected | |
| 23.19 Rectal bleeding grade 2+ (2 year post RT) Show forest plot | 1 | Risk Ratio (IV, Random, 95% CI) | Totals not selected | |
| Outcome or subgroup title | No. of studies | No. of participants | Statistical method | Effect size |
| 24.1 Diarrhoea: grade 2+ (during RT) Show forest plot | 5 | 923 | Risk Ratio (IV, Random, 95% CI) | 0.43 [0.22, 0.82] |
| 24.2 Weight loss grade 2+ Show forest plot | 1 | Risk Ratio (IV, Random, 95% CI) | Totals not selected | |
| 24.3 Medication for GI symptom control Show forest plot | 6 | 507 | Risk Ratio (IV, Random, 95% CI) | 0.53 [0.32, 0.88] |
| Outcome or subgroup title | No. of studies | No. of participants | Statistical method | Effect size |
| 25.1 Acute GI toxicity: grade 2+ (during RT) Show forest plot | 1 | Risk Ratio (IV, Random, 95% CI) | Totals not selected | |
| 25.2 Acute GI toxicity: grade 1+ (during RT) Show forest plot | 1 | Risk Ratio (IV, Random, 95% CI) | Totals not selected | |
| 25.3 Diarrhoea: grade 2+ (during RT) Show forest plot | 1 | Risk Ratio (IV, Random, 95% CI) | Totals not selected | |
| 25.4 Vomiting grade 2+ (during RT) Show forest plot | 1 | Risk Ratio (IV, Random, 95% CI) | Totals not selected | |
| 25.5 Rectal bleeding grade 2+ (during RT) Show forest plot | 1 | Risk Ratio (IV, Random, 95% CI) | Totals not selected | |
| 25.6 Medication for GI symptom control Show forest plot | 1 | Risk Ratio (IV, Random, 95% CI) | Totals not selected | |