Scolaris Content Display Scolaris Content Display

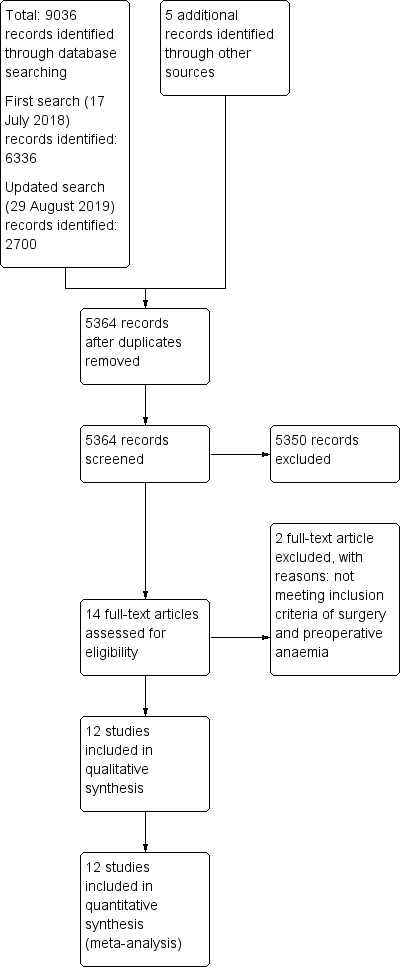
Study flow diagram.

Figuras y tablas -
Figure 1

Study flow diagram.

Risk of bias summary: review authors' judgements about each risk of bias item for each included study.

Figuras y tablas -
Figure 2

Risk of bias summary: review authors' judgements about each risk of bias item for each included study.

Risk of bias graph: review authors' judgements about each risk of bias item presented as percentages across all included studies.

Figuras y tablas -
Figure 3

Risk of bias graph: review authors' judgements about each risk of bias item presented as percentages across all included studies.

Funnel plot of comparison: 1 rHuEPO versus control treatment, outcome: 1.1 Transfusion.

Figuras y tablas -
Figure 4

Funnel plot of comparison: 1 rHuEPO versus control treatment, outcome: 1.1 Transfusion.

Forest plot of comparison: 1 rHuEPO versus control treatment, outcome: 1.1 Transfusion.

Figuras y tablas -
Figure 5

Forest plot of comparison: 1 rHuEPO versus control treatment, outcome: 1.1 Transfusion.

Forest plot of comparison: 1 rHuEPO versus control treatment with or without iron, outcome: 1.2 Haemoglobin concentration immediately prior to surgery (g/dL).

Figuras y tablas -
Figure 6

Forest plot of comparison: 1 rHuEPO versus control treatment with or without iron, outcome: 1.2 Haemoglobin concentration immediately prior to surgery (g/dL).

Forest plot of comparison: 1 rHuEPO versus control treatment with or without iron, outcome: 1.3 Number of RBC units transfused per participant (intraoperative to 5 days postoperative).

Figuras y tablas -
Figure 7

Forest plot of comparison: 1 rHuEPO versus control treatment with or without iron, outcome: 1.3 Number of RBC units transfused per participant (intraoperative to 5 days postoperative).

Forest plot of comparison: 1 rHuEPO versus control treatment with or without iron, outcome: 1.4 Mortality (within 30 days after surgery).

Figuras y tablas -
Figure 8

Forest plot of comparison: 1 rHuEPO versus control treatment with or without iron, outcome: 1.4 Mortality (within 30 days after surgery).

Forest plot of comparison: 1 rHuEPO versus control treatment with or without iron, outcome: 1.5 Adverse events (number of participants with any adverse event).

Figuras y tablas -
Figure 9

Forest plot of comparison: 1 rHuEPO versus control treatment with or without iron, outcome: 1.5 Adverse events (number of participants with any adverse event).

Forest plot of comparison: 1 rHuEPO versus control treatment with or without iron, outcome: 1.6 Length of hospital stay.

Figuras y tablas -
Figure 10

Forest plot of comparison: 1 rHuEPO versus control treatment with or without iron, outcome: 1.6 Length of hospital stay.

Comparison 1: rHuEPO versus control treatment with or without iron, Outcome 1: Transfusion (measured in participants during or up to 5 days after operation)

Figuras y tablas -
Analysis 1.1

Comparison 1: rHuEPO versus control treatment with or without iron, Outcome 1: Transfusion (measured in participants during or up to 5 days after operation)

Comparison 1: rHuEPO versus control treatment with or without iron, Outcome 2: Haemoglobin concentration immediately prior to surgery (g/dL)

Figuras y tablas -
Analysis 1.2

Comparison 1: rHuEPO versus control treatment with or without iron, Outcome 2: Haemoglobin concentration immediately prior to surgery (g/dL)

Comparison 1: rHuEPO versus control treatment with or without iron, Outcome 3: Number of RBC units transfused per participant (intraoperative to 5 days postoperative)

Figuras y tablas -
Analysis 1.3

Comparison 1: rHuEPO versus control treatment with or without iron, Outcome 3: Number of RBC units transfused per participant (intraoperative to 5 days postoperative)

Comparison 1: rHuEPO versus control treatment with or without iron, Outcome 4: Mortality (within 30 days after surgery)

Figuras y tablas -
Analysis 1.4

Comparison 1: rHuEPO versus control treatment with or without iron, Outcome 4: Mortality (within 30 days after surgery)

Comparison 1: rHuEPO versus control treatment with or without iron, Outcome 5: Adverse events (number of participants with any adverse event)

Figuras y tablas -
Analysis 1.5

Comparison 1: rHuEPO versus control treatment with or without iron, Outcome 5: Adverse events (number of participants with any adverse event)

Comparison 1: rHuEPO versus control treatment with or without iron, Outcome 6: Length of hospital stay

Figuras y tablas -
Analysis 1.6

Comparison 1: rHuEPO versus control treatment with or without iron, Outcome 6: Length of hospital stay

Summary of findings 1. rHuEPO with iron compared to control treatment with or without iron in preoperative anaemic adults undergoing non‐cardiac surgery

rHuEPO with iron compared to control treatment with or without iron in preoperative anaemic adults undergoing non‐cardiac surgery

Patient or population: adult participants, irrespective of gender and type of non‐cardiac surgery, with mild or severe preoperative anaemia
Setting: hospital (Europe, Canada, and South Korea)
Intervention: rHuEPO subcutaneously or intravenously with iron supplementation (enteral or parenteral)
Comparison: control treatment

Outcomes

Anticipated absolute effects* (95% CI)

Relative effect
(95% CI)

№ of participants
(studies)

Quality of the evidence
(GRADE)

Risk with

control treatment

Risk with rHuEPO + iron

Transfusion (measured in participants during or up to 5 days after operation)

444 per 1000

231 per 1000
(200 to 262)

RR 0.55
(0.38 to 0.80)

1880
(12 RCTs)

⊕⊕⊕⊝
MODERATE 1

Subgroup Hb concentration immediately prior to surgery (g/dL)

rHuEPO high (500 to 600 IU/kg BW)

The mean Hb ‐ rHuEPO high 500 to 600 IU/kg BW

ranged across control groups

from 10.7 to 12.4 g/dL.

MD 1.87 (1.26 higher to 2.49 higher)

852
(3 RCTs)

⊕⊕⊝⊝
LOW1 2

Subgroup Hb concentration immediately prior to surgery (g/dL)

rHuEPO low (150 to 300 IU/kg BW)

The mean Hb ‐ rHuEPO low 150 to 300 IU/kg BW

ranged across control groups

from 11.9 to 12.1 g/dL.

MD 0.11 (0.46 lower to 0.69 higher)

334
(4 RCTs)

⊕⊕⊝⊝
LOW1 2

Number of RBC units transfused per participant (intraoperative to 5 days postoperative)

The mean number of RBC units ranged across control groups from

1.28 to 2.69.

MD 0.09 lower
(0.23 lower to 0.05 higher)

1420
(6 RCTs)

⊕⊕⊕⊝
MODERATE3

Mortality (within 30 days after surgery)

45 per 1000

54 per 1000
(18 to 165)

RR 1.18
(0.39 to 3.63)

230
(2 RCTs)

⊕⊕⊕⊝
MODERATE4

Adverse events (number of participants with any adverse event)

88 per 1000

81 per 1000
(59 to 111)

RR 0.93
(0.68 to 1.28)

1722
(10 RCTs)

⊕⊕⊕⊝
MODERATE4

Length of hospital stay

The mean length of hospital stay ranged across

control groups from 7 to 13.

MD 1.07 lower (4.12 lower to 1.98 higher)

293
(3 RCTs)

⊕⊝⊝⊝
LOW1 4

*The risk in the intervention group (and its 95% confidence interval) is based on the assumed risk in the comparison group and the relative effect of the intervention (and its 95% CI).

BW: body weight; CI: confidence interval; Hb: haemoglobin; IU: international unit; MD: mean difference; RBC: red blood cells; RCT: randomized controlled trial; rHuEPO: recombinant human erythropoietin; RR: risk ratio

GRADE Working Group grades of evidence
High quality: We are very confident that the true effect lies close to that of the estimate of the effect.
Moderate quality: We are moderately confident in the effect estimate: the true effect is likely to be close to the estimate of the effect, but there is a possibility that it is substantially different.
Low quality: Our confidence in the effect estimate is limited: the true effect may be substantially different from the estimate of the effect.
Very low quality: We have very little confidence in the effect estimate: the true effect is likely to be substantially different from the estimate of effect.

1Downgraded 1 level due to inconsistency. Unexplained inconsistency, with widely different point estimates.
2Downgraded 1 level due to risk of bias (study limitations) (sensitivity analysis).
3Downgraded 1 level due to differences between studies regarding counting units (imprecision).
4Downgraded 1 level due to imprecision: the 95% CI is consistent with both important benefit and harm.

Figuras y tablas -
Summary of findings 1. rHuEPO with iron compared to control treatment with or without iron in preoperative anaemic adults undergoing non‐cardiac surgery
Table 1. Sensitivity analysis, risk of bias

Outcome

Statistical method

All studies

Trials with low risk of bias for

random sequence generation,

blinding, incomplete outcome data

Studies

Effect estimate (95% CI)

Studies

Effect estimate (95% CI)

Transfusion (measured in participants during or up to 5 days after operation)

Risk ratio
(MH Random 95% CI)

12

RR 0.55 (0.38; 0.80)

5

RR 0.79 (0.61; 1.01)

Hb concentration preoperatively

(directly before surgery)

Mean difference
(IV Random 95% CI)

7

MD 0.97 (0.07; 1.87)

2

MD −0.31 (−0.69; 0.08)

Subgroup Hb concentration immediately prior to surgery (g/dL)

rHuEPO high (500 to 600 IU/kg BW)

Mean difference
(IV Random 95% CI)

3

MD 1.87 (1.26; 2.49)

0

Subgroup Hb concentration immediately prior to surgery (g/dL)

rHuEPO low (150 to 300 IU/kg BW)

Mean difference
(IV Random 95% CI)

4

MD 0.11 (−0.46; 0.69)

2

MD 0.15 (−1.28; 1.58)

Number of RBC units transfused per participant

(intraoperative to 5 days postoperative)

Mean difference
(IV Random 95% CI)

6

MD −0.09 (−0.23; 0.05)

3

MD −0.09 (−0.27; 0.09)

Mortality

(within 30 days after surgery)

Risk ratio
(MH Random 95% CI)

2

RR 1.18 (0.39; 3.63)

1

RR 1.25 (0.35; 4.52)

Adverse events (number of participants
with any adverse event)

Risk ratio
(MH Random 95% CI)

10

RR 0.97 (0.70;
1.34)

5

RR 0.92 (0.63;
1.33)

Length of hospital stay

Mean difference
(IV Random 95% CI)

3

MD −1.07 (−4.12; 1.98)

2

MD 0.65 (0.05;
1.25)

BW: body weight; CI: confidence interval; Hb: haemoglobin; IU: international unit; IV: inverse variance; MD: mean difference; MH: Mantel‐Haenszel; RBC: red blood cells; rHuEPO: recombinant human erythropoietin; RR: risk ratio

Figuras y tablas -
Table 1. Sensitivity analysis, risk of bias
Table 2. Sensitivity analysis (random‐effects model/fixed‐effect model)

Outcome

Statistical heterogeneity (I2)

Fixed‐effect (95% CI)

Random‐effects (95% CI)

Transfusion (measured in participants during or up to 5 days after operation)

84%

RR 0.52 (0.45, 0.59)

RR 0.55 (0.38, 0.45)

Hb concentration preoperatively

(directly before surgery)

97%

MD 1.58 (1.47, 1.70)

MD 0.97 (0.07, 1.87)

Subgroup Hb concentration immediately prior to surgery (g/dL)

rHuEPO high (500 to 600 IU/kg BW)

69%

MD −0.11 (−0.39, 0.17)

MD 0.11 (−0.46, 0.69)

Subgroup Hb concentration immediately prior to surgery (g/dL)

rHuEPO low (150 to 300 IU/kg BW)

89%

MD 1.94 (1.81, 2.07)

MD 1.87 (1.26, 2.49)

Number of RBC units transfused

per participant (intraoperative to 5 days postoperative)

0%

MD −0.09 (−0.23, 0.05)

MD −0.09 (−0.23, 0.05)

Mortality (within 30 days after surgery)

0%

RR 1.19 (0.39, 3.63)

RR 1.18 (0.39, 3.63)

Adverse events (number of participants with any adverse event)

0%

RR 0.93 (0.68, 1.28)

RR 0.97 (0.70, 1.34)

Length of hospital stay

87%

MD 0.59 (−0.00, 1.18)

MD −1.07 (−4.12, 1.98)

BW: body weight; CI: confidence interval; Hb: haemoglobin; IU: international unit; MD: mean difference; RBC: red blood cells; rHuEPO: recombinant human erythropoietin; RR: risk ratio

Figuras y tablas -
Table 2. Sensitivity analysis (random‐effects model/fixed‐effect model)
Comparison 1. rHuEPO versus control treatment with or without iron

Outcome or subgroup title

No. of studies

No. of participants

Statistical method

Effect size

1.1 Transfusion (measured in participants during or up to 5 days after operation) Show forest plot

12

1880

Risk Ratio (M‐H, Random, 95% CI)

0.55 [0.38, 0.80]

1.2 Haemoglobin concentration immediately prior to surgery (g/dL) Show forest plot

7

1186

Mean Difference (IV, Random, 95% CI)

0.97 [0.07, 1.87]

1.2.1 rHuEPO low 150 to 300 IU/kg body weight

4

334

Mean Difference (IV, Random, 95% CI)

0.11 [‐0.46, 0.69]

1.2.2 rHuEPO high 500 to 600 IU/kg body weight

3

852

Mean Difference (IV, Random, 95% CI)

1.87 [1.26, 2.49]

1.3 Number of RBC units transfused per participant (intraoperative to 5 days postoperative) Show forest plot

6

1420

Mean Difference (IV, Fixed, 95% CI)

‐0.09 [‐0.23, 0.05]

1.4 Mortality (within 30 days after surgery) Show forest plot

2

230

Risk Ratio (M‐H, Fixed, 95% CI)

1.19 [0.39, 3.63]

1.5 Adverse events (number of participants with any adverse event) Show forest plot

10

1722

Risk Ratio (M‐H, Fixed, 95% CI)

0.93 [0.68, 1.28]

1.6 Length of hospital stay Show forest plot

3

293

Mean Difference (IV, Random, 95% CI)

‐1.07 [‐4.12, 1.98]

Figuras y tablas -
Comparison 1. rHuEPO versus control treatment with or without iron