Daikenchuto para la reducción del íleo posoperatorio en los pacientes sometidos a una cirugía abdominal electiva
Appendices
Appendix 1. CENTRAL search strategy
Cochrane Central Register of Controlled Trials (CENTRAL; 2017, Issue 6) in The Cochrane Library (searched 3 July 2017; 54 hits)
#1 (daikenchuto or dai‐kenchu‐to or dai‐ken‐chu‐to or DKT or TJ‐100 or TU‐100):ti,ab,kw
Appendix 2. MEDLINE search strategy
Ovid MEDLINE(R) Epub Ahead of Print, In‐Process & Other Non‐Indexed Citations, Ovid MEDLINE(R) Daily and Ovid MEDLINE(R) (1946 to 3 July 2017; 230 hits)
1. (daikenchuto or dai‐kenchu‐to or dai‐ken‐chu‐to or DKT or TJ‐100 or TU‐100).mp
Appendix 3. Embase search strategy
Embase Ovid (1974 to 3 July 2017; 450 hits)
1. (daikenchuto or dai‐kenchu‐to or dai‐ken‐chu‐to or DKT or TJ‐100 or TU‐100).mp.
Appendix 4. ICHUSHI search strategy
Igaku Chuo Zasshi (ICHUSHI) (1977 to 3 July 2017; 1458 hits)
1. (daikenchuto or dai‐kenchu‐to or dai‐ken‐chu‐to or DKT or TJ‐100 or TU‐100).mp.
Appendix 5. Criteria for judging risk of bias in the 'Risk of bias' assessment tool
| Random sequence generation: selection bias (biased allocation to interventions) due to inadequate generation of a randomized sequence | |
| Criteria for a judgement of low risk of bias | The investigators describe a random component in the sequence generation process such as:
*Minimisation may be implemented without a random element, and this is considered to be equivalent to being random. |
| Criteria for a judgement of high risk of bias | The investigators describe a non‐random component in the sequence generation process. Usually, the description would involve some systematic, non‐random approach, for example:
Other non‐random approaches happen much less frequently than the systematic approaches mentioned above and tend to be obvious. They usually involve judgement, or some method of non‐random categorisation of participants, for example:
|
| Criteria for a judgement of unclear risk of bias | Insufficient information about the sequence generation process to permit judgement of low risk or high risk. |
| Allocation concealment: selection bias (biased allocation to intervention) due to inadequate concealment of allocations prior to assignment | |
| Criteria for a judgement of low risk of bias | Participants and investigators enrolling participants could not foresee assignment because one of the following, or an equivalent method, was used to conceal allocation:
|
| Criteria for a judgement of high risk of bias | Participants or investigators enrolling participants could possibly foresee assignment and thus introduce selection bias, such as allocation based on:
|
| Criteria for a judgement of unclear risk of bias | Insufficient information to permit judgement of low risk or high risk. This is usually the case if the method of concealment is not described or not described in sufficient detail to allow a definite judgement – for example if the use of assignment envelopes is described, but it remains unclear whether envelopes were sequentially‐numbered, opaque and sealed. |
| Blinding of participants and personnel: performance bias due to knowledge of the allocated interventions by participants and personnel during the study | |
| Criteria for a judgement of low risk of bias | Any one of the following:
|
| Criteria for a judgement of high risk of bias | Any one of the following:
|
| Criteria for a judgement of unclear risk of bias | Any one of the following:
|
| Blinding of outcome assessment: detection bias due to knowledge of the allocated interventions by outcome assessors | |
| Criteria for a judgement of low risk of bias | Any one of the following:
|
| Criteria for a judgement of high risk of bias | Any one of the following:
|
| Criteria for a judgement of unclear risk of bias | Any one of the following:
|
| Incomplete outcome data: attrition bias due to amount, nature, or handling of incomplete data | |
| Criteria for a judgement of low risk of bias | Any one of the following:
|
| Criteria for a judgement of high risk of bias | Any one of the following:
|
| Criteria for a judgement of unclear risk of bias | Any one of the following:
|
| Selective reporting: reporting bias due to selective outcome reporting | |
| Criteria for a judgement of low risk of bias | Any of the following:
|
| Criteria for a judgement of high risk of bias | Any one of the following:
|
| Criteria for a judgement of unclear risk of bias | Insufficient information to permit judgement of low risk or high risk. It is likely that the majority of studies will fall into this category. |
| Other bias: bias due to problems not covered elsewhere in the table | |
| Criteria for a judgement of low risk of bias | The study appears to be free of other sources of bias. |
| Criteria for a judgement of high risk of bias | There is at least one important risk of bias. For example, the study:
|
| Criteria for a judgement of unclear risk of bias | There may be a risk of bias, but there is either:
|

Study flow diagram

Risk of bias graph: review authors' judgements about each risk of bias item presented as percentages across all included studies

Risk of bias summary: review authors' judgements about each risk of bias item for each included study
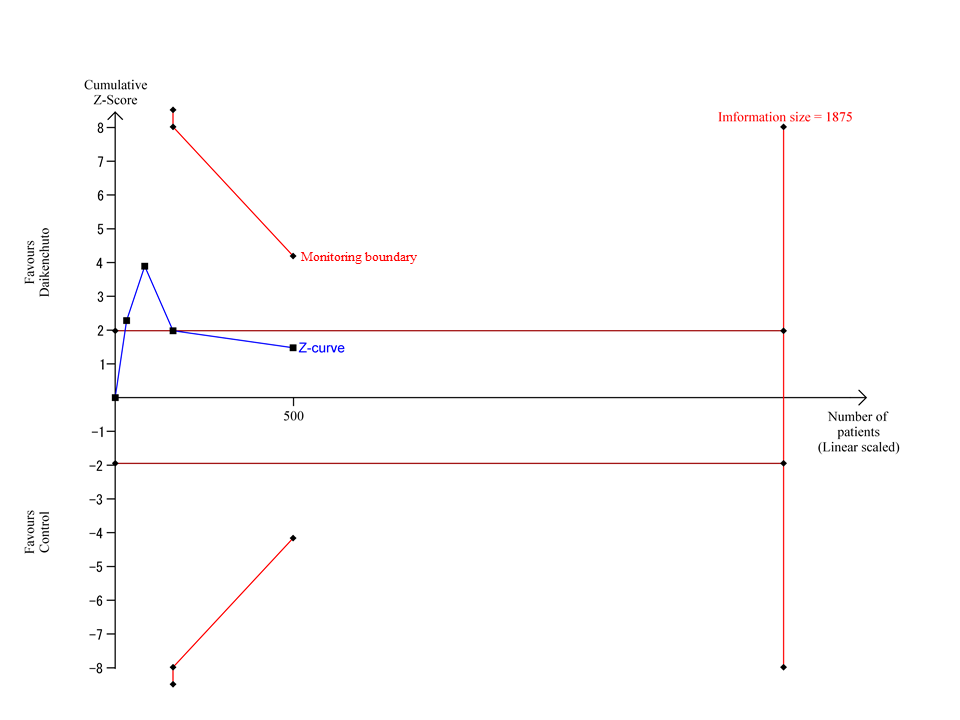
Trial Sequential Analysis for time from completion of operation to first bowel movement
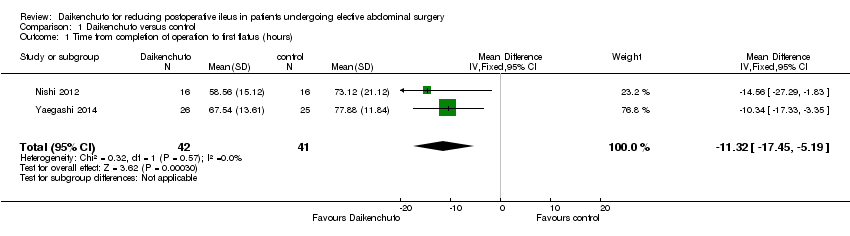
Comparison 1 Daikenchuto versus control, Outcome 1 Time from completion of operation to first flatus (hours).

Comparison 1 Daikenchuto versus control, Outcome 2 Time from completion of operation to first bowel movement (hours).
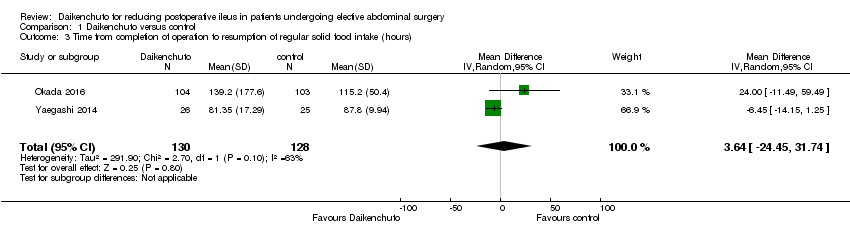
Comparison 1 Daikenchuto versus control, Outcome 3 Time from completion of operation to resumption of regular solid food intake (hours).
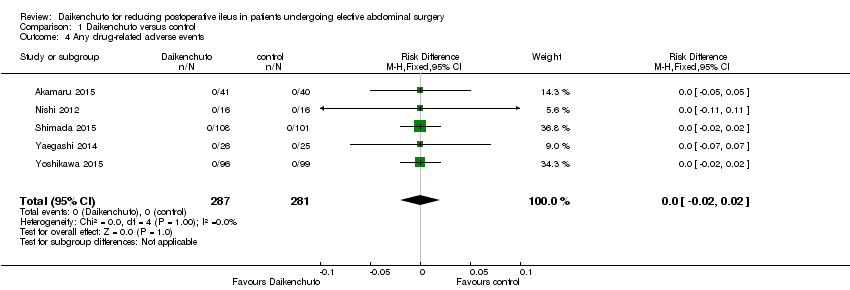
Comparison 1 Daikenchuto versus control, Outcome 4 Any drug‐related adverse events.

Comparison 1 Daikenchuto versus control, Outcome 5 Patient satisfaction.

Comparison 1 Daikenchuto versus control, Outcome 6 Incidence ratio of any re‐interventions before leaving hospital.

Comparison 1 Daikenchuto versus control, Outcome 7 Length of postoperative hospital stay (days).
| Daikenchuto compared to control for reducing postoperative ileus | ||||||
| Participants: patients undergoing elective abdominal surgery, either open or laparoscopic Setting: hospital Intervention: all doses of Daikenchuto, administered orally and regularly in the preoperative or postoperative periods, or both Comparison: placebo, any intestinal stimulant, or no treatment | ||||||
| Outcomes | Anticipated absolute effects* (95% CI) | Relative effect | № of participants | Certainty of the evidence | Comments | |
| Risk with control | Risk with Daikenchuto | |||||
| Time from completion of operation to first flatus (hours) | The mean time from completion of operation to first flatus in the control groups was 75.50 hours | The mean time from completion of operation to first flatus in the Daikenchuto groups was 11.32 hours less | ‐ | 83 | ⊕⊝⊝⊝ | |
| Time from completion of operation to first bowel movement (hours) | The mean time from completion of operation to first bowel movement in the control groups was 105.15 hours | The mean time from completion of operation to first bowel movement in the Daikenchuto groups was 9.44 hours less (22.22 hours less to 3.35 hours more) | ‐ | 500 | ⊕⊝⊝⊝ | |
| Time from completion of operation to resumption of regular solid food intake (hours) | The mean time from completion of operation to resumption of regular solid food intake in the control groups was 101.50 hours | The mean time from completion of operation to resumption of regular solid food intake in the Daikenchuto groups was 3.64 hours more | ‐ | 258 | ⊕⊝⊝⊝ | |
| Any drug‐related adverse events (CTCAE grade ≥ 2) | Study population | RD 0.00 (‐0.02 to 0.02) | 568 | ⊕⊕⊝⊝ | ||
| No events were reported in either arm in any of the studies | ||||||
| Patient satisfaction on day of discharge (Gastrointestinal Symptom Rating Scale (GSRS)) Range: a higher score represents greater satisfaction | The mean patient satisfaction in the control group on the day of discharge was 1.92 | The mean patient satisfaction in the Daikenchuto group on the day of discharge was 0.09 points higher | ‐ | 81 | ⊕⊝⊝⊝ | |
| Incidence ratio of any re‐interventions before leaving hospital | Study population | RR 0.99 | 207 | ⊕⊕⊕⊝ | ||
| 10 per 1000 | 10 per 1000 | |||||
| Length of postoperative hospital stay (days) | The mean length of postoperative hospital stay for the control group was 17.37 days | The mean length of postoperative hospital stay for the Daikenchuto groups was 0.49 days lower | ‐ | 292 | ⊕⊕⊝⊝ | |
| *The risk in the intervention group (and its 95% confidence interval) is based on the assumed risk in the comparison group and the relative effect of the intervention (and its 95% CI). | ||||||
| GRADE Working Group grades of evidence | ||||||
| 1 Downgraded by one level because of lack of blinding of participants, personnel, and outcome assessment 2 Downgraded by two levels because of a very small sample size 3 Downgraded by one level because of substantial heterogeneity 4 Downgraded by one level because of imprecision (95% confidence interval overlapped no effect) | ||||||
| Outcome or subgroup title | No. of studies | No. of participants | Statistical method | Effect size |
| 1 Time from completion of operation to first flatus (hours) Show forest plot | 2 | 83 | Mean Difference (IV, Fixed, 95% CI) | ‐11.32 [‐17.45, ‐5.19] |
| 2 Time from completion of operation to first bowel movement (hours) Show forest plot | 4 | 500 | Mean Difference (IV, Random, 95% CI) | ‐9.44 [‐22.22, 3.35] |
| 3 Time from completion of operation to resumption of regular solid food intake (hours) Show forest plot | 2 | 258 | Mean Difference (IV, Random, 95% CI) | 3.64 [‐24.45, 31.74] |
| 4 Any drug‐related adverse events Show forest plot | 5 | 568 | Risk Difference (M‐H, Fixed, 95% CI) | 0.0 [‐0.02, 0.02] |
| 5 Patient satisfaction Show forest plot | 1 | 81 | Mean Difference (IV, Fixed, 95% CI) | 0.09 [‐0.19, 0.37] |
| 6 Incidence ratio of any re‐interventions before leaving hospital Show forest plot | 1 | 207 | Risk Ratio (M‐H, Fixed, 95% CI) | 0.99 [0.06, 15.62] |
| 7 Length of postoperative hospital stay (days) Show forest plot | 3 | 292 | Mean Difference (IV, Fixed, 95% CI) | ‐0.49 [‐1.21, 0.22] |