| What is the diagnostic accuracy of 18F‐florbetapir PET amyloid biomarker for predict progression to ADD, any other form of dementia (non‐ADD) or any form of dementia in people with MCI? |
| Descriptive |
| Patient population | Participants diagnosed with MCI at time of performing the test using any of the Petersen criteria or Winblad criteria or CDR = 0.5 or any 16 definitions included by Matthews (Matthews 2008). |
| Sources of referral | Not reported (n = 2) Mixed (memory clinics, newspaper ads, radio, and other public media campaigns) (n = 1) |
| MCI criteria | ADNI criteria, CDR 0.5 criterion was included (n = 2) CIND (cognitive impairment not dementia) (Matthews 2008) (n = 1) |
| Sampling procedure | Unclear (n = 3) |
| Prior testing | The only testing prior to performing the 18F‐florbetapir PET amyloid biomarker was the application of diagnostic criteria for identifying participants with MCI |
| Settings | Community and institutionalised (n = 1) Not reported (n = 2) |
| Index test | 18F‐florbetapir PET |
| Threshold prespecified at baseline | Yes (n = 3) |
| Threshold interpretation | Visual (n = 3) Quantitative (n = 1) |
| Threshold | Visual: -
Increased tracer uptake reduced or absent white matter/gray matter contrast in at least one cortical (frontal, parietal, temporal, occipital) region detectable on more than two adjacent scan slices (n = 1) -
Amyloid burden based on successive levels of florbetapir retention from from 0 (no amyloid) to 4 (high levels of cortical amyloid). The median of the three visual scores was used to dichotomize participants into Aβ (‐) (score, 0 to 1 point) and Aβ (+) (score, 2 to 4 points) (n = 2) SUVR (Standardised Uptake Volume ratio): |
| 18F‐florbetapir retention region | Global cortex (n = 1) |
| Reference Standard | Alzheimer’s disease dementia: NINCDS‐ADRDA (n = 1) Unclear (n = 1) Any form of dementia: DSM‐IV criteria for dementia (n = 1) |
| Target condition | Progression from MCI to Alzheimer’s disease dementia or any other forms of dementia (non‐ADD) or any form of dementia |
| Included studies | Prospectively well‐defined cohorts with any accepted definition of MCI (as above). Three studies (N = 458 participants) were included. Number of participants included in analysis: 453. |
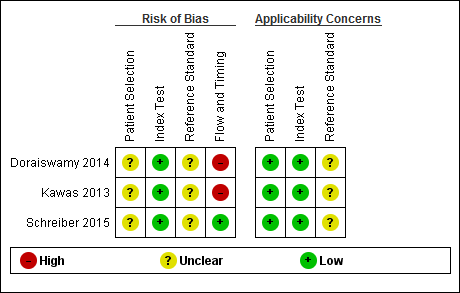
| Quality concerns | The participant selection and reference standard QUADAS‐2 domain: unclear risk of bias. The index test domain: low risk of bias in all three included studies. The flow and timing domain: high risk of bias in the two included studies. Unclear concerns about applicability in the reference standard domain in all three included studies. |
| Limitations | Limited investigation of heterogeneity and sensitivity analysis due to insufficient number of studies. We were unable to evaluate progression from MCI to any other form of dementia (non‐ADD) due to lack of included studies. |
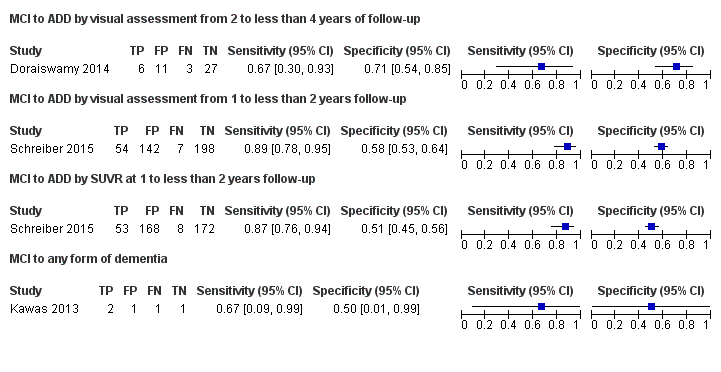
| Test | Studies | Cases/Participants | Sensitivity | Specificity | Consequences in a cohort of 100 |
| Proportion converting1 | Missed cases2 | Overdiagnosed2 |
| Alzheimer's disease dementia |
| 18F‐florbetapir by visual assessment from one to less than two years of follow‐up (Schreiber 2015) | 1 | 61/401 | 89% (95% CI 78% to 95%) | 58% (95% CI 53% to 64%) | 15 | 2 | 36 |
| 18F‐florbetapir by quantitative assessment from one to less than two years of follow‐up (Schreiber 2015) | 1 | 61/401 | 87% (95% CI 76% to 94%) | 51% (95% CI 45% to 56%) | 15 | 2 | 42 |
| 18F‐florbetapir by visual assessment from two to less than four years of follow‐up (Doraiswamy 2014) | 1 | 9/47 | 67% (95% CI 30% to 93%) | 71% (95% CI 54% to 85%) | 19 | 6 | 23 |
| Any form of dementia |
| 18F‐florbetapir by visual assessment from one to less than two years of follow‐up (Kawas 2013) | 1 | 3/5 | 67% (95% CI 9% to 99%) | 50% (95% CI 1% to 99%) | 60 | 20 | 20 |
| Investigation of heterogeneity and sensitivity analysis: The planned investigations were not possible due to the limited number of studies available for each analysis. |
| Conclusions:18F‐florbetapir PET scan is not an accurate test for detecting progression from MCI to Alzheimer’s disease dementia or any form of dementia. The strength of the evidence was weak because of considerable variation in study methods, unclear methodological quality due to poor reporting, and high risk of bias due to possible conflict of interest. There is a need for conducting studies using standardised 18F‐florbetapir PET scan methodology in larger populations. |