Hearing aids for mild to moderate hearing loss in adults
Abstract
Background
The main clinical intervention for mild to moderate hearing loss is the provision of hearing aids. These are routinely offered and fitted to those who seek help for hearing difficulties. By amplifying and improving access to sounds, and speech sounds in particular, the aim of hearing aid use is to reduce the negative consequences of hearing loss and improve participation in everyday life.
Objectives
To evaluate the effects of hearing aids for mild to moderate hearing loss in adults.
Search methods
The Cochrane ENT Information Specialist searched the ENT Trials Register; the Cochrane Register of Studies Online; MEDLINE; PubMed; EMBASE; CINAHL; Web of Science; ClinicalTrials.gov; ICTRP and additional sources for published and unpublished trials. The date of the search was 23 March 2017.
Selection criteria
Randomised controlled trials (RCTs) of hearing aids compared to a passive or active control in adults with mild to moderate hearing loss.
Data collection and analysis
We used the standard methodological procedures expected by Cochrane. The primary outcomes in this review were hearing‐specific health‐related quality of life and the adverse effect pain. Secondary outcomes were health‐related quality of life, listening ability and the adverse effect noise‐induced hearing loss. We used GRADE to assess the quality of the evidence for each outcome; this is indicated in italics.
Main results
We included five RCTs involving 825 participants. The studies were carried out in the USA and Europe, and were published between 1987 and 2017. Risk of bias across the studies varied. Most had low risk for selection, reporting and attrition bias, and a high risk for performance and detection bias because blinding was inadequate or absent.
All participants had mild to moderate hearing loss. The average age across all five studies was between 69 and 83 years. The duration of the studies ranged between six weeks and six months.
There was a large beneficial effect of hearing aids on hearing‐specific health‐related quality of life associated with participation in daily life as measured using the Hearing Handicap Inventory for the Elderly (HHIE, scale range 1 to 100) compared to the unaided/placebo condition (mean difference (MD) ‐26.47, 95% confidence interval (CI) ‐42.16 to ‐10.77; 722 participants; three studies) (moderate‐quality evidence).
There was a small beneficial effect of hearing aids on general health‐related quality of life (standardised mean difference (SMD) ‐0.38, 95% CI ‐0.55 to ‐0.21; 568 participants; two studies) (moderate‐quality evidence). There was a large beneficial effect of hearing aids on listening ability (SMD ‐1.88, 95% CI ‐3.24 to ‐0.52; 534 participants; two studies) (moderate‐quality evidence).
Adverse effects were measured in only one study (48 participants) and none were reported (very low‐quality evidence).
Authors' conclusions
The available evidence concurs that hearing aids are effective at improving hearing‐specific health‐related quality of life, general health‐related quality of life and listening ability in adults with mild to moderate hearing loss. The evidence is compatible with the widespread provision of hearing aids as the first‐line clinical management in those who seek help for hearing difficulties. Greater consistency is needed in the choice of outcome measures used to assess benefits from hearing aids. Further placebo‐controlled studies would increase our confidence in the estimates of these effects and ascertain whether they vary according to age, gender, degree of hearing loss and type of hearing aid.
PICO
Plain language summary
Hearing aids for mild to moderate hearing loss in adults
Review question
We reviewed the evidence on the effects that hearing aids have on everyday life in adults with mild to moderate hearing loss. We were interested in (1) a person's ability to take part in everyday situations, (2) general health‐related quality of life, (3) ability to listen to other people, and (4) harm, such as pain or over‐exposure to noise.
Background
Hearing loss is very common and adults with hearing loss may be offered hearing aids. These devices increase the loudness, and may improve the clarity, of sounds so that they are easier to hear. The main goal of hearing aids is to reduce the impact of hearing loss and to improve a person's ability to take part in everyday life. Although hearing aids are the most common technology for adults with hearing loss and are in widespread use, it is not clear how beneficial they are.
Study characteristics
The evidence is up to date to 23 March 2017. We found five clinical studies involving 825 adults with mild to moderate hearing loss who were randomly given either hearing aids, no hearing aids or placebo hearing aids. Studies involved older adults with the average age within studies between 69 and 83 years. The duration of the studies was between six weeks and six months.
Key results
We found evidence in three studies that hearing aids have a large beneficial effect in improving the ability of adults with mild to moderate hearing loss to take part in everyday situations. Hearing aids have a small beneficial effect in improving general health‐related quality of life, such as physical, social, emotional and mental well‐being, and have a large effect in improving the ability to listen to other people.
Only one study attempted to measure harms due to hearing aids. None were reported.
Quality of the evidence
We judged the evidence that hearing aids improve the ability to take part in everyday situations, improve general health‐related quality of life and improve listening ability to be of moderate quality. This means that while we are reasonably confident that the reported benefits of hearing aids are real, there is a possibility that if further studies are conducted the size of the benefit might differ. We judged the quality of evidence for harms to be very low, because this was only measured in one small study.
Conclusions
We found that hearing aids improve the ability of adults with mild to moderate hearing loss to take part in everyday life, their general quality of life and their ability to listen to other people. If an adult with mild to moderate hearing loss seeks help for their hearing difficulties, hearing aids are an effective clinical option. It is important that future studies measure benefits consistently and report benefits separately for different age groups, genders, levels of hearing loss and types of hearing aids.
Authors' conclusions
Summary of findings
| Hearing aids versus no hearing aids for mild to moderate hearing loss in adults | |||||
| Patient or population: adults with mild to moderate hearing loss | |||||
| Outcomes No. of participants | Anticipated absolute effects (95% CI) | Quality | What happens* | ||
| Without hearing aids | With hearing aids | Difference | |||
| Hearing‐specific HRQoL assessed with: HHIE (range 0 to 100) Follow‐up: range 6 to 16 weeks No. of participants: 722 (3 RCTs) | The mean hearing‐specific HRQoL score was 39 | — | Mean 26 lower (42 to 11 lower) | ⊕⊕⊕⊝ | Lower score indicates better hearing‐specific HRQoL. The mean difference corresponds to a large effect size (SMD ‐1.38, 95% CI ‐2.02 to ‐0.75) favouring hearing aids. |
| Health‐related QoL assessed with: WHO‐DAS II (range 0 to 100) and the SELF (range 54 to 216) Follow‐up: range 2 months to 16 weeks No. of participants: 568 (2 RCTs) | — | — | SMD 0.38 lower (0.55 lower to 0.21 lower) | ⊕⊕⊕⊝ | Lower score indicates better HRQoL. The SMD corresponds to a small effect size favouring hearing aids, which is equivalent to a 6‐point decrease (9‐ to 3‐point decrease) on the 0 to 100 scale of the WHO‐DAS II5. |
| Listening ability assessed with: PHAP (range 0 to 1) and APHAB (range 0 to 100) Follow‐up: 6 weeks to 2 months No. of participants: 534 (2 RCTs) | — | — | SMD 1.88 lower (3.24 lower to 0.52 lower) | ⊕⊕⊕⊝ | Lower score indicates improved listening ability. The SMD corresponds to a large effect size favouring hearing aids, which is equivalent to a 29‐point decrease (50‐ to 8‐point decrease) on the 0 to 100 scale of the APHAB6. |
| Adverse effect ‐ pain No. of participants: 48 (1 RCT) | Adverse effects related to pain were measured in 1 study: none were reported. | ⊕⊝⊝⊝ VERY LOW7 | There was too little information to estimate the risk of pain. | ||
| Adverse effect ‐ noise‐induced hearing loss No. of participants: 48 (1 RCT) | Adverse effects related to noise‐induced hearing loss were measured in 1 study: none were reported. | ⊕⊝⊝⊝ VERY LOW7 | There was too little information to estimate the risk of noise‐induced hearing loss. | ||
| *The equivalent change in the intervention group (and its 95% confidence interval) is based on the standard deviation in the comparison group from a representative study (see footnotes for each outcome) and the relative effect of the intervention (and its 95% CI). | |||||
| GRADE Working Group grades of evidence | |||||
| 1Quality of evidence downgraded by one level because all studies have either a rating of unclear and/or high risk bias in at least one of these domains: selection bias, performance and/or detection bias. | |||||
Background
Description of the condition
Hearing loss is the most prevalent sensory deficit (Mathers 2000), and represents a major public health issue with substantial economic and societal costs. Untreated, adult hearing loss results in communication difficulties that can lead to social isolation and withdrawal, depression and reduced quality of life (Davis 2007). Hearing loss is also associated with an increased risk of dementia, although currently the underlying mechanism is unknown (Lin 2011).
According to the World Health Organization, hearing loss is the 13th most common global disease burden and the third leading cause of years lived with disability (YLD) (WHO 2008). Disabling hearing loss is estimated to affect 360 million people globally (5.3% of the world's population) (WHO 2012a). The prevalence of hearing loss increases with age (Akeroyd 2014), and given the ageing society it is predicted that by 2030 adult‐onset hearing loss will be the seventh largest disease burden, above diabetes and human immunodeficiency virus (HIV) (WHO 2008).
Epidemiological data suggest that the majority of cases of hearing loss in adults are sensorineural in nature (92%) and occur bilaterally (94.8%) (Cruickshanks 1998). There are numerous definitions of hearing loss across different countries and organisations (Timmer 2015). In this review, hearing loss is defined according to averaged pure‐tone thresholds across combinations of frequencies (0.5 kHz, 1.0 kHz, 2.0 kHz and 4.0 kHz), and grades of hearing impairment are consistent with the World Health Organization (Mathers 2000). The majority of hearing losses (92%) are those that are defined as mild or moderate (AoHL 2015). Mild (or slight) hearing loss is indicated as 26 to 40 dB hearing level (HL) and described as the ability to hear and repeat words spoken in a normal voice at one metre. Moderate hearing loss is indicated as 41 to 60 dB HL and described as the ability to hear and repeat words using a raised voice at one metre (Mathers 2000). In addition to a loss of hearing sensitivity there may be additional sensory deficits of temporal and spectral processing that contribute to speech perception (Hopkins 2011), not necessarily captured by pure‐tone audiometry.
Description of the intervention
There are no effective medical or surgical treatments for mild to moderate sensorineural hearing loss (Chisolm 2007), so the main clinical intervention is the use of acoustic hearing aids (Kochkin 2009). It was estimated that in 2012, 11 million hearing aids were sold worldwide (Kirkwood 2013). Hearing aids detect and amplify sound, and deliver an amplified acoustic signal via air conduction to the external auditory canal on the same side as the signals are detected. Hearing aids are described according to where they are worn (e.g. behind‐the‐ear, in‐the‐ear, in‐the‐canal, completely‐in‐the‐canal) or classified by their technology (i.e. analogue, digitally programmable analogue or digital hearing aids) (Dillon 2012). Hearing aids are typically fitted by healthcare professionals who have been trained in audiology or the dispensing of hearing aids.
Hearing aid fittings can be unilateral or bilateral and they are typically programmed according to the user's pure‐tone hearing thresholds using hearing aid prescription formulae (Mueller 2005). Changes to the hearing aid programme may be made according to subjective preference for sound quality, such as the perceived loudness of sounds or the clarity of speech (McArdle 2005). Hearing aid orientation that includes information on hearing aid use and care, expectations and limitations is typically offered as usual care (Boothroyd 2007; Reese 2005).
The use of hearing aids to amplify sounds does not necessarily restore hearing function. Frequency response characteristics of hearing aids, distortions arising from peak clipping, poor clarity or loudness of speech can all have an impact on successful listening (Dillon 2012). As hearing aids amplify all sounds, not just speech sounds, their use can lead to continued communication difficulties, particularly in noisy backgrounds (Picou 2013). These and other reasons can lead to non‐use of hearing aids (McCormack 2013), with estimates of non‐use varying from 3% (Bertoli 2009) to 24% (Lupsakko 2005). Recent studies have shown non‐use at 10% (Aazh 2015) and 15.5% (Solheim 2017), consistent with commercial surveys (4.7% to 7% (Hougaard 2011), 12.4% (Kochkin 2010)). Additional interventions may be used to promote the use of hearing aids in people with hearing loss (Barker 2016).
How the intervention might work
The primary function of hearing aids is to amplify and improve the audibility of sounds, and speech in particular. However, improving the audibility of sounds or speech signals forms only one element within the broader concept of rehabilitating a person with hearing loss, where the overall aim is to reduce the negative consequences of hearing loss and improve communication. In order to communicate effectively, an individual needs to access the acoustic information (hearing, a passive process), employ attention and intention (listening, an active process), correctly interpret the acoustic and linguistic information (comprehension, a unidirectional process) and use and transmit this information effectively (communication, a bidirectional process) (Kiessling 2003). These processes can be mapped onto the International Classification of Functioning, Disability and Health (ICF, WHO 2001), which provides a theoretical framework upon which to measure the success of amplification using hearing aids.
Based on the ICF Core Set (Danermark 2013), the goal of amplification with hearing aids where there is mild to moderate hearing loss is to reduce the auditory deficits associated with body functions and structures, thereby reducing activity limitations and participation restrictions (Chisolm 2007; Kiessling 2003). Participation has been defined as involvement in a life situation, especially engagement in a social domain, such as family relationships, community life, employment, education and recreation and leisure (Danermark 2013; Resnik 2009; WHO 2002). Hearing‐related participation also has an emotional component, particularly feelings of social isolation and loneliness (Ventry 1982).
Improvements in the ability of a patient with hearing aids to detect and discriminate sounds and speech can be measured by acoustic outcomes (e.g. free‐field threshold and speech audiometry). The consequences of these improvements in terms of activities and participation can then be measured by patient‐reported outcomes such as self‐report questionnaires, which can be defined as either disease‐specific (e.g. hearing) or generic (e.g. health‐related quality of life). Generic health‐related quality of life measures generally show limited benefit from hearing aids as they lack sensitivity to the consequences of hearing loss (Joore 2002; Joore 2003; Stark 2004). There is, however, some evidence that the Health Utilities Index Mark 3 (HUI3) is useful (Barton 2004; Davis 2007). Currently, there is a lack of consensus on the optimal set of outcome measures to use in hearing research (Granberg 2014).
Why it is important to do this review
Hearing aids are routinely offered and fitted for people with hearing loss. It might seem obvious that such an intervention is bound to be associated with an improvement in a patient's ability to hear and to communicate, but is this true? If there is an improvement in a patient's ability to hear and communicate, how big an improvement is it? There is little high‐level evidence to answer these questions and to inform discussions around the effectiveness of hearing aids, their provision within a population and the approach to be taken by those who might fund such provision.
There are no recent or ongoing systematic reviews that provide the high‐level evidence to inform clinical decision‐making on this important topic. A previous systematic review of the published evidence included randomised controlled trials (RCTs) and non‐randomised trials published up to August 2004 that met specific criteria. It sought to address a specific objective: to determine if the use of hearing aids compared to the non‐use of hearing aids resulted in improvements in health‐related quality of life for adults with sensorineural hearing loss using disease‐specific and generic instruments (Chisolm 2007). The authors reported that there were only two RCTs suitable for inclusion at that time, although only one trial randomised the whole patient sample (Mulrow 1990), therefore limiting the generalisability of the findings and the robustness of the conclusions. A more recent systematic review that investigated hearing aid benefit in those with mild sensorineural hearing loss included 10 studies, but none of these were RCTs (Johnson 2016).
The present review does not compare the evidence for the bilateral versus unilateral fitting of hearing aids, for which there is an ongoing Cochrane Review (Browning 2017).
Objectives
To evaluate the effects of hearing aids for mild to moderate hearing loss in adults.
Methods
Criteria for considering studies for this review
Types of studies
We included randomised controlled trials and used the first treatment period of cross‐over trials (i.e. treated as a parallel‐arm trial) provided the study reporting permitted, where the unit of analysis was the individual participant.
Types of participants
Adults (≥ 18 years old) who have mild to moderate hearing loss. For inclusion, hearing loss of participants had to be either described qualitatively as 'mild' and/or 'moderate', or the study group had to be quantitatively defined as having an average pure‐tone threshold within the mild or moderate ranges of hearing loss as defined by the WHO (mild: 26 to 40 dB HL inclusive; moderate: 41 to 60 dB HL inclusive). Here, an average pure‐tone threshold is defined as the mean of at least two octave frequencies up to and including 4 kHz.
Types of interventions
Acoustic hearing aids, irrespective of where they are worn or the type of technology (analogue or digital).
We excluded hearing aids or implantable devices whose primary purpose is to deliver bone conduction sound or those that detect and deliver sound via air conduction to the contralateral ear.
The comparisons of interest were hearing aids versus either a passive control (no intervention, waiting list control; these were pooled in the meta‐analysis) or an active control that involved:
-
information/education only, listening tactics and communication training;
-
assistive listening devices; or
-
auditory training (we planned to analyse these second two in separate meta‐analyses).
We did not consider studies where the intervention was delivered in a group setting.
Types of outcome measures
The following outcomes were analysed in the review, but we did not use them as a basis for including or excluding studies. We analysed the data at the trial endpoint, with a planned subgroup analysis to compare different trial endpoints. The ranked hierarchy of instruments was derived from those reported in two systematic reviews (Chisolm 2007 Table 4; Granberg 2014 Table 4).
Primary outcomes
-
Hearing‐specific health‐related quality of life, where participation was the key domain. This was measured using self‐report questionnaires. Where multiple questionnaires were used in a study, we proposed a ranked hierarchy of instruments whereby we identified the primary outcome based on the following in order of importance:
-
Hearing Handicap Inventory for the Elderly (HHIE; Ventry 1982) or HHI for Adults (HHIA; Newman 1990), if the HHIE was not used;
-
Quantified Denver Scale of Communication (QDS; Tuley 1990);
-
Auditory Disability Preference ‐ Visual Analogue Scale (ADPI‐VAS; Joore 2002); and
-
any questionnaire not specified above that was relevant to hearing‐specific health‐related quality of life.
-
For example, if both the HHIE and QDS were included in one study, we would use only the HHIE in any meta‐analysis.
-
Adverse effect: pain. As reported by the patient as pain, discomfort, tenderness or skin irritation, or reported as occurrence of ear infection as a consequence of hearing aid fitting.
Secondary outcomes
-
Health‐related quality of life. A ranked hierarchy of self‐report outcome measures was proposed in the following order:
-
Health Utilities Index Mark 3 (HUI‐3; Furlong 2001);
-
EQ‐5D (Rabin 2001);
-
SF‐36 (Ware 1992), or if not reported other short forms of the SF‐36;
-
Glasgow Benefit Inventory (GBI; Robinson 1996);
-
World Health Organization Disability Assessment Schedule (WHO‐DAS; WHO 2012b);
-
Self‐Evaluation of Life Function (SELF; Linn 1984); and
-
any questionnaire not specified above that was relevant to health‐related quality of life.
-
-
Listening ability. A ranked hierarchy of self‐report outcome measures was proposed in the following order:
-
Abbreviated Profile of Hearing Aid Benefit (APHAB; Cox 1995);
-
Speech, Spatial and Qualities of Hearing (SSQ; Gatehouse 2004);
-
Glasgow Hearing Aid Benefit Profile (GHABP, residual disability subscale; Gatehouse 1999); and
-
any questionnaire not specified above that was relevant to self‐report of listening ability.
-
-
Adverse effect: noise‐induced hearing loss, for example due to over‐amplification from inappropriate hearing aid fitting.
Search methods for identification of studies
The Cochrane ENT Information Specialist conducted systematic searches for randomised controlled trials and controlled clinical trials. There were no language, publication year or publication status restrictions. The date of the search was 23 March 2017. We contacted original authors for clarification and further data when trial reports were unclear, and arranged translations of papers where necessary.
Electronic searches
We searched the following databases from their inception for published, unpublished and ongoing trials:
-
the Cochrane Register of Studies Online (searched 23 March 2017);
-
Epub Ahead of Print, In‐Process & Other Non‐Indexed Citations, Ovid MEDLINE(R) Daily and Ovid MEDLINE(R) (1946 to 23 March 2017);
-
Ovid Embase (1974 to 23 March 2017);
-
EBSCO CINAHL (1982 to 23 March 2017);
-
Ovid Cab (1910 to 23 March 2017);
-
LILACS (searched 23 March 2017);
-
KoreaMed (searched 23 March 2017);
-
PakMediNet (searched 23 March 2017);
-
Web of Knowledge, Web of Science (1945 to 23 March 2017);
-
ClinicalTrials.gov, www.clinicaltrials.gov (searched via the Cochrane Register of Studies 23 March 2017);
-
World Health Organization (WHO) International Clinical Trials Registry Platform (ICTRP), www.who.int/ictrp (searched 23 March 2017);
-
Google Scholar (searched 23 March 2017).
In searches prior to 2017 we also searched PubMed 1946 to January 2016 as a top‐up to Ovid MEDLINE and IndMed to January 2017.
The Information Specialist modelled subject strategies for databases on the search strategy designed for CENTRAL. Where appropriate, they were combined with subject strategy adaptations of the highly sensitive search strategy designed by Cochrane for identifying randomised controlled trials and controlled clinical trials (as described in the Cochrane Handbook for Systematic Reviews of Interventions Version 5.1.0, Box 6.4.b. (Handbook 2011). Search strategies for major databases including CENTRAL are provided in Appendix 1.
Searching other resources
We scanned the reference lists of identified publications for additional trials and contacted trial authors where necessary. In addition, the Information Specialist searched Ovid MEDLINE to retrieve existing systematic reviews relevant to this systematic review so that we could scan their reference lists for additional trials.
Data collection and analysis
Selection of studies
Material downloaded from electronic sources included details of author, institution, journal of publication and abstract. Two of the three screening authors (MF, DH and FB) independently screened each study against the inclusion criteria to determine their eligibility for inclusion in the review. Where the decision about any one study was not unanimous among the screening authors or there was insufficient information, we acquired the full article for further inspection. Once the full articles were obtained, we decided whether the studies met the review criteria, and where there were disagreements we reached a final decision by discussion and consensus.
We revised the inclusion criteria for participants part‐way through the review process. The revised definition for Types of participants and the final decision about which studies to include were subject to independent review by an external expert committee to ensure that it was appropriate for the review question. The risk of revising the protocol was minimised, because this committee also independently evaluated the studies (shortlisted by the authors) and agreed that they met the new inclusion criterion. See Differences between protocol and review for details.
Data extraction and management
MF and PK independently extracted data from the articles. We recorded the extracted data using the Covidence systematic review software (Covidence 2017) on review‐specific forms. We developed and assessed these for suitability through pilot testing prior to independent data extraction. Where there were discrepancies in the data extracted from either the main body or a table we made a final decision by discussion. Where data were extracted from graphs, we used the average of the two independent extractions. Whenever discrepancies were detected, a third author was involved to reconsider and resolve the differences.
Information extracted included: trial design, setting, methods of randomisation and blinding, power, inclusion and exclusion criteria, type of intervention and control, time since hearing aid fitting, duration of follow‐up, outcome measures and statistical tests.
For both the intervention and control groups, data extraction included: baseline characteristics of participants (number, sex, age), details of their hearing loss (mean, standard deviation, range), and details of any attrition or exclusion. For the intervention group, we extracted details of hearing aids (ear on which they were worn, analogue or digital, in‐the‐ear or behind‐the‐ear, manufacturer, unilateral or bilateral hearing aid fittings, and fitting procedures if reported).
Outcome measure data included: group means and standard deviations at pre‐ and post‐intervention and follow‐up, number of participants and results of statistical tests of between‐group comparisons.
We contacted the authors of all included studies as further information was required on all studies after inspection of the full articles. After independent data extraction by MF and PK, there were no disagreements that could not be resolved through discussion.
Assessment of risk of bias in included studies
MF and PK independently assessed the risk of bias of the included trials, with the following taken into consideration, as guided by theCochrane Handbook for Systematic Reviews of Interventions (Handbook 2011):
-
sequence generation;
-
allocation concealment;
-
blinding of (i) participants and study personnel (performance bias), and (ii) outcome assessment (detection bias);
-
incomplete outcome data;
-
selective outcome reporting; and
-
other sources of bias.
We used the Cochrane 'Risk of bias' tool in RevMan 5.3 (RevMan 2014), which involved describing each of these domains as reported in the trial and then assigning a judgement about the risk of bias on the outcomes measured as a result of each entry: 'low', 'high' or 'unclear' risk of bias. Where there were disagreements that could not be resolved, DH reviewed the paper and made a final judgement.
Measures of treatment effect
We expressed continuous outcomes as the size of the difference in treatment effect between an intervention group and a comparator group at the trial endpoint in terms of either the mean difference (MD), when the same outcome measures were used across studies, or the standardised mean difference (SMD), when different outcome measures were used across studies. The calculation of the effect size used the pooled standard deviation, and we reported the 95% confidence interval (CI) for each MD or SMD. An effect size less than 0 indicated that a larger treatment effect was observed in the treatment group relative to the comparator group. We did not extract any binary data.
Unit of analysis issues
The unit of analysis was the participant. We anticipated that participant‐level data would not generally be available and therefore reported suitable summary statistics that were provided in the articles. As stated above, in the case of cross‐over trials we only included data from the first period.
Dealing with missing data
We contacted the corresponding authors of all the included studies to obtain missing data, except McArdle 2005 because they used imputation to account for missing data. We obtained participant‐level data from Humes 2017, but we received no data from the other three studies, two of which no longer had the data available (Melin 1987; Mulrow 1990). We either took data from tables presented in the published manuscripts or estimated data from published figures, as described in the Data extraction and management section. Where standard deviations were not reported or provided by the authors, we estimated standard deviations in RevMan 5.3 (RevMan 2014) using available data, such as standard errors, 95% confidence intervals, P values and t values. We reported the extent of the missing data within studies. Data were not available for any subgroups of interest.
Assessment of heterogeneity
We assessed heterogeneity among treatment effect sizes using RevMan 5.3 (RevMan 2014), and we expressed this in terms of the I2 statistic. We assessed the statistical significance (P = 0.10) using a Chi2 test with K‐1 degrees of freedom. We quantified heterogeneity in terms of the I2 statistic with low, medium and high ranges of 0% to 40%, 41% to 60% and 61% to 100%, respectively.
Assessment of reporting biases
We planned to assess publication bias by examining a funnel plot of the size of treatment effects plotted against their variability. However, there were insufficient studies to assess whether the plot was symmetrical or to quantify the deviation from the expected symmetrical pattern using the 'trim and fill' method (Duval 2000).
Data synthesis
We conducted random‐effects meta‐analyses of the MDs and SMDs using RevMan 5.3 (RevMan 2014). We used random‐effects models as we anticipated significant heterogeneity among treatment effects across studies. For each meta‐analysis, we reported a summary effect size estimate in terms of the MD or SMD, together with its 95% confidence interval. We calculated summary effects using the inverse variance procedure.
To help with the interpretation of data, we estimated the 'equivalent' change on one of the more commonly used scales whenever SMDs were used to summarise data from a few different patient‐reported outcome instruments. We multiplied the observed SMD by the standard deviation of a representative study.
Subgroup analysis and investigation of heterogeneity
We had planned to use subgroup analyses to assess possible sources of heterogeneity. While heterogeneity was identified (see Effects of interventions), it was not possible to perform subgroup analyses based on age, sex and degree of hearing loss as data on subgroups were not available. Time between fitting and trial endpoint was also identified as a possible source of heterogeneity, but a planned subgroup analysis comparing trials with different endpoints (up to three months, over three months to six months and six months or more) was not possible due to the small number of included studies. We conducted a post‐hoc subgroup analysis for the hearing‐specific health‐related quality of life outcome due to the observed pattern of effects across studies (see Effects of interventions) and the differences in participant groups (e.g. military personnel compared with community dwellers).
Sensitivity analysis
We had planned to perform sensitivity analyses to informally test the robustness of assumptions from the data. The small number of studies precluded sensitivity analyses to assess uncertainty about aspects of the included studies, in terms of randomisation (random/quasi‐random), missing data (greater than 30% at the primary endpoint) and description of hearing loss (mild/moderate).
GRADE and 'Summary of findings' table
Using the GRADE approach, two review authors (PK, DH) independently rated the overall quality of evidence using the GDT tool (http://www.guidelinedevelopment.org/) for the main comparison pairs listed in the Types of interventions section. MF and LYC reviewed the ratings and resolved any queries and disagreements. In addition, we also presented the data to a guideline panel that consisted of clinical experts, methodologists and patient representatives and we took their comments into account to reach the final ratings. The quality of evidence reflects the extent to which we are confident that an estimate of effect is close to its true value and we applied this in the interpretation of results. The four possible ratings were: high, moderate, low and very low. A rating of high quality of evidence implies that we are confident in our estimate of effect and that further research is very unlikely to change our confidence in the estimate of effect. A rating of very low quality implies that any estimate of effect obtained is very uncertain.
The GRADE approach rates evidence from RCTs that do not have serious limitations as high quality. However, several factors can lead to the downgrading of the evidence to moderate, low or very low. The degree of downgrading is determined by the seriousness of these factors:
-
study limitations (risk of bias);
-
inconsistency;
-
indirectness of evidence;
-
imprecision; and
-
publication bias.
We included a 'Summary of findings' table, constructed according to the recommendations described in Chapter 10 of the Cochrane Handbook for Systematic Reviews of Interventions (Handbook 2011). We included the following outcomes in the 'Summary of findings' table: hearing‐specific health‐related quality of life, health‐related quality of life, listening ability and adverse effects.
Results
Description of studies
See: Characteristics of included studies; Characteristics of excluded studies.
Results of the search
The search identified 4821 records including papers, reviews, conference abstracts and registered clinical trials, of which 2840 remained after removing duplicates. We discarded 2748 records based on the title and/or abstract, which left 92 records. We discarded a further 81 records. Of these, we discarded 69 on the basis that they were not RCTs, 10 because the intervention was not hearing aids alone, one because the control was not appropriate according to the protocol, and one record was an ongoing clinical trial (NCT03002142).
Subsequently, we formally excluded five studies for the reasons given in Excluded studies. An erratum (McArdle 2006) was associated with one of the included studies (McArdle 2005). Five studies were eligible for inclusion in the review (Figure 1). Three studies reported quantitative data that could be included in the meta‐analyses (Humes 2017; McArdle 2005; Mulrow 1990). Methodological information was supplemented by other articles on the same study for McArdle 2005 by Chisolm 2005, and for Adrait 2017 by Nguyen 2017.

Study flow diagram.
Included studies
Design
All five included studies reported using a randomised controlled (parallel) design. Three studies used a waiting list control group (McArdle 2005; Melin 1987; Mulrow 1990), and the control group in two studies used placebo hearing aids (Adrait 2017; Humes 2017). All five studies specified that the control group received the active hearing aid intervention at the end of the randomised phase, and further follow‐up was conducted in all but one study (Mulrow 1990). Participants in the waiting list groups received hearing aids (McArdle 2005; Melin 1987; Mulrow 1990), and the placebo hearing aids were reprogrammed to provide amplification (Adrait 2017; Humes 2017).
The trial endpoint varied across studies with post‐hearing aid fitting outcomes obtained at six weeks (Humes 2017; Melin 1987), two months (McArdle 2005), 16 weeks (Mulrow 1990), and six months (Adrait 2017). None of the studies reported long‐term outcomes of over one year.
Setting
Three studies were published between 1987 and 2005 (McArdle 2005; Melin 1987; Mulrow 1990), and two were published in 2017 (Adrait 2017; Humes 2017). Two studies were set in Veterans Association clinics in the USA (McArdle 2005; Mulrow 1990), two in university clinics in the USA and Sweden (Humes 2017; Melin 1987), and one in a hospital setting in France (Adrait 2017).
Population and sample size
Age, sex and hearing loss were reported at the group level for all studies except Melin 1987, which reported these data at the participant level. The total sample size for the included studies was 825.
All the studies recruited older adult participants, with the mean age in individual studies ranging between 69 and 83 years. Two studies involved military personnel and had almost exclusively male participants (McArdle 2005 98%; Mulrow 1990 99%), whereas in the other studies males accounted for between 33% and 57% of the samples. All reported mean thresholds were within the mild to moderate hearing loss range of this review's inclusion criteria as described in Types of participants. The frequencies at which mean hearing thresholds were reported varied across studies. All studies had hearing loss as an inclusion criterion but the frequencies and hearing levels used to define the inclusion criteria varied across studies. It is possible that the military veterans were at increased risk of having noise‐induced hearing loss. This is typically shown by a notch in the pure‐tone audiogram around 4 kHz (i.e. thresholds close to that frequency would be better at adjacent frequencies). There was no evidence of noise‐induced hearing loss in the group audiometric results in McArdle 2005, and the presence of noise‐induced hearing loss could not be determined in Mulrow 1990. The participants in Humes 2017, who lived independently in the community, showed no evidence of noise‐induced hearing loss in the group audiometric results. The participants in Adrait 2017 all had a diagnosis of Alzheimer's disease. Two studies used normal cognitive function based on the Mini‐Mental State Examination as an inclusion criterion (Humes 2017; McArdle 2005), and those with disabling comorbid conditions were excluded from Mulrow 1990.
Interventions and comparisons
The intervention in each study was acoustic hearing aids, which met the inclusion criteria of this review as described in Types of interventions. Three studies used bilateral hearing fittings (Adrait 2017; Humes 2017; McArdle 2005), and in the two early studies hearing aids were fitted to one ear only in 95% and 97% participants respectively (Melin 1987; Mulrow 1990). Two studies reported using in‐the‐ear hearing aids (McArdle 2005; Mulrow 1990), and three studies used behind‐the‐ear hearing aids (Adrait 2017; Humes 2017; Melin 1987), with three studies reporting the manufacturer and model of hearing aid used (Adrait 2017; Humes 2017; Melin 1987). Fully digitally programmable hearing aids were used in two studies (Adrait 2017; Humes 2017), with both digital or analogue hearing aids used by McArdle 2005. Humes 2017 used two programming methods for the intervention group. The hearing aids for the Audiology Best practice group were programmed using real‐ear measurements according to NAL‐NL2, whereas the hearing aids for the Consumer Decides group were preset to three common audiogram configurations, and the participants chose which programme they preferred. The two early studies did not report the technology type (Melin 1987; Mulrow 1990). Three studies used a waiting list comparison group until the first treatment period was completed (McArdle 2005; Melin 1987; Mulrow 1990), and two studies used placebo hearing aids as the comparison (Adrait 2017; Humes 2017), which were programmed to provide no gain so as to be as acoustically transparent as possible.
Outcomes
Adrait 2017 is one of a series of papers reporting the results of a clinical trial aimed at studying the effects of bilateral hearing aids in patients with age‐related hearing loss and Alzheimer's disease (Alzheimer Disease, Presbycusis and Hearing Aids, ADPHA study) on the cognitive, behavioural, quality of life and economic aspects. There were no hearing‐specific health‐related quality of life or listening ability outcomes measured. Apart from adverse effects, this study did not use any of the outcome measures pre‐specified in this review (Types of outcome measures).
Primary outcomes
Three studies reported hearing‐specific health‐related quality of life using the HHIE (Humes 2017; McArdle 2005; Mulrow 1990). In addition to the HHIE, Mulrow 1990 also used the Quantified Denver Scale of Communication (QDS). Using the outcome hierarchy defined in Primary outcomes, we only included the HHIE data from Mulrow 1990 in the meta‐analyses.
Only one study measured adverse effects (Adrait 2017); no adverse effects related to pain were reported.
Secondary outcomes
Health‐related quality of life was reported by three studies (Adrait 2017; McArdle 2005; Mulrow 1990). Two studies used outcome measures that were generic to the clinical population being assessed: McArdle 2005 used the WHO‐DAS II and Mulrow 1990 used the Self‐Evaluation of Life Function (SELF).
Adrait 2017 used a disease‐specific health‐related quality of life measure for patients with Alzheimer's disease (Alzheimer's Disease Related Quality of Life, ADRQL; Rabins 1999). Data for the ADRQL were collected from the caregivers, rather than the patients. Therefore, this was not an outcome measure of interest pre‐specified in this review.
Listening ability was reported in three studies. Humes 2017 used the Profile of Hearing Aid Performance (PHAP; Cox 1990), McArdle 2005 used the Abbreviated Profile of Hearing Aid Benefit (APHAB) and Melin 1987 used a hearing ability scaling assessment. We did not include the hearing ability scaling assessment, which is not a validated measure, in the meta‐analysis as not all the data required were available in the paper and were no longer available.
Only one study measured adverse effects (Adrait 2017); no adverse effects related to noise‐induced hearing loss were reported.
Excluded studies
Details of the five studies that we excluded after clarification of the methods used are shown in Characteristics of excluded studies.
Risk of bias in included studies
Two authors (MF, PK) critically reviewed the methodology of the included studies. We contacted the authors from all five included studies to further establish aspects of risk of bias that were unclear from the full article. We received responses from four authors (Adrait 2017; Humes 2017; McArdle 2005; Melin 1987). The 'Risk of bias' summary for the included studies is shown in Figure 2. One study showed a low risk of bias in six categories (Adrait 2017), two studies showed a low risk of bias in four categories (Humes 2017; Mulrow 1990), and two studies showed a low risk of bias in three categories (McArdle 2005; Melin 1987).The 'Risk of bias' graph presented as percentages across all studies is shown in Figure 3. Further details are described below.

'Risk of bias' summary: review authors' judgements about each risk of bias item for each included study.

'Risk of bias' graph: review authors' judgements about each risk of bias item presented as percentages across all included studies.
Allocation
Random sequence generation
We judged all five included studies to be at a low risk of bias due to sequence generation.
Allocation concealment
We judged three studies to be at low risk of bias due to allocation concealment as a remote allocation service or sealed, opaque envelopes were used (Adrait 2017; Melin 1987; Mulrow 1990). There was insufficient information to make a judgement for McArdle 2005, and we judged Humes 2017 to be at high risk of bias because the randomisation list was visible to the clinical trial co‐ordinator who also allocated participants to the treatment or comparator group.
Blinding
Until recently, the nature of hearing aids as an intervention has led to substantial difficulty in designing trials that aim to control for performance bias. In addition, the visibility of hearing aids increases the risk of detection bias when a researcher measures outcomes. Thus, we judged all the studies published during or before 2005 that used waiting list controls to be at high risk for both performance and detection bias (McArdle 2005; Melin 1987; Mulrow 1990). The use of placebo hearing aids allows blinding of participants and personnel and blinded assessment of outcomes if they are visibly identical to active hearing aids and the fitting procedure for active and placebo devices is indistinguishable to the participant. These criteria were met by Adrait 2017, which we judged to be at low risk of performance and detection bias. The Humes 2017 study also used placebo devices but we judged this to have an unclear risk of performance and detection bias as there was potential for participants to be unblinded due to contact with the clinical trial co‐ordinator who was not blinded to allocation.
Incomplete outcome data
We judged attrition bias to be low for three studies (Humes 2017; McArdle 2005; Mulrow 1990), as dropouts were clearly reported and dropout numbers were low and were equal across both the intervention and comparator groups. The reasons for dropouts were generally not related to the intervention. McArdle 2005 used imputation to account for missing data due to dropouts. There was insufficient information about the other two studies to assess the risk of bias (Adrait 2017; Melin 1987), which led to a judgement of unclear risk.
Selective reporting
We judged all five included studies to be at low risk of selective reporting. Two studies published study protocols and reported the stated outcomes (Adrait 2017; Humes 2017). Although no protocols had been published prior to the completion of two of the older studies (McArdle 2005; Mulrow 1990), the reported outcomes followed the rationale of the studies. Contact with the authors of Melin 1987 indicated that all outcomes measured had been included.
Other potential sources of bias
Three of the included studies had the comparator group on a waiting list (McArdle 2005; Melin 1987; Mulrow 1990), and all of these studies had specified that all patients would receive hearing aids at the end of the randomised phase. Studies using waiting list controls have a risk of overestimating the benefit of an intervention, especially if participants perceived that the reported outcomes could determine their eligibility for an intervention (Furukawa 2014). As all the participants were aware that they would receive the interventions at the end of the study, we thought that the risks were less clear in this case (unclear risk of bias).
Effects of interventions
See: summary of findings Table for the main comparison.
For the McArdle 2005 study, we extracted data from Table 3, except the Hearing Handicap Inventory for the Elderly (HHIE) data from the control group at the two‐month follow‐up, which we took from the table in the Erratum (McArdle 2006). Humes 2017 did not report the six‐week follow‐up results, so we obtained these from the study dataset that was sent at our request. We directly extracted data from Mulrow 1990. Data from Melin 1987 and Adrait 2017 were not included in the meta‐analysis (see Characteristics of included studies).
Comparison: hearing aids versus no hearing aids
Primary outcome measures
1. Hearing‐specific health‐related quality of life
The HHIE at study endpoint was used to measure hearing‐specific health‐related quality of life in all three studies included in a meta‐analysis. Mean differences (MDs) and their 95% confidence intervals (CIs) are shown in Analysis 1.1 (Figure 4).

Forest plot of comparison: 1 Hearing aids versus no/placebo hearing aids, outcome: 1.1 Hearing‐specific health‐related quality of life. Assessed using Hearing Handicap Inventory for the Elderly (HHIE) in all studies.
The random‐effects meta‐analysis showed a significant overall effect that favoured hearing aids over the unaided/placebo comparison (scale range 0 to 100) (MD ‐26.47, 95% CI ‐42.16 to ‐10.77; 722 participants; three studies) (moderate‐quality evidence) (Analysis 1.1). We observed considerable heterogeneity (I2 = 97%), which was statistically significant (Chi2 = 63.84, df = 2, P < 0.00001). We conducted an unplanned subgroup analysis (Veterans Association setting, mostly male, in‐the‐ear hearing aids, waiting list control versus community setting, male‐female balance, behind‐the‐ear hearing aids, placebo control study) to explore this statistical heterogeneity. This showed statistically significant subgroup effects (P < 0.00001). The MD was ‐33.48, (95% CI ‐36.72 to ‐30.23; 568 participants; two studies; I2 = 4%) for the veterans subgroup (McArdle 2005; Mulrow 1990), and ‐10.54 (95% CI ‐15.26 to ‐5.82; 154 participants) for the community setting subgroup (Humes 2017).
The Quantified Denver Scale of Communication (QDS) results from Mulrow 1990 were not included in the meta‐analysis as our protocol specified a hierarchy of inclusion in which the HHIE had a higher priority. However, the QDS also indicated a significant effect favouring hearing aids (scale range 0 to 100) (MD ‐26.5, 95% CI ‐33.6 to ‐19.4; 188 participants).
2. Adverse effects
Only one study (n = 48) measured adverse effects (Adrait 2017), and no adverse effects related to pain were reported (very low‐quality evidence).
Secondary outcome measures
1. Health‐related quality of life
Health‐related quality of life at study endpoint was measured using the World Health Organization Disability Assessment Schedule (WHO‐DAS) II (McArdle 2005) and the Self‐Evaluation of Life Function (SELF) (Mulrow 1990). A random‐effects meta‐analysis showed a significant overall effect that favoured hearing aids over the unaided/placebo comparison (standardised mean difference (SMD) ‐0.38, 95% CI ‐0.55 to ‐0.21; 568 participants; two studies, I2 = 6%) (moderate‐quality evidence) (see Analysis 1.2; Figure 5).

Forest plot of comparison: 1 Hearing aids versus no/placebo hearing aids, outcome: 1.2 Health‐related quality of life.
2. Listening ability
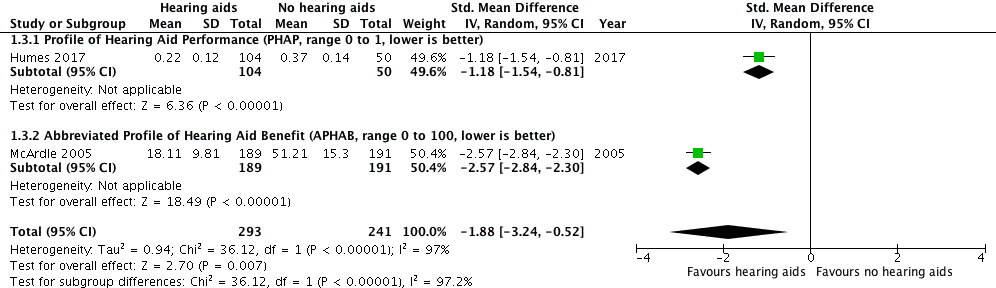
Listening ability at study endpoint was measured using the Profile of Hearing Aid Performance (PHAP) in Humes 2017 and the Abbreviated Profile of Hearing Aid Benefit (APHAB) in McArdle 2005. A random‐effects meta‐analysis showed a significant overall effect that favoured hearing aids over the unaided/placebo comparison (SMD ‐1.88, 95% CI ‐3.24 to ‐0.52; 534 participants; two studies) (moderate‐quality evidence) (Analysis 1.3; Figure 6). We observed considerable heterogeneity (I2 = 97%), which was statistically significant (Chi2 = 31.12, df = 1, P < 0.00001). The unplanned subgroup analysis showed statistically significant (P < 0.00001) subgroup effects, where McArdle 2005 had a SMD of ‐2.57 (95% CI ‐2.84 to ‐2.30; 380 participants) and Humes 2017 had a SMD of ‐1.18 (95% CI ‐1.54 to ‐0.81; 154 participants).

Forest plot of comparison: 1 Hearing aids versus no/placebo hearing aids, outcome: 1.3 Listening ability.
3. Adverse effects
Only one study (n = 48) measured adverse effects (Adrait 2017), and no adverse effects related to noise‐induced hearing loss were reported (very low‐quality evidence).
Discussion
Summary of main results
For hearing‐specific health‐related quality of life where participation is the key domain (primary outcome measure), we found evidence that hearing aids had a large beneficial effect in reducing participation restrictions. Our confidence in the quality of the evidence for hearing‐specific health‐related quality of life was moderate due to high risk of bias (see summary of findings Table for the main comparison). Significant differences in the size of effects were apparent across studies; the effects reported by the two individual Veterans Association (VA) studies were similar (McArdle 2005; Mulrow 1990), and more than twice the size of the effect reported by Humes 2017. However, all three studies individually reported large effects (standardised mean difference (SMD) > 0.70) that favoured hearing aids, meaning that while further evidence may change the size of the overall effect on hearing‐specific health‐related quality of life, we have high confidence in the magnitude and direction of the effect.
For health‐related quality of life (secondary outcome measure) there was evidence of a small beneficial overall effect of hearing aids compared to the unaided/placebo condition. Two different outcome measures were used. One study reported a significant benefit of hearing aids compared to the unaided/placebo condition using the World Health Organization Disability Assessment Schedule (WHO‐DAS II) (SMD ‐0.44, 95% confidence interval (CI) ‐0.65 to ‐0.24; 380 participants), and another study reported no significant effect of hearing aids using the Self‐Evaluation of Life Function (SELF) (SMD ‐0.26, 95% CI ‐0.55 to 0.03; 188 participants). Heterogeneity was low. Our confidence in the quality of the evidence for health‐related quality of life was moderate due to high risk of bias (see summary of findings Table for the main comparison).
For listening ability (secondary outcome measure), there was a large beneficial effect of hearing aids when compared to the unaided/placebo condition. The two studies used different outcome measures with one, Abbreviated Profile of Hearing Aid Benefit (APHAB), being an abbreviated version of the other (PHAP). Both measures revealed large beneficial effects that favoured the use of hearing aids. Our confidence in the quality of the evidence for listening ability was moderate due to high risk of bias (see summary of findings Table for the main comparison), although we have high confidence that the effect was both large and beneficial.
Adverse effects associated with hearing aids were measured in only one study but no adverse effects were reported that related to pain or noise‐induced hearing loss, so it was not possible to comment on the reported benefits against harms.
Overall completeness and applicability of evidence
Five randomised controlled trials (RCTs) met the inclusion criteria for this review. Three studies assessed hearing‐specific health‐related quality of life using measures that fit within our pre‐defined hierarchy of self‐report outcome measures, of which one measure (the Hearing Handicap Inventory for the Elderly, HHIE) was used in all three studies. High heterogeneity and subgroup differences for the HHIE results stem from the Humes 2017 study of older adults living in the general community, in which a smaller effect was observed than was found in the two VA studies (McArdle 2005; Mulrow 1990). The participants in the Humes 2017 study had a more even male‐female split (57:43), had better average hearing thresholds, were provided with behind‐the‐ear hearing aids for a cost, and the comparison group received placebo hearing aids. In contrast, the participants in the VA studies were almost exclusively male veterans who may have experienced gunfire or explosive noise that may have resulted in noise‐induced hearing loss and the possibility of compensation claims, had poorer hearing, were provided with in‐the‐ear hearing aids at no cost, and were compared to a waiting list (passive control) group. These participant and methodological differences were likely to account for the differences in the estimated size of the effects between the studies for both the hearing‐specific health‐related quality of life and listening ability outcomes. As there were numerous differences between these two groups of participants (military veterans versus community dwellers), we considered whether it was appropriate to pool the studies. On the basis that recommendations for the clinical management of hearing loss using hearing aids would not differ between these two groups, we concluded that the data from the studies should therefore be pooled. The choice of outcome measure to assess health‐related quality of life was inconsistent, although heterogeneity in the reported effects was low. The WHO‐DAS II used in the McArdle 2005 study has since been superseded by the WHO‐DAS 2.0 (WHO 2012b), which directly links to the International Classification of Functioning, Disability and Health (ICF) framework.
We did not include cognition as an outcome in the protocol because of the wide variety and uncertainty of definitions of specific domains within the broader context of cognition (e.g. attention, memory, processing speed). The Short Portable Mental Status Questionnaire and Geriatric Depression Scale measures reported in one included study (Mulrow 1990), alongside a raft of measures related to Alzheimer's disease in another study (Adrait 2017), were not specified in the protocol, and we did not analyse or report the results. Mulrow 1990 reported significant improvements in the hearing aid group on both measures, whereas there were no group differences for any of the measures reported by Adrait 2017.
The planned subgroup analyses (age, sex and degree of hearing loss) could not be performed as data from these subgroups were not reported. Outcomes were measured for short‐to‐medium term follow‐up only (six weeks to six months), with no studies reporting long‐term outcome at more than one year for either intervention or control groups separately. In terms of completeness, there are a limited number of RCTs, a preponderance of participants who were men who had poorer hearing, inconsistency in the choice of outcome measures to assess health‐related quality of life and listening ability, and inconsistency in the choice of comparator (waiting list versus placebo control).
In terms of applicability, all participant samples were reported to have mild to moderate hearing loss. The three studies included in the meta‐analyses represented the majority of the participants from the included studies (n = 738; 89%). However, two of these study samples (n = 574) were overwhelmingly male military veterans (97% and 99%) who received their hearing aids free of charge, although there is evidence that the price of hearing aids does not affect outcomes (Humes 2017). Generalisability to other non‐military populations that would certainly include a greater proportion of women represents a limitation, which these studies acknowledged, and may reflect the size of the effects on hearing‐specific health‐related quality of life and listening ability. There was also variability in whether hearing aids were fitted unilaterally or bilaterally. Three of the studies had exclusion criteria that were specific to other comorbid conditions, such as cognitive impairment (two studies specifically screened for this using the Mini‐Mental State Examination), which could also limit applicability of the findings to general clinical populations, such as those with dementia. Although Adrait 2017 reported no effect of hearing aids in their population of patients with Alzheimer's disease, the outcomes in that study differed to those specified in our review.
Finally, only two of the five included studies set out specifically to examine whether hearing aids improved quality of life in those who had hearing loss (Adrait 2017; Mulrow 1990), but one of these recruited only people with Alzheimer's disease. The primary aim of McArdle 2005 was to assess the properties of the WHO‐DAS II as an outcome measure by examining its responsiveness to the effects of hearing aids. The Melin 1987 study was primarily designed to examine hearing aids as an intervention for people with tinnitus, and the Humes 2017 study focused on different service delivery models.
Quality of the evidence
We considered the quality of evidence for the primary outcome measure (hearing‐specific health‐related quality of life) and secondary outcome measures (health‐related quality of life and listening ability), as assessed by the GRADE system, to be moderate. We downgraded the quality of the evidence by one level because all studies contributing data to these outcomes had either a rating of unclear and/or high risk bias in at least one of the domains of selection bias, performance and/or detection bias (see summary of findings Table for the main comparison).
All five included studies were RCTs. We judged three studies to be at high risk of performance and detection bias (McArdle 2005; Melin 1987; Mulrow 1990). These biases are recognised widely to be problematic in hearing aid intervention studies as blinding of patients and assessors can be difficult to achieve. Although Humes 2017 used a placebo hearing aid comparison to control for these biases, the potential for unblinding led to our judgements of unclear risk. However, the use of placebo hearing aids with zero‐gain prescriptions adopted by both Adrait 2017 and Humes 2017 does demonstrate that it is now possible to blind participants and outcome assessors in hearing aid trials.
We considered downgrading the evidence for the effects of hearing aids on hearing‐specific health‐related quality of life and listening ability due to both inconsistency and indirectness. There were concerns over inconsistency because of the observed statistical heterogeneity between VA studies (McArdle 2005; Mulrow 1990) and the study of Humes 2017 conducted in the community setting. Concerns arose over indirectness both because the analyses included data from male military veterans and also because of the short follow‐up period in Humes 2017 (six weeks). We took the decision not to downgrade due to either inconsistency or indirectness as all studies individually reported large beneficial effects of hearing aids on both outcomes, regardless of whether they had been conducted in the military or community settings and regardless of the duration of follow‐up. Thus, the observed heterogeneity did not reduce our confidence in the estimates of these effects.
Finally, we considered downgrading the evidence for health‐related quality of life due to indirectness. Both studies included in the analysis had samples that were almost exclusively male military veterans (McArdle 2005; Mulrow 1990). However, we did not downgrade the evidence because the estimates of the effect were similar across the two studies and heterogeneity was low despite numerous other differences in their samples and designs (i.e. different outcome measure, follow‐up period and hearing aid style and number fitted). Our confidence in the size of the effect was therefore not reduced.
Limitations of the evidence reviewed were the numerous methodological and sampling differences between the two veteran studies (McArdle 2005; Mulrow 1990) and the other included studies, and the lack of long‐term outcomes (i.e. greater than one year). There were also inconsistencies in the reporting of the studies and clarification on methodological details had to be sought from the authors of all five studies, with four providing information that was not published. Two of the studies were published before the 2001 CONSORT guidelines yet only one out of the other three studies that could have feasibly been able to follow these guidelines reported the study to that standard (Humes 2017).
Potential biases in the review process
The electronic searches for this review were comprehensive, with a second search carried out within two months of submission to ensure an up‐to‐date review. The protocol defined the review process and the roles of the authors, and each source was independently reviewed by two authors. Inclusion did not require specific outcome tools.
We revised the inclusion criteria relating to the types of participants due to concerns that the original criteria stated in the protocol had the potential to bias the study selection process (see Differences between protocol and review).
Although we revised the inclusion criteria for Types of participants part‐way through the review, we did this with the important rationale of avoiding a potential bias where studies that were reported in less detail (e.g. group mean hearing threshold data or qualitative descriptions) were more likely to be included than those studies that either reported in more detail or provided us with participant‐level data. To minimise the risk of bias in this process, the revised definition for Types of participants and the final decisions about which studies were eligible for inclusion in the review were subject to independent review by an external expert committee to ensure that this was appropriate for the review question.
Agreements and disagreements with other studies or reviews
This review is consistent with the conclusions of a previous systematic review on hearing aids (Chisolm 2007). Both reviews conclude that hearing aids improve hearing‐specific health‐related quality of life compared to no hearing aids. However, whereas Chisolm 2007 identified a lack of evidence for more general effects on health‐related quality of life in people with hearing loss, in our review we showed a small beneficial effect. These reviews differ in a number of methodological details. The current review includes only randomised controlled trials, whereas Chisolm 2007 included randomised and non‐randomised trials. Chisolm 2007 used the Scottish Intercollegiate Guideline Network (SIGN) grading system (Harbour 2001), and included two studies that met the highest level of evidence (level 1, RCTs) (Mulrow 1990; Yueh 2001). We did not include the Yueh 2001 study as the randomisation took place after the participants had been allocated to either hearing aids or no hearing aids on the basis of whether they were eligible to receive hearing aids or not. Our review included the McArdle 2005 study, which had not been published at the time the Chisolm 2007 review was conducted, and we included the study by Melin 1987. The other main differences between the reviews were that our review was able to include three generally well‐designed RCTs in the meta‐analyses and used a pre‐defined hierarchy of outcome measures for each outcome domain.
A more recent review on the benefit of hearing aids for patients with mild sensorineural hearing loss concludes that there is evidence that hearing aids benefit adults with mild sensorineural hearing loss (Johnson 2016). None of the studies included in this review were RCTs, and so we cannot compare the results and conclusions of that review with ours.

Study flow diagram.
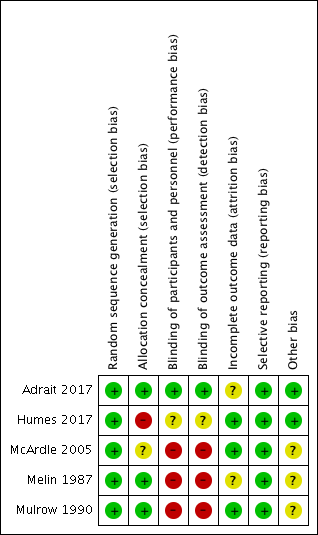
'Risk of bias' summary: review authors' judgements about each risk of bias item for each included study.

'Risk of bias' graph: review authors' judgements about each risk of bias item presented as percentages across all included studies.

Forest plot of comparison: 1 Hearing aids versus no/placebo hearing aids, outcome: 1.1 Hearing‐specific health‐related quality of life. Assessed using Hearing Handicap Inventory for the Elderly (HHIE) in all studies.

Forest plot of comparison: 1 Hearing aids versus no/placebo hearing aids, outcome: 1.2 Health‐related quality of life.
Forest plot of comparison: 1 Hearing aids versus no/placebo hearing aids, outcome: 1.3 Listening ability.

Comparison 1 Hearing aids versus no/placebo hearing aids, Outcome 1 Hearing‐specific health‐related quality of life.

Comparison 1 Hearing aids versus no/placebo hearing aids, Outcome 2 Health‐related quality of life.

Comparison 1 Hearing aids versus no/placebo hearing aids, Outcome 3 Listening ability.
| Hearing aids versus no hearing aids for mild to moderate hearing loss in adults | |||||
| Patient or population: adults with mild to moderate hearing loss | |||||
| Outcomes No. of participants | Anticipated absolute effects (95% CI) | Quality | What happens* | ||
| Without hearing aids | With hearing aids | Difference | |||
| Hearing‐specific HRQoL assessed with: HHIE (range 0 to 100) Follow‐up: range 6 to 16 weeks No. of participants: 722 (3 RCTs) | The mean hearing‐specific HRQoL score was 39 | — | Mean 26 lower (42 to 11 lower) | ⊕⊕⊕⊝ | Lower score indicates better hearing‐specific HRQoL. The mean difference corresponds to a large effect size (SMD ‐1.38, 95% CI ‐2.02 to ‐0.75) favouring hearing aids. |
| Health‐related QoL assessed with: WHO‐DAS II (range 0 to 100) and the SELF (range 54 to 216) Follow‐up: range 2 months to 16 weeks No. of participants: 568 (2 RCTs) | — | — | SMD 0.38 lower (0.55 lower to 0.21 lower) | ⊕⊕⊕⊝ | Lower score indicates better HRQoL. The SMD corresponds to a small effect size favouring hearing aids, which is equivalent to a 6‐point decrease (9‐ to 3‐point decrease) on the 0 to 100 scale of the WHO‐DAS II5. |
| Listening ability assessed with: PHAP (range 0 to 1) and APHAB (range 0 to 100) Follow‐up: 6 weeks to 2 months No. of participants: 534 (2 RCTs) | — | — | SMD 1.88 lower (3.24 lower to 0.52 lower) | ⊕⊕⊕⊝ | Lower score indicates improved listening ability. The SMD corresponds to a large effect size favouring hearing aids, which is equivalent to a 29‐point decrease (50‐ to 8‐point decrease) on the 0 to 100 scale of the APHAB6. |
| Adverse effect ‐ pain No. of participants: 48 (1 RCT) | Adverse effects related to pain were measured in 1 study: none were reported. | ⊕⊝⊝⊝ VERY LOW7 | There was too little information to estimate the risk of pain. | ||
| Adverse effect ‐ noise‐induced hearing loss No. of participants: 48 (1 RCT) | Adverse effects related to noise‐induced hearing loss were measured in 1 study: none were reported. | ⊕⊝⊝⊝ VERY LOW7 | There was too little information to estimate the risk of noise‐induced hearing loss. | ||
| *The equivalent change in the intervention group (and its 95% confidence interval) is based on the standard deviation in the comparison group from a representative study (see footnotes for each outcome) and the relative effect of the intervention (and its 95% CI). | |||||
| GRADE Working Group grades of evidence | |||||
| 1Quality of evidence downgraded by one level because all studies have either a rating of unclear and/or high risk bias in at least one of these domains: selection bias, performance and/or detection bias. | |||||
| Outcome or subgroup title | No. of studies | No. of participants | Statistical method | Effect size |
| 1 Hearing‐specific health‐related quality of life Show forest plot | 3 | 722 | Mean Difference (IV, Random, 95% CI) | ‐26.47 [‐42.16, ‐10.77] |
| 1.1 Subgroup A (community setting, male‐female balance, behind‐the‐ear hearing aids, placebo control) | 1 | 154 | Mean Difference (IV, Random, 95% CI) | ‐10.54 [‐15.26, ‐5.82] |
| 1.2 Subgroup B (Veterans Association setting, mostly male, in‐the‐ear hearing aids, waiting list control) | 2 | 568 | Mean Difference (IV, Random, 95% CI) | ‐33.48 [‐36.72, ‐30.23] |
| 2 Health‐related quality of life Show forest plot | 2 | 568 | Std. Mean Difference (IV, Random, 95% CI) | ‐0.38 [‐0.55, ‐0.21] |
| 2.1 WHO Disability Assessment Schedule 2.0 (WHO‐DAS II, range 0 to 100, lower is better) | 1 | 380 | Std. Mean Difference (IV, Random, 95% CI) | ‐0.44 [‐0.65, ‐0.24] |
| 2.2 Self‐evaluation of Life Function (SELF, range 54 to 216, lower is better) | 1 | 188 | Std. Mean Difference (IV, Random, 95% CI) | ‐0.26 [‐0.55, 0.03] |
| 3 Listening ability Show forest plot | 2 | 534 | Std. Mean Difference (IV, Random, 95% CI) | ‐1.88 [‐3.24, ‐0.52] |
| 3.1 Profile of Hearing Aid Performance (PHAP, range 0 to 1, lower is better) | 1 | 154 | Std. Mean Difference (IV, Random, 95% CI) | ‐1.18 [‐1.54, ‐0.81] |
| 3.2 Abbreviated Profile of Hearing Aid Benefit (APHAB, range 0 to 100, lower is better) | 1 | 380 | Std. Mean Difference (IV, Random, 95% CI) | ‐2.57 [‐2.84, ‐2.30] |