Lentes intraoculares con filtro para luz azul (LIO) para la protección de la salud macular
Resumen
Antecedentes
La lente intraocular (LIO) es una lente sintética que se implanta quirúrgicamente dentro del ojo después de la extracción de la lente cristalina, durante la cirugía por catarata. Aunque todas las LIO modernas atenúan la transmisión de la luz ultravioleta (UV), algunas LIO, llamadas LIO que bloquean la luz azul o con filtro para luz azul, también reducen la transmisión de luces visibles de onda corta. La justificación para el uso de las LIO con filtro para luz azul proviene principalmente del cultivo celular y los estudios en animales, que indican que la luz visible de onda corta puede inducir fototoxicidad retiniana. Las LIO con filtro para luz azul se han indicado para proteger el deterioro retiniano y prevenir potencialmente el desarrollo y la progresión de la degeneración macular senil (DMS). Se pretendía investigar la evidencia con respecto a los efectos beneficiosos indicados de las LIO con filtro para luz azul, y considerar cualquier efecto adverso potencial.
Objetivos
Evaluar los efectos de las LIO con filtro para luz azul en comparación con las LIO sin filtro para luz azul, con respecto a brindar protección de la salud y la función macular.
Métodos de búsqueda
Se hicieron búsquedas en el Registro Cochrane Central de Ensayos Controlados (Cochrane Central Register of Controlled Trials) (CENTRAL) (que contiene el Registro de ensayos del Grupo Cochrane de Trastornos de los Ojos y la Visión [Cochrane Eyes and Vision Group]) (2017, número 9); Ovid MEDLINE; Ovid Embase; LILACS; el ISRCTN registry; ClinicalTrials.gov y el ICTRP. La fecha de la búsqueda fue el 25 de octubre de 2017.
Criterios de selección
Se incluyeron los ensayos controlados aleatorios (ECA) que reclutaron participantes adultos sometidos a extracción de cataratas, donde una LIO con filtro para luz azul se comparó con una LIO sin filtro para luz azul equivalente.
Obtención y análisis de los datos
El resultado primario predeterminado fue el cambio en la mejor agudeza visual corregida (MAVC) a distancia, como un resultado continuo, entre el valor inicial y a los 12 meses de seguimiento. Los resultados secundarios predeterminados incluyeron sensibilidad posoperatoria al contraste, discriminación cromática, densidad óptica del pigmento macular (DOPM), proporción de ojos con un hallazgo patológico en la mácula (incluido, pero no limitado al desarrollo o progresión de la DMS, o ambos), estado de alerta diurno, tiempo de reacción y satisfacción de los pacientes. Se evaluaron resultados relacionados con efectos adversos oculares y sistémicos.
Dos autores de la revisión de forma independiente revisaron los resúmenes y los artículos de texto completo, extrajeron los datos de los ECA elegibles y evaluaron el riesgo de sesgo mediante la herramienta Cochrane. Se llegó a un consenso sobre cualquier desacuerdo mediante discusión. Cuando fue apropiado se agruparon los datos relacionados con los resultados y se utilizaron modelos de efectos aleatorios o de efectos fijos para los metanálisis. La certeza general de la evidencia se resumió mediante GRADE.
Resultados principales
Se incluyeron 51 ECA de 17 países diferentes, aunque la mayoría de los estudios no informaron resultados relevantes o proporcionaron los datos en un formato que no permitió extraerlos. En conjunto, los estudios incluidos consideraron los resultados de la implantación de LIO en más de 5000 ojos. El número de participantes varió de 13 a 300, y el período de seguimiento varió de un mes a cinco años. Solo dos de los estudios tenían un registro de ensayo y ningún estudio se refirió a un protocolo publicado. Ninguno de los estudios se consideró con riesgo bajo de sesgo en los siete dominios. Aproximadamente dos tercios de los estudios se consideraron con alto riesgo de sesgo en dominios relacionados con el "cegamiento de los participantes y el personal" (sesgo de realización) y "cegamiento de la evaluación de resultados" (sesgo de detección).
Hubo evidencia de certeza moderada con respecto a que la MAVC a distancia con una LIO con filtro para luz azul, a los seis a 18 meses después de la cirugía y medido en logMAR, no fue claramente diferente a la MAVC a distancia con una LIO sin filtro para luz azul (diferencia de medias [DM] ‐0,01 logMAR; intervalo de confianza [IC] del 95%: ‐0,03 a 0,02; P = 0,48; dos estudios, 131 ojos).
Hubo evidencia de muy baja certeza con respecto a cualquier diferencia potencial entre las intervenciones en la proporción de ojos que desarrollaron DMS en estadio tardío a los tres años de seguimiento, o cualquier estadio de la DMS al año de seguimiento, ya que los datos se obtuvieron de un ensayo y dos ensayos respectivamente y no hubo eventos en los grupos de intervención con LIO para cualquiera de los resultados. Hubo evidencia de certeza muy baja para el resultado de la proporción de participantes que perdieron 15 o más letras de la MAVC a distancia a los seis meses de seguimiento; dos ensayos que consideraron un total de 63 ojos no informaron eventos en cualquiera de los grupos de intervención con LIO.
No hubo datos relevantes combinables disponibles para los resultados relacionados con el efecto sobre la sensibilidad al contraste a los seis meses, la proporción de ojos con una pérdida cuantificable de la discriminación cromática a partir del valor inicial a los seis meses o la proporción de participantes con eventos adversos con un vínculo causal probable con las intervenciones de los estudios después de seis meses.
No fue posible establecer conclusiones fiables sobre la equivalencia o la superioridad relativa de las LIO con filtro para luz azul versus las LIO sin filtro para luz azul con respecto a los efectos a más largo plazo sobre la salud macular. Tampoco fue posible determinar con alguna certeza si las LIO con filtro para luz azul tienen efectos significativos sobre la DOPM, la sensibilidad al contraste, la discriminación cromática, el estado de alerta diurno, el tiempo de reacción o la satisfacción de los pacientes, con respecto a las LIO sin filtro para luz azul.
Conclusiones de los autores
Esta revisión sistemática muestra con certeza moderada que no hay diferencias clínicamente significativas en la MAVC a corto plazo con los dos tipos de LIO. Además, según los datos disponibles, estos resultados indican que no hay diferencias clínicamente significativas en la sensibilidad al contraste a corto plazo con las dos intervenciones, aunque hubo certeza de nivel bajo para este resultado debido al escaso número de estudios incluidos y al riesgo inherente de sesgo. Según la evidencia actual, la mejor evidencia de investigación disponible, no está claro si las LIO con filtro para luz azul preservan la salud macular o modifican los riesgos asociados con el desarrollo y la progresión de DMS, o ambos. Se necesitan estudios de investigación adicionales para comprender completamente los efectos de las LIO con filtro para luz azul para proporcionar protección a la salud y la función macular.
PICOs
Resumen en términos sencillos
Lentes artificiales con filtro para luz azul en el ojo para la protección de la mácula (fondo del ojo) después de la cirugía por catarata
¿Cuál es el objetivo de la revisión?
El objetivo de esta revisión Cochrane fue determinar si las lentes artificiales con filtro para luz azul, también conocidos como lentes intraoculares (LIO), protegen el fondo del ojo. Los autores de la revisión Cochrane recopilaron y analizaron todos los estudios relevantes para responder a esta pregunta y encontraron 51 estudios.
Mensajes clave
Hay poca evidencia de cualquier diferencia importante entre las lentes con filtro para luz azul y las lentes sin filtro para luz azul. Sin embargo, los estudios han sido demasiado pequeños y a muy corto plazo para dar una respuesta fiable a esta pregunta.
¿Qué se estudió en la revisión?
A veces la lente del ojo se torna opaca, habitualmente cuando las personas envejecen. La cirugía por catarata incluye la extracción de la lente opaca y el reemplazo por una artificial. Esta lente artificial se conoce como una "lente intraocular" o LIO. Estas LIO contienen un filtro para bloquear la luz ultravioleta (UV) nociva. Algunas lentes también tienen un filtro para bloquear la luz azul visible. En teoría, los niveles altos de luz azul podrían lesionar el fondo del ojo que controla la visión central (la mácula). Se ha indicado que las LIO con filtro para luz azul pueden ayudar a proteger la mácula y prevenir una causa frecuente de pérdida de visión en las personas mayores, la degeneración macular senil.
¿Cuáles son los principales resultados de la revisión?
Los autores de la revisión Cochrane incluyeron 51 estudios de 17 países diferentes en esta revisión. La revisión mostró que:
• probablemente no hay diferencias importantes en la visión a distancia entre las lentes artificiales con filtro para luz azul y las lentes sin filtro para luz azul a los 12 meses después de la cirugía (certeza moderada con respecto a esta evidencia);
• no hubo datos relevantes sobre la sensibilidad al contraste (la capacidad de las personas de diferenciar un objeto de su fondo) ni la discriminación cromática, que son dos medidas de salud macular;
• ninguno de los pacientes que participan en estos estudios desarrollaron degeneración macular senil en el período de seguimiento (muy poca certeza acerca de esta evidencia);
• no hubo evidencia sobre los resultados adversos que pueden estar relacionados con las LIO con filtro para luz azul (por ejemplo, trastornos del sueño).
¿Cuál es el grado de actualización de esta revisión?
Los autores de la revisión Cochrane buscaron estudios que se habían publicado hasta el 25 de octubre de 2017.
Conclusiones de los autores
Summary of findings
| Blue‐light filtering IOL compared to non‐blue‐light filtering IOL for protecting macular health | ||||||
| Patient or population: adults undergoing cataract surgery with IOL implantation | ||||||
| Outcomes | Anticipated absolute effects* (95% CI) | Relative effect | № of participants | Certainty of the evidence | Comments | |
| Risk with non‐blue‐light filtering IOL | Risk with blue‐light filtering IOL | |||||
| Change in distance BCVA, between baseline and 12 months | Mean change in distance BCVA between baseline and 12 months was 0 logMAR | MD 0.01 logMAR lower | ‐ | 131 | ⊕⊕⊕⊝ | A lower BCVA (in logMAR) indicates a higher level of visual acuity. Studies in this analysis reported data at the end of the follow‐up period rather than change from baseline. |
| Distance BCVA, considered as a dichotomous outcome (being the proportion of eyes that experienced loss of 15 or more letters from baseline BCVA), at six months | See comments | Not estimable | 63 | ⊕⊝⊝⊝ | There were no eyes, in either intervention group that had a loss of 15 or more letters from baseline BCVA. | |
| Contrast sensitivity function, measured in log Contrast Sensitivity at six months | ‐ | ‐ | ‐ | ‐ | ‐ | No relevant combinable data available for this outcome |
| Colour discrimination, measured as the proportion of eyes that had a measurable loss from baseline using Farnsworth‐Munsell 100‐hue colour test score under photopic conditions at six months | ‐ | ‐ | ‐ | ‐ | ‐ | No relevant combinable data available for this outcome |
| Proportion of participants with adverse events with a probable causal link with the study interventions at six months follow‐up | ‐ | ‐ | ‐ | ‐ | ‐ | No relevant combinable data available for this outcome |
| Proportion of eyes that developed late‐stage AMD, being CNV and/or GA, at three years of follow‐up | See comments | Not estimable | 50 | ⊕⊝⊝⊝ | In the 1 trial (Kara Junior 2011) there were no eyes, in either intervention group that developed late‐stage AMD at five years of follow‐up. | |
| Proportion of eyes that developed any stage of AMD at 12 months | See comments | Not estimable | 144 | ⊕⊝⊝⊝ | In both studies, there were no eyes, in either intervention group that developed any stage of AMD over the nominated follow‐up period. | |
| *The risk in the intervention group (and its 95% confidence interval) is based on the assumed risk in the comparison group and the relative effect of the intervention (and its 95% CI). | ||||||
| GRADE Working Group grades of evidence | ||||||
| aDowngraded for risk of bias (‐1). Data derive from two relatively small studies, with one (Caporossi 2009) judged to have a high risk of bias in both masking domains, and the other (Vuori 2006) having an unclear risk of bias in most domains. | ||||||
Antecedentes
Descripción de la afección
La mácula es la región especializada de la retina humana que media los 15 a 20 grados centrales de visión (Holz 2013). Anatómicamente, la mácula corresponde a un área de aproximadamente 5 mm de diámetro dentro del polo posterior (Snell 1998) y tiene una pigmentación amarilla distintiva debido a la presencia de los pigmentos carotenoides luteína y zeaxantina (Beatty 1999; Wald 1945). Se piensa que los pigmentos maculares protegen contra los riesgos de la luz visible de onda corta, que incluye la luz violeta y azul. Funcionalmente, la mácula permite la visión espacial de alta resolución y la percepción del color. El mantenimiento de la salud macular es fundamental para la función visual normal. De ahí se deduce que las enfermedades que afectan la mácula pueden provocar deterioro visual significativo. En 2010, 2 100 000 personas a nivel global quedaron ciegas y 6 000 000 personas presentaron deterioro visual debido a enfermedades maculares (Jonas 2014).
Una forma habitual de la enfermedad macular es la degeneración macular senil (DMS), que es la principal causa de ceguera en los países desarrollados (Congdon 2004; Pascolini 2012). La DMS es una afección degenerativa retiniana lentamente progresiva que afecta de forma selectiva a la mácula y, por lo tanto, la visión central. La prevalencia de la DMS aumenta drásticamente con la edad (Owen 2003; Wong 2014). Aproximadamente un tercio de las personas con 80 años de edad o más tienen probabilidades de presentar signos clínicos de DMS (Klein 1992), y alrededor del 6% de las personas presentan enfermedad en estadio tardío a esta edad (Rudnicka 2012). Los riesgos establecidos para la DMS incluyen el envejecimiento, los factores genéticos (Klein 2005; Yang 2006) y el hábito de fumar (Thornton 2005). Se ha formulado la hipótesis, pero aún no está claro, de si otros factores, incluida la exposición a largo plazo a la luz ambiental de onda corta, contribuyen a la DMS (Beatty 1999).
La DMS habitualmente es asintomática en estadios iniciales. Clínicamente, un signo retiniano clave es la aparición de drusas, visibles como depósitos amarillos amorfos entre el epitelio pigmentario de la retina (EPR) y la membrana de Bruch, como resultado del depósito de material lipoproteico (Bressler 1994; Sarks 1999). La presencia de drusas grandes y de cambios hiper o hipopigmentarios, o ambos, dentro de la mácula, confiere un riesgo mayor de progresión a DMS en estadio tardío (Ferris 2005). La enfermedad progresiva puede dar lugar a la aparición de atrofia geográfica o neovascularización coroidea (NVC); ambas formas de DMS de estadio tardío entrañan un alto riesgo de pérdida significativa de la visión.
La agudeza visual de contraste alto es actualmente la medida de función visual informada de forma más consistente en los estudios de DMS, pero es una herramienta relativamente poco sensible (Downie 2014a). Una variedad de otras medidas funcionales también han mostrado estar afectadas en la DMS; estas medidas incluyen la perimetría estática y pulsar (Luu 2013), la microperimetría (Wu 2013), la visión de color (Downie 2014b) y el electrorretinograma multifocal (Gin 2011).
Actualmente no hay intervenciones para prevenir el desarrollo de la DMS, ni cura para la DMS. Aunque para la CNV existen tratamientos, en forma de inhibidores del factor de crecimiento endotelial vascular intravítreo, actualmente los tratamientos terapéuticos para los estadios iniciales de la DMS, o la atrofia geográfica, todavía se consideran experimentales. Debido a que la DMS es la causa principal de deterioro visual irreversible en personas de 50 años de edad o más en los países desarrollados (Coleman 2008), hay gran interés en las intervenciones que se pueden utilizar para prevenir el desarrollo de DMS o retardar la progresión a DMS en estadio tardío.
Descripción de la intervención
La luz solar está compuesta de radiación electromagnética que varía desde la luz ultravioleta (UV) hasta la luz infrarroja (IR). La radiación ultravioleta incluye longitudes de onda en el rango de 200 a 400 nanómetros (nm) (Youssef 2011). La luz visible está en el rango de 380 a 760 nm; la luz visible de onda corta (400 a 500 nm) corresponde a los colores violeta (400 a 440 nm) y azules (440 a 500 nm) dentro del espectro visible (Mainster 2005). Los dispositivos tecnológicos modernos, como la luz que emiten los diodos (LED) y las lámparas fluorescentes compactas (CFL), también emiten niveles relativamente altos de luz azul.
Las lentes oftálmicas con filtro para luz azul, también denominadas "bloqueantes del azul", son lentes diseñadas para atenuar selectivamente la transmisión de la radiación ultravioleta y la luz visible de onda corta (Mainster 2006). Se utilizaron por primera vez en la práctica oftalmológica en 1991. Actualmente hay comercialmente disponibles dos categorías importantes de productos de lentes oftálmicas con filtro para luz azul, las lentes intraoculares (LIO) y las lentes de gafas; esta revisión se centra específicamente en las LIO. Los filtros de las lentes de gafas se consideran en otras revisiones (Downie 2017; Lawrenson 2017).
Una LIO es una lente sintética que se implanta quirúrgicamente dentro del ojo después de la extracción de la lente cristalina natural, durante la cirugía por catarata. Las LIO con filtro para luz azul habitualmente contienen cromóforos amarillos que atenúan la transmisión de alrededor de la mitad de la luz de onda baja incidente, según el poder dióptrico (Brockmann 2008; Mainster 2006). Las LIO con filtro para luz azul se diferencian de las LIO con filtro para luz UV en que son incoloras y absorben la mayoría de la radiación ultravioleta y una cantidad pequeña de luz violeta (Mainster 1986; Mainster 2006). Actualmente está disponible en el mercado una variedad de LIO con filtro para luz azul; los ejemplos incluyen OptiBlue (AMO), AF‐1 (Hoya), AcrySof Natural (Alcon) y PC 440Y Orange Series (Optech).
De qué manera podría funcionar la intervención
Aunque la luz es fundamental para la percepción visual, también es un riesgo ocular potencial. Afortunadamente, las características de absorción natural de las estructuras anteriores del ojo limitan la cantidad de daño potencial de la radiación ultravioleta que alcanza la retina. La córnea absorbe la radiación ultravioleta por debajo de 300 nm (Boettner 1962) y la lente cristalina filtra la mayoría de la luz entre 300 nm y 400 nm (Boettner 1962; Norren 1974). La lente cristalina progresivamente se torna menos transparente y más amarillenta con la edad; el resultado de este proceso fisiológico es una reducción relativa de la transmisión de la luz visible de onda corta a la retina (Van Norren 2007). Por lo tanto, la lente cristalina envejecida demuestra propiedades para filtrar la luz azul, mientras que las lentes cristalinas más jóvenes permiten que la luz visible de onda más baja se transmita a la retina. Se ha indicado que después de la cirugía por catarata, la implantación de una LIO que permita una transmisión relativamente mayor de la luz visible de onda corta que la lente cristalina envejecida podría precipitar la disfunción retiniana, en particular la DMS; actualmente no hay datos suficientes para apoyar lo anterior (Casparis 2012). También se ha planteado la vulnerabilidad relativa del ojo más joven al daño retiniano debido a la transmisión natural de la luz azul.
Las lentes oftálmicas con filtro para luz azul se proponen para proteger contra el daño retiniano potencial provocado por la luz, un fenómeno conocido como fototoxicidad retiniana, que puede provocar la luz visible de onda corta. Estudios de laboratorio han mostrado que la fototoxicidad retiniana habitualmente se debe al daño fotoquímico (Youssef 2011), que se presenta cuando la luz es absorbida por un fotosensibilizador (un cromóforo) y se liberan especies de oxígeno reactivas (ROS) (Boulton 2001). Las ROS puede provocar el daño retiniano citotóxico mediante diversos procesos, que incluyen peroxidación de los lípidos, oxidación proteica y mutagénesis (Boulton 2001). Aunque la retina tiene mecanismos de defensa celular para combatir las ROS, por diversas razones la eficiencia de estos procesos compensatorios habitualmente disminuye con la edad (Margrain 2004). Las capas retinianas exteriores muy oxigenadas, en particular el EPR y los fotorreceptores, se consideran muy vulnerables a daño fotoquímico. En condiciones experimentales, se ha mostrado que la luz visible de onda corta provoca daño celular al EPR (Ham 1978; Ham 1984); esta región del espectro visible tiene la mayor posibilidad de fototoxicidad retiniana (Ham 1976), que forma la base para la frase comúnmente adoptada, "riesgo de la luz azul" (Boulton 2001). Aunque no se ha/n determinado el/los cromóforo/s intracelular/es preciso/s que mitiga/n la sensibilidad informada a la luz azul de las células del EPR, el componente lipofuscina A2E se ha propuesto como un candidato probable. Este fluoróforo se encuentra específicamente en las células del EPR y se acumula con la edad (Parish 1998); el espectro de absorción de la lipofuscina también refleja los espectros de acción para la fototoxicidad de la luz azul (Mainster 2010).
Sobre la base principalmente de la evidencia de estudios en animales, se ha formulado la hipótesis de que el daño retiniano acumulativo en los seres humanos, debido a la fototoxicidad de la exposición a la luz ambiental (Mainster 1978), puede contribuir a los cambios maculares que se producen en la DMS. Según esta hipótesis, se ha indicado que las lentes oftálmicas con filtro para luz azul tienen una función en la protección de la mácula y posiblemente evitan el desarrollo o la progresión de la DMS, o ambos (Beatty 1999; Bernstein 2010). Persiste la polémica con respecto a inquietudes acerca de la posible interrupción de los ritmos circadianos de las lentes oftálmicas con filtro para luz azul, hasta afectar la calidad del sueño y el estado de alerta diurno (Mainster 2006).
Por qué es importante realizar esta revisión
Aunque la justificación para el uso de lentes oftálmicas con filtro para luz azul es científicamente verosímil, hay un debate académico significativo con respecto al mérito, o no, de estos dispositivos oftálmicos para proteger la mácula (Lee 2012; Mainster 2011; Symes 2012). Lo anterior se debe, al menos en parte, a la evidencia aparentemente contradictoria con respecto al mérito y crea una posible confusión en los oftalmólogos que buscan proporcionar la mejor práctica de atención.
Las LIO con filtro para luz azul se utilizan de forma sistemática en la cirugía por catarata, y representan aproximadamente el 25% de las LIO implantadas en todo el mundo (Mainster 2011). Este hecho ocurre a pesar de la escasez relativa de evidencia epidemiológica para corroborar el efecto beneficioso supuesto de las lentes con filtro para luz azul para la protección macular; diez de los 12 estudios poblacionales principales que intentaron determinar si había una correlación entre la exposición a la luz y la DMS no informaron una asociación positiva (Mainster 2006). Tampoco son concluyentes los estudios que han intentado determinar si la cirugía por catarata es un factor de riesgo para el desarrollo o la progresión de la DMS; aunque algunos estudios informaron asociaciones positivas (Klein 1998; Liu 1989), otros no han encontrado efectos claros sobre la progresión de la DMS (Baatz 2008; Chew 2009). Es importante señalar que los estudios observacionales han reconocido limitaciones metodológicas, como las influencias potenciales del sesgo y los factores de confusión, que pueden limitar la interpretación de los resultados.
Determinar si las lentes con filtro para luz azul protegen la salud macular es un problema de salud pública importante. La DMS es la principal causa de ceguera en todo el mundo, y se esperaría que los métodos efectivos para prevenir el desarrollo o la progresión tuvieran efectos beneficiosos inmensos en la reducción de la carga individual y económica de esta enfermedad. La relevancia de estas ganancias potenciales aumenta en el contexto de los cambios demográficos mundiales hacia la mejoría de la longevidad. Una revisión sistemática que considere la mejor evidencia de investigación disponible es fundamental para evaluar de forma objetiva la conveniencia relativa de las prácticas actuales con respecto a la prescripción de las lentes oftálmicas con filtro para luz azul. Dicha evaluación considera los efectos beneficiosos relativos y los efectos perjudiciales potenciales de estos dispositivos. Se considera que este tema es de interés significativo para los médicos, los investigadores y la comunidad en su sentido más amplio. La realización de esta revisión sistemática también puede identificar las áreas de interés para los estudios de investigación futuros en el campo.
Objetivos
Evaluar los efectos de las LIO con filtro para luz azul en comparación con las LIO sin filtro para luz azul, con respecto a brindar protección de la salud y la función macular.
Métodos
Criterios de inclusión de estudios para esta revisión
Tipos de estudios
Sólo se consideraron ensayos controlados aleatorios (ECA).
Tipos de participantes
Se incluyeron ECA en los que los participantes eran adultos (es decir, al menos 18 años de edad).
Tipos de intervenciones
Se incluyeron los ECA que compararon una LIO con filtro para luz azul con un tipo equivalente de LIO sin filtro para luz azul. No se incluyeron los estudios que utilizaron una LIO con filtro para luz azul en combinación con otra intervención posible para la DMS.
Tipos de medida de resultado
Resultados primarios
El resultado primario predeterminado fue el cambio en la mejor agudeza visual corregida (MAVC) a distancia, considerado un resultado continuo, entre el valor inicial y a los 12 meses de seguimiento. Para este resultado se aceptaron las medidas de la MAVC entre seis y 18 meses de seguimiento. Si los estudios no informaran sobre el cambio en la MAVC a distancia, se utilizaron los datos informados al final del período de seguimiento.
Resultados secundarios
Se consideraron los siguientes resultados secundarios:
-
proporción de ojos con DMS en estadio tardío, con la DMS neovascular o la atrofia geográfica como las definieron los investigadores de los estudios a los tres años de seguimiento (con un rango de seguimiento aceptable entre dos y cuatro años);
-
proporción de ojos con cualquier estadio de DMS, como la definieron los investigadores de los estudios a los 12 meses (con un rango de seguimiento aceptable entre seis y 18 meses);
-
proporción de ojos con un hallazgo de cambio estructural patológico de la mácula, detectado por observación clínica, tomografía de coherencia óptica (TCO) o fotografía del fondo retiniano a los 12 meses (con un rango de seguimiento aceptable de entre seis y 18 meses);
-
efecto sobre la MAVC a distancia, medido en logMAR y considerado como un resultado dicotómico (como la proporción de ojos que presentaron una pérdida de 15 o más letras a partir de la MAVC inicial), a los seis meses (con un rango de seguimiento aceptable de tres a nueve meses);
-
efecto sobre la función de sensibilidad al contraste, medido en log Sensibilidad al Contraste (%) y considerado como un resultado continuo con el uso del rango medio de las frecuencias espaciales disponibles (entre seis y 12 ciclos por grado), en condiciones fotópicas, de acuerdo con lo determinado por diversas tablas de agudeza al contraste, a los seis meses (con un rango de seguimiento aceptable de tres a nueve meses);
-
efecto sobre la discriminación cromática, medido como la proporción de ojos que tuvieron una pérdida cuantificable de la discriminación cromática a partir del valor inicial con el uso de la puntuación de la prueba de 100 matices de color de Farnsworth‐Munsell en condiciones fotópicas a los seis meses (con un rango de seguimiento aceptable de tres a nueve meses);
-
efecto sobre el promedio de la densidad óptica del pigmento macular (DOPM) retiniano, medido como la proporción de ojos que tuvieron un aumento significativo de la DOPM a los seis meses (con un rango de seguimiento aceptable de tres a nueve meses);
-
efecto sobre el estado de alerta diurno, considerado como la proporción de participantes que habían reducido el estado de alerta diurno cuando se midió mediante las Epworth Sleepiness Scores a los seis meses (con un rango de seguimiento aceptable de tres a nueve meses);
-
efecto sobre el tiempo de reacción, como una variable de resultado cognitiva, considerado como la proporción de participantes que habían reducido los tiempos de reacción a los seis meses (con un rango de seguimiento aceptable de tres a nueve meses);
-
proporción de pacientes que en general estaban satisfechos con el resultado visual a los seis meses (con un rango de seguimiento aceptable de tres a nueve meses).
Efectos adversos
Se tabularon los resultados con respecto a los efectos adversos oculares y sistémicos, como se informaron en los estudios incluidos.
Métodos de búsqueda para la identificación de los estudios
Búsquedas electrónicas
The Cochrane Eyes and Vision Information Specialist conducted systematic searches in the following databases for RCTs. There were no language or publication year restrictions. The date of the search was 25 October 2017.
-
Cochrane Central Register of Controlled Trials (CENTRAL; 2017, Issue 9) (which contains the Cochrane Eyes and Vision Trials Register) in the Cochrane Library (searched 25 October 2017) (Appendix 1);
-
MEDLINE Ovid (1946 to 25 October 2017) (Appendix 2);
-
Embase Ovid (1980 to 25 October 2017) (Appendix 3);
-
LILACS (1982 to 25 October 2017) (Appendix 4);
-
ISRCTN registry (www.isrctn.com/editAdvancedSearch; searched 25 October 2017) (Appendix 5);
-
US National Institutes of Health Ongoing Trials Register ClinicalTrials.gov (www.clinicaltrials.gov; searched 25 October 2017) (Appendix 6);
-
World Health Organization (WHO) International Clinical Trials Registry Platform (ICTRP) (www.who.int/ictrp; searched 25 October 2017) (Appendix 7).
Búsqueda de otros recursos
We undertook additional searching using the bibliographies of included RCTs to identify other potentially relevant studies. We did not handsearch conference abstracts for this review, as Cochrane Eyes and Vision routinely conducts handsearching for RCTs from major ophthalmology meetings and incorporates these results into CENTRAL.
Obtención y análisis de los datos
Selección de los estudios
We adopted a two‐stage process to select studies for this review.
First, two of the review authors (LED, PRK) independently evaluated the title and abstract results from the electronic search strategies, in order to identify potentially suitable studies for inclusion in the review.
Next, we obtained full‐text copies for studies that at least one review author deemed relevant or possibly relevant to the review. Two review authors (LED, PRK) independently assessed each full‐text article and classified its suitability for inclusion in the review, according to the Criteria for considering studies for this review into one of three categories: (i) definitely include, (ii) inclusion status unclear or (iii) definitely exclude.
We resolved discrepancies in classification by discussion to reach consensus between the two review authors. For cases where we considered further information was necessary to determine the eligibility of a study for inclusion, we contacted the study authors for this information. If we did not receive a response from the study authors within four weeks of initial contact, or they did not provide the requested information, we used the information within the full‐text article to decide upon the eligibility of the study. We have provided details relating to the reason for excluding studies that underwent full‐text review in the ‘Characteristics of excluded studies’ table.
Extracción y manejo de los datos
Two review authors (LED, PRK) independently extracted key study data (detailed in Appendix 8) using Covidence (Covidence). We collected details relating to the study design, participant characteristics, number of participants, outcomes, results and any other relevant information (e.g. funding sources). Wherever possible, we extracted quantitative data for outcomes. We resolved any discrepancies in data extraction by discussion to reach consensus; adjudication by the third review author was not required. After reaching consensus in Covidence, one review author (LED) exported collated data into Cochrane's Review Manager 5 (RevMan 5) software (RevMan 2014) and a second review author (LB) independently verified the data.
Evaluación del riesgo de sesgo de los estudios incluidos
Two review authors (LED, PRK) independently assessed the risk of bias in each of the included studies using the guidelines in Chapter 8 of the Cochrane Handbook for Systematic Review of Interventions (Higgins 2011a). We evaluated the risk of bias in the following domains:
-
selection bias (random sequence generation and allocation concealment);
-
performance bias (masking of participants and personnel);
-
detection bias (masking of outcome assessment);
-
attrition bias (incomplete outcome data);
-
reporting bias (selective reporting of outcomes);
-
other bias (funding source, other conflicts of interest).
Each review author made a judgement regarding the estimated risk of each type of bias in each included study as: (i) low risk, (ii) unclear risk (due to either lack of information or uncertainty over the potential for bias) or (iii) high risk. The review authors (LED, PRK) resolved disagreements in bias assessment by consensus.
Medidas del efecto del tratamiento
We undertook the data analyses according to the methods described in Chapter 9 of the Cochrane Handbook for Systematic Reviews of Interventions (Deeks 2011).
For continuous outcomes, we extracted information on the change in means of the outcome measures for the intervention and comparator groups at the specified follow‐up periods and standard deviations of change. Where no change scores were reported, we extracted information on means and standard deviation of the outcome for the intervention and comparator groups at the specified follow‐up periods. We have expressed treatment effects as mean difference (MD) with 95% confidence intervals (CIs) between the intervention and comparator groups.
For dichotomous outcomes (including progression to late‐stage AMD and development of early stages of AMD), we compared the proportion of eyes reaching defined categories of AMD (i.e., any AMD or late‐stage AMD) between the intervention and control groups at the nominated time points. We have presented treatment effects as risk ratios (RRs) with 95% CIs.
Cuestiones relativas a la unidad de análisis
For the purpose of this review, the unit of analysis was the enrolled study eye of the participant. Where the study collected data on more than one eye per participant, we followed guidelines for clustering or paired‐eye design described in the Cochrane Handbook for Systematic Reviews of Interventions (Higgins 2011b).
Some trials randomised one or both eyes to the intervention or comparator. When participants were randomly allocated to treatment but only one eye per person was included in the trial, then there was no unit of analysis issue. When participants were randomly allocated to treatment and both eyes per person were included, and the average value of both eyes was reported, then there was no unit of analysis issue. When participants were randomly allocated to treatment but both eyes were included and reported separately, we indicated in our protocol that we would analyse this as 'clustered data' (i.e., adjusted for within‐person correlation). In our protocol we had also stated that if the study was a within‐person study (i.e., one eye was randomly allocated to the intervention and the other eye received the comparator intervention), then we would analyse this as 'paired data'.
There were some studies that had data relevant to the review outcomes where both eyes were included in the study (i.e., a paired‐eye trial), but the data were reported as independent observations (Bhattacharjee 2006; Mester 2008a; Schmack 2012). For these trials, we attempted to contact the study authors via email to obtain information to perform a matched analysis, but either did not receive a response within four weeks of our request, or received an automated alert that the email address no longer existed. In two studies, more than one eye from an individual participant was included in the analysis but details of the intra‐class correlation coefficient for within‐person clustering were not provided (Kennis 2004; Marshall 2005). For each of these studies, we attempted to contact the study authors via email to obtain the necessary information, but either did not receive a response within four weeks of our request, or received an automated alert that the email address no longer existed.
Manejo de los datos faltantes
For any studies where we identified missing outcome data (e.g., omitted standard deviations, standard errors), we attempted to contact the study authors (see Characteristics of included studies for further details). If we did not receive a response from them within four weeks, or if they were unable to provide this further information, we used the information that was available within the publication.
We had specified in our protocol that if an intention‐to‐treat (ITT) analysis was provided, we would use these data in our analyses. As none of the included studies reported undertaking an ITT analysis, we analysed the data reported by the study authors.
Evaluación de la heterogeneidad
We assessed studies for heterogeneity using the recommendations outlined in Chapter 9 of the Cochrane Handbook for Systematic Reviews of Interventions (Deeks 2011).
We assessed for clinical and methodological heterogeneity between studies by examining differences in trial design, participant characteristics at baseline (e.g., age, gender, eligibility criteria, etc.) and risk of bias. We quantified statistical heterogeneity between studies using the I2 statistic (Higgins 2003). We interpreted an I2 statistic of 60% or more to be at risk of moderate heterogeneity (Ng 2014). In identifying and measuring heterogeneity, we also examined the magnitude and direction of effects of individual studies as well as the strength of evidence for heterogeneity (using a P value < 0.10, from the Chi2 test) as an indication of significant heterogeneity.
Evaluación de los sesgos de notificación
We had intended to assess the risk of reporting bias (due to selective reporting of outcomes) by comparing the outcomes defined in the trial protocol with those in the publication(s). However, none of the included trials had published protocols or methodological papers. There were two trials that had been prospectively registered in a clinical trials registry; for these studies, we compared study outcomes in the publication with the trial registry entry.
As we included fewer than 10 studies in any of the meta‐analyses, we were not able to assess for the potential effect of publication bias.
Síntesis de los datos
Where studies were multi‐arm studies that randomly assigned participants to more than one type of IOL, we considered data from the relevant study arms in the analyses by calculating the relevant point estimate and measure of variability for each main category of IOL (i.e., non‐blue light filtering and blue‐light filtering). We considered the intervention groups of relevance to be all those that could be included in a pair‐wise comparison of intervention groups that, if investigated alone, would meet the criteria for including studies in the review.
Where appropriate, we performed a meta‐analysis for primary or secondary outcomes, or both. When we included fewer than three RCTs in a meta‐analysis, we used a fixed‐effect model. When we included three or more RCTs in a meta‐analysis, we used a random‐effects model.
As there was adequate consistency between individual study results for a pooled result to provide a good summary of the trial findings (i.e. effects in the same directions, I2 < 60%, or a Chi2 test P value > 0.10), we pooled data.
For adverse events, including intraoperative and postoperative complications, we generated tabulated results summaries.
Análisis de subgrupos e investigación de la heterogeneidad
We did not perform any subgroup analyses for prognostic factors (i.e., gender and age) at baseline for the primary outcome measure, as there was not a sufficient number of studies (considered two studies per subgroup or more) to perform these analyses.
Análisis de sensibilidad
We had planned to perform a sensitivity analysis on the primary outcome measure, to assess the effect of excluding studies that: (i) had a high risk of bias (due to lack of allocation concealment or incomplete outcome data or lack of masking), (ii) were unpublished and (iii) were industry‐funded. We were not able to perform a sensitivity analysis on the primary outcome measure as there were too few studies to permit this analysis.
Summary of findings
We prepared a ‘Summary of findings’ table for each comparison to summarise the results of our analyses, using the formats described in Chapter 11 of the Cochrane Handbook for Systematic Reviews of Interventions (Schünemann 2011). We followed the GRADE Working Group approach to grade the certainty of evidence. Outcomes include:
-
mean change in number of letters of distance BCVA from baseline BCVA in intervention and control groups after 12 months of follow‐up;
-
proportion of participants who lost 15 or more letters of distance BCVA from baseline BCVA in intervention and control groups after six months of follow‐up;
-
mean change in contrast sensitivity from baseline in intervention and control groups after six months of follow‐up;
-
proportion of eyes with a measurable loss of colour discrimination from baseline in intervention and control groups after six months of follow‐up;
-
proportion of eyes that developed late‐stage AMD in intervention and control groups after three years of follow‐up;
-
proportion of eyes that developed any AMD in intervention and control groups after one year of follow‐up;
-
proportion of participants with adverse events with a probable causal link with the study intervention after six months of follow‐up.
Results
Description of studies
Results of the search
The electronic searches yielded a total of 834 references (Figure 1). The Cochrane Information Specialist removed 251 duplicate records and we screened the remaining 583 reports for potential inclusion in the review. We obtained 88 full‐text reports or conference abstracts that appeared to meet the pre‐defined inclusion criteria, based upon the abstract screening process. We considered a total of 52 reports of 51 studies to be suitable for inclusion in the review and these are summarised in the Characteristics of included studies. We excluded 32 reports of 32 studies; see Characteristics of excluded studies for details. We categorised one study as ongoing, see Characteristics of ongoing studies, and three studies are still currently awaiting categorisation: Ji 2013 is pending translation to English and currently we are unable to source two Chinese papers (Li 2009; Shi 2008). See Characteristics of studies awaiting classification for details.

Study flow diagram
Included studies
Types of studies
Of the 51 included studies, 12 consisted of conference abstracts and 39 were full‐text articles. The individual study designs differed across the included studies, and involved:
-
the unit of randomisation being the participant, with bilateral implantation of a randomly allocated IOL type (i.e. blue‐light filtering or non‐blue‐light filtering), where the unit of analysis for inter‐group comparisons was the study eye (Caporossi 2007), the average of both eyes (Caporossi 2009; Hayashi 2006), both eyes without apparent statistical adjustment (Marshall 2005), or was unclear (Cionni 2003; Walter 2005). One study, involving bilateral IOL implantation only reported non‐ocular outcomes, and thus the unit of analysis was the participant (Espindle 2005). For the study where one eye was included in the analysis (Caporossi 2007), the method of selection was the dominant eye, although it was not stated whether this was a pre‐planned or post hoc selection.
-
the unit of randomisation being the participants, unilateral implantation of a randomly allocated IOL type with inter‐group comparisons (Bandyopadhyay 2016; Brøndsted 2015; Brøndsted 2017; Espíndola 2012a; Falkner Radler 2008; Kim 2011b; Leibovitch 2006; Monnet 2009; Neumaier‐Ammerer 2010; Pandita 2007; Schmoll 2014; Ueda 2006; Wang 2010; Yuan 2004);
-
a paired‐eye design, whereby one eye randomly received a blue‐light filtering IOL and the fellow eye received a non‐blue‐light filtering IOL for intra‐individual comparisons (Bhattacharjee 2006; Cristobal 2005; Hahsler 2005; Kara Júnior 2006; Kara Junior 2011; Mester 2008a; Raj 2005; Rocha 2007; Schmack 2012; Schmidinger 2008; Wirtitsch 2009);
-
a combination of bilateral and unilateral IOL implantations, where one eye per individual was used for inter‐group comparisons (Cuthbertson 2009; Vuori 2006) or no further information was provided regarding the unit of analysis (Barisic 2007; Hyunseok 2007; Kennis 2004; Kim 2011a).
Additionally, in a number of studies, there was lack of a clear description relating to whether IOL allocation was bilateral or unilateral (Aose 2006; Behrens‐Baumann 2005; Brøndsted 2014; Cui 2009; Hahsler 2004; Kuchenbecker 2004; Nolan 2009; Rocha 2006a; Rocha 2006b; Soriano 2006; Ueda 2005; Yamaguchi 2009; Yamaguchi 2011).
For studies where one eye was randomised to one intervention group and the fellow eye was randomised to another intervention group, we noted that the analyses reported in these studies did not describe taking into account the non‐independence of eyes by using paired‐eye analysis methods. For most studies where bilateral IOL implantation was performed, data were inappropriately analysed as independent observations, without taking into account the relative non‐independence of eyes. In an attempt to incorporate studies adopting clustered or paired designs in our meta‐analyses, wherever possible, we contacted the authors of studies to obtain relevant data relating to within‐person differences or within‐person clustering for our prespecified outcome measures.
Types of participants
We included 51 RCTs in which the participants were adults (i.e. at least 18 years of age), where a blue‐light filtering IOL was compared with an equivalent type of non‐blue‐light filtering IOL. Together, these studies considered the outcomes of IOL implantation in over 5000 eyes. Based upon data reported in the studies, the number of participants in each trial ranged from 13 to 300. The follow‐up period of the studies ranged from one month to five years after cataract surgery.
The studies were conducted in 17 different countries: one in Australia (Leibovitch 2006), six in Austria (Falkner Radler 2008; Hahsler 2004; Hahsler 2005; Neumaier‐Ammerer 2010; Schmidinger 2008; Wirtitsch 2009), one in Belgium or Switzerland (unclear) (Kennis 2004), four in Brazil (Espíndola 2012a; Kara Júnior 2006; Kara Junior 2011; Rocha 2007), three in China (Cui 2009; Wang 2010; Yuan 2004), one in Croatia (Barisic 2007), three in Denmark (Brøndsted 2014; Brøndsted 2015; Brøndsted 2017), one in England (Cuthbertson 2009), one in Finland (Vuori 2006), one in France (Monnet 2009), four in Germany (Kuchenbecker 2004; Mester 2008a; Schmack 2012; Walter 2005), four in India (Bandyopadhyay 2016; Bhattacharjee 2006; Pandita 2007; Raj 2005), one in Ireland (Nolan 2009), two in Italy (Caporossi 2007; Caporossi 2009), five in Japan (Aose 2006; Hayashi 2006; Ueda 2006; Yamaguchi 2009; Yamaguchi 2011), two in Korea (Kim 2011a; Kim 2011b), one in Scotland (Schmoll 2014) and two in the USA (Espindle 2005; Marshall 2005). Investigators of eight studies did not report in which country the trial had been conducted (Behrens‐Baumann 2005; Cionni 2003; Cristobal 2005; Hyunseok 2007; Rocha 2006a; Rocha 2006b; Soriano 2006; Ueda 2005).
For all trials, an inclusion criterion was a clinical indication for cataract surgery. In one study (Falkner Radler 2008), participants had a diagnosis of vitreoretinal pathology, including diabetic vitreous haemorrhage, macular hole, epiretinal membrane or persisting macula oedema, with coexisting significant cataract. One trial (Schmoll 2014), described a group of 'control' participants not undergoing cataract surgery; we did not include data from these participants in our analyses. In one trial, all participants were moderate red–green anomalous trichromats (Raj 2005).
Several studies excluded participants with intraoperative complications (Bhattacharjee 2006; Caporossi 2007; Caporossi 2009; Cristobal 2005; Cuthbertson 2009; Espíndola 2012a; Kara Junior 2011; Kennis 2004; Kim 2011a; Mester 2008a; Monnet 2009; Pandita 2007; Raj 2005; Rocha 2007; Schmack 2012; Wang 2010; Yamaguchi 2009; Yamaguchi 2011), postoperative complications (Bhattacharjee 2006; Brøndsted 2015; Caporossi 2007; Caporossi 2009; Cristobal 2005; Kennis 2004; Kim 2011a; Pandita 2007; Raj 2005; Schmack 2012; Yamaguchi 2009; Yamaguchi 2011), incomplete follow‐up (Espíndola 2012a; Kara Junior 2011; Wang 2010) and/or reduced actual (Kara Júnior 2006) or anticipated (Wirtitsch 2009) postoperative visual acuity. Some trials indicated that no participants developed intraoperative or postoperative complications (Brøndsted 2015; Caporossi 2007; Caporossi 2009; Espíndola 2012a; Raj 2005; Yamaguchi 2009) but most studies did not report on how many participants were excluded due to such effects, which may have affected our ability to report upon all potential adverse events from the interventions.
Types of interventions
All included trials compared at least one blue‐light filtering IOL to at least one non‐blue‐light filtering IOL. In one study, all participants underwent phacoemulsification and IOL implantation, followed by a vitreo‐retinal procedure (Falkner Radler 2008).
Table 1 summarises the specific IOLs used in each trial. Most studies used one type of blue‐light filtering IOL and compared this directly with a non‐blue‐light filtering IOL, although some studies considered multiple IOL types. One trial did not report the IOLs investigated in the study (Yuan 2004).
| Study | Blue‐light filtering IOL name(s)a (Manufacturer) | Non‐blue‐light filtering IOL name(s)a |
| YA‐60BB (Hoya) | AcrySof SA60AT (Alcon) or AcrySof MA60BM (Alcon) or VA‐60BB (Hoya) | |
| AcrySof Natural SN60AT (Alcon) or PC4406 (Optech) | AcrySof SA60AT (Alcon) | |
| AcrySof Natural (Alcon) | AcrySof MA60BM (Alcon) | |
| YA‐60BB (Hoya) | VA‐60BB (Hoya) | |
| AcrySof Natural SN60AT (Alcon) | AcrySof SA60AT (Alcon) | |
| Not reported | Not reported | |
| AcrySof IQ SN60WF (Alcon) | AMO ZCBOO (Abbott Medical Optics) | |
| AcrySof IQ SN60WF (Alcon) | AMO ZCBOO (Abbott Medical Optics) | |
| AcrySof Natural SN60AT (Alcon) or AcrySof IQ SN60WF (Alcon) | Sensar AR40e (Abbott Medical Optics) or Tecnis Z9000 (Abbott Medical Optics) or Sofport L161AO (Bausch & Lomb) | |
| AcrySof Natural SN60AT (Alcon) or AcrySof IQ SN60WF (Alcon) | Sensar AR40e (Abbott Medical Optics) or Tecnis Z9000 (Abbott Medical Optics) | |
| AcrySof SB30AL (Alcon) | AcrySof SA30AL (Alcon) | |
| AcrySof Natural SN60AT (Alcon) | AcrySof SA60AT (Alcon) | |
| AcrySof Natural SN60AT (Alcon) or AcrySof IQ SN60WF (Alcon) | Tecnis Z9001 (Abbott Medical Optics) | |
| AcrySof Natural SN60AT (Alcon) or AcrySof IQ SN60WF (Alcon) | Tecnis Z9000 (Abbott Medical Optics) or Cee On Edge (Abbott Medical Optics) or Akreos AO (Bausch & Lomb) or Akreos Adapt (Bausch & Lomb) | |
| AcrySof Natural (Alcon) | AcrySof single‐piece (Alcon) | |
| AcrySof Natural SN60AT (Alcon) | Akreos Fit (Bausch & Lomb) or Akreos AO (Bausch & Lomb) or AcrySof SA60AT as described in the methods (but appears to be inadvertently described as the MA60AC in the reporting of the results) | |
| AcrySof Natural (Alcon) or AF‐1 UY (Hoya) | AcrySof single‐piece (Alcon) or AF‐1 UV (Hoya) | |
| SN60 (Alcon) | SA60 (Alcon) | |
| YA (Hoya) or SN60 (Alcon) | VA (Hoya) or SA60 (Alcon) | |
| YA‐60BB (Hoya) | VA‐60BB (Hoya) | |
| AcrySof Natural SN60AT (Alcon) | Tecnis ZA9003 (Abbott Medical Optics) | |
| AcrySof Natural SN60AT (Alcon) | AcrySof SA60AT (Alcon) | |
| AcrySof Natural SN60AT (Alcon) | AcrySof MA30AC (Alcon) | |
| AcrySof Natural SN60AT (Alcon) | Tecnis Z9000 (Pfizer) or Opti‐Edge (Abbott Medical Optics) | |
| AcrySof IQ SN60WF (Alcon) | OII Biovue3 (BioVue) or YA60BBR (Hoya) | |
| AcrySof IQ SN60WF (Alcon) | Tecnis Z9003 (Abbott Medical Optics) | |
| YA‐60BB (Hoya) | VA‐60BB (Hoya) | |
| AcrySof Natural SN60AT (Alcon) | AcrySof single‐piece SA60AT (Alcon) | |
| AcrySof Natural IOL SB30AL (Alcon) (the current marketed version of this lens is the SN60AT) | AcrySof SA30AL (Alcon) | |
| AF‐1 UY (Hoya) | AF‐1 UV (Hoya) | |
| AcrySof SN60AT (Alcon) | AcrySof MA60AC (Alcon) or AcrySof SA60AT (Alcon) | |
| AF1 UY (Hoya) or AcrySof SN60AT (Alcon) | AF1 UV (Hoya) or AcrySof SA60AT (Alcon) | |
| AcrySof Natural SN60AT (Alcon) | AcrySof SA60AT (Alcon) | |
| AcrySof SN60AT (Alcon) or AcrySof SN60WF (Alcon) | AcrySof SA60AT (Alcon) | |
| AcrySof Natural SN60AT (Alcon) | AcrySof SA60AT (Alcon) | |
| AcrySof IQ (Alcon) or AcrySof Natural (Alcon) | Sensar (Abbott Medical Optics) | |
| AcrySof IQ (Alcon) or AcrySof Natural (Alcon) | Sensar (Abbott Medical Optics) | |
| AcrySof IQ (Alcon) or AcrySof SN60AT (Alcon) | Sensar AR40 (Allergan) | |
| Oculaid PC 440Y Orange Series (Ophtec BV) | Oculaid PC 430Y Elite Series (Ophtec BV) | |
| AF‐1 UY (Hoya) | AF‐1 UV (Hoya) | |
| AcrySof SN60WF (Alcon) | Tecnis ZCB (Abbott Medical Optics) | |
| AcrySof SN60AT (Alcon) or AcrySof SN60WF (Alcon) | Sensar (Abbott Medical Optics) | |
| ENV‐13 (Menicon) | ES‐13 (Menicon) | |
| YA‐60BB (Hoya) | VA‐60BB (Hoya) | |
| AcrySof Natural SN60AT (Alcon) | AcrySof SA60AT (Alcon) | |
| AF‐1 YA‐60BB (Hoya) | AF‐1 UV‐60BB (Hoya) | |
| AY‐1 UY (Hoya) or Arium Matrix Model 4000 (Medennium) | MC611MI (HumanOptics) | |
| YA‐60BB (Hoya) | VA‐60BB (Hoya) | |
| AcrySof SN60WF (Alcon) or AcrySof SN60AT (Alcon) or Py60AD (Hoya) | Tecnis Z9003 (Abbott Medical Optics) | |
| AcrySof SN60WF (Alcon) or AcrySof SN60AT (Alcon) or Py60AD (Hoya) | Tecnis Z9003 (Abbott Medical Optics) | |
| Not reported (Hoya) | Not reported (not reported) |
aDetails of the interventions are provided as per the details available in the included studies.
bCaporossi 2009, reported two‐year follow‐up data for four out of five of the intervention groups from the Caporossi 2007 study (data from the Sofport L161AO group were not provided, although no explanation was provided).
Primary outcome
As a frequent measure of visual function, distance best‐corrected visual acuity (BCVA) was reported, in various forms and in varying degrees of detail, in many of the included studies.
Six studies (Bhattacharjee 2006; Caporossi 2009; Kennis 2004; Mester 2008a; Schmack 2012; Vuori 2006) presented data that we judged to be potentially relevant to the primary outcome, defined as the change in distance BCVA, and considered as a continuous variable. The methods adopted to assess BCVA involved quantification on an Early Treatment of Diabetic Retinopathy Study (ETDRS) chart under photopic conditions (Caporossi 2009; Mester 2008a; Schmack 2012), Snellen chart under photopic conditions (Kennis 2004; Vuori 2006), or was not reported (Bhattacharjee 2006).
In our protocol, we prespecified that we would obtain data between baseline and 12 months of follow‐up for this outcome measure, but that we would accept measures between six and 18 months of follow‐up, and that if studies did not report the change in distance BCVA, we would utilise data reported at the end of the follow‐up period. The trial designs of the six studies were single‐eye comparisons (Caporossi 2009; Vuori 2006), paired‐eye comparisons (Bhattacharjee 2006; Mester 2008a; Schmack 2012) and a clustered design including where data from more than one eye of some participants were included (Kennis 2004). We attempted to contact the authors of studies utilising paired‐eye and clustered designs, to obtain relevant information relating to within‐person clustering or within‐person differences, or both, to be able to include these data in a meta‐analysis. Each of the six studies reported BCVA data at the end of the follow‐up period, rather than the change from baseline. For one study (Kennis 2004), the unit of measure for distance BCVA was not defined in the paper; for all other studies, the unit of measure was in LogMAR.
Several studies reported data relating to distance BCVA that were not directly relevant to the primary outcome, due to:
-
the postoperative follow‐up period being less than six months (Aose 2006; Bandyopadhyay 2016; Brøndsted 2015; Caporossi 2007; Cristobal 2005; Cui 2009; Cuthbertson 2009; Falkner Radler 2008; Hayashi 2006; Kim 2011a; Kim 2011b; Kuchenbecker 2004; Neumaier‐Ammerer 2010; Pandita 2007; Rocha 2007; Schmidinger 2008; Ueda 2006; Walter 2005; Wang 2010; Wirtitsch 2009);
-
the postoperative follow‐up period being in excess of 18 months (Espíndola 2012a: 24 months);
-
data being presented in an alternative format:
-
Nolan 2009: reported distance BCVA as a 'visual acuity rating' (VAR) at 12 months after surgery, which could not be incorporated in our statistical analysis of this outcome. In this study, it was reported that "similar improvements in acuity were observed in (both intervention groups) over the time course of the study";
-
Barisic 2007: measured distance BCVA categorically as the number of eyes with BCVA of 0.8, 0.9 or 1.0 decimal acuity after six months of follow‐up, which could not be included in the statistical analysis;
-
-
a lack of quantitative data within the publication (Aose 2006; Barisic 2007; Caporossi 2007; Cionni 2003; Cui 2009; Kim 2011a; Kim 2011b; Leibovitch 2006; Marshall 2005).
Secondary outcomes
Proportion of eyes with late‐stage AMD (neovascular AMD or geographic atrophy)
One trial (Kara Junior 2011) reported data relevant to the proportion of eyes with late‐stage AMD (being neovascular AMD or geographic atrophy) at three‐years of follow‐up (with an acceptable follow‐up range of between two and four years).
Proportion of eyes with any stage of AMD
For the outcome involving the proportion of eyes with any stage of AMD, as defined by the study investigators at 12 months (with an acceptable follow‐up range of between six and 18 months), there were two relevant studies (Kara Junior 2011; Mester 2008a). Kara Junior 2011 examined macular findings, determined by optical coherence tomography (OCT) analysis and retinal examination by a masked retinal specialist, at five years of follow‐up and reported "no significant clinical or OCT findings with respect to AMD in any case", in the 25 individuals participating in this paired‐eye trial. The OCT used in this study was a Stratus OCT, with central retinal thickness quantified using the Stratus OCT Reading Software (version 4.1, Carl Zeiss Meditec, Incorporated). In Mester 2008a, also a paired‐eye trial, where participants were followed up for 12 months postoperatively, it was reported that "there were no pathologic findings on fundus examination in any eye at any follow‐up visit." As there were no eyes that developed AMD, of any stage, in any of the intervention groups, in either of the studies, meta‐analysis was not possible for this outcome.
Proportion of eyes with structural macular change
Four studies (Falkner Radler 2008; Marshall 2005; Mester 2008a; Ueda 2005) presented data that were considered potentially relevant to the outcome relating to the proportion of eyes with a finding of a pathological structural change at the macula, as detected by clinical observation, OCT or retinal fundus photography at 12 months (with an acceptable follow‐up range of between six and 18 months).
In the Falkner Radler 2008 study, it was reported that "one patient (in the blue‐light filtering IOL group) had a cystoid macular oedema at nine months after surgery." In the Marshall 2005 study, the same IOLs were bilaterally implanted; the relative non‐independence of eyes from a given participant did not appear to be factored into the statistical analysis. In this trial, it was reported that at six months of follow‐up, six eyes in the blue‐light filtering IOL group had developed cystoid macula oedema and six eyes required secondary surgical intervention; none of the occurrences were considered IOL‐related. In addition, in the non‐blue‐light filtering IOL group, three eyes developed cystoid macula oedema and three eyes required secondary surgical intervention; none of the occurrences were considered IOL‐related.In the paired‐eye Mester 2008a trial, no pathological findings were identified in the blue‐light filtering or non‐blue‐light filtering IOL groups. For the Ueda 2005 study, being an Association for Research in Vision and Ophthalmology (ARVO) conference abstract, the number of eyes assigned to each treatment group, from the 31 participants recruited, was not provided; we attempted to contact the study authors for this information, but were not successful; data from this study could thus not be included in the review for this outcome. In the conference abstract, the authors reported that in the blue‐light filtering IOL group, cystoid macular oedema was evident in 25% of participants at three months of follow‐up, and 9% of participants at 12 months of follow‐up. In the non‐blue‐light filtering IOL group, it was reported that cystoid macular oedema was present in 28% of participants at three months of follow‐up, and 17% of participants at 12 months of follow‐up. The type of OCT used in the study was not reported.
Effect on distance BCVA (logMAR)
For the effect on distance BCVA, measured in logMAR and considered as a dichotomous outcome (being the proportion of eyes that experienced loss of 15 or more letters from baseline BCVA) at six months postoperatively (with an acceptable follow‐up range of three to nine months), there were two studies reporting relevant data (Leibovitch 2006; Schmack 2012). Neither of these studies excluded participants on the basis of intraoperative and/or postoperative complications. In both studies, there were no cases of a loss of distance BCVA in either intervention group; as such, a meta‐analysis was not feasible for this secondary outcome.
Contrast sensitivity
In relation to effects on contrast sensitivity, many of the included studies reported data, in various forms and with varying degrees of detail. Nine studies (Caporossi 2009; Falkner Radler 2008; Kennis 2004; Leibovitch 2006; Mester 2008a; Pandita 2007; Schmack 2012; Wang 2010; Yuan 2004) presented data that we considered potentially relevant to this outcome, defined as the effect on the contrast sensitivity function, measured in log Contrast Threshold (%), and considered as a continuous outcome using the mid‐range of the available spatial frequencies (between six and 12 cycles/degree), under photopic conditions, as determined by various contrast acuity charts, at six months (with an acceptable follow‐up range of three to nine months). Of these potentially relevant trials, five studies (Caporossi 2009; Kennis 2004; Pandita 2007; Wang 2010; Yuan 2004) did not provide details relating to measures of variability for this outcome; we attempted to contact the study authors for this information, but this was not successful, and thus we were unable to include data from these trials. One trial (Falkner Radler 2008) reported changes to contrast acuity, from baseline, measured using the Pelli Robson chart, quantified in log contrast sensitivity, at three months postsurgery. The trial by Leibovitch 2006 reported photopic contrast sensitivity data at six‐months postoperatively (i.e. at the study endpoint) using the Pelli‐Robson chart; although the spatial frequency was not specified, we considered these data relevant to the review and incorporated this information in our analyses. Both the Mester 2008a and Schmack 2012 trials were paired‐eye studies, reporting data at 12 cycles/degree after six months of follow‐up; we contacted the authors of both studies to provide information relating to the means and standard deviations of the within‐pair differences in contrast sensitivity at follow‐up, and for P‐values from the repeated measures ANOVA or paired samples t‐tests; however we did not receive this information, and thus could not incorporate data from these trials in a meta‐analysis.
Reaction time
One study (Schmoll 2014) included a figure (box and whisker plot) that reported data relating to reaction time, as a cognitive outcome variable, at three months of follow‐up. The study authors stated that "Both lenses had an identical mean choice reaction time improvement; Mann–Whitney U testing showed no significant difference in lens effect (P=0.272)."
Overall satisfaction
One study (Barisic 2007) reported on the proportion of people who were overall satisfied with their visual outcome after six months. The authors stated that "high patient satisfaction was noticed since 96.7% of patients would implant (the) AcrySof Natural IOL again (Figure 6). Only one patient would not implant this lens again due to the fact that other people could see a yellow »shine« in his eye. Out of six patients having AcrySof Natural IOL in one eye and a standard AcrySof IOL in other eye, three patients were more satisfied with AcrySof Natural IOL, two didn't notice any difference and one was more satisfied with AcrySof MA60BM IOL."
There were no relevant extractable data for outcomes relating to the following secondary outcomes.
-
The effect on colour discrimination, measured as the proportion of eyes that had a measurable loss of colour discrimination from baseline using the Farnsworth‐Munsell 100‐hue colour test score under phototopic conditions, at six months of follow‐up. Several studies considered colour vision, but some only included subjective‐reported outcomes (Barisic 2007; Cristobal 2005), did not provide quantitative data in the required format (Behrens‐Baumann 2005; Bhattacharjee 2006; Cionni 2003; Kuchenbecker 2004; Neumaier‐Ammerer 2010; Schmack 2012; Vuori 2006; Walter 2005; Wang 2010; Wirtitsch 2009), used an alternative test to quantify it (i.e., the Ishihara test (Falkner Radler 2008) and/or Farnsworth D‐15 test (Marshall 2005; Raj 2005)), or quantified it at an alternative time‐point (Kara Junior 2011).
-
The effect on average macular pigment optical density (MPOD) measured as the proportion of eyes that had a significant increase in MPOD at six months of follow‐up. One study considered MPOD measures (Nolan 2009). This trial reported that "average MPOD across the retina increased significantly with time (after 3 months) in the ANIOL (blue‐light filtering) group (repeated‐measures, general linear model, P < 0.05), but remained stable in the AIOL (non‐blue‐light filtering) group (repeated‐measures, general linear model, P > 0.05)." Although the authors analysed the within‐group trend for change in MPOD separately for each group, they did not report the change from baseline in MPOD between groups. This outcome should be considered in the context that it is unclear, from the available information about this study, whether this was a pre‐planned or post‐hoc analysis.
-
The effect on daytime alertness, considered as the proportion of participants who had reduced daytime alertness measured using the Epworth Sleepiness Score, at six months of follow‐up. One study, Brøndsted 2015, reported on subjective sleep quality, measured using the Pittsburgh Sleep Quality Index (PSQI). The study authors reported that "subjective sleep quality assessed by the PSQI questionnaire was not affected by the surgery (mixed‐model ANOVA, F64 = 0.91, P = 0.345) or by IOL type (mixed‐model ANOVA, F63 = 2.04, P = 0.158) (Table 5). The number of poor sleepers was not affected by surgery (Chi‐square test, X2 = 0.03, P = 0.856) (Table 5)." Brøndsted 2017, also reported on subjective sleep quality, using the PSQI. The study authors reported that subjective sleep quality was improved, as the time of wakefulness after sleep onset had improved by five minutes (95% CI, 1 to 10) for the entire population, while sleep efficiency had increased by two percentage points (95% CI, 0.42 to 3.65) although exclusively, for the participants allocated to blue‐blocking IOLs. However, it should be noted that the results of the "Morningness‐eveningness questionnaire", listed as a secondary outcome measure on the clinicaltrials.gov entry for this study, were not reported.
-
One study (Espindle 2005) only reported quality‐of‐life outcomes, and did not describe any vision‐related outcomes.
Adverse effects
We have summarised data relating to adverse effects in relation to:
-
intraoperative complications (Bandyopadhyay 2016; Barisic 2007; Caporossi 2007; Cui 2009; Cuthbertson 2009; Espíndola 2012a; Falkner Radler 2008; Kim 2011a; Kim 2011b; Leibovitch 2006; Marshall 2005; Monnet 2009; Pandita 2007; Raj 2005; Schmidinger 2008; Vuori 2006);
-
eyes that required neodymium‐doped yttrium aluminium garnet (Nd:YAG) capsulotomy following cataract surgery (Barisic 2007; Caporossi 2009; Espíndola 2012a; Marshall 2005; Monnet 2009; Vuori 2006; Wang 2010; Yamaguchi 2011); and
-
postoperative complications (Bandyopadhyay 2016; Barisic 2007; Brøndsted 2015; Caporossi 2007; Cui 2009; Falkner Radler 2008; Hayashi 2006; Kara Junior 2011;Kim 2011a; Kim 2011b; Leibovitch 2006; Marshall 2005; Monnet 2009; Schmidinger 2008; Wang 2010;Yamaguchi 2011).
As summarised in Table 2, a total of 16 studies reported on intraoperative complications. Together, these studies considered a total of 1815 eyes (15 RCTs), with overall very few intraoperative complications described with either type of IOL. Marshall 2005 described one case of IOL dislocation during surgery with a blue‐light filtering IOL. Monnet 2009 reported that two (blue‐light filtering IOLs) were placed with one haptic in the capsular bag and one haptic outside the capsular bag; we excluded outcomes from these two participants from the analyses.
| Study | Study population: number of participants (number of eyes) | Number of intraoperative complication(s) | Details of intraoperative complication(s) |
| Blue‐light filtering IOLs: n = 65 (65); this group combined individuals assigned to 2 different blue‐light filtering IOLs Non‐blue‐light filtering IOL: n = 33 (33) | Blue‐light filtering IOL: none Non‐blue‐light filtering IOL: none | Not applicable | |
| Blue‐light filtering IOL: n = 30 (60) Non‐blue‐light filtering IOL: n = 30 (60) | Blue‐light filtering IOL: none Non‐blue‐light filtering IOL: none | Not applicable | |
| Blue‐light filtering IOL: n = 50 (100); this group combined individuals assigned to 2 different blue‐light filtering IOLs Non‐blue‐light filtering IOL: n = 75 (150); this group combined individuals assigned to 3 different non‐blue‐light filtering IOLs | Blue‐light filtering IOL: none Non‐blue‐light filtering IOL: none | Not applicable | |
| Blue‐light filtering IOL: n = 39 (41) Non‐blue‐light filtering IOL: n = 18 (20) | Blue‐light filtering IOL: none Non‐blue‐light filtering IOL: none | Not applicable | |
| Overall: n = 31 (31) | Not reported | One participant developed endophthalmitis and was removed from the trial, being replaced (after re‐randomisation) by another individual. There was one anterior capsular rim tear and one posterior capsule tear without vitreous loss. No details were provided in relation to which group(s) the adverse events occurred in. | |
| Blue‐light filtering IOL: n = 27 (27) Non‐blue‐light filtering IOL: n = 52 (77) | Blue‐light filtering IOL: none Non‐blue‐light filtering IOL: none | Not applicable | |
| Blue‐light filtering IOL: n = 30 (30) Non‐blue‐light filtering IOL: n = 30 (30) | Blue‐light filtering IOL: none Non‐blue‐light filtering IOL: none | Not applicable | |
| Blue‐light filtering IOL: n = ? (42) Non‐blue‐light filtering IOL: n = ? (26) | Blue‐light filtering IOL: none Non‐blue‐light filtering IOL: none | Not applicable | |
| Blue‐light filtering IOL: n = 23 (23) Non‐blue‐light filtering IOL: n = 16 (16) | Blue‐light filtering IOL: none Non‐blue‐light filtering IOL: none | Not applicable | |
| Blue‐light filtering IOL: n = 9 (9) Non‐blue‐light filtering IOL: n = 10 (10) | Blue‐light filtering IOL: none Non‐blue‐light filtering IOL: none | Not applicable | |
| Blue‐light filtering IOL: n = 150 (300) Non‐blue‐light filtering IOL: n = 147 (294) | Blue‐light filtering IOL: n = 1 Non‐blue‐light filtering IOL: none | There was one case of lens dislocation during surgery in the blue‐light filtering IOL group, in a case in which a posterior capsule rupture had occurred during cataract extraction. | |
| Blue‐light filtering IOL: n = 19 (19) Non‐blue‐light filtering IOL: n = 40 (40); this group combined individuals assigned to 2 different non‐blue‐light filtering IOLs. | Blue‐light filtering IOL: n = 2 Non‐blue‐light filtering IOL: none | In the blue‐light filtering IOL lens group "two IOLs were placed with 1 haptic in the capsular bag and 1 haptic outside the capsular bag; these 2 patients were also excluded from the final statistical analysis." | |
| Blue‐light filtering IOL: n = 73 (73); this group combined individuals assigned to 2 different blue‐light filtering IOLs. Non‐blue‐light filtering IOL: n = 36 (36) | Blue‐light filtering IOL: none Non‐blue‐light filtering IOL: none | Not applicable | |
| Blue‐light filtering IOL: n = 30 (30) Non‐blue‐light filtering IOL: n = 30 (30) | Blue‐light filtering IOL: none Non‐blue‐light filtering IOL: none | Not applicable | |
| Blue‐light filtering IOL: n = 31 (31) Non‐blue‐light filtering IOL: n = 31 (31) | Blue‐light filtering IOL: none Non‐blue‐light filtering IOL: none | Not applicable | |
| Blue‐light filtering IOL: n = 19 (25) Non‐blue‐light filtering IOL: n = 18 (27) | Blue‐light filtering IOL: none Non‐blue‐light filtering IOL: none | Not applicable |
IOL: intraocular lens
As summarised in Table 3, the time period for reporting postoperative complications or Nd:YAG capsulotomies, or both, ranged from eight weeks to five years of follow‐up. In total, these trials considered more than 1700 eyes (19 RCTs). The risk ratio (RR) of a postoperative complication in the blue‐light filtering IOL group was RR 2.24 (95% CI 0.93 to 5.38), although there was no probable causal link with the intervention. The most common postoperative complication in both intervention groups was the need for a Nd:YAG capsulotomy.
| Study | Study population: number of participants (number of eyes) | Number of postoperative complication(s) | Details of postoperative complication(s) |
| Blue‐light filtering IOLs: n = 65 (65); this group combined individuals assigned to 2 different blue‐light filtering IOLs. Non‐blue‐light filtering IOL: n = 33 (33) | Blue‐light filtering IOL: none Non‐blue‐light filtering IOL: none | None at four weeks of follow‐up | |
| Blue‐light filtering IOL: n = 30 (60) Non‐blue‐light filtering IOL: n = 30 (60) | Blue‐light filtering IOL: n = 3 eyes Non‐blue‐light filtering IOL: n = 4 eyes | Although the study authors reported that "there were no postoperative complications", n = 3 eyes from the blue‐light filtering IOL group and n = 4 eyes from the non‐blue‐light filtering IOL group required Nd:YAG capsulotomy at six months of follow‐up. | |
| Blue‐light filtering IOL: n = 38 (38) Non‐blue‐light filtering IOL: n = 35 (35) | Blue‐light filtering IOL: none Non‐blue‐light filtering IOL: none | None at six months of follow‐up. | |
| Blue‐light filtering IOL: n = 50 (100); this group combined individuals assigned to 2 different blue‐light filtering IOLs. Non‐blue‐light filtering IOL: n = 75 (150); this group combined individuals assigned to three different non‐blue‐light filtering IOLs. | Blue‐light filtering IOL: none Non‐blue‐light filtering IOL: none | None at two months of follow‐up | |
| Blue‐light filtering IOL: n = 50 (100); this group combined individuals assigned to 2 different blue‐light filtering IOLs Non‐blue‐light filtering IOL: n = 50 (100); this group combined individuals assigned to 2 different non‐blue‐light filtering IOLs | Blue‐light filtering IOL: n = 1 for Nd:YAG capsulotomy Non‐blue‐light filtering IOL: n = 1 for Nd:YAG capsulotomy | This study reports the two‐year follow‐up data for a subset of participants from Caporossi 2007. The study authors reported that "patients who underwent a capsulotomy before two‐year follow‐up (two patients) were excluded as it was not possible to perform aberrometric analysis. Two Nd:YAG laser capsulotomies were required in two patients who had AcrySof SN60AT IOL (blue‐light filtering IOL) and Tecnis Z9000 IOL (non‐blue‐light filtering IOL) implantation." | |
| Blue‐light filtering IOL: n = 39 (41); this group combined individuals assigned to 2 different blue‐light filtering IOLs. Non‐blue‐light filtering IOL: n = 18 (20) | Blue‐light filtering IOL: none Non‐blue‐light filtering IOL: none | None at two months of follow‐up | |
| Blue‐light filtering IOL: n = 27 (27) Non‐blue‐light filtering IOL: n = 52 (77) | Blue‐light filtering IOL: none for glaucoma or Nd:YAG capsulotomy Non‐blue‐light filtering IOL: none for glaucoma or Nd:YAG capsulotomy | The study authors reported that "at two years after surgery, all lenses were well centered and there was no evidence of posterior capsule opacity or glaucoma." | |
| Blue‐light filtering IOL: n = 30 (30) Non‐blue‐light filtering IOL: n = 30 (30) | Blue‐light filtering IOL: n = 3 eyes Non‐blue‐light filtering IOL: n = 1 eye | Blue‐light filtering IOL: n = 1 postoperative iris capture, n = 1 spontaneously reabsorbed vitreous haemorrhage, n = 1 cystoid macular oedema at nine months after surgery Non‐blue‐light filtering IOL: n = 1 postoperative iris capture | |
| Blue‐light filtering IOL: n = 23 (23) Non‐blue‐light filtering IOL: n = 16 (16) | Blue‐light filtering IOL: none Non‐blue‐light filtering IOL: none | None at eight weeks of follow‐up | |
| Blue‐light filtering IOL: n = 38 (38) Non‐blue‐light filtering IOL: n = 36 (36) (In both groups, data were obtained from both eyes and averaged) | Glare symptoms Blue‐light filtering IOL: n = 3 participants Non‐blue‐light filtering IOL: n = 2 participants Cyanopsia Blue‐light filtering IOL: none Non‐blue‐light filtering IOL: none | Postoperative complications (as measured by participant report of glare symptoms and cyanopsia) at three months after surgery One participant was reported to have a clinically significant epiretinal membrane in the macula (it is unclear which group the participant belonged to) | |
| Blue‐light filtering IOL: n = 30 (30) Non‐blue‐light filtering IOL: n = 30 (30) | "Three patients required neodymium:YAG laser capsulotomy for posterior capsule opacification," however group allocations were not specified. | Three participants (although this was not distinguished by the IOL intervention) at five years of follow‐up | |
| Blue‐light filtering IOL: n = 23 (23) Non‐blue‐light filtering IOL: n = 16 (16) | Blue‐light filtering IOL: none Non‐blue‐light filtering IOL: none | None at eight weeks of follow‐up | |
| Blue‐light filtering IOL: n = 9 (9) Non‐blue‐light filtering IOL: n = 10 (10) | Blue‐light filtering IOL: none Non‐blue‐light filtering IOL: none | None at six months of follow‐up | |
| Blue‐light filtering IOL: n = 150 (300) Non‐blue‐light filtering IOL: n = 147 (294) | Blue‐light filtering IOL: n = 12 Non‐blue‐light filtering IOL: n = 6 | At six months of follow‐up, in the blue‐light filtering IOL group, six eyes developed cystoid macula oedema and six eyes required secondary surgical intervention; none of the occurrences were considered IOL‐related. At six months of follow‐up, in the non‐blue‐light filtering IOL group, three eyes developed cystoid macula oedema and three eyes required secondary surgical intervention; none of the occurrences were considered IOL‐related. The study authors stated that "no Nd:YAG capsulotomy was performed in the first‐eye subgroup in either the test or control groups throughout the study period." | |
| Blue‐light filtering IOL: n = 19 (19) Non‐blue‐light filtering IOL: n = 40 (40); this group combined individuals assigned to 2 different non‐blue‐light filtering IOLs. | Blue‐light filtering IOL: none Non‐blue‐light filtering IOL: none | None at three months of follow‐up | |
| Blue‐light filtering IOL: n = 31 (31) Non‐blue‐light filtering IOL: n = 31 (31) | Blue‐light filtering IOL: none Non‐blue‐light filtering IOL: none | None at three months of follow‐up | |
| Blue‐light filtering IOL: n = 80 (80); this group combined individuals assigned to 2 different blue‐light filtering IOLs. Non‐blue‐light filtering IOL: n = 38 (38) | Blue‐light filtering IOL: none Non‐blue‐light filtering IOL: none | None at 3 months of follow‐up | |
| Blue‐light filtering IOL: n = 19 (25) Non‐blue‐light filtering IOL: n = 18 (27) | Blue‐light filtering IOL: none Non‐blue‐light filtering IOL: none | The study authors stated that "in the biomicroscopic examination (at one month postoperatively) the posterior capsule appeared clear in all test eyes." | |
| Blue‐light filtering IOL: n = ? (120); this group combined individuals assigned to 3 different blue‐light filtering IOLs. Non‐blue‐light filtering IOL: n = ? (30) | Blue‐light filtering IOL: none Non‐blue‐light filtering IOL: none | Reported at one month of follow‐up |
IOL: intraocular lens
Funding sources
Thirty‐six of the 51 included studies did not report their source of funding. Four trials (Espindle 2005; Marshall 2005; Mester 2008a; Nolan 2009) were funded by an IOL manufacturer, three trials (Bhattacharjee 2006; Brøndsted 2017; Brøndsted 2015) received philanthropic funding and eight trials (Cuthbertson 2009; Espíndola 2012a; Falkner Radler 2008; Kara Junior 2011; Rocha 2006a; Schmoll 2014; Ueda 2005; Wirtitsch 2009) reported receiving no funding.
Seventeen of the 51 included studies did not report potential conflicts of interest. Thirty‐one studies reported an absence of any conflict of interest (Aose 2006; Bandyopadhyay 2016; Bhattacharjee 2006; Brøndsted 2014; Brøndsted 2015; Caporossi 2007; Caporossi 2009; Cui 2009; Cuthbertson 2009; Espíndola 2012a; Falkner Radler 2008; Hayashi 2006; Kara Júnior 2006; Kara Junior 2011; Kim 2011a; Kim 2011b; Mester 2008a; Monnet 2009; Neumaier‐Ammerer 2010; Pandita 2007; Raj 2005; Rocha 2006b; Rocha 2007; Schmack 2012; Schmidinger 2008; Schmoll 2014; Ueda 2005; Wang 2010; Wirtitsch 2009; Yamaguchi 2009; Yamaguchi 2011). Three studies (Espindle 2005; Marshall 2005; Nolan 2009) declared that one or more of their authors were employees of the IOL manufacturer that funded the trial.
Excluded studies
We excluded 32 studies from the review, after assessing full‐text reports. The reasons for excluding these studies are detailed in the Characteristics of excluded studies table. Sixteen trials (Alexander 2014; Alfonso 2007; Cionni 2006; Feng 2016; Hammond 2010; Hayashi 2009; Lak 2007; Lavric 2014; Munoz 2012; Nagai 2015; Nishi 2013; Rodriguez‐Galietero 2005a; Shpak 2012; Sun 2007; Wen 2012; Wohlfart 2007) adopted a non‐randomised method for allocating interventions. Twelve trials (Chen 2013; Chiosi 2006; Cunha 2010; Gavris 2006; Mayer 2005; Mayer 2006; Mester 2008b; Mester 2008c; Muller 2005; Nakamura 2006; Rodriguez‐Galietero 2005b; Stopyra 2012 did not specify adopting a randomised method to allocate interventions. Four trials (Clarke 1989; Gibson 2008; Kraff 1985; Tognetto 2003) did not meet the criteria for the type(s) of interventions being considered in this review.
As detailed in the Characteristics of studies awaiting classification, we categorised one study (Ji 2013) as 'awaiting classification', pending its translation to identify whether it meets the inclusion criteria for the review. We were unable to source two full‐text reports of studies (Li 2009; Shi 2008).
We categorised one study (Nishi 2015) as ongoing.
Risk of bias in included studies
Figure 2 and Figure 3 summarise the risk of bias assessments for studies included in this review. We have also provided information on risk of bias for individual studies are also provided in the Characteristics of included studies. We did not judge any of the 51 included studies to have a low risk of bias in all seven domains. We considered most studies to have an unclear risk of bias in at least four domains and approximately two‐thirds of the included studies to have a high risk of bias in the domains relating to ‘blinding of participants and personnel (performance bias)’ and ‘blinding of outcome assessment (detection bias)’. The vast majority of studies did not adequately describe their selection bias, ‘random sequence generation’ and ‘allocation concealment’ processes. The three studies that we considered to have the least overall risk of bias (Hayashi 2006; Pandita 2007; Wirtitsch 2009), which we judged as ‘low’ risk in five of the seven domains, did not report quantitative data that could be included in the analysis for any of the prespecified outcomes.

Risk of bias graph: review authors' judgements about each risk of bias item presented as percentages across all included studies.

Risk of bias summary: review authors' judgements about each risk of bias item for each included study.
Allocation
Although all of the included studies were reported to be randomised, only four trials (Brøndsted 2015; Brøndsted 2017; Hayashi 2006; Pandita 2007), clearly detailed the method for generating a random sequence allocation, and we judged them as having a low risk of bias in this domain. Four trials did not describe how the randomisation sequence was generated, but reported an appropriate method to conceal the allocation sequence (Espíndola 2012a; Leibovitch 2006; Raj 2005; Vuori 2006). We considered that none of the 51 studies adequately reported both how the randomisation sequence was generated and how allocation was concealed.
Blinding
With regard to performance bias, eight studies clearly specified masking study participants and study personnel (Bhattacharjee 2006; Espindle 2005; Espíndola 2012a; Hayashi 2006; Pandita 2007; Raj 2005; Schmoll 2014; Wirtitsch 2009). For eight trials (Brøndsted 2017; Kara Junior 2011; Neumaier‐Ammerer 2010; Nolan 2009; Schmack 2012; Schmidinger 2008; Vuori 2006; Wang 2010), the study reports stated that the trials were 'double‐blind' or that participants and personnel were masked, but no details were provided with regard to how this was achieved. We therefore judged the potential risk of performance bias to be unclear in these trials. Leibovitch 2006 reported that participants were masked to the intervention, but there was no mention of whether personnel were masked. We therefore judged the risk of performance bias in this study as unclear. For the other 34 trials, the design was either an ‘open label’ trial (Behrens‐Baumann 2005; Kuchenbecker 2004; Monnet 2009; Walter 2005), 'patient‐masked only' (Cionni 2003; Marshall 2005), or there was no information provided in relation to how masking may have been performed for study participants and personnel (Aose 2006; Bandyopadhyay 2016; Barisic 2007; Brøndsted 2014; Brøndsted 2015; Caporossi 2007; Caporossi 2009; Cristobal 2005; Cui 2009; Cuthbertson 2009; Falkner Radler 2008; Hahsler 2004; Hahsler 2005; Hyunseok 2007; Kara Júnior 2006; Kennis 2004; Kim 2011a; Kim 2011b; Mester 2008a; Rocha 2006a; Rocha 2006b; Rocha 2007; Soriano 2006; Ueda 2005; Ueda 2006; Yamaguchi 2009; Yamaguchi 2011; Yuan 2004); in the absence of reporting, we assumed that masking was not performed, which constituted a high potential risk of bias.
For masking of outcome assessors (detection bias), we judged a low risk of bias for 11 trials (Bhattacharjee 2006; Cuthbertson 2009; Espindle 2005; Espíndola 2012a; Hayashi 2006; Kara Júnior 2006; Pandita 2007; Schmack 2012; Schmidinger 2008; Wang 2010; Wirtitsch 2009). For six trials, the studies were described as 'double‐blind', but they did not provide any details with regard to how this was achieved. We therefore judged the potential risk of bias in this domain to be unclear (Kara Junior 2011; Neumaier‐Ammerer 2010; Nolan 2009; Raj 2005; Schmoll 2014; Vuori 2006). We judged the other 34 included studies to have a high risk of detection bias, due to being either open label, 'patient‐masked' only or providing no information with regard to the masking of the outcome assessors.
Incomplete outcome data
We judged 15 trials judged to have a low risk of attrition bias (Barisic 2007; Brøndsted 2015; Caporossi 2009; Espindle 2005; Falkner Radler 2008; Hayashi 2006; Kara Junior 2011; Leibovitch 2006; Monnet 2009; Neumaier‐Ammerer 2010; Pandita 2007; Raj 2005; Rocha 2007; Schmidinger 2008; Wirtitsch 2009), reporting that either there were no participants lost to follow‐up, or missing data of less than 20% (based upon a 20% attrition threshold, Schulz 2002), and relatively equal follow‐up in both groups with no obvious reason as to why loss to follow‐up should have been related to the outcome. In 32 studies, we judged the influence of attrition bias to be unclear, as follow‐up was either not clearly stated (Aose 2006; Bandyopadhyay 2016; Behrens‐Baumann 2005; Brøndsted 2014; Brøndsted 2017; Cionni 2003; Cui 2009; Hahsler 2004; Hahsler 2005; Hyunseok 2007; Kennis 2004; Kim 2011a; Kuchenbecker 2004; Rocha 2006a; Rocha 2006b; Soriano 2006; Ueda 2005; Ueda 2006; Vuori 2006; Walter 2005; Yuan 2004), participants were potentially excluded due to intraoperative and/or postoperative complications (Bhattacharjee 2006; Caporossi 2007; Cristobal 2005; Cuthbertson 2009; Espíndola 2012a; Mester 2008a; Schmack 2012; Wang 2010; Yamaguchi 2009; Yamaguchi 2011), or where there was relatively similar follow‐up in the intervention groups but less than 80% participant retention overall (Marshall 2005). Four studies were judged as having a high risk of attrition bias (Kara Júnior 2006; Kim 2011b; Nolan 2009; Schmoll 2014) as overall participant follow‐up was less than 80%.
None of the included studies specifically reported undertaking an intention‐to‐treat (ITT) analysis.
Selective reporting
For 48 of the 51 included studies, we could not judge whether there was selective outcome reporting due to lack of access to the study protocol or a clinical trials registry entry, so we classed them as being as unclear risk of reporting bias. We judged two trials as having a low risk of reporting bias, as the outcomes in the manuscript were consistent with the relevant clinical trials registry entry on clinicaltrials.gov (Brøndsted 2015; Wirtitsch 2009). We judged one trial as having a high risk of reporting bias, as results from the "morningness‐eveningness questionnaire", listed as a secondary outcome measure on the clinicaltrials.gov entry, were not reported in the publication (Brøndsted 2017).
Other potential sources of bias
For 36 of the 51 included trials we did not identify any other potential sources of bias (Aose 2006; Bandyopadhyay 2016; Barisic 2007; Behrens‐Baumann 2005; Bhattacharjee 2006; Brøndsted 2014; Brøndsted 2015; Brøndsted 2017; Caporossi 2007; Caporossi 2009; Cionni 2003; Cui 2009; Cuthbertson 2009; Espíndola 2012a; Falkner Radler 2008; Hayashi 2006; Kara Júnior 2006; Kara Junior 2011; Kennis 2004; Kim 2011a; Kim 2011b; Leibovitch 2006; Monnet 2009; Neumaier‐Ammerer 2010; Pandita 2007; Raj 2005; Rocha 2007; Schmack 2012; Schmidinger 2008; Schmoll 2014; Ueda 2006; Wang 2010; Wirtitsch 2009; Yamaguchi 2009; Yamaguchi 2011; Yuan 2004). We judged four studies as having a high risk of other bias as a result of them being funded by industry, by the companies that manufactured the investigated IOLs (Espindle 2005; Marshall 2005; Mester 2008a; Nolan 2009). We judged an unclear risk of other sources of bias for nine studies, where only abstracts were available (Hahsler 2004; Hahsler 2005; Hyunseok 2007; Kuchenbecker 2004; Rocha 2006a; Rocha 2006b; Soriano 2006; Ueda 2005; Walter 2005), as there was insufficient information provided to comprehensively judge this domain. For Vuori 2006, we judged the risk of other sources of bias to be unclear, as the sex distribution of the study groups at baseline was not reported, however the significance of this baseline imbalance was not clear. For Cristobal 2005, we judged the risk of bias in this domain also as unclear as there was no baseline information available for participants.
Effects of interventions
summary of findings Table for the main comparison summarises the effects of the intervention (blue‐light filtering IOL) compared to the comparator (non‐blue‐light filtering IOL) for prespecified outcomes.
Primary outcome: effect on distance best‐corrected visual acuity (BCVA)
A total of six studies (Bhattacharjee 2006; Caporossi 2009; Kennis 2004; Mester 2008a; Schmack 2012; Vuori 2006), reported data relating to the effect on distance BCVA data within six and 18 months of follow‐up; as none of the studies reported the change in distance BCVA from baseline, we utilised data reported at the end of the follow‐up period.
Two trials were single‐eye intervention studies, with no unit‐of‐analysis issue (Caporossi 2009; Vuori 2006). Three trials (Bhattacharjee 2006; Mester 2008a; Schmack 2012), were paired eye studies that undertook inter‐eye comparisons; for these trials, we attempted to contact the study authors via email to obtain the mean and standard deviations of the within‐pair differences in BCVA at follow‐up, however no response was received after more than one month of the email; data from these trials were not included in the meta‐analysis, due to the potential for biased estimates of variance of the outcome. One trial (Kennis 2004), analysed data from 98 eyes of 71 participants without providing further details regarding the analysis approach; we had intended to contact the authors for details relating to the intra‐class correlation coefficient for the within‐person clustering of BCVA, however we could not find any contact details. As a result, we could not include data from this study in the meta‐analysis.
Given the differences in study designs, we undertook a meta‐analysis for the single‐eye trials (Caporossi 2009; Vuori 2006; Analysis 1.1; Figure 4). Pooling the results from these studies, which reported BCVA at 12 months (Caporossi 2009), and six months (Vuori 2006), of follow‐up, the effect on distance BCVA was not statistically significant between blue‐light filtering IOLs and non‐blue‐light filtering IOLs (MD: ‐0.01, 95% CI ‐0.03 to 0.02, P = 0.48; n = 131 eyes, studies: 2); the level of heterogeneity between the two studies was negligible (I2 = 0%). Similar findings were reported separately in the three paired‐eye trials (Bhattacharjee 2006; Mester 2008a; Schmack 2012), and in Kennis 2004, which did not provide specific details regarding the unit of analysis, but appeared to be in Snellen acuity (Analysis 1.2; Figure 5).

Forest plot of comparison 1. Blue‐light filtering IOL vs non‐blue‐light filtering IOL, outcome: 1.1 Change in distance best‐corrected visual acuity (BCVA), between baseline and 12 months (accepting measures for 6‐18 months' follow‐up. If change in distance BCVA not reported, we have utilised data reported at the end of the follow‐up period).
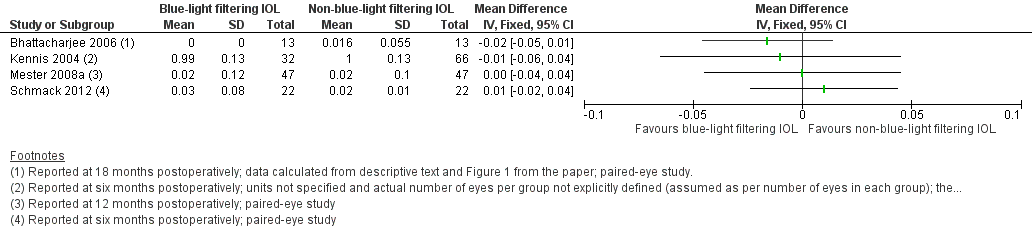
Forest plot of comparison 1. Blue‐light filtering IOL vs non‐blue‐light filtering IOL, outcome: 1.2 Change in distance best‐corrected visual acuity (BCVA) for paired‐eye trials, between baseline and 12 months (accepted measures for 6‐18 months' follow‐up. If change in distance BCVA was not reported, we utilised data reported at the end of the follow‐up period.
We assessed the certainty of the evidence for this outcome measure as 'moderate' using the GRADE approach.
Secondary outcome: effect on contrast sensitivity
Four trials (Falkner Radler 2008; Leibovitch 2006; Mester 2008a; Schmack 2012), reported data relating to the effect on contrast sensitivity, measured within three and nine months of follow‐up, in log Contrast Sensitivity, rather than log Contrast Threshold (%), as we had sought to capture. One study (Falkner Radler 2008), reported the change in contrast sensitivity from baseline, as measured using a Pelli Robson chart. For the remaining studies, (Leibovitch 2006; Mester 2008a; Schmack 2012), data were reported at the end of the follow‐up period. Leibovitch 2006 also used a Pelli Robson chart for measurement. Mester 2008a quantified contrast sensitivity using the Optec 6500 Contrast Sensitivity View‐In Tester (Stereo Optical Company). Schmack 2012 used a CSV‐1000 retroilluminated contrast sensitivity chart (Vector Vision).
Two trials (Falkner Radler 2008; Leibovitch 2006), were single‐eye intervention studies, with no unit‐of‐analysis issue, however we could not pool these data as standardised mean differences, because they represented change scores and final values respectively. As for the distance BCVA outcome, the two other trials (Mester 2008a; Schmack 2012), were paired eye studies that undertook inter‐eye comparisons; for these trials, we attempted to contact the study authors via email to obtain the mean and standard deviations of the within‐pair differences at follow‐up, however no response was received after more than one month of the email; we were therefore not able to include these data in a meta‐analysis.
The data from the single‐eye trials are presented in Analysis 1.3 and Figure 6. Contrast sensitivity was considered as the change from baseline at three months (Falkner Radler 2008), and the study endpoint value at six months of follow‐up (Leibovitch 2006). Similar findings were reported in the results of the two paired‐eye trials (Mester 2008a; Schmack 2012; Analysis 1.4; Figure 7).

Forest plot of comparison 1. Blue‐light filtering IOL vs non‐blue‐light filtering IOL, outcome: 1.2 Effect on photopic contrast sensitivity function, measured in log Contrast Threshold (%) using the mid‐range of the available spatial frequencies (between 6‐12 cycles/deg) at 6 months (with an acceptable follow‐up range of 3‐9 months).
![Forest plot of comparison 1. Blue‐light filtering IOL vs non‐blue‐light filtering IOL, outcome: 1.4 Contrast sensitivity function, measured in log Contrast Sensitivity, using the mid‐range of the available spatial frequencies (between 6‐12 cycles/deg) at 6 months (acceptable follow‐up range of 3‐9 months) [logCT].](/cdsr/doi/10.1002/14651858.CD011977.pub2/media/CDSR/CD011977/image_n/nCD011977-AFig-FIG07.png)
Forest plot of comparison 1. Blue‐light filtering IOL vs non‐blue‐light filtering IOL, outcome: 1.4 Contrast sensitivity function, measured in log Contrast Sensitivity, using the mid‐range of the available spatial frequencies (between 6‐12 cycles/deg) at 6 months (acceptable follow‐up range of 3‐9 months) [logCT].
We assessed the certainty of the evidence for this outcome measure as 'low' using the GRADE approach.
Secondary outcome: effect on colour vision
As previously reported, we were unable to extract any relevant data for the effect on colour discrimination, measured as the proportion of eyes that had a measurable loss of colour discrimination from baseline using the Farnsworth‐Munsell 100‐hue colour test score under phototopic conditions, at six months of follow‐up; thus, we could not perform a meta‐analysis.
Although the potential effect of the intervention on colour vision was considered in several studies, the ability to include this information was limited by the use of subjective‐reported outcomes (Barisic 2007; Cristobal 2005), quantitative data not being provided in the required format (Behrens‐Baumann 2005; Bhattacharjee 2006; Cionni 2003; Kuchenbecker 2004; Neumaier‐Ammerer 2010; Schmack 2012; Vuori 2006; Walter 2005; Wang 2010; Wirtitsch 2009), quantification with an alternative colour vision test (Ishihara (Falkner Radler 2008), and/or Farnsworth D‐15 test (Marshall 2005; Raj 2005)), or examination at a different follow‐up time point (Kara Junior 2011).
While most individual studies that considered effects on colour vision reported no significant difference between IOL interventions, Wang 2010 reported that "performance on rack 3 of the FM 100‐hue test, which contains blue disks, resulted in significantly higher mean total error scores in the yellow (blue‐light filtering) IOL group than in the other 2 IOL (photochromic and clear IOL) groups. The differences were statistically significant under mesopic (30 lux) conditions, under which photochromic IOL and clear IOL remained colorless." These findings are consistent with the findings of Neumaier‐Ammerer 2010, who concluded that "patients with yellow tinted IOLs made statistically significantly more mistakes in the blue range under dim light than patients with clear IOLs."
Secondary outcome: development of late stage age‐related macular degeneration (AMD)
We obtained data on the development of late‐stage AMD from one trial, Kara Junior 2011. In this paired‐eye study, which involved the recruitment of 30 people (60 eyes), of which 25 people (50 eyes) completed the study, there were no cases of late‐stage AMD at the five year follow‐up time point.
We assessed the certainty of the evidence for this outcome measure as 'very low' using the GRADE approach.
Secondary outcome: development of any stage of AMD
Two small trials (Kara Junior 2011; Mester 2008a), both being of a paired‐eye (intra‐individual) design, involving the recruitment of a total of 77 participants, reported data relating to the development of any stage of AMD in 144 eyes. The postoperative follow‐up period for these studies was five years (Kara Junior 2011), and 12 months (Mester 2008a). In both studies, there were no participants (in either the intervention of comparator groups) who developed AMD over the nominated follow‐up periods.
We assessed the certainty of the evidence for this outcome measure as 'very low' using the GRADE approach.
Secondary outcome: development of a pathological change at the macula
Three studies (Falkner Radler 2008; Marshall 2005; Mester 2008a), involving a total of 404 people (748 eyes), reported outcomes relating to the development of pathological changes at the macula, where the unit of analysis was the study eye. In Falkner Radler 2008, a single‐eye trial, one eye developed a cystoid macular oedema (CME) at nine months of follow‐up; this eye had received a blue‐light filtering IOL. Of note, in this study participants had a diagnosis of vitreoretinal pathology, including diabetic vitreous haemorrhage, macular hole, epiretinal membrane, or persisting macula oedema, with coexisting significant cataract. In Marshall 2005, both eyes received the same treatment and were analysed independently; at six months of follow‐up there were six eyes (from a total of 300 eyes) that had developed a pathological change at the macula (CME) in the blue‐light filtering IOL group and three eyes (from a total of 294 eyes) that had developed CME in the non‐blue‐light filtering IOL group. In Mester 2008a, which was a paired‐eye trial, no eyes developed a pathological macula change over the follow‐up period. Pooling the results from these three trials (Analysis 1.5; Figure 8), the proportion of eyes with a finding of a pathological structural change at the macula was not statistically different between blue‐light filtering IOLs and non‐blue‐light filtering IOLs (Peto odds‐ratio: 2.21, 95% CI 0.63 to 7.68, P = 0.21, n = 808 eyes, studies: 3); the level of heterogeneity between the three studies was negligible (I2 = 0%).
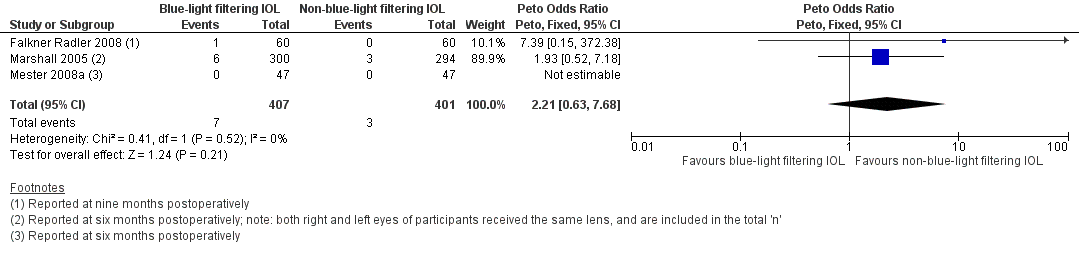
Forest plot of comparison 1. Blue‐light filtering IOL vs non‐blue‐light filtering IOL, outcome: 1.5 Proportion of eyes with a finding of pathological structural change at the macula, detected by clinical observation or optical coherence tomography or retinal fundus photography, at 12 months (acceptable follow‐up range of 6‐18 months).
In addition, in Hayashi 2006, it was reported that "one participant had a clinically significant epiretinal membrane in the macula" and was excluded from the analysis; they did not specify the time point at which this was identified or the intervention group of the participant.
Secondary outcome: effect on distance BCVA, considered as a dichotomous outcome
For the outcome relating to the proportion of participants who lost 15 or more letters of distance BCVA from baseline after six months of follow‐up, two small trials involving a total of 41 people (63 eyes) reported relevant data (Leibovitch 2006; Schmack 2012). In both Leibovitch 2006 (a single‐eye study) and Schmack 2012 (a paired‐eye study), there were no eyes that lost 15 or more letters of distance BCVA from baseline BCVA in either IOL intervention group.
We assessed the certainty of the evidence for this outcome measure as 'very low' using the GRADE approach.
Secondary outcome: effect on reaction time
We obtained data on the effect on reaction time, considered as the proportion of participants who had reduced reaction times, after six months of follow‐up (with an acceptable follow‐up range of three to nine months), from one study (Schmoll 2014). In this single‐eye trial involving a total of 59 eyes, there were no individuals that had a reduction in reaction time in either IOL intervention group at three months of follow‐up. However, this outcome should be viewed in the context that it is unclear from the study methodology whether the trial was sufficiently powered to detect a difference in reaction time between the study groups.
Secondary outcome: level of satisfaction with visual outcome
We obtained data on the level of patient satisfaction with the visual outcome at six months after cataract surgery from one trial (Barisic 2007). In this parallel‐group trial involving 60 participants, the authors reported bilateral IOL implantation of the same IOL type, except for six participants where a blue‐light filtering IOL was implanted in one eye and a non‐blue‐light IOL was implanted in the fellow eye. The study authors reported that: "high patient satisfaction was noticed since 96.67 % of patients would implant AcrySof Natural IOL again. Only one patient would not implant this lens again due to the fact that other people could see yellow »shine« in his eye. None of the patients reported any colour perception disturbances in photopic or mesopic conditions. Out of six patients having AcrySof Natural IOL in one (eye) and standard AcrySof IOL in (the) other eye, three patients were more satisfied with (the) AcrySof Natural IOL, two of them didn't notice any difference and one of them was more satisfied with AcrySof MA60BM IOL. There was no difference in colour perception under photopic and mesopic conditions between the two eyes."
Secondary outcome: proportion of participants with adverse events with a probable causal link with the study interventions after six months of follow‐up
There were no relevant data relating to the proportion of participants with adverse events with a probable casual link with the study interventions after six months of follow‐up. One study, Hayashi 2006, which reported outcomes at three months postoperatively, described that three out of 38 participants with blue‐light filtering IOLs and two out of 36 participants with non‐blue‐light filtering IOLs reported symptoms of glare; no participants in either group reported symptoms of cyanopsia.
Discusión
Se ha indicado que las lentes intraoculares (LIO) que limitan de forma selectiva la transmisión de la luz visible de onda más baja, denominadas LIO con filtro para luz azul, tienen una función potencial al proteger la mácula y posiblemente atenúan el desarrollo o la progresión de la DMS (Beatty 1999; Bernstein 2010). Aunque la justificación para el uso de las lentes oftálmicas con filtro para luz azul es científicamente verosímil, ha habido debate académico con respecto al mérito relativo de estos dispositivos oftálmicos para proteger la salud y la función macular (Downes 2016; Downie 2017; Lee 2012; Mainster 2011; Symes 2012). Hasta la fecha, no ha estado claro si las LIO con filtro para luz azul proporcionan algún posible efecto beneficioso clínico sobre las LIO sin filtro para luz azul con respecto a aspectos como MAVC a distancia, sensibilidad al contraste y desarrollo de patología macular. Además, se han planteado posibles efectos negativos de las LIO con filtro para luz azul sobre parámetros funcionales como la discriminación cromática, el estado de alerta diurno y los tiempos de reacción (como una variable de resultado cognitiva).
Resumen de los resultados principales
El objetivo primario de esta revisión fue evaluar los efectos de las LIO con filtro para luz azul con respecto a proporcionar protección a la salud y la función macular, en pacientes adultos sometidos a cirugía.
Se identificaron 51 ECA elegibles para inclusión, en los que más de 3325 participantes (que incluyeron más de 5000 ojos) se asignaron al azar a recibir una LIO con filtro para luz azul o una LIO sin filtro para luz azul. Según los detalles aportados en los estudios incluidos, el número de participantes en cada ensayo varió de 13 a 300. El período de seguimiento posquirúrgico varió de cuatro semanas a cinco años. En general, los métodos de los estudios no se informaron bien, y se consideró que muchos dominios del "riesgo de sesgo" fueron inciertos. Se consideró que el riesgo de sesgo de realización y de sesgo de detección fue alto en la mayoría de los estudios incluidos. Ningún estudio se consideró con bajo riesgo en todos los dominios de "Riesgo de sesgo".
En todos los resultados de eficacia de los que hubo datos cuantitativos relevantes disponibles, a saber MAVC a distancia como un resultado continuo (seis ensayos), MAVC a distancia como un resultado dicotómico (dos ensayos), sensibilidad al contraste (cuatro ensayos), desarrollo de DMS en estadio tardío (un ensayo), desarrollo de cualquier estadio de DMS (dos ensayos), desarrollo de una alteración anatomopatológica de la mácula (cuatro ensayos), cambio en el tiempo de reacción (un ensayo) y nivel de la satisfacción de los pacientes con el resultado visual (un ensayo), no hubo diferencias significativas entre los resultados informados para las LIO con filtro para luz azul versus las LIO sin filtro para luz azul. Fue posible realizar metanálisis para los resultados relacionados con la MAVC como un resultado continuo (dos ensayos) y la sensibilidad al contraste (dos ensayos); ambos análisis no mostraron diferencias significativas entre los dos tipos de LIO.
Para los resultados de seguridad, complicaciones intraoperatorias y posoperatorias, tampoco hubo diferencias significativas entre los resultados informados para las LIO con filtro para luz azul versus las LIO sin filtro para luz azul.
Por lo tanto, según los mejores datos clínicos actuales disponibles, la evidencia relacionada con si las LIO con filtro para luz azul proporcionan mayor protección a la salud macular que las LIO sin filtro para luz azul no es concluyente.
Compleción y aplicabilidad general de las pruebas
Los ensayos incluidos en esta revisión se realizaron en 17 países. Sin embargo, excepto un ensayo realizado en Australia (Leibovitch 2006), todos los estudios incluidos se realizaron en el hemisferio norte. Los ensayos evaluaron las intervenciones principalmente en poblaciones blancas y asiáticas. Como actualmente no está claro si el riesgo de DMS aumenta por la exposición a la luz solar (Chalam 2011; Sui 2013), tampoco está clara la importancia de que se hayan realizado relativamente menos estudios de investigación en el hemisferio sur con respecto a la generalizabilidad de estos hallazgos.
Los ensayos de esta revisión reclutaron a participantes que requirieron cirugía por catarata debido a opacidades lenticulares relacionadas con la edad. Por lo tanto, no está claro si los resultados informados son generalizables a poblaciones más jóvenes que requieren cirugía por catarata por indicaciones clínicas diferentes (p.ej. postraumatismo, catarata congénita, etc.). Una consideración adicional es que la duración del seguimiento posquirúrgico en la mayoría de los ensayos fue de menos de un año y solo un estudio pequeño (Falkner Radler 2008), que incluyó a 60 participantes, consideró la salud macular a los cinco años de seguimiento posquirúrgico. Por lo tanto, actualmente no hay evidencia suficiente para determinar si las LIO con filtro para luz azul proporcionan efectos beneficiosos a largo plazo para la salud macular o previenen el desarrollo o la progresión de la DMS durante períodos prolongados, o ambos.
Como se resume en la Tabla 1, los estudios incluidos utilizaron varias LIO diferentes. Algunas de estas LIO fueron asféricas y otras adoptaron un diseño esférico; es posible que las diferencias en varios resultados relacionados con la visión (p.ej. MAVC, sensibilidad al contraste) puedan estar relacionadas con el diseño óptico de la LIO, en lugar de con la presencia o ausencia de un cromóforo con filtro para luz azul. Como no hubo un número suficiente de estudios para considerar la influencia potencial del diseño óptico en los análisis, no fue posible evaluar la posible repercusión de este factor sobre los resultados informados.
Debido a diferencias en la técnica de medición, los períodos de seguimiento, la presentación de los datos (p.ej. sin unidad de error, presentación gráfica solamente), o una combinación de algunos o todos estos factores, no fue posible extraer datos relevantes con respecto a si las LIO con filtro para luz azul afectan la percepción del color, la DOPM o el tiempo de reacción (como una variable de resultado cognitiva). Por lo tanto, el efecto de las LIO con filtro para luz azul, en comparación con las LIO sin filtro para luz azul, sobre estos resultados todavía no está claro.
Con respecto al informe de los eventos adversos, incluidas las complicaciones intraoperatorias y posoperatorias, los diseños de estudio de varios ensayos impidieron potencialmente la identificación de todos los casos relevantes. Aproximadamente un tercio de los estudios en la revisión excluyeron a participantes con complicaciones intraoperatorias. Doce estudios excluyeron a participantes con complicaciones posoperatorias, tres ensayos excluyeron a participantes con seguimiento incompleto, un ensayo excluyó a participantes con agudeza visual posoperatoria reducida y un ensayo excluyó a participantes con agudeza visual reducida prevista. Como los datos relacionados con los participantes excluidos no estuvieron disponibles de forma sistemática, es posible que se haya subestimado el número real de eventos adversos (debido a ambas intervenciones).
Las diferencias en el diseño de los ensayos clínicos también fue un reto en el análisis de los datos. Aunque muchos de los estudios incluidos fueron ensayos de ojo único, hubo varios ensayos que adoptaron un diseño de ojo pareado, implante bilateral del mismo LIO cuando la unidad del análisis era el ojo de estudio, o una combinación de implantes bilaterales y unilaterales de LIO donde se utilizó un ojo por individuo para las comparaciones intergrupales y no se proporcionó más información con respecto a la unidad de análisis. En estos casos se intentó establecer contacto con los autores de los estudios para obtener más información que permitiera la inclusión de los datos de estos estudios en metanálisis relevantes, pero no se recibió la información necesaria. Por lo tanto, no fue posible agrupar los datos potencialmente relevantes de estos estudios en los metanálisis.
Calidad de la evidencia
En general, la evidencia relacionada con los resultados predeterminados se consideró de certeza moderada, baja y muy baja. La razón más frecuente para la disminución, que fue relevante para el resultado primario (cambio en la MAVC a distancia considerada como un resultado continuo) y varios resultados secundarios (MAVC a distancia considerada como un resultado dicotómico, sensibilidad al contraste, proporción de ojos que desarrollaron DMS o patología macular, tasa de complicaciones intraoperatorias y tasa de complicaciones posoperatorias), se debió a los riesgos de sesgo (en particular se consideró que la mayoría de los ensayos tuvieron riesgo incierto o alto de sesgo en dominios relacionados con el sesgo de realización y el sesgo de detección).
La certeza de la evidencia se disminuyó (a baja) para el efecto sobre la sensibilidad al contraste, ya que los datos se obtuvieron de dos ensayos pequeños considerados con alto riesgo de sesgo con relación al cegamiento de los evaluadores de resultado e indireccionalidad (no especificaron la frecuencia espacial).
La certeza de la evidencia se disminuyó a muy baja para los efectos sobre la MAVC a distancia (considerada como un resultado dicotómico) y la proporción de ojos que desarrollaron cualquier estadio o estadio tardío de DMS, debido a factores relacionados con la imprecisión (p.ej. riesgo desconocido de sesgo en dominios múltiples).
Sesgos potenciales en el proceso de revisión
Se siguieron los procedimientos metodológicos estándar recomendados por Cochrane para disminuir los sesgos potenciales y no fue posible identificar sesgos potenciales en el proceso de revisión.
Acuerdos y desacuerdos con otros estudios o revisiones
Un metanálisis anterior (Zhu 2012), comparó resultados funcionales (como los relacionados con la MAVC posoperatoria, la sensibilidad al contraste y la visión de color, así como la evaluación de la calidad visual posoperatoria y los eventos adversos visuales) entre las LIO con filtro para luz azul y las LIO con filtro para luz UV. De forma consistente con los resultados de la presente revisión, este estudio que incluyó 15 ECA encontró que no hubo diferencias significativas en la MAVC media posoperatoria, la sensibilidad al contraste ni la visión general de color entre los dos tipos de LIO. Sobre la base del agrupamiento de los datos de tres estudios, que incluyeron ensayos de ojo único como ensayos de ojo pareado, Zhu 2012 informó que la visión de color con las LIO con filtro para luz azul se redujo significativamente en el espectro de luz azul bajo condiciones de luz mesópicas (DME 0,74; IC del 95%: 0,29; 1,18; P = 0,001). Se recomienda que los resultados de este metanálisis se interpreten con cuidado, ya que al parecer los autores no ajustaron para el agrupamiento de los ojos en las personas, lo que potencialmente podría haber dado lugar a estimaciones sesgadas de los errores estándar y, como resultado, a un valor de p sesgado. Se reconoce que en la presente revisión no se consideró el efecto de las LIO que absorben las ondas cortas sobre el rendimiento visual a niveles escotópicos de luz; este resultado se consideró más allá del alcance de la presente revisión, pero es un camino relevante para la evaluación futura de los efectos de estos dispositivos.
Una revisión sistemática reciente (Lawrenson 2017) que consideró los efectos de las lentes de gafas con filtro para luz azul sobre el rendimiento visual, la salud macular y el ciclo sueño‐vigilia, concluyó que se identificó una falta de evidencia de alta calidad para apoyar el uso de lentes de gafas con filtro para luz azul para la población general para mejorar el rendimiento visual o la calidad del sueño, aliviar la fatiga de los ojos o conservar la salud macular. Estos resultados, relacionados con los resultados que midieron el rendimiento visual y la salud macular con lentes de gafas, son consistentes con los resultados informados para las LIO en la presente revisión.
Risk of bias graph: review authors' judgements about each risk of bias item presented as percentages across all included studies.
Risk of bias summary: review authors' judgements about each risk of bias item for each included study.
Forest plot of comparison 1. Blue‐light filtering IOL vs non‐blue‐light filtering IOL, outcome: 1.1 Change in distance best‐corrected visual acuity (BCVA), between baseline and 12 months (accepting measures for 6‐18 months' follow‐up. If change in distance BCVA not reported, we have utilised data reported at the end of the follow‐up period).
Forest plot of comparison 1. Blue‐light filtering IOL vs non‐blue‐light filtering IOL, outcome: 1.2 Change in distance best‐corrected visual acuity (BCVA) for paired‐eye trials, between baseline and 12 months (accepted measures for 6‐18 months' follow‐up. If change in distance BCVA was not reported, we utilised data reported at the end of the follow‐up period.
Forest plot of comparison 1. Blue‐light filtering IOL vs non‐blue‐light filtering IOL, outcome: 1.2 Effect on photopic contrast sensitivity function, measured in log Contrast Threshold (%) using the mid‐range of the available spatial frequencies (between 6‐12 cycles/deg) at 6 months (with an acceptable follow‐up range of 3‐9 months).
Forest plot of comparison 1. Blue‐light filtering IOL vs non‐blue‐light filtering IOL, outcome: 1.4 Contrast sensitivity function, measured in log Contrast Sensitivity, using the mid‐range of the available spatial frequencies (between 6‐12 cycles/deg) at 6 months (acceptable follow‐up range of 3‐9 months) [logCT].
Forest plot of comparison 1. Blue‐light filtering IOL vs non‐blue‐light filtering IOL, outcome: 1.5 Proportion of eyes with a finding of pathological structural change at the macula, detected by clinical observation or optical coherence tomography or retinal fundus photography, at 12 months (acceptable follow‐up range of 6‐18 months).

Comparison 1 Blue‐light filtering IOL vs non‐blue‐light filtering IOL, Outcome 1 Change in distance best‐corrected visual acuity (BCVA) for single‐eye trials, between baseline and 12 months (accepted measures for 6‐18 months' follow‐up). If studies did not report change in distance BCVA, we utilised data reported at the end of the follow‐up period..

Comparison 1 Blue‐light filtering IOL vs non‐blue‐light filtering IOL, Outcome 2 Change in distance best‐corrected visual acuity (BCVA) for paired‐eye trials, between baseline and 12 months (accepted measures for 6‐18 months follow‐up. If change in distance BCVA was not reported, we utilised data reported at the end of the follow‐up period..

Comparison 1 Blue‐light filtering IOL vs non‐blue‐light filtering IOL, Outcome 3 Contrast sensitivity, measured in log Contrast Sensitivity at 6 months (acceptable follow‐up range of 3‐9 months).
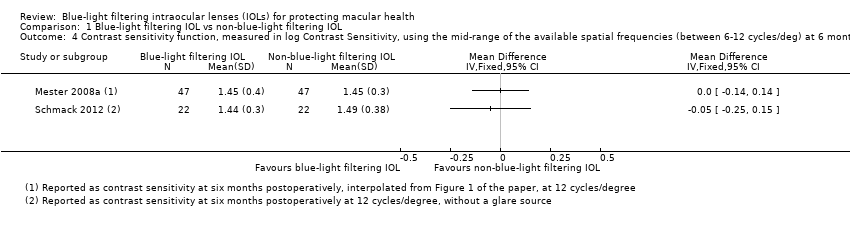
Comparison 1 Blue‐light filtering IOL vs non‐blue‐light filtering IOL, Outcome 4 Contrast sensitivity function, measured in log Contrast Sensitivity, using the mid‐range of the available spatial frequencies (between 6‐12 cycles/deg) at 6 months (acceptable follow‐up range of 3‐9 months; logCT).

Comparison 1 Blue‐light filtering IOL vs non‐blue‐light filtering IOL, Outcome 5 Proportion of eyes with a finding of pathological structural change at the macula, detected by clinical observation or OCT or retinal fundus photography, at 12 months (acceptable follow‐up range of 6‐18 months).
| Blue‐light filtering IOL compared to non‐blue‐light filtering IOL for protecting macular health | ||||||
| Patient or population: adults undergoing cataract surgery with IOL implantation | ||||||
| Outcomes | Anticipated absolute effects* (95% CI) | Relative effect | № of participants | Certainty of the evidence | Comments | |
| Risk with non‐blue‐light filtering IOL | Risk with blue‐light filtering IOL | |||||
| Change in distance BCVA, between baseline and 12 months | Mean change in distance BCVA between baseline and 12 months was 0 logMAR | MD 0.01 logMAR lower | ‐ | 131 | ⊕⊕⊕⊝ | A lower BCVA (in logMAR) indicates a higher level of visual acuity. Studies in this analysis reported data at the end of the follow‐up period rather than change from baseline. |
| Distance BCVA, considered as a dichotomous outcome (being the proportion of eyes that experienced loss of 15 or more letters from baseline BCVA), at six months | See comments | Not estimable | 63 | ⊕⊝⊝⊝ | There were no eyes, in either intervention group that had a loss of 15 or more letters from baseline BCVA. | |
| Contrast sensitivity function, measured in log Contrast Sensitivity at six months | ‐ | ‐ | ‐ | ‐ | ‐ | No relevant combinable data available for this outcome |
| Colour discrimination, measured as the proportion of eyes that had a measurable loss from baseline using Farnsworth‐Munsell 100‐hue colour test score under photopic conditions at six months | ‐ | ‐ | ‐ | ‐ | ‐ | No relevant combinable data available for this outcome |
| Proportion of participants with adverse events with a probable causal link with the study interventions at six months follow‐up | ‐ | ‐ | ‐ | ‐ | ‐ | No relevant combinable data available for this outcome |
| Proportion of eyes that developed late‐stage AMD, being CNV and/or GA, at three years of follow‐up | See comments | Not estimable | 50 | ⊕⊝⊝⊝ | In the 1 trial (Kara Junior 2011) there were no eyes, in either intervention group that developed late‐stage AMD at five years of follow‐up. | |
| Proportion of eyes that developed any stage of AMD at 12 months | See comments | Not estimable | 144 | ⊕⊝⊝⊝ | In both studies, there were no eyes, in either intervention group that developed any stage of AMD over the nominated follow‐up period. | |
| *The risk in the intervention group (and its 95% confidence interval) is based on the assumed risk in the comparison group and the relative effect of the intervention (and its 95% CI). | ||||||
| GRADE Working Group grades of evidence | ||||||
| aDowngraded for risk of bias (‐1). Data derive from two relatively small studies, with one (Caporossi 2009) judged to have a high risk of bias in both masking domains, and the other (Vuori 2006) having an unclear risk of bias in most domains. | ||||||
| Study | Blue‐light filtering IOL name(s)a (Manufacturer) | Non‐blue‐light filtering IOL name(s)a |
| YA‐60BB (Hoya) | AcrySof SA60AT (Alcon) or AcrySof MA60BM (Alcon) or VA‐60BB (Hoya) | |
| AcrySof Natural SN60AT (Alcon) or PC4406 (Optech) | AcrySof SA60AT (Alcon) | |
| AcrySof Natural (Alcon) | AcrySof MA60BM (Alcon) | |
| YA‐60BB (Hoya) | VA‐60BB (Hoya) | |
| AcrySof Natural SN60AT (Alcon) | AcrySof SA60AT (Alcon) | |
| Not reported | Not reported | |
| AcrySof IQ SN60WF (Alcon) | AMO ZCBOO (Abbott Medical Optics) | |
| AcrySof IQ SN60WF (Alcon) | AMO ZCBOO (Abbott Medical Optics) | |
| AcrySof Natural SN60AT (Alcon) or AcrySof IQ SN60WF (Alcon) | Sensar AR40e (Abbott Medical Optics) or Tecnis Z9000 (Abbott Medical Optics) or Sofport L161AO (Bausch & Lomb) | |
| AcrySof Natural SN60AT (Alcon) or AcrySof IQ SN60WF (Alcon) | Sensar AR40e (Abbott Medical Optics) or Tecnis Z9000 (Abbott Medical Optics) | |
| AcrySof SB30AL (Alcon) | AcrySof SA30AL (Alcon) | |
| AcrySof Natural SN60AT (Alcon) | AcrySof SA60AT (Alcon) | |
| AcrySof Natural SN60AT (Alcon) or AcrySof IQ SN60WF (Alcon) | Tecnis Z9001 (Abbott Medical Optics) | |
| AcrySof Natural SN60AT (Alcon) or AcrySof IQ SN60WF (Alcon) | Tecnis Z9000 (Abbott Medical Optics) or Cee On Edge (Abbott Medical Optics) or Akreos AO (Bausch & Lomb) or Akreos Adapt (Bausch & Lomb) | |
| AcrySof Natural (Alcon) | AcrySof single‐piece (Alcon) | |
| AcrySof Natural SN60AT (Alcon) | Akreos Fit (Bausch & Lomb) or Akreos AO (Bausch & Lomb) or AcrySof SA60AT as described in the methods (but appears to be inadvertently described as the MA60AC in the reporting of the results) | |
| AcrySof Natural (Alcon) or AF‐1 UY (Hoya) | AcrySof single‐piece (Alcon) or AF‐1 UV (Hoya) | |
| SN60 (Alcon) | SA60 (Alcon) | |
| YA (Hoya) or SN60 (Alcon) | VA (Hoya) or SA60 (Alcon) | |
| YA‐60BB (Hoya) | VA‐60BB (Hoya) | |
| AcrySof Natural SN60AT (Alcon) | Tecnis ZA9003 (Abbott Medical Optics) | |
| AcrySof Natural SN60AT (Alcon) | AcrySof SA60AT (Alcon) | |
| AcrySof Natural SN60AT (Alcon) | AcrySof MA30AC (Alcon) | |
| AcrySof Natural SN60AT (Alcon) | Tecnis Z9000 (Pfizer) or Opti‐Edge (Abbott Medical Optics) | |
| AcrySof IQ SN60WF (Alcon) | OII Biovue3 (BioVue) or YA60BBR (Hoya) | |
| AcrySof IQ SN60WF (Alcon) | Tecnis Z9003 (Abbott Medical Optics) | |
| YA‐60BB (Hoya) | VA‐60BB (Hoya) | |
| AcrySof Natural SN60AT (Alcon) | AcrySof single‐piece SA60AT (Alcon) | |
| AcrySof Natural IOL SB30AL (Alcon) (the current marketed version of this lens is the SN60AT) | AcrySof SA30AL (Alcon) | |
| AF‐1 UY (Hoya) | AF‐1 UV (Hoya) | |
| AcrySof SN60AT (Alcon) | AcrySof MA60AC (Alcon) or AcrySof SA60AT (Alcon) | |
| AF1 UY (Hoya) or AcrySof SN60AT (Alcon) | AF1 UV (Hoya) or AcrySof SA60AT (Alcon) | |
| AcrySof Natural SN60AT (Alcon) | AcrySof SA60AT (Alcon) | |
| AcrySof SN60AT (Alcon) or AcrySof SN60WF (Alcon) | AcrySof SA60AT (Alcon) | |
| AcrySof Natural SN60AT (Alcon) | AcrySof SA60AT (Alcon) | |
| AcrySof IQ (Alcon) or AcrySof Natural (Alcon) | Sensar (Abbott Medical Optics) | |
| AcrySof IQ (Alcon) or AcrySof Natural (Alcon) | Sensar (Abbott Medical Optics) | |
| AcrySof IQ (Alcon) or AcrySof SN60AT (Alcon) | Sensar AR40 (Allergan) | |
| Oculaid PC 440Y Orange Series (Ophtec BV) | Oculaid PC 430Y Elite Series (Ophtec BV) | |
| AF‐1 UY (Hoya) | AF‐1 UV (Hoya) | |
| AcrySof SN60WF (Alcon) | Tecnis ZCB (Abbott Medical Optics) | |
| AcrySof SN60AT (Alcon) or AcrySof SN60WF (Alcon) | Sensar (Abbott Medical Optics) | |
| ENV‐13 (Menicon) | ES‐13 (Menicon) | |
| YA‐60BB (Hoya) | VA‐60BB (Hoya) | |
| AcrySof Natural SN60AT (Alcon) | AcrySof SA60AT (Alcon) | |
| AF‐1 YA‐60BB (Hoya) | AF‐1 UV‐60BB (Hoya) | |
| AY‐1 UY (Hoya) or Arium Matrix Model 4000 (Medennium) | MC611MI (HumanOptics) | |
| YA‐60BB (Hoya) | VA‐60BB (Hoya) | |
| AcrySof SN60WF (Alcon) or AcrySof SN60AT (Alcon) or Py60AD (Hoya) | Tecnis Z9003 (Abbott Medical Optics) | |
| AcrySof SN60WF (Alcon) or AcrySof SN60AT (Alcon) or Py60AD (Hoya) | Tecnis Z9003 (Abbott Medical Optics) | |
| Not reported (Hoya) | Not reported (not reported) | |
| aDetails of the interventions are provided as per the details available in the included studies. | ||
| Study | Study population: number of participants (number of eyes) | Number of intraoperative complication(s) | Details of intraoperative complication(s) |
| Blue‐light filtering IOLs: n = 65 (65); this group combined individuals assigned to 2 different blue‐light filtering IOLs Non‐blue‐light filtering IOL: n = 33 (33) | Blue‐light filtering IOL: none Non‐blue‐light filtering IOL: none | Not applicable | |
| Blue‐light filtering IOL: n = 30 (60) Non‐blue‐light filtering IOL: n = 30 (60) | Blue‐light filtering IOL: none Non‐blue‐light filtering IOL: none | Not applicable | |
| Blue‐light filtering IOL: n = 50 (100); this group combined individuals assigned to 2 different blue‐light filtering IOLs Non‐blue‐light filtering IOL: n = 75 (150); this group combined individuals assigned to 3 different non‐blue‐light filtering IOLs | Blue‐light filtering IOL: none Non‐blue‐light filtering IOL: none | Not applicable | |
| Blue‐light filtering IOL: n = 39 (41) Non‐blue‐light filtering IOL: n = 18 (20) | Blue‐light filtering IOL: none Non‐blue‐light filtering IOL: none | Not applicable | |
| Overall: n = 31 (31) | Not reported | One participant developed endophthalmitis and was removed from the trial, being replaced (after re‐randomisation) by another individual. There was one anterior capsular rim tear and one posterior capsule tear without vitreous loss. No details were provided in relation to which group(s) the adverse events occurred in. | |
| Blue‐light filtering IOL: n = 27 (27) Non‐blue‐light filtering IOL: n = 52 (77) | Blue‐light filtering IOL: none Non‐blue‐light filtering IOL: none | Not applicable | |
| Blue‐light filtering IOL: n = 30 (30) Non‐blue‐light filtering IOL: n = 30 (30) | Blue‐light filtering IOL: none Non‐blue‐light filtering IOL: none | Not applicable | |
| Blue‐light filtering IOL: n = ? (42) Non‐blue‐light filtering IOL: n = ? (26) | Blue‐light filtering IOL: none Non‐blue‐light filtering IOL: none | Not applicable | |
| Blue‐light filtering IOL: n = 23 (23) Non‐blue‐light filtering IOL: n = 16 (16) | Blue‐light filtering IOL: none Non‐blue‐light filtering IOL: none | Not applicable | |
| Blue‐light filtering IOL: n = 9 (9) Non‐blue‐light filtering IOL: n = 10 (10) | Blue‐light filtering IOL: none Non‐blue‐light filtering IOL: none | Not applicable | |
| Blue‐light filtering IOL: n = 150 (300) Non‐blue‐light filtering IOL: n = 147 (294) | Blue‐light filtering IOL: n = 1 Non‐blue‐light filtering IOL: none | There was one case of lens dislocation during surgery in the blue‐light filtering IOL group, in a case in which a posterior capsule rupture had occurred during cataract extraction. | |
| Blue‐light filtering IOL: n = 19 (19) Non‐blue‐light filtering IOL: n = 40 (40); this group combined individuals assigned to 2 different non‐blue‐light filtering IOLs. | Blue‐light filtering IOL: n = 2 Non‐blue‐light filtering IOL: none | In the blue‐light filtering IOL lens group "two IOLs were placed with 1 haptic in the capsular bag and 1 haptic outside the capsular bag; these 2 patients were also excluded from the final statistical analysis." | |
| Blue‐light filtering IOL: n = 73 (73); this group combined individuals assigned to 2 different blue‐light filtering IOLs. Non‐blue‐light filtering IOL: n = 36 (36) | Blue‐light filtering IOL: none Non‐blue‐light filtering IOL: none | Not applicable | |
| Blue‐light filtering IOL: n = 30 (30) Non‐blue‐light filtering IOL: n = 30 (30) | Blue‐light filtering IOL: none Non‐blue‐light filtering IOL: none | Not applicable | |
| Blue‐light filtering IOL: n = 31 (31) Non‐blue‐light filtering IOL: n = 31 (31) | Blue‐light filtering IOL: none Non‐blue‐light filtering IOL: none | Not applicable | |
| Blue‐light filtering IOL: n = 19 (25) Non‐blue‐light filtering IOL: n = 18 (27) | Blue‐light filtering IOL: none Non‐blue‐light filtering IOL: none | Not applicable | |
| IOL: intraocular lens | |||
| Study | Study population: number of participants (number of eyes) | Number of postoperative complication(s) | Details of postoperative complication(s) |
| Blue‐light filtering IOLs: n = 65 (65); this group combined individuals assigned to 2 different blue‐light filtering IOLs. Non‐blue‐light filtering IOL: n = 33 (33) | Blue‐light filtering IOL: none Non‐blue‐light filtering IOL: none | None at four weeks of follow‐up | |
| Blue‐light filtering IOL: n = 30 (60) Non‐blue‐light filtering IOL: n = 30 (60) | Blue‐light filtering IOL: n = 3 eyes Non‐blue‐light filtering IOL: n = 4 eyes | Although the study authors reported that "there were no postoperative complications", n = 3 eyes from the blue‐light filtering IOL group and n = 4 eyes from the non‐blue‐light filtering IOL group required Nd:YAG capsulotomy at six months of follow‐up. | |
| Blue‐light filtering IOL: n = 38 (38) Non‐blue‐light filtering IOL: n = 35 (35) | Blue‐light filtering IOL: none Non‐blue‐light filtering IOL: none | None at six months of follow‐up. | |
| Blue‐light filtering IOL: n = 50 (100); this group combined individuals assigned to 2 different blue‐light filtering IOLs. Non‐blue‐light filtering IOL: n = 75 (150); this group combined individuals assigned to three different non‐blue‐light filtering IOLs. | Blue‐light filtering IOL: none Non‐blue‐light filtering IOL: none | None at two months of follow‐up | |
| Blue‐light filtering IOL: n = 50 (100); this group combined individuals assigned to 2 different blue‐light filtering IOLs Non‐blue‐light filtering IOL: n = 50 (100); this group combined individuals assigned to 2 different non‐blue‐light filtering IOLs | Blue‐light filtering IOL: n = 1 for Nd:YAG capsulotomy Non‐blue‐light filtering IOL: n = 1 for Nd:YAG capsulotomy | This study reports the two‐year follow‐up data for a subset of participants from Caporossi 2007. The study authors reported that "patients who underwent a capsulotomy before two‐year follow‐up (two patients) were excluded as it was not possible to perform aberrometric analysis. Two Nd:YAG laser capsulotomies were required in two patients who had AcrySof SN60AT IOL (blue‐light filtering IOL) and Tecnis Z9000 IOL (non‐blue‐light filtering IOL) implantation." | |
| Blue‐light filtering IOL: n = 39 (41); this group combined individuals assigned to 2 different blue‐light filtering IOLs. Non‐blue‐light filtering IOL: n = 18 (20) | Blue‐light filtering IOL: none Non‐blue‐light filtering IOL: none | None at two months of follow‐up | |
| Blue‐light filtering IOL: n = 27 (27) Non‐blue‐light filtering IOL: n = 52 (77) | Blue‐light filtering IOL: none for glaucoma or Nd:YAG capsulotomy Non‐blue‐light filtering IOL: none for glaucoma or Nd:YAG capsulotomy | The study authors reported that "at two years after surgery, all lenses were well centered and there was no evidence of posterior capsule opacity or glaucoma." | |
| Blue‐light filtering IOL: n = 30 (30) Non‐blue‐light filtering IOL: n = 30 (30) | Blue‐light filtering IOL: n = 3 eyes Non‐blue‐light filtering IOL: n = 1 eye | Blue‐light filtering IOL: n = 1 postoperative iris capture, n = 1 spontaneously reabsorbed vitreous haemorrhage, n = 1 cystoid macular oedema at nine months after surgery Non‐blue‐light filtering IOL: n = 1 postoperative iris capture | |
| Blue‐light filtering IOL: n = 23 (23) Non‐blue‐light filtering IOL: n = 16 (16) | Blue‐light filtering IOL: none Non‐blue‐light filtering IOL: none | None at eight weeks of follow‐up | |
| Blue‐light filtering IOL: n = 38 (38) Non‐blue‐light filtering IOL: n = 36 (36) (In both groups, data were obtained from both eyes and averaged) | Glare symptoms Blue‐light filtering IOL: n = 3 participants Non‐blue‐light filtering IOL: n = 2 participants Cyanopsia Blue‐light filtering IOL: none Non‐blue‐light filtering IOL: none | Postoperative complications (as measured by participant report of glare symptoms and cyanopsia) at three months after surgery One participant was reported to have a clinically significant epiretinal membrane in the macula (it is unclear which group the participant belonged to) | |
| Blue‐light filtering IOL: n = 30 (30) Non‐blue‐light filtering IOL: n = 30 (30) | "Three patients required neodymium:YAG laser capsulotomy for posterior capsule opacification," however group allocations were not specified. | Three participants (although this was not distinguished by the IOL intervention) at five years of follow‐up | |
| Blue‐light filtering IOL: n = 23 (23) Non‐blue‐light filtering IOL: n = 16 (16) | Blue‐light filtering IOL: none Non‐blue‐light filtering IOL: none | None at eight weeks of follow‐up | |
| Blue‐light filtering IOL: n = 9 (9) Non‐blue‐light filtering IOL: n = 10 (10) | Blue‐light filtering IOL: none Non‐blue‐light filtering IOL: none | None at six months of follow‐up | |
| Blue‐light filtering IOL: n = 150 (300) Non‐blue‐light filtering IOL: n = 147 (294) | Blue‐light filtering IOL: n = 12 Non‐blue‐light filtering IOL: n = 6 | At six months of follow‐up, in the blue‐light filtering IOL group, six eyes developed cystoid macula oedema and six eyes required secondary surgical intervention; none of the occurrences were considered IOL‐related. At six months of follow‐up, in the non‐blue‐light filtering IOL group, three eyes developed cystoid macula oedema and three eyes required secondary surgical intervention; none of the occurrences were considered IOL‐related. The study authors stated that "no Nd:YAG capsulotomy was performed in the first‐eye subgroup in either the test or control groups throughout the study period." | |
| Blue‐light filtering IOL: n = 19 (19) Non‐blue‐light filtering IOL: n = 40 (40); this group combined individuals assigned to 2 different non‐blue‐light filtering IOLs. | Blue‐light filtering IOL: none Non‐blue‐light filtering IOL: none | None at three months of follow‐up | |
| Blue‐light filtering IOL: n = 31 (31) Non‐blue‐light filtering IOL: n = 31 (31) | Blue‐light filtering IOL: none Non‐blue‐light filtering IOL: none | None at three months of follow‐up | |
| Blue‐light filtering IOL: n = 80 (80); this group combined individuals assigned to 2 different blue‐light filtering IOLs. Non‐blue‐light filtering IOL: n = 38 (38) | Blue‐light filtering IOL: none Non‐blue‐light filtering IOL: none | None at 3 months of follow‐up | |
| Blue‐light filtering IOL: n = 19 (25) Non‐blue‐light filtering IOL: n = 18 (27) | Blue‐light filtering IOL: none Non‐blue‐light filtering IOL: none | The study authors stated that "in the biomicroscopic examination (at one month postoperatively) the posterior capsule appeared clear in all test eyes." | |
| Blue‐light filtering IOL: n = ? (120); this group combined individuals assigned to 3 different blue‐light filtering IOLs. Non‐blue‐light filtering IOL: n = ? (30) | Blue‐light filtering IOL: none Non‐blue‐light filtering IOL: none | Reported at one month of follow‐up | |
| IOL: intraocular lens | |||
| Outcome or subgroup title | No. of studies | No. of participants | Statistical method | Effect size |
| 1 Change in distance best‐corrected visual acuity (BCVA) for single‐eye trials, between baseline and 12 months (accepted measures for 6‐18 months' follow‐up). If studies did not report change in distance BCVA, we utilised data reported at the end of the follow‐up period. Show forest plot | 2 | 131 | Mean Difference (IV, Fixed, 95% CI) | ‐0.01 [‐0.03, 0.02] |
| 2 Change in distance best‐corrected visual acuity (BCVA) for paired‐eye trials, between baseline and 12 months (accepted measures for 6‐18 months follow‐up. If change in distance BCVA was not reported, we utilised data reported at the end of the follow‐up period. Show forest plot | 4 | Mean Difference (IV, Fixed, 95% CI) | Totals not selected | |
| 3 Contrast sensitivity, measured in log Contrast Sensitivity at 6 months (acceptable follow‐up range of 3‐9 months) Show forest plot | 2 | 79 | Mean Difference (IV, Fixed, 95% CI) | 0.00 [‐0.14, 0.14] |
| 4 Contrast sensitivity function, measured in log Contrast Sensitivity, using the mid‐range of the available spatial frequencies (between 6‐12 cycles/deg) at 6 months (acceptable follow‐up range of 3‐9 months; logCT) Show forest plot | 2 | Mean Difference (IV, Fixed, 95% CI) | Totals not selected | |
| 5 Proportion of eyes with a finding of pathological structural change at the macula, detected by clinical observation or OCT or retinal fundus photography, at 12 months (acceptable follow‐up range of 6‐18 months) Show forest plot | 3 | 808 | Peto Odds Ratio (Peto, Fixed, 95% CI) | 2.21 [0.63, 7.68] |