Aumento de la dosis del antipsicótico versus cambio de antipsicótico para la falta de respuesta en la esquizofrenia
Resumen
Antecedentes
Muchos pacientes con esquizofrenia no responden al fármaco antipsicótico prescrito inicialmente. En dichos casos, una estrategia de tratamiento podría ser el aumento de la dosis del antipsicótico; y otra estrategia podría ser el cambio a un fármaco antipsicótico diferente.
Objetivos
Examinar la eficacia del aumento de la dosis del antipsicótico versus el cambio de fármaco antipsicótico en el tratamiento de los pacientes con esquizofrenia refractaria.
Métodos de búsqueda
Se hicieron búsquedas en el registro de ensayos del Grupo Cochrane de Esquizofrenia (Cochrane Schizophrenia Group Trials Register) (10 junio 2014, 6 octubre 2015 y 30 marzo 2017). Se examinaron las referencias de todos los estudios incluidos para obtener ensayos adicionales.
Criterios de selección
Todos los ensayos controlados aleatorios (ECA) relevantes que compararon el aumento de la dosis del antipsicótico versus cambio a un fármaco antipsicótico diferente en pacientes con esquizofrenia que no han respondido al tratamiento antipsicótico inicial.
Obtención y análisis de los datos
Al menos dos autores de la revisión extrajeron los datos de forma independiente. Los datos dicotómicos se analizaron mediante los riesgos relativos (RR) y sus intervalos de confianza (IC) del 95%. Los datos continuos se analizaron mediante las diferencias de medias (DM) y sus IC del 95%. Se evaluó el riesgo de sesgo de los estudios incluidos y se utilizó GRADE para crear la tabla "Resumen de los hallazgos".
Resultados principales
Se incluyó un ECA con datos relevantes sobre 29 participantes en esta revisión. El ensayo tuvo un diseño paralelo y fue doble ciego, aunque no se describieron los procedimientos de cegamiento. El ensayo incluyó a pacientes que no respondían al tratamiento con flufenazina 20 mg/día administrada durante cuatro semanas. Los participantes se asignaron al azar a continuar el tratamiento con flufenazina 20 mg/día, a aumentar la dosis a flufenazina 80 mg/día o a cambiar al haloperidol 20 mg/día durante cuatro semanas adicionales. Solamente se informaron datos de 47 de los 58 participantes asignados al azar inicialmente. El ensayo se publicó en 1993. El hecho de que sólo se incluyera un ECA con un tamaño de la muestra pequeño (N = 29) en el análisis limita la calidad de la evidencia. En términos generales, no se encontraron diferencias claras entre los grupos en cuanto a los tres resultados disponibles: estado global (número de participantes con una respuesta clínicamente relevante) (RR 1,63; IC del 95%: 0,17 a 15,99; evidencia de muy baja calidad); estado mental general (puntuación final, BPRS total) (DM 2,00; IC del 95%: ‐4,20 a 8,20; evidencia de muy baja calidad); y síntomas negativos (puntuación final, SANS) (DM 3,40; IC del 95%: ‐12,56 a 19,36). No se informaron datos con respecto al abandono temprano del estudio, los efectos adversos, el tiempo en el hospital, la calidad de vida, la satisfacción con la atención ni el funcionamiento.
Conclusiones de los autores
Hay evidencia muy limitada y no es posible establecer conclusiones claras. Hay una necesidad urgente de ensayos adicionales para determinar la estrategia de tratamiento óptima para los pacientes con esquizofrenia que no responden al tratamiento antipsicótico inicial.
PICOs
Resumen en términos sencillos
Aumento de la dosis del antipsicótico versus cambio a un antipsicótico diferente para los pacientes con esquizofrenia que no responden al tratamiento inicial
Pregunta de la revisión
¿Si un paciente con esquizofrenia no responde inicialmente a un antipsicótico, el aumento de la dosis de dicho antipsicótico es más efectivo y más seguro, en comparación con el cambio a otro antipsicótico?
Antecedentes
Muchos pacientes con esquizofrenia, una enfermedad mental grave, no responden completamente (es decir aún presentan síntomas como delirios y alucinaciones) con una dosis estándar del fármaco antipsicótico prescrito inicialmente. En dichos casos, los médicos pueden considerar la posibilidad de aumentar la dosis del antipsicótico más allá de los umbrales regulares o cambiar a un fármaco antipsicótico diferente para mejorar la eficacia del antipsicótico. La evidencia sobre la estrategia de tratamiento óptima es escasa.
Búsqueda de la evidencia
El especialista en información del Grupo Cochrane de Esquizofrenia realizó una búsqueda electrónica (hasta el 30 de marzo de 2017) para obtener ensayos que hubieran asignado al azar a pacientes con esquizofrenia que no respondían al tratamiento antipsicótico inicial a recibir un aumento de la dosis del antipsicótico o a un cambio a un fármaco antipsicótico diferente. Los autores de la revisión encontraron y verificaron 902 registros.
Evidencia encontrada
Solo un ensayo cumplió con los requisitos de la revisión y proporcionó datos utilizables. Se informaron datos del número de participantes que respondieron al tratamiento, del estado mental general de los participantes al final del ensayo y de la presencia de síntomas negativos al final del ensayo. No hubo datos disponibles para ningún otro resultado. No se observaron diferencias claras entre el aumento de la dosis del fármaco antipsicótico y el cambio a un antipsicótico diferente. La evidencia disponible fue extremadamente limitada y de muy baja calidad.
Conclusiones
Los resultados de la presente revisión indican que no existe evidencia de buena calidad para ayudar a los médicos a decidir entre el aumento de la dosis del antipsicótico o el cambio a un fármaco antipsicótico diferente en los pacientes que no responden al tratamiento antipsicótico inicial. Por lo tanto, no se pueden extraer conclusiones claras. Se necesitan ensayos más grandes y bien diseñados.
Conclusiones de los autores
Summary of findings
| Increasing the antipsychotic dose compared to switching the antipsychotic drug for non responsein schizophrenia | ||||||
| Patient or population: patients with non response in schizophrenia | ||||||
| Outcomes | Illustrative comparative risks* (95% CI) | Relative effect | No of Participants | Quality of the evidence | Comments | |
| Assumed risk | Corresponding risk | |||||
| Switching the atipsychotic drug | Increasing the antipsychotic dose | |||||
| Global state: Clinically relevant response – as defined by trial | 77 per 1000 | 125 per 1000 | RR 1.63 | 29 | ⊕⊝⊝⊝ | |
| Leaving the study early: Tolerability ‒leaving the study early due to side effects | See comment | See comment | Not estimable | 0 | See comment | No studies reported on this outcome. |
| Leaving the study early: Acceptability ‒leaving the study early due to any reason | See comment | See comment | Not estimable | 0 | See comment | No studies reported on this outcome, |
| General mental state ‒BPRS total score at endpoint* | The mean general mental state ‒ BPRS total score at endpoint in the control groups was | The mean general mental state ‐ BPRS total score at endpoint in the intervention groups was | 29 | ⊕⊝⊝⊝ | Data for prespecified outcome: Clinically important change were not reported. | |
| Adverse effects ‒at least one adverse effect | See comment | See comment | Not estimable | 0 | See comment | No studies reported on this outcome. |
| Service use ‒time in hospital | See comment | See comment | Not estimable | 0 | See comment | No studies reported on this outcome. |
| Quality of life ‒average change in quality of life | See comment | See comment | Not estimable | 0 | See comment | No studies reported on this outcome. |
| *The basis for the assumed risk (e.g. the median control group risk across studies) is provided in footnotes. The corresponding risk (and its 95% confidence interval) is based on the assumed risk in the comparison group and the relative effect of the intervention (and its 95% CI). | ||||||
| GRADE Working Group grades of evidence | ||||||
| 1 Imprecision: total (cumulative) sample size was just 29 participants and 95% confidence interval around the estimate of effect included no effect and appreciable benefit and appreciable harm; thus, very serious imprecision was present. | ||||||
Antecedentes
Un considerable número de pacientes con esquizofrenia no responde al primer fármaco antipsicótico que reciben administrado a una dosis que los médicos consideran adecuada (Barnes 2003; Lehmann 2004). En cambio, requieren pruebas múltiples con diferentes fármacos antes de lograr una respuesta satisfactoria. En dichas situaciones se utilizan diversas estrategias como el agregado de otros antipsicóticos, el agregado de otros agentes psicotrópicos (p.ej. estabilizadores del estado de ánimo), el aumento de la dosis o el cambio a otro antipsicótico. Sin embargo, no se conoce cuál es la mejor estrategia. El cambio de antipsicótico se aplica con frecuencia en la práctica clínica aunque hay muchas preguntas abiertas. ¿El cambio es efectivo, para qué fármacos y después de cuánto tiempo? Las guías originalmente recomendaron esperar de cuatro a ocho semanas antes del cambio a otro fármaco, argumentando que la eficacia completa de un fármaco determinado se logra después de un período de tratamiento más prolongado (Lehmann 2004; Falkai 2005). Sin embargo, datos recientes indican que los pacientes que no responden al tratamiento ya se pueden detectar a las dos semanas después de iniciar el tratamiento (Agid 2003; Samara 2015). Otra posibilidad general es aumentar la dosis del antipsicótico actualmente prescrito. Este enfoque se basa en la premisa de que el aumento de la dosis de un fármaco antipsicótico daría lugar a una mejoría en la eficacia del tratamiento (Kinon 2004). Esta revisión procuró examinar qué estrategia (aumento de la dosis del antipsicótico o cambio del fármaco antipsicótico) es más promisoria en los pacientes que no han respondido a un tratamiento antipsicótico inicial.
Descripción de la afección
La esquizofrenia es un trastorno psiquiátrico crónico e invalidante. Por lo general tiene una aparición temprana y síntomas graves. Es una de las principales causas de discapacidad a largo plazo en todo el mundo, con un impacto devastador para los pacientes y sus familias. El grado de dificultad y discapacidad es considerable; las tasas de empleo varían entre el 4,5% y el 50% (Bouwmans 2015); y se calcula que la prevalencia de suicidio durante la vida está alrededor del 5% (Palmer 2005). La calidad de vida de los pacientes que presentan esquizofrenia es significativamente deficiente y en general se deteriora durante el curso de la enfermedad.
Los antipsicóticos son el tratamiento actual de preferencia en la esquizofrenia (Kane 1996). Desafortunadamente, un gran número de pacientes no presenta mejorías significativas a pesar del tratamiento farmacológico (Lieberman 2005). Estos pacientes suelen ser considerados "pacientes que no responden al tratamiento". La epidemiología exacta de este fenómeno no se comprende claramente, y una razón es la diferencia entre los criterios sobre la falta de respuesta o la resistencia al tratamiento (Howes 2017). Sin embargo, las guías dicen que aproximadamente del 20% al 30% de los pacientes no responden a una prueba adecuada de un fármaco antipsicótico (Lehmann 2004). No hay una variable predictiva clara de la falta de respuesta a los antipsicóticos, aunque está bien establecido que los pacientes con un primer episodio responden mejor que los pacientes crónicos (Jäger 2007).
Descripción de la intervención
El aumento de la dosis del antipsicótico y el cambio del fármaco antipsicótico son dos estrategias alternativas en el caso de una falta de respuesta inicial; no se puede establecer a priori cuál es la intervención y cuál el comparador. Por lo tanto, se describen ambos brevemente.
El aumento de la dosis del antipsicótico en los pacientes con esquizofrenia que no responden al tratamiento a menudo se realiza de forma gradual: la dosis se aumenta de manera sistemática hasta que se logra una respuesta clínica o hasta que los efectos secundarios se vuelven demasiado graves y no se obtienen beneficios adicionales en la eficacia. En los años setenta y ochenta hubo la noción de que los pacientes con esquizofrenia se beneficiarían con megadosis de antipsicóticos, que podrían acelerar el inicio de la acción (a veces denominado "neuroleptización rápida"). Aunque este concepto en gran parte ha sido abandonado, debido a que las revisiones narrativas indicaron que estas dosis excesivas no son más eficaces en los pacientes "generales" (Baldessarini 1988), hay una posibilidad de que algunos pacientes que no responden obtengan beneficios de dichas dosis. Una razón podría ser que una proporción considerable de pacientes (hasta el 7% de los caucásicos; Steijns 1998) presenta polimorfismo genético de las enzimas hepáticas del sistema de CIP que da lugar a un metabolismo demasiado rápido de los antipsicóticos y a la falta de respuesta. Por lo tanto, podría ser que al menos algunos pacientes individuales necesiten dosis mayores más allá de los rangos aprobados oficialmente. Gardner 2010, por ejemplo, proporciona una lista de dosis proyectadas y dosis máximas recomendadas por los expertos internacionales en esquizofrenia. Si se administran dosis mayores que las aprobadas por las etiquetas oficiales, el riesgo principal para los pacientes con esquizofrenia es que podrían presentar efectos secundarios más pronunciados o graves como síntomas extrapiramidales, aumento de peso y un intervalo QT prolongado.
El cambio del fármaco antipsicótico se puede definir ampliamente como el cambio de un fármaco prescrito actualmente por uno diferente. Para la revisión actual, la razón del cambio en la que se centró el interés fue la respuesta terapéutica insuficiente al antipsicótico original. Los antipsicóticos se pueden cambiar de forma brusca o gradual y el momento adecuado del cambio también es importante; o sea, por cuánto tiempo se debió haber prolongado un tratamiento farmacológico inicial. El riesgo principal para los pacientes con esquizofrenia puede ser que al cambiar de un antipsicótico a otro se pierda tiempo, mientras los pacientes se habrían beneficiado al seguir recibiendo el mismo fármaco. Además, en algún momento durante el proceso de cambio, los pacientes por lo general reciben dos fármacos lo que puede dar lugar a más efectos secundarios.
De qué manera podría funcionar la intervención
La idea detrás del aumento de la dosis del antipsicótico es que en el paciente con esquizofrenia que no responde al tratamiento, se tiene que lograr un umbral individual de sensibilidad para que el fármaco sea efectivo. Es bien conocido que existen diferencias individuales considerables con respecto a la farmacocinética de los antipsicóticos, que influyen directamente en su eficacia (Miller 2009). Un factor importante son las diferencias en la expresión de las enzimas del citocromo P450 que son responsables del metabolismo de muchos fármacos antipsicóticos. Existen polimorfismos en los genes que codifican estas enzimas y pueden dar lugar a su expresión excesiva y, por lo tanto, a la eliminación demasiado rápida de los fármacos (denominados "metabolizadores ultrarrápidos") y a la falta de respuesta posterior (Steijns 1998). Un trabajo más reciente indicó que algunas de las diferencias individuales en la respuesta a los fármacos antipsicóticos podrían tener su fuente en la variabilidad de los genotipos ABCB1, lo que significa que los individuos con una configuración genotípica favorable muestran un riesgo menor de desarrollar refractividad al aumento de la dosis del antipsicótico (Vijayan 2012).
La idea detrás del cambio del fármaco antipsicótico se basa en lo siguiente: aunque todos los antipsicóticos bloquean los receptores de dopamina, difieren de manera significativa en sus efectos sobre otros receptores (Arnt 1998). Por lo tanto, podría ser que los pacientes que no responden a un fármaco antipsicótico quizás respondan bien a otro. Además, incluso al centrarse sólo en los receptores de dopamina podría haber diferencias entre los pacientes individuales. Por ejemplo, un metanálisis reciente estableció que las variaciones en el gen receptor dopaminérgico D2 (DRD2) que codifica el receptor dopaminérgico D₂ se asocian con la respuesta clínica al tratamiento antipsicótico (Zhang 2010).
Por qué es importante realizar esta revisión
Se calcula que entre un quinto y un tercio de los pacientes con esquizofrenia no responden adecuadamente al tratamiento antipsicótico estándar (Barnes 2003). Uno de los retos principales en el tratamiento farmacológico del trastorno es ayudar a que dichos pacientes logren la remisión completa de los síntomas. Además de continuar el tratamiento actual y esperar que los pacientes comiencen a responder con el transcurso del tiempo, existen dos estrategias contrapuestas: aumentar la dosis del antipsicótico; o cambiar a otro antipsicótico. Desafortunadamente, no existe evidencia clara sobre hasta qué punto estas estrategias son efectivas. El objetivo es proporcionar una familia de revisiones sistemáticas relacionadas sobre este tema para contribuir a más práctica clínica basada en la evidencia. La revisión también es potencialmente importante para los elaboradores de políticas, debido a que la alta frecuencia de falta de respuesta y de resistencia al tratamiento da lugar a tasas altas de discapacidad y, por lo tanto, a costos para la sociedad (Vos 2012).
Esta revisión forma parte de tres Revisiones Cochrane "relacionadas", que investigan la falta de respuesta en pacientes con esquizofrenia (las otras son Aumento de la dosis del antipsicótico para la falta de respuesta en la esquizofrenia (Helfer 2015); y Reducción de la dosis del antipsicótico para los pacientes con esquizofrenia [título solamente]).
Objetivos
Examinar la eficacia del aumento de la dosis del antipsicótico versus el cambio de fármaco antipsicótico en el tratamiento de los pacientes con esquizofrenia refractaria.
Métodos
Criterios de inclusión de estudios para esta revisión
Tipos de estudios
Todos los ensayos controlados aleatorios relevantes. Si un ensayo se había descrito como "doble ciego" pero estaba implícita la asignación al azar, el ensayo se incluyó en un análisis de sensibilidad (ver Análisis de sensibilidad). Se excluyeron los estudios cuasialeatorios, como los que asignaron por días alternos de la semana. Cuando los pacientes recibieron tratamientos adicionales dentro de los grupos de aumento o de cambio de la dosis, sólo se incluyeron los datos si el tratamiento adicional se distribuyó por igual entre los grupos y sólo se habían asignado al azar los grupos de aumento y de cambio de la dosis.
Tipos de participantes
Adultos, como sea que se hayan definido, con esquizofrenia o trastornos relacionados, incluido el trastorno esquizofreniforme, el trastorno esquizoafectivo y el trastorno delusorio, por cualquier medio de diagnóstico, que no respondían al tratamiento antipsicótico actual, independientemente de la edad, el sexo o la raza. Se aceptó cualquier definición de falta de respuesta utilizada en los estudios individuales. Es una estrategia general del Grupo Cochrane de Esquizofrenia (Cochrane Schizophrenia Group) para incluir también estudios que no utilizaron los criterios de diagnóstico operacionalizados como los del Diagnostic and Statistical Manual of Mental Disorders (DSM‐5), debido a que en la práctica clínica habitual dichos criterios tampoco se utilizan de forma meticulosa.
Tipos de intervenciones
1. Aumento de la dosis
Cualquier aumento de la dosis del antipsicótico, independientemente de cómo se definió. Las dosis nuevas podrían estar dentro de los rangos de dosis proyectados recomendados según se describe en las etiquetas de los antipsicóticos o en las recomendaciones internacionales o ser mayores (Gardner 2010).
2. Cambio
Cambio de un antipsicótico a otro, independientemente del método de cambio o el momento en que se realizó el cambio. No hubo restricciones en cuanto a la dosis del segundo antipsicótico, aunque cuando la dosis del fármaco nuevo no coincidió obviamente con la del original (con el uso de Gardner 2010 como estándar), se registraron dichos detalles en la Evaluación del riesgo de sesgo en los estudios incluidos.
Tipos de medida de resultado
Se planificó dividir, de ser posible, todos los resultados en a corto plazo (hasta tres meses), a plazo medio (más de tres meses y hasta seis meses) y a largo plazo (más de seis meses).
Se informaron los resultados binarios, registrando los grados claros y clínicamente significativos del cambio (p.ej. impresión global de "mucha mejoría" o una mejoría mayor del 50% en una escala de calificación, según lo definido dentro de los ensayos) antes que cualquier otra cosa. Posteriormente se enumeraron los resultados continuos.
Resultados primarios
1. Estado global: respuesta clínicamente relevante ‐ según lo definido por los ensayos*
* Se esperó que diferentes ensayos utilizaran diferentes definiciones de respuesta. Aunque los estudios han mostrado que, siempre que se apliquen medidas relativas del riesgo (riesgos relativos, odds ratios), los resultados metanalíticos no difieren mucho en dependencia del valor de corte exacto aplicado (Furukawa 2011).
2. Estado global: exacerbaciones de la psicosis ‐ según lo definido por los autores
Resultados secundarios
1. Abandono temprano del estudio
1.1 Tolerabilidad ‐ abandono temprano debido a los efectos adversos
1.2 Aceptabilidad ‐ abandono temprano del estudio por cualquier razón
1.3 Eficacia ‐ abandono temprano debido a la ineficacia del tratamiento
2. Estado mental
2.1 Estado mental general
2.1.1 Ningún cambio de importancia clínica en el estado mental general ‐ según se definió en cada uno de los estudios
2.1.2 Puntuación final promedio del estado mental general
2.1.3 Cambio promedio en las puntuaciones del estado mental general
2.2 Síntomas positivos
2.2.1 Ningún cambio de importancia clínica en los síntomas positivos ‐ según se definió en cada uno de los estudios
2.2.2 Puntuación promedio de los síntomas positivos al final del estudio
2.2.3 Cambio promedio en las puntuaciones de síntomas positivos
2.3 Síntomas negativos
2.3.1 Cambio de importancia clínica en los síntomas negativos ‐ según se definió en cada uno de los estudios
2.3.2 Puntuación promedio de los síntomas negativos al final del estudio
2.3.3 Cambio promedio en las puntuaciones de síntomas negativos
3. Depresión
3.1 Cambio de importancia clínica en los síntomas depresivos ‐ según se definió en cada uno de los estudios
3.2 Puntuación promedio de los síntomas depresivos al final del estudio
3.3 Cambio promedio en las puntuaciones de síntomas depresivos
4. Conducta agresiva
4.1 Cambio de importancia clínica en la conducta agresiva ‐ según se definió en cada uno de los estudios
4.2 Puntuación promedio de la conducta agresiva al final del estudio
4.3 Cambio promedio en la puntuación de la conducta agresiva
5. Exacerbaciones de la psicosis (según se definió en los estudios individuales)
5.1 Duración de la enfermedad (número de días con exacerbaciones)
6. Uso de servicios
6.1 Hospitalización ‐ tiempo en el hospital (días)
7. Efectos adversos
7.1 Por lo menos un efecto adverso
7.2 Efectos secundarios específicos (según los definieron los autores originales, basado en cualquier valor de referencia aplicado)
8. Calidad de vida
8.1 Cambio de importancia clínica en la calidad de vida ‐ según se definió en cada uno de los estudios
8.2 Promedio de la calidad de vida al final del estudio
8.3 Cambio promedio de la calidad de vida
9. Satisfacción con la atención
9.1 Cambio de importancia clínica en la satisfacción con la atención ‐ según se definió en cada uno de los estudios
9.2 Satisfacción final promedio con la atención
9.3 Cambio promedio en la satisfacción con la atención
Tabla "Resumen de los hallazgos"
Se utilizó el enfoque GRADE para interpretar los hallazgos (Schünemann 2011); y el GRADE profiler para exportar datos de esta revisión y crear la tabla "Resumen de los hallazgos"(GRADE pro GDT). Las tablas "Resumen de los hallazgos" brindan información específica de los resultados en cuanto a la calidad general de la evidencia de cada estudio incluido en la comparación, la magnitud del efecto de las intervenciones examinadas y la suma de los datos disponibles sobre todos los resultados que los autores de la revisión consideraron importantes para la atención del paciente y la toma de decisiones.
Se intentaron seleccionar los siguientes resultados importantes para su inclusión en la tabla "Resumen de los hallazgos".
-
Estado global: respuesta clínicamente relevante ‐ según lo definido por el ensayo.
-
Abandono temprano del estudio: tolerabilidad ‐ abandono temprano debido a los efectos secundarios.
-
Abandono temprano del estudio: aceptabilidad ‐ abandono temprano debido a cualquier razón.
-
Estado mental general ‐ cambio clínicamente importante en el estado mental general.
-
Efectos adversos ‐ al menos un efecto adverso.
-
Uso de servicios ‐ tiempo en el hospital.
-
Calidad de vida ‐ cambio de importancia clínica en la calidad de vida.
Cuando los datos no estaban disponibles para estos resultados predeterminados pero estaban disponibles para los que son similares, se presentó el resultado más cercano al predeterminado en la tabla pero se consideró este hecho al calificar el resultado.
Métodos de búsqueda para la identificación de los estudios
We did not apply any language restrictions, within the limitations of the search tools.
Búsquedas electrónicas
1. Cochrane Schizophrenia Group’s Study‐Based Register of Trials
On 30 March 2017, the Information Specialist searched the register using the following search strategies:
(Dosage Increasing* AND Switch*) in Intervention Field of STUDY
This register is compiled by systematic searches of major resources (including AMED, BIOSIS, CINAHL, Embase, MEDLINE, PsycINFO, PubMed, and registries of clinical trials) and their monthly updates; handsearches; grey literature; and conference proceedings (see Group Module). There are no language, date, document type, or publication status limitations for inclusion of records in the register.
For previous searches, see Appendix 1.
Búsqueda de otros recursos
1. Reference searching
We inspected references of the included study for further relevant studies.
2. Personal contact
We contacted the first author of the included study for information regarding unpublished trials.
Obtención y análisis de los datos
Selección de los estudios
Two authors (MS and EK) independently inspected citations from the searches and identified relevant abstracts. Where disputes arose, we obtained the full‐text reports for further assessment. We retrieved full reports of conference proceedings meeting the review criteria; the two authors (MS and EK) inspected these independently. We resolved disagreements by discussion with a third author (SL). If it had not been possible to resolve disagreement by discussion, we would have attempted to contact the authors of the study for clarification.
Extracción y manejo de los datos
1. Extraction
Two authors (MS and EK) independently extracted data from the included study. We discussed any disagreement and, if necessary, consulted a third author (SL). We documented our decisions and, if necessary, we would have attempted to contact authors of the study for clarification. We would have extracted data presented only in graphs and figures whenever necessary and possible.
2. Management
2.1 Forms
We extracted data using pre‐standardised data extraction forms.
2.2 Scale‐derived data
We included continuous data from rating scales only if:
a) the psychometric properties of the measuring instrument have been described in a peer‐reviewed journal (Marshall 2000);
b) the measuring instrument had not been written or modified by one of the trialists for that particular trial; and
c) the instrument is not a global assessment of an area of functioning and not sub‐scores which are not, in themselves, validated or shown to be reliable. However there are exceptions: we would have included sub‐scores from mental state scales measuring positive and negative symptoms of schizophrenia.
Ideally the measuring instrument should either be i. a self‐report or ii. completed by an independent rater or relative (not the therapist). We realise that this is not often reported clearly; in 'Description of studies' we noted if this is the case or not.
2.3 Endpoint versus change data
There are advantages of both endpoint and change data. Change data can remove a component of between‐person variability from the analysis. On the other hand calculation of change needs two assessments (baseline and endpoint) which can be difficult in unstable and difficult‐to‐measure conditions such as schizophrenia. We decided to primarily use endpoint data, and only use change data if the latter were not available. We combined endpoint and change data as we preferred to use mean differences (MD) rather than standardised mean differences (Deeks 2011).
2.4 Skewed data
Continuous data on clinical and social outcomes are often not normally distributed. To avoid the pitfall of applying parametric tests to non‐parametric data, we aimed to apply the following standards to relevant continuous data before inclusion.
Standard deviations (SDs) and means that are reported in the paper or obtained from the authors.
For endpoint data from studies including fewer than 200 participants:
-
when a scale starts from the finite number zero, we would have subtracted the lowest possible value from the mean, and divided this by the standard deviation. If this value is lower than one, it strongly suggests that the data are skewed and we would exclude these data. If this ratio is higher than one but less than two, there is a suggestion that the data are skewed: we would enter these data and test whether their inclusion or exclusion would change the results substantially. If such data changed results we would enter as 'other data'. Finally, if the ratio is larger than two we would included these data, because it is less likely that they are skewed (Altman 1996; Higgins 2011a).
-
if a scale starts from a positive value (such as the Positive and Negative Syndrome Scale (PANSS), which can have values from 30 to 210 (Kay 1986)), we would modify the calculation described above to take the scale starting point into account. In these cases skewed data are present if 2 SD > (S − S min), where S is the mean score and 'S min' is the minimum score.
Please note: we would have entered all relevant data from studies of more than 200 participants in the analysis irrespective of the above rules, because skewed data pose less of a problem in large studies. We also would have entered all relevant change data, as when continuous data are presented on a scale that includes a possibility of negative values (such as change data), it is difficult to tell whether or not data are skewed.
2.5 Common measure
To facilitate comparison between trials, we intended to convert variables that could be reported in different metrics, such as days in hospital (mean days per year, per week or per month) to a common metric (e.g. mean days per month).
2.6 Conversion of continuous to binary
Where possible, we converted outcome measures to dichotomous data. This can be done by identifying cut‐off points on rating scales and dividing participants accordingly into 'clinically improved' or 'not clinically improved'. It is generally assumed that if there is a 50% reduction in a scale‐derived score such as the Brief Psychiatric Rating Scale (BPRS) or the Positive and Negative Syndrome Scale (PANSS) (Overall 1962; Kay 1986), this can be considered as a clinically significant response (Leucht 2005a; Leucht 2005b). If data based on these thresholds were not available, we used the primary cut‐off presented by the original authors.
2.7 Direction of graphs
Where possible, we decided to enter data in such a way that the area to the left of the line of no effect would indicate a favourable outcome for the increased dose group. If this way made it impossible to avoid outcome titles with clumsy double‐negatives (e.g. 'Not non‐improved'), we decided to report data where the left of the line would indicate a favourable outcome for the switching group and noted this in the relevant graphs.
Evaluación del riesgo de sesgo de los estudios incluidos
Two authors (MS and EK) worked independently to assess risk of bias by using criteria described in the Cochrane Handbook for Systematic Reviews of Interventions (Higgins 2011b). This set of criteria is based on evidence of associations between overestimate of effect and high risk of bias of the article such as sequence generation, allocation concealment, blinding, incomplete outcome data and selective reporting.
If the authors disagreed, we would have made the final rating by consensus with involvement of a third author (SL). If inadequate details of randomisation and other characteristics of the trial were provided, we would have to contacted study authors in order to obtain further information. We would have reported non‐concurrence in quality assessment.
We noted the level of risk of bias in the text of the review (Risk of bias in included studies), the Characteristics of included studies table and Summary of findings table 1.
Medidas del efecto del tratamiento
1. Binary data
For binary outcomes we calculated standard estimations of risk ratios (RRs) and their 95% confidence intervals (CIs). It has been shown that RRs are more intuitive than odds ratios (ORs) (Boissel 1999), and that ORs tend to be interpreted as RRs by clinicians (Deeks 2000). The number needed to treat for an additional beneficial outcome (NNTB) and the number needed to treat for an additional harmful outcome (NNTH) with their CIs are intuitively attractive to clinicians but can be problematic both in terms of accurate calculation in meta‐analyses and interpretation (Hutton 2009). For binary data presented in the 'Summary of findings' table, where possible we calculated illustrative comparative risks.
2. Continuous data
For continuous outcomes we estimated mean difference (MD) between groups. We preferred not to calculate effect size measures (standardised mean difference SMD). However, if scales of very considerable similarity were used, we presumed there was a small difference in measurement, and we calculated effect size and transformed the effect back to the units of one or more of the specific instruments.
Cuestiones relativas a la unidad de análisis
1. Cluster trials
Studies increasingly employ 'cluster randomisation' (such as randomisation by clinician or practice) but analysis and pooling of clustered data poses problems. Firstly, authors often fail to account for intra‐class correlation in clustered studies, leading to a 'unit of analysis' error (Divine 1992), whereby P values are spuriously low, CIs unduly narrow and statistical significance overestimated. This causes type I errors (Bland 1997; Gulliford 1999).
If clustering had not been accounted for in primary studies, we would have presented data in a table, with a (*) symbol to indicate the presence of a probable unit of analysis error. We would have attempted to contact first authors of studies to obtain intra‐class correlation coefficients for their clustered data and to adjust for this by using accepted methods (Gulliford 1999). Where clustering is incorporated into the analysis of primary studies, we would have presented these data as if from a non‐cluster randomised study, but adjusted for the clustering effect.
We have sought statistical advice and have been advised that binary data as presented in a report should be divided by a 'design effect'. This can be calculated using the mean number of participants per cluster (m) and the intraclass correlation coefficient (ICC) [Design effect = 1 + (m − 1) * ICC] (Donner 2002). If the ICC were not reported we would have assumed it to be 0.1 (Ukoumunne 1999).
If cluster studies had been appropriately analysed taking into account intra‐class correlation coefficients and relevant data documented in the report, synthesis with other studies would be possible using the generic inverse variance technique.
2. Cross‐over trials
A major concern of cross‐over trials is the carry‐over effect. It occurs if an effect (e.g. pharmacological, physiological or psychological) of the treatment in the first phase is carried over to the second phase. As a consequence on entry to the second phase the participants can differ systematically from their initial state despite a wash‐out phase. For the same reason cross‐over trials are not appropriate if the condition of interest is unstable (Elbourne 2002). As both effects are very likely in people with severe mental illness, we would have used only the data of the first phase of cross‐over studies.
3. Studies with multiple treatment groups
Where a study involves more than two treatment arms, if relevant we would have presented the additional treatment arms in comparisons. If data were binary we would simply have added and combined within the two‐by‐two table. If data were continuous we would have combined data following the formula in the Cochrane Handbook for Systematic Reviews of Interventions (Higgins 2011a). Where the additional treatment arms were not relevant, we would not have used these data.
Manejo de los datos faltantes
1. Overall loss of credibility
We share the concern that at some degree of loss to follow‐up, data must lose credibility (Xia 2010). However, it remains unclear which degree of attrition is problematic. Therefore, we did not exclude studies on the basis of degree of attrition, but considered attrition in our 'Risk of bias' assessment.
2. Binary
We decided to present data on a 'once randomised, always analyse' basis (an intention‐to‐treat (ITT) analysis). Those leaving the study early were all assumed to have the same rates of outcome as those who completed.
3. Continuous
3.1 Assumptions about participants who left the trials early or who were lost to follow‐up
Various methods are available to account for participants who left the trials early or were lost to follow‐up. Some trials just present the results of study completers, others use the method of 'last observation carried forward' (LOCF) (Leucht 2007), while more recently methods such as multiple imputation or mixed‐effects models for repeated measurements have become more of a standard. While the second two methods seem to be somewhat better than LOCF (Leon 2006), we feel that the high percentage of participants leaving the studies early and differences in the reasons for leaving the studies early between groups is often the core problem in randomised schizophrenia trials. We therefore did not exclude studies based on the statistical approach used. However, we preferably used the more sophisticated approaches e.g. mixed‐effects models for repeated measurements or multiple‐imputation instead of LOCF, and we only presented completer analyses if some kind of ITT data were not available at all. Moreover, we addressed this issue in the item "incomplete outcome data" of the 'Risk of bias' tool.
3.2 Standard deviations
If standard deviations (SDs) were not reported, we tried to obtain the missing values from the authors. If SDs were not available, but an exact standard error (SE) and confidence intervals (CIs) were available for group means, and either the P value or t value were available for differences in the mean, we decided to calculate them according to the rules described in the Cochrane Handbook for Systematic Reviews of Interventions (Higgins 2011a). When only the standard error (SE) was reported, SDs were calculated by the formula SD = SE * √(n). The Cochrane Handbook for Systematic Reviews of Interventions presents detailed formulae for estimating SDs from P values, t or F values, CIs, ranges or other statistics (Higgins 2011a). If these formulae did not apply, we decided to calculate the SDs according to a validated imputation method which is based on the SDs of the other included studies (Furukawa 2006). Although some of these imputation strategies can introduce error, the alternative would be to exclude a given study’s outcome and thus to lose information. We nevertheless decided to examine the validity of the imputations in a sensitivity analysis excluding imputed values.
Evaluación de la heterogeneidad
1. Clinical heterogeneity
If we had included more than one study, we would have considered all included studies initially, without seeing comparison data, to judge clinical heterogeneity. We simply would have inspected all studies for clearly outlying people or situations which we had not predicted would arise. When such situations or participant groups arose, we would have discussed these.
2. Methodological heterogeneity
If we had included more than one study, we would have considered all included studies initially, without seeing comparison data, to judge methodological heterogeneity. We simply would have inspected all studies for clearly outlying methods which we had not predicted would arise. When such methodological outliers arose, we would have discussed these.
3. Statistical heterogeneity
3.1 Visual inspection
We would have visually inspected graphs to investigate the possibility of statistical heterogeneity.
3.2 Employing the I² statistic
We would have investigated statistical heterogeneity between studies by considering the I² statistic alongside the P value of the Chi² test. The I² statistic provides an estimate of the percentage of inconsistency thought to be due to chance (Higgins 2003). The importance of the observed value of the I² statistic depends on both the magnitude and direction of effects and the strength of evidence for heterogeneity (e.g. P value from the Chi² test, or CIs for the I² statistic). We would have considered an I² statistic estimate equal to or greater than 50%, accompanied by a statistically significant Chi² test (P value < 0.01) as evidence of substantial heterogeneity (Deeks 2011). If substantial levels of heterogeneity were found in the primary outcome, we would have explored reasons for heterogeneity (Subgroup analysis and investigation of heterogeneity).
Evaluación de los sesgos de notificación
Reporting biases arise when the dissemination of research findings is influenced by the nature and direction of results (Egger 1997). These are described in Chapter 10 of the Cochrane Handbook for Systematic Reviews of Interventions (Sterne 2011).
1. Protocol versus full study
We tried to locate the protocol of the included trial. If the protocol is available, we compared outcomes in the protocol and in the published report . If the protocol is not available, we compared outcomes listed in the Methods section of the trial report with actually reported results.
We tried to locate the protocol of the included trial. If the protocol had been available, we would have compared outcomes in the protocol and in the published report. As the protocol was not available, we compared outcomes listed in the Methods section of the trial report with actually reported results.
2. Funnel plot
We are aware that funnel plots may be useful in investigating reporting biases but are of limited power to detect small‐study effects. We did not plan to use funnel plots for outcomes where there are 10 or fewer studies, or where all studies are of similar size. If funnel plots are possible in future versions, we will seek statistical advice in their interpretation.
Síntesis de los datos
We understand that there is no closed argument for preferring the use of a fixed‐effect model over a random‐effects models, or a random‐effects model over a fixed‐effect model. The random‐effects method incorporates an assumption that the different studies are estimating different, yet related, intervention effects. This does seem true to us as we (a priori) expected some clinical heterogeneity between participants in different trials. We therefore chose the random‐effects model for all analyses (DerSimonian 1986). There is, however, a disadvantage to the random‐effects model: it puts added weight onto small studies which often are the most biased ones. Depending on the direction of effect, these studies can either inflate or deflate the effect size.
Análisis de subgrupos e investigación de la heterogeneidad
1. Subgroup analyses
1.1 Antipsychotic drugs
We planned to perform subgroup analyses based on the antipsychotic drugs included in the selected studies.
1.2 Clinical state, stage or problem
We proposed to undertake this review and provide an overview of the effects of switching for people with schizophrenia in general. In addition, however, we aimed to report data on subgroups of people in the same clinical state, stage and with similar problems.
2. Investigation of heterogeneity
We planned to report relevant findings if heterogeneity was found to be high. Firstly, we would have investigated whether data had been entered correctly. Secondly, if data were correct, we would visually inspect the graph and particularly the studies outside of the company of the rest in order to identify reasons that might explain the heterogeneity. Decisions as to whether single studies are to be excluded from the analysis or whether a formal meta‐analysis can be undertaken at all depend on issues such as whether the heterogeneity was due to differences in direction of effect or only to the degree of the differences between intervention and control (Higgins 2011a). If unanticipated clinical or methodological heterogeneity had been obvious we would simply have stated hypotheses regarding these for future reviews or versions of this review. We did not anticipate undertaking analyses relating to these.
Análisis de sensibilidad
1. Implication of randomisation
We aimed to include trials in a sensitivity analysis if they were described in some way as to imply randomisation. For the primary outcomes we planned to include these studies and if their inclusion did not result in a substantive difference, they would have remained in the analyses. If their inclusion resulted in important clinically significant differences — but not necessarily statistically significant differences — we planned not to add the data from these lower‐quality studies to the results of the better trials, but would have presented such data within a subcategory.
2. Risk of bias
We aimed to analyse the effects of excluding trials that were judged to be at high risk of bias across one or more of the domains; see Assessment of risk of bias in included studies. If the exclusion of trials at high risk of bias did not substantially alter the direction of effect or the precision of the effect estimates, we would have included data from these trials in the analysis. Studies with a high risk of bias in terms of randomisation or allocation concealment would have been excluded right from the start. If randomisation and allocation methods were described (and risk of bias was rated as unclear) we planned to enter such trials in a sensitivity analysis.
3. Imputed values
If assumptions had to be made regarding missing SDs (see Dealing with missing data), we planned to compare the findings of the primary outcomes when we used our assumption/s and when we used data only from studies which provided SDs.
We also planned to undertake a sensitivity analysis to assess the effects of including data from trials where imputed values for ICC in calculating the design effect in cluster randomised trials were used.
4. Fixed effect and random effects
We synthesised data using a random‐effects model; however, if possible, we would have synthesised data for the primary outcomes using a fixed‐effect model to evaluate whether this would alter the results.
If substantial differences had been noted in the direction or precision of effect estimates in any of the sensitivity analyses listed above, we would not have pooled data from the excluded trials with the other trials contributing to the outcome, but would have presented them separately.
Results
Description of studies
For substantive description of studies please see Characteristics of included studies and Characteristics of excluded studies.
Results of the search
The initial search of the Cochrane Schizophrenia Group Trials Register in June 2014 yielded 543 records. We additionally made two later searches of the same Trials Register (using the same search strategy), one in October 2015 which yielded 358 records and one in March 2017 which yielded one record. After we removed duplicates, we screened 819 records and excluded 781 at abstract and title stage. We obtained and closely inspected 38 full‐text reports on 26 studies; and as a result we included one study (referring to two full‐text reports) and excluded 25 studies (referring to 36 full‐text reports) (see Figure 1).

Study flow diagram for trial selection up to March 2017
Included studies
Only one study met inclusion criteria for this review (Kinon 1993). The study was published in 1993 (for more details, see Characteristics of included studies and the accompanying 'Risk of bias' table).
1. Study design
Kinon 1993 had two phases. The first phase was an open‐label, non‐comparative design. The second phase was a double‐blind, randomised, interventional design.
2. Length of trial
Kinon 1993 had a total duration of eight weeks; each phase had a duration of four weeks. In the first phase, all participants received fluphenazine 20 mg/day plus benztropine 4 mg/day openly for four weeks. Non‐responders of the first phase then entered the second, double‐blind phase of another four weeks' duration.
3. Participants
One hundred and fifty‐six participants entered the study. Out of 115 participants that completed the first four weeks of treatment, 37 were responders and 78 were non‐responders. Fifty‐eight of the 78 non‐responder participants entered the double‐blind phase of the study, but data were presented only for 47 of them (see also Characteristics of included studies).
All 156 participants initially entering the Kinon 1993 study were inpatients and had a diagnosis of schizophrenia (76.9%), schizoaffective disorder (16.7%) or schizophreniform disorder (6.4%) according to DSM‐III‐R criteria (American Psychiatric Association 1987). One hundred participants were men; 56 were women. The mean age of participants was 29.4 ± 7.0 years, the age at first hospitalisation was 23.0 ± 6.5 years and the number of previous hospitalisations was 2.6 ± 2.2.
4. Interventions
In the second phase of the Kinon 1993 study, 58 participants (of the 78 non‐responders to fluphenazine 20 mg/day during the first phase of the study) were randomly assigned to double‐blind treatment with either fluphenazine 20 mg/day, fluphenazine 80 mg/day or haloperidol 20 mg/day, all supplemented with benztropine. Data were available for 47 out of 58 participants entering the double‐blind phase of the study: fluphenazine 20 mg/day (N = 18), fluphenazine 80 mg/day (N = 16) and haloperidol 20 mg/day (N = 13). For the purpose of the present review, 29 participants were of interest (fluphenazine 80 mg/day (N = 16) and haloperidol 20 mg/day (N = 13)).
5. Outcomes
5.1 Outcome scales
A variety of scales were used to assess clinical response and adverse events. Details of scales that provided usable data are shown below.
5.1.1 Global state
Clinical Global Impression ‒ CGI (Guy 1976)
CGI is a 7‐point rating instrument that is commonly used in studies on schizophrenia. It enables clinicians to quantify severity of illness (CGI‐Severity) or overall clinical improvement (CGI‐Improvement) during therapy with low scores indicating decreased severity or greater improvement.
5.1.2 Mental state
Brief Psychiatric Rating Scale ‒ BPRS (Overall 1962)
The BPRS is a scale used to measure the severity of psychiatric symptoms, including psychotic symptoms. The scale has usually 18 items (depending on the version the number of items could vary from 16 to 24), and each item is rated on a 7‐point scoring system varying from 'not present' (1) to 'extremely severe' (7). Higher scores indicate more pronounced symptomatology.
Scale for the Assessment of Negative Symptoms ‒ SANS (Andreasen 1982)
The SANS is a scale used to measure the severity of negative symptoms in schizophrenia. The scale is used to evaluate five domains of symptoms: alogia; affective blunting; avolition‒apathy; anhedonia‒asociality; and attention impairment. Each symptom is rated on a 6‐point scoring system varying from 'absent' (0) to 'severe' (5). Higher scores indicate more pronounced symptomatology.
5.1.3 Adverse events
Simpson Angus Scale ‒ SAS (Simpson 1970)
This 10‐item scale, with a scoring system of 0 to 4 for each item, measures drug‐induced parkinsonism, a short‐term drug‐induced movement disorder. A low score indicates low levels of parkinsonism.
Excluded studies
We excluded 36 full‐text articles on 26 trials. We excluded three studies because they were not appropriately randomised (Suzuki 2007; Agid 2013; Kim 2013). We excluded the remaining studies because of wrong interventions, e.g. no antipsychotic dose increase group or no antipsychotic switching group.
Risk of bias in included studies
For graphical representations of our judgements of risk of bias please refer to Figure 2 and Figure 3. Full details of judgements are seen in the ‘Risk of bias’ table.

Risk of bias graph: review authors' judgements about each risk of bias item presented as percentages across all included studies.
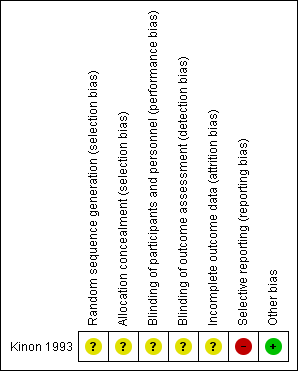
Risk of bias summary: review authors' judgements about each risk of bias item for each included study.
Allocation
Concerning random sequence generation and allocation concealment, we rated Kinon 1993 with an unclear risk of bias for both; it was described as "randomised", but no detail on allocation concealment was provided.
Blinding
Concerning performance bias and detection bias, we rated Kinon 1993 with an unclear risk of bias; it was described as "double‐blind", but no detail was provided regarding blinding of participants, personnel or assessors.
Incomplete outcome data
Concerning attrition bias, we rated Kinon 1993 with an unclear risk of bias since the issue of numbers leaving the study early was not addressed. Furthermore, data were presented for just 81% (47/58) of all randomised participants.
Selective reporting
Concerning reporting bias, we rated Kinon 1993 with a high risk of bias since SAS scores were available only for two items and not total.
Other potential sources of bias
We judged Kinon 1993 to be free of other potential sources of bias.
Effects of interventions
We did not perform any meta‐analysis as only one study was included in the review. In the first phase of Kinon 1993, all participants received fluphenazine 20 mg/day plus benztropine 4 mg/day openly for 4 weeks. In the second phase, 58 non‐responders to fluphenazine 20 mg/day of the first phase were randomly assigned to double‐blind treatment with either fluphenazine 20 mg/day, fluphenazine 80 mg/day or haloperidol 20 mg/day, all supplemented with benztropine 4 mg/day. Data were reported only for 47 out of 58 initially randomised participants.
See: summary of findings Table for the main comparison of the available outcomes for the comparison 'Increasing the antipsychotic dose versus switching the antipsychotic drug'.
1. Increasing the antipsychotic dose versus switching the antipsychotic drug
1.1 Global state
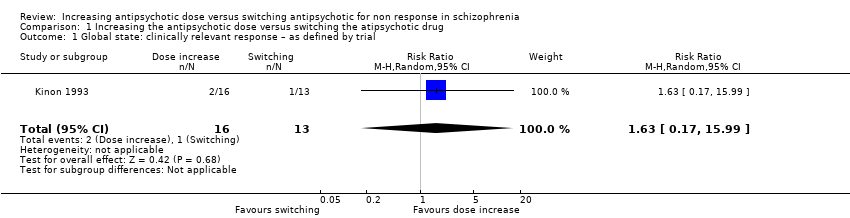
1.1.1 Clinically relevant response ‒ as defined by the authors
Kinon 1993 provided data on the number of responders. Response was defined by a combination of criteria: a rating of 'mild' or better on each of the four BPRS psychotic items and a rating of 'much improved' or better in CGI‐Improvement scale. Two out of 16 participants in the dose increase group, one out of 13 participants in the switching the antipsychotic drug group and one out of 18 participants in the continuing with the same dose and drug group were judged to be responders. There was no clear difference between the antipsychotic dose increase group versus the antipsychotic switching group in this regard (RR 1.63, CI 0.17 to 15.99, 1 RCT, N = 29, very low quality evidence,Analysis 1.1).
1.2 Mental state
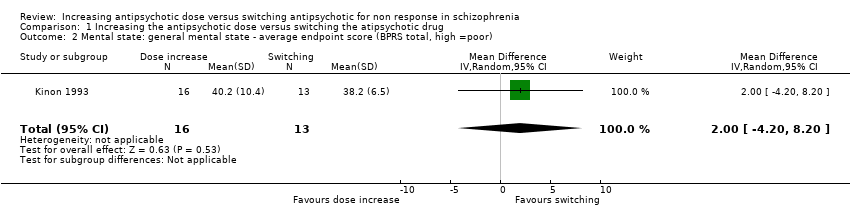
1.2.1 General mental state ‒ average endpoint score (BPRS total, high = poor)
Kinon 1993 reported the average BPRS total score at endpoint per group (dose increase: 40.2 points ± 10.4 versus switching: 38.2 points ± 6.5). There was no clear difference between antipsychotic dose increase versus antipsychotic switching group in this regard (MD 2.00, CI −4.20 to 8.20, 1 RCT, N = 29, very low quality evidence, Analysis 1.2 ).
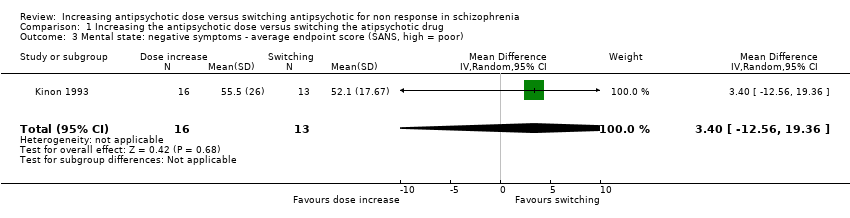
1.2.2 Negative symptoms ‒ average endpoint score (SANS, high = poor)
Kinon 1993 reported the average SANS total score at endpoint per group (dose increase: 55.5 ± 26 versus switching: 52.1 ± 17.67). There was no clear difference between antipsychotic dose increase versus antipsychotic switching group in this regard (MD 3.40, CI −12.56 to 19.36, 1 RCT, N = 29, Analysis 1.3).
2. Subgroup analysis and investigation of heterogeneity
Only one study was included in our review. Therefore, no subgroup analysis could be performed.
3. Publication bias
Only one study was included in our review. Therefore, a funnel plot analysis could not be performed.
4. Sensitivity analyses
Only one study was included in our review. Therefore, no sensitivity analysis could be performed.
Discusión
Resumen de los resultados principales
A pesar de la búsqueda exhaustiva, en la presente revisión solamente se incluyó un estudio pequeño (Kinon 1993). Kinon 1993 comparó el aumento de la dosis del antipsicótico versus un cambio del fármaco antipsicótico versus continuación con la misma dosis y fármaco antipsicótico en los pacientes con esquizofrenia o trastornos relacionados que no respondían al tratamiento antipsicótico inicial. El estudio incluido se publicó en 1993. La fase inicial incluyó tratamiento abierto con flufenazina 20 mg/día durante cuatro semanas. Los pacientes que no respondían al tratamiento luego se asignaron al azar al aumento de la dosis de flufenazina a 80 mg/día, a cambio al haloperidol 20 mg/día o a la continuación del tratamiento con flufenazina con la misma dosis inicial de 20 mg/día durante cuatro semanas adicionales. No se observaron diferencias en ninguno de los resultados de eficacia (respuesta clínica, BPRS al final del estudio, SANS al final del estudio) entre las tres opciones alternativas de tratamiento.
Compleción y aplicabilidad general de las pruebas
Sólo un estudio examinó si el aumento de la dosis es más eficaz que el cambio del fármaco antipsicótico en los pacientes con esquizofrenia no que responden al tratamiento antipsicótico actual. De la presente revisión se excluyeron los estudios que no examinaron exclusivamente a los pacientes que no responden, aunque también se incluyeron los participantes con intolerancia al tratamiento. ???? Las conclusiones basadas en los datos de la presente revisión sistemática son muy limitadas debido a la inclusión de sólo un ECA con un número pequeño de participantes y sólo tres resultados informados. En resumen, actualmente no hay evidencia suficiente para establecer conclusiones sólidas y se necesitan más estudios.
Calidad de la evidencia
Kinon 1993 se describió como aleatorio y doble ciego, aunque no se aportaron detalles. Por lo tanto, no está claro si el estudio realizó una asignación al azar adecuada, si realmente se realizó la ocultación de la asignación al tratamiento ni si el cegamiento funcionó. Además, el estudio no consideró los datos de resultado faltantes, ya sea los números que abandonaron el estudio temprano o con respecto a las razones, y no informó otros resultados predeterminados de importancia como los efectos adversos, el uso de servicios y la calidad de vida. Sin embargo, incluso para los tres resultados (respuesta clínica, estado mental general y síntomas negativos) que se informaron de manera adecuada, el tamaño de la muestra no fue lo suficientemente grande (N = 29) para detectar alguna diferencia clara, incluso si existió una diferencia (es decir error tipo II). En general, la calidad de la evidencia de Kinon 1993 fue muy baja para todos los resultados basado en GRADE (Schünemann 2011).
Sesgos potenciales en el proceso de revisión
Se intentó limitar el sesgo en cada paso del proceso de revisión. Se predeterminó y publicó el protocolo de estudio, la búsqueda fue amplia, los criterios de selección fueron claros y estrictos, se extrajeron todos los resultados y al menos dos autores seleccionaron los estudios y extrajeron los datos. Sin embargo, la búsqueda se basó principalmente en el registro de ensayos del Grupo Cochrane de Esquizofrenia que en gran parte está constituido por búsquedas de la bibliografía publicada. Por lo tanto, es posible que haya estudios no publicados que no se conocen y existe la posibilidad de sesgo de publicación. Además, no fue posible realizar el gráfico en embudo propuesto para investigar la presencia de sesgo de publicación debido a que sólo se incluyó un estudio en esta revisión.
Acuerdos y desacuerdos con otros estudios o revisiones
Un consenso de expertos recomendó el aumento de la dosis del antipsicótico, especialmente para los antipsicóticos de segunda generación y de depósito, antes de considerar la posibilidad de cambiar el fármaco antipsicótico a un agente diferente (Kane 2003). No obstante, las guías de tratamiento de la esquizofrenia reconocen que hay evidencia limitada a favor del aumento de la dosis del antipsicótico, fuera de los rangos de dosis recomendados, para los pacientes con esquizofrenia que no responden al tratamiento antipsicótico inicial (Lehmann 2004; Buchanan 2010; Hasan 2012). Por otro lado, se reconoce que algunos estudios indican que el cambio de un antipsicótico de primera generación (APG) o de un antipsicótico de segunda generación (ASG) a determinados ASG podría ser alentador (Hasan 2012). Revisiones anteriores que examinaron estrategias de tratamiento alternativas en caso de falta de respuesta al tratamiento antipsicótico inicial — Leucht 2013; Leucht 2015 y Dold 2014 — también encontraron solo el estudio Kinon 1993 para la comparación específica del aumento de la dosis versus el cambio del fármaco, aunque se observaron diferencias en los criterios de inclusión y de exclusión y no se planificó la realización de una síntesis cuantitativa (metanálisis).
Study flow diagram for trial selection up to March 2017
Risk of bias graph: review authors' judgements about each risk of bias item presented as percentages across all included studies.
Risk of bias summary: review authors' judgements about each risk of bias item for each included study.
Comparison 1 Increasing the antipsychotic dose versus switching the atipsychotic drug, Outcome 1 Global state: clinically relevant response – as defined by trial.
Comparison 1 Increasing the antipsychotic dose versus switching the atipsychotic drug, Outcome 2 Mental state: general mental state ‐ average endpoint score (BPRS total, high =poor).
Comparison 1 Increasing the antipsychotic dose versus switching the atipsychotic drug, Outcome 3 Mental state: negative symptoms ‐ average endpoint score (SANS, high = poor).
| Methods | Randomisation: random |
| Participants | Diagnosis: people with schizophrenia, schizoaffective disorder or schizophreniform disorder N > 450 |
| Interventions | All participants firstly receive treatment with one antipsychotic drug for at least 2 weeks. Those participants who do not at least minimally improve after 2 weeks, are considered non‐responders and are randomised to: 1. increasing the dose of the initial antipsychotic drug above the officially recommended dose range; or 2. switching the initial antipsychotic drug to another one with a different receptor profile; or 3. continuing treatment with the initial antipsychotic drug and at the same, initial dose (within the officially recommended dose range). |
| Outcomes | Response (defined as PANSS or BPRS decrease ≥ 50%)* Relapse Leaving the study early due to any reason Leaving the study early due to side effects General mental state: average change in general mental state scores Adverse effects: at least one adverse effect; clinically important general adverse effects; sudden and unexpected death Service use: time in hospital Quality of life All outcomes by time ‒ short term (up to 12 weeks), medium term (13 to 26 weeks) and long term (over 26 weeks) |
| Notes | *Primary outcome of interest |
| Increasing the antipsychotic dose compared to switching the antipsychotic drug for non responsein schizophrenia | ||||||
| Patient or population: patients with non response in schizophrenia | ||||||
| Outcomes | Illustrative comparative risks* (95% CI) | Relative effect | No of Participants | Quality of the evidence | Comments | |
| Assumed risk | Corresponding risk | |||||
| Switching the atipsychotic drug | Increasing the antipsychotic dose | |||||
| Global state: Clinically relevant response – as defined by trial | 77 per 1000 | 125 per 1000 | RR 1.63 | 29 | ⊕⊝⊝⊝ | |
| Leaving the study early: Tolerability ‒leaving the study early due to side effects | See comment | See comment | Not estimable | 0 | See comment | No studies reported on this outcome. |
| Leaving the study early: Acceptability ‒leaving the study early due to any reason | See comment | See comment | Not estimable | 0 | See comment | No studies reported on this outcome, |
| General mental state ‒BPRS total score at endpoint* | The mean general mental state ‒ BPRS total score at endpoint in the control groups was | The mean general mental state ‐ BPRS total score at endpoint in the intervention groups was | 29 | ⊕⊝⊝⊝ | Data for prespecified outcome: Clinically important change were not reported. | |
| Adverse effects ‒at least one adverse effect | See comment | See comment | Not estimable | 0 | See comment | No studies reported on this outcome. |
| Service use ‒time in hospital | See comment | See comment | Not estimable | 0 | See comment | No studies reported on this outcome. |
| Quality of life ‒average change in quality of life | See comment | See comment | Not estimable | 0 | See comment | No studies reported on this outcome. |
| *The basis for the assumed risk (e.g. the median control group risk across studies) is provided in footnotes. The corresponding risk (and its 95% confidence interval) is based on the assumed risk in the comparison group and the relative effect of the intervention (and its 95% CI). | ||||||
| GRADE Working Group grades of evidence | ||||||
| 1 Imprecision: total (cumulative) sample size was just 29 participants and 95% confidence interval around the estimate of effect included no effect and appreciable benefit and appreciable harm; thus, very serious imprecision was present. | ||||||
| Outcome or subgroup title | No. of studies | No. of participants | Statistical method | Effect size |
| 1 Global state: clinically relevant response – as defined by trial Show forest plot | 1 | 29 | Risk Ratio (M‐H, Random, 95% CI) | 1.63 [0.17, 15.99] |
| 2 Mental state: general mental state ‐ average endpoint score (BPRS total, high =poor) Show forest plot | 1 | 29 | Mean Difference (IV, Random, 95% CI) | 2.0 [‐4.20, 8.20] |
| 3 Mental state: negative symptoms ‐ average endpoint score (SANS, high = poor) Show forest plot | 1 | 29 | Mean Difference (IV, Random, 95% CI) | 3.40 [‐12.56, 19.36] |