La Neonatal Behavioral Assessment Scale (Neonatal Behavioral Assessment Scale, NBAS por su sigla en inglés) y el sistema Newborn Behavioral Observations (Observaciones Conductuales del Recién Nacido, NBO por su sigla en inglés) para apoyar a los cuidadores y mejorar los resultados en los cuidadores y los lactantes
Resumen
Antecedentes
Los primeros tres años de vida del niño son un período clave en el desarrollo físico, fisiológico, cognitivo y social, y la relación cuidador‐lactante en el período neonatal desempeña una función importante al influir en estos aspectos del desarrollo. Específicamente, la adaptación de los cuidadores facilita la evolución de la corregulación a la autorregulación; la capacidad de los padres de comprender comportamientos de su lactante como la comunicación es un aspecto clave de este proceso. Las intervenciones tempranas breves como la Neonatal Behavioral Assessment Scale (NBAS) o el sistema Newborn Behavioral Observations (NBO) son posibles métodos para mejorar los resultados en el lactante y el cuidador.
Objetivos
Evaluar los efectos de la NBAS y el sistema NBO para mejorar la interacción cuidador‐lactante y los resultados relacionados en los cuidadores y los lactantes. Los objetivos secundarios fueron determinar si la NBAS y el NBO son más efectivos para grupos particulares de lactantes o padres, e identificar los factores asociados con una mayor efectividad (p.ej. momento, duración, etc.).
Métodos de búsqueda
En septiembre 2017, se hicieron búsquedas en CENTRAL, MEDLINE, Embase, PsycINFO, en otras 12 bases de datos y en cuatro registros de ensayos. También se buscaron listas de referencias de estudios incluidos y revisiones sistemáticas relevantes, y se estableció contacto con el Instituto Brazelton, y se buscó en sus sitios web para identificar cualquier estudio en curso y no publicado.
Criterios de selección
Se incluyeron los ensayos controlados aleatorios (ECA) y cuasialeatorios que utilizaron al menos una medida estandarizada para evaluar los efectos de la NBAS o el NBO versus control inactivo para mejorar los resultados en los cuidadores y sus lactantes.
Obtención y análisis de los datos
Dos autores de la revisión evaluaron de forma independiente los registros recuperados mediante la búsqueda. Un autor de la revisión extrajo los datos y un segundo autor comprobó su exactitud. Los resultados para cada hallazgo de cada estudio se presentaron como diferencias de medias estandarizadas (DME) o como cocientes de riesgos (CR), con intervalos de confianza (IC) del 95%. Cuando fue apropiado, se combinaron los resultados en un metanálisis utilizando los procedimientos metodológicos estándar previstos por Cochrane. Se utilizó el enfoque GRADE para evaluar la calidad general del grupo de evidencia para cada resultado.
Resultados principales
Se identificaron 16 ECA en esta revisión: 13 evaluaron la NBAS y tres el NBO para mejorar los resultados en 851 participantes asignados al azar, incluidos los padres y sus recién nacidos prematuros o lactantes (de cuatro a 12 semanas de vida). Todos los estudios se realizaron en los EE.UU., y se consideró que todos tuvieron alto riesgo de sesgo.
Siete estudios que incluyeron 304 participantes contribuyeron con datos a un metanálisis de la repercusión de la NBAS o el NBO para la interacción cuidador‐lactante, y los resultados indican una diferencia significativa de tamaño mediano entre los grupos intervención y control (DME ‐0,53; IC del 95%: ‐0,90 a ‐0,17; evidencia de muy baja calidad), con heterogeneidad moderada (I2 = 51%). Los análisis de subgrupos que compararon los dos tipos de programas (es decir, NBAS y NBO) encontraron un efecto mediano aunque no significativo de la NBAS (‐0,49; IC del 95%: ‐0,99 a 0,00; cinco estudios), con niveles altos de heterogeneidad (I2 = 61%), en comparación con un tamaño del efecto grande significativo del NBO (‐0,69; IC del 95%: ‐1,18 a ‐0,20; dos estudios), sin heterogeneidad (I2 = 0,0%). Sin embargo, la evidencia de diferencias de subgrupos entre los dos modelos no fue significativa. Un estudio encontró una repercusión significativa sobre el resultado secundario conocimiento de los cuidadores (DME ‐1,30; IC del 95%: ‐2,16 a ‐0,44; evidencia de muy baja calidad). No hubo evidencia de una repercusión sobre la depresión materna. No se identificó ningún efecto adverso.
Conclusiones de los autores
Actualmente solo hay evidencia de muy baja calidad de la efectividad de la NBAS y el NBO relacionada con mejorías en la interacción padre‐lactante en los cuidadores, principalmente en los padres primerizos con bajo riesgo y sus lactantes. Hay estudios de investigación adicionales en marcha con respecto a la efectividad del NBO, que son necesarios para corroborar estos resultados.
PICOs
Resumen en términos sencillos
Efectividad de la Neonatal Behavioral Assessment Scale (NBAS) y del sistema Newborn Behavioral Observations (NBO) para los padres y los lactantes
Antecedentes
Los tres primeros años de vida de un niño comprenden un período clave del desarrollo, y se ha encontrado que la relación cuidador‐lactante en el período neonatal influye en los resultados posteriores. La sensibilidad de los cuidadores y la capacidad de comprender los comportamientos del lactante como la comunicación es particularmente importante para el desarrollo del lactante. Las intervenciones tempranas breves como la Neonatal Behavioral Assessment Scale (NBAS) o el sistema Newborn Behavioral Observations (NBO) pueden mejorar potencialmente los resultados del lactante y el cuidador.
Pregunta de la revisión
¿Cuán efectiva es la NBAS o el NBO para mejorar los resultados en los padres y los lactantes?
Estudios incluidos
Se encontraron 16 estudios con un total de 851 participantes. De estos, 13 estudios evaluaron la NBAS y tres el NBO. Todos los estudios tuvieron lugar en los Estados Unidos entre 1981 y 2015.
Resultados
Fue posible combinar en un metanálisis (un método estadístico de combinación de los datos de varios estudios para establecer una conclusión única más consistente) los datos de siete estudios que midieron la repercusión de la NBAS en la interacción cuidador‐lactante. Se encontró alguna evidencia de efectividad a partir de estudios de muy baja calidad. Sin embargo, una comparación de la NBAS con el NBO para este resultado indicó que, aunque el NBO produjo un tamaño más grande del efecto que la NBAS, esta diferencia no fue significativa. Un estudio de baja calidad mostró una repercusión positiva sobre el conocimiento de los cuidadores. No se encontró evidencia de una repercusión sobre la depresión materna. No se identificó ningún efecto adverso como resultado de la intervención.
Calidad de los estudios
Se consideró que los datos de los resultados principales de los estudio fueron de muy baja calidad.
Conclusiones de los autores
Actualmente hay evidencia de muy baja calidad de la efectividad, y está relacionada con que la NBAS y el NBO mejoran la interacción padre‐lactante en los padres primerizos con bajo riesgo y sus lactantes. Los estudios en curso con respecto al NBO ayudarán a establecer la exactitud de estos resultados.
Authors' conclusions
Summary of findings
| NBAS or NBO versus control for caregiver‐infant interaction, caregiver mental health, and caregiver functioning | |||||
| Patient or population: caregiver‐infant dyads Settings: hospitals, clinics, home Intervention: NBAS or NBO Comparison: NBAS or NBO administered with no interaction | |||||
| Outcomes | Illustrative comparative risks* (95% CI) | Relative effect | Number of participants | Quality of the evidence | |
| Assumed risk | Corresponding risk | ||||
| Control group | NBAS or NBO | ||||
| Quality of caregiver‐infant interaction (parental sensitivity, attunement, etc.); continuous data Assessed at postintervention using validated assessment scales for caregiver‐infant interaction: higher scores indicate better outcome | The mean score for quality of caregiver‐infant interaction ranged across control groups from 3.72 to 51.90 | The mean caregiver‐infant interaction score in the intervention groups was 0.53 lower (0.90 lower to 0.17 lower) | — | 304 | ⊕⊕⊝⊝ |
| Caregiver mental health (depression), dichotomous data Assessed at postintervention using the EPDS; lower scores indicate less depression | Low‐risk population | RR 0.23 (0.05 to 1.04) | 106 (1 study) | ⊕⊕⊝⊝ | |
| 157 per 1000 | 36 per 1000 (8 to 163) | ||||
| Medium‐risk population | |||||
| NA | NA | ||||
| High‐risk population | |||||
| NA | NA | ||||
| Infant social, emotional, cognitive and motor development Assessed when infant aged 4 months, using the BSID; higher scores indicate better development | The mean score for infant mental development in the control group was 107.83 | The mean score for infant mental development in the intervention groups was0.13 lower (0.48 lower to 0.22 higher) | — | 125 (1 study) | ⊕⊕⊝⊝ |
| Caregiver perception of infant (parents' perception of the degree of difficult temperament of the infant) Assessed at postintervention, 8 weeks after delivery; higher score indicates better outcome | The mean score for caregiver perception of infant in the control group was 18.90 | The mean score for caregiver perception of the infant in the intervention group was 0.36 lower (0.95 lower to 0.24 higher) | — | 44 (1 study) | ⊕⊕⊝⊝ |
| Caregiver stress (maternal perceptions of her adjustment to the parenting role) Assessed when infant aged 4 months, using the PSI | The mean score for parent‐related caregiver stress in the control group was 2.19 | The mean score for parent‐related caregiver stress in the intervention groups was0.00 (0.35 lower to 0.35 higher) | — | 125 (1 study) | ⊕⊕⊝⊝ |
| Caregiver knowledge (related to infants' physical capacities, including reflexes and senses) Assessed at postintervention, using multiple choice factual questions; higher scores indicate better outcome | The mean score for caregiver knowledge in the control groups was8.30 | The mean score for caregiver knowledge in the intervention groups was 1.30 higher (0.44 to 2.16 higher) | — | 26 (1 study) | ⊕⊕⊝⊝ |
| *The basis for the assumed risk (e.g. the median control group risk across studies) is provided in footnotes. The corresponding risk (and its 95% CI) is based on the assumed risk in the comparison group and the relative effect of the intervention (and its 95% CI). | |||||
| GRADE Working Group grades of evidence | |||||
| 1Downgraded due to risk of bias due to poor quality research (e.g. limitations in design, including inadequate randomisation or allocation procedures, together with attrition, which ranged from 4% to 20% in seven studies – none of which conducted an intention‐to‐treat analysis), inconsistency for the main outcome due to high levels of heterogeneity for the NBAS; and indirectness in terms of the low levels of generalisability to wider risk groups within the population. 2Downgraded due to risk of bias due to poor quality research (e.g. limitations in design, including inadequate randomisation or allocation procedures, together with attrition, which ranged from 4% to 20% in seven studies – none of which conducted an intention‐to‐treat analysis), and indirectness in terms of the low levels of generalisability to wider risk groups within the population. | |||||
Background
Description of the condition
The importance of attachment for children's development
The first three years of a child's life are a key period of physical, physiological, cognitive and social development (Richter 2004). The caregiver‐infant attachment relationship is important to a child's development (Bowlby 1969), and depending on its quality, the attachment relationship may confer a positive influence on a child or be a source of risk. For example, longitudinal research has identified some associations between children's social, emotional and cognitive outcomes and the caregiver‐infant attachment during the first year (Malekpour 2007; Sroufe 2005). Secure attachment in infancy has also been found to be associated with greater confidence and self‐regulation, more adaptive stress management, and more positive relationships in childhood and in later life (Sroufe 2005). Conversely, insecure and disorganised attachment in infancy is associated with unfavourable outcomes in later childhood, including problems with emotion regulation, social and behavioural issues, and lowered academic achievement (Berlin 2008; Granot 2001; Sroufe 2005), as well as an increased risk of a range of later forms of psychopathology, including externalising disorders (i.e. conduct and behaviour problems) (Fearon 2010); personality disorder (i.e. mental health problems characterised by enduring maladaptive patterns of emotional regulation, relating and behaviour) (Steele 2010); dissociation (Dutra 2005); post‐traumatic stress disorder (PTSD) (MacDonald 2008); and an increased likelihood of children experiencing symptoms that meet clinical criteria (Borelli 2010).
Attachment quality is not necessarily static (Belsky 1996; Vondra 2001), although it may remain stable between infancy and adulthood or change depending on a person's environment and experiences (Egeland 1984; Weinfield 2000). Therefore, the influence of attachment security on development may be best understood in terms of the risk or protection it delivers, rather than as a causal relationship, taking into account a given child's context and history (Belsky 2002). Although dynamic, and with the potential for discontinuity as well as continuity, attachment status in infancy is considered to be an important predictor of a child's long‐term development (Grossman 2002; Sroufe 2005; Waters 2000).
The neurobiology of attachment – regulation theory
Neurobiological research indicates that caregivers play a key role throughout the first year of life in the development of an infant's brain and physiology through regulation of the infant's developing stress response system (Gunnar 1996; Gunnar 2002; Schore 2002; Schore 2008). A caregiver who is able to interpret an infant's behavioural cues and respond appropriately to meet the child's emotional and physical needs, called an 'attuned' or 'responsive' caregiver, uses his or her vocalisations, facial expressions and physical handling to provide continuous psychobiological regulation of the infant's ever‐changing states of stress and arousal (Schore 2001). Over time, this dyadic regulation allows the infant to develop adaptive strategies for responding to and regulating stress independently, which then enables the child to be less vulnerable to future stress (Sroufe 2005). When a caregiver is severely and chronically misattuned, however, typical dyadic regulatory processes are disrupted, such that, in the face of chronically high levels of stress that are not successfully coregulated by the caregiver, the infant may develop only minimal or maladaptive strategies for self‐regulation (Gunnar 2007; Lyons‐Ruth 2005). Infant regulatory difficulties expressed as 'excessive crying' and problems with attachment, sleeping, and feeding are the primary reasons for referral to infant mental health services (Keren 2001). DeGangi 2000 found that all but five per cent of a group of infants who were experiencing moderate regulatory problems at seven months (i.e. problems with sleep and feeding; ability to self‐soothe and modulate affect states; ability to regulate mood, and emotional and behavioural control), were experiencing caregiver‐child relationship problems or developmental delays in the cognitive, motor, and language domains at age three. This finding highlights how important it is for children to have attuned caregivers to support them in developing adaptive stress response systems and regulatory capacity.
Understanding infant behaviour as communication
The successful shift from coregulation to self‐regulation happens within the context of a secure attachment relationship with a caregiver who can meet the infant's needs (Beebe 2010). In order to successfully identify and meet these needs, a caregiver must understand that infant behaviour is a communication of their needs, wants and preferences, and that these behavioural cues can be interpreted and merit a prompt appropriate response (Nugent 2007).
When caregivers understand that behaviour represents a communication of need, they can support their babies' growing ability to be sufficiently coregulated to enter into and remain in the quiet‐alert interactive state by ensuring all other physical needs are met (Hawthorne 2005; Nugent 2007). This facilitation may allow for longer or more frequent periods of contingent communication to take place. As early as five weeks of age, infants whose caregivers meet their needs and provide social interaction when the infants are available for it have been found to participate more readily during interactions by engaging in more "gazing, smiling and vocalizing" than infants of less responsive caregivers (Markova 2006). In turn, the more infants look, smile and vocalise at their mothers, the more affectionate the mothers' behaviours toward the infants become, reflecting the bi‐directional influence of both caregivers and infants to their interactive context (Clarke‐Stewart 1973).
Contingency in caregiver‐infant communication
A key factor influencing the quality of interaction patterns is the degree of contingency, or level of predictability and synchronicity of responses, between the parent‐infant dyad (Beebe 2012). Readiness of an infant to engage with the parents' emotional communications (i.e. by touch, sight or sound) are influenced by a variety of factors, including components of visceral motor regulation, which require subtle aspects of timing to achieve attunement (Porges 2011). A number of studies have now measured interpersonal contingent co‐ordination in mother‐infant dyads, some using the specialist technique microanalysing interaction (see Beebe 2010 for a summary). These show that interaction that is within what is defined as the midrange (i.e. infant and caregiver respond optimally to each others' cues without hypervigilance or withdrawal, and within repeated cycles characterised by synchrony, rupture and repair) is most optimal, in terms of parental sensitivity (Bornstein 2013); they also show an association with infant attachment security at 12 months (Beebe 2010; Beebe 2012). This contrasts with interaction that is either 'over‐contingent' (i.e. characterised by hypervigilance and intrusion) or 'under‐contingent' (i.e. characterised as inhibited and withdrawn), both of which are associated with insecure and disorganised attachment (Beebe 2010; Beebe 2012). This sensitivity is associated with the development of a secure attachment relationship (De Wolff 1997), which in turn is associated with positive developmental outcomes, including resilience and optimal social functioning (Lecce 2008).
Attempts to understand the correlates of infant attachment have more recently focused at the cognitive level on "reflective functioning" (Slade 2001), and "mind‐mindedness" (Meins 2012; Meins 2001), which refer to the caregiver's ability to accurately interpret the infant's thoughts and feelings. Different studies have associated reflective functioning with caregiver responsiveness (Greinenberger 2005; Slade 2001; Slade 2005), while low reflective functioning is associated with caregiver withdrawal, intrusiveness and hostility (Greinenberger 2005; Slade 2001; Slade 2005). Similarly, maternal mind‐mindedness has been found to be associated with infant attachment security at 12 months of age (Meins 2012; Meins 2001). Thus, when the caregiver views the infant as an individual with thoughts and feelings that can be imagined and interpreted through the infant's behaviour, the relationship is more likely to be characterised by responsive, contingent interactions to meet the infant's needs (Greinenberger 2005; Slade 2001; Slade 2005). Interventions that foster caregiver contingency or mind‐mindedness, therefore, have a role to play in fostering positive caregiver‐infant interaction and promoting optimal, long‐term, developmental outcomes in children.
Description of the intervention
Possibly one the earliest interventions that was developed to improve caregiver‐infant interaction at the behavioural level with a specific focus on caregiver responsiveness during the earliest days and months of the infant's life is the Brazelton Neonatal Behavioral Assessment Scale (NBAS) (Brazelton 1978), along with its shorter clinical variation, the Newborn Behavioral Observations (NBO) system. Paediatrician Dr T Berry Brazelton developed the NBAS in the 1970s as a way of assessing a newborn's neurological functioning and ability to participate actively in interaction (Brazelton 1995). In the 1980s, clinicians began using it as an intervention to support caregivers in understanding their infants' behaviour (Hawthorne 2004; Teti 1996). The NBAS and NBO direct the caregiver's attention toward the infant's behaviour; address the caregiver's awareness and understanding of newborn infants as unique individuals whose behaviours can be understood as meaningful communication of needs, wants, abilities, challenges, and preferences; and model contingent responses to these behaviours.
The NBAS can be used with healthy, full‐term infants from a few hours after birth to two months postpartum (Brazelton 1995), with stabilised preterm infants from 35 weeks' gestational age, and with otherwise developmentally delayed infants until much later (Hawthorne 2004). During an NBAS session, a qualified clinician (e.g. a paediatrician, midwife, psychologist, etc. trained to deliver the NBAS) administers as many as possible of the 28 behavioural and reflex items, given the time available and the infant's willingness and ability to engage, recording the infant's responses on a standardised scoring sheet. These items are designed to reveal the infant's unique social‐interactive and neurodevelopmental capabilities and difficulties, including orientation to human voices and other sounds, muscle tone, and self‐soothing (Brazelton 1995).
In 2007, the NBO – originally called the Clinical NBAS – was published, having been developed from the NBAS framework as a clinical tool for supporting caregivers in their relationships and interactions with their infants (Nugent 2007). The main difference during an NBO session is that the facilitator may select from 18 neurobehavioural items as opposed to 28, so an NBO session is typically much shorter than an NBAS session. The NBO can be used with healthy infants from a gestational age of 36 weeks to three months "post‐term", and with preterm or medically fragile infants who are stable enough to be close to hospital discharge or who are postdischarge at home (Nugent 2007).
Clinicians can administer both the NBAS and NBO at home, in hospital or in another clinical setting such as a children's centre. The instruments are designed to be flexibly tailored to each caregiver‐infant dyad. Both instruments have been used with caregivers who are considered low‐vulnerability (e.g. middle‐class, high educational attainment, married, etc.) and high‐vulnerability (e.g. low‐socioeconomic status, low educational attainment, young, depressed, drug‐using, etc.), with mothers and fathers, and with first‐time and experienced caregivers, with varying effectiveness on caregiver and infant outcomes (see Why it is important to do this review for further detail). The developers recommend that families participate in sessions anywhere from once to three or more times depending on resources and other factors such as infant vulnerability, positing that a greater number of sessions, spread over the first two to three months, provides a more detailed picture of the infant during a period of development.
Both the NBAS and NBO are used in research settings to explore associations between observed infant behaviours and antecedent variables or later outcomes and to evaluate their effectiveness as tools for assessing infant behaviour or enhancing given caregiver and infant outcomes. In clinical settings, they constitute intervention tools to support caregivers and their infants. Two key guidelines for primary care practice with caregivers and newborns in the United Kingdom, NHS England 2014 and WAVE Trust 2013, both recommend the NBAS and NBO.
How the intervention might work
A critical attachment‐related task for a caregiver in the newborn period is to understand the infant's behaviour (e.g. crying, body movement, sleeping, gaze toward or away from people or objects, etc.) as communication (Golas 1986). When a caregiver appropriately interprets and responds to this communication, the resulting prompt and contingent caregiving interactions are described as being responsive (e.g. Eshel 2006), attuned (e.g. Brazelton 1995), or sensitive (e.g. Ainsworth 1974). This type of caregiving, tailored to the needs and wants of the infant, has positive implications for the infant's developing stress response system and social abilities (Schore 2001; Sroufe 2005), enabling the caregiver to feel knowledgeable (Britt 1994a), confident (Hawthorne 2005; Ohgi 2004; Teti 1996), and satisfied in the caregiver role (Rauh 1988). This contributes to a caregiver‐infant relationship that is healthy and gratifying for both partners.
Alternatively, when a caregiver does not recognise the infant's behaviour as communication, they either may not respond to the behaviour, which in the extreme may constitute neglect, or may respond to these behaviours in a way that is non‐contingent (inappropriate to meet the infants' needs), abusive, frightening or unpredictable (Jacobvitz 1997; Lyons‐Ruth 2005). These interactive patterns, marked by a lack of responsiveness resulting from a mismatch of infant cues and caregiver interpretation and response, are associated with the development of insecure or disorganised attachment (Beebe 2010), with implications for a child's long‐term development (Berlin 2008; Granot 2001; Green 2002; Sroufe 2005).
Given that these patterns begin to become established by the time a child is three months old (Crockenberg 1982), the newborn period and early infancy is an opportune window for universal, early, preventive intervention with caregivers (Brazelton 1995). The NBAS or NBO may be universally and preventively used from the earliest moments in this window to support the emergence of positive caregiver‐infant interactions (Myers 1982b; Nugent 2007; Poley‐Strobel 1987), even in the face of caregiver challenges in adjusting and interacting with a child (Beeghly 1995b). Such intervention in the earliest days of the child's life have the potential to benefit the caregiver‐infant relationship, mediate potential risk factors for the child's development within this relationship (Myers 1982b; Poley‐Strobel 1987), and enhance the caregiver's satisfaction, confidence and experience of the relationship (Hawthorne 2005).
Why it is important to do this review
Proponents of the NBAS have suggested that its use may improve a caregiver's responsiveness (Das Eiden 1996), increase caregiver involvement (Worobey 1985), improve a caregiver's attitudes toward the infant and satisfaction in the caregiving role (Britt 1994b), and enhance caregiver confidence in their role and in understanding the infant (Hawthorne 2005). Although these suggested benefits are theoretically supported, in that caregiver responsiveness, involvement, satisfaction and confidence are related to caregiver‐infant interaction quality (see Eshel 2006; Gaertner 2007; Isabella 1994; Shea 1988, respectively), and the quality of the caregiver‐infant relationship is related to the developmental outcomes of the infant (Sroufe 2005), recent reviews of the effectiveness of the NBAS have been inconclusive (Britt 1994b; Das Eiden 1996; Worobey 1985). However, none of the three existing reviews used a systematic methodology, and therefore selection bias may have influenced their results.
These reviews also had further methodological and reporting problems, and all are now out‐dated, with new primary studies emerging since their publication. One meta‐analysis of 13 randomised controlled trials (RCTs) that found a small‐to‐moderate beneficial effect on "parenting quality" calculated an average global effect size for a single outcome across the 13 included studies (Das Eiden 1996). While seemingly providing conclusive evidence of effectiveness, the review presented the average effect size without explicitly noting that most of the included studies (k = 10) had effect sizes of less than 0.20, with just three studies increasing the average through small‐to‐medium effect sizes (0.48, 0.39 and 0.28). Britt 1994b also reviewed 13 studies, including unpublished reports, but only provided a narrative synthesis. Worobey 1985 only selected studies for inclusion that had demonstrated effectiveness in at least one of its outcomes.
Evidence about effectiveness and cost‐effectiveness are key to enabling decisions about how best to support caregivers of newborns. Despite the numerous evaluations of the effectiveness of the NBAS and NBO as an intervention, there is currently no reliable systematic review of this evidence to assist with decision‐making about its use. In the context of this lack of evidence, this review will enable us to assess the extent to which key recommendations for its use in primary care practice are valid (NHS England 2014; WAVE Trust 2013).
This review aims to improve upon previous reviews by using a systematic methodology to identify and appraise all rigorous studies published since the first NBAS manual in 1973 that have used the NBAS or NBO as an intervention, in order to provide an updated analysis of the effectiveness of the NBAS and NBO for enhancing a range of aspects of caregiving (see Bartram 2016 for study protocol).
Objectives
To assess the effects of the NBAS and NBO system for improving caregiver‐infant interaction and related outcomes in caregivers and newborn babies. Secondary objectives were to determine whether the NBAS and NBO are more effective for particular groups of infants or parents, and to identify the factors associated with increased effectiveness (e.g. timing, duration, etc.).
Methods
Criteria for considering studies for this review
Types of studies
Randomised controlled trials (RCTs) and quasi‐RCTs (i.e. trials in which participants were allocated using a method that is not truly random, such as alternate allocation).
Types of participants
All caregiver and infant participants eligible to receive the Neonatal Behavioral Assessment Scale (NBAS) or Newborn Behavioral Observations (NBO) system.
Types of interventions
Experimental intervention
Studies using the NBAS or the NBO in full or as part of an intervention (as opposed to an assessment). We excluded studies in which the NBAS or NBO was provided as part of a suite of services, and in which independent effects could not be estimated.
We considered the NBAS to be used as an 'intervention' when investigators employed it with intent to influence an aspect of the infant's psychological or physical development, an aspect of caregiving (e.g. parental confidence, involvement, responsiveness, etc.) or a feature of the dyadic relationship (e.g. attunement, reciprocity, attachment quality, etc.).
Comparator intervention
Studies that utilised an inactive control group (e.g. wait‐list, placebo, care‐as‐usual, or no‐treatment) were eligible for inclusion, but not those using active control groups (e.g. receiving a variation of the NBAS or NBO, or an alternative intervention), in order to ensure that we could evaluate the primary rather than the relative effectiveness of the NBAS and NBO. We did not use other eligibility restrictions for the control group.
Types of outcome measures
All outcomes conceptually related to infant health and development, caregiver‐infant dyadic variables, and caregiver variables related to caregiving, including mental health, were of interest; we did not use outcomes as criteria for study inclusion. Trials could have measured outcomes at any time point in order to examine the short‐, medium‐, and long‐term effectiveness of the NBAS or NBO (Higgins 2016). For scales in which an increase (i.e. as opposed to a decrease) in score represents an improvement, we multiplied mean values by −1 to ensure that all scales pointed in the same direction. We provide examples of outcomes and measurements below.
Primary outcomes
-
Quality of caregiver‐infant interaction, including frequency and contingency (e.g. CARE index (Crittenden 2001), Nursing Child Assessment Teaching Scale (NCATS; Barnard 1978)), sensitivity and responsiveness (e.g. Nursing Child Assessment of Feeding Scale (NCAFS; Sumner 1994)), and responsiveness to infant distress (Britt 1994a).
-
Caregiver mental health (e.g. Edinburgh Postnatal Depression Scale (EPDS; Cox 1987)).
-
Adverse effects or unintended consequences (e.g. outcomes, such as caregiving quality, that worsen following the intervention).
Secondary outcomes
-
Infant social, emotional, cognitive, and motor development (e.g. Bayley Scales of Infant Development (BSID; Bayley 1969), Denver Developmental Screening Test (DDST; Frankenburg 1967), NBAS (motor and reflex items; Brazelton 1995), and McCarthy General Cognitive Index (GCI; McCarthy 1972)).
-
Infant physical health (e.g. anthropometric measures (see Cooper 2002), immunisation rates (see Koniak‐Griffin 2002), number of hospitalisations (see Koniak‐Griffin 2002), and health outcomes based on medical records (see Koniak‐Griffin 1999; Koniak‐Griffin 2000; Koniak‐Griffin 2003)).
-
Caregiver perception of infant (e.g. Broussard's Neonatal Perception Inventory (NPI; Broussard 1970)).
-
Caregiver stress (e.g. Parenting Stress Index (PSI; Abidin 1983)).
-
Caregiver reflective functioning (e.g. Parent Development Interview (PDI; Slade 2004)).
-
Caregiver satisfaction in the caregiving role (e.g. Myer's satisfaction estimation (Myers 1982b)).
-
Caregiver confidence, self‐efficacy, and self‐esteem in the caregiving role (e.g. Myer's confidence rating scale (Myers 1982b)).
-
Caregiver knowledge of infant behaviour (e.g. Maternal Developmental Expectations and Childrearing Attitudes Scale (MDECAS; Widmayer 1980).
Search methods for identification of studies
Electronic searches
Using the strategies in Appendix 1, we searched the electronic databases and trial registers listed below with no restrictions based on date of publication, language or publication status. We ran our initial searches in March 2015 and updated them in September 2016 and September 2017, except for the trials registers, which we searched on 13 October 2017.
-
Cochrane Central Register of Controlled Trials (CENTRAL; 2017, Issue 8) in the Cochrane Library, and which includes the Cochrane Developmental, Psychosocial and Learning Problems Specialised Register (searched 14 September 2017).
-
MEDLINE Ovid (1946 to Week 37 2017).
-
Embase Ovid (1974 to Week 37 2017).
-
Cochrane Database of Systematic Reviews (CDSR; 2017, Issue 9) part of the Cochrane Library (searched 14 September 2017).
-
Database of Abstracts of Reviews of Effects (DARE; 2015, Issue 2) part of the Cochrane Library (searched 14 September 2017).
-
PsycINFO OVID (1806 to 14 September 2017).
-
CINAHL EBSCOhost (Cumulative Index to Nursing and Allied Health Literature; 1982 to 14 September 2017).
-
Science Citation Index Web of Science (SCI; 1970 to 14 September 2017).
-
Social Sciences Citation Index Web of Science (SSCI; 1970 to 14 September 2017).
-
Conference Proceedings Citation Index ‐ Science Web of Science (CPCI‐S; 1990 to 14 September 2017).
-
Conference Proceedings Citation Index ‐ Social Science & Humanities Web of Science (CPCI‐SS&H; 1990 to 14 September 2017).
-
BIOSIS (ISI) Web of Science (1969 to 12 September 2017; searched 14 September 2017).
-
ERIC EBSCOhost (Education Resources Information Center; 1966 to 14 September 2017).
-
SCOPUS Elsevier (1996 to 14 September 2017).
-
Sociological Abstracts ProQuest (1952 to 14 September 2017).
-
LILACS (Latin American and Caribbean Health Science Information database; lilacs.bvsalud.org/en; 1982 to 14 September 2017).
-
ClinicalTrials.gov (clinicaltrials.gov; searched 13 October 2017).
-
ISTRN (www.isrctn.com; searched 13 October 2017).
-
UK Clinical Research Network Study Portfolio (public.ukcrn.org.uk; searched 13 October 2017).
-
World Health Organisation International Clinical Trials Registry Platform (WHO ICTRP; who.int/ictrp/en; searched 13 October 2017).
Searching other resources
We also:
-
scanned reference lists of relevant reports identified through database searches to identify further relevant studies;
-
ran forward citation searches for relevant studies;
-
scanned bibliographies of systematic and non‐systematic reviews, plus the NBAS and NBO training manuals to identify relevant studies; and
-
contacted the Brazelton Institute and searched brazelton.co.uk and brazelton‐institute.com, to identify unpublished and ongoing studies.
Data collection and analysis
Selection of studies
Two review authors (JB and CBT) independently screened titles and abstracts of studies identified through electronic searches, to assess whether they met the inclusion criteria (see Criteria for considering studies for this review), and they excluded clearly irrelevant abstracts. Next, both review authors independently screened full‐text copies of reports that appeared to meet the inclusion criteria or for which more information was needed to decide on eligibility. We resolved any uncertainties by discussion with NH. CBT documented the search and selection processes, recording decisions in a PRISMA flow chart (Moher 2009).
Data extraction and management
NH extracted data from included studies using a piloted data extraction form and entered the data into Review Manager 5 (RevMan 5) (RevMan 2014). JB checked the data extraction, and the review authors resolved any uncertainties by discussion with a third review author (CBT). We contacted authors of studies that were not written in English to request a copy or the required information in English. We examined all relevant retraction statements and errata (Higgins 2016).
We extracted information on the following: study funding source, declarations of conflict of interest of the primary investigators, participant demographics, duration and content of each session, number of sessions, study design, group allocation, sample size, outcomes measured (and their validity, reliability, time points for assessment, and whether researchers were blinded), participant attrition, and results.
We assessed the extent to which studies had reported whether confounding factors may have influenced the results and to which these had been controlled for in the primary analysis: caregiver age, education, income or socioeconomic status, marital status, parity; and age and sex of infant (see also Dealing with missing data section).
Assessment of risk of bias in included studies
NH independently assessed the risk of bias of the included studies, using the Cochrane 'Risk of bias' assessment tool (Higgins 2017), across the following domains: sequence generation, allocation concealment, blinding of participants and personnel, blinding of outcome assessment, incomplete outcome data, selective outcome reporting, and other sources of bias. JB checked this process. We resolved differences in consultation with CBT.
For each included study, we described and assessed each domain as being at low, high or unclear risk of bias, with justification for these judgments (see also Dealing with missing data section). We list the 'Risk of bias' domains that we assessed in Appendix 2.
Measures of treatment effect
Dichotomous outcome data
Only one study reported dichotomous outcome data for one standardised measure (i.e. depression). We presented this outcome using the risk ratio (RR) and 95% confidence intervals (CI).
Continuous outcome data
All included studies measured at least one outcome using standardised tools that provided continuous data (i.e. means and standard deviations). We analysed the data using the standardised mean difference (SMD). We calculated the SMD by dividing the mean difference (MD) in postintervention scores between the intervention and control groups by the standard deviation of the outcome among participants. We presented the SMD with 95% CI for individual outcomes in individual studies. Where these data were not available, we presented significance levels as reported in the paper.
Unit of analysis issues
We did not encounter any unit‐of‐analysis issues. Please see Bartram 2016 and Table 1.
| Unit of analysis issues | Cluster‐randomised trials The randomisation of clusters can result in an overestimate of the precision of the results (with a higher risk of a type I error) when their use has not been compensated for in the analysis. Had we included a cluster‐RCT, we planned to explore whether the authors had adequately controlled for the effects of clustering in the study. When they had, and when there was little difference between the study designs, and when there was unlikely to be an interaction between the effect of the intervention and the choice of randomisation method, we planned to combine the data from the cluster‐RCT with data from individual RCTs. When the effects of clustering had not been controlled for properly, we planned to derive an estimate of the intracluster correlation coefficient (ICC) from the study or that of a similar population, and to report whether an ICC had been used and conduct sensitivity analyses to determine the effect of using an ICC. We also planned to assess the impact of including data from a cluster‐RCT on the inclusion of the study in the meta‐analyses using a sensitivity analysis to explore the effects of the randomisation method. However, no cluster RCTs were identified or included. |
| Trials with multiple treatments groups In the event that we had identified a multi‐arm study in which the NBAS and NBO had been compared with an alternative treatment and a control group, we planned to only extract data from two arms (e.g. NBAS and control group). In the event that we had identified a multi‐arm study in which the NBAS had been compared with the NBO and involved only one control group, we planned to combine the data from the NBAS and NBO arms for primary analyses and to conduct secondary, subgroup analyses and split the control group data. However, we identified no multiple treatment groups. | |
| Cross‐over trials Cross‐over trials are not possible with this type of intervention, and none were identified. | |
| Assessment of reporting bias | We planned to draw funnel plots (estimated differences in treatment effects against their standard error) if there was a sufficient number of included studies (e.g. more than 10), to identify asymmetry due to publication bias and other small study effects. We also planned to assess whether there had been selective reporting of outcomes and to assess the impact of this using a sensitivity analysis. However, there were insufficient studies to undertake this analysis. |
| Subgroup analysis and investigation of heterogeneity | We planned to explore possible reasons for heterogeneity by undertaking the following, additional subgroup analyses, scrutinising studies to determine the extent of between‐trial differences.
However, it was only possible to undertake subgroup analysis for NBAS versus NBO, due to the small number of studies. |
| Sensitivity analysis | We planned to conduct sensitivity analyses on the basis of method of sequence generation only, to assess the robustness of the results, but this was not possible due to the small number of studies. |
NBAS: Neonatal Behavioral Assessment Scale; NBO: Newborn Behavioral Observations system; RCT: randomised controlled trial.
Dealing with missing data
When appropriate, we contacted study authors to request missing data. When we were unable to obtain them, we reported the available data only. We did not use imputation because the data were not presented in a suitable format (i.e. only the results of t‐tests of ANOVA's were provided).
We described the extent of the missing data and attrition for each included study and reported our findings in the 'Risk of bias' tables, beneath the Characteristics of included studies tables. We also reported the number of participants included in the final analysis as a proportion of all participants in each study. We provided a narrative summary of the reasons for missing data in the Results section, where we considered their possible impact on the results of the review.
Assessment of heterogeneity
We assessed clinical and methodological heterogeneity by considering the extent of between‐trial differences, including methods, populations, interventions or outcomes. We assessed statistical heterogeneity using the I2 statistic. The importance of the observed value of I2 depends on the magnitude and direction of effects and strength of evidence for heterogeneity (e.g. P value from the Chi2 test, or a CI for I2) (Higgins 2002). An I2 with a significance level less than 0.10 is treated as evidence of heterogeneity. We also reported the estimate of between‐study variance for each meta‐analysis using Tau2 – an absolute measure of heterogeneity.
Assessment of reporting biases
We were unable to assess reporting biases. Please see Bartram 2016 and Table 1.
Data synthesis
We combined data for each outcome across studies using both the NBAS and the NBO, as these interventions were clinically homogenous enough in terms of their populations, methods of delivery and the outcomes assessed, to justify this procedure (Higgins 2016). We used the random‐effects model, weighted by the inverse of the variance for continuous data and the Mantel‐Haenszel method for dichotomous data, because we found high levels of variation in the results, possibly because the studies took place over a 30‐year period. When it was not possible to combine data, we presented results from single studies (i.e. individual effect sizes and 95% CI).
Subgroup analysis and investigation of heterogeneity
We explored possible reasons for heterogeneity by undertaking a subgroup analysis comparing one outcome (i.e. sensitivity) across the two different models of provision (i.e. NBAS versus NBO). No further subgroup analyses were possible. Please see Bartram 2016 and Table 1.
Sensitivity analysis
We were unable to conduct any of our preplanned sensitivity analyses. Please see Bartram 2016 and Table 1.
Summary of findings table
We applied the five GRADE considerations (limitations, effect consistency, imprecision, indirectness and publication bias) to the body of evidence for each outcome to assess its quality (Higgins 2016). When necessary, we downgraded the quality of the evidence by reducing the rating one or two levels for each factor, three levels being the maximum number of downgrades possible. The potential ratings for RCTs are listed below (Higgins 2016).
-
High quality: randomised trials.
-
Moderate quality: downgraded randomised trials.
-
Low quality: double‐downgraded randomised trials.
-
Very low quality: triple‐downgraded randomised trials.
JB and NH assessed the quality of the body of evidence for each of the following outcomes: quality of caregiver‐infant interaction; caregiver mental health; infant social, emotional, cognitive development; caregiver perception of infant; caregiver stress, and caregiver knowledge. We presented these outcomes and their ratings in summary of findings Table for the main comparison, which we created using GRADEpro GDT (GRADEpro GDT 2015), for the following comparison: NBAS/NBO versus control for caregiver‐infant interaction, caregiver mental health, and caregiver functioning.
Results
Description of studies
Results of the search
In total, our searches yielded 9889 records, from which we identified and eliminated 2843 duplicates. Of the 7046 remaining records, we identified 40 as potentially relevant. We obtained the full texts of these records and reviewed them against our inclusion criteria (Criteria for considering studies for this review). We excluded 24 studies and included 16 (see Characteristics of included studies; Characteristics of excluded studies). We also identified three ongoing studies through contact with the Brazelton Centre (See 'Ongoing studies' below) (NCT03070652; Nicolson 2016; Nugent 2016).
See Figure 1.
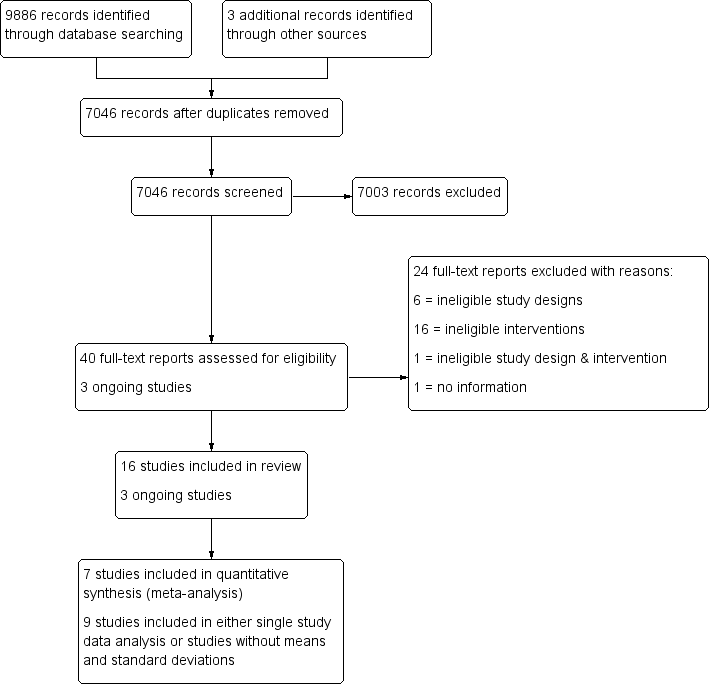
Study flow diagram.
Included studies
This review includes 16 studies (Anderson 1981; Beal 1989; Beeghly 1995a; Belsky 1985; Britt 1994; Furr 1982; Killough 2004; Liptak 1983; McManus 2012; Myers 1982a; Nugent 2014; Nugent 2015; Pannabecker 1982; Poley‐Strobel 1987; Szajnberg 1987; Worobey 1982). We provide further details about the included studies below and in the Characteristics of included studies tables.
Design
All 16 included studies were randomised controlled trials (RCTs). None of the included studies utilised a cluster design.
Ten studies were two‐arm comparisons of the NBAS or NBO against a single control group (Beal 1989; Beeghly 1995a; Belsky 1985; Killough 2004; McManus 2012; Myers 1982a; Nugent 2014; Nugent 2015; Poley‐Strobel 1987; Szajnberg 1987). The remaining six studies utilised more than one control/condition group (Anderson 1981; Britt 1994; Furr 1982; Liptak 1983; Pannabecker 1982; Worobey 1982).
Of the 10 studies that used only two conditions, control conditions in six studies consisted of treatment‐as‐usual (Killough 2004; McManus 2012; Nugent 2014; Nugent 2015; Poley‐Strobel 1987; Szajnberg 1987), in one the use of the NBAS in the physical absence of a caregiver (Beeghly 1995a), and in one the NBAS without involvement of the caregiver (Beal 1989); one study, Myers 1982a, had two intervention groups (mother treatment, father treatment) and one control group; and one study, Belsky 1985, had two intervention groups (mother treatment, mother and father treatment) and two control groups (mother control, mother and father control).
The six studies with more than one control group were as follows. Anderson 1981 had two control groups in addition to the experimental group. In one group, NBAS was performed on infants, but mothers did not receive immediate feedback and instead were offered a class on infant furnishings; for the second group, NBAS was performed on the infants and, following each assessment, the investigator met with the mother and explained the assessment. We included the first control condition in our analysis. Britt 1994 used three groups in addition to the NBAS group. In one group, the examiner talked with the mother about her baby; in the second group, mothers received a questionnaire assessment of the NBAS to complete; and the third group underwent an NBAS assessment of the baby as usual plus a questionnaire assessment. Our analysis included the control group where the experimenter talked with the mother about her baby. The remaining four studies did not provide means and standard deviations, so we presented data for all groups from analyses of variances (ANOVAs), which cannot be disaggregated for control group. In Furr 1982, the mothers were assigned to three other groups in addition to the intervention, which was maternal orientation to newborn behaviour using the Infant Behaviour Assessment Record (IBAR) derived from NBAS. In one group, feeding was observed on day two and IBAR derived from NBAS was then obtained; in the second group a feeding observation was carried out on the second day; the third group did not receive feeding observation or IBAR derived from NBAS. In Pannabecker 1982, the first control group was shown a videotape of a typical normal newborn, whereas the second control group received no educational information and no extra contact with their infants. Worobey 1982 had two control groups: for one group, immediately after the behavioural assessment of the newborn, the mother received a verbal summary of her infant's performance; for the second group, mothers observed a demonstration of NBAS on their newborns and were given the opportunity to talk about what they were seeing. In Liptak 1983, one control group of infants received the usual newborn care in the absence of parents, and the other control group infants received usual newborn care along with complete physical examination of baby in front of the mother.
Years of publication
Most studies were old in the sense that they took place between 1981 and 1995. Only four studies were more recent (Killough 2004; McManus 2012; Nugent 2014; Nugent 2015).
Setting
All included studies took place in a single centre in the USA.
Sample sizes
There was considerable variation in sample size between studies. Altogether the 16 included studies initially randomised 851 participants, with sample sizes ranging from 20 in Poley‐Strobel 1987 to 125 in Beeghly 1995a (mean N = 53.2 and median N = 43).
Recruitment
All participants were recruited from maternity wards in both rural and urban community settings. They included prenatal mothers (Belsky 1985), mothers postdelivery (Anderson 1981; Beeghly 1995a; Britt 1994; Furr 1982; Killough 2004; Liptak 1983; McManus 2012; Myers 1982a; Nugent 2014; Nugent 2015; Poley‐Strobel 1987; Szajnberg 1987; Worobey 1982), fathers who were present during labour and delivery (Beal 1989), and parents attending pre‐ and postnatal classes (Pannabecker 1982).
The intervention was initially delivered in a newborn nursery (Beeghly 1995a), mother's hospital room/anteroom (Anderson 1981; Beal 1989; Myers 1982a; Nugent 2014; Nugent 2015), a specially designated room (Belsky 1985), an unspecified place in the hospital (Britt 1994; Furr 1982; Killough 2004; Liptak 1983; Pannabecker 1982; Szajnberg 1987; Worobey 1982), or at home (McManus 2012; Poley‐Strobel 1987).
Participants
An inclusion criterion was that participants were all caregivers and infants eligible to receive the NBAS or NBO system. In 11 studies participants were mothers (Anderson 1981; Beeghly 1995a; Britt 1994; Furr 1982; Killough 2004; Liptak 1983; Nugent 2014; Nugent 2015; Poley‐Strobel 1987; Szajnberg 1987; Worobey 1982); 2 studies recruited fathers (Beal 1989; Pannabecker 1982); 2 studies, both parents as a couple (Belsky 1985; McManus 2012); and one study, mothers and fathers separately (Myers 1982a).
Seven studies included primiparous mothers (Anderson 1981; Furr 1982; Killough 2004; Liptak 1983; Nugent 2014; Nugent 2015; Poley‐Strobel 1987). Two studies included first‐time couples, although Myers 1982a included them separately, while Belsky 1985 included some couples and some mothers only. One study, McManus 2012, included both parents but did not describe their parity, and another, Britt 1994, included women who were abusing drugs irrespective of parity. Two studies included fathers: one specified including first‐time fathers (Beal 1989), and the second did not describe parity (Pannabecker 1982). Three studied did not describe mothers' parity (Beeghly 1995a; Szajnberg 1987; Worobey 1982).
The sex of participating infants was not specified in nine studies (Beal 1989; Belsky 1985; Britt 1994; Furr 1982; Liptak 1983; Nugent 2014; Nugent 2015; Pannabecker 1982; Szajnberg 1987). In six studies participating infants included both boys and girls (Beeghly 1995a; Killough 2004; McManus 2012; Myers 1982a; Poley‐Strobel 1987; Worobey 1982). One study included only female infants (Anderson 1981).
In 12 studies the age of participating infants was four days or less (Anderson 1981; Beal 1989; Beeghly 1995a; Belsky 1985; Furr 1982; Killough 2004; Myers 1982a; Nugent 2014; Nugent 2015; Pannabecker 1982; Poley‐Strobel 1987; Worobey 1982); age was less than 12 weeks in one study, McManus 2012, and less than 34 weeks gestational age in another (Szajnberg 1987). Two studies did not describe the age of the infant (Britt 1994; Liptak 1983).
The infants were full‐term and clinically normal in 10 studies (Anderson 1981; Furr 1982; Killough 2004; Liptak 1983; Myers 1982a; Nugent 2014; Nugent 2015; Pannabecker 1982; Poley‐Strobel 1987; Worobey 1982). In one study, Beeghly 1995a, half of the infants were small for gestational age (SGA) at the time of delivery and half were average for gestational age (AGA). In another study, Szajnberg 1987, infants of 28 to 32 weeks appropriate for gestational age were included when they reached 34 weeks. Infants were developmentally delayed in one study (McManus 2012), and in one study, Belsky 1985, perinatal assessment for neonatal functioning was insignificant. In two studies, details regarding the clinical presentation of the infant were not provided (Beal 1989; Britt 1994).
Interventions
We grouped the interventions into two categories: NBAS and NBO.
NBAS
Thirteen studies evaluated the effectiveness of NBAS (Anderson 1981; Beal 1989; Beeghly 1995a; Belsky 1985; Britt 1994; Furr 1982; Killough 2004; Liptak 1983; Myers 1982a; Pannabecker 1982; Poley‐Strobel 1987; Szajnberg 1987; Worobey 1982). Five studies involved demonstration only (Anderson 1981; Beal 1989; Liptak 1983; Poley‐Strobel 1987; Szajnberg 1987), and the remainder involved the parents as participants (Beeghly 1995a; Belsky 1985; Britt 1994; Furr 1982; Killough 2004; Myers 1982a; Pannabecker 1982; Worobey 1982).
NBO
Three studies evaluated the effectiveness of NBO, which was administered in the presence of the caregiver (McManus 2012; Nugent 2014; Nugent 2015).
Frequency and duration of the intervention
Nine studies administered the intervention only once (Anderson 1981; Beal 1989; Belsky 1985; Britt 1994; Furr 1982; Liptak 1983; Myers 1982a; Szajnberg 1987; Worobey 1982); five studies, twice (Killough 2004; Nugent 2014; Nugent 2015; Pannabecker 1982; Poley‐Strobel 1987); one study, three times (Beeghly 1995a); and one study, seven times (McManus 2012).
Seven studies did not describe the duration of intervention (Beal 1989; Belsky 1985; Britt 1994; Killough 2004; McManus 2012; Poley‐Strobel 1987; Szajnberg 1987). It was 30 minutes or less in five studies (i.e. 20 minutes in Liptak 1983; 12 to 25 minutes in Nugent 2014 and Nugent 2015; and 30 minutes in Furr 1982 and Pannabecker 1982), and about 45 to 60 minutes in four studies (i.e. about 45 minutes in Anderson 1981, Beeghly 1995a, and Worobey 1982; and 45 to 60 minutes in Myers 1982a).
Outcomes
Primary outcome measures
Quality of caregiver‐infant interaction
Thirteen studies assessed the impact of the NBAS or NBO on caregiver‐child interaction, using the scales listed below.
-
Anderson 1981 used the Price Adaptation Scale (PrAS; Price 1977).
-
Beeghly 1995a used the Maternal Sensitivity Scale (MSS; Barett 1988).
-
Belsky 1985 used the Reciprocal Interaction Measure (RIM: Belsky 1984).
-
Britt 1994 and Furr 1982 used the Nursing Child Assessment Feeding Scale (NCAFS; Barnard 1978; Sumner 1994).
-
Killough 2004 and Nugent 2015 used the CARE‐Index (Crittenden 2001).
-
Liptak 1983 used the Ainsworth Interaction Scale (AIS; Ainsworth 1971).
-
McManus 2012 used the Home Visiting Index (HVI; Nugent 2003).
-
Myers 1982a assessed the infant's state (asleep, quiet‐alert or fussing‐crying) and the presence or absence of caregiver behaviours (looks on face; talks to infant; smiles, touches or positions infant) every 10 seconds for 10 minutes.
-
Pannabecker 1982 used a list of behaviours (coding of behaviours using Klaus 1972 and Richard 1972 checklists).
-
Poley‐Strobel 1987 used the Assessment of Mother Infant Sensitivity (AMIS; Price 1983).
-
Worobey 1982 observed 16 behaviour categories using a pre‐coded checklist.
Caregiver mental health
-
Nugent 2014 assessed caregiver mental health using the Edinburgh Postnatal Depression Scale (EPDS; Cox 1987).
Secondary outcome measures
Infant social, emotional, cognitive and motor development
-
Beeghly 1995a and Szajnberg 1987 assessed infant development using the Bayley Scales of Infant Development (BSID; Bayley 1969).
Caregiver perception of infant
Four studies assessed the impact of the NBAS or NBO on caregiver perceptions of the infant.
-
Beal 1989 used the Infant Characteristic Questionnaire (ICQ; Bates 1979).
-
Myers 1982a and Liptak 1983 used the Neonatal Perception Inventory (NPI; Broussard 1970; Broussard 1971).
-
Szajnberg 1987 used the Carey Infant Temperament Questionnaire (ITQ; Carey 1978).
Caregiver stress
Two studies assessed the impact of the NBAS or NBO on caregiver stress.
-
Beeghly 1995a used the Parenting Stress Index (PSI; Abidin 1983).
-
Liptak 1983 used the Modified Degree of Bother Scale (DBS; Liptak 1977).
Caregiver reflective functioning
-
Killough 2004 assessed caregiver reflective functioning using the Maternal Representations Questionnaire (MRQ: Stern 1998).
Caregiver confidence, self‐efficacy and self‐esteem in the caregiving role
-
Poley‐Strobel 1987 assessed caregiver confidence using the Self‐Confidence Scales (SCS; Seashore 1973), which comprise paired‐comparison questionnaires in which the caregiver compares herself with five other possible caretakers.
Caregiver knowledge of infant behaviour
Two studies assessed the impact of the NBAS or NBO on caregiver knowledge of infant behaviour.
-
Myers 1982a used a set of 15 multiple‐choice, factual questions related to infants' physical capacities, including reflexes and senses.
-
Poley‐Strobel 1987 assessed maternal knowledge about infant behaviour using the Mother's Assessment of the Behaviour of her Infant scale (MABI; Field 1978).
No study assessed adverse effects, infant physical health or caregiver satisfaction in the caregiving role.
Excluded studies
We excluded 24 studies (in 24 reports) from this review, which are summarised in the Characteristics of excluded studies tables. The main reason for exclusion was that the NBAS/NBO was not used in isolation but as part of a wider intervention (10 studies: Cooper 2009; Golas 1986; Gomespedro 1995; Hart 1998; Nurcombe 1984; Ohgi 2004; Parker Loewen 1987; Teti 2009; Widmayer 1980; Widmayer 1981), or because they used variations of the NBAS but provided little further information (6 studies: Cardone 1990; Cooper 2015; Gomes 1987; Parker 1992; Sullivan 1980; Wendland Carro 1999). The remaining eight studies did not meet key inclusion criteria in that they were not RCTs, they included other intervention components, or both, or they did not provide sufficient information to make a judgment (Egeland 1984; Fowles 1999; Joshi 2013; Kiepura 2011; Kusaka 2007; Meisels 1993; Ogi 2001; Sanders 2006).
Ongoing studies
See Characteristics of ongoing studies.
We identified three ongoing studies (NCT03070652; Nicolson 2016; Nugent 2016). NCT03070652 is a cluster‐randomised trial assessing the effectiveness of the NBO (postbirth and over next three months) for improving interaction in with first‐time parents. Nicolson 2016 is an RCT of the effectiveness of the NBO (three sessions) for improving depression and mother‐infant interaction with first‐time parents. Nugent 2016 is an RCT examining the effectiveness of an NBO early intervention model of care for improving infant self‐regulation, parent‐infant interaction as well as maternal depression and socioemotional functioning in infants with developmental disabilities.
Risk of bias in included studies
We described and presented the risk of bias for each included study in the 'Risk of bias' tables, beneath the Characteristics of included studies. We also summarised our judgments about each risk of bias item for each included study below and graphically (see Figure 2 and Figure 3).

Risk of bias summary: review authors' judgments about each risk of bias item for each included study.

Risk of bias graph: review authors' judgments about each risk of bias item presented as percentages across all included studies.
Allocation
Random sequence generation
In terms of random sequence generation, we rated only five studies at low risk of bias due to their use of adequate methods of sequence generation (e.g. toss of a coin and cyclic rotating table of numbers) (Furr 1982; Myers 1982a; Nugent 2014; Szajnberg 1987; Worobey 1982). We judged the 10 remaining studies to be at unclear or high risk of bias.
Allocation concealment
Only one study carried out allocation concealment where the individual scheduling a prenatal visit had no knowledge of the group to which each family was assigned or that assignment was taking place at that time (Belsky 1985). Blinding was achieved by providing the scheduler with a packet of manila folders in a specified order. Each time a prenatal visit was scheduled, the top folder in the stack was selected and the family's name and address was placed on the folder. The folders had been precoded for treatment condition. The only person who knew the group assignment was the author, who did not collect any of the data. We judged this study to be at low risk of bias. The remaining 15 studies did not mention allocation concealment, so we judged these to be at unclear risk of bias.
Blinding
Performance bias
In trials of newborn behaviour programmes it is not possible to blind either facilitators or parents to the type of treatment being implemented or received, although in three studies caregivers were unaware of the presence of other treatment conditions (Belsky 1985; Myers 1982a; Worobey 1982). Nevertheless, we rated all studies as being at high risk of performance bias.
Detection bias
We judged 11 studies to be at low risk of detection bias because observer‐rated outcomes were double‐blinded (Anderson 1981; Beeghly 1995a; Belsky 1985; Britt 1994; Killough 2004; Liptak 1983; Myers 1982a; Nugent 2015; Pannabecker 1982; Poley‐Strobel 1987; Worobey 1982).
The remaining five studies did not involve independent assessment of outcomes (Beal 1989; Furr 1982; McManus 2012; Nugent 2014; Szajnberg 1987). In Beal 1989, the principal investigator carried out the NBAS demonstration as well as postpartum home visits, so we rated this study as being at high risk of detection bias. In Furr 1982, the investigator was singularly involved in all phases of data collection: randomly assigning the sample of mothers, pre‐testing, providing the behavioural orientation and post‐testing. In addition, it was difficult to determine the effect of investigator bias in scoring the post‐test feeding episodes, so we judged this study to be at high risk of detection bias as well. In McManus 2012, the assessment was conducted as part of the last home visit when the infant was three months of age, but it was not clear whether this was administered by the early intervention service provider or by the researcher. Consequently, we judged it to be at unclear risk of detection bias. Two studies, Nugent 2014 and Szajnberg 1987, did not describe whether assessment was blinded and therefore we considered them to be at unclear risk of detection bias also.
Incomplete outcome data
No attrition occurred in one study, Anderson 1981, which we rated as being at low risk of bias.
Eight studies reported attrition (Belsky 1985; Killough 2004; Liptak 1983; McManus 2012; Myers 1982a; Nugent 2014; Nugent 2015; Szajnberg 1987), ranging from 4% in Liptak 1983 to 20% in Szajnberg 1987. None of these studies undertook intention‐to‐treat analyses, and we judged all studies with more than 5% attrition to be at high risk of attrition bias (Belsky 1985; Killough 2004; McManus 2012; Nugent 2014; Nugent 2015; Szajnberg 1987).
Seven studies did not mention attrition or the use of an intention‐to‐treat analysis, so we judged these to be at unclear risk of bias (Beal 1989; Beeghly 1995a; Britt 1994; Furr 1982; Pannabecker 1982; Poley‐Strobel 1987; Worobey 1982)
Selective reporting
We judged all 16 studies to be at low risk for reporting bias because they reported all pre‐specified outcomes.
Other potential sources of bias
All studies were RCTs, so confounding was not a source of bias; furthermore, no included studies used the NBAS or NBO as part of another intervention. Some studies imposed other restrictions as inclusion and exclusion criteria. Britt 1994 targeted drug‐abusing mothers; Poley‐Strobel 1987 included only mothers with low socioeconomic status and their newborns without any perinatal complications; McManus 2012 and Szajnberg 1987 targeted preterm deliveries; Beal 1989 involved first‐time fathers; Pannabecker 1982 involved first‐time fathers and their healthy newborns; Anderson 1981, Furr 1982, Killough 2004, Liptak 1983, Nugent 2014 and Nugent 2015 involved first‐time mothers with their healthy newborn babies; Belsky 1985 and Myers 1982a targeted first‐time parents and their healthy infants; Beeghly 1995a and Worobey 1982 targeted full‐term, normal healthy newborns.
We judged 13 studies to be at low risk for other potential sources of bias and rated three studies at high risk of bias due to the involvement of the authors with the NBAS Institute (McManus 2012; Nugent 2014; Nugent 2015).
Effects of interventions
NBAS and NBO versus control
Primary outcomes
1. Quality of caregiver‐infant interaction
1.1 Meta‐analytic data
A meta‐analysis of data from seven studies revealed a statistically significant difference in caregiver‐interaction between intervention and control groups (SMD −0.53, 95% CI −0.90 to −0.17; 304 participants; Analysis 1.1; Anderson 1981; Beeghly 1995a; Britt 1994; Killough 2004; McManus 2012; Nugent 2015; Poley‐Strobel 1987). There was a moderate level of heterogeneity (Tau2 = 0.12; Chi2 = 12.23, df = 6, P = 0.06; I2 = 51%). We rated the quality of evidence as low because of methodological limitations in terms of blinding and allocation as well as follow‐up and dropout (see summary of findings Table for the main comparison).
1.2 Studies without means or standard deviations
Six studies did not provide sufficient data to calculate an effect size for caregiver‐infant interaction; two of these reported significant results (Furr 1982; Worobey 1982), and four indicated no significant difference between intervention and control conditions (Belsky 1985; Liptak 1983; Myers 1982a; Pannabecker 1982).
2. Caregiver mental health: single study data
Data from a single study, Nugent 2014, indicated no statistically significant difference in caregiver depression between intervention and control groups when measuring depression either as a continuous (SMD −0.28, 95% CI −0.66 to 0.10; 106 participants; Analysis 1.2) or dichotomous outcome (RR 0.23, 95% CI 0.05 to 1.04; 106 participants; 1 study; Analysis 1.3). We rated the quality of evidence as low because of methodological limitations in terms of blinding and allocation as well as follow‐up and dropout. See summary of findings Table for the main comparison.
3. Adverse effects or unintended consequences
No studies provided data on this outcome.
Secondary outcomes
1. Infant social, emotional, cognitive and motor development
1.1 Single study data
One study involving 125 participants, Beeghly 1995a, found no statistically significant differences between intervention and control groups for mental development (SMD −0.13, 95% CI −0.48 to 0.22) or psychomotor development (SMD −0.11, 95% CI −0.47 to 0.24). See Analysis 1.4. We rated the quality of evidence as low because of methodological limitations in terms of blinding and allocation as well as follow‐up and dropout, inconsistency for the main outcome due to high levels of heterogeneity for the NBAS; and indirectness in terms of the low levels of generalisability to wider risk groups within the population. See summary of findings Table for the main comparison.
1.2 Studies without means and standard deviations
One study reported no significant difference between intervention and control groups for infant development (Szajnberg 1987).
2. Infant physical health
No studies provided data on this outcome.
3. Caregiver perception of infant
3.1 Single study data
One study, Beal 1989, revealed no statistically significant difference in caregiver perceptions of the infant between intervention and control condition (SMD −0.36, 95% CI −0.95 to 0.24; 44 participants; Analysis 1.5). We rated the quality of evidence as low because of methodological limitations in terms of blinding and allocation as well as follow‐up and dropout, and indirectness in terms of the low levels of generalisability to wider risk groups within the population. See summary of findings Table for the main comparison.
3.2 Studies without means and standard deviations
Three studies did not provide sufficient data to calculate an effect size (Liptak 1983; Myers 1982a; Szajnberg 1987), two of which reported no significant differences between intervention and control groups in caregiver perceptions of the infant (Myers 1982a; Szajnberg 1987), and one of which provided inadequate information (Liptak 1983).
4. Caregiver stress
4.1 Single study data
One study involving 125 participants, Beeghly 1995a, found no statistically significant differences between intervention and control conditions for parent‐related (SMD 0.00, 95% CI −0.35 to 0.35) or child‐related stress (SMD 0.06, 95% CI −0.29 to 0.41). See Analysis 1.7. We rated the quality of evidence as low because of methodological limitations in terms of blinding and allocation as well as follow‐up and dropout, and indirectness in terms of the low levels of generalisability to wider risk groups within the population. See summary of findings Table for the main comparison.
4.2 Studies without means and standard deviations
One study reported no significant difference between intervention and control groups for caregiver stress (Liptak 1983).
5. Caregiver reflective functioning: studies without means and standard deviations
One study did not provide sufficient data to calculate an effect size for maternal reflective functioning and reported no statistically significant difference between the intervention and control groups (Killough 2004).
6. Caregiver satisfaction in the caregiving role
No studies provided data on this outcome.
7. Caregiver confidence, self‐efficacy and self‐esteem in the caregiving role: studies without means and standard deviations
One study reported no significant difference between intervention and control groups for caregiver confidence (Poley‐Strobel 1987).
8. Caregiver knowledge of infant behaviour
8.1 Single study data
One study, Myers 1982a, found a clear difference between intervention and control, favouring the NBAS/NBO group statistically for caregiver knowledge of infant behaviour (SMD −1.30, 95% CI −2.16 to −0.44; 26 participants; Analysis 1.6). We rated the quality of evidence as very low because of the use of a non‐standardised tool and methodological limitations in terms of blinding and allocation as well as follow‐up and dropout, and indirectness in terms of the low levels of generalisability to wider risk groups within the population. summary of findings Table for the main comparison.
8.2 Studies without means and standard deviations
One study reported no significant difference between the intervention and control groups for caregiver knowledge of infant behaviour (Poley‐Strobel 1987).
Two studies reported no significant difference between intervention and control group for caregiver attitude (Beal 1989; Szajnberg 1987).
Subgroup analysis: quality of caregiver‐infant interaction
Subgroup analyses for the NBAS (five studies) and the NBO (two studies) indicated a medium but insignificant effect size for the former (SMD −0.49, 95% CI −0.99 to −0.00; 231 participants), with high levels of heterogeneity (Tau2 = 0.18; Chi2 = 10.31, df = 4, P = 0.04; I2 = 61%), while the NBO produced a large and significant effect size (−0.69, 95% CI −1.18 to −0.20; 73 participants) with no heterogeneity (Tau2 = 0.00; Chi2 = 0.16, df = 1, P = 0.69; I2 = 0%). A test for subgroup differences gave a Chi2 statistic of 0.31 with an associated P value of 0.58, suggesting that there is no evidence for different intervention effects between these two subgroups. We also conducted a meta‐regression to check this result. The meta‐regression for the intervention type (NBAS or NBO) is estimated as −0.22 (95% CI −1.34 to 0.90), which confirms the results from testing the subgroup difference by using the Chi2 test.
Discussion
Summary of main results
We included 16 studies (N = 851) in this review: 13 evaluated the effectiveness of the NBAS (Anderson 1981; Beal 1989; Beeghly 1995a; Belsky 1985; Britt 1994; Furr 1982; Killough 2004; Liptak 1983; Myers 1982a; Pannabecker 1982; Poley‐Strobel 1987; Szajnberg 1987; Worobey 1982), and 3 evaluated the NBO (McManus 2012; Nugent 2014; Nugent 2015). All studies provided postintervention data, although only 10 studies provided the necessary means and standard deviations to calculate an effect size. Furthermore, of these 10 studies, only one, Myers 1982a, also provided further assessment at a later time point, so we do not report follow‐up data as part of this review. Meta‐analysis was possible for only one primary outcome – quality of caregiver‐infant interaction. Single study data were available to assess one other primary outcome – caregiver mental health – and a number of secondary outcomes: infant social, emotional, cognitive and motor development; caregiver perception of infant; caregiver stress; and caregiver knowledge of infant behaviour.
The results of the meta‐analysis suggest there was a difference in the quality of caregiver‐infant interaction between intervention and control groups, with moderate heterogeneity (SMD −0.53, 95% CI −0.90 to −0.17; low‐quality evidence; summary of findings Table for the main comparison). Although the effect size for the NBO was larger than that for the NBAS, results of a subgroup analysis found no statistically significant difference between the two models. This may reflect the small number of studies included in the meta‐analysis of the NBO, which was specifically developed as "a clinical relationship‐building tool, designed for pediatricians, nurses, infant mental health specialists, early intervention providers, home visitors and other allied health professionals, to help parents understand their baby's language" (www.brazeltontouchpoints.org/offerings/nbo‐and‐nbas), compared with the NBAS, which was developed as a neurobehavioural assessment tool. Nugent 2017 [pers comm] has described the NBO as: "an infant‐focused, family‐centered relationship‐based tool, designed to sensitize parents to their baby's competencies and individuality, in order to foster positive parent‐infant interactions and thus contribute to the development of the parent's confidence and to the quality of the parent‐infant relationship from the very beginning. It is conceived of as an interactive system in which parents play an active role in both the observations of their baby's behaviour and in the identification of appropriate caregiving strategies. Ideally, the NBO is used serially with the family across the first three months of life, in order to see how the baby is adapting to his or her new world and to enable the NBO practitioner to develop a relationship with the family". Although between‐group analysis showed no differences between the two models of intervention in terms of parent‐infant interaction, further studies of the NBO are needed to confirm this finding.
We conducted no meta‐analyses for any of the secondary outcomes due to an absence of suitable data for this purpose. Results from single studies did not show significant differences between intervention and control groups for the secondary outcomes of infant social, emotional, cognitive and motor development; caregiver perception of infant; or caregiver stress (low‐quality evidence). One study found a significant impact on the secondary outcome of caregiver knowledge (SMD −1.30, 95% CI −2.16 to −0.44; very low‐quality evidence).
Overall, this review did not find any evidence of adverse effects, in terms of deterioration in any of the outcomes measured.
Overall completeness and applicability of evidence
This review included data from 16 RCTs, many of which did not provide data appropriate for meta‐analysis, and our attempts to obtain the data from the authors were mostly unsuccessful, probably due to the fact that most studies were published in the 1980s and 1990s. Only three studies assessed the effectiveness of the NBO, and only two of these provided data amenable for pooling. Furthermore, most included studies were small, which may have had an impact on the power of the results and the confidence in the precision of the effect sizes. We also identified three ongoing RCTs of the effectiveness of the NBO on outcomes of relevance to the current review (NCT03070652; Nicolson 2016; Nugent 2016). This data will, in the long term, strengthen the overall analysis of the effectiveness of the NBO in particular.
Although the NBAS and NBO are highly standardised interventions in terms of their administration, the NBAS in particular was not designed as an intervention, and there is little guidance regarding wider aspects of their delivery with the result that the included studies varied in terms of the number of times that they were administered (i.e. ranging from one to four); the setting for administration (i.e. hospital or clinic; at home); whether the participant was the mother, father, or both; and the designation of the infant (e.g. preterm versus full‐term) and the parent (e.g. healthy and substance dependent). Generalisability is limited because all of the studies were conducted in the USA, and most of the participants were low‐risk dyads. As stated earlier, two‐thirds of the included studies were conducted in the 1980s and 1990s with only three studies being conducted since 2000.
Quality of the evidence
Using the GRADE approach, we rated the overall quality of the body evidence as low to very low (see summary of findings Table for the main comparison). The three main reasons for downgrading the quality of the evidence were risk of bias due to poor quality research (e.g. limitations in design, including inadequate randomisation or allocation procedures, together with attrition, which ranged from 4% to 20% in seven studies – none of which conducted an intention‐to‐treat analysis), inconsistency for the main outcome due to high levels of heterogeneity for the NBAS; and indirectness in terms of the low levels of generalisability to wider risk groups within the population.
Potential biases in the review process
Our literature searches and screening process conformed strictly to Cochrane criteria, as defined by our Methods, with the most recent search being conducted in September 2017. We conducted systematic searches across a large number of highly relevant databases, including trials registers, to identify both completed and ongoing trials. Two review authors independently screened potentially eligible studies for inclusion and assessed risk of bias in included studies. None of the review authors had any significant conflicts of interest. The review itself, however, was limited in that it was aimed at assessing whether the NBAS and NBO were sufficiently powerful to be conceived of as a single treatment(s) rather than as brief interventions used alongside other methods, and, as such, excluded studies in which their independent impact could not be assessed.
Agreements and disagreements with other studies or reviews
This is the first review that has examined the effectiveness of the NBO in addition to the NBAS, so it is different from earlier reviews. The results of the current review are, to some extent, consistent with earlier reviews (Britt 1994b; Das Eiden 1996; Worobey 1985), all of which produced evidence suggesting that the NBAS was effective; however, the findings of the current review are much more limited in terms of the outcomes showing a beneficial effect. All of the earlier reviews had significant methodological limitations. The earliest review only included studies that demonstrated effectiveness in at least one of its outcomes (Worobey 1985). The second was a narrative review only (Britt 1994b). The third conducted a meta‐analysis of 13 RCTs but produced an average global effect size for 'parenting quality' (i.e. combining conceptually distinct aspects of parenting), which found a small‐to‐moderate beneficial effect (Das Eiden 1996); it also included studies that we excluded because they used modified versions of the NBAS. Furthermore, the most recent of these reviews is now over 20 years old (Das Eiden 1996), although only a small number of studies have been conducted since then.
Risk of bias summary: review authors' judgments about each risk of bias item for each included study.
Risk of bias graph: review authors' judgments about each risk of bias item presented as percentages across all included studies.

Comparison 1 NBAS or NBO versus control, Outcome 1 Quality of caregiver‐infant interaction: postintervention.

Comparison 1 NBAS or NBO versus control, Outcome 2 Caregiver mental health (maternal depression): EPDS postintervention score.

Comparison 1 NBAS or NBO versus control, Outcome 3 Caregiver mental health (maternal depression): EPDS postintervention score (dichotomous data).

Comparison 1 NBAS or NBO versus control, Outcome 4 Infant social, emotional, cognitive and motor development.

Comparison 1 NBAS or NBO versus control, Outcome 5 Caregiver perception of infant.

Comparison 1 NBAS or NBO versus control, Outcome 6 Caregiver knowledge of infant behaviour (multiple choice factual questions).

Comparison 1 NBAS or NBO versus control, Outcome 7 Caregiver stress.
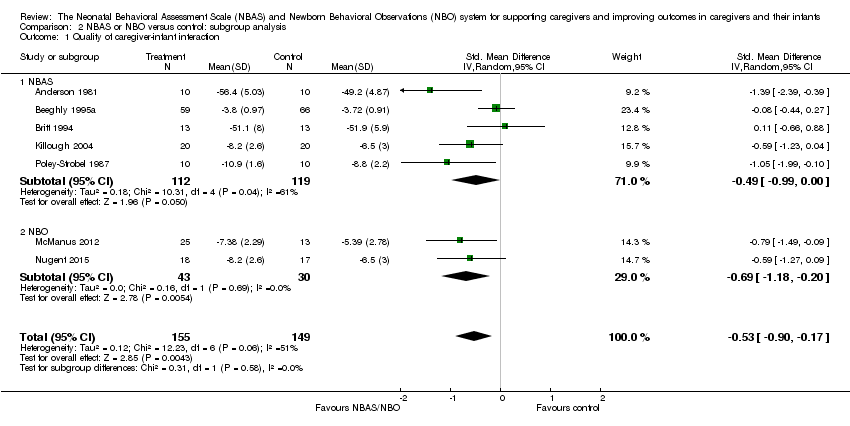
Comparison 2 NBAS or NBO versus control: subgroup analysis, Outcome 1 Quality of caregiver‐infant interaction.
| NBAS or NBO versus control for caregiver‐infant interaction, caregiver mental health, and caregiver functioning | |||||
| Patient or population: caregiver‐infant dyads Settings: hospitals, clinics, home Intervention: NBAS or NBO Comparison: NBAS or NBO administered with no interaction | |||||
| Outcomes | Illustrative comparative risks* (95% CI) | Relative effect | Number of participants | Quality of the evidence | |
| Assumed risk | Corresponding risk | ||||
| Control group | NBAS or NBO | ||||
| Quality of caregiver‐infant interaction (parental sensitivity, attunement, etc.); continuous data Assessed at postintervention using validated assessment scales for caregiver‐infant interaction: higher scores indicate better outcome | The mean score for quality of caregiver‐infant interaction ranged across control groups from 3.72 to 51.90 | The mean caregiver‐infant interaction score in the intervention groups was 0.53 lower (0.90 lower to 0.17 lower) | — | 304 | ⊕⊕⊝⊝ |
| Caregiver mental health (depression), dichotomous data Assessed at postintervention using the EPDS; lower scores indicate less depression | Low‐risk population | RR 0.23 (0.05 to 1.04) | 106 (1 study) | ⊕⊕⊝⊝ | |
| 157 per 1000 | 36 per 1000 (8 to 163) | ||||
| Medium‐risk population | |||||
| NA | NA | ||||
| High‐risk population | |||||
| NA | NA | ||||
| Infant social, emotional, cognitive and motor development Assessed when infant aged 4 months, using the BSID; higher scores indicate better development | The mean score for infant mental development in the control group was 107.83 | The mean score for infant mental development in the intervention groups was0.13 lower (0.48 lower to 0.22 higher) | — | 125 (1 study) | ⊕⊕⊝⊝ |
| Caregiver perception of infant (parents' perception of the degree of difficult temperament of the infant) Assessed at postintervention, 8 weeks after delivery; higher score indicates better outcome | The mean score for caregiver perception of infant in the control group was 18.90 | The mean score for caregiver perception of the infant in the intervention group was 0.36 lower (0.95 lower to 0.24 higher) | — | 44 (1 study) | ⊕⊕⊝⊝ |
| Caregiver stress (maternal perceptions of her adjustment to the parenting role) Assessed when infant aged 4 months, using the PSI | The mean score for parent‐related caregiver stress in the control group was 2.19 | The mean score for parent‐related caregiver stress in the intervention groups was0.00 (0.35 lower to 0.35 higher) | — | 125 (1 study) | ⊕⊕⊝⊝ |
| Caregiver knowledge (related to infants' physical capacities, including reflexes and senses) Assessed at postintervention, using multiple choice factual questions; higher scores indicate better outcome | The mean score for caregiver knowledge in the control groups was8.30 | The mean score for caregiver knowledge in the intervention groups was 1.30 higher (0.44 to 2.16 higher) | — | 26 (1 study) | ⊕⊕⊝⊝ |
| *The basis for the assumed risk (e.g. the median control group risk across studies) is provided in footnotes. The corresponding risk (and its 95% CI) is based on the assumed risk in the comparison group and the relative effect of the intervention (and its 95% CI). | |||||
| GRADE Working Group grades of evidence | |||||
| 1Downgraded due to risk of bias due to poor quality research (e.g. limitations in design, including inadequate randomisation or allocation procedures, together with attrition, which ranged from 4% to 20% in seven studies – none of which conducted an intention‐to‐treat analysis), inconsistency for the main outcome due to high levels of heterogeneity for the NBAS; and indirectness in terms of the low levels of generalisability to wider risk groups within the population. 2Downgraded due to risk of bias due to poor quality research (e.g. limitations in design, including inadequate randomisation or allocation procedures, together with attrition, which ranged from 4% to 20% in seven studies – none of which conducted an intention‐to‐treat analysis), and indirectness in terms of the low levels of generalisability to wider risk groups within the population. | |||||
| Unit of analysis issues | Cluster‐randomised trials The randomisation of clusters can result in an overestimate of the precision of the results (with a higher risk of a type I error) when their use has not been compensated for in the analysis. Had we included a cluster‐RCT, we planned to explore whether the authors had adequately controlled for the effects of clustering in the study. When they had, and when there was little difference between the study designs, and when there was unlikely to be an interaction between the effect of the intervention and the choice of randomisation method, we planned to combine the data from the cluster‐RCT with data from individual RCTs. When the effects of clustering had not been controlled for properly, we planned to derive an estimate of the intracluster correlation coefficient (ICC) from the study or that of a similar population, and to report whether an ICC had been used and conduct sensitivity analyses to determine the effect of using an ICC. We also planned to assess the impact of including data from a cluster‐RCT on the inclusion of the study in the meta‐analyses using a sensitivity analysis to explore the effects of the randomisation method. However, no cluster RCTs were identified or included. |
| Trials with multiple treatments groups In the event that we had identified a multi‐arm study in which the NBAS and NBO had been compared with an alternative treatment and a control group, we planned to only extract data from two arms (e.g. NBAS and control group). In the event that we had identified a multi‐arm study in which the NBAS had been compared with the NBO and involved only one control group, we planned to combine the data from the NBAS and NBO arms for primary analyses and to conduct secondary, subgroup analyses and split the control group data. However, we identified no multiple treatment groups. | |
| Cross‐over trials Cross‐over trials are not possible with this type of intervention, and none were identified. | |
| Assessment of reporting bias | We planned to draw funnel plots (estimated differences in treatment effects against their standard error) if there was a sufficient number of included studies (e.g. more than 10), to identify asymmetry due to publication bias and other small study effects. We also planned to assess whether there had been selective reporting of outcomes and to assess the impact of this using a sensitivity analysis. However, there were insufficient studies to undertake this analysis. |
| Subgroup analysis and investigation of heterogeneity | We planned to explore possible reasons for heterogeneity by undertaking the following, additional subgroup analyses, scrutinising studies to determine the extent of between‐trial differences.
However, it was only possible to undertake subgroup analysis for NBAS versus NBO, due to the small number of studies. |
| Sensitivity analysis | We planned to conduct sensitivity analyses on the basis of method of sequence generation only, to assess the robustness of the results, but this was not possible due to the small number of studies. |
| NBAS: Neonatal Behavioral Assessment Scale; NBO: Newborn Behavioral Observations system; RCT: randomised controlled trial. | |
| Outcome or subgroup title | No. of studies | No. of participants | Statistical method | Effect size |
| 1 Quality of caregiver‐infant interaction: postintervention Show forest plot | 7 | 304 | Std. Mean Difference (IV, Random, 95% CI) | ‐0.53 [‐0.90, ‐0.17] |
| 2 Caregiver mental health (maternal depression): EPDS postintervention score Show forest plot | 1 | Std. Mean Difference (IV, Random, 95% CI) | Subtotals only | |
| 3 Caregiver mental health (maternal depression): EPDS postintervention score (dichotomous data) Show forest plot | 1 | Risk Ratio (M‐H, Fixed, 95% CI) | Totals not selected | |
| 4 Infant social, emotional, cognitive and motor development Show forest plot | 1 | Std. Mean Difference (IV, Random, 95% CI) | Totals not selected | |
| 4.1 BSID: mental development | 1 | Std. Mean Difference (IV, Random, 95% CI) | 0.0 [0.0, 0.0] | |
| 4.2 BSID: psychomotor development | 1 | Std. Mean Difference (IV, Random, 95% CI) | 0.0 [0.0, 0.0] | |
| 5 Caregiver perception of infant Show forest plot | 1 | Std. Mean Difference (IV, Random, 95% CI) | Subtotals only | |
| 6 Caregiver knowledge of infant behaviour (multiple choice factual questions) Show forest plot | 1 | Std. Mean Difference (IV, Random, 95% CI) | Totals not selected | |
| 7 Caregiver stress Show forest plot | 1 | Std. Mean Difference (IV, Random, 95% CI) | Totals not selected | |
| 7.1 PSI: parent‐related sources of stress | 1 | Std. Mean Difference (IV, Random, 95% CI) | 0.0 [0.0, 0.0] | |
| 7.2 PSI: child‐related sources of stress | 1 | Std. Mean Difference (IV, Random, 95% CI) | 0.0 [0.0, 0.0] | |
| Outcome or subgroup title | No. of studies | No. of participants | Statistical method | Effect size |
| 1 Quality of caregiver‐infant interaction Show forest plot | 7 | 304 | Std. Mean Difference (IV, Random, 95% CI) | ‐0.53 [‐0.90, ‐0.17] |
| 1.1 NBAS | 5 | 231 | Std. Mean Difference (IV, Random, 95% CI) | ‐0.49 [‐0.99, ‐0.00] |
| 1.2 NBO | 2 | 73 | Std. Mean Difference (IV, Random, 95% CI) | ‐0.69 [‐1.18, ‐0.20] |