Intervenciones farmacológicas para la colangitis biliar primaria
Resumen
Antecedentes
La colangitis biliar primaria (previamente denominada cirrosis biliar primaria) es una enfermedad hepática crónica causada por la destrucción de los conductos biliares intrahepáticos pequeños que da lugar a estasis de la bilis (colestasis), fibrosis hepática y cirrosis hepática. Aún no se conoce el tratamiento farmacológico óptimo para la colangitis biliar primaria.
Objetivos
Evaluar los efectos beneficiosos y perjudiciales comparativos de diferentes intervenciones farmacológicas en el tratamiento de la colangitis biliar primaria mediante un metanálisis de redes y generar jerarquizaciones de las intervenciones farmacológicas disponibles según su seguridad y eficacia. Sin embargo, no se pudo evaluar si los posibles modificadores del efecto fueron similares en las diferentes comparaciones. Por lo tanto, no se realizó el metanálisis en red. En su lugar se evaluaron los efectos beneficiosos y perjudiciales comparativos de diferentes intervenciones con la metodología Cochrane estándar.
Métodos de búsqueda
Se realizaron búsquedas en el Registro Cochrane Central de Ensayos Controlados (Cochrane Central Register of Controlled Trials, CENTRAL; 2017, Número 2), MEDLINE, Embase, Science Citation Index Expanded, la Plataforma de registros internacionales de ensayos clínicos de la Organización Mundial de la Salud y en los registros de ensayos controlados aleatorizados hasta abril de 2017 para identificar ensayos clínicos aleatorizados sobre intervenciones farmacológicas para la colangitis biliar primaria.
Criterios de selección
Se incluyeron solo ensayos clínicos aleatorizados (independientemente del idioma, el cegamiento, o el estado de publicación) con participantes con colangitis biliar primaria. Se excluyeron los ensayos en los que los participantes incluidos se habían sometido previamente a trasplante hepático. Se tuvieron en cuenta las diversas intervenciones farmacológicas comparadas entre sí, con placebo o con ninguna intervención.
Obtención y análisis de los datos
Se utilizaron los procedimientos metodológicos estándar previstos por Cochrane. Se calculó la odds ratio (OR) y el cociente de tasas con los intervalos de confianza (IC) del 95%, utilizando los modelos de efectos fijos y aleatorios basados en el análisis de pacientes disponibles con Review Manager 5. Se evaluó el riesgo de sesgo según Cochrane, se controló el riesgo de errores aleatorios con el Análisis Secuencial de Ensayos y se evaluó la calidad de la evidencia con la metodología GRADE.
Resultados principales
Se identificaron 74 ensayos con 5902 participantes que cumplieron los criterios de inclusión de esta revisión. Un total de 46 ensayos (4274 participantes) proporcionó información para uno o más desenlaces. El riesgo de sesgo de los ensayos fue alto en uno o más dominios. En general, la evidencia fue de calidad baja o muy baja. La proporción de participantes con síntomas varió de un 19,9% a un 100% en los ensayos que dieron esta información. La proporción de participantes con resultado positivo para el anticuerpo antimitocondrial (AAM) varió de 80,8% a 100% en los ensayos que dieron esta información. Pareció que la mayoría de los ensayos incluyó a participantes que no habían recibido tratamientos anteriores o incluyó a participantes independientemente de los tratamientos anteriores recibidos. El seguimiento en los ensayos varió de uno a 96 meses.
La proporción de pacientes con mortalidad (seguimiento máximo) fue mayor en el grupo de metotrexato en comparación con el grupo de ninguna intervención (OR: 8,83; IC del 95%: 1,01 a 76,96; 60 participantes; un ensayo; evidencia de calidad baja). La proporción de personas con mortalidad (seguimiento máximo) fue menor en el grupo de la azatioprina en comparación con el grupo de ninguna intervención (OR: 0,56; IC del 95%: 0,32 a 0,98; 224 participantes; dos ensayos; I2 = 0%; evidencia de calidad baja). Sin embargo, debe señalarse que una gran parte de los participantes (25%) fue excluida del ensayo que contribuyó con la mayoría de los participantes a este análisis y los resultados no eran fiables. No había evidencia de una diferencia en ninguna de las comparaciones restantes. La proporción de pacientes con eventos adversos graves fue mayor en el grupo de D‐penicilamina en comparación con el grupo de ninguna intervención (OR: 28,77; IC del 95%: 1,57 a 526,67; 52 participantes; un ensayo; evidencia de calidad baja). La proporción de pacientes con eventos adversos graves fue mayor en el grupo de ácido obeticólico más ácido ursodeoxicólico (AUDC) comparado con el grupo de AUDC (OR: 3,58; IC del 95%: 1,02 a 12,51; 216 participantes; un ensayo; evidencia de calidad baja). No hubo evidencia de una diferencia en ninguna de las comparaciones restantes para los eventos adversos graves (proporción) ni para los eventos adversos graves (número de eventos). Ninguno de los ensayos informó la calidad de vida relacionada con la salud en ningún punto temporal.
Financiación: nueve ensayos no recibieron financiación especial o estaban financiados por hospitales u organizaciones benéficas; 31 ensayos estaban financiados por empresas farmacéuticas; y 34 ensayos no proporcionaron información sobre la fuente de financiación.
Conclusiones de los autores
Basado en evidencia de calidad muy baja, actualmente no hay evidencia de que alguna intervención arroje resultados beneficiosos para la colangitis biliar primaria. Sin embargo, los períodos de seguimiento en los ensayos fueron cortos y hay dudas significativas al respecto. Se necesitan más ensayos clínicos aleatorizados bien diseñados. Los futuros ensayos clínicos aleatorizados deben tener una potencia adecuada; realizarse en personas que generalmente son atendidas en la clínica en lugar de en participantes seleccionados; emplear el cegamiento; evitar los abandonos posteriores a la aleatorización o los cruces planificados; tener un período de seguimiento suficiente (por ejemplo, cinco o 10 años o más), y utilizar desenlaces clínicamente importantes como la mortalidad, la calidad de vida relacionada con la salud, la cirrosis, la cirrosis descompensada y el trasplante de hígado. Como alternativa, deben asignarse al azar los grupos muy grandes de participantes para facilitar una duración más corta del ensayo.
PICOs
Resumen en términos sencillos
Tratamiento médico de la colangitis biliar primaria
Antecedentes
La colangitis biliar primaria (previamente llamada cirrosis biliar primaria) es una enfermedad hepática crónica causada por la destrucción de los conductos biliares pequeños dentro del hígado (tubos que llevan la bilis producida por el hígado) que da lugar al estancamiento de la bilis (colestasis), daño hepático y al reemplazo de las células hepáticas con tejido cicatrizal (cirrosis hepática). No está claro cuál es el mejor tratamiento de los pacientes con colangitis biliar primaria. Se intentó resolver este problema mediante la búsqueda de ensayos existentes sobre el tema. Se incluyeron todos los ensayos clínicos aleatorizados (estudios clínicos en que los participantes son asignados al azar a uno de dos o más grupos de tratamiento) cuyos resultados se presentaron hasta febrero de 2017. Se incluyeron solo ensayos en los cuales los participantes con colangitis biliar primaria no habían sido sometidos al trasplante hepático previamente. Además de utilizar los métodos estándar de Cochrane que permiten la comparación de solo dos tratamientos a la vez (comparación directa), se planeó utilizar un método avanzado que permite la comparación de manera individual de muchos tratamientos diferentes en los ensayos (metanálisis en red). Sin embargo, debido a la naturaleza de la información disponible, no fue posible determinar si los resultados del metanálisis en red eran fiables. Por lo tanto, se utilizó la metodología Cochrane estándar.
Características de los estudios
Se identificaron 74 ensayos clínicos aleatorizados (5902 participantes). De los mismos, 46 ensayos clínicos aleatorizados (4274 participantes) proporcionaron información para una o más medidas (desenlaces). Los ensayos incluyeron personas con colangitis biliar primaria con y sin síntomas, con y sin anticuerpos antimitocondriales (AAM) (un indicador de la colangitis biliar primaria) independientemente de que hubieran recibido tratamientos anteriores. El período de seguimiento medio en los ensayos varió desde un mes hasta ocho años en los ensayos que dieron esta información.
Financiación: nueve ensayos no recibieron financiación adicional o fueron financiados por partes sin intereses personales en los resultados. Treinta y un ensayos fueron financiados de forma parcial o completa por compañías farmacéuticas que sacarían beneficios según los resultados del ensayo. La fuente de financiación no estaba disponible en el resto de ensayos.
Calidad de la evidencia
La calidad general de la evidencia fue muy baja y todos los ensayos presentaban riesgo de sesgo alto, lo cual significa que existe la posibilidad de sacar conclusiones equivocadas que sobreestimen los efectos beneficiosos o subestimen los efectos perjudiciales de un tratamiento o el otro debido a la forma en que se realizaron los ensayos.
Resultados clave
No hubo evidencia fiable sobre la disminución de las muertes entre alguna de las intervenciones comparado con ninguna intervención. No hubo evidencia de disminución en las complicaciones graves o las complicaciones de alguna gravedad entre ninguno de los tratamientos y ningún tratamiento. Ninguno de los ensayos informó la calidad de vida relacionada con la salud (una medida de la satisfacción del paciente con su vida y su salud) en ningún punto temporal.
En términos generales, actualmente no hay evidencia del efecto beneficioso de ninguna intervención en la colangitis biliar primaria. Hay dudas significativas sobre este tema y se requieren ensayos clínicos aleatorizados adicionales de calidad alta.
Authors' conclusions
Summary of findings
| UDCA versus no intervention for primary biliary cholangitis | |||||
| Patient or population: people with primary biliary cholangitis Settings: secondary or tertiary care Intervention: UDCA Comparison: no intervention | |||||
| Outcomes | Illustrative comparative risks* (95% CI) | Relative effect | No of participants | Quality of the evidence | |
| Assumed risk | Corresponding risk | ||||
| No intervention | UDCA | ||||
| Mortality at maximal follow‐up Follow‐up: 12 to 89 months | 208 per 1000 | 206 per 1000 | OR 0.99 | 734 | ⊕⊝⊝⊝ |
| Serious adverse events (proportion) Follow‐up: 12 to 41 months | There were no events in either group | 380 | ⊕⊝⊝⊝ | ||
| Serious adverse events (number of events) | None of the trials reported this outcome. | ||||
| Health‐related quality of life | None of the trials reported this outcome. | ||||
| *The basis for the assumed risk is the mean control group proportion across all the trials. The corresponding risk (and its 95% confidence interval) is based on the assumed risk in the comparison group and the relative effect of the intervention (and its 95% CI). | |||||
| GRADE Working Group grades of evidence | |||||
| 1 Risk of bias in the trial(s) was high (downgraded by two levels). 3 There was moderate heterogeneity (downgraded by one level). | |||||
| Azathioprine versus no intervention for primary biliary cholangitis | |||||
| Patient or population: people with primary biliary cholangitis Settings: secondary or tertiary care Intervention: azathioprine Comparison: no intervention | |||||
| Outcomes | Illustrative comparative risks* (95% CI) | Relative effect | No of participants | Quality of the evidence | |
| Assumed risk | Corresponding risk | ||||
| No intervention | Azathioprine | ||||
| Mortality at maximal follow‐up Follow‐up: 63 months in 1 trial and not stated in 1 trial | 208 per 1000 | 128 per 1000 | OR 0.56 | 224 | ⊕⊝⊝⊝ |
| Serious adverse events (proportion) | None of the trials reported this outcome. | ||||
| Serious adverse events (number of events) | None of the trials reported this outcome. | ||||
| Health‐related quality of life | None of the trials reported this outcome. | ||||
| *The basis for the assumed risk is the mean control group proportion across all the trials. The corresponding risk (and its 95% confidence interval) is based on the assumed risk in the comparison group and the relative effect of the intervention (and its 95% CI). | |||||
| GRADE Working Group grades of evidence | |||||
| 1 Risk of bias in the trial(s) was high (downgraded by two levels). | |||||
| Colchicine versus no intervention for primary biliary cholangitis | |||||
| Patient or population: people with primary biliary cholangitis Settings: secondary or tertiary care Intervention: colchicine Comparison: no intervention | |||||
| Outcomes | Illustrative comparative risks* (95% CI) | Relative effect | No of participants | Quality of the evidence | |
| Assumed risk | Corresponding risk | ||||
| No intervention | Colchicine | ||||
| Mortality at maximal follow‐up Follow‐up: 12 to 24 months | 208 per 1000 | 168 per 1000 | OR 0.77 | 122 | ⊕⊝⊝⊝ |
| Serious adverse events (proportion) Follow‐up: 12 months | There were no events in either group | 64 | ⊕⊝⊝⊝ | ||
| Serious adverse events (number of events) | None of the trials reported this outcome. | ||||
| Health‐related quality of life | None of the trials reported this outcome. | ||||
| *The basis for the assumed risk is the mean control group proportion across all the trials. The corresponding risk (and its 95% confidence interval) is based on the assumed risk in the comparison group and the relative effect of the intervention (and its 95% CI). | |||||
| GRADE Working Group grades of evidence | |||||
| 1 Risk of bias in the trial(s) was high (downgraded by two levels). 3 There was moderate heterogeneity (downgraded by one level). | |||||
| Ciclosporin versus no intervention for primary biliary cholangitis | |||||
| Patient or population: people with primary biliary cholangitis Settings: secondary or tertiary care Intervention: ciclosporin Comparison: no intervention | |||||
| Outcomes | Illustrative comparative risks* (95% CI) | Relative effect | No of participants | Quality of the evidence | |
| Assumed risk | Corresponding risk | ||||
| No intervention | Ciclosporin | ||||
| Mortality at maximal follow‐up Follow‐up: 31 to 35 months | 208 per 1000 | 188 per 1000 | OR 0.88 | 390 | ⊕⊝⊝⊝ |
| Serious adverse events (proportion) | None of the trials reported this outcome. | ||||
| Serious adverse events (number of events) | None of the trials reported this outcome. | ||||
| Health‐related quality of life | None of the trials reported this outcome. | ||||
| *The basis for the assumed risk is the mean control group proportion across all the trials. The corresponding risk (and its 95% confidence interval) is based on the assumed risk in the comparison group and the relative effect of the intervention (and its 95% CI). | |||||
| GRADE Working Group grades of evidence | |||||
| 1 Risk of bias in the trial(s) was high (downgraded by two levels). | |||||
| D‐Penicillamine versus no intervention for primary biliary cholangitis | |||||
| Patient or population: people with primary biliary cholangitis Settings: secondary or tertiary care Intervention: D‐penicillamine Comparison: no intervention | |||||
| Outcomes | Illustrative comparative risks* (95% CI) | Relative effect | No of participants | Quality of the evidence | |
| Assumed risk | Corresponding risk | ||||
| No intervention | D‐Penicillamine | ||||
| Mortality at maximal follow‐up (Follow‐up 24 to 66 months) | 208 per 1000 | 191 per 1000 | OR 0.90 | 423 | ⊕⊝⊝⊝ |
| Serious adverse events (proportion) (Follow‐up 24 months) | 4 per 1000 | 104 per 1000 | OR 28.77 | 52 | ⊕⊝⊝⊝ |
| Serious adverse events (number of events) | None of the trials reported this outcome. | ||||
| Health‐related quality of life | None of the trials reported this outcome. | ||||
| *The basis for the assumed risk is the mean control group proportion across all the trials. The corresponding risk (and its 95% confidence interval) is based on the assumed risk in the comparison group and the relative effect of the intervention (and its 95% CI). | |||||
| GRADE Working Group grades of evidence | |||||
| 1 Risk of bias in the trial(s) was high (downgraded by two levels). 3 There was moderate heterogeneity (downgraded by one level). | |||||
| Colchicine plus UDCA versus UDCA for primary biliary cholangitis | |||||
| Patient or population: people with primary biliary cholangitis Settings: secondary or tertiary care Intervention: colchicine + UDCA Comparison: UDCA | |||||
| Outcomes | Illustrative comparative risks* (95% CI) | Relative effect | No of participants | Quality of the evidence | |
| Assumed risk | Corresponding risk | ||||
| UDCA | Colchicine + UDCA | ||||
| Mortality at maximal follow‐up Follow‐up: 24 months in 1 trial; not reported in 1 trial | 110 per 1000 | 185 per 1000 | OR 1.84 | 158 | ⊕⊝⊝⊝ |
| Serious adverse events (proportion) Follow‐up: not stated | 14 per 1000 | 42 per 1000 | OR 3.08 | 74 | ⊕⊝⊝⊝ |
| Serious adverse events (number of events) | None of the trials reported this outcome. | ||||
| Health‐related quality of life | None of the trials reported this outcome. | ||||
| *The basis for the assumed risk is the mean control group proportion across all the trials. The corresponding risk (and its 95% confidence interval) is based on the assumed risk in the comparison group and the relative effect of the intervention (and its 95% CI). | |||||
| GRADE Working Group grades of evidence | |||||
| 1 Risk of bias in the trial(s) was high (downgraded by two levels). 3 There was moderate heterogeneity (downgraded by one level). | |||||
| Methotrexate plus UDCA versus UDCA for primary biliary cholangitis | |||||
| Patient or population: people with primary biliary cholangitis Settings: secondary or tertiary care Intervention: methotrexate + UDCA Comparison: UDCA | |||||
| Outcomes | Illustrative comparative risks* (95% CI) | Relative effect | No of participants | Quality of the evidence | |
| Assumed risk | Corresponding risk | ||||
| UDCA | Methotrexate + UDCA | ||||
| Mortality at maximal follow‐up Follow‐up: 11 to 91 months | 110 per 1000 | 126 per 1000 | OR 1.17 | 290 | ⊕⊝⊝⊝ |
| Serious adverse events (proportion) | None of the trials reported this outcome. | ||||
| Serious adverse events (number of events) | None of the trials reported this outcome. | ||||
| Health‐related quality of life | None of the trials reported this outcome. | ||||
| *The basis for the assumed risk is the mean control group proportion across all the trials. The corresponding risk (and its 95% confidence interval) is based on the assumed risk in the comparison group and the relative effect of the intervention (and its 95% CI). | |||||
| GRADE Working Group grades of evidence | |||||
| 1 Risk of bias in the trial(s) was high (downgraded by two levels). 3 There was moderate heterogeneity (downgraded by one level). | |||||
Background
Description of the condition
Primary biliary cholangitis (previously named primary biliary cirrhosis) is a chronic liver disease caused by the destruction of small intrahepatic bile ducts resulting in stasis of bile (cholestasis), liver fibrosis, and liver cirrhosis (NCBI 2014). There is global variation in the incidence and prevalence of primary biliary cholangitis with annual incidence varying from 1.6 to 3.2 per 100,000 people and prevalence varying from 5 to 38 per 100,000 people, with a trend of increasing incidence and prevalence in many countries (Metcalf 1997; Boberg 1998; Kim 2000; Sood 2004; Lazaridis 2007; Pla 2007; Rautiainen 2007; Myers 2009; Baldursdottir 2012; Boonstra 2014). It is more common in women, particularly aged 25 to 40 years (Metcalf 1997; Kim 2000; Gershwin 2005; Pla 2007; Myers 2009; Baldursdottir 2012). The mean age at diagnosis is 40 to 60 years (Kim 2000; Parikh‐Patel 2001; Gershwin 2005; Myers 2009; Baldursdottir 2012).
The aetiology of primary biliary cholangitis is unclear. The associations with primary biliary cholangitis include family history of primary biliary cholangitis, Sjögren's syndrome (autoimmune disease characterised by dry mouth and dry eyes), systemic lupus erythematosus (autoimmune connective tissue disorder), autoimmune thyroid disease, multiple sclerosis (autoimmune disorder of the central nervous system), scleroderma (autoimmune disease affecting the skin and internal organs), polymyositis (chronic inflammation of the muscles, possibly an autoimmune disease), history of cigarette smoking, history of hair dye use, and urinary tract infections (Parikh‐Patel 2001; Gershwin 2005; Lazaridis 2007; Prince 2010; Lammert 2013). People with primary biliary cholangitis have other coexisting autoimmune disorders such as rheumatoid arthritis, systemic lupus erythematosus, autoimmune thyroid disease, multiple sclerosis, scleroderma, and polymyositis (Parikh‐Patel 2001; Gershwin 2005; Prince 2010; Lammert 2013). Although the strong association between personal and family history of autoimmune diseases suggests that primary biliary cholangitis may have an autoimmune aetiology, the clustering of primary biliary cholangitis in certain areas and associations between primary biliary cholangitis and hair dye use, past smoking, and history of urinary tract infections have prompted people to consider environmental factors such as toxins and infections as possible aetiologies or triggering factors for primary biliary cholangitis (Leung 2005; Dronamraju 2010; Prince 2010; Selmi 2010).
A significant proportion of people with primary biliary cholangitis are asymptomatic at the time of diagnosis (up to about 60% in some studies (Pla 2007)). Itching and fatigue are the most common symptoms (Pla 2007; Myers 2009). Other ways of clinical presentation include Raynaud's syndrome (bluish discolouration of the fingers and toes due to vasospasm in response to cold or emotional stress); features of portal hypertension; osteoporosis; high cholesterol (particularly high ratio of high‐density lipoprotein cholesterol (which is considered protective for the heart) to low‐density lipoprotein cholesterol); and rarely deficiencies of vitamin A, vitamin D, vitamin E, and vitamin K (Kim 2000; Gershwin 2005; Pla 2007; Myers 2009; Baldursdottir 2012). Approximately 3% to 8% of people require liver transplantation in about five to six years from diagnosis (Kim 2000; Lindor 2009; Myers 2009; Baldursdottir 2012). Approximately 3% to 4% of people with primary biliary cholangitis die every year, usually because of liver‐related causes such as decompensated liver disease or hepatocellular carcinoma (Rautiainen 2007; Myers 2009). Overall, approximately 21% to 50% of people are dead in about 10 to 11 years from diagnosis (Kim 2000; Rautiainen 2007; Myers 2009; Floreani 2011; Baldursdottir 2012).
The diagnosis of primary biliary cholangitis is made in the presence of any two of the following three criteria (Lindor 2009).
-
Elevation of alkaline phosphatases.
-
Presence of antimitochondrial antibody (AMA).
-
Liver biopsy demonstrating non‐suppurative destructive cholangitis and destruction of interlobular bile ducts.
Some variations of primary biliary cholangitis are AMA‐negative primary biliary cholangitis that requires liver biopsy for establishing the diagnosis and the primary biliary cholangitis ‐ autoimmune hepatitis overlap syndrome (Lindor 2009). However, there is currently no strong evidence that the course of the disease is different between the classic primary biliary cholangitis and these variants (Lindor 2009).
Description of the intervention
Various pharmacological interventions have been tried to treat people with primary biliary cholangitis. These include bile acids such as ursodeoxycholic acid (UDCA) (Kaplan 2004; Combes 2005; Rautiainen 2005; Rudic 2012a); fibrates such as bezafibrate (Kurihara 2000; Rudic 2012b); immunosuppressants or immunomodulators such as glucocorticosteroids (Prince 2005; Rautiainen 2005), colchicine (Almasio 2000; Gong 2004a; Kaplan 2004), methotrexate (Kaplan 2004; Combes 2005; Giljaca 2010), azathioprine (Gong 2007a), ciclosporin (Gong 2007b), chlorambucil (Li Wei 2012), mycophenolate mofetil (Jones 1999; Talwalkar 2005), and thalidomide (McCormick 1994); and copper‐chelating agents such as D‐penicillamine (Gong 2004b) and tetrathiomolybdate (Askari 2010). Several other interventions such as bisphosphonates and hormonal replacement to prevent or treat osteoporosis (Ormarsdottir 2004; Rudic 2011a; Rudic 2011b; Guanabens 2013); antidepressants such as fluoxetine and fluvoxamine to overcome fatigue (Ter Borg 2004; Talwalkar 2006); cholesterol‐lowering agents such as simvastatin to decrease the high cholesterol (Cash 2013); and cholestyramine, rifampicin, and S‐adenosyl methionine for pruritus (Bergasa 2000) have been evaluated for control of various symptoms. Liver transplantation is performed in some people with decompensated liver disease due to primary biliary cholangitis (Kim 2000; Lindor 2009; Myers 2009; Baldursdottir 2012).
How the intervention might work
Certain bile acids are protective while other bile acids are harmful to hepatocytes (liver cells), cholangiocytes (cells that line the bile duct), and gastrointestinal cells lining the oesophagus and stomach (Perez 2009). Bile acids such as UDCA may protect the cholangiocytes from the damage caused by hydrophobic bile acids by decreasing the oxidative stress (by direct antioxidant effect or an increase in antioxidant defences) (Paumgartner 2002; Perez 2009). Bile acids also stimulate the secretion of bile acids from hepatocytes, thereby decreasing their stasis and the resulting damage to the cells and inhibit apoptosis (programmed cell death) (Paumgartner 2002; Perez 2009). Fibrates inactivate hydrophobic bile acids and, therefore, decrease the damage to the cells (Kurihara 2000). Since primary biliary cholangitis is considered an autoimmune disorder, altering the immunity and inflammatory response using glucocorticoids and other immunosuppressants may decrease the damage resulting from the inflammatory response. D‐Penicillamine and tetrathiomolybdate might remove the excess copper, thereby protecting the cells from the damage caused by copper accumulation. They also have antifibrotic properties (Song 2008). In this Cochrane Review, we included only pharmacological interventions aimed at controlling the liver disease (i.e. we excluded symptomatic treatments, lifestyle modifications, and liver transplantation).
Why it is important to do this review
The optimal pharmacological treatment of primary biliary cholangitis is unknown. Currently, both the European Association for the Study of the Liver (EASL) and American Association for the Study of Liver Diseases (AASLD) recommend UDCA for the management of primary biliary cholangitis (EASL 2009; Lindor 2009). However, one Cochrane Review that compared UDCA versus placebo or no intervention reported that there was no survival or symptomatic benefit for UDCA (Rudic 2012a). Therefore, there is clearly a discordance between the evidence and guideline recommendation. Network meta‐analysis allows combination of the direct evidence and indirect evidence, and allows ranking of different interventions in terms of the different outcomes (Salanti 2011; Salanti 2012). There has been no Cochrane Review on the different pharmacological interventions for primary biliary cholangitis. This systematic review and attempted network meta‐analysis provides the best level of evidence for the role of different interventions used in the treatment of people with primary biliary cholangitis.
Objectives
To assess the comparative benefits and harms of different pharmacological interventions in the treatment of primary biliary cholangitis through a network meta‐analysis and to generate rankings of the available pharmacological interventions according to their safety and efficacy. However, it was not possible to assess whether the potential effect modifiers were similar across different comparisons. Therefore, we did not perform the network meta‐analysis, and, instead, assessed the comparative benefits and harms of different interventions using standard Cochrane methodology.
When more trials become available with adequate description of potential effect modifiers, we will attempt to conduct network meta‐analysis to generate rankings of the available interventions according to their safety and efficacy. This is why we retained the planned methodology for network meta‐analysis in our Appendix 1. Once data appear allowing for the conduct of network meta‐analysis, this Appendix 1 will be moved back into the Methods section.
Methods
Criteria for considering studies for this review
Types of studies
We considered randomised clinical trials only for this network meta‐analysis, irrespective of the language, publication status, or date of publication. We excluded studies of other design because of the risk of bias in such studies. We are all aware that such exclusions make us focus much more on potential benefits and not fully assess the risks of serious adverse events as well as risks of adverse events.
Types of participants
We included randomised clinical trials with participants with primary biliary cholangitis irrespective of the method of diagnosis of the disease or the presence of symptoms. We excluded randomised clinical trials in which participants had undergone liver transplantation previously.
Types of interventions
Any of the following pharmacological interventions that are possible treatments used either alone or in combination for primary biliary cholangitis and can be compared with each other or with placebo or no intervention.
The interventions that we considered were:
-
UDCA;
-
obeticholic acid;
-
bezafibrate;
-
glucocorticosteroids;
-
colchicine;
-
methotrexate;
-
azathioprine;
-
ciclosporin;
-
chlorambucil;
-
mycophenolate mofetil;
-
thalidomide;
-
D‐penicillamine;
-
tetrathiomolybdate.
The above list was not exhaustive. If we identified pharmacological interventions that we were not aware of, we considered them as eligible and included them in the review if they were used primarily for the treatment of primary biliary cholangitis.
Types of outcome measures
We assessed the comparative benefits and harms of available pharmacological interventions aimed at treating people with primary biliary cholangitis for the following outcomes.
Primary outcomes
-
Mortality at maximal follow‐up.
-
Mortality:
-
short‐term mortality (up to one year);
-
medium‐term mortality (one to five years).
-
-
Adverse events (within three months after cessation of treatment). Depending on the availability of data, we attempted to classify adverse events as serious or non‐serious. We defined a non‐serious adverse event as any untoward medical occurrence not necessarily having a causal relationship with the treatment but resulting in a dose reduction or discontinuation of treatment (any time after commencement of treatment) (ICH‐GCP 1997). We defined a serious adverse event as any event that would increase mortality; was life threatening; required hospitalisation; resulted in persistent or significant disability; was a congenital anomaly/birth defect; or any important medical event that might jeopardise the person or require intervention to prevent it. We used the definition used by study authors for non‐serious and serious adverse events:
-
proportion of participants with serious adverse events;
-
number of serious adverse events;
-
proportion of participants with any type of adverse event;
-
number of any type of adverse event.
-
-
Health‐related quality of life as defined in the included trials using a validated scale such as EQ‐5D or 36‐item Short Form (SF‐36) (EuroQol 2014; Ware 2014):
-
short‐term (up to one year);
-
medium‐term (one to five years);
-
long‐term (beyond five years).
-
We considered long‐term quality of life more important than short‐term or medium‐term quality of life, although short‐term and medium‐term quality of life are also important primary outcomes.
Secondary outcomes
-
Liver transplantation (maximal follow‐up):
-
proportion of participants with liver transplantation;
-
time to liver transplantation.
-
-
Decompensated liver disease (maximal follow‐up):
-
proportion of participants with decompensated liver disease;
-
time to liver decompensation.
-
-
Cirrhosis (maximal follow‐up):
-
proportion of participants with cirrhosis;
-
time to cirrhosis.
-
-
Hepatocellular carcinoma (maximal follow‐up).
Search methods for identification of studies
Electronic searches
We searched the Cochrane Central Register of Controlled Trials (CENTRAL), MEDLINE, Embase, and Science Citation Index Expanded (Royle 2003) from inception to 27 February 2017 for randomised clinical trials comparing two or more of the above interventions without applying any language restrictions. We searched for all possible comparisons formed by the interventions of interest. To identify further ongoing or completed trials, we also searched the World Health Organization International Clinical Trials Registry Platform Search Portal (apps.who.int/trialsearch/), which searches various trial registers, including ISRCTN and ClinicalTrials.gov. Appendix 2 shows the search strategies we used.
Searching other resources
We searched the references of the identified trials and existing Cochrane Reviews on primary biliary cholangitis to identify additional trials for inclusion.
Data collection and analysis
Selection of studies
Two review authors (KG and FS) independently identified the trials for inclusion by screening the titles and abstracts. We sought full‐text articles for any references that at least one of the review authors identified for potential inclusion. We selected trials for inclusion based on the full‐text articles. We listed the excluded full‐text references with reasons for their exclusion in the Characteristics of excluded studies table. We have also listed any ongoing trials identified primarily through the search of the clinical trial registers for further follow‐up. We resolved discrepancies through discussion.
Data extraction and management
Two review authors (KG and FS or LHE) independently extracted the following data.
-
Outcome data (for each outcome and for each treatment arm whenever applicable):
-
number of participants randomised;
-
number of participants included for the analysis;
-
number of participants with events for binary outcomes, mean and standard deviation for continuous outcomes, number of events for count outcomes, and the number of participants with events and the mean follow‐up period for time‐to‐event outcomes;
-
definition of outcomes or scale used if appropriate.
-
-
Data on potential effect modifiers:
-
participant characteristics such as age, sex, comorbidities, proportion of symptomatic participants, proportion with AMA‐positive status, proportion of participants with overlap syndrome, and responders;
-
details of the intervention and control (including dose, frequency, and duration);
-
risk of bias (assessment of risk of bias in included studies).
-
-
Other data:
-
year and language of publication;
-
country in which the participants were recruited;
-
year(s) in which the trial was conducted;
-
inclusion and exclusion criteria;
-
follow‐up time points of the outcome.
-
If available, we planned to obtain the data separately for symptomatic participants and asymptomatic participants from the report. If available, we also planned to obtain the data separately for people with AMA‐positive status and people with AMA‐negative status and for responders and non‐responders separately. We sought unclear or missing information by contacting the trial authors. If there was any doubt whether trials shared the same participants, completely or partially (by identifying common authors and centres), we attempted to contact the trial authors to clarify whether the trial report was duplicated. We resolved any differences in opinion through discussion.
Assessment of risk of bias in included studies
We followed the guidance given in the Cochrane Handbook for Systematic Reviews of Interventions (Higgins 2011) and described in the Cochrane Hepato‐Biliary Module (Gluud 2017) to assess the risk of bias in included trials. Specifically, we assessed the risk of bias in included trials for the following domains using the methods below (Schulz 1995; Moher 1998; Kjaergard 2001; Wood 2008; Savović 2012a; Savović 2012b; Lundh 2017).
Allocation sequence generation
-
Low risk of bias: sequence generation was achieved using computer random number generation or a random number table. Drawing lots, tossing a coin, shuffling cards, and throwing dice were adequate if performed by an independent person not otherwise involved in the trial.
-
Unclear risk of bias: the method of sequence generation was not specified.
-
High risk of bias: the sequence generation method was not random.
Allocation concealment
-
Low risk of bias: the participant allocations could not have been foreseen in advance of, or during, enrolment. Allocation was controlled by a central and independent randomisation unit. The allocation sequence was unknown to the investigators (e.g. if the allocation sequence was hidden in sequentially numbered, opaque, and sealed envelopes).
-
Unclear risk of bias: the method used to conceal the allocation was not described so that intervention allocations may have been foreseen in advance of, or during, enrolment.
-
High risk of bias: the allocation sequence was likely to be known to the investigators who assigned the participants.
Blinding of participants and personnel
-
Low risk of bias: any of the following: no blinding or incomplete blinding, but the review authors judged that the outcome was not likely to be influenced by lack of blinding; or blinding of participants and key study personnel ensured, and it was unlikely that the blinding could have been broken.
-
Unclear risk of bias: any of the following: insufficient information to permit judgement of 'low risk' or 'high risk'; or the trial did not address this outcome.
-
High risk of bias: any of the following: no blinding or incomplete blinding, and the outcome was likely to be influenced by lack of blinding; or blinding of key study participants and personnel attempted, but likely that the blinding could have been broken, and the outcome was likely to be influenced by lack of blinding.
Blinding of outcome assessors
-
Low risk of bias: any of the following: no blinding of outcome assessment, but the review authors judged that the outcome measurement was not likely to be influenced by lack of blinding; or blinding of outcome assessment ensured, and unlikely that the blinding could have been broken.
-
Unclear risk of bias: any of the following: insufficient information to permit judgement of 'low risk' or 'high risk'; or the trial did not address this outcome.
-
High risk of bias: any of the following: no blinding of outcome assessment, and the outcome measurement was likely to be influenced by lack of blinding; or blinding of outcome assessment, but likely that the blinding could have been broken, and the outcome measurement was likely to be influenced by lack of blinding.
Incomplete outcome data
-
Low risk of bias: missing data were unlikely to make treatment effects depart from plausible values. Sufficient methods, such as multiple imputation, were employed to handle missing data.
-
Unclear risk of bias: there was insufficient information to assess whether missing data in combination with the method used to handle missing data were likely to induce bias on the results.
-
High risk of bias: the results were likely to be biased due to missing data.
Selective outcome reporting
-
Low risk of bias: the trial reported at least the following predefined outcomes: mortality, decompensated liver disease, requirement for transplantation, or treatment‐related adverse events. If the original trial protocol was available, the outcomes should have been those called for in that protocol. If the trial protocol was obtained from a trial registry (e.g. www.clinicaltrials.gov), the outcomes sought should have been those enumerated in the original protocol if the trial protocol was registered before or at the time that the trial was begun. If the trial protocol was registered after the trial was begun, those outcomes were not considered to be reliable.
-
Unclear risk: not all predefined, or clinically relevant and reasonably expected, outcomes were reported fully, or it was unclear whether data on these outcomes were recorded or not.
-
High risk: one or more predefined or clinically relevant and reasonably expected outcomes were not reported, even though data on these outcomes were likely to have been available and even recorded.
For‐profit bias
-
Low risk of bias: the trial appeared to be free of industry sponsorship or other type of for‐profit support that may manipulate the trial design, conductance, or results of the trial.
-
Unclear risk of bias: the trial may or may not have been free of for‐profit bias as no information on clinical trial support or sponsorship was provided.
-
High risk of bias: the trial was sponsored by industry or received other type of for‐profit support.
Other bias
-
Low risk of bias: the trial appeared to be free of other components (e.g. inappropriate control or dose or administration of control) that could put it at risk of bias.
-
Unclear risk of bias: the trial may or may not have been free of other components that could put it at risk of bias.
-
High risk of bias: there are other factors in the trial that could put it at risk of bias (e.g. inappropriate control or dose or administration of control).
We considered a trial at low risk of bias if we assessed the trial to be at low risk of bias across all domains. Otherwise, we considered trials to be at unclear risk of bias or at high risk of bias regarding one or more domains as at high risk of bias.
Measures of treatment effect
For dichotomous variables (e.g. short‐term and medium‐term mortality, liver transplantation, proportion of participants with adverse events, decompensated liver disease, cirrhosis, or hepatocellular carcinoma), we calculated the odds ratio (OR) with 95% confidence intervals (CI). For continuous variables (e.g. quality of life reported on the same scale), we planned to calculate the mean difference with 95% CI. We planned to use standardised mean difference values with 95% CI for quality of life if included trials used different scales. For count outcomes (e.g. number of adverse events), we calculated the rate ratio with 95% CI. For time‐to‐event data (e.g. mortality at maximal follow‐up or requirement for liver transplantation, time to liver decompensation, and time to cirrhosis), we planned to use the hazard ratio (HR) with 95% CIs. We also calculated Trial Sequential Analysis‐adjusted CI to control random errors (Thorlund 2011).
Unit of analysis issues
The unit of analysis was people with primary biliary cholangitis according to the intervention group to which they were randomly assigned.
Cluster randomised clinical trials
We found no cluster randomised clinical trials. However, if we had found them, we would have included them provided that the effect estimate adjusted for cluster correlation was available.
Cross‐over randomised clinical trials
If we found cross‐over randomised clinical trials, we included the outcomes after the period of first intervention only since primary biliary cholangitis is a chronic disease and the interventions could potentially have a residual effect.
Trials with multiple treatment groups
We collected data for all trial intervention groups that met our inclusion criteria.
Dealing with missing data
We performed an intention‐to‐treat analysis whenever possible (Newell 1992). Otherwise, we used the data that were available to us (e.g. a trial may have reported only per‐protocol analysis results). As such per‐protocol analyses may be biased, we planned to conduct best‐worst case scenario analysis (good outcome in intervention group and bad outcome in control group) and worst‐best case scenario analysis (bad outcome in intervention group and good outcome in control group) as sensitivity analyses whenever possible.
For continuous outcomes, we planned to impute the standard deviation from P values according to guidance given in the Cochrane Handbook for Systematic Reviews of Interventions (Higgins 2011). If the data were likely to be normally distributed, we planned to use the median for meta‐analysis when the mean was not available. If it was not possible to calculate the standard deviation from the P value or the CIs, we planned to impute the standard deviation using the largest standard deviation in other trials for that outcome. This form of imputation may decrease the weight of the study for calculation of mean differences and may bias the effect estimate to no effect for calculation of standardised mean differences (Higgins 2011).
Assessment of heterogeneity
We assessed clinical and methodological heterogeneity by carefully examining the characteristics and design of included trials. We assessed the presence of clinical heterogeneity by comparing effect estimates in the presence or absence of symptoms, the presence or absence of AMA, responders versus non‐responders, and the doses of the pharmacological interventions. Different study designs and risk of bias may contribute to methodological heterogeneity. We used the I2 test and Chi2 test for heterogeneity, and overlapping of CIs to assess heterogeneity.
Assessment of reporting biases
We planned to use visual asymmetry on a funnel plot to explore reporting bias in the presence of at least 10 trials that could be included for a direct comparison (Egger 1997; Macaskill 2001). In the presence of heterogeneity that could be explained by subgroup analysis, we planned to produce a funnel plot for each subgroup in the presence of an adequate number of trials (at least 10 trials). We planned to use the linear regression approach described by Egger 1997 to determine funnel plot asymmetry.
We also considered selective reporting as evidence of reporting bias.
Data synthesis
We performed the meta‐analyses according to the recommendations of Cochrane (Higgins 2011), using the software package Review Manager 5 (RevMan 2014). We used a random‐effects model (DerSimonian 1986) and a fixed‐effect model (DeMets 1987). In the case of a discrepancy between the two models, we reported both results; otherwise, we reported only the results from the fixed‐effect model.
Calculation of required information size and Trial Sequential Analysis
For calculation of the required information size, see Appendix 3. We performed Trial Sequential Analysis to control the risk of random errors when there were at least two trials included for mortality at maximal follow‐up, serious adverse events (proportion) and health‐related quality of life, the three outcomes that determine whether an intervention should be used (Wetterslev 2008; Thorlund 2011; TSA 2011; Wetterslev 2017). We used an alpha error as per guidance of Jakobsen 2014, power of 90% (beta error of 10%), a relative risk reduction of 20%, a control group proportion observed in the trials, and the diversity observed in the meta‐analysis.
Subgroup analysis and investigation of heterogeneity
We planned to assess the differences in the effect estimates between the following subgroups.
-
Trials at low risk of bias compared to trials at high risk of bias.
-
Participants with symptomatic compared to participants with asymptomatic primary biliary cholangitis.
-
AMA‐positive participants compared to AMA‐negative participants.
-
Responders compared to non‐responders to bile acids.
-
Different doses of pharmacological interventions. For example, various doses of UDCA used in randomised clinical trials include 5 mg/kg to 7 mg/kg, 13 mg/kg to 15 mg/kg (moderate dose), and 23 mg/kg to 25 mg/kg (high dose) (Angulo 1999a; Lindor 1997).
We planned to use the Chi2 test for subgroup differences to identify subgroup differences.
Sensitivity analysis
If a trial reported only per‐protocol analysis results, we planned to re‐analyse the results using the best‐worst case scenario and worst‐best case scenario analyses as sensitivity analyses whenever possible.
Presentation of results and GRADE assessments
We reported mortality, serious adverse events, and health‐related quality of life, the three most important outcomes that determine the use of an intervention in a 'Summary of findings' table format, downgrading the quality of evidence for risk of bias, inconsistency, indirectness, imprecision, and publication bias using GRADE (Guyatt 2011). We have presented the 'Summary of findings' tables for all comparisons in which two trials were included for one of mortality at maximal follow‐up, serious adverse events, or health‐related quality of life.
Results
Description of studies
Results of the search
We identified 5592 references through electronic searches of CENTRAL (n = 1104), MEDLINE (n = 2383), Embase (n = 604), Science Citation Index Expanded (n = 1362), World Health Organization International Clinical Trials Registry Platform (n = 88), and ClinicalTrials.gov (n = 51). After the removal of 1249 duplicates we obtained 4343 references. We then excluded 3973 clearly irrelevant references through screening titles and reading abstracts. We retrieved 370 references for further assessment. No references were identified through scanning reference lists of the identified randomised trials. We excluded 117 references for the reasons stated in the Characteristics of excluded studies table. Nine references are an ongoing trial without any interim data (ChiCTR‐IPR‐16008935; EUCTR2015‐002698‐39‐GB; NCT02308111; NCT02701166; NCT02823353; NCT02823366; NCT02937012; NCT02943447; NCT02965911). We were unable to obtain the full texts for two references (O'Brian 1990; Zaman 2006). In total, 242 references (74 trials) met the inclusion criteria. The reference flow is summarised in the study flow diagram (Figure 1).

Study flow diagram.
Included studies
The 74 trials that met the inclusion criteria for this review included 5902 participants. Some 28 trials did not contribute any information for this review leaving 4274 participants included in one or more outcomes in the review (Bodenheimer 1988; Arora 1990; Oka 1990; Smart 1990; Poupon 1991a; Senior 1991; Battezzati 1993; Manzillo 1993a; Manzillo 1993b; Bobadilla 1994; Goddard 1994; Lim 1994; McCormick 1994; Steenbergen 1994; Lindor 1997; Kaplan 1999; Leuschner 1999; Nakai 2000; Mazzarella 2002; Ueno 2005; Iwasaki 2008a; Iwasaki 2008b; Askari 2010; Liberopoulos 2010; Cash 2013; Bowlus 2014; Kowdley 2014a; Mayo 2015). In the main review unstratified by the dose of UDCA or obeticholic acid, 4060 participants were included in one or more outcomes in the review. The mean or median age of the participants ranged from 46 to 64 years in the trials that reported this information. The proportion of females ranged from 77.8% to 100% in the trials that reported this information. The proportion of participants with symptoms varied from 19.9% to 100% in the trials that reported this information. The proportion of participants who were AMA positive ranged from 80.8% to 100% in the trials that reported this information. Ten trials included non‐responders to bile acids only (Van Hoogstraten 1998; Wolfhagen 1998; Kanda 2003; Ueno 2005; Iwasaki 2008b; Mason 2008; Liberopoulos 2010; Hirschfield 2015; Hosonuma 2015; Nevens 2016). The remaining trials did not state whether they included responders or non‐responders, or both. However, it appeared that most trials included participants who had not received previous treatments or regardless of the previous treatments received. The interventions, controls, number of participants included in each trial, and the follow‐up period reported in the different trials are listed in Table 1.
| Study name | No participants randomised | Post‐randomisation dropouts | No participants for whom outcome was reported | Intervention(s) | Control | Mean follow‐up period (months) |
| 20 | Not stated | 20 | Antioxidants | No intervention | Not stated | |
| 248 | 63 | 185 | Azathioprine | No intervention | 63 | |
| 45 | 6 | 39 | Azathioprine | No intervention | Not stated | |
| 24 | 0 | 24 | Chlorambucil | No intervention | 52 | |
| 57 | 10 | 47 | Colchicine | No intervention | 33 | |
| 60 | 3 | 57 | Colchicine | No intervention | 24 | |
| 64 | Not stated | 64* | Colchicine | No intervention | 19 (median) | |
| 40 | Not stated | 40 | Colchicine + UDCA | No intervention | 12 | |
| 349 | 0 | 349 | Ciclosporin | No intervention | 31 (median) | |
| 12 | 0 | 12 | Ciclosporin | No intervention | Not stated | |
| 40 | 11 | 29 | Ciclosporin | No intervention | 35 (median) | |
| 309 | 82 | 227 | D‐Penicillamine | No intervention | 60 (median) | |
| 98 | Not stated | 98 | D‐Penicillamine | No intervention | 66 | |
| 60 | 0 | 60 | D‐Penicillamine | No intervention | 37 | |
| 52 | 0 | 52 | D‐Penicillamine | No intervention | 24 | |
| 189 | Not stated | 189 | D‐Penicillamine | No intervention | Not stated | |
| 24 | Not stated | 24 | D‐Penicillamine | No intervention | 18 | |
| 35 | Not stated | 35 | D‐Penicillamine | No intervention | Not stated | |
| 36 | 0 | 36 | Glucocorticosteroids | No intervention | 36 | |
| 20 | Not stated | 20 | Lamivudine | No intervention | Not stated | |
| 104 | 3 | 101 | Malotilate | No intervention | 25 (median) | |
| 60 | Not stated | 60 | Methotrexate | No intervention | 68 | |
| 14 | Not stated | 14 | Methotrexate + UDCA | No intervention | 24 | |
| 45 | 3 | 42 | NGM282 | No intervention | Not stated | |
| 216 | Not stated | 216 | Obeticholic acid | No intervention | 12 | |
| 165 | 0 | 165 | Obeticholic acid | No intervention | 3 | |
| 59 | Not stated | 59 | Obeticholic acid | No intervention | Not stated | |
| 32 | Not stated | 32 | S‐Adenosyl methionine | No intervention | 1 | |
| 6 | Not stated | 6 | S‐Adenosyl methionine | No intervention | 2 | |
| 21 | 8 | 13 | Simvastatin | No intervention | 12 | |
| 28 | 0 | 28 | Tetrathiomolybdate | No intervention | Not stated | |
| 18 | 0 | 18 | Thalidomide | No intervention | Not stated | |
| 9 | Not stated | 9 | UDCA | No intervention | 5 | |
| 88 | 2 | 86 | UDCA | No intervention | 6 | |
| 151 | 0 | 151 | UDCA | No intervention | 24 | |
| 116 | 15 | 101 | UDCA | No intervention | 24 | |
| 222 | Not stated | 222 | UDCA | No intervention | 24 | |
| 20 | 0 | 18 | UDCA | No intervention | 12 | |
| 32 | Not stated | 32 | UDCA | No intervention | Not stated | |
| 180 | 10 | 170 | UDCA | No intervention | 24 | |
| 52 | 7 | 45 | UDCA | No intervention | Not stated | |
| 92 | 6 | 86 | UDCA | No intervention | 89 | |
| 192 | 0 | 192 | UDCA | No intervention | 41 (median) | |
| 149 | 3 | 146 | UDCA | No intervention | Not stated | |
| 20 | 1 | 19 | UDCA | No intervention | 18 | |
| 46 | 0 | 46 | UDCA | No intervention | 24 | |
| 57 | Not stated | 57 | Intervention 1: UDCA | No intervention | 15 | |
| 50 | Not stated | 50 | Azathioprine + glucocorticosteroids + UDCA | UDCA | 12 | |
| 45 | Not stated | 45 | Bezafibrate | UDCA | 12 | |
| 24 | Not stated | 24 | Bezafibrate | UDCA | Not stated | |
| 27 | 0 | 27 | Bezafibrate + UDCA | UDCA | 96 | |
| 22 | Not stated | 22 | Bezafibrate + UDCA | UDCA | 12 | |
| 22 | 0 | 22 | Bezafibrate + UDCA | UDCA | 7 | |
| 23 | Not stated | 23 | Bezafibrate + UDCA | UDCA | 12 | |
| 90 | 6 | 84 | Colchicine + UDCA | UDCA | Not stated | |
| 22 | 0 | 22 | Colchicine + UDCA | UDCA | 24 | |
| 74 | Not stated | 74 | Colchicine + UDCA | UDCA | 24 | |
| 28 | 8 | 20 | Colchicine + UDCA | UDCA | 24 | |
| 11 | Not stated | 11 | Colestilan + UDCA | UDCA | Not stated | |
| 10 | Not stated | 10 | Fenofibrate + UDCA | UDCA | Not stated | |
| 40 | 0 | 39 | Glucocorticosteroids + UDCA | UDCA | 24 | |
| 77 | 8 | 69 | Glucocorticosteroids + UDCA | UDCA | 36 | |
| 79 | Not stated | 79 | Intervention 1: glucocorticosteroids + UDCA | UDCA | Not stated | |
| 59 | 0 | 59 | Lamivudine + zidovudine + UDCA | UDCA | 6 | |
| 265 | 0 | 265 | Methotrexate + UDCA | UDCA | 91 (median) | |
| 25 | Not stated | 25 | Methotrexate + UDCA | UDCA | 11 | |
| 217 | Not stated | 216 | Obeticholic acid + UDCA | UDCA | 12 | |
| 30 | 0 | 30 | TUDCA | UDCA | 6 | |
| 199 | 8 | 191 | TUDCA | UDCA | 6 | |
| 87 | 2 | 85 | Colchicine | Methotrexate | 24 | |
| Comparison of doses | ||||||
| 150 | Not stated | 150 | Intervention 1: UDCA (high) Intervention 2: UDCA (moderate) | UDCA (low) | 12 | |
| 155 | Not stated | 155 | Intervention 1: UDCA (high) Intervention 2: UDCA (moderate) | UDCA (low) | 12 | |
| 61 | 2 | 59 | UDCA (moderate) | UDCA (low) | Not stated | |
| 42 | Not stated | 42 | UDCA (high) | UDCA (moderate) | 72 | |
TUDCA: taurodeoxycholic acid; UDCA: ursodeoxycholic acid.
Source of funding: nine trials receive no additional funding or were funded by parties with no vested interest in the results (Heathcote 1976; Hoofnagle 1986; Almasio 2000; Nakai 2000; Iwasaki 2008a; Iwasaki 2008b; Askari 2010; Cash 2013; Hosonuma 2015). Thirty‐one trials were partially or fully funded by the pharmaceutical companies that would benefit based on the results of the trial (Triger 1980; Matloff 1982; Christensen 1985; Dickson 1985; Bodenheimer 1988; Minuk 1988; Oka 1990; Wiesner 1990; Poupon 1991a; Senior 1991; Lombard 1993; Mitchison 1993; Heathcote 1994; Lindor 1994; McCormick 1994; Combes 1995a; Poupon 1996; Eriksson 1997; Van Hoogstraten 1998; Wolfhagen 1998; Leuschner 1999; Pares 2000; Papatheodoridis 2002; Combes 2005; Rautiainen 2005; Mason 2008; Bowlus 2014; Kowdley 2014a; Mayo 2015; Ma 2016; Nevens 2016). The source of funding was not available from the 34 remaining trials.
Excluded studies
The reasons for exclusion are summarised in the Characteristics of excluded studies table. While the reasons for exclusion for most references were self‐explanatory, the reasons for exclusion of 15 references required some explanation (Poupon 1994; Lindor 1995a; Emond 1996; Lindor 1996; Angulo 1999b; Angulo 1999c; Degott 1999; Corpechot 2000; Jorgensen 2002; Kaplan 2004; Combes 2005b; Leung 2010; Leung 2011; Kowdley 2015; Carbone 2016). These 15 references were long‐term follow‐up reports of included trials, but the randomisation was not maintained and the 'no intervention' group received the intervention. While this is acceptable if some participants crossed over for specific reasons in an intention‐to‐treat analysis, it is not acceptable if the cross‐over from one group to another was done in a systematic manner. Therefore, we excluded these references.
Risk of bias in included studies
The risk of bias is summarised in Figure 2, Figure 3, and Table 2.

Risk of bias graph: review authors' judgements about each risk of bias item presented as percentages across all included studies.

Risk of bias summary: review authors' judgements about each risk of bias item for each included study.
| Name of studies | Intervention(s) | Control | Random sequence generation | Allocation concealment | Blinding of participants and health professionals | Blinding of outcome assessors | Missing outcome bias | Selective outcome reporting | For‐profit bias | Other bias |
| Antioxidants | No intervention | Unclear | Unclear | Unclear | Unclear | Unclear | High | Unclear | Low | |
| Azathioprine | No intervention | Unclear | Unclear | Low | Low | High | High | High | Low | |
| Azathioprine | No intervention | Unclear | Unclear | High | High | High | High | Low | Low | |
| Chlorambucil | No intervention | Low | Low | High | High | Low | Low | Low | Low | |
| Colchicine | No intervention | Unclear | Unclear | Low | Low | High | High | High | Low | |
| Colchicine | No intervention | Unclear | Unclear | Unclear | Unclear | High | High | Unclear | Low | |
| Colchicine | No intervention | Low | Low | Low | Low | Unclear | Low | Unclear | Low | |
| Colchicine + UDCA | No intervention | Unclear | Unclear | Unclear | Unclear | Unclear | High | Unclear | Low | |
| Ciclosporin | No intervention | Unclear | Unclear | Low | Low | Low | Low | High | Low | |
| Ciclosporin | No intervention | Unclear | Unclear | Low | Unclear | Unclear | Low | High | Low | |
| Ciclosporin | No intervention | Unclear | Unclear | Low | Low | Unclear | Low | High | Low | |
| D‐Penicillamine | No intervention | Low | Low | Low | Low | High | High | High | High | |
| D‐Penicillamine | No intervention | Unclear | Unclear | High | High | Unclear | High | Unclear | Low | |
| D‐Penicillamine | No intervention | Unclear | Unclear | Unclear | Unclear | Low | Low | Unclear | Low | |
| D‐Penicillamine | No intervention | Unclear | Unclear | Unclear | Unclear | Low | Low | High | Low | |
| D‐Penicillamine | No intervention | Unclear | Low | Low | Low | Unclear | High | Unclear | Low | |
| D‐Penicillamine | No intervention | Unclear | Unclear | Low | Low | Unclear | Low | Unclear | Low | |
| D‐Penicillamine | No intervention | Unclear | Unclear | Unclear | Unclear | Unclear | High | High | Low | |
| Glucocorticosteroids | No intervention | Low | Low | High | High | Low | High | Unclear | Low | |
| Lamivudine | No intervention | Unclear | Unclear | Low | Low | Unclear | High | Unclear | Low | |
| Malotilate | No intervention | Low | Low | Low | Low | High | Low | High | Low | |
| Methotrexate | No intervention | Low | Low | Unclear | Unclear | Unclear | High | Unclear | Low | |
| Methotrexate + UDCA | No intervention | Low | Unclear | Unclear | Unclear | Unclear | High | Unclear | Low | |
| NGM282 | No intervention | Unclear | Unclear | Unclear | Unclear | High | High | High | Low | |
| Obeticholic acid | No intervention | Unclear | Unclear | Unclear | Unclear | Unclear | High | High | Low | |
| Obeticholic acid | No intervention | Low | Unclear | Low | Low | Low | High | Unclear | High | |
| Obeticholic acid | No intervention | Unclear | Unclear | Unclear | Unclear | Unclear | High | High | Low | |
| S‐Adenosyl methionine | No intervention | Unclear | Unclear | Unclear | Unclear | Unclear | High | Unclear | Low | |
| S‐Adenosyl methionine | No intervention | Unclear | Unclear | Unclear | Unclear | Unclear | High | Unclear | Low | |
| Simvastatin | No intervention | Unclear | Low | High | High | High | High | Low | High | |
| Tetrathiomolybdate | No intervention | Low | Low | Low | Low | Low | High | Low | High | |
| Thalidomide | No intervention | Unclear | Unclear | Low | Low | Low | High | High | Low | |
| UDCA | No intervention | Unclear | Unclear | Unclear | Unclear | Unclear | High | Unclear | Low | |
| UDCA | No intervention | Low | Low | Low | Low | High | High | Unclear | Low | |
| UDCA | No intervention | Unclear | Unclear | Low | Low | Low | High | High | Low | |
| UDCA | No intervention | Unclear | Unclear | Unclear | Unclear | High | High | High | Low | |
| UDCA | No intervention | Unclear | Low | Low | Low | Unclear | High | High | Low | |
| UDCA | No intervention | Unclear | Unclear | Unclear | Unclear | High | Low | Unclear | Low | |
| UDCA | No intervention | Unclear | Unclear | Unclear | Unclear | Unclear | High | Unclear | Low | |
| UDCA | No intervention | Unclear | Unclear | Low | Low | High | Low | High | Low | |
| UDCA | No intervention | Unclear | Low | Low | Low | High | High | High | Low | |
| UDCA | No intervention | Low | Low | High | High | High | High | High | High | |
| UDCA | No intervention | Unclear | Unclear | Low | Low | Unclear | Low | High | Low | |
| UDCA | No intervention | Unclear | Unclear | Low | Low | High | High | High | Low | |
| UDCA | No intervention | Unclear | Unclear | Unclear | Unclear | High | High | High | Low | |
| UDCA | No intervention | Unclear | Unclear | Low | Low | Low | High | Unclear | Low | |
| Intervention 1: UDCA | No intervention | Unclear | Unclear | Unclear | Unclear | Unclear | High | Unclear | Low | |
| Azathioprine + glucocorticosteroids + UDCA | UDCA | Low | Low | Low | Low | Unclear | High | High | Low | |
| Bezafibrate | UDCA | Unclear | Low | High | High | Unclear | High | Low | Low | |
| Bezafibrate | UDCA | Unclear | Unclear | Unclear | Unclear | Unclear | High | Unclear | Low | |
| Bezafibrate + UDCA | UDCA | Low | Low | High | High | Low | Low | Low | Low | |
| Bezafibrate + UDCA | UDCA | Unclear | Low | High | High | Unclear | High | Low | Low | |
| Bezafibrate + UDCA | UDCA | Unclear | Unclear | Unclear | Unclear | Low | High | Unclear | Low | |
| Bezafibrate + UDCA | UDCA | Unclear | Unclear | Unclear | Unclear | Unclear | High | Low | Low | |
| Colchicine + UDCA | UDCA | Low | Low | Low | Low | High | High | Low | Low | |
| Colchicine + UDCA | UDCA | Unclear | Unclear | Unclear | Unclear | Low | High | Unclear | High | |
| Colchicine + UDCA | UDCA | Unclear | Unclear | Low | Low | Unclear | Low | High | Low | |
| Colchicine + UDCA | UDCA | Unclear | Unclear | Unclear | Unclear | High | High | Unclear | Low | |
| Colestilan + UDCA | UDCA | Unclear | Unclear | High | High | Unclear | High | Unclear | Low | |
| Fenofibrate + UDCA | UDCA | Unclear | Unclear | High | High | Unclear | High | Unclear | Low | |
| Glucocorticosteroids + UDCA | UDCA | Low | Unclear | Unclear | Unclear | High | High | High | Low | |
| Glucocorticosteroids + UDCA | UDCA | Unclear | Unclear | High | High | High | High | High | Low | |
| Glucocorticosteroids + UDCA | UDCA | Unclear | Unclear | Unclear | Unclear | Unclear | High | Unclear | Low | |
| Lamivudine + zidovudine + UDCA | UDCA | Low | Low | Low | Low | Unclear | High | High | Low | |
| Methotrexate + UDCA | UDCA | Unclear | Unclear | Unclear | Unclear | Low | High | High | Low | |
| Methotrexate + UDCA | UDCA | Unclear | Low | Unclear | Unclear | Unclear | Low | Unclear | Low | |
| Obeticholic acid + UDCA | UDCA | Low | Low | Low | Low | High | Low | High | Low | |
| TUDCA | UDCA | Unclear | Unclear | Unclear | Unclear | Low | High | Unclear | Low | |
| TUDCA | UDCA | Low | Low | Low | Low | Unclear | High | High | Low | |
| Colchicine | Methotrexate | Unclear | Unclear | Low | Low | High | High | Unclear | Low | |
| Comparison of doses | ||||||||||
| Intervention 1: UDCA (high) Intervention 2: UDCA (moderate) | UDCA (low) | Unclear | Unclear | Unclear | Unclear | Unclear | High | Unclear | Low | |
| Intervention 1: UDCA (high) Intervention 2: UDCA (moderate) | UDCA (low) | Low | Low | Low | Low | Unclear | Low | Unclear | Low | |
| UDCA (moderate) | UDCA (low) | Low | Low | High | High | Unclear | High | High | Low | |
| UDCA (high) | UDCA (moderate) | Unclear | Unclear | Unclear | Unclear | Unclear | High | Unclear | Low | |
TUDCA: taurodeoxycholic acid; UDCA: ursodeoxycholic acid.
Allocation
Twenty trials were at low risk of bias due to random sequence generation (Dickson 1985; Hoofnagle 1986; Warnes 1987; Mitchison 1989; Battezzati 1993; Mitchison 1993; Steenbergen 1994; Van Hoogstraten 1998; Wolfhagen 1998; Angulo 1999a; Hendrickse 1999; Leuschner 1999; Almasio 2000; Papatheodoridis 2002; Mason 2008; Askari 2010; Hirschfield 2015; Hosonuma 2015; Ma 2016; Nevens 2016). The remaining trials were at unclear risk of bias.
Twenty‐four trials were at low risk of bias due allocation concealment (Dickson 1985; Neuberger 1985; Hoofnagle 1986; Warnes 1987; Mitchison 1989; Oka 1990; Battezzati 1993; Mitchison 1993; Heathcote 1994; Gonzalezkoch 1997; Van Hoogstraten 1998; Wolfhagen 1998; Angulo 1999a; Hendrickse 1999; Almasio 2000; Papatheodoridis 2002; Iwasaki 2008a; Iwasaki 2008b; Mason 2008; Askari 2010; Cash 2013; Hosonuma 2015; Ma 2016; Nevens 2016). The remaining trials were at unclear risk of bias.
Sixteen trials were at low risk of both random sequence generation bias and allocation concealment bias (Dickson 1985; Warnes 1987; Mitchison 1989; Battezzati 1993; Mitchison 1993; Van Hoogstraten 1998; Wolfhagen 1998; Angulo 1999a; Hendrickse 1999; Almasio 2000; Papatheodoridis 2002; Mason 2008; Askari 2010; Hosonuma 2015; Ma 2016; Nevens 2016); these trials were considered to be at low risk of selection bias. The remaining trials were at unclear risk of selection bias.
Blinding
Thirty trials were at low risk of performance bias (Taal 1983; Christensen 1985; Dickson 1985; Neuberger 1985; Warnes 1987; Bodenheimer 1988; Minuk 1988; Oka 1990; Wiesner 1990; Poupon 1991a; Battezzati 1993; Lombard 1993; Mitchison 1993; Heathcote 1994; Lindor 1994; McCormick 1994; Turner 1994; Combes 1995a; Poupon 1996; Wolfhagen 1998; Angulo 1999a; Kaplan 1999; Almasio 2000; Pares 2000; Ueno 2005; Mason 2008; Askari 2010; Hirschfield 2015; Ma 2016; Nevens 2016). Thirteen trials were at high risk of performance bias (Heathcote 1976; Epstein 1979; Hoofnagle 1986; Mitchison 1989; Van Hoogstraten 1998; Yokomori 2001; Papatheodoridis 2002; Rautiainen 2005; Iwasaki 2008a; Iwasaki 2008b; Liberopoulos 2010; Cash 2013; Hosonuma 2015). The remaining trials were at unclear risk of performance bias.
Twenty‐nine trials were at low risk of detection bias (Taal 1983; Christensen 1985; Dickson 1985; Neuberger 1985; Warnes 1987; Bodenheimer 1988; Oka 1990; Wiesner 1990; Poupon 1991a; Battezzati 1993; Lombard 1993; Mitchison 1993; Heathcote 1994; Lindor 1994; McCormick 1994; Turner 1994; Combes 1995a; Poupon 1996; Wolfhagen 1998; Angulo 1999a; Kaplan 1999; Almasio 2000; Pares 2000; Ueno 2005; Mason 2008; Askari 2010; Hirschfield 2015; Ma 2016; Nevens 2016). Thirteen trials were at high risk of detection bias (Heathcote 1976; Epstein 1979; Hoofnagle 1986; Mitchison 1989; Van Hoogstraten 1998; Yokomori 2001; Papatheodoridis 2002; Rautiainen 2005; Iwasaki 2008a; Iwasaki 2008b; Liberopoulos 2010; Cash 2013; Hosonuma 2015). The remaining trials were at unclear risk of detection bias.
Twenty‐nine trials were at low risk of performance bias and detection bias (Taal 1983; Christensen 1985; Dickson 1985; Neuberger 1985; Warnes 1987; Bodenheimer 1988; Oka 1990; Wiesner 1990; Poupon 1991a; Battezzati 1993; Lombard 1993; Mitchison 1993; Heathcote 1994; Lindor 1994; McCormick 1994; Turner 1994; Combes 1995a; Poupon 1996; Wolfhagen 1998; Angulo 1999a; Kaplan 1999; Almasio 2000; Pares 2000; Ueno 2005; Mason 2008; Askari 2010; Hirschfield 2015; Ma 2016; Nevens 2016). Thirteen trials were at high risk of performance bias and detection bias (Heathcote 1976; Epstein 1979; Hoofnagle 1986; Mitchison 1989; Van Hoogstraten 1998; Yokomori 2001; Papatheodoridis 2002; Rautiainen 2005; Iwasaki 2008a; Iwasaki 2008b; Liberopoulos 2010; Cash 2013; Hosonuma 2015). The remaining trials were at unclear risk of performance and detection bias.
Incomplete outcome data
Fifteen trials were at low risk of attrition bias (Macklon 1982; Matloff 1982; Hoofnagle 1986; Mitchison 1989; Ferri 1993; Lombard 1993; McCormick 1994; Turner 1994; Combes 1995a; Ikeda 1996; Kanda 2003; Combes 2005; Askari 2010; Hirschfield 2015; Hosonuma 2015). Twenty‐two trials were at high risk of attrition bias due to dropouts which may have been related to the intervention that the participant received (Heathcote 1976; Christensen 1985; Dickson 1985; Kaplan 1986; Bodenheimer 1988; Leuschner 1989; Oka 1990; Poupon 1991a; Senior 1991; Battezzati 1993; Mitchison 1993; Raedsch 1993; Lindor 1994; Eriksson 1997; Kaplan 1999; Leuschner 1999; Almasio 2000; Papatheodoridis 2002; Rautiainen 2005; Cash 2013; Mayo 2015; Nevens 2016). The remaining trials were at unclear risk of attrition bias.
Selective reporting
We were unable to find any protocols published prior to the full study reports. Seventeen trials were at low risk of due to selecting outcome reporting (Macklon 1982; Matloff 1982; Taal 1983; Hoofnagle 1986; Warnes 1987; Minuk 1988; Leuschner 1989; Wiesner 1990; Lombard 1993; Mitchison 1993; Lindor 1994; Poupon 1996; Gonzalezkoch 1997; Angulo 1999a; Pares 2000; Hosonuma 2015; Nevens 2016). The remaining trials were at high risk of bias due to selective reporting (reporting bias).
Other potential sources of bias
For profit bias: nine trials receive no additional funding or were funded by parties with no vested interest in the results and were at low risk of for‐profit bias (Heathcote 1976; Hoofnagle 1986; Almasio 2000; Nakai 2000; Iwasaki 2008a; Iwasaki 2008b; Askari 2010; Cash 2013; Hosonuma 2015). Thirty‐one trials partially or fully funded by the pharmaceutical companies that would benefit based on the results of the trial were at high risk of for‐profit bias (Triger 1980; Matloff 1982; Christensen 1985; Dickson 1985; Bodenheimer 1988; Minuk 1988; Oka 1990; Wiesner 1990; Poupon 1991a; Senior 1991; Lombard 1993; Mitchison 1993; Heathcote 1994; Lindor 1994; McCormick 1994; Combes 1995a; Poupon 1996; Eriksson 1997; Van Hoogstraten 1998; Wolfhagen 1998; Leuschner 1999; Pares 2000; Papatheodoridis 2002; Combes 2005; Rautiainen 2005; Mason 2008; Bowlus 2014; Kowdley 2014a; Mayo 2015; Ma 2016; Nevens 2016). The remaining trials were at unclear risk of for‐profit bias.
Six trials were at high risk of other bias: authors presented the results of only a subgroup of participants without explaining the reason for this approach (Dickson 1985; Ikeda 1996); a significant proportion of participants crossed over from placebo to UDCA (Papatheodoridis 2002); it was unclear whether the participants continued to take UDCA in both groups (Askari 2010); participants continued to take varying doses of UDCA (Hirschfield 2015); and participants were allowed to continue previous prescriptions for primary biliary cholangitis (it was unclear whether this was balanced across groups) (Cash 2013). The remaining trials were at low risk of other bias.
Overall risk of bias
All trials were at high risk of bias in one or more domains.
Effects of interventions
See: Summary of findings for the main comparison Ursodeoxycholic acid (UDCA) versus no intervention for primary biliary cholangitis; Summary of findings 2 Azathioprine versus no intervention for primary biliary cholangitis; Summary of findings 3 Colchicine versus no intervention for primary biliary cholangitis; Summary of findings 4 Ciclosporin versus no intervention for primary biliary cholangitis; Summary of findings 5 D‐Penicillamine versus no intervention for primary biliary cholangitis; Summary of findings 6 Colchicine plus ursodeoxycholic acid (UDCA) versus UDCA for primary biliary cholangitis; Summary of findings 7 Methotrexate plus ursodeoxycholic acid (UDCA) versus UDCA for primary biliary cholangitis
Mortality at maximal follow‐up
Twenty‐eight trials including 2823 participants reported mortality at maximal follow‐up (Heathcote 1976; Epstein 1979; Macklon 1982; Matloff 1982; Taal 1983; Christensen 1985; Neuberger 1985; Hoofnagle 1986; Kaplan 1986; Warnes 1987; Minuk 1988; Leuschner 1989; Mitchison 1989; Wiesner 1990; Lombard 1993; Mitchison 1993; Heathcote 1994; Lindor 1994; Turner 1994; Poupon 1996; Gonzalezkoch 1997; Hendrickse 1999; Almasio 2000; Pares 2000; Papatheodoridis 2002; Combes 2005; Hosonuma 2015; Nevens 2016). The period of follow‐up in these trials varied between 11 and 96 months. The proportion of people with mortality (maximal follow‐up) was higher in the methotrexate group (adjusted proportion: 23.3%) than in the no intervention group (1/30 (3.3%)) (OR 8.83, 95% CI 1.01 to 76.96; 60 participants; 1 trial). The proportion of people with mortality (maximal follow‐up) was lower in the azathioprine group (adjusted proportion: 53.5%) than in the no intervention group (72/107 (67.3%)) (OR 0.56, 95% CI 0.32 to 0.98; 224 participants; 2 trials; I2 = 0%). There was no evidence of a difference in any of the remaining comparisons (Analysis 1.1).
Mortality (up to one year)
Eight trials including 655 participants reported mortality (up to year) (Heathcote 1976; Neuberger 1985; Warnes 1987; Minuk 1988; Leuschner 1989; Gonzalezkoch 1997; Almasio 2000; Nevens 2016). There was no evidence of a difference in any of the comparisons (Analysis 1.2).
Mortality (one to five years)
Twenty trials including 2168 participants reported mortality (one to five years) (Epstein 1979; Macklon 1982; Matloff 1982; Taal 1983; Christensen 1985; Hoofnagle 1986; Kaplan 1986; Mitchison 1989; Wiesner 1990; Lombard 1993; Mitchison 1993; Heathcote 1994; Lindor 1994; Turner 1994; Poupon 1996; Hendrickse 1999; Pares 2000; Papatheodoridis 2002; Combes 2005; Hosonuma 2015). The proportion of people with mortality (one to five years) was higher in the methotrexate group (adjusted proportion: 23.3%) than in the no intervention group (1/30 (3.3%)) (OR 8.83, 95% CI 1.01 to 76.96; 60 participants; 1 trial). There was no evidence of a difference in any of the remaining comparisons (Analysis 1.3).
Serious adverse events (proportion)
Eleven trials including 1076 participants reported serious adverse events (proportion) (Matloff 1982; Warnes 1987; Leuschner 1989; Lindor 1994; Poupon 1996; Kurihara 2000; Pares 2000; Kanda 2003; Mason 2008; Hirschfield 2015; Nevens 2016). The period of follow‐up varied from three to 41 months. The proportion of people with serious adverse events (proportion) was higher in the D‐penicillamine group (adjusted proportion: 28.8%; based on a control group proportion of 1%) versus the no intervention group (0/26 (0.0%)) (OR 28.77, 95% CI 1.57 to 526.67; 52 participants; 1 trial). The proportion of people with serious adverse events (proportion) was higher in the obeticholic acid plus UDCA group (adjusted proportion: 4.1%) versus the UDCA group (19/143 (13.3%)) (OR 3.58, 95% CI 1.02 to 12.51; 216 participants; 1 trial). There was no evidence of a difference in any of the remaining comparisons (Analysis 1.4).
Serious adverse events (number of events)
One trial including 216 participants reported serious adverse events (number of events) (Nevens 2016). The period of follow‐up was 12 months. There was no evidence of a difference between the UDCA plus obeticholic acid versus the UDCA groups (Analysis 1.5).
Adverse events (proportion)
Nineteen trials including 1652 participants reported adverse events (proportion) (Macklon 1982; Dickson 1985; Minuk 1988; Leuschner 1989; Wiesner 1990; Ferri 1993; Lombard 1993; Mitchison 1993; Raedsch 1993; Lindor 1994; Ikeda 1996; Gonzalezkoch 1997; Kurihara 2000; Pares 2000; Yokomori 2001; Kanda 2003; Rautiainen 2005; Gao 2012; Hirschfield 2015). The proportion of people with adverse events (proportion) was higher in the ciclosporin group (adjusted proportion: 76.2%) versus the no intervention group (97/189 (51.3%) (OR 3.04, 95% CI 1.98 to 4.68; 390; 3 trials; I2 = 27%), D‐penicillamine group (adjusted proportion: 50.6%) versus the no intervention group (25/135 (18.5%)) (OR 4.51, 95% CI 2.56 to 7.93; 287 participants; 2 trials; I2 = 0%); malotilate group (adjusted proportion: 19.2%) versus the no intervention group (1/49 (2.0%)) (OR 11.43, 95% CI 1.40 to 93.04; 101 participants; 1 trial); and obeticholic acid group (adjusted proportion: 96.1%) versus the no intervention group (32/38 (84.2%)) (OR 4.58, 95% CI 1.31 to 15.95; 165 participants; 1 trial). The proportion of people with adverse events (proportion) was higher in the glucocorticosteroids plus UDCA (adjusted proportion: 15.8%) versus the UDCA group (2/61 (3.3%) (OR 5.54, 95% CI 1.35 to 22.84; 135 participants; 2 trials; I2 = 0%) and methotrexate plus UDCA (adjusted proportion: 100.0%) versus the UDCA group (0/12 (0.0%)) (OR 115.00, 95% CI 4.98 to 2657.48; 25 participants; 1 trial). The proportion of people with adverse events (proportion) was higher in the taurodeoxycholic acid (TUDCA) group (adjusted proportion: 60.0%) versus the UDCA group (1/15 (6.7%)) (OR 21.00, 95% CI 2.16 to 204.61; 30 participants; 1 trial). There was no evidence of a difference in any of the remaining comparisons (Analysis 1.6).
Adverse events (number)
Fourteen trials including 1304 participants reported adverse events (number) (Matloff 1982; Taal 1983; Dickson 1985; Hoofnagle 1986; Minuk 1988; Wiesner 1990; Lombard 1993; Mitchison 1993; Ikeda 1996; Gonzalezkoch 1997; Wolfhagen 1998; Hirschfield 2015; Hosonuma 2015; Ma 2016). The number of adverse events was higher in the chlorambucil group (adjusted rate: 57.9 events per 100 participants) versus the no intervention group (3/11 (27.3 events per 100 participants)) (rate ratio 3.67, 95% CI 1.04 to 12.87; 24 participants; 1 trial); ciclosporin group (adjusted rate: 84.4 events per 100 participants) versus the no intervention group (128/189 (67.7 events per 100 participants)) (rate ratio 2.58, 95% CI 1.26 to 5.31; 390 participants; 3 trials; I2= 69%); D‐penicillamine group (adjusted rate: 48.4 events per 100 participants) versus the no intervention group (37/155 (23.9 events per 100 participants)) (rate ratio 2.99, 95% CI 1.04 to 8.63; 303 participants; 3 trials; I2 = 75%), malotilate group (adjusted rate: 20.7 events per 100 participants) versus the no intervention group (2/49 (4.1 events per 100 participants)) (rate ratio 6.13, 95% CI 1.38 to 27.14; 101 participants; 1 trial); and obeticholic acid group (adjusted rate: 175.0 events per 100 participants) versus the no intervention group (96/38 (252.6 events per 100 participants)) (rate ratio 1.41, 95% CI 1.13 to 1.75; 76 participants; 1 trial); ; ; ; . The number of adverse events was higher in the methotrexate plus UDCA group (adjusted rate: 30.6 events per 100 participants) versus the UDCA group (0/12 (0.0 events per 100 participants)) (rate ratio 30.64, 95% CI 1.84 to 510.76; 27 participants; 1 trial). There was no evidence of a difference in any of the remaining comparisons (Analysis 1.7).
Health‐related quality of life
None of the trials reported health‐related quality of life at any time point.
Liver transplantation
Eleven trials including 1561 participants reported liver transplantation (Neuberger 1985; Wiesner 1990; Lombard 1993; Heathcote 1994; Lindor 1994; Turner 1994; Eriksson 1997; Hendrickse 1999; Papatheodoridis 2002; Combes 2005; Hosonuma 2015). There was no evidence of a difference in any of the comparisons (Analysis 1.8).
Decompensated liver disease
Seven trials including 909 participants reported decompensated liver disease (Taal 1983; Combes 1995a; Almasio 2000; Papatheodoridis 2002; Combes 2005; Gao 2012; Nevens 2016). There was no evidence of a difference in any of the comparisons (Analysis 1.9).
Cirrhosis
Three trials including 103 participants reported cirrhosis (Heathcote 1976; Turner 1994; Wolfhagen 1998). There was no evidence of a difference in any of the comparisons (Analysis 1.10).
Hepatocellular carcinoma
None of the trials reported hepatocellular carcinoma.
Subgroup analysis
All the trials were at high risk of bias for one or more domains. None of the trials reported separate data for symptomatic and asymptomatic participants, AMA‐positive and AMA‐negative participants, or for responders and non‐responders to bile acids. A secondary analysis performed by stratifying for the doses of UDCA and obeticholic acid revealed no differences between the main analysis except for the following.
There was no evidence of differences in the proportion of people with adverse events when stratified by the dose of obeticholic acid (obeticholic acid (high) versus no intervention: OR 16.60, 95% CI 0.90 to 305.59; 79 participants; 1 trial; obeticholic acid (moderate) versus no intervention: OR 8.81, 95% CI 1.01 to 76.73; 86 participants; 1 trial; and obeticholic acid (low) versus no intervention: OR 1.59, 95% CI 0.41 to 6.17; 76 participants; 1 trial). In addition, when stratified by dose, only obeticholic acid (high) had higher number of adverse events than no intervention (rate ratio 1.91, 95% CI 1.50 to 2.44; 79 participants; 1 trial). It also had higher number of adverse events than obeticholic acid (moderate) and obeticholic acid (low) (obeticholic acid (moderate) versus obeticholic acid (high): rate ratio 0.66, 95% CI 0.53 to 0.81; 89 participants; 1 trial; obeticholic acid (low) versus obeticholic acid (high): rate ratio 0.55, 95% CI 0.43 to 0.70; 79 participants; 1 trial).
Sensitivity analysis
We did not perform a sensitivity analysis of imputing information based on different scenarios because of paucity of data to carry out these analyses. We did not impute standard deviation; therefore, we did not perform a sensitivity analysis to assess the impact of imputing the standard deviation.
Reporting bias
We did not assess reporting bias by creating a funnel plot because of the few trials included under each comparison.
Using fixed‐effect model versus random‐effects model
The interpretation of results was not altered based on the model used for analysis.
Quality of evidence
The overall quality of evidence was very low for all the outcomes (summary of findings Table for the main comparison; summary of findings Table 2; summary of findings Table 3; summary of findings Table 4; summary of findings Table 5; summary of findings Table 6; summary of findings Table 7). This was because of the high risk of bias in all the trials (downgraded by two levels); small sample sizes for all outcomes and wide CIs (downgraded by two levels for imprecision) and heterogeneity (downgraded by two levels) for some of the outcomes.
Sample size calculations and Trial Sequential Analysis
The required sample size for identifying a 20% relative risk reduction in the different outcomes based on an alpha error of 5%, a beta error of 20%, and the control group proportion observed across trials were as follows.
-
Mortality (up to one year) (control group proportion: 25.2%): 2166 participants.
-
Mortality (one to five years) (control group proportion: 20.0%): 2894 participants.
-
Mortality at maximal follow‐up (control group proportion: 20.8%): 2758 participants.
-
Serious adverse events (proportion) (control group proportion: 0.4%): 175,996 participants.
-
Adverse events (proportion) (control group proportion: 27%): 1978 participants.
-
Liver transplantation (control group proportion: 7.4%): 8910 participants.
-
Decompensated liver disease (control group proportion: 20.8%): 2758 participants.
-
Cirrhosis (control group proportion: 55.6%): 632 participants.
The above mentioned are sample sizes uncorrected for heterogeneity. In the presence of heterogeneity, for example, in the presence of a heterogeneity of 27%, the required information size for adverse events (proportion) is 1978/(1 ‐ 0.27) = 2710 participants.
As shown in Figure 4, Figure 5, and Figure 6, the accrued sample sizes were only small fractions of the diversity‐adjusted required information size (DARIS) and therefore, the boundaries could not be drawn. There was a high risk of random errors. The TSA‐adjusted CI could not be calculated as there was too little information for the calculation (i.e. the CIs were wide).
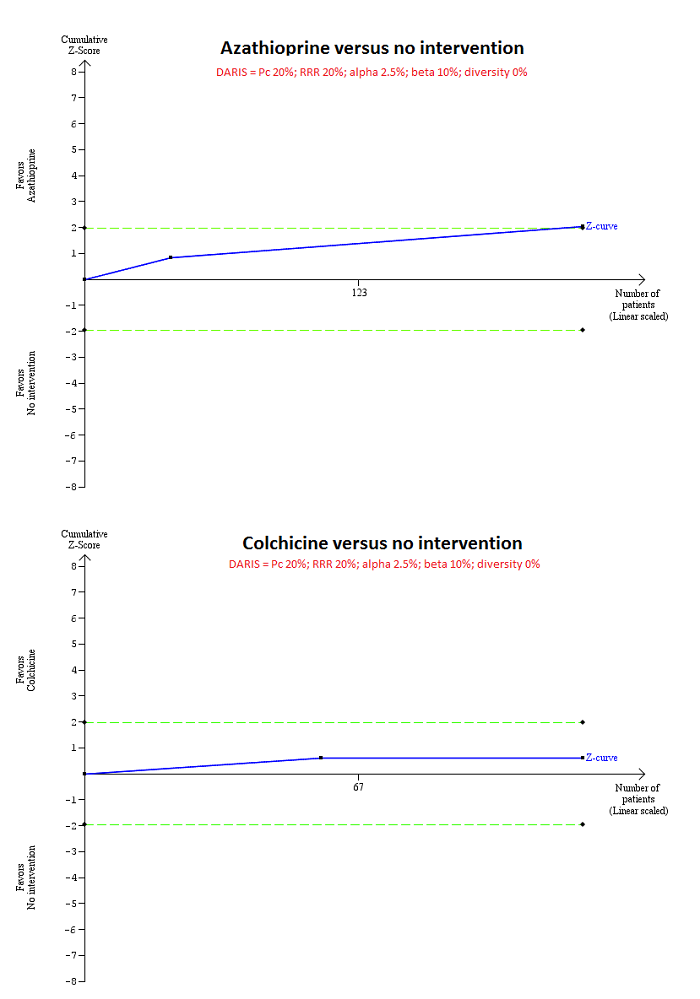
Trial Sequential Analysis of mortality at maximal follow‐up: azathioprine versus no intervention and colchicine versus no intervention.
Based on an alpha error of 2.5%, power of 90% (beta error of 10%), a relative risk reduction (RRR) of 20%, a control group proportion observed in the trials (Pc = 20%), and diversity observed in the analyses (0%), the accrued sample size (224 for azathioprine versus intervention and 122 for colchicine versus no intervention) was only a small fraction of the diversity adjusted required information size (DARIS) (4580 for both comparisons); therefore, the trial sequential monitoring boundaries were not drawn. The Z‐curve (blue line) crossed the conventional boundaries (dotted green line) favouring azathioprine for azathioprine versus no intervention, but did not cross the conventional boundaries for colchicine versus no intervention. This indicates that there is a high risk of random errors in both these comparisons.

Trial Sequential Analysis of mortality at maximal follow‐up: ciclosporin versus no intervention and D‐penicillamine versus no intervention.
Based on an alpha error of 2.5%, power of 90% (beta error of 10%), a relative risk reduction (RRR) of 20%, a control group proportion observed in the trials (Pc = 20%), and diversity observed in the analyses (82% for ciclosporin versus no intervention and 61% for D‐penicillamine versus no intervention), the accrued sample size (394 for ciclosporin versus no intervention and 423 for D‐penicillamine versus no intervention) was only a small fraction of the diversity adjusted required information size (DARIS) (25,098 for ciclosporin versus no intervention and 11,623 for D‐penicillamine versus no intervention); therefore, the trial sequential monitoring boundaries were not drawn. The Z‐curve (blue line) crossed the conventional boundaries (dotted green line) favouring ciclosporin for ciclosporin versus no intervention, but did not cross the conventional boundaries for D‐penicillamine versus no intervention. This indicates that there is a high risk of random errors in both these comparisons.
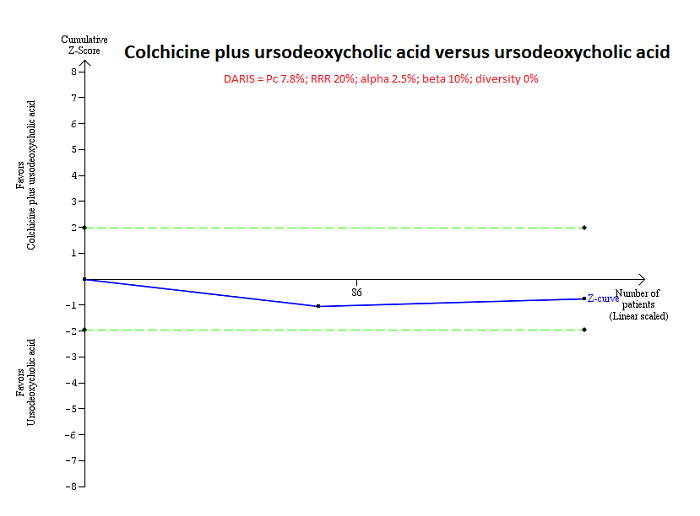
Trial Sequential Analysis of mortality at maximal follow‐up: colchicine plus UDCA versus UDCA.
Based on an alpha error of 2.5%, power of 90% (beta error of 10%), a relative risk reduction (RRR) of 20%, a control group proportion observed in the trials (Pc = 7.8%), and diversity observed in the analyses (0%), the accrued sample size (160 participants) was only a small fraction of the diversity adjusted required information size (DARIS) (13,316); therefore, the trial sequential monitoring boundaries were not drawn. The Z‐curve (blue line) did not cross the conventional boundaries (green dotted line). This indicates that there is a high risk of random errors in both this comparison.
Discussion
Summary of main results
We included 74 trials (5902 participants) in this review, and included 4274 participants from 46 trials in one or more outcomes in this review. We did not perform the planned network meta‐analysis because there was no closed loop (i.e. outcomes for which direct and indirect estimates were available to allow us estimation of inconsistency). Therefore, we reported only the direct comparisons. We reported the results from frequentist meta‐analysis only as it is more familiar to people.
Although mortality at maximal follow‐up was lower in people who received azathioprine versus no intervention, there was no evidence of any reduction in mortality by any intervention, either at less than one year or between one and five years. However, this evidence is unreliable because the Christensen 1985 trial excluded a large proportion of participants (25%) (i.e. only 185/224 participants were included in the meta‐analysis). The Trial Sequential Analysis showed that only a small proportion of the required information size was reached and the risk of random errors was high. In addition to the risk of systematic errors and random errors, the proportion of people who died was high (71.3%) in the no intervention group of the Christensen 1985 trial compared to the other trials (the overall mortality at maximal follow‐up was 20.8%). Although this difference could be due to the shorter follow‐up periods in some of the other trials, the mortality observed in this trial was much higher than that observed in the other trials with similar or longer follow‐up such as Epstein 1979; Hendrickse 1999; and Papatheodoridis 2002. The general care of people with cirrhosis is likely to have improved since the 1980s and it is unlikely to be as high as that mortality observed in Christensen 1985. This is another reason why there is no need to recommend azathioprine routinely in people with primary biliary cholangitis.
There was no evidence of a decrease in liver transplantation, decompensated liver disease, or cirrhosis in any of the interventions compared with no intervention. However, several interventions increased the number of people with, and total number of, adverse events. Although the Trial Sequential Analysis revealed that only a small proportion of the required information size was reached, the risk of random errors was high. Thus, concluding that there were more adverse events in some of these comparisons is only of academic interest because none of the interventions appeared to result in clinical benefit.
However, it has to be pointed out that the periods of follow‐up in the trials were sufficiently long to identify any differences in clinical outcomes because primary biliary cholangitis is a slowly progressive disease. Trials with sufficient follow‐up (e.g. five or 10 years) are required to detect any differences in clinically important outcomes.
Overall completeness and applicability of evidence
The trials included symptomatic and asymptomatic primary biliary cholangitis, AMA‐positive and AMA‐negative primary biliary cholangitis, treatment‐naive people, and people regardless of the treatments that they had received previously. However, majority of the trials excluded people with advanced liver cirrhosis and primary biliary cholangitis in people with other liver diseases. Therefore, this review is applicable to people with primary biliary cholangitis without advanced liver cirrhosis or with coexisting other liver diseases.
Quality of the evidence
The overall quality of evidence was very low for all the outcomes. The major reasons for this were the high risk of bias in the trials, in particular, exclusion of participants from the analysis after randomisation, small sample size, and imprecision. Overall, there were serious concerns about whether the effect estimates observed were the true effect estimates.
Potential biases in the review process
We followed the guidance of the Cochrane Handbook for Systematic Reviews of Interventions with two review authors independently selecting trials and extracting data (Higgins 2011). We performed a thorough search of the literature. However, the search period includes the premandatory trial registration era and it is possible that some trials on treatments that were not effective or were harmful were not reported at all.
We excluded studies which compared variations in the different treatments. Hence, this review does not provide information on whether one variation is better than another.
We only included randomised clinical trials which are known to focus mostly on benefits and do not collect and report harms in a detailed manner. Therefore, we might have missed a large number of studies that addressed the reporting of harms. Accordingly, this review is biased towards benefits ignoring harms. We did not search for interventions and trials registered at regulatory authorities (e.g. US Food and Drug Administration; European Medicines Agency, etc.). This may have overlooked trials and as such trials usually are unpublished, the lack of inclusion of such trials may make our comparisons look more advantageous than they really are. However, this is of academic interest only because there is no evidence of benefit of any treatment in people with primary biliary cholangitis (i.e. there is no reason to suggest that any of the treatments should be used in routine clinical practice regardless of the adverse event profile of the intervention).
We planned to perform a network meta‐analysis. However, it was not possible to assess whether the potential effect modifiers were similar across different comparisons. Performing a network meta‐analysis in this scenario can be misleading. Therefore, we did not perform the network meta‐analysis, and assessed the comparative benefits and harms of different interventions using standard Cochrane methodology.
Agreements and disagreements with other studies or reviews
We identified three network meta‐analyses on this topic (Zhu 2015a; Zhu 2015b; Zhu 2015c). We disagreed with the authors of these reviews that UDCA in combination with corticosteroids or methotrexate are effective interventions in the treatment of primary biliary cholangitis. The disagreements were probably due to considering mortality and liver transplantation separately in this review compared to Zhu 2015a and Zhu 2015b and only including evidence prior to cross‐over in our review. In particular, the cross‐over was not true cross‐over where the interventions were swapped but all the participants belonging to the 'no intervention' were switched over to the intervention. Therefore, it was not possible to obtain the effect estimate adjusted for intra‐participant correlation either. It should be also noted that the decision to switch the no intervention to intervention was based on improvement of some laboratory parameters which are invalidated surrogate outcomes. This can only be considered as observational evidence. We disagree with current EASL and AASLD guideline recommendations that UDCA should be used for the management of primary biliary cholangitis (EASL 2009; Lindor 2009). Again, these recommendations were based on observational evidence and invalidated surrogate outcomes (Gluud 2007).
We agreed with several systematic reviews that showed that none of the interventions are effective in improving survival or other major clinical outcomes such as cirrhosis or liver transplantation (Giljaca 2010; Rudic 2012a; Rudic 2012b; Yin 2015; Zhang 2015).
Risk of bias graph: review authors' judgements about each risk of bias item presented as percentages across all included studies.
Risk of bias summary: review authors' judgements about each risk of bias item for each included study.
Trial Sequential Analysis of mortality at maximal follow‐up: azathioprine versus no intervention and colchicine versus no intervention.
Based on an alpha error of 2.5%, power of 90% (beta error of 10%), a relative risk reduction (RRR) of 20%, a control group proportion observed in the trials (Pc = 20%), and diversity observed in the analyses (0%), the accrued sample size (224 for azathioprine versus intervention and 122 for colchicine versus no intervention) was only a small fraction of the diversity adjusted required information size (DARIS) (4580 for both comparisons); therefore, the trial sequential monitoring boundaries were not drawn. The Z‐curve (blue line) crossed the conventional boundaries (dotted green line) favouring azathioprine for azathioprine versus no intervention, but did not cross the conventional boundaries for colchicine versus no intervention. This indicates that there is a high risk of random errors in both these comparisons.
Trial Sequential Analysis of mortality at maximal follow‐up: ciclosporin versus no intervention and D‐penicillamine versus no intervention.
Based on an alpha error of 2.5%, power of 90% (beta error of 10%), a relative risk reduction (RRR) of 20%, a control group proportion observed in the trials (Pc = 20%), and diversity observed in the analyses (82% for ciclosporin versus no intervention and 61% for D‐penicillamine versus no intervention), the accrued sample size (394 for ciclosporin versus no intervention and 423 for D‐penicillamine versus no intervention) was only a small fraction of the diversity adjusted required information size (DARIS) (25,098 for ciclosporin versus no intervention and 11,623 for D‐penicillamine versus no intervention); therefore, the trial sequential monitoring boundaries were not drawn. The Z‐curve (blue line) crossed the conventional boundaries (dotted green line) favouring ciclosporin for ciclosporin versus no intervention, but did not cross the conventional boundaries for D‐penicillamine versus no intervention. This indicates that there is a high risk of random errors in both these comparisons.
Trial Sequential Analysis of mortality at maximal follow‐up: colchicine plus UDCA versus UDCA.
Based on an alpha error of 2.5%, power of 90% (beta error of 10%), a relative risk reduction (RRR) of 20%, a control group proportion observed in the trials (Pc = 7.8%), and diversity observed in the analyses (0%), the accrued sample size (160 participants) was only a small fraction of the diversity adjusted required information size (DARIS) (13,316); therefore, the trial sequential monitoring boundaries were not drawn. The Z‐curve (blue line) did not cross the conventional boundaries (green dotted line). This indicates that there is a high risk of random errors in both this comparison.

Comparison 1 Main analysis, Outcome 1 Mortality at maximal follow‐up.
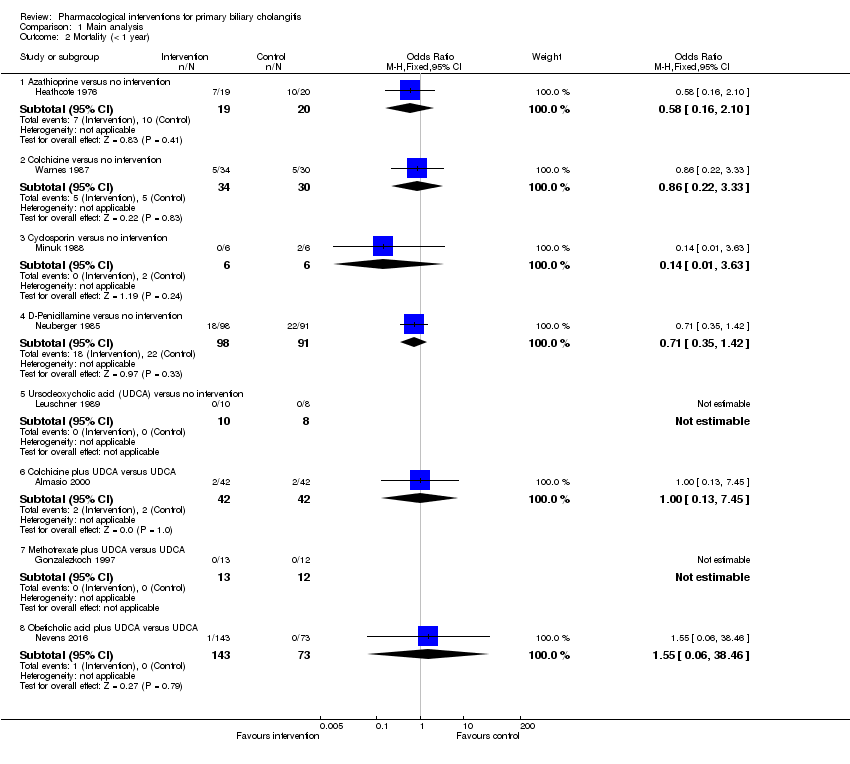
Comparison 1 Main analysis, Outcome 2 Mortality (< 1 year).

Comparison 1 Main analysis, Outcome 3 Mortality (1 to 5 years).
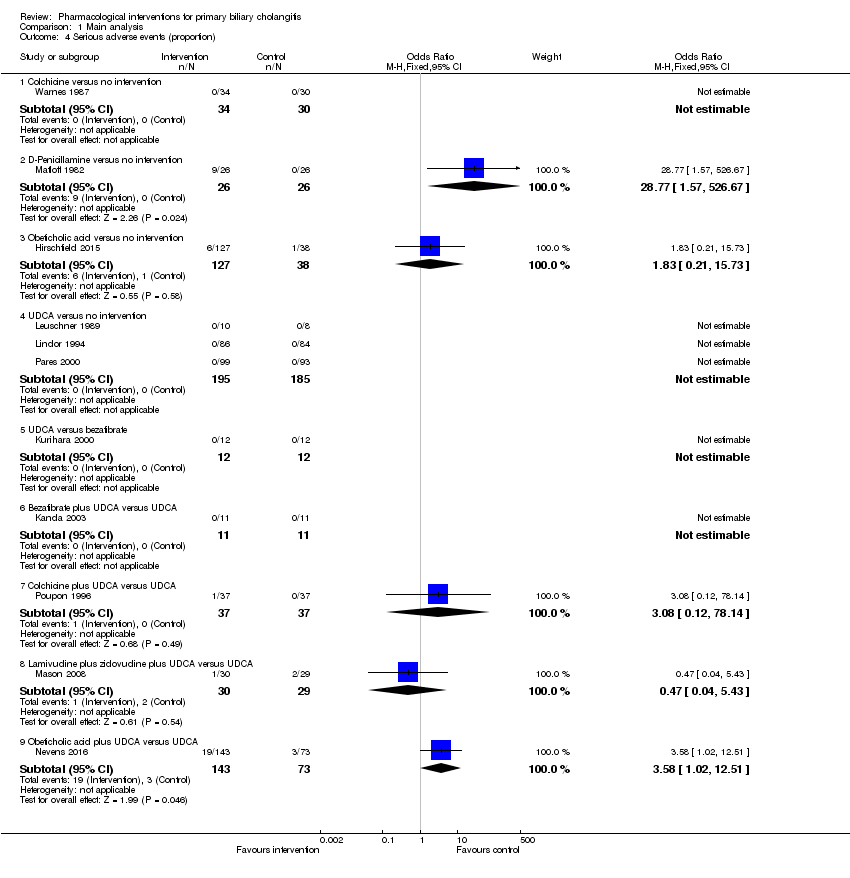
Comparison 1 Main analysis, Outcome 4 Serious adverse events (proportion).

Comparison 1 Main analysis, Outcome 5 Serious adverse events (number of events).
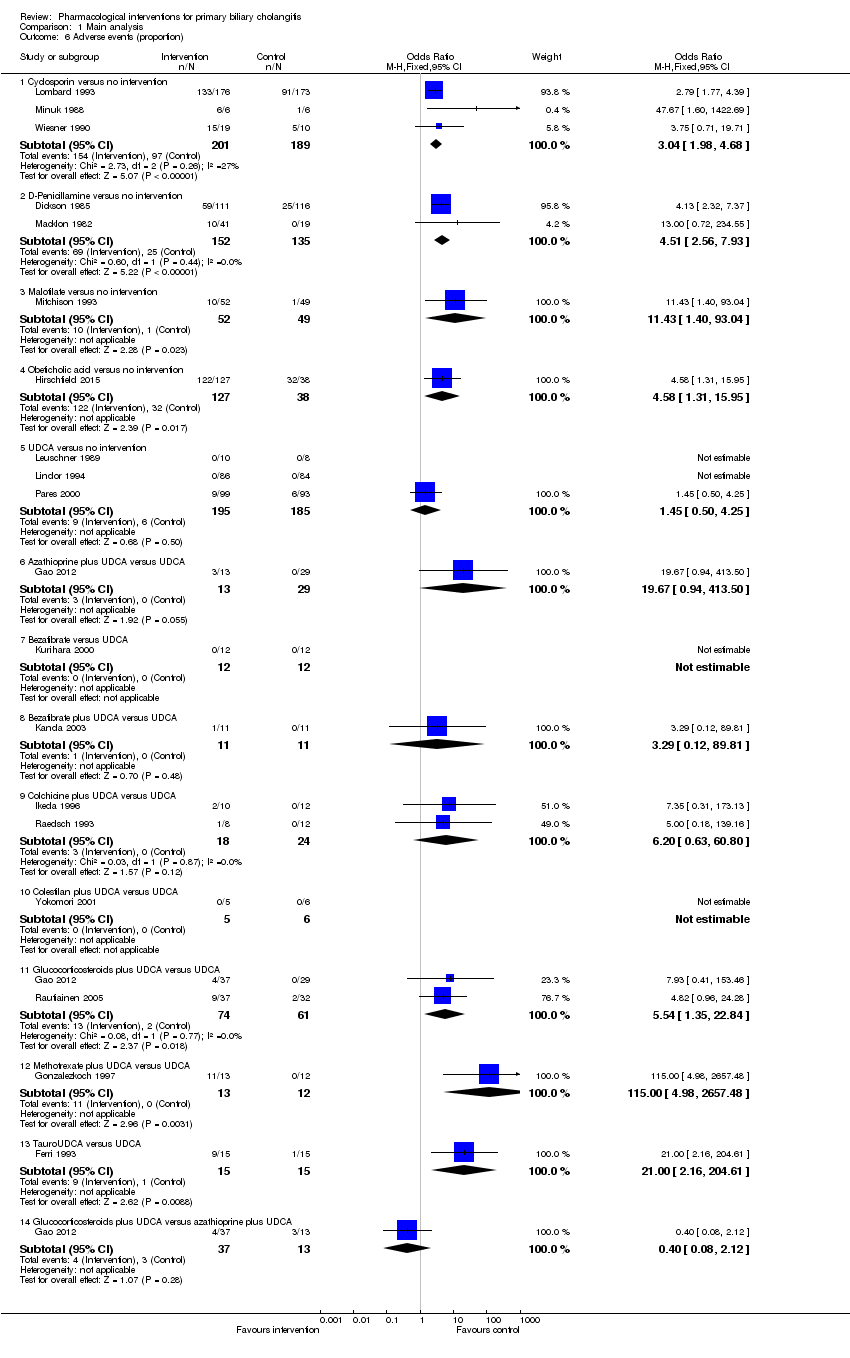
Comparison 1 Main analysis, Outcome 6 Adverse events (proportion).

Comparison 1 Main analysis, Outcome 7 Adverse events (number).

Comparison 1 Main analysis, Outcome 8 Liver transplantation.
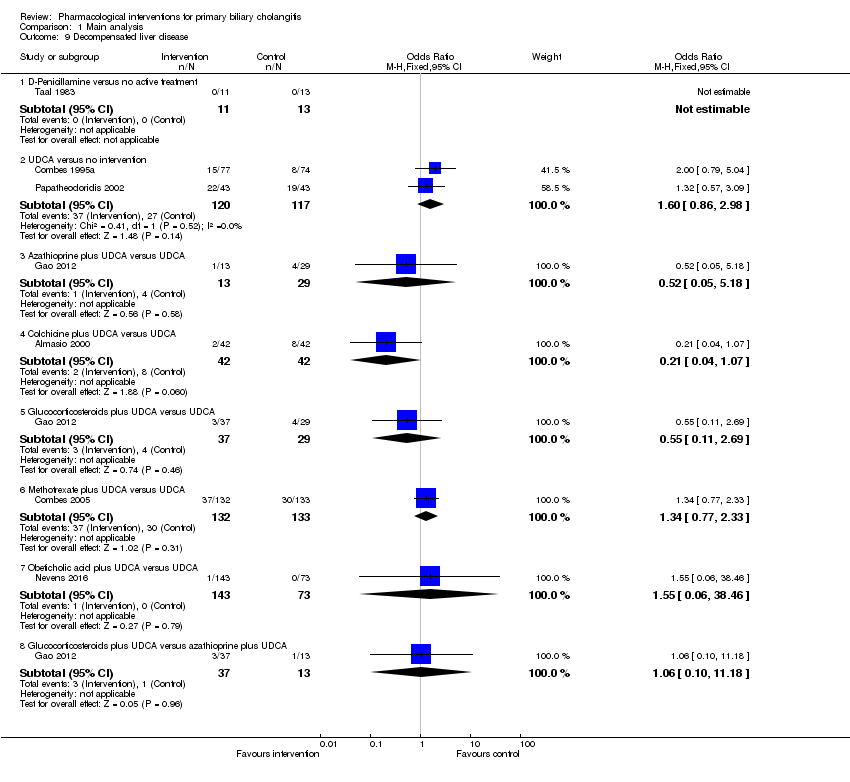
Comparison 1 Main analysis, Outcome 9 Decompensated liver disease.
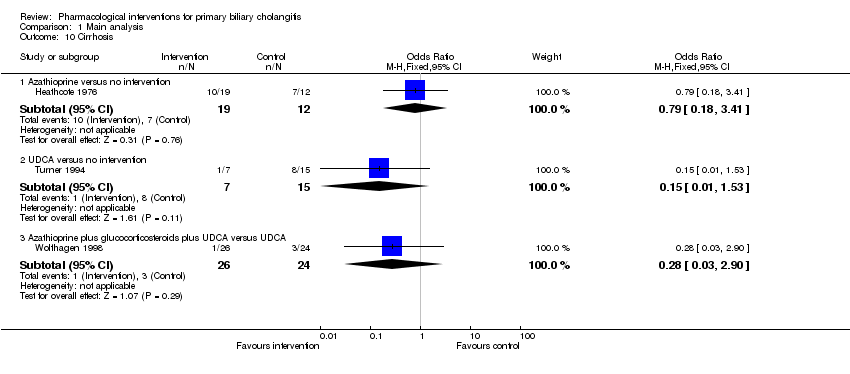
Comparison 1 Main analysis, Outcome 10 Cirrhosis.
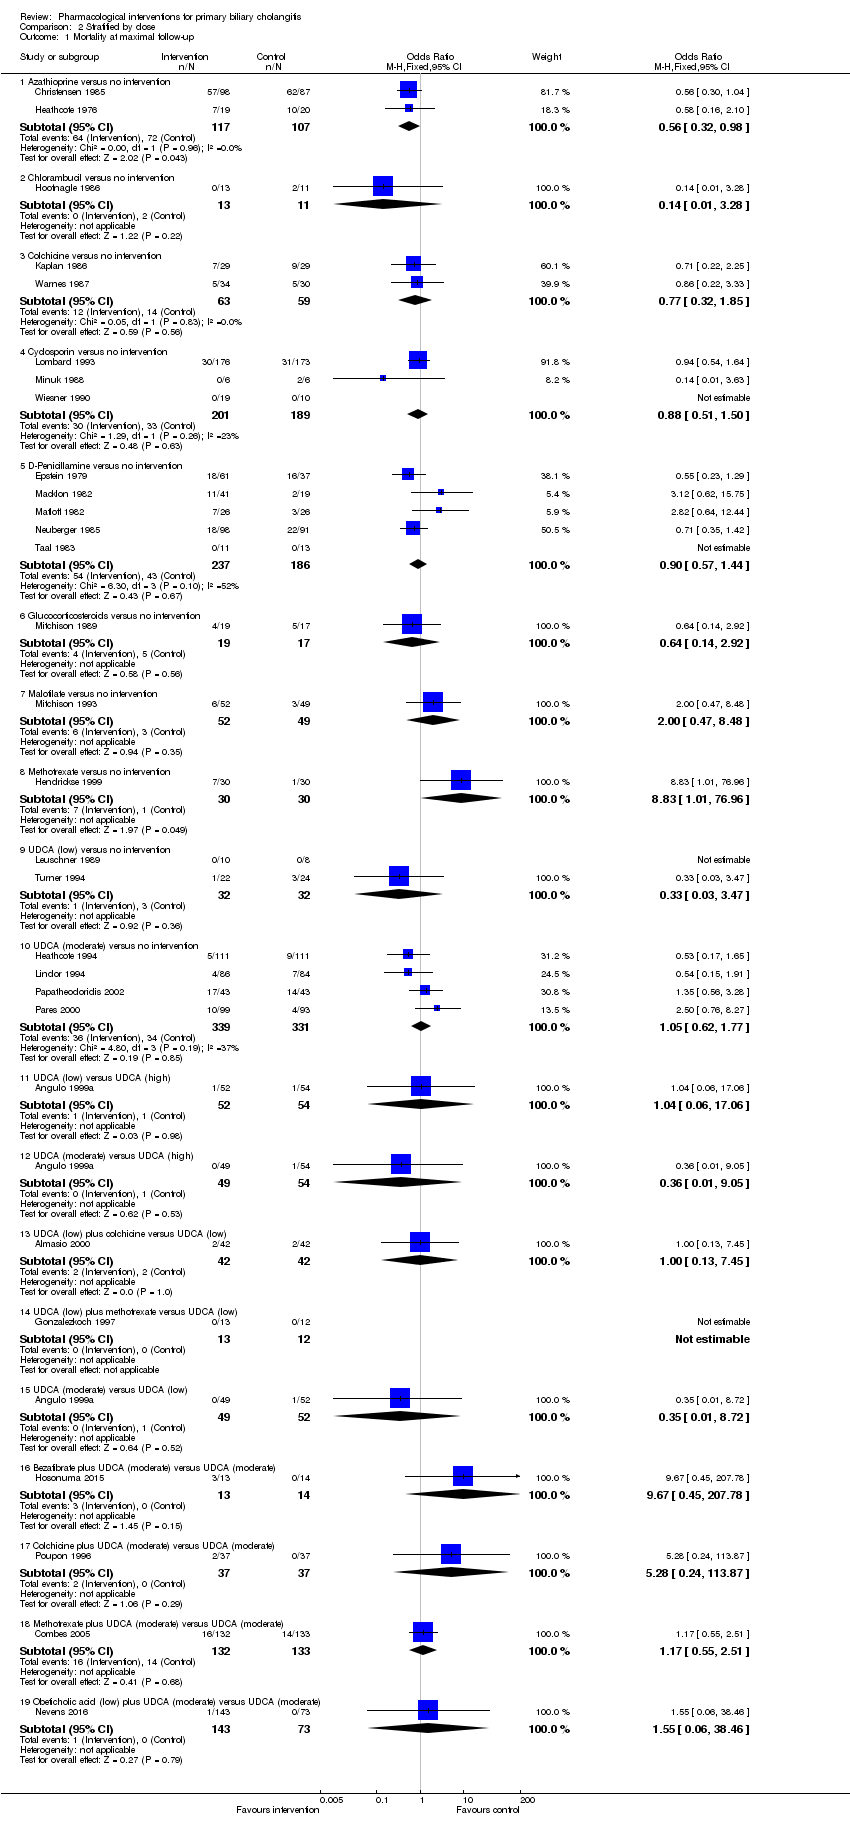
Comparison 2 Stratified by dose, Outcome 1 Mortality at maximal follow‐up.

Comparison 2 Stratified by dose, Outcome 2 Mortality (< 1 year).

Comparison 2 Stratified by dose, Outcome 3 Mortality (1 to 5 years).
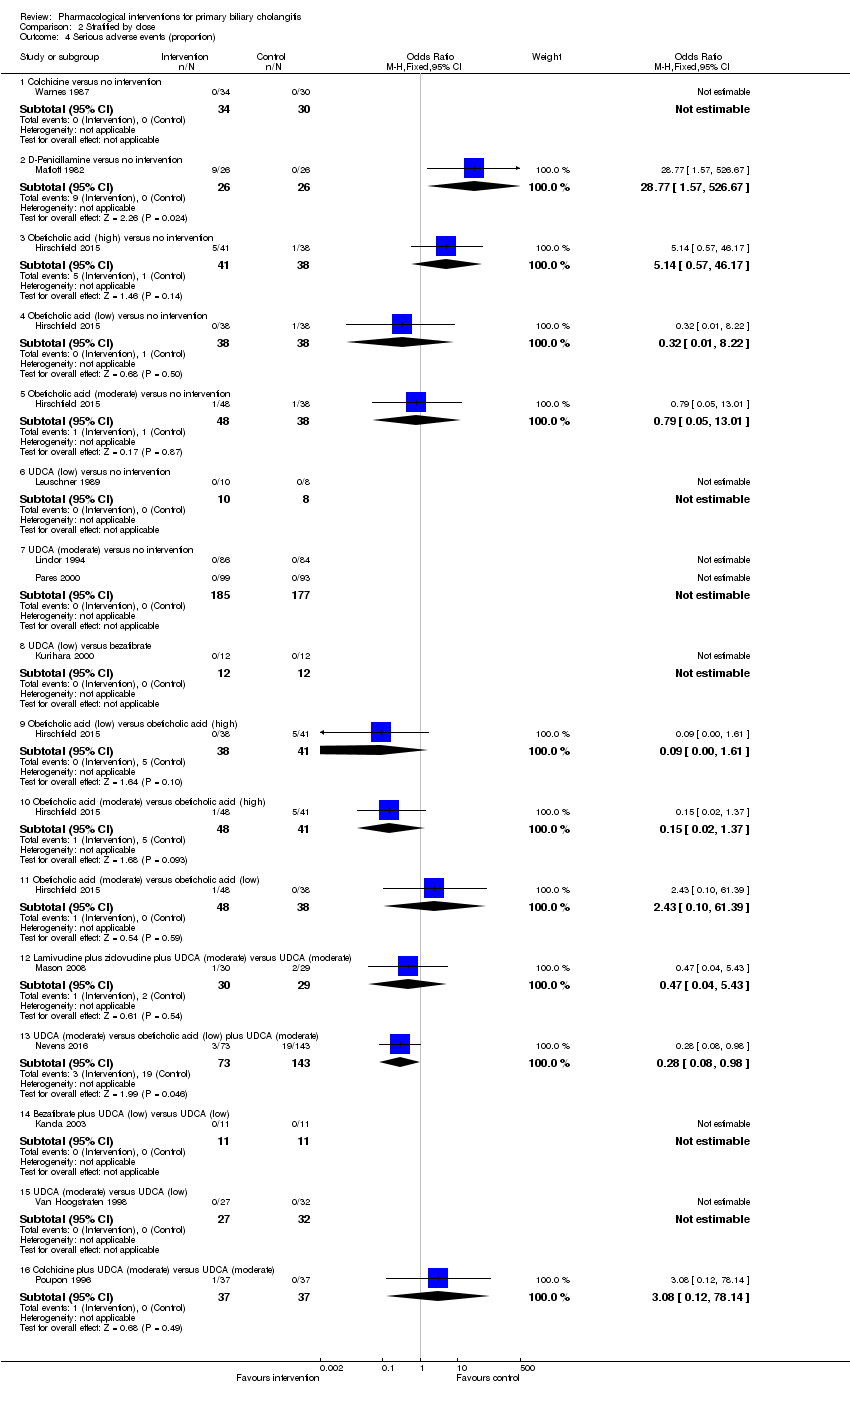
Comparison 2 Stratified by dose, Outcome 4 Serious adverse events (proportion).

Comparison 2 Stratified by dose, Outcome 5 Serious adverse events (number of events).
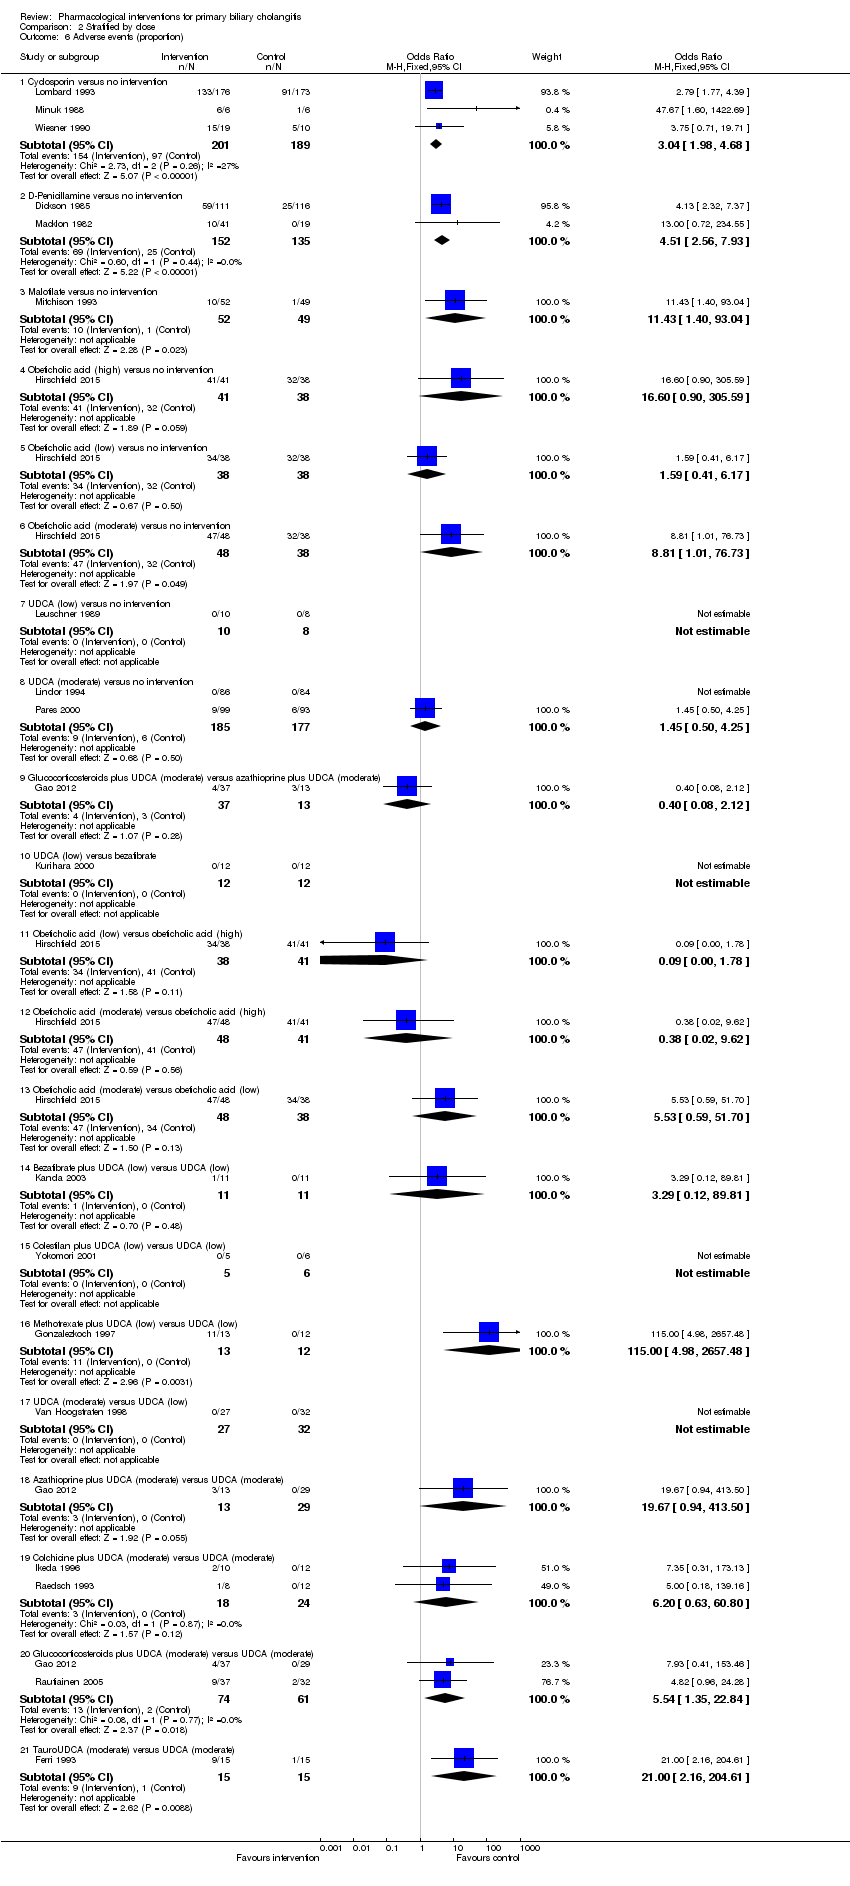
Comparison 2 Stratified by dose, Outcome 6 Adverse events (proportion).

Comparison 2 Stratified by dose, Outcome 7 Adverse events (number).

Comparison 2 Stratified by dose, Outcome 8 Liver transplantation.
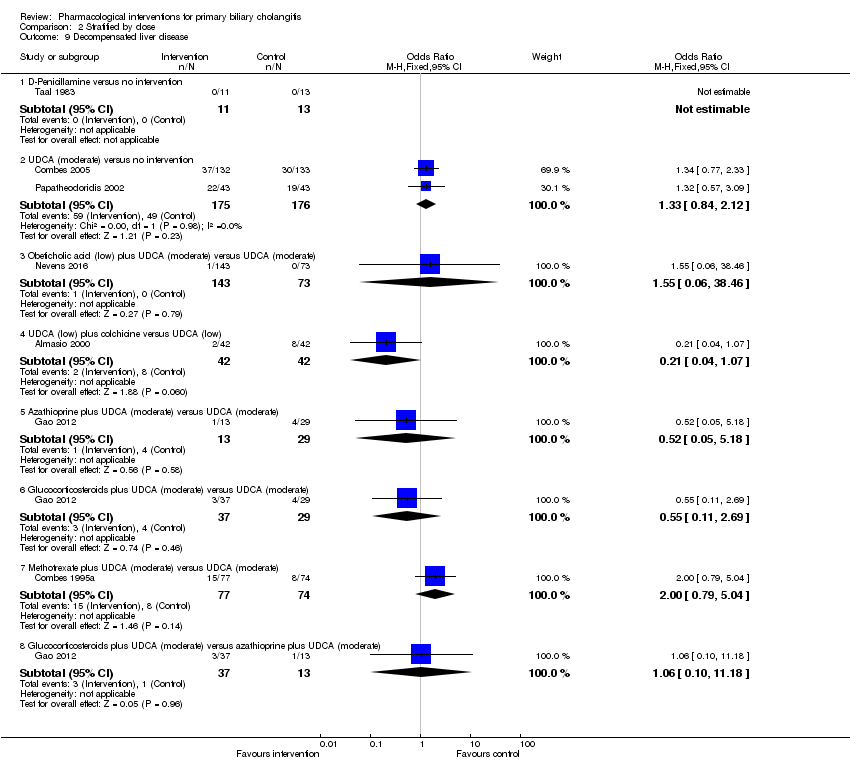
Comparison 2 Stratified by dose, Outcome 9 Decompensated liver disease.

Comparison 2 Stratified by dose, Outcome 10 Cirrhosis.
| UDCA versus no intervention for primary biliary cholangitis | |||||
| Patient or population: people with primary biliary cholangitis Settings: secondary or tertiary care Intervention: UDCA Comparison: no intervention | |||||
| Outcomes | Illustrative comparative risks* (95% CI) | Relative effect | No of participants | Quality of the evidence | |
| Assumed risk | Corresponding risk | ||||
| No intervention | UDCA | ||||
| Mortality at maximal follow‐up Follow‐up: 12 to 89 months | 208 per 1000 | 206 per 1000 | OR 0.99 | 734 | ⊕⊝⊝⊝ |
| Serious adverse events (proportion) Follow‐up: 12 to 41 months | There were no events in either group | 380 | ⊕⊝⊝⊝ | ||
| Serious adverse events (number of events) | None of the trials reported this outcome. | ||||
| Health‐related quality of life | None of the trials reported this outcome. | ||||
| *The basis for the assumed risk is the mean control group proportion across all the trials. The corresponding risk (and its 95% confidence interval) is based on the assumed risk in the comparison group and the relative effect of the intervention (and its 95% CI). | |||||
| GRADE Working Group grades of evidence | |||||
| 1 Risk of bias in the trial(s) was high (downgraded by two levels). 3 There was moderate heterogeneity (downgraded by one level). | |||||
| Azathioprine versus no intervention for primary biliary cholangitis | |||||
| Patient or population: people with primary biliary cholangitis Settings: secondary or tertiary care Intervention: azathioprine Comparison: no intervention | |||||
| Outcomes | Illustrative comparative risks* (95% CI) | Relative effect | No of participants | Quality of the evidence | |
| Assumed risk | Corresponding risk | ||||
| No intervention | Azathioprine | ||||
| Mortality at maximal follow‐up Follow‐up: 63 months in 1 trial and not stated in 1 trial | 208 per 1000 | 128 per 1000 | OR 0.56 | 224 | ⊕⊝⊝⊝ |
| Serious adverse events (proportion) | None of the trials reported this outcome. | ||||
| Serious adverse events (number of events) | None of the trials reported this outcome. | ||||
| Health‐related quality of life | None of the trials reported this outcome. | ||||
| *The basis for the assumed risk is the mean control group proportion across all the trials. The corresponding risk (and its 95% confidence interval) is based on the assumed risk in the comparison group and the relative effect of the intervention (and its 95% CI). | |||||
| GRADE Working Group grades of evidence | |||||
| 1 Risk of bias in the trial(s) was high (downgraded by two levels). | |||||
| Colchicine versus no intervention for primary biliary cholangitis | |||||
| Patient or population: people with primary biliary cholangitis Settings: secondary or tertiary care Intervention: colchicine Comparison: no intervention | |||||
| Outcomes | Illustrative comparative risks* (95% CI) | Relative effect | No of participants | Quality of the evidence | |
| Assumed risk | Corresponding risk | ||||
| No intervention | Colchicine | ||||
| Mortality at maximal follow‐up Follow‐up: 12 to 24 months | 208 per 1000 | 168 per 1000 | OR 0.77 | 122 | ⊕⊝⊝⊝ |
| Serious adverse events (proportion) Follow‐up: 12 months | There were no events in either group | 64 | ⊕⊝⊝⊝ | ||
| Serious adverse events (number of events) | None of the trials reported this outcome. | ||||
| Health‐related quality of life | None of the trials reported this outcome. | ||||
| *The basis for the assumed risk is the mean control group proportion across all the trials. The corresponding risk (and its 95% confidence interval) is based on the assumed risk in the comparison group and the relative effect of the intervention (and its 95% CI). | |||||
| GRADE Working Group grades of evidence | |||||
| 1 Risk of bias in the trial(s) was high (downgraded by two levels). 3 There was moderate heterogeneity (downgraded by one level). | |||||
| Ciclosporin versus no intervention for primary biliary cholangitis | |||||
| Patient or population: people with primary biliary cholangitis Settings: secondary or tertiary care Intervention: ciclosporin Comparison: no intervention | |||||
| Outcomes | Illustrative comparative risks* (95% CI) | Relative effect | No of participants | Quality of the evidence | |
| Assumed risk | Corresponding risk | ||||
| No intervention | Ciclosporin | ||||
| Mortality at maximal follow‐up Follow‐up: 31 to 35 months | 208 per 1000 | 188 per 1000 | OR 0.88 | 390 | ⊕⊝⊝⊝ |
| Serious adverse events (proportion) | None of the trials reported this outcome. | ||||
| Serious adverse events (number of events) | None of the trials reported this outcome. | ||||
| Health‐related quality of life | None of the trials reported this outcome. | ||||
| *The basis for the assumed risk is the mean control group proportion across all the trials. The corresponding risk (and its 95% confidence interval) is based on the assumed risk in the comparison group and the relative effect of the intervention (and its 95% CI). | |||||
| GRADE Working Group grades of evidence | |||||
| 1 Risk of bias in the trial(s) was high (downgraded by two levels). | |||||
| D‐Penicillamine versus no intervention for primary biliary cholangitis | |||||
| Patient or population: people with primary biliary cholangitis Settings: secondary or tertiary care Intervention: D‐penicillamine Comparison: no intervention | |||||
| Outcomes | Illustrative comparative risks* (95% CI) | Relative effect | No of participants | Quality of the evidence | |
| Assumed risk | Corresponding risk | ||||
| No intervention | D‐Penicillamine | ||||
| Mortality at maximal follow‐up (Follow‐up 24 to 66 months) | 208 per 1000 | 191 per 1000 | OR 0.90 | 423 | ⊕⊝⊝⊝ |
| Serious adverse events (proportion) (Follow‐up 24 months) | 4 per 1000 | 104 per 1000 | OR 28.77 | 52 | ⊕⊝⊝⊝ |
| Serious adverse events (number of events) | None of the trials reported this outcome. | ||||
| Health‐related quality of life | None of the trials reported this outcome. | ||||
| *The basis for the assumed risk is the mean control group proportion across all the trials. The corresponding risk (and its 95% confidence interval) is based on the assumed risk in the comparison group and the relative effect of the intervention (and its 95% CI). | |||||
| GRADE Working Group grades of evidence | |||||
| 1 Risk of bias in the trial(s) was high (downgraded by two levels). 3 There was moderate heterogeneity (downgraded by one level). | |||||
| Colchicine plus UDCA versus UDCA for primary biliary cholangitis | |||||
| Patient or population: people with primary biliary cholangitis Settings: secondary or tertiary care Intervention: colchicine + UDCA Comparison: UDCA | |||||
| Outcomes | Illustrative comparative risks* (95% CI) | Relative effect | No of participants | Quality of the evidence | |
| Assumed risk | Corresponding risk | ||||
| UDCA | Colchicine + UDCA | ||||
| Mortality at maximal follow‐up Follow‐up: 24 months in 1 trial; not reported in 1 trial | 110 per 1000 | 185 per 1000 | OR 1.84 | 158 | ⊕⊝⊝⊝ |
| Serious adverse events (proportion) Follow‐up: not stated | 14 per 1000 | 42 per 1000 | OR 3.08 | 74 | ⊕⊝⊝⊝ |
| Serious adverse events (number of events) | None of the trials reported this outcome. | ||||
| Health‐related quality of life | None of the trials reported this outcome. | ||||
| *The basis for the assumed risk is the mean control group proportion across all the trials. The corresponding risk (and its 95% confidence interval) is based on the assumed risk in the comparison group and the relative effect of the intervention (and its 95% CI). | |||||
| GRADE Working Group grades of evidence | |||||
| 1 Risk of bias in the trial(s) was high (downgraded by two levels). 3 There was moderate heterogeneity (downgraded by one level). | |||||
| Methotrexate plus UDCA versus UDCA for primary biliary cholangitis | |||||
| Patient or population: people with primary biliary cholangitis Settings: secondary or tertiary care Intervention: methotrexate + UDCA Comparison: UDCA | |||||
| Outcomes | Illustrative comparative risks* (95% CI) | Relative effect | No of participants | Quality of the evidence | |
| Assumed risk | Corresponding risk | ||||
| UDCA | Methotrexate + UDCA | ||||
| Mortality at maximal follow‐up Follow‐up: 11 to 91 months | 110 per 1000 | 126 per 1000 | OR 1.17 | 290 | ⊕⊝⊝⊝ |
| Serious adverse events (proportion) | None of the trials reported this outcome. | ||||
| Serious adverse events (number of events) | None of the trials reported this outcome. | ||||
| Health‐related quality of life | None of the trials reported this outcome. | ||||
| *The basis for the assumed risk is the mean control group proportion across all the trials. The corresponding risk (and its 95% confidence interval) is based on the assumed risk in the comparison group and the relative effect of the intervention (and its 95% CI). | |||||
| GRADE Working Group grades of evidence | |||||
| 1 Risk of bias in the trial(s) was high (downgraded by two levels). 3 There was moderate heterogeneity (downgraded by one level). | |||||
| Study name | No participants randomised | Post‐randomisation dropouts | No participants for whom outcome was reported | Intervention(s) | Control | Mean follow‐up period (months) |
| 20 | Not stated | 20 | Antioxidants | No intervention | Not stated | |
| 248 | 63 | 185 | Azathioprine | No intervention | 63 | |
| 45 | 6 | 39 | Azathioprine | No intervention | Not stated | |
| 24 | 0 | 24 | Chlorambucil | No intervention | 52 | |
| 57 | 10 | 47 | Colchicine | No intervention | 33 | |
| 60 | 3 | 57 | Colchicine | No intervention | 24 | |
| 64 | Not stated | 64* | Colchicine | No intervention | 19 (median) | |
| 40 | Not stated | 40 | Colchicine + UDCA | No intervention | 12 | |
| 349 | 0 | 349 | Ciclosporin | No intervention | 31 (median) | |
| 12 | 0 | 12 | Ciclosporin | No intervention | Not stated | |
| 40 | 11 | 29 | Ciclosporin | No intervention | 35 (median) | |
| 309 | 82 | 227 | D‐Penicillamine | No intervention | 60 (median) | |
| 98 | Not stated | 98 | D‐Penicillamine | No intervention | 66 | |
| 60 | 0 | 60 | D‐Penicillamine | No intervention | 37 | |
| 52 | 0 | 52 | D‐Penicillamine | No intervention | 24 | |
| 189 | Not stated | 189 | D‐Penicillamine | No intervention | Not stated | |
| 24 | Not stated | 24 | D‐Penicillamine | No intervention | 18 | |
| 35 | Not stated | 35 | D‐Penicillamine | No intervention | Not stated | |
| 36 | 0 | 36 | Glucocorticosteroids | No intervention | 36 | |
| 20 | Not stated | 20 | Lamivudine | No intervention | Not stated | |
| 104 | 3 | 101 | Malotilate | No intervention | 25 (median) | |
| 60 | Not stated | 60 | Methotrexate | No intervention | 68 | |
| 14 | Not stated | 14 | Methotrexate + UDCA | No intervention | 24 | |
| 45 | 3 | 42 | NGM282 | No intervention | Not stated | |
| 216 | Not stated | 216 | Obeticholic acid | No intervention | 12 | |
| 165 | 0 | 165 | Obeticholic acid | No intervention | 3 | |
| 59 | Not stated | 59 | Obeticholic acid | No intervention | Not stated | |
| 32 | Not stated | 32 | S‐Adenosyl methionine | No intervention | 1 | |
| 6 | Not stated | 6 | S‐Adenosyl methionine | No intervention | 2 | |
| 21 | 8 | 13 | Simvastatin | No intervention | 12 | |
| 28 | 0 | 28 | Tetrathiomolybdate | No intervention | Not stated | |
| 18 | 0 | 18 | Thalidomide | No intervention | Not stated | |
| 9 | Not stated | 9 | UDCA | No intervention | 5 | |
| 88 | 2 | 86 | UDCA | No intervention | 6 | |
| 151 | 0 | 151 | UDCA | No intervention | 24 | |
| 116 | 15 | 101 | UDCA | No intervention | 24 | |
| 222 | Not stated | 222 | UDCA | No intervention | 24 | |
| 20 | 0 | 18 | UDCA | No intervention | 12 | |
| 32 | Not stated | 32 | UDCA | No intervention | Not stated | |
| 180 | 10 | 170 | UDCA | No intervention | 24 | |
| 52 | 7 | 45 | UDCA | No intervention | Not stated | |
| 92 | 6 | 86 | UDCA | No intervention | 89 | |
| 192 | 0 | 192 | UDCA | No intervention | 41 (median) | |
| 149 | 3 | 146 | UDCA | No intervention | Not stated | |
| 20 | 1 | 19 | UDCA | No intervention | 18 | |
| 46 | 0 | 46 | UDCA | No intervention | 24 | |
| 57 | Not stated | 57 | Intervention 1: UDCA | No intervention | 15 | |
| 50 | Not stated | 50 | Azathioprine + glucocorticosteroids + UDCA | UDCA | 12 | |
| 45 | Not stated | 45 | Bezafibrate | UDCA | 12 | |
| 24 | Not stated | 24 | Bezafibrate | UDCA | Not stated | |
| 27 | 0 | 27 | Bezafibrate + UDCA | UDCA | 96 | |
| 22 | Not stated | 22 | Bezafibrate + UDCA | UDCA | 12 | |
| 22 | 0 | 22 | Bezafibrate + UDCA | UDCA | 7 | |
| 23 | Not stated | 23 | Bezafibrate + UDCA | UDCA | 12 | |
| 90 | 6 | 84 | Colchicine + UDCA | UDCA | Not stated | |
| 22 | 0 | 22 | Colchicine + UDCA | UDCA | 24 | |
| 74 | Not stated | 74 | Colchicine + UDCA | UDCA | 24 | |
| 28 | 8 | 20 | Colchicine + UDCA | UDCA | 24 | |
| 11 | Not stated | 11 | Colestilan + UDCA | UDCA | Not stated | |
| 10 | Not stated | 10 | Fenofibrate + UDCA | UDCA | Not stated | |
| 40 | 0 | 39 | Glucocorticosteroids + UDCA | UDCA | 24 | |
| 77 | 8 | 69 | Glucocorticosteroids + UDCA | UDCA | 36 | |
| 79 | Not stated | 79 | Intervention 1: glucocorticosteroids + UDCA | UDCA | Not stated | |
| 59 | 0 | 59 | Lamivudine + zidovudine + UDCA | UDCA | 6 | |
| 265 | 0 | 265 | Methotrexate + UDCA | UDCA | 91 (median) | |
| 25 | Not stated | 25 | Methotrexate + UDCA | UDCA | 11 | |
| 217 | Not stated | 216 | Obeticholic acid + UDCA | UDCA | 12 | |
| 30 | 0 | 30 | TUDCA | UDCA | 6 | |
| 199 | 8 | 191 | TUDCA | UDCA | 6 | |
| 87 | 2 | 85 | Colchicine | Methotrexate | 24 | |
| Comparison of doses | ||||||
| 150 | Not stated | 150 | Intervention 1: UDCA (high) Intervention 2: UDCA (moderate) | UDCA (low) | 12 | |
| 155 | Not stated | 155 | Intervention 1: UDCA (high) Intervention 2: UDCA (moderate) | UDCA (low) | 12 | |
| 61 | 2 | 59 | UDCA (moderate) | UDCA (low) | Not stated | |
| 42 | Not stated | 42 | UDCA (high) | UDCA (moderate) | 72 | |
| TUDCA: taurodeoxycholic acid; UDCA: ursodeoxycholic acid. | ||||||
| Name of studies | Intervention(s) | Control | Random sequence generation | Allocation concealment | Blinding of participants and health professionals | Blinding of outcome assessors | Missing outcome bias | Selective outcome reporting | For‐profit bias | Other bias |
| Antioxidants | No intervention | Unclear | Unclear | Unclear | Unclear | Unclear | High | Unclear | Low | |
| Azathioprine | No intervention | Unclear | Unclear | Low | Low | High | High | High | Low | |
| Azathioprine | No intervention | Unclear | Unclear | High | High | High | High | Low | Low | |
| Chlorambucil | No intervention | Low | Low | High | High | Low | Low | Low | Low | |
| Colchicine | No intervention | Unclear | Unclear | Low | Low | High | High | High | Low | |
| Colchicine | No intervention | Unclear | Unclear | Unclear | Unclear | High | High | Unclear | Low | |
| Colchicine | No intervention | Low | Low | Low | Low | Unclear | Low | Unclear | Low | |
| Colchicine + UDCA | No intervention | Unclear | Unclear | Unclear | Unclear | Unclear | High | Unclear | Low | |
| Ciclosporin | No intervention | Unclear | Unclear | Low | Low | Low | Low | High | Low | |
| Ciclosporin | No intervention | Unclear | Unclear | Low | Unclear | Unclear | Low | High | Low | |
| Ciclosporin | No intervention | Unclear | Unclear | Low | Low | Unclear | Low | High | Low | |
| D‐Penicillamine | No intervention | Low | Low | Low | Low | High | High | High | High | |
| D‐Penicillamine | No intervention | Unclear | Unclear | High | High | Unclear | High | Unclear | Low | |
| D‐Penicillamine | No intervention | Unclear | Unclear | Unclear | Unclear | Low | Low | Unclear | Low | |
| D‐Penicillamine | No intervention | Unclear | Unclear | Unclear | Unclear | Low | Low | High | Low | |
| D‐Penicillamine | No intervention | Unclear | Low | Low | Low | Unclear | High | Unclear | Low | |
| D‐Penicillamine | No intervention | Unclear | Unclear | Low | Low | Unclear | Low | Unclear | Low | |
| D‐Penicillamine | No intervention | Unclear | Unclear | Unclear | Unclear | Unclear | High | High | Low | |
| Glucocorticosteroids | No intervention | Low | Low | High | High | Low | High | Unclear | Low | |
| Lamivudine | No intervention | Unclear | Unclear | Low | Low | Unclear | High | Unclear | Low | |
| Malotilate | No intervention | Low | Low | Low | Low | High | Low | High | Low | |
| Methotrexate | No intervention | Low | Low | Unclear | Unclear | Unclear | High | Unclear | Low | |
| Methotrexate + UDCA | No intervention | Low | Unclear | Unclear | Unclear | Unclear | High | Unclear | Low | |
| NGM282 | No intervention | Unclear | Unclear | Unclear | Unclear | High | High | High | Low | |
| Obeticholic acid | No intervention | Unclear | Unclear | Unclear | Unclear | Unclear | High | High | Low | |
| Obeticholic acid | No intervention | Low | Unclear | Low | Low | Low | High | Unclear | High | |
| Obeticholic acid | No intervention | Unclear | Unclear | Unclear | Unclear | Unclear | High | High | Low | |
| S‐Adenosyl methionine | No intervention | Unclear | Unclear | Unclear | Unclear | Unclear | High | Unclear | Low | |
| S‐Adenosyl methionine | No intervention | Unclear | Unclear | Unclear | Unclear | Unclear | High | Unclear | Low | |
| Simvastatin | No intervention | Unclear | Low | High | High | High | High | Low | High | |
| Tetrathiomolybdate | No intervention | Low | Low | Low | Low | Low | High | Low | High | |
| Thalidomide | No intervention | Unclear | Unclear | Low | Low | Low | High | High | Low | |
| UDCA | No intervention | Unclear | Unclear | Unclear | Unclear | Unclear | High | Unclear | Low | |
| UDCA | No intervention | Low | Low | Low | Low | High | High | Unclear | Low | |
| UDCA | No intervention | Unclear | Unclear | Low | Low | Low | High | High | Low | |
| UDCA | No intervention | Unclear | Unclear | Unclear | Unclear | High | High | High | Low | |
| UDCA | No intervention | Unclear | Low | Low | Low | Unclear | High | High | Low | |
| UDCA | No intervention | Unclear | Unclear | Unclear | Unclear | High | Low | Unclear | Low | |
| UDCA | No intervention | Unclear | Unclear | Unclear | Unclear | Unclear | High | Unclear | Low | |
| UDCA | No intervention | Unclear | Unclear | Low | Low | High | Low | High | Low | |
| UDCA | No intervention | Unclear | Low | Low | Low | High | High | High | Low | |
| UDCA | No intervention | Low | Low | High | High | High | High | High | High | |
| UDCA | No intervention | Unclear | Unclear | Low | Low | Unclear | Low | High | Low | |
| UDCA | No intervention | Unclear | Unclear | Low | Low | High | High | High | Low | |
| UDCA | No intervention | Unclear | Unclear | Unclear | Unclear | High | High | High | Low | |
| UDCA | No intervention | Unclear | Unclear | Low | Low | Low | High | Unclear | Low | |
| Intervention 1: UDCA | No intervention | Unclear | Unclear | Unclear | Unclear | Unclear | High | Unclear | Low | |
| Azathioprine + glucocorticosteroids + UDCA | UDCA | Low | Low | Low | Low | Unclear | High | High | Low | |
| Bezafibrate | UDCA | Unclear | Low | High | High | Unclear | High | Low | Low | |
| Bezafibrate | UDCA | Unclear | Unclear | Unclear | Unclear | Unclear | High | Unclear | Low | |
| Bezafibrate + UDCA | UDCA | Low | Low | High | High | Low | Low | Low | Low | |
| Bezafibrate + UDCA | UDCA | Unclear | Low | High | High | Unclear | High | Low | Low | |
| Bezafibrate + UDCA | UDCA | Unclear | Unclear | Unclear | Unclear | Low | High | Unclear | Low | |
| Bezafibrate + UDCA | UDCA | Unclear | Unclear | Unclear | Unclear | Unclear | High | Low | Low | |
| Colchicine + UDCA | UDCA | Low | Low | Low | Low | High | High | Low | Low | |
| Colchicine + UDCA | UDCA | Unclear | Unclear | Unclear | Unclear | Low | High | Unclear | High | |
| Colchicine + UDCA | UDCA | Unclear | Unclear | Low | Low | Unclear | Low | High | Low | |
| Colchicine + UDCA | UDCA | Unclear | Unclear | Unclear | Unclear | High | High | Unclear | Low | |
| Colestilan + UDCA | UDCA | Unclear | Unclear | High | High | Unclear | High | Unclear | Low | |
| Fenofibrate + UDCA | UDCA | Unclear | Unclear | High | High | Unclear | High | Unclear | Low | |
| Glucocorticosteroids + UDCA | UDCA | Low | Unclear | Unclear | Unclear | High | High | High | Low | |
| Glucocorticosteroids + UDCA | UDCA | Unclear | Unclear | High | High | High | High | High | Low | |
| Glucocorticosteroids + UDCA | UDCA | Unclear | Unclear | Unclear | Unclear | Unclear | High | Unclear | Low | |
| Lamivudine + zidovudine + UDCA | UDCA | Low | Low | Low | Low | Unclear | High | High | Low | |
| Methotrexate + UDCA | UDCA | Unclear | Unclear | Unclear | Unclear | Low | High | High | Low | |
| Methotrexate + UDCA | UDCA | Unclear | Low | Unclear | Unclear | Unclear | Low | Unclear | Low | |
| Obeticholic acid + UDCA | UDCA | Low | Low | Low | Low | High | Low | High | Low | |
| TUDCA | UDCA | Unclear | Unclear | Unclear | Unclear | Low | High | Unclear | Low | |
| TUDCA | UDCA | Low | Low | Low | Low | Unclear | High | High | Low | |
| Colchicine | Methotrexate | Unclear | Unclear | Low | Low | High | High | Unclear | Low | |
| Comparison of doses | ||||||||||
| Intervention 1: UDCA (high) Intervention 2: UDCA (moderate) | UDCA (low) | Unclear | Unclear | Unclear | Unclear | Unclear | High | Unclear | Low | |
| Intervention 1: UDCA (high) Intervention 2: UDCA (moderate) | UDCA (low) | Low | Low | Low | Low | Unclear | Low | Unclear | Low | |
| UDCA (moderate) | UDCA (low) | Low | Low | High | High | Unclear | High | High | Low | |
| UDCA (high) | UDCA (moderate) | Unclear | Unclear | Unclear | Unclear | Unclear | High | Unclear | Low | |
| TUDCA: taurodeoxycholic acid; UDCA: ursodeoxycholic acid. | ||||||||||
| Outcome or subgroup title | No. of studies | No. of participants | Statistical method | Effect size |
| 1 Mortality at maximal follow‐up Show forest plot | 28 | Odds Ratio (M‐H, Fixed, 95% CI) | Subtotals only | |
| 1.1 Azathioprine versus no intervention | 2 | 224 | Odds Ratio (M‐H, Fixed, 95% CI) | 0.56 [0.32, 0.98] |
| 1.2 Chlorambucil versus no intervention | 1 | 24 | Odds Ratio (M‐H, Fixed, 95% CI) | 0.14 [0.01, 3.28] |
| 1.3 Colchicine versus no intervention | 2 | 122 | Odds Ratio (M‐H, Fixed, 95% CI) | 0.77 [0.32, 1.85] |
| 1.4 Cyclosporin versus no intervention | 3 | 390 | Odds Ratio (M‐H, Fixed, 95% CI) | 0.88 [0.51, 1.50] |
| 1.5 D‐Penicillamine versus no intervention | 5 | 423 | Odds Ratio (M‐H, Fixed, 95% CI) | 0.90 [0.57, 1.44] |
| 1.6 Glucocorticosteroids versus no intervention | 1 | 36 | Odds Ratio (M‐H, Fixed, 95% CI) | 0.64 [0.14, 2.92] |
| 1.7 Malotilate versus no intervention | 1 | 101 | Odds Ratio (M‐H, Fixed, 95% CI) | 2.0 [0.47, 8.48] |
| 1.8 Methotrexate versus no intervention | 1 | 60 | Odds Ratio (M‐H, Fixed, 95% CI) | 8.83 [1.01, 76.96] |
| 1.9 UDCA versus no intervention | 6 | 734 | Odds Ratio (M‐H, Fixed, 95% CI) | 0.99 [0.60, 1.64] |
| 1.10 Bezafibrate plus UDCA versus UDCA | 1 | 27 | Odds Ratio (M‐H, Fixed, 95% CI) | 9.67 [0.45, 207.78] |
| 1.11 Colchicine plus UDCA versus UDCA | 2 | 158 | Odds Ratio (M‐H, Fixed, 95% CI) | 1.84 [0.38, 8.91] |
| 1.12 Methotrexate plus UDCA versus UDCA | 2 | 290 | Odds Ratio (M‐H, Fixed, 95% CI) | 1.17 [0.55, 2.51] |
| 1.13 Obeticholic acid plus UDCA versus UDCA | 1 | 216 | Odds Ratio (M‐H, Fixed, 95% CI) | 1.55 [0.06, 38.46] |
| 2 Mortality (< 1 year) Show forest plot | 8 | Odds Ratio (M‐H, Fixed, 95% CI) | Subtotals only | |
| 2.1 Azathioprine versus no intervention | 1 | 39 | Odds Ratio (M‐H, Fixed, 95% CI) | 0.58 [0.16, 2.10] |
| 2.2 Colchicine versus no intervention | 1 | 64 | Odds Ratio (M‐H, Fixed, 95% CI) | 0.86 [0.22, 3.33] |
| 2.3 Cyclosporin versus no intervention | 1 | 12 | Odds Ratio (M‐H, Fixed, 95% CI) | 0.14 [0.01, 3.63] |
| 2.4 D‐Penicillamine versus no intervention | 1 | 189 | Odds Ratio (M‐H, Fixed, 95% CI) | 0.71 [0.35, 1.42] |
| 2.5 Ursodeoxycholic acid (UDCA) versus no intervention | 1 | 18 | Odds Ratio (M‐H, Fixed, 95% CI) | 0.0 [0.0, 0.0] |
| 2.6 Colchicine plus UDCA versus UDCA | 1 | 84 | Odds Ratio (M‐H, Fixed, 95% CI) | 1.0 [0.13, 7.45] |
| 2.7 Methotrexate plus UDCA versus UDCA | 1 | 25 | Odds Ratio (M‐H, Fixed, 95% CI) | 0.0 [0.0, 0.0] |
| 2.8 Obeticholic acid plus UDCA versus UDCA | 1 | 216 | Odds Ratio (M‐H, Fixed, 95% CI) | 1.55 [0.06, 38.46] |
| 3 Mortality (1 to 5 years) Show forest plot | 20 | Odds Ratio (M‐H, Fixed, 95% CI) | Subtotals only | |
| 3.1 Azathioprine versus no intervention | 1 | 185 | Odds Ratio (M‐H, Fixed, 95% CI) | 0.56 [0.30, 1.04] |
| 3.2 Chlorambucil versus no intervention | 1 | 24 | Odds Ratio (M‐H, Fixed, 95% CI) | 0.14 [0.01, 3.28] |
| 3.3 Colchicine versus no intervention | 1 | 58 | Odds Ratio (M‐H, Fixed, 95% CI) | 0.71 [0.22, 2.25] |
| 3.4 Cyclosporin versus no intervention | 2 | 378 | Odds Ratio (M‐H, Fixed, 95% CI) | 0.94 [0.54, 1.64] |
| 3.5 D‐Penicillamine versus no intervention | 4 | 234 | Odds Ratio (M‐H, Fixed, 95% CI) | 1.10 [0.59, 2.08] |
| 3.6 Glucocorticosteroids versus no intervention | 1 | 36 | Odds Ratio (M‐H, Fixed, 95% CI) | 0.64 [0.14, 2.92] |
| 3.7 Malotilate versus no intervention | 1 | 101 | Odds Ratio (M‐H, Fixed, 95% CI) | 2.0 [0.47, 8.48] |
| 3.8 Methotrexate versus no intervention | 1 | 60 | Odds Ratio (M‐H, Fixed, 95% CI) | 8.83 [1.01, 76.96] |
| 3.9 UDCA versus no intervention | 5 | 716 | Odds Ratio (M‐H, Fixed, 95% CI) | 0.99 [0.60, 1.64] |
| 3.10 Bezafibrate plus UDCA versus UDCA | 1 | 27 | Odds Ratio (M‐H, Fixed, 95% CI) | 9.67 [0.45, 207.78] |
| 3.11 Colchicine plus UDCA versus UDCA | 1 | 74 | Odds Ratio (M‐H, Fixed, 95% CI) | 5.28 [0.24, 113.87] |
| 3.12 Methotrexate plus UDCA versus UDCA | 1 | 265 | Odds Ratio (M‐H, Fixed, 95% CI) | 1.17 [0.55, 2.51] |
| 4 Serious adverse events (proportion) Show forest plot | 11 | Odds Ratio (M‐H, Fixed, 95% CI) | Subtotals only | |
| 4.1 Colchicine versus no intervention | 1 | 64 | Odds Ratio (M‐H, Fixed, 95% CI) | 0.0 [0.0, 0.0] |
| 4.2 D‐Penicillamine versus no intervention | 1 | 52 | Odds Ratio (M‐H, Fixed, 95% CI) | 28.77 [1.57, 526.67] |
| 4.3 Obeticholic acid versus no intervention | 1 | 165 | Odds Ratio (M‐H, Fixed, 95% CI) | 1.83 [0.21, 15.73] |
| 4.4 UDCA versus no intervention | 3 | 380 | Odds Ratio (M‐H, Fixed, 95% CI) | 0.0 [0.0, 0.0] |
| 4.5 UDCA versus bezafibrate | 1 | 24 | Odds Ratio (M‐H, Fixed, 95% CI) | 0.0 [0.0, 0.0] |
| 4.6 Bezafibrate plus UDCA versus UDCA | 1 | 22 | Odds Ratio (M‐H, Fixed, 95% CI) | 0.0 [0.0, 0.0] |
| 4.7 Colchicine plus UDCA versus UDCA | 1 | 74 | Odds Ratio (M‐H, Fixed, 95% CI) | 3.08 [0.12, 78.14] |
| 4.8 Lamivudine plus zidovudine plus UDCA versus UDCA | 1 | 59 | Odds Ratio (M‐H, Fixed, 95% CI) | 0.47 [0.04, 5.43] |
| 4.9 Obeticholic acid plus UDCA versus UDCA | 1 | 216 | Odds Ratio (M‐H, Fixed, 95% CI) | 3.58 [1.02, 12.51] |
| 5 Serious adverse events (number of events) Show forest plot | 1 | Rate Ratio (Fixed, 95% CI) | Subtotals only | |
| 5.1 Obeticholic acid plus UDCA versus UDCA | 1 | 216 | Rate Ratio (Fixed, 95% CI) | 1.66 [0.75, 3.66] |
| 6 Adverse events (proportion) Show forest plot | 19 | Odds Ratio (M‐H, Fixed, 95% CI) | Subtotals only | |
| 6.1 Cyclosporin versus no intervention | 3 | 390 | Odds Ratio (M‐H, Fixed, 95% CI) | 3.04 [1.98, 4.68] |
| 6.2 D‐Penicillamine versus no intervention | 2 | 287 | Odds Ratio (M‐H, Fixed, 95% CI) | 4.51 [2.56, 7.93] |
| 6.3 Malotilate versus no intervention | 1 | 101 | Odds Ratio (M‐H, Fixed, 95% CI) | 11.43 [1.40, 93.04] |
| 6.4 Obeticholic acid versus no intervention | 1 | 165 | Odds Ratio (M‐H, Fixed, 95% CI) | 4.58 [1.31, 15.95] |
| 6.5 UDCA versus no intervention | 3 | 380 | Odds Ratio (M‐H, Fixed, 95% CI) | 1.45 [0.50, 4.25] |
| 6.6 Azathioprine plus UDCA versus UDCA | 1 | 42 | Odds Ratio (M‐H, Fixed, 95% CI) | 19.67 [0.94, 413.50] |
| 6.7 Bezafibrate versus UDCA | 1 | 24 | Odds Ratio (M‐H, Fixed, 95% CI) | 0.0 [0.0, 0.0] |
| 6.8 Bezafibrate plus UDCA versus UDCA | 1 | 22 | Odds Ratio (M‐H, Fixed, 95% CI) | 3.29 [0.12, 89.81] |
| 6.9 Colchicine plus UDCA versus UDCA | 2 | 42 | Odds Ratio (M‐H, Fixed, 95% CI) | 6.20 [0.63, 60.80] |
| 6.10 Colestilan plus UDCA versus UDCA | 1 | 11 | Odds Ratio (M‐H, Fixed, 95% CI) | 0.0 [0.0, 0.0] |
| 6.11 Glucocorticosteroids plus UDCA versus UDCA | 2 | 135 | Odds Ratio (M‐H, Fixed, 95% CI) | 5.54 [1.35, 22.84] |
| 6.12 Methotrexate plus UDCA versus UDCA | 1 | 25 | Odds Ratio (M‐H, Fixed, 95% CI) | 115.0 [4.98, 2657.48] |
| 6.13 TauroUDCA versus UDCA | 1 | 30 | Odds Ratio (M‐H, Fixed, 95% CI) | 21.0 [2.16, 204.61] |
| 6.14 Glucocorticosteroids plus UDCA versus azathioprine plus UDCA | 1 | 50 | Odds Ratio (M‐H, Fixed, 95% CI) | 0.40 [0.08, 2.12] |
| 7 Adverse events (number) Show forest plot | 14 | Rate Ratio (Random, 95% CI) | Subtotals only | |
| 7.1 Chlorambucil versus no intervention | 1 | 24 | Rate Ratio (Random, 95% CI) | 3.67 [1.04, 12.87] |
| 7.2 Cyclosporin versus no intervention | 3 | 390 | Rate Ratio (Random, 95% CI) | 2.58 [1.26, 5.31] |
| 7.3 D‐Penicillamine versus no intervention | 3 | 303 | Rate Ratio (Random, 95% CI) | 2.99 [1.04, 8.63] |
| 7.4 Malotilate versus no intervention | 1 | 101 | Rate Ratio (Random, 95% CI) | 6.13 [1.38, 27.14] |
| 7.5 Obeticholic acid versus no intervention | 1 | 76 | Rate Ratio (Random, 95% CI) | 1.41 [1.13, 1.75] |
| 7.6 Azathioprine plus glucocorticosteroids plus UDCA versus UDCA | 1 | 50 | Rate Ratio (Random, 95% CI) | 1.32 [0.88, 1.97] |
| 7.7 Bezafibrate plus UDCA versus UDCA | 1 | 29 | Rate Ratio (Random, 95% CI) | 11.79 [0.65, 213.14] |
| 7.8 Colchicine plus UDCA versus UDCA | 1 | 24 | Rate Ratio (Random, 95% CI) | 5.91 [0.28, 123.08] |
| 7.9 Methotrexate plus UDCA versus UDCA | 1 | 27 | Rate Ratio (Random, 95% CI) | 30.64 [1.84, 510.76] |
| 7.10 TauroUDCA versus UDCA | 1 | 191 | Rate Ratio (Random, 95% CI) | 1.17 [0.81, 1.71] |
| 8 Liver transplantation Show forest plot | 11 | Odds Ratio (M‐H, Fixed, 95% CI) | Subtotals only | |
| 8.1 Cyclosporin versus no intervention | 2 | 378 | Odds Ratio (M‐H, Fixed, 95% CI) | 0.86 [0.43, 1.72] |
| 8.2 D‐Penicillamine versus no intervention | 1 | 189 | Odds Ratio (M‐H, Fixed, 95% CI) | 0.93 [0.06, 15.05] |
| 8.3 Methotrexate versus no intervention | 1 | 60 | Odds Ratio (M‐H, Fixed, 95% CI) | 0.17 [0.02, 1.58] |
| 8.4 UDCA versus no intervention | 5 | 640 | Odds Ratio (M‐H, Fixed, 95% CI) | 0.90 [0.48, 1.68] |
| 8.5 Bezafibrate plus UDCA versus UDCA | 1 | 27 | Odds Ratio (M‐H, Fixed, 95% CI) | 0.0 [0.0, 0.0] |
| 8.6 Methotrexate plus UDCA versus UDCA | 1 | 265 | Odds Ratio (M‐H, Fixed, 95% CI) | 0.70 [0.35, 1.39] |
| 9 Decompensated liver disease Show forest plot | 7 | Odds Ratio (M‐H, Fixed, 95% CI) | Subtotals only | |
| 9.1 D‐Penicillamine versus no active treatment | 1 | 24 | Odds Ratio (M‐H, Fixed, 95% CI) | 0.0 [0.0, 0.0] |
| 9.2 UDCA versus no intervention | 2 | 237 | Odds Ratio (M‐H, Fixed, 95% CI) | 1.60 [0.86, 2.98] |
| 9.3 Azathioprine plus UDCA versus UDCA | 1 | 42 | Odds Ratio (M‐H, Fixed, 95% CI) | 0.52 [0.05, 5.18] |
| 9.4 Colchicine plus UDCA versus UDCA | 1 | 84 | Odds Ratio (M‐H, Fixed, 95% CI) | 0.21 [0.04, 1.07] |
| 9.5 Glucocorticosteroids plus UDCA versus UDCA | 1 | 66 | Odds Ratio (M‐H, Fixed, 95% CI) | 0.55 [0.11, 2.69] |
| 9.6 Methotrexate plus UDCA versus UDCA | 1 | 265 | Odds Ratio (M‐H, Fixed, 95% CI) | 1.34 [0.77, 2.33] |
| 9.7 Obeticholic acid plus UDCA versus UDCA | 1 | 216 | Odds Ratio (M‐H, Fixed, 95% CI) | 1.55 [0.06, 38.46] |
| 9.8 Glucocorticosteroids plus UDCA versus azathioprine plus UDCA | 1 | 50 | Odds Ratio (M‐H, Fixed, 95% CI) | 1.06 [0.10, 11.18] |
| 10 Cirrhosis Show forest plot | 3 | Odds Ratio (M‐H, Fixed, 95% CI) | Subtotals only | |
| 10.1 Azathioprine versus no intervention | 1 | 31 | Odds Ratio (M‐H, Fixed, 95% CI) | 0.79 [0.18, 3.41] |
| 10.2 UDCA versus no intervention | 1 | 22 | Odds Ratio (M‐H, Fixed, 95% CI) | 0.15 [0.01, 1.53] |
| 10.3 Azathioprine plus glucocorticosteroids plus UDCA versus UDCA | 1 | 50 | Odds Ratio (M‐H, Fixed, 95% CI) | 0.28 [0.03, 2.90] |
| Outcome or subgroup title | No. of studies | No. of participants | Statistical method | Effect size |
| 1 Mortality at maximal follow‐up Show forest plot | 29 | Odds Ratio (M‐H, Fixed, 95% CI) | Subtotals only | |
| 1.1 Azathioprine versus no intervention | 2 | 224 | Odds Ratio (M‐H, Fixed, 95% CI) | 0.56 [0.32, 0.98] |
| 1.2 Chlorambucil versus no intervention | 1 | 24 | Odds Ratio (M‐H, Fixed, 95% CI) | 0.14 [0.01, 3.28] |
| 1.3 Colchicine versus no intervention | 2 | 122 | Odds Ratio (M‐H, Fixed, 95% CI) | 0.77 [0.32, 1.85] |
| 1.4 Cyclosporin versus no intervention | 3 | 390 | Odds Ratio (M‐H, Fixed, 95% CI) | 0.88 [0.51, 1.50] |
| 1.5 D‐Penicillamine versus no intervention | 5 | 423 | Odds Ratio (M‐H, Fixed, 95% CI) | 0.90 [0.57, 1.44] |
| 1.6 Glucocorticosteroids versus no intervention | 1 | 36 | Odds Ratio (M‐H, Fixed, 95% CI) | 0.64 [0.14, 2.92] |
| 1.7 Malotilate versus no intervention | 1 | 101 | Odds Ratio (M‐H, Fixed, 95% CI) | 2.0 [0.47, 8.48] |
| 1.8 Methotrexate versus no intervention | 1 | 60 | Odds Ratio (M‐H, Fixed, 95% CI) | 8.83 [1.01, 76.96] |
| 1.9 UDCA (low) versus no intervention | 2 | 64 | Odds Ratio (M‐H, Fixed, 95% CI) | 0.33 [0.03, 3.47] |
| 1.10 UDCA (moderate) versus no intervention | 4 | 670 | Odds Ratio (M‐H, Fixed, 95% CI) | 1.05 [0.62, 1.77] |
| 1.11 UDCA (low) versus UDCA (high) | 1 | 106 | Odds Ratio (M‐H, Fixed, 95% CI) | 1.04 [0.06, 17.06] |
| 1.12 UDCA (moderate) versus UDCA (high) | 1 | 103 | Odds Ratio (M‐H, Fixed, 95% CI) | 0.36 [0.01, 9.05] |
| 1.13 UDCA (low) plus colchicine versus UDCA (low) | 1 | 84 | Odds Ratio (M‐H, Fixed, 95% CI) | 1.0 [0.13, 7.45] |
| 1.14 UDCA (low) plus methotrexate versus UDCA (low) | 1 | 25 | Odds Ratio (M‐H, Fixed, 95% CI) | 0.0 [0.0, 0.0] |
| 1.15 UDCA (moderate) versus UDCA (low) | 1 | 101 | Odds Ratio (M‐H, Fixed, 95% CI) | 0.35 [0.01, 8.72] |
| 1.16 Bezafibrate plus UDCA (moderate) versus UDCA (moderate) | 1 | 27 | Odds Ratio (M‐H, Fixed, 95% CI) | 9.67 [0.45, 207.78] |
| 1.17 Colchicine plus UDCA (moderate) versus UDCA (moderate) | 1 | 74 | Odds Ratio (M‐H, Fixed, 95% CI) | 5.28 [0.24, 113.87] |
| 1.18 Methotrexate plus UDCA (moderate) versus UDCA (moderate) | 1 | 265 | Odds Ratio (M‐H, Fixed, 95% CI) | 1.17 [0.55, 2.51] |
| 1.19 Obeticholic acid (low) plus UDCA (moderate) versus UDCA (moderate) | 1 | 216 | Odds Ratio (M‐H, Fixed, 95% CI) | 1.55 [0.06, 38.46] |
| 2 Mortality (< 1 year) Show forest plot | 9 | Odds Ratio (M‐H, Fixed, 95% CI) | Subtotals only | |
| 2.1 Azathioprine versus no intervention | 1 | 39 | Odds Ratio (M‐H, Fixed, 95% CI) | 0.58 [0.16, 2.10] |
| 2.2 Colchicine versus no intervention | 1 | 64 | Odds Ratio (M‐H, Fixed, 95% CI) | 0.86 [0.22, 3.33] |
| 2.3 Cyclosporin versus no intervention | 1 | 12 | Odds Ratio (M‐H, Fixed, 95% CI) | 0.14 [0.01, 3.63] |
| 2.4 D‐Penicillamine versus no intervention | 1 | 189 | Odds Ratio (M‐H, Fixed, 95% CI) | 0.71 [0.35, 1.42] |
| 2.5 UDCA (low) versus no intervention | 1 | 18 | Odds Ratio (M‐H, Fixed, 95% CI) | 0.0 [0.0, 0.0] |
| 2.6 UDCA (low) versus UDCA (high) | 1 | 106 | Odds Ratio (M‐H, Fixed, 95% CI) | 1.04 [0.06, 17.06] |
| 2.7 UDCA (moderate) versus UDCA (high) | 1 | 103 | Odds Ratio (M‐H, Fixed, 95% CI) | 0.36 [0.01, 9.05] |
| 2.8 Obeticholic acid (low) plus UDCA (moderate) versus UDCA (moderate) | 1 | 216 | Odds Ratio (M‐H, Fixed, 95% CI) | 1.55 [0.06, 38.46] |
| 2.9 UDCA (low) plus colchicine versus UDCA (low) | 1 | 84 | Odds Ratio (M‐H, Fixed, 95% CI) | 1.0 [0.13, 7.45] |
| 2.10 UDCA (low) plus methotrexate versus UDCA (low) | 1 | 25 | Odds Ratio (M‐H, Fixed, 95% CI) | 0.0 [0.0, 0.0] |
| 2.11 UDCA (moderate) versus UDCA (low) | 1 | 101 | Odds Ratio (M‐H, Fixed, 95% CI) | 0.35 [0.01, 8.72] |
| 3 Mortality (1 to 5 years) Show forest plot | 20 | Odds Ratio (M‐H, Fixed, 95% CI) | Subtotals only | |
| 3.1 Azathioprine versus no intervention | 1 | 185 | Odds Ratio (M‐H, Fixed, 95% CI) | 0.56 [0.30, 1.04] |
| 3.2 Chlorambucil versus no intervention | 1 | 24 | Odds Ratio (M‐H, Fixed, 95% CI) | 0.14 [0.01, 3.28] |
| 3.3 Colchicine versus no intervention | 1 | 58 | Odds Ratio (M‐H, Fixed, 95% CI) | 0.71 [0.22, 2.25] |
| 3.4 Cyclosporin versus no intervention | 2 | 378 | Odds Ratio (M‐H, Fixed, 95% CI) | 0.94 [0.54, 1.64] |
| 3.5 D‐Penicillamine versus no intervention | 4 | 234 | Odds Ratio (M‐H, Fixed, 95% CI) | 1.10 [0.59, 2.08] |
| 3.6 Glucocorticosteroids versus no intervention | 1 | 36 | Odds Ratio (M‐H, Fixed, 95% CI) | 0.64 [0.14, 2.92] |
| 3.7 Malotilate versus no intervention | 1 | 101 | Odds Ratio (M‐H, Fixed, 95% CI) | 2.0 [0.47, 8.48] |
| 3.8 Methotrexate versus no intervention | 1 | 60 | Odds Ratio (M‐H, Fixed, 95% CI) | 8.83 [1.01, 76.96] |
| 3.9 UDCA (low) versus no intervention | 1 | 46 | Odds Ratio (M‐H, Fixed, 95% CI) | 0.33 [0.03, 3.47] |
| 3.10 UDCA (moderate) versus no intervention | 4 | 670 | Odds Ratio (M‐H, Fixed, 95% CI) | 1.05 [0.62, 1.77] |
| 3.11 Bezafibrate plus UDCA (moderate) versus UDCA (moderate) | 1 | 27 | Odds Ratio (M‐H, Fixed, 95% CI) | 9.67 [0.45, 207.78] |
| 3.12 Colchicine plus UDCA (moderate) versus UDCA (moderate) | 1 | 74 | Odds Ratio (M‐H, Fixed, 95% CI) | 5.28 [0.24, 113.87] |
| 3.13 Methotrexate plus UDCA (moderate) versus UDCA (moderate) | 1 | 265 | Odds Ratio (M‐H, Fixed, 95% CI) | 1.17 [0.55, 2.51] |
| 4 Serious adverse events (proportion) Show forest plot | 12 | Odds Ratio (M‐H, Fixed, 95% CI) | Subtotals only | |
| 4.1 Colchicine versus no intervention | 1 | 64 | Odds Ratio (M‐H, Fixed, 95% CI) | 0.0 [0.0, 0.0] |
| 4.2 D‐Penicillamine versus no intervention | 1 | 52 | Odds Ratio (M‐H, Fixed, 95% CI) | 28.77 [1.57, 526.67] |
| 4.3 Obeticholic acid (high) versus no intervention | 1 | 79 | Odds Ratio (M‐H, Fixed, 95% CI) | 5.14 [0.57, 46.17] |
| 4.4 Obeticholic acid (low) versus no intervention | 1 | 76 | Odds Ratio (M‐H, Fixed, 95% CI) | 0.32 [0.01, 8.22] |
| 4.5 Obeticholic acid (moderate) versus no intervention | 1 | 86 | Odds Ratio (M‐H, Fixed, 95% CI) | 0.79 [0.05, 13.01] |
| 4.6 UDCA (low) versus no intervention | 1 | 18 | Odds Ratio (M‐H, Fixed, 95% CI) | 0.0 [0.0, 0.0] |
| 4.7 UDCA (moderate) versus no intervention | 2 | 362 | Odds Ratio (M‐H, Fixed, 95% CI) | 0.0 [0.0, 0.0] |
| 4.8 UDCA (low) versus bezafibrate | 1 | 24 | Odds Ratio (M‐H, Fixed, 95% CI) | 0.0 [0.0, 0.0] |
| 4.9 Obeticholic acid (low) versus obeticholic acid (high) | 1 | 79 | Odds Ratio (M‐H, Fixed, 95% CI) | 0.09 [0.00, 1.61] |
| 4.10 Obeticholic acid (moderate) versus obeticholic acid (high) | 1 | 89 | Odds Ratio (M‐H, Fixed, 95% CI) | 0.15 [0.02, 1.37] |
| 4.11 Obeticholic acid (moderate) versus obeticholic acid (low) | 1 | 86 | Odds Ratio (M‐H, Fixed, 95% CI) | 2.43 [0.10, 61.39] |
| 4.12 Lamivudine plus zidovudine plus UDCA (moderate) versus UDCA (moderate) | 1 | 59 | Odds Ratio (M‐H, Fixed, 95% CI) | 0.47 [0.04, 5.43] |
| 4.13 UDCA (moderate) versus obeticholic acid (low) plus UDCA (moderate) | 1 | 216 | Odds Ratio (M‐H, Fixed, 95% CI) | 0.28 [0.08, 0.98] |
| 4.14 Bezafibrate plus UDCA (low) versus UDCA (low) | 1 | 22 | Odds Ratio (M‐H, Fixed, 95% CI) | 0.0 [0.0, 0.0] |
| 4.15 UDCA (moderate) versus UDCA (low) | 1 | 59 | Odds Ratio (M‐H, Fixed, 95% CI) | 0.0 [0.0, 0.0] |
| 4.16 Colchicine plus UDCA (moderate) versus UDCA (moderate) | 1 | 74 | Odds Ratio (M‐H, Fixed, 95% CI) | 3.08 [0.12, 78.14] |
| 5 Serious adverse events (number of events) Show forest plot | 1 | Rate Ratio (Fixed, 95% CI) | Subtotals only | |
| 5.1 Obeticholic acid (low) plus UDCA (moderate) versus UDCA (moderate) | 1 | Rate Ratio (Fixed, 95% CI) | 1.66 [0.75, 3.66] | |
| 6 Adverse events (proportion) Show forest plot | 20 | Odds Ratio (M‐H, Fixed, 95% CI) | Subtotals only | |
| 6.1 Cyclosporin versus no intervention | 3 | 390 | Odds Ratio (M‐H, Fixed, 95% CI) | 3.04 [1.98, 4.68] |
| 6.2 D‐Penicillamine versus no intervention | 2 | 287 | Odds Ratio (M‐H, Fixed, 95% CI) | 4.51 [2.56, 7.93] |
| 6.3 Malotilate versus no intervention | 1 | 101 | Odds Ratio (M‐H, Fixed, 95% CI) | 11.43 [1.40, 93.04] |
| 6.4 Obeticholic acid (high) versus no intervention | 1 | 79 | Odds Ratio (M‐H, Fixed, 95% CI) | 16.6 [0.90, 305.59] |
| 6.5 Obeticholic acid (low) versus no intervention | 1 | 76 | Odds Ratio (M‐H, Fixed, 95% CI) | 1.59 [0.41, 6.17] |
| 6.6 Obeticholic acid (moderate) versus no intervention | 1 | 86 | Odds Ratio (M‐H, Fixed, 95% CI) | 8.81 [1.01, 76.73] |
| 6.7 UDCA (low) versus no intervention | 1 | 18 | Odds Ratio (M‐H, Fixed, 95% CI) | 0.0 [0.0, 0.0] |
| 6.8 UDCA (moderate) versus no intervention | 2 | 362 | Odds Ratio (M‐H, Fixed, 95% CI) | 1.45 [0.50, 4.25] |
| 6.9 Glucocorticosteroids plus UDCA (moderate) versus azathioprine plus UDCA (moderate) | 1 | 50 | Odds Ratio (M‐H, Fixed, 95% CI) | 0.40 [0.08, 2.12] |
| 6.10 UDCA (low) versus bezafibrate | 1 | 24 | Odds Ratio (M‐H, Fixed, 95% CI) | 0.0 [0.0, 0.0] |
| 6.11 Obeticholic acid (low) versus obeticholic acid (high) | 1 | 79 | Odds Ratio (M‐H, Fixed, 95% CI) | 0.09 [0.00, 1.78] |
| 6.12 Obeticholic acid (moderate) versus obeticholic acid (high) | 1 | 89 | Odds Ratio (M‐H, Fixed, 95% CI) | 0.38 [0.02, 9.62] |
| 6.13 Obeticholic acid (moderate) versus obeticholic acid (low) | 1 | 86 | Odds Ratio (M‐H, Fixed, 95% CI) | 5.53 [0.59, 51.70] |
| 6.14 Bezafibrate plus UDCA (low) versus UDCA (low) | 1 | 22 | Odds Ratio (M‐H, Fixed, 95% CI) | 3.29 [0.12, 89.81] |
| 6.15 Colestilan plus UDCA (low) versus UDCA (low) | 1 | 11 | Odds Ratio (M‐H, Fixed, 95% CI) | 0.0 [0.0, 0.0] |
| 6.16 Methotrexate plus UDCA (low) versus UDCA (low) | 1 | 25 | Odds Ratio (M‐H, Fixed, 95% CI) | 115.0 [4.98, 2657.48] |
| 6.17 UDCA (moderate) versus UDCA (low) | 1 | 59 | Odds Ratio (M‐H, Fixed, 95% CI) | 0.0 [0.0, 0.0] |
| 6.18 Azathioprine plus UDCA (moderate) versus UDCA (moderate) | 1 | 42 | Odds Ratio (M‐H, Fixed, 95% CI) | 19.67 [0.94, 413.50] |
| 6.19 Colchicine plus UDCA (moderate) versus UDCA (moderate) | 2 | 42 | Odds Ratio (M‐H, Fixed, 95% CI) | 6.20 [0.63, 60.80] |
| 6.20 Glucocorticosteroids plus UDCA (moderate) versus UDCA (moderate) | 2 | 135 | Odds Ratio (M‐H, Fixed, 95% CI) | 5.54 [1.35, 22.84] |
| 6.21 TauroUDCA (moderate) versus UDCA (moderate) | 1 | 30 | Odds Ratio (M‐H, Fixed, 95% CI) | 21.0 [2.16, 204.61] |
| 7 Adverse events (number) Show forest plot | 15 | Rate Ratio (Fixed, 95% CI) | Subtotals only | |
| 7.1 Chlorambucil versus no intervention | 1 | Rate Ratio (Fixed, 95% CI) | 3.67 [1.04, 12.87] | |
| 7.2 Cyclosporin versus no intervention | 3 | Rate Ratio (Fixed, 95% CI) | 1.87 [1.51, 2.32] | |
| 7.3 D‐Penicillamine versus no intervention | 3 | Rate Ratio (Fixed, 95% CI) | 2.64 [1.78, 3.91] | |
| 7.4 Malotilate versus no intervention | 1 | Rate Ratio (Fixed, 95% CI) | 6.13 [1.38, 27.14] | |
| 7.5 Obeticholic acid (high) versus no intervention | 1 | Rate Ratio (Fixed, 95% CI) | 1.91 [1.50, 2.44] | |
| 7.6 Obeticholic acid (low) versus no intervention | 1 | Rate Ratio (Fixed, 95% CI) | 1.05 [0.80, 1.39] | |
| 7.7 Obeticholic acid (moderate) versus no intervention | 1 | Rate Ratio (Fixed, 95% CI) | 1.25 [0.97, 1.62] | |
| 7.8 Obeticholic acid (low) versus obeticholic acid (high) | 1 | Rate Ratio (Fixed, 95% CI) | 0.55 [0.43, 0.70] | |
| 7.9 Obeticholic acid (moderate) versus obeticholic acid (high) | 1 | Rate Ratio (Fixed, 95% CI) | 0.66 [0.53, 0.81] | |
| 7.10 Obeticholic acid (moderate) versus obeticholic acid (low) | 1 | Rate Ratio (Fixed, 95% CI) | 1.19 [0.93, 1.53] | |
| 7.11 UDCA (low) versus UDCA (high) | 1 | Rate Ratio (Fixed, 95% CI) | 2.08 [0.78, 5.53] | |
| 7.12 UDCA (moderate) versus UDCA (high) | 1 | Rate Ratio (Fixed, 95% CI) | 0.73 [0.21, 2.60] | |
| 7.13 UDCA (low) plus methotrexate versus UDCA (low) | 1 | Rate Ratio (Fixed, 95% CI) | 30.64 [1.84, 510.76] | |
| 7.14 UDCA (moderate) versus UDCA (low) | 1 | Rate Ratio (Fixed, 95% CI) | 0.35 [0.11, 1.10] | |
| 7.15 Azathioprine plus glucocorticosteroids plus UDCA (moderate) versus UDCA (moderate) | 1 | Rate Ratio (Fixed, 95% CI) | 1.32 [0.88, 1.97] | |
| 7.16 Bezafibrate plus UDCA (moderate) versus UDCA (moderate) | 1 | Rate Ratio (Fixed, 95% CI) | 11.79 [0.65, 213.14] | |
| 7.17 Colchicine plus UDCA (moderate) versus UDCA (moderate) | 1 | Rate Ratio (Fixed, 95% CI) | 5.91 [0.28, 123.08] | |
| 7.18 TauroUDCA (moderate) versus UDCA (moderate) | 1 | Rate Ratio (Fixed, 95% CI) | 1.17 [0.81, 1.71] | |
| 8 Liver transplantation Show forest plot | 12 | Odds Ratio (M‐H, Fixed, 95% CI) | Subtotals only | |
| 8.1 Cyclosporin versus no intervention | 2 | 378 | Odds Ratio (M‐H, Fixed, 95% CI) | 0.86 [0.43, 1.72] |
| 8.2 D‐Penicillamine versus no intervention | 1 | 189 | Odds Ratio (M‐H, Fixed, 95% CI) | 0.93 [0.06, 15.05] |
| 8.3 Methotrexate versus no intervention | 1 | 60 | Odds Ratio (M‐H, Fixed, 95% CI) | 0.17 [0.02, 1.58] |
| 8.4 UDCA (low) versus no intervention | 2 | 162 | Odds Ratio (M‐H, Fixed, 95% CI) | 0.99 [0.24, 4.06] |
| 8.5 UDCA (moderate) versus no intervention | 3 | 478 | Odds Ratio (M‐H, Fixed, 95% CI) | 0.88 [0.44, 1.76] |
| 8.6 UDCA (low) versus UDCA (high) | 1 | 106 | Odds Ratio (M‐H, Fixed, 95% CI) | 3.17 [0.13, 79.71] |
| 8.7 UDCA (moderate) versus UDCA (high) | 1 | 103 | Odds Ratio (M‐H, Fixed, 95% CI) | 3.37 [0.13, 84.70] |
| 8.8 UDCA (moderate) versus UDCA (low) | 1 | 101 | Odds Ratio (M‐H, Fixed, 95% CI) | 1.06 [0.06, 17.47] |
| 8.9 Bezafibrate plus UDCA (moderate) versus UDCA (moderate) | 1 | 27 | Odds Ratio (M‐H, Fixed, 95% CI) | 0.0 [0.0, 0.0] |
| 8.10 Methotrexate plus UDCA (moderate) versus UDCA (moderate) | 1 | 265 | Odds Ratio (M‐H, Fixed, 95% CI) | 0.70 [0.35, 1.39] |
| 9 Decompensated liver disease Show forest plot | 7 | Odds Ratio (M‐H, Fixed, 95% CI) | Subtotals only | |
| 9.1 D‐Penicillamine versus no intervention | 1 | 24 | Odds Ratio (M‐H, Fixed, 95% CI) | 0.0 [0.0, 0.0] |
| 9.2 UDCA (moderate) versus no intervention | 2 | 351 | Odds Ratio (M‐H, Fixed, 95% CI) | 1.33 [0.84, 2.12] |
| 9.3 Obeticholic acid (low) plus UDCA (moderate) versus UDCA (moderate) | 1 | 216 | Odds Ratio (M‐H, Fixed, 95% CI) | 1.55 [0.06, 38.46] |
| 9.4 UDCA (low) plus colchicine versus UDCA (low) | 1 | 84 | Odds Ratio (M‐H, Fixed, 95% CI) | 0.21 [0.04, 1.07] |
| 9.5 Azathioprine plus UDCA (moderate) versus UDCA (moderate) | 1 | 42 | Odds Ratio (M‐H, Fixed, 95% CI) | 0.52 [0.05, 5.18] |
| 9.6 Glucocorticosteroids plus UDCA (moderate) versus UDCA (moderate) | 1 | 66 | Odds Ratio (M‐H, Fixed, 95% CI) | 0.55 [0.11, 2.69] |
| 9.7 Methotrexate plus UDCA (moderate) versus UDCA (moderate) | 1 | 151 | Odds Ratio (M‐H, Fixed, 95% CI) | 2.00 [0.79, 5.04] |
| 9.8 Glucocorticosteroids plus UDCA (moderate) versus azathioprine plus UDCA (moderate) | 1 | 50 | Odds Ratio (M‐H, Fixed, 95% CI) | 1.06 [0.10, 11.18] |
| 10 Cirrhosis Show forest plot | 3 | Odds Ratio (M‐H, Fixed, 95% CI) | Subtotals only | |
| 10.1 Azathioprine versus no intervention | 1 | 31 | Odds Ratio (M‐H, Fixed, 95% CI) | 0.79 [0.18, 3.41] |
| 10.2 UDCA (low) versus no intervention | 1 | 22 | Odds Ratio (M‐H, Fixed, 95% CI) | 0.15 [0.01, 1.53] |
| 10.3 Azathioprine plus glucocorticosteroids plus UDCA (moderate) versus UDCA (moderate) | 1 | 50 | Odds Ratio (M‐H, Fixed, 95% CI) | 0.28 [0.03, 2.90] |