Nutrition support in hospitalised adults at nutritional risk
Referencias
References to studies included in this review
References to studies excluded from this review
References to studies awaiting assessment
References to ongoing studies
Additional references
References to other published versions of this review
Characteristics of studies
Characteristics of included studies [ordered by study ID]
| Methods | Randomised clinical trial, France | |
| Participants | 29 hospitalised geriatric adults, at nutritional risk as characterised by trialist Male:female = 1:28 Mean age = 85 years Exclusion criteria: diabetes mellitus, hepatic, renal, cardiac failure, major illness, sensory impairment, other conditions impeding assessment, prior nutritional treatment, uncooperativeness, poor oral intake, tube‐feeding or being bedridden | |
| Interventions | Experimental group: Oral nutrition support (n = 15) In addition to normal hospital food, participants received oral nutrients during the 105 trial days. The amounts of calories ingested daily were from day 1 through day 35 equal to 1254 kcal (± 259 kcal), and from day 36 through day 105 equal to 936 kcal (± 235 kcal) Control group: No intervention (n = 15) Co‐interventions: Participants received normal hospital food with no nutritional supplements | |
| Outcomes | Cognitive function (using MMS scores), body weight | |
| Study dates | Not stated | |
| Notes | We contacted the authors on 6th September 2015 by email: fabalan@ch‐perrens.fr. Authors replied with additional information on randomisation sequence (although we were missing information on whether the coin toss was performed by an independent person), blinding and incomplete outcome data. | |
| Risk of bias | ||
| Bias | Authors' judgement | Support for judgement |
| Random sequence generation (selection bias) | Unclear risk | Randomisation was done my means of coin toss but it was unclear if it was performed by an independent person. |
| Allocation concealment (selection bias) | Unclear risk | Not described. |
| Blinding of participants and personnel (performance bias) | High risk | Participants and personnel were not blinded. |
| Blinding of outcome assessment (detection bias) | High risk | Blinding of outcome assessment was not performed. |
| Incomplete outcome data (attrition bias) | Low risk | There were no drop‐outs. |
| Selective reporting (reporting bias) | Unclear risk | No protocol could be obtained and the trial did not report on all‐cause mortality and serious adverse event. |
| For‐profit bias | High risk | Trial was supported by Sopharga, Latema and Valpan Laboratories, who provided the oral nutrition support. |
| Other bias | Low risk | The trial appeared to be free of other components that could put it at risk of bias. |
| Methods | Randomised clinical trial, USA | |
| Participants | 44 hospitalised adults undergoing cardiac surgical procedures and malnourished at nutritional risk due to anthropometricsMale:female = not stated Mean age = not stated Exclusion criteria: not stated. | |
| Interventions | Experimental group: immediate hypertonic total parenteral nutrition for 5 days(n = 20) Control group: routine postoperative intravenous solutions for 5 days(n = 24) | |
| Outcomes | Mortality, net fluid balance, nitrogen balance | |
| Study dates | Not stated | |
| Notes | We contadted the authors on 9th November 2015 by email [email protected]. We received no reply. | |
| Risk of bias | ||
| Bias | Authors' judgement | Support for judgement |
| Random sequence generation (selection bias) | Unclear risk | Not described |
| Allocation concealment (selection bias) | Unclear risk | Not described |
| Blinding of participants and personnel (performance bias) | Unclear risk | Not described |
| Blinding of outcome assessment (detection bias) | Unclear risk | Not described |
| Incomplete outcome data (attrition bias) | Unclear risk | The number of participants with incomplete data was not described. |
| Selective reporting (reporting bias) | Unclear risk | No protocol could be obtained and the trial did not report all‐cause mortality and serious adverse events. |
| For‐profit bias | Unclear risk | It was unclear how the trial was funded. |
| Other bias | Low risk | The trial appeared to be free of other components that could put it at risk of bias. |
| Methods | Randomised clinical trial, Iran | |
| Participants | 20 hospitalised adults with recent ICU admission (< 24 hrs), having systemic inflammatory response syndrome, Acute Physiology and Chronic Health Evaluation II (APACHE II) score > 10 and expected not to feed via oral route for at least 5 days, at nutritional risk due to being in a ICU Mean age = 56.5 years Exclusion criteria: adults with high probability of death in the next 7 days of admission, pregnant, lactating, and having EN contra‐indication | |
| Interventions | Experimental group: parenteral nutrition (500 ml 10% amino acid solution, 500 ml 50% dextrose) (n = 10) Control group: no intervention (n = 10) Co‐interventions: standard ICU care + EN (1 kCal/ml) | |
| Outcomes | Mortality, pre‐albumin, tumour necrosis factor, sequential organ failure assessment, therapeutic intervention scoring system | |
| Study dates | November 2007 and May 2009 | |
| Notes | We contacted the authors on 9th November 2015 by email: [email protected] . We received no reply. | |
| Risk of bias | ||
| Bias | Authors' judgement | Support for judgement |
| Random sequence generation (selection bias) | Unclear risk | Not described |
| Allocation concealment (selection bias) | Unclear risk | Not described |
| Blinding of participants and personnel (performance bias) | Unclear risk | Not described |
| Blinding of outcome assessment (detection bias) | Unclear risk | Not described |
| Incomplete outcome data (attrition bias) | Low risk | One person dropped out (5%) and had missing data. |
| Selective reporting (reporting bias) | Unclear risk | No protocol could be obtained and the trial did not report all‐cause mortality and serious adverse. |
| For‐profit bias | Low risk | The study was partly supported by grant from Tehran University of Medical Sciences research council. |
| Other bias | Low risk | The trial appeared to be free of other components that could put it at risk of bias. |
| Methods | Randomised clinical trial, Israel | |
| Participants | 51 hospitalised adults undergoing surgery for hip fracture, at nutritional risk due to being frail elderly Male:Female = 17:33 Mean age = 83 Exclusion criteria: patients were excluded if they presented to hospital > 48 hours after the injury, were receiving steroids or immunosuppression therapy, or both; in the presence of active oncologic disease, multiple fractures, diagnosed dementia or in the event that patients required supplemental nasal oxygen which precludes the measurement of REE | |
| Interventions | Experimental group: the tight calorie group received calories with an energy goal determined by repeated REE measurements using indirect calorimetry (IC) (Fitmate, Cosmed, Italy) which was based on hospital‐prepared diets (standard or texture‐adapted). Oral nutritional supplements (ONS) were started 24 hours after surgery and the amount adjusted to make up the difference between energy received from hospital food and measured energy expenditure. Control group: no intervention (n = 28) Co‐intervention: standard hospital diet which provided a mean of 1800 kcal and 80 g of protein | |
| Outcomes | BMI, Biochemical parameters including serum glucose, albumin, lymphocyte count and creatinine levels | |
| Study dates | May 2010 to December 2011 | |
| Notes | We contacted the authors on 21st October 2015 by email: [email protected]. We received no reply. | |
| Risk of bias | ||
| Bias | Authors' judgement | Support for judgement |
| Random sequence generation (selection bias) | Low risk | The trial states that "Randomization was performed using a concealed, computer‐generated program". |
| Allocation concealment (selection bias) | Unclear risk | It was unclear how the randomisation code was concealed although it was stated that it was concealed as above. |
| Blinding of participants and personnel (performance bias) | High risk | The trial was described as unblinded. |
| Blinding of outcome assessment (detection bias) | High risk | The trial was described as unblinded. |
| Incomplete outcome data (attrition bias) | Low risk | There was one randomised participant who did not complete the trial. |
| Selective reporting (reporting bias) | Low risk | The trial reported all‐cause mortality and complications. |
| For‐profit bias | Unclear risk | It was unclear how the trial was funded. |
| Other bias | Low risk | The trial appeared to be free of other components that could put it at risk of bias. |
| Methods | Randomised clinical trial, Italy | |
| Participants | 48 adults hospitalised with subacute stroke, cognitive dysfunction (< 20 in the mini‐mental state examination) and independent in their alimentation. They were at nutritional risk due to stroke. Male:Female = 27:21 Mean age = 73 years (experimental group), 71 years (control group) Exclusion criteria: aphasic patients, patients with chronic renal failure or diabetes on hypoglycaemic therapy, or both | |
| Interventions | Experimental group: Oral caloric‐protein supplement for 21 days, containing 200 ml mixture of cubit an, nutricia, Italy providing 250 calories, 20 g protein, 28,2 g carbohydrates and 7 g lipids (n = 24) Control group: No intervention (n = 24) | |
| Outcomes | Anthropometric and nutritional (3‐day diary) variables, cognitive function (MMSE) Weight, height, BMI, daily caloric and macronutrient intake | |
| Study dates | Not stated | |
| Notes | We contacted the authors on 27th September 2015 by email: [email protected]. We received an initial reply, but did not receive a reply for our follow‐up questions. | |
| Risk of bias | ||
| Bias | Authors' judgement | Support for judgement |
| Random sequence generation (selection bias) | Low risk | Randomisation where performed using SAS statistical tool |
| Allocation concealment (selection bias) | Unclear risk | The description of allocation concealment was too unclear to permit judgement of low or high risk of bias. |
| Blinding of participants and personnel (performance bias) | Unclear risk | The study reports to be "double blinded", but does not explicitly describe how. The physician who evaluated the MMSE score was blinded to the supplementation and was different from the physician who prescribed the supplementation. |
| Blinding of outcome assessment (detection bias) | Unclear risk | Not described |
| Incomplete outcome data (attrition bias) | Unclear risk | The number of participants with incomplete data was not reported. |
| Selective reporting (reporting bias) | Unclear risk | No protocol could be obtained and the trial did not report all‐cause mortality and serious adverse events. |
| For‐profit bias | Unclear risk | It was unclear how the trial was funded. |
| Other bias | Low risk | The trial appeared to be free of other components that could put it at risk of bias. |
| Methods | Randomised clinical trial, Uruguay | |
| Participants | 667 hospitalised adults admitted to the medical ward, at nutritional risk due to being malnourished or severely malnourished according the Subjective Global Assessment criteria Male:Female = 337:200 (excluding dropped‐out participants) Exclusion criteria: diabetic, decompensated hepatitis with encephalitis, altered consciousness, difficulty understanding instructions or handicap, where the family was unwilling to co‐operate | |
| Interventions | Experimental group: oral nutrition support with 1 cal/ml (54.5% carbohydrates, 31.5% lipid, 14% protein), 700 ml maximum (n = 333) Control group: no intervention (n = 334) Co‐interventions: treatment as usual | |
| Outcomes | Development of infections, pressure ulcers, length of hospital stay, mortality and weight | |
| Study dates | May 2005 to September 2006 | |
| Notes | We contacted the authors by email: [email protected]. We received a reply and received information on sequence generation, allocation concealment and weight data. | |
| Risk of bias | ||
| Bias | Authors' judgement | Support for judgement |
| Random sequence generation (selection bias) | Unclear risk | The 'code' was made by folding papers with either a T or a C, not performed by an independent person. |
| Allocation concealment (selection bias) | Unclear risk | The papers were folded and put into a dark bag. It is unclear if the allocation was concealed properly. |
| Blinding of participants and personnel (performance bias) | High risk | The trial was not blinded. |
| Blinding of outcome assessment (detection bias) | High risk | The trial was not blinded. |
| Incomplete outcome data (attrition bias) | High risk | 130 participants dropped out, without the trial using proper methods to deal with the dropouts. |
| Selective reporting (reporting bias) | Low risk | All‐cause mortality and complications were reported. |
| For‐profit bias | Unclear risk | It was unclear how the trial was funded. |
| Other bias | Low risk | The trial appeared to be free of other components that could put it at risk of bias. |
| Methods | Randomised clinical trial, unknown country. | |
| Participants | 63 hospitalised long‐stay elderly, at nutritional risk according to the trialist Male:Female = 21:42 Mean age: 81 years | |
| Interventions | Experimental group: 60 g daily oral supplements (n = 31) Control group: no intervention (n = 32) Co‐intervention: observation for 14 weeks before study start, standard hospital diet | |
| Outcomes | Change in intake, skin‐fold thickness, laboratory test, mortality | |
| Study dates | Not stated | |
| Notes | We did not contact the authors due to the trial's late inclusion. | |
| Risk of bias | ||
| Bias | Authors' judgement | Support for judgement |
| Random sequence generation (selection bias) | Unclear risk | Not described |
| Allocation concealment (selection bias) | Unclear risk | Not described |
| Blinding of participants and personnel (performance bias) | Unclear risk | Not described |
| Blinding of outcome assessment (detection bias) | Unclear risk | Not described |
| Incomplete outcome data (attrition bias) | Low risk | Less than 5% dropped out (3 participants) |
| Selective reporting (reporting bias) | Unclear risk | No protocol could be obtained, and the trial did not report on serious adverse events. |
| For‐profit bias | High risk | The trial was funded by Glaxo Laboratories. |
| Other bias | Low risk | The trial appeared to be free of other components that could put it at risk of bias. |
| Methods | Randomised clinical trial, hospital in UK | |
| Participants | 121 hospitalised adults; most suspected upper gastrointestinal malignancy referred for major elective surgery, at nutritional risk due to major surgery Male:Female = 83:38 Mean age = 64 years Exclusion criteria: age under 18 years; unable or unwilling to give informed consent; pregnant; pre‐operative infection; previous intestinal surgery resulting in residual small intestine length of less than 100 cm | |
| Interventions | Experimental group: Early Enteral Nutrition was delivered via a needle catheter jejunostomy. Nutritional support begun within 12 hrs of the surgery at 20 ml/hr of a standard 1 kcal/ml commercial whole protein enteral feed for the first 24 hrs in participants undergoing oesophagogastric resection, with the rate increasing as tolerated by 10 ml/hr every 12 hrs, until the maximum feed target rate of 80 ml/h was achieved. Participants undergoing pancreatic resection were started on 10 ml/hr of a 1.3 kcal/ml commercial semi‐elemental enteral feed on the first post‐operative day, which was then steadily increased as for the oesophagogastric participants. The aim was to achieve a minimum of half of nutritional requirements by the 5th postoperative day. | |
| Outcomes | Postoperative morbidity and mortality, wound infections, chest infections, anastomotic leaks, length of hospital stay | |
| Study dates | ||
| Notes | We contacted the authors on 30th June 2015 by email: [email protected]. We received no reply. | |
| Risk of bias | ||
| Bias | Authors' judgement | Support for judgement |
| Random sequence generation (selection bias) | Low risk | The randomisation sequence was generated by computer in permuted blocks of 30. |
| Allocation concealment (selection bias) | Low risk | The code was kept in opaque, sealed envelopes labelled with sequential study numbers in a locked box. |
| Blinding of participants and personnel (performance bias) | High risk | The trial is described as unblinded. |
| Blinding of outcome assessment (detection bias) | High risk | The trial is described as unblinded. |
| Incomplete outcome data (attrition bias) | Low risk | No dropouts and data on all participants |
| Selective reporting (reporting bias) | Low risk | Protocol is available, but contains no outcomes. In the trial all‐cause mortality and serious adverse events are reported. |
| For‐profit bias | Low risk | This trial was funded by a grant from The Health Foundation, London, UK. |
| Other bias | Low risk | The trial appeared to be free of other components that could put it at risk of bias. |
| Methods | Randomised clinical trial, Australia | |
| Participants | 57 hospitalised adults scheduled for major upper abdominal surgery, at nutritional risk due to major abdominal surgery Male:Female = 27:20 Mean age = 60.25 years Exclusion criteria: Younger than 21 years or older than 80 years of age, required IVN because of severe malnutrition, or postoperative complications such as sepsis or haemorrhage, surgery involving the diaphragm or thorax, significant cardiac disease, respiratory disease, renal disease, musculoskeletal or neurological disease, hematological disease, drug dependency disorder, or psychiatric disease. | |
| Interventions | Experimental group: Multimodal analgesia and intravenous nutrition, either glucose or lipid‐based. On the second postoperative day, a peripheral “long‐line” IV was inserted for IVN. From this time, IV feeding was established and continued until day 14. The formulation included 66% of the non‐protein kilo joules as lipid, 9 g/L of nitrogen (Vamin 18; Kabi Vitrum, Stockholm, Sweden), and a non‐nitrogen energy load of 4200 kJ/L. This was infused at a rate of 2 to 2.8 L/24 hr, depending on the participant's calculated requirements. (n = 18) Control group: Multimodal analgesia (n = 14) | |
| Outcomes | Duration of hospital stay, time to start of oral nutrition, weight (kg), BMI, fat (kg), protein (kg), water (Kg), nitrogen balance. Significant clinical complications | |
| Study dates | Not stated | |
| Notes | We contacted the authors on 12th September 2015 by email [email protected]. We received no reply. | |
| Risk of bias | ||
| Bias | Authors' judgement | Support for judgement |
| Random sequence generation (selection bias) | Unclear risk | Randomly allocated cards, but it was unclear if the shuffling was done by an independent person. |
| Allocation concealment (selection bias) | Unclear risk | The envelopes used to conceal the randomisation code were described as sealed envelopes, but it was unknown if they were opaque. |
| Blinding of participants and personnel (performance bias) | High risk | Blinding was not performed. |
| Blinding of outcome assessment (detection bias) | High risk | Blinding was not performed. |
| Incomplete outcome data (attrition bias) | Unclear risk | The number of participants with incomplete data was not described. |
| Selective reporting (reporting bias) | Unclear risk | No protocol could be obtained and the trial did not report all‐cause mortality and serious adverse events. |
| For‐profit bias | Unclear risk | It was unclear how the trial was funded. |
| Other bias | Low risk | The trial appeared to be free of other components that could put it at risk of bias. |
| Methods | Randomised clinical trial, Australia | |
| Participants | 57 hospitalised adults scheduled for major upper abdominal surgery, at nutritional risk due to major abdominal surgery Male:Female = 27:20 Mean age = 60.25 years Exclusion criteria: Younger than 21 years or older than 80 years, required IVN because of severe malnutrition, or postoperative complications such as sepsis or haemorrhage. Surgery involving the diaphragm or thorax, significant cardiac disease, respiratory disease, renal disease, musculoskeletal or neurological disease, haematological disease; drug dependency disorder, or psychiatric disease | |
| Interventions | Experimental group: participant‐controlled analgesia with opioids + Intravenous nutrition either glucose‐ or lipid‐based. On the 2nd postoperative day, a peripheral “long‐line” IV was inserted for IVN. From this time, IV feeding was established and continued until day 14. The formulation included 66% of the non‐protein kilo joules as lipid, 9 g/L of nitrogen (Vamin 18; Kabi Vitrum, Stockholm, Sweden), and a non‐nitrogen energy load of 4200 kJ/L. This was infused at a rate of 2 to 2.8 L/24 hrs, depending on the participant's calculated requirements. (n = 12) Control group: participant‐controlled analgesia with opioids(n = 13) | |
| Outcomes | Duration of hospital stay, time to commencement of oral nutrition, weight (Kg), BMI, fat (Kg), protein (g), water (Kg), nitrogen balance. Significant clinical complications | |
| Study dates | Not stated | |
| Notes | We contacted the authors on 12th September 2015 by email: [email protected]. We received no reply. | |
| Risk of bias | ||
| Bias | Authors' judgement | Support for judgement |
| Random sequence generation (selection bias) | Unclear risk | Randomly allocated cards, but it was unclear if the shuffling was done by an independent person |
| Allocation concealment (selection bias) | Unclear risk | The envelopes used to conceal the randomisation code were described as sealed envelopes, but it was unknown if they were opaque. |
| Blinding of participants and personnel (performance bias) | High risk | The trial was not blinded. |
| Blinding of outcome assessment (detection bias) | High risk | The trial was not blinded. |
| Incomplete outcome data (attrition bias) | Unclear risk | The number of participants with incomplete data was not reported. |
| Selective reporting (reporting bias) | Unclear risk | No protocol could be obtained and the trial did not report all‐cause mortality and serious adverse events. |
| For‐profit bias | Unclear risk | It was unclear how the trial was funded. |
| Other bias | Low risk | The trial appeared to be free of other components that could put it at risk of bias. |
| Methods | Randomised clinical trial, hospital in UK | |
| Participants | 122 hospitalised adults with fractured neck of femur and assessed as thin (1 ‐ 2 SDs below the mean), at nutritional risk due to being frail elderly with hip fracture Only women Exclusion criteria: severe dementia or serious concomitant physical disorders, e.g. stroke | |
| Interventions | Experimental group: an overnight feed of 1 litre Clinifeed Iso (4 ‐ 2 MJ (1000 kcal), including 28 g protein). It was started within 5 days of operation and delivered over 8 hrs each night through a fine bore soft nasogastric tube using a peristaltic pump. Tube‐feeding was continued until the adult was discharged from the ward, did not tolerate the tube or died.(n = 39) Control group: no intervention(n = 35) Co‐interventions: both control and tube‐fed adults ate a normal ward diet during the day and were given free access to snacks and drinks. | |
| Outcomes | Weight, upper arm circumference, triceps skinfold thickness, mortality, food intake, length of hospital stay, mobility, plasma protein | |
| Study dates | Not stated | |
| Notes | Same trial as Bastow 1983b but with the participants characterised as 'thin'. We could not obtain any contact information on the author. | |
| Risk of bias | ||
| Bias | Authors' judgement | Support for judgement |
| Random sequence generation (selection bias) | Unclear risk | Not described |
| Allocation concealment (selection bias) | Unclear risk | Not described |
| Blinding of participants and personnel (performance bias) | Unclear risk | Not described |
| Blinding of outcome assessment (detection bias) | Unclear risk | Not described |
| Incomplete outcome data (attrition bias) | Unclear risk | The number of participants with incomplete data was not reported. |
| Selective reporting (reporting bias) | Unclear risk | No protocol could be obtained and the trial did not report all‐cause mortality and serious adverse events. |
| For‐profit bias | High risk | One of the authors was supported by a grant from Roussell Laboratories Ltd. |
| Other bias | Low risk | The trial appeared to be free of other components that could put it at risk of bias. |
| Methods | Randomised clinical trial, hospital in UK | |
| Participants | 122 hospitalised adults with fractured neck of femur and assessed as very thin ( > 2 SDs below the mean), at nutritional risk due to being frail elderly with hip fracture Only women Mean age = 80 years Exclusion criteria: severe dementia or serious concomitant physical disorders, e.g. stroke | |
| Interventions | Experimental group: an overnight feed of 1 litre Clinifeed Iso (4 ‐ 2 MJ (1000 kcal), including 28 g protein). It was started within 5 days of operation and delivered over 8 hours each night through a fine bore soft nasogastric tube using a peristaltic pump. Tube‐feeding was continued until the adult was discharged from the ward, did not tolerate the tube or died. (n = 25) Control group: no intervention (n = 23) Co‐interventions: both control and tube‐fed adults ate a normal ward diet during the day and were given free access to snacks and drinks. | |
| Outcomes | Weight, upper arm circumference, triceps skinfold thickness, mortality, food intake, length of hospital stay, mobility, plasma protein | |
| Study dates | Not stated | |
| Notes | Same trial as Bastow 1983a but with the participants characterised as 'very thin' | |
| Risk of bias | ||
| Bias | Authors' judgement | Support for judgement |
| Random sequence generation (selection bias) | Unclear risk | Not described |
| Allocation concealment (selection bias) | Unclear risk | Not described |
| Blinding of participants and personnel (performance bias) | Unclear risk | Not described |
| Blinding of outcome assessment (detection bias) | Unclear risk | Not described |
| Incomplete outcome data (attrition bias) | Unclear risk | The number of participants with incomplete data was not reported. |
| Selective reporting (reporting bias) | Unclear risk | No protocol could be obtained and the trial did not report all‐cause mortality and serious adverse events. |
| For‐profit bias | High risk | One of the authors was supported by a grant from Roussell Laboratories Ltd. |
| Other bias | Low risk | The trial appeared to be free of other components that could put it at risk of bias. |
| Methods | Randomised clinical trial (blocks of 10), France | |
| Participants | 120 hospitalised adults admitted to the ICU for more than 2 days, at nutritional risk due to being in the ICU Male:Female = 82:38 Mean age: 54 years Exclusion criteria: elective surgery or presenting a contraindication to enteral or parenteral support, or both, having a previous history of allergy to vitamins | |
| Interventions | Experimental group: received parenteral nutrition. Treatment consisted of a 3‐in‐1 solution of carbohydrates, fat, and protein, Vitrimix KV and hydrosoluble vitamins, Soluvit. (n = 60)Control group: received placebo. Treatment consisted of sodium chloride 0.9% with Intralipid 20% (50 ml/l) and Soluvit (10 ml/l), stable for 24 hrs Treatment and placebo were administered in the same type of plastic bags (1 ± 2 l), at a concentration of 1 kcal/ml in the treatment group. The solution was administered through a central line (960 mOSm/l) that was not inserted solely for nutritional purposes. The rate of intravenous administration was increased to 120 ml/hr for 18 ± 24 hrs. (n = 60) Co‐intervention: both groups received enteral support: Participants were bolus‐fed every 4 hrs, 5 times a day with a standard, noncommercial, modular polymeric diet. The composition of the solution was protein (20%), polyunsaturated fats (30%), carbohydrates (50%), non‐soluble fibres, sodium chloride (2 g/l), potassium chloride (3 g/l), and a standard solution of hydro‐ and lipo‐soluble vitamins; the concentration of the solution was 1 kcal/ml. A typical 70‐kg participant would receive 100 ml initially, with an increased amount in 50‐ml steps to a maximum of 350 ml every 4 hrs 5 times a day. | |
| Outcomes | Levels of retinol‐binding protein and prealbumin, morbidity, mortality, cost | |
| Study dates | Not stated | |
| Notes | No contact information could be obtained. | |
| Risk of bias | ||
| Bias | Authors' judgement | Support for judgement |
| Random sequence generation (selection bias) | Unclear risk | Not described |
| Allocation concealment (selection bias) | Unclear risk | The envelopes were described as sealed but it was uncertain if the envelopes were opaque. |
| Blinding of participants and personnel (performance bias) | Low risk | Neither the healthcare providers nor the participants were aware of the treatment given. |
| Blinding of outcome assessment (detection bias) | Unclear risk | Although the statistician was blinded to the allocation of treatment until all events had occurred, it is not stated clearly who performed the outcome assessment. |
| Incomplete outcome data (attrition bias) | Unclear risk | 6/60 early dropouts in the experimental group and 7/60 in the control group They stated that they used intention‐to‐treat analysis, but did not fully describe how they dealt with missing participants. |
| Selective reporting (reporting bias) | Low risk | The trial reported all‐cause mortality and serious adverse events. No protocol could be found. |
| For‐profit bias | Unclear risk | It was unclear how the trial was funded. |
| Other bias | Low risk | The trial appeared to be free of other components that could put it at risk of bias. |
| Methods | Randomised clinical trial, Denmark | |
| Participants | 60 hospitalised adults with gastro‐intestinal diseases requiring major surgery, at nutritional risk due to major surgery Male:Female = 38:22 Mean age = 64 years Exclusion criteria: Adults with insulin‐dependent diabetes mellitus, inadequate renal or hepatic functions, or inflammatory bowel disease were excluded, as were adults receiving immunosuppressive drugs. | |
| Interventions | Experimental group: Nutrition (Nutridrink with orange flavour, Nutricia). They were scheduled to receive 600 ml on the day of operation, increasing by 400 ml daily until the 4th postoperative day. (n = 30) They were scheduled to receive 600 ml on the day of operation, increasing by 400 ml daily until the 4th postoperative day. | |
| Outcomes | Cell‐mediated immunity, serious adverse events, all‐cause mortality | |
| Study dates | Not stated | |
| Notes | We contacted the authors on 27th September 2015 by email: [email protected], We received an initial reply but no reply on following emails. | |
| Risk of bias | ||
| Bias | Authors' judgement | Support for judgement |
| Random sequence generation (selection bias) | Unclear risk | Not described |
| Allocation concealment (selection bias) | Unclear risk | Not described |
| Blinding of participants and personnel (performance bias) | Unclear risk | It was reported that the study was double‐blinded, but it was not further described. |
| Blinding of outcome assessment (detection bias) | Unclear risk | It was reported that the study was double‐blinded, but it was not further described. |
| Incomplete outcome data (attrition bias) | Unclear risk | The number of participants with incomplete data was not reported. |
| Selective reporting (reporting bias) | Low risk | No protocol could be obtained, but all‐cause mortality and serious adverse events were assessed. |
| For‐profit bias | High risk | "Nutricia Research, Zoetermeer, the Netherlands" kindly contributed financially to the study. |
| Other bias | Low risk | The trial appeared to be free of other components that could put it at risk of bias. |
| Methods | Randomised clinical trial, Italy | |
| Participants | 100 hospitalised adults admitted for gastro‐intestinal surgery, at nutritional risk due to major surgery Male:Female = 64:36 Mean age = 58 years | |
| Interventions | Experimental group: Parenteral supplements (30 Cal/kg/day 200 mg/kg/day nitrogen) for at least 7 days prior to surgery(n = 54) Control group: No intervention(n = 46) Co‐intervention: Standard hospital oral diet | |
| Outcomes | Mortality, septic complications | |
| Study dates | Not stated | |
| Notes | We contacted the authors on 9th November 2015 by email: [email protected] . We received no reply. | |
| Risk of bias | ||
| Bias | Authors' judgement | Support for judgement |
| Random sequence generation (selection bias) | Unclear risk | Not described |
| Allocation concealment (selection bias) | Unclear risk | Not described |
| Blinding of participants and personnel (performance bias) | Unclear risk | Not described |
| Blinding of outcome assessment (detection bias) | Unclear risk | Not described |
| Incomplete outcome data (attrition bias) | Unclear risk | The number of participants with incomplete data was not reported. |
| Selective reporting (reporting bias) | Unclear risk | No protocol could be obtained and the trial did not report all‐cause mortality or serious adverse events. |
| For‐profit bias | Unclear risk | It was unclear how the trial was funded. |
| Other bias | Low risk | The trial appeared to be free of other components that could put it at risk of bias. |
| Methods | Randomised clinical trial, the Netherlands | |
| Participants | 49 adults undergoing radical and extensive surgery for advanced head and neck cancer (stage III and IV) severely malnourished (preoperative weight loss > 10%), at nutritional risk due to major surgery Male:Female = 18:15 Mean age = 62.5 years Exclusion criteria: Well‐nourished (weight loss < 10%), received other investigational drugs or steroids, or suffered from renal insufficiency, hepatic failure, any genetic immune disorders or a confirmed diagnosis of AIDS | |
| Interventions | Experimental group: standard preoperative enteral nutrition (1250 kcal/L, 62.5 g. protein/L) (n = 15) Control group: No preoperative nutritional support(n = 17) Co‐interventions: preoperatively fed for 7 – 10 days. Postoperatively tube‐fed for approximately 14 days, as was standard hospital procedure | |
| Outcomes | Quality of life, using the scales: QLQ‐C30, COOP–WONCA | |
| Study dates | 1994 to 1997 | |
| Notes | We only use groups 1 and 2. We contacted the authors in September 2015 by email: [email protected]. We received a reply with the specific calorie intake in the 2 groups. | |
| Risk of bias | ||
| Bias | Authors' judgement | Support for judgement |
| Random sequence generation (selection bias) | Unclear risk | Not described |
| Allocation concealment (selection bias) | Unclear risk | Not described |
| Blinding of participants and personnel (performance bias) | High risk | Blinding of participants, healthcare professionals involved in participant treatment and assessors was only possible in groups II and III. |
| Blinding of outcome assessment (detection bias) | High risk | Blinding of participants, healthcare professionals involved in participant treatment and assessors was only possible in groups II and III. |
| Incomplete outcome data (attrition bias) | High risk | There were missing data for 18 out of 49 participants for quality of life and the trial did not use proper methodology to account for the missing data. |
| Selective reporting (reporting bias) | Unclear risk | No protocol could be obtained and the trial did not report all‐cause mortality or serious adverse events. |
| For‐profit bias | Unclear risk | It was unclear how the trial was funded. |
| Other bias | Low risk | The trial appeared to be free of other components that could put it at risk of bias. |
| Methods | Randomised clinical trial, USA | |
| Participants | 39 hospitalised adults with alcoholic hepatitis due to 1. prolonged ethanol intake; 2. laboratory studies; 3. time of cessation of alcohol intake 5 ‐ 14 days before entry to the study, at nutritional risk according to the trialist Mean age = 42 years Exclusion criteria: recent severe gastro‐intestinal bleeding, severe ascites, severe degree of encephalophathy, renal insufficiency, acute pancreatitis, haemodynamic instability, advanced pulmonary disease, diabetes mellitus, active malignancy | |
| Interventions | The trial consisted of 4 groups. Groups 1 and 3, and groups 2 and 4 could be compared. Experimental group: parenteral nutritional supplementation 2 L (3.5 amino acids, 5% dextrose) for 21 days(n = 9) Co‐intervention: standard therapy (nutritionally adequate diets) in all groups and Oxandrolone in groups 2 and 4 | |
| Outcomes | Laboratory measurements, complications | |
| Study dates | August 1986 to November 1988 | |
| Notes | We here report group 1 (control) versus group 3 (experimental). | |
| Risk of bias | ||
| Bias | Authors' judgement | Support for judgement |
| Random sequence generation (selection bias) | Low risk | Random‐numbers table |
| Allocation concealment (selection bias) | Unclear risk | Not described |
| Blinding of participants and personnel (performance bias) | Unclear risk | Not described |
| Blinding of outcome assessment (detection bias) | Unclear risk | Not described |
| Incomplete outcome data (attrition bias) | Low risk | Data were reported for all participants for all outcomes. |
| Selective reporting (reporting bias) | Unclear risk | No protocol could be obtained, and the trial did not report on serious adverse events or mortality. |
| For‐profit bias | High risk | The trial was funded by Miles Laboratories. |
| Other bias | Low risk | The trial appeared to be free of other components that could put it at risk of bias. |
| Methods | Randomised clinical trial, USA | |
| Participants | 39 hospitalised adults with alcoholic hepatitis due to 1. prolonged ethanol intake; 2. laboratory studies; 3. time of cessation of alcohol intake 5 ‐ 14 days before entry to the study, at nutritional risk according to the trialist Mean age = 42 years Exclusion criteria: recent severe gastro‐intestinal bleeding, severe ascites, severe degree of encephalopathy, renal insufficiency, acute pancreatitis, haemodynamic instability, advanced pulmonary disease, diabetes mellitus, active malignancy | |
| Interventions | The trial consisted of 4 groups. Groups 1 and 3, and groups 2 and 4 could be compared. Experimental group: parenteral nutritional supplementation 2 L (3.5 amino acids, 5% dextrose) for 21 days(n = 10) Co‐intervention: standard therapy (nutritionally adequate diets) in all groups and Oxandrolone in groups 2 and 4 | |
| Outcomes | Laboratory measurements, complications | |
| Study dates | August 1986 to November 1988 | |
| Notes | We here report group 2 (control) versus group 4 (experimental). | |
| Risk of bias | ||
| Bias | Authors' judgement | Support for judgement |
| Random sequence generation (selection bias) | Low risk | Random‐numbers table |
| Allocation concealment (selection bias) | Unclear risk | Not described |
| Blinding of participants and personnel (performance bias) | Unclear risk | Not described |
| Blinding of outcome assessment (detection bias) | Unclear risk | Not described |
| Incomplete outcome data (attrition bias) | Low risk | Data were reported for all participants for all outcomes. |
| Selective reporting (reporting bias) | Unclear risk | No protocol could be obtained, and the trial did not report on serious adverse events or mortality. |
| For‐profit bias | High risk | The trial was funded by Miles Laboratories. |
| Other bias | Low risk | The trial appeared to be free of other components that could put it at risk of bias. |
| Methods | Randomised clinical trial, Spain | |
| Participants | 90 hospitalised adults 65 years or older undergoing surgery for hip fracture, at nutritional risk due to frail elderly with hip fracture Male:Female = 71:19 Mean age = 83.5 years Exclusion criteria: Adults with moderate to severe malnutrition (those with a weight loss of > 5% in the previous month or > 10% in the previous 6 months from their usual weight or serum albumin concentrations < 2.7 g/dL, or both) acute or chronic renal failure, hepatic insufficiency or cirrhosis (Child B or C), severe heart failure defined as New York Heart Association class III or IV, respiratory failure, and any Gl condition which precluded adequate oral nutrition intake | |
| Interventions | Experimental group: Group 2: protein powder ONSs. Adults received protein supplementation in the form of commercial protein powder (Vegenat‐med Proteina; Vegenat SA, Badajoz, Spain; 10‐g packets, with each providing 9 g of protein and 38 kcal) dissolved in water or in the diet’s milk or soup, to aim at 36 g of protein a day (4 packets a day)(n = 30) The oral nutritional supplement was started 48 hrs after operation and maintained after hospital discharge. Control group: No intervention(n = 15) Co‐intervention: All were prescribed a standard or texture‐adapted diet to meet the calculated metabolic rate. | |
| Outcomes | Changes in serum albumin, prealbumin, retinol‐binding globulin (RBG), BMI, midbrachial circumference, and tricipital fold, tolerance to prescribed ONS, length of hospital stay, postoperative complications, the time from surgery to the start of mobilisation as included in the rehabilitation programme | |
| Study dates | February 2006 to February 2007 | |
| Notes | We contacted authors on 6th June 2015 by email: [email protected], about details on data of BMI and complications and risk of bias (random sequence generation and blinding of outcome assessment). | |
| Risk of bias | ||
| Bias | Authors' judgement | Support for judgement |
| Random sequence generation (selection bias) | Unclear risk | Not described |
| Allocation concealment (selection bias) | Low risk | Randomised using sealed opaque envelopes |
| Blinding of participants and personnel (performance bias) | High risk | Participants were not blinded, as the control group received no intervention |
| Blinding of outcome assessment (detection bias) | Unclear risk | Not described |
| Incomplete outcome data (attrition bias) | High risk | 5 participants did not complete the study and the trial did not use proper methodology to account for the missing data. |
| Selective reporting (reporting bias) | Unclear risk | No protocol could be obtained and the trial did not report all‐cause mortality or serious adverse events. |
| For‐profit bias | Low risk | The trial was financed by Fundación para la Investigación Biomédica, Hospital Ramón y Cajal (FIBio‐RyC), Madrid, Spain. |
| Other bias | Low risk | The trial appeared to be free of other components that could put it at risk of bias. |
| Methods | Randomised clinical trial, Spain | |
| Participants | 90 hospitalised adults 65 years or older undergoing surgery for hip fracture, at nutritional risk due to frail elderly with hip fracture Male:Female = 71:19 Mean age = 83.5 years Exclusion criteria: Adults with moderate to severe malnutrition (those with a weight loss of > 5% in the previous month or > 10% in the previous 6 months from their usual weight or serum albumin concentrations < 2.7 g/dL, or both) acute or chronic renal failure, hepatic insufficiency or cirrhosis (Child B or C), severe heart failure defined as New York Heart Association class III or IV, respiratory failure, and any Gl condition which precluded adequate oral nutrition intake | |
| Interventions | Experimental group: Group 3: Energy protein ONSs. Participants received energy and protein supplements by means of commercial enteral nutrition for oral intake (Resource Hiperproteico; Novartis Medical Nutrition, Barcelona, Spain; 200‐mL bricks, with each providing 18.8 g of protein and 250 kcal) to aim at 37.6 g of protein and 500 kcal a day (2 bricks a day). The ONS was started 48 hrs after operation and maintained after hospital discharge.(n = 30) Control group: No intervention(n = 15) Co‐intervention: All were prescribed a standard or texture‐adapted diet to meet the calculated metabolic rate. | |
| Outcomes | Changes in serum albumin, prealbumin, retinol‐binding globulin (RBG), BMI, midbrachial circumference, and tricipital fold, tolerance to prescribed ONS, length of hospital stay, postoperative complications, the time from surgery to the start of mobilisation as included in the rehabilitation programme | |
| Study dates | February 2006 to February 2007 | |
| Notes | We contacted the authors on 6th June 2015 by email: [email protected] about details on data of BMI and complications and risk of bias (random sequence generation and blinding of outcome assessment). | |
| Risk of bias | ||
| Bias | Authors' judgement | Support for judgement |
| Random sequence generation (selection bias) | Unclear risk | Not described |
| Allocation concealment (selection bias) | Low risk | Randomised using sealed opaque envelopes |
| Blinding of participants and personnel (performance bias) | High risk | Participants were not blinded, as the control group received no intervention |
| Blinding of outcome assessment (detection bias) | Unclear risk | Not described |
| Incomplete outcome data (attrition bias) | High risk | 5 participants did not complete the study and the trial did not use proper methodology to account for the missing data. |
| Selective reporting (reporting bias) | Unclear risk | No protocol could be obtained and the trial did not report all‐cause mortality or serious adverse events. |
| For‐profit bias | Low risk | The trial was financed by Fundación para la Investigación Biomédica, Hospital Ramón y Cajal Madrid, Spain. |
| Other bias | Low risk | The trial appeared to be free of other components that could put it at risk of bias. |
| Methods | Randomised clinical trial, Spain | |
| Participants | 60 hospitalised adults with hip fractures, at nutritional risk due to hip surgery Male:Female = 16:44 Mean age = 83.5 years Exclusion criteria: "Patients with moderate–severe malnutrition (those with a weight loss of more than 5% in the previous month or more than 10% in the previous 6 months from their usual weight, and/or serum albumin concentrations below 2.7 g/dL) were automatically excluded from the study. All of these patients receive supplementation according to our Institution protocol, following current guidelines. Other exclusion criteria were acute and/or chronic renal failure, hepatic insufficiency or cirrhosis (Child B or C), severe heart failure with class III or IV of the New York Heart Association (NYHA), respiratory failure, and any gastrointestinal condition that may preclude from adequate oral nutritional intake. None of the patients had been on ONS from the previous 6 months, or had received any nutritional support by any other means. | |
| Interventions | Experimental group: Oral nutrition energy and protein support by means of commercial enteral nutrition for oral intake (Fortimel, 200 mL bricks, each provides 20 g protein and 200 kcal, Nutricia Advanced Medical Nutrition ‐ Danone Group) to aim at 40 g of protein and 400 kcal a day (2 bricks a day). The treatment was started at admission, before surgery and maintained until the day of hospital discharge. (n = 30) Control group: No intervention (n = 30) Co‐interventions: Every adult was prescribed a standard or texture‐adapted diet to meet their calculated metabolic rate. | |
| Outcomes | Mortality, serum proteins, BMI, postoperative complications, weight, postoperative hospital stay, time of immobilisation after surgery | |
| Study dates | May 2007 to September 2008 | |
| Notes | We contacted the authors on 6th June 2015 by email: [email protected] about data on BMI, weight and complications, which could not be extracted from the full text. | |
| Risk of bias | ||
| Bias | Authors' judgement | Support for judgement |
| Random sequence generation (selection bias) | Unclear risk | Not described |
| Allocation concealment (selection bias) | Low risk | The randomisation was concealed by means of sealed opaque envelopes. |
| Blinding of participants and personnel (performance bias) | High risk | Participants were not blinded. |
| Blinding of outcome assessment (detection bias) | Unclear risk | The procedure of blinding was insufficiently described. |
| Incomplete outcome data (attrition bias) | High risk | Intention‐to‐treat analysis was performed with the last observation carried forward to evaluate data of all participants at hospital discharge. There were incomplete data for 32 participants. |
| Selective reporting (reporting bias) | Low risk | The protocol could not be obtained, but the study reported on mortality and complications. |
| For‐profit bias | Low risk | One of the Researchers, B.I. was supported by the Fundación para la Investigación Biomédica Hospital Ramón y Cajal (FIBio‐RyC), Madrid, Spain. |
| Other bias | Low risk | The trial appeared to be free of other components that could put it at risk of bias. |
| Methods | Randomised clinical trial, the Netherlands | |
| Participants | 152 hospitalised adults admitted for hip fracture surgery and aged > 55 years, at nutritional risk due to being frail elderly Male:Female = 44:108 Mean age = 78.5 years | |
| Interventions | Experimental group: frequent dietetic counselling and multinutrient ONSs until 3 months after hip fracture surgery (n = 73) Control group: standard dietetic counselling and diet (n = 79) | |
| Outcomes | Cost, cost effectiveness, mortality, weight, quality of life | |
| Study dates | ||
| Notes | The trial had both an inpatient and an outpatient phase. We contacted the authors on 16th December 2015 by email: [email protected]. We received no reply. | |
| Risk of bias | ||
| Bias | Authors' judgement | Support for judgement |
| Random sequence generation (selection bias) | Low risk | Computer‐generated random‐number sequence list |
| Allocation concealment (selection bias) | Unclear risk | The allocation was described as being concealed, but it was unclear how it was concealed. |
| Blinding of participants and personnel (performance bias) | Unclear risk | Not described |
| Blinding of outcome assessment (detection bias) | Unclear risk | Not described |
| Incomplete outcome data (attrition bias) | High risk | More than 5% dropouts, and the trial did not allow proper intention‐to‐treat methodology. |
| Selective reporting (reporting bias) | High risk | The trial did not report length of stay or rate of complications, which were stated in the protocol. |
| For‐profit bias | High risk | The oral nutritional supplements were provided by at nutrition company (Nutricia Advanced Medical Nutrition). |
| Other bias | Low risk | The trial appeared to be free of other components that could put it at risk of bias. |
| Methods | Randomised clinical trial, USA | |
| Participants | 117 hospitalised adults undergoing major pancreatic resections, at nutritional risk due to major surgery. Male:Female = 61:55 (gender not reported for one participants) Mean age = 64 years | |
| Interventions | Experimental group: Total parenteral nutrition (30 ‐ 35 kcal/kg/day and 1 g protein/kg/day) (n = 60) Co‐interventions: Both groups were given nutrition until oral intake exceeded 1000 kcal/day | |
| Outcomes | Mortality, complications, major complications, morbidity, survival data | |
| Study dates | February 1988 to November 1993 | |
| Notes | We contacted the author on 19th August 2015 by email: [email protected] . The author initially replied but did not reply on follow‐up emails. | |
| Risk of bias | ||
| Bias | Authors' judgement | Support for judgement |
| Random sequence generation (selection bias) | Unclear risk | Not described |
| Allocation concealment (selection bias) | Unclear risk | Not described |
| Blinding of participants and personnel (performance bias) | Unclear risk | Not described |
| Blinding of outcome assessment (detection bias) | Unclear risk | Not described |
| Incomplete outcome data (attrition bias) | Unclear risk | The number of participants with incomplete data was not reported. |
| Selective reporting (reporting bias) | Low risk | The trial reported serious adverse events and mortality. |
| For‐profit bias | Low risk | The trial was supported by a non‐profit organisation (Lawrence M. Gelb Foundation). |
| Other bias | Low risk | The trial appeared to be free of other components that could put it at risk of bias. |
| Methods | Randomised clinical trial, hospital in UK | |
| Participants | 10 hospitalised adults with fractured neck of femur, at nutritional risk due to major surgery Male:Female = 0:10 Mean age = 81 years Exclusion criteria: any form of malignant disease, mental illness, renal or hepatic failure, neurological disorder, cerebrovascular accident or diabetes | |
| Interventions | Experimental group: Enteral nutrition (Fresubin) to make up the deficit between regular intake and requirements of nutrition. Received from the 2nd day of admission until the end of the study Intervention lasted approximately 47 days. (n = 5) Control group: No intervention(n = 5) Co‐interventions: Both groups received normal hospital diet. | |
| Outcomes | Body weight, triceps skinfold thickness, midarm circumference, arm muscle circumference , time of discharge, serum concentrations of albumin, prealbumin, magnesium and zinc. Meals, snacks and fluid intake. Walking with a frame or crutches with 1 or 2 attendants, walking with or without sticks with 1 or 2 attendants, and pressure sores | |
| Study dates | Not stated | |
| Notes | We could not obtain contact information for the author. | |
| Risk of bias | ||
| Bias | Authors' judgement | Support for judgement |
| Random sequence generation (selection bias) | Unclear risk | Not described |
| Allocation concealment (selection bias) | Unclear risk | Not described |
| Blinding of participants and personnel (performance bias) | Unclear risk | Not described |
| Blinding of outcome assessment (detection bias) | Unclear risk | Not described |
| Incomplete outcome data (attrition bias) | Low risk | There were complete data for all participants. |
| Selective reporting (reporting bias) | Unclear risk | No protocol could be obtained, and the trial did not report all‐cause mortality or serious adverse events. |
| For‐profit bias | Unclear risk | It was unclear how the trial was funded. |
| Other bias | Low risk | The trial appeared to be free of other components that could put it at risk of bias. |
| Methods | Randomised clinical trial, USA | |
| Participants | 57 hospitalised adults undergoing PEG placement due to different conditions (primarily oropharyngeal dysphagia), at nutritional risk due to trialist indication Male:Female = 38:19 Mean age = 67 years Exclusion criteria: none stated | |
| Interventions | Experimental: early feeding within 3 hrs of placement(n = 17) Control: no intervention(n = 19) Co‐intervention: feeding from the next day | |
| Outcomes | Complications related to tube‐feeding (not used) | |
| Study dates | Not stated | |
| Notes | We could not obtain contact information for the author. | |
| Risk of bias | ||
| Bias | Authors' judgement | Support for judgement |
| Random sequence generation (selection bias) | Unclear risk | Not described |
| Allocation concealment (selection bias) | Unclear risk | Not described |
| Blinding of participants and personnel (performance bias) | Unclear risk | Not described |
| Blinding of outcome assessment (detection bias) | Unclear risk | Not described |
| Incomplete outcome data (attrition bias) | Unclear risk | It was unclear how many participants had incomplete outcome data. |
| Selective reporting (reporting bias) | Unclear risk | No protocol could be obtained and the trial did not report all‐cause mortality. |
| For‐profit bias | Unclear risk | It was unclear how the trial was funded. |
| Other bias | Low risk | The trial appeared to be free of other components that could put it at risk of bias. |
| Methods | Randomised clinical trial, hospital in Chile | |
| Participants | 36 hospitalised adults who within the first 3 days of admission met the following criteria: (a) history of excessive alcohol ingestion for at least 2 years; and (b) the presence of 2+ major signs of liver failure: jaundice, encephalopathy, ascites, hepatomegaly, collateral circulation and oedema, who were, at nutritional risk according to the trialist Male:female = not stated Mean age = 49.1 years Exclusion criteria: contraindication for oral or enteral feeding, current upper gastrointestinal bleeding, encephalopathy grade OV and extrahepatic major organ failure (cardiac, pulmonary or renal) | |
| Interventions | Experimental group: diet aiming at 1.5 g/kg body weight of protein and 50 kcal/kg body weight/day. The protein and energy were provided by a casein‐based nutritional product. Contained casein, maltodextrins, medium‐chain triglycerides, sunflower oil.(n = 17) | |
| Outcomes | Biochemical analysis, length of hospital stay, anthropometrics, mortality | |
| Study dates | Not stated | |
| Notes | We contacted the author on 08th February 2016 by email: [email protected]. We received no reply. | |
| Risk of bias | ||
| Bias | Authors' judgement | Support for judgement |
| Random sequence generation (selection bias) | Unclear risk | The trial was described as being randomised, but there was no description of how the sequence was generated. |
| Allocation concealment (selection bias) | Unclear risk | The trial was described as being randomised, but there were no description of how the allocation was concealed. |
| Blinding of participants and personnel (performance bias) | Unclear risk | Not described |
| Blinding of outcome assessment (detection bias) | Unclear risk | Not described |
| Incomplete outcome data (attrition bias) | Low risk | There were no dropouts. |
| Selective reporting (reporting bias) | Unclear risk | No protocol could be obtained, and the trial did not report all‐cause mortality or serious adverse events. |
| For‐profit bias | Low risk | The trial was funded by a non‐profit organisation: "University of Chile grant no. PRI 823080009". |
| Other bias | Low risk | The trial appeared to be free of other components that could put it at risk of bias. |
| Methods | Randomised clinical trial, Turkey | |
| Participants | 28 hospitalised adults with colorectal cancer, at nutritional risk due to oncologic history and upcoming surgery Male:Female = 11:16 (gender not reported for one participants) Mean age = 62.79 years Exclusion criteria: Clinical findings of vitamin and element deficiency, diabetes mellitus, a history of renal and hepatic deficiency as well as active infection, and immunosuppressive drug use | |
| Interventions | Experimental group: 3 groups (only 2 could potentially have been used): Enteral: SE product without RNA or omega‐3 fatty acid (Fresubin) TPN: With subclavian catheter infusion Freamin 8.5% Lipovenöz% 10 ‐ 20 Dekstroz 10%, 20%, 30%. Soluvit N.Vitalipid N adult. Tracutil. (n = 21) | |
| Outcomes | CD4 cell infiltrate, CD8 cell infiltrate, CD16 cell infiltrate, CD56 cell infiltrate | |
| Study dates | Not stated | |
| Notes | We contacted the authors on 9th December 2015 by email: [email protected]. We received no reply. | |
| Risk of bias | ||
| Bias | Authors' judgement | Support for judgement |
| Random sequence generation (selection bias) | Unclear risk | Not described |
| Allocation concealment (selection bias) | Unclear risk | Not described |
| Blinding of participants and personnel (performance bias) | High risk | Participants and personnel were not blinded. |
| Blinding of outcome assessment (detection bias) | Low risk | Pathologist was blinded. |
| Incomplete outcome data (attrition bias) | Unclear risk | The number of participants with incomplete data was not reported. |
| Selective reporting (reporting bias) | Unclear risk | No protocol could be obtained and the trial did not report all‐cause mortality or serious adverse events. |
| For‐profit bias | Unclear risk | It was unclear how the trial was funded. |
| Other bias | Low risk | The trial appeared to be free of other components that could put it at risk of bias. |
| Methods | Randomised clinical trial, Australia | |
| Participants | 60 hospitalised adults with chronic kidney disease, at nutritional risk defined by trialists Male:Female = 34:19 (after early exclusions) Mean age = 69.9 years Exclusion criteria: < 18 years, glomerular filtration rate (GFR) > 30 ml/min , previously seen by a dietitian for Stage IV CKD, communication or intellectual impairment inhibiting their ability to undertake the intervention and malnutrition from a cause other than CKD | |
| Interventions | Experimental group: A dietitian, experienced in renal nutrition, gave treatment over a 12‐week period and aimed to optimise nutritional status and attain evidence‐based dietary prescription. (n = 60) Control group: Standard care(n = 31) | |
| Outcomes | QOL: Kidney Disease Quality of Life Short Form version 1.3, combining the Short Form‐36 (SF‐36), with a kidney disease‐specific module | |
| Study dates | Not stated | |
| Notes | We contacted the authors on 5th October 2015 by email: [email protected]. We received no reply. | |
| Risk of bias | ||
| Bias | Authors' judgement | Support for judgement |
| Random sequence generation (selection bias) | Low risk | Computer‐generated sequence |
| Allocation concealment (selection bias) | Low risk | Concealed from recruiting officer |
| Blinding of participants and personnel (performance bias) | High risk | Not blinded |
| Blinding of outcome assessment (detection bias) | Unclear risk | Not described |
| Incomplete outcome data (attrition bias) | Unclear risk | 13 dropouts (> 5%). No use of intention‐to‐treat |
| Selective reporting (reporting bias) | Unclear risk | No protocol could be obtained and the trial did not report all‐cause mortality or serious adverse events. |
| For‐profit bias | Low risk | Royal Brisbane and Women’s Hospital Foundation seeding grant, Queensland University of Technology Postgraduate Research Award (PhD scholarship) and an Institute of Health and Biomedical Innovation Research Scholarship. |
| Other bias | Low risk | The trial appeared to be free of other components that could put it at risk of bias. |
| Methods | Randomised clinical trial, Spain | |
| Participants | 27 hospitalised adults with gastric adenocardinoma undergoing total gastrectomy, at nutritional risk due to major abdominal surgery Male:Female = 21:6 Mean age = 64 years | |
| Interventions | Experimental group: Received TPN (n = 15) Control group: Received traditional serum therapy (3 participants actually received peripheral parenteral nutrition)(n = 12) | |
| Outcomes | Mortality, complications, length of hospital stay | |
| Study dates | 1983 to 1986 | |
| Notes | We contacted the authors on 13th December 2015 by email: [email protected]. We received no reply. | |
| Risk of bias | ||
| Bias | Authors' judgement | Support for judgement |
| Random sequence generation (selection bias) | Unclear risk | Not described |
| Allocation concealment (selection bias) | Unclear risk | Not described |
| Blinding of participants and personnel (performance bias) | Unclear risk | Not described |
| Blinding of outcome assessment (detection bias) | Unclear risk | Not described |
| Incomplete outcome data (attrition bias) | Unclear risk | The number of participants with incomplete data was not reported. |
| Selective reporting (reporting bias) | Low risk | Mortality and complications were reported. |
| For‐profit bias | Unclear risk | It was unclear how the trial was funded. |
| Other bias | Low risk | The trial appeared to be free of other components that could put it at risk of bias. |
| Methods | Randomised clinical trial, UK. | |
| Participants | 30 hospitalised adults undergoing intestinal resection, at nutritional risk due to major surgery Male:Female = 19:11 Mean age = 55.1 years Exclusion criteria: emergencies and allergy or intolerance to the constituents of the feed | |
| Interventions | Experimental group: early enteral feeding (energy and water requirements were calculated from the weight of the participant and a mixture of Fresubin and water provided the full basic fluid requirements).(n = 15) Control group: standard care (n = 15) | |
| Outcomes | Daily intake, anthropometrics, complications, length of stay, days to intake, hand‐grip strength, weight | |
| Study dates | Not stated | |
| Notes | We could obtain no contact information for the author. | |
| Risk of bias | ||
| Bias | Authors' judgement | Support for judgement |
| Random sequence generation (selection bias) | Unclear risk | Not described |
| Allocation concealment (selection bias) | Unclear risk | Not described |
| Blinding of participants and personnel (performance bias) | Unclear risk | Not described |
| Blinding of outcome assessment (detection bias) | Unclear risk | Not described |
| Incomplete outcome data (attrition bias) | Unclear risk | More than 5% dropped out, and the trial did not use proper methodology to deal with missing data. |
| Selective reporting (reporting bias) | Low risk | No protocol could be obtained, but the trial reported on mortality and complications. |
| For‐profit bias | Low risk | The trial was funded by the Departments of surgery and intensive care. |
| Other bias | Low risk | The trial appeared to be free of other components that could put it at risk of bias. |
| Methods | Randomised clinical trial, UK | |
| Participants | 46 hospitalised adults with a BMI < 20, at nutritional risk due to having a BMI < 20.5 kg/m2. Male:Female = 10:36 Mean age = 75 Exclusion criteria: Residents classified as emaciated, had known physical pathology or were in short‐term or assessment wards | |
| Interventions | Experimental group: Oral supplements in the form of 200 ml oral supplement Fortisip (Cow & Gate Ltd, Trowbridge, UK) twice daily. This provided 2.5 MJ (600 kcal) energy a day from protein, carbohydrate and fat in addition to a range of vitamins and minerals. (n = 23) Control group: Placebo, in the form of a 200 ml oral vitamin preparation twice daily providing the same vitamins as Fortisip but virtually no macronutrients and thus minimal additional energy(n = 23) | |
| Outcomes | Weight, BMI, triceps skinfold thickness and midupper‐arm circumference | |
| Study dates | Not stated | |
| Notes | We contacted the authors on 9th November 2015 by email: [email protected]. We received no reply. | |
| Risk of bias | ||
| Bias | Authors' judgement | Support for judgement |
| Random sequence generation (selection bias) | Unclear risk | Not described |
| Allocation concealment (selection bias) | Unclear risk | Not described |
| Blinding of participants and personnel (performance bias) | Low risk | Control group received placebo |
| Blinding of outcome assessment (detection bias) | Low risk | All measurements were made by the authors, who did not know whether residents were in the treatment or control group. |
| Incomplete outcome data (attrition bias) | High risk | 6 participants in each group (12 (26 %) in total) were withdrawn and excluded from the analyses, but reasons for withdrawal were clearly stated. |
| Selective reporting (reporting bias) | Unclear risk | No protocol could be obtained and the trial did not report all‐cause mortality or serious adverse events. |
| For‐profit bias | High risk | The trial was supported by Cow & Gate. |
| Other bias | Low risk | The trial appeared to be free of other components that could put it at risk of bias. |
| Methods | Randomised clinical trial in Belgium | |
| Participants | 4640 hospitalised adults in ICU, at nutritional risk due to having NRS score of 3 or more Male:Female = 2972:1668 Mean age = 64 years Exclusion criteria: "chronic malnourishment (defined as a BMI of < 17) before admission to an ICU and referral from another ICU with an established regimen of enteral or parenteral nutrition" | |
| Interventions | Experimental group: "Participants received i.v. 20% glucose solution; the target for total energy intake was 400 kcal a day on ICU day 1 and 800 kcal a day on day 2. On day 3, parenteral nutrition (OliClinomel or Clinimix, Baxter) was initiated, with the dose targeted to 100% of the caloric goal through combined enteral and parenteral nutrition. (n = 2312) Control: Participants received 5% glucose solution in a volume equal to that of the parenteral nutrition administered in the early‐initiation group in order to provide adequate hydration, with the delivered volume of enteral nutrition taken into account. If enteral nutrition was insufficient after 7 days in the ICU, parenteral nutrition was initiated on day 8 to reach the caloric goal."(n = 2328) Co‐interventions: "All participants who were unable to eat by day 2 received enteral nutrition (mainly Osmolite, Abbott), while being maintained in a semirecumbent position unless medically contraindicated. Standing orders for enteral nutrition for all participants specified a twice‐daily increase in the infusion rate for enteral nutrition and the use of prokinetic agents and duodenal feeding tubes." | |
| Outcomes | Vital status (mortality 90 days after randomisation independent of ICU and hospital discharge status, hospital mortality, ICU mortality and proportion of participants discharged alive from ICU within 8 days), hypoglycaemia, serious adverse events and complications related to the mode of nutrition. The primary efficacy endpoint for this RCT was the time to discharge alive from ICU, time to discharge alive from the hospital, time to final (alive) weaning from mechanical respiratory support, kidney failure, need for pharmacological or mechanical haemodynamic support during ICU stay, need for a tracheostomy during ICU stay, cholestasis and liver dysfunction, occurrence of infections during ICU stay, inflammation, distribution of 6‐MWD, proportion of participants independent for all ADL functions in both groups was compared at hospital discharge. | |
| Study dates | August 2007 to November | |
| Notes | We contacted the authors on 17th November 2015 by mail: [email protected] regarding allocation sequence generation. We received a reply with the information. | |
| Risk of bias | ||
| Bias | Authors' judgement | Support for judgement |
| Random sequence generation (selection bias) | Low risk | Computer‐based randomisation |
| Allocation concealment (selection bias) | Low risk | "Sequentially numbered, sealed and opaque envelopes". |
| Blinding of participants and personnel (performance bias) | High risk | None were blinded. |
| Blinding of outcome assessment (detection bias) | Low risk | All outcome assessors, which were investigators not directly involved (such as statisticians, laboratory personnel, infectious disease specialists, pathologists, physiotherapists involved in the strength measurement, electrophysiologists) as well as physicians and nurses in the conventional wards, were blinded to treatment allocation. |
| Incomplete outcome data (attrition bias) | High risk | There were incomplete data for 6‐MWD and the trial did not use proper methods to deal with the missing data. |
| Selective reporting (reporting bias) | Low risk | The trial reported on all outcomes stated in the protocol. |
| For‐profit bias | Low risk | Funded by the Methusalem programme of the Flemish government and others. |
| Other bias | Low risk | The trial appeared to be free of other components that could put it at risk of bias. |
| Methods | Randomised clinical trial, Ireland | |
| Participants | 41 hospitalised adults who were malnourished, at nutritional risk according to the trialist Male:Female = not stated Mean age = not stated Exclusion criteria: none stated | |
| Interventions | Experimental group 1: 200 ml or 4 x 50 ml ONSs (2 kcal/ml) for 28 days(n = 27) Control group: No intervention(n = 14) | |
| Outcomes | Nutritional assessment, biochemical measurements, presence of pressure ulcers, product tolerance and compliance | |
| Study dates | Not stated | |
| Notes | Abstract only. We contacted the author on 9th November 2015 via Facebook. We received no reply. | |
| Risk of bias | ||
| Bias | Authors' judgement | Support for judgement |
| Random sequence generation (selection bias) | Unclear risk | Not described |
| Allocation concealment (selection bias) | Unclear risk | Not described |
| Blinding of participants and personnel (performance bias) | Unclear risk | Not described |
| Blinding of outcome assessment (detection bias) | Unclear risk | Not described |
| Incomplete outcome data (attrition bias) | Unclear risk | The number of participants with incomplete data was not reported. |
| Selective reporting (reporting bias) | Unclear risk | No protocol could be obtained, and the trial did not report all‐cause mortality or serious adverse events. |
| For‐profit bias | Unclear risk | It was unclear how the trial was funded. |
| Other bias | Low risk | The trial appeared to be free of other components that could put it at risk of bias. |
| Methods | Randomised clinical trial, China | |
| Participants | 24 hospitalised adults undergoing abdominal elective surgery, at nutritional risk due to major surgery Male:Female = 15:9 Mean age = 53.5 years Exclusion criteria: Unclear | |
| Interventions | Experimental group A: Recieved the compound nutrition elements of Qingdao biochemical pharmaceutical factory ( 400 kcal, N 2.56 g per 100 g) from the 1st day after the operation. It was infused as a 10% nutrient solution continuously with the speed of 50 ml/hr, reaching the maximum volume (25% of the daily nutrient solution 3000 ml) gradually within a few days according to tolerance. Oral intake was maintained during this time. The amount of perfusion was gradually decreased and the tube removed, when nutrition sufficed from oral intake. (n = 8) Experimental group B: enteral nutrition support after postoperative flatus, in the same way as experimental group A. (n = 8) Control group: Conventional i.v. infusion after surgery. Some received albumin or blood transfusion once or twice. (n = 8) | |
| Outcomes | Complication, weight, daily calorie, nitrogen and liquid intake, albumin and transferrin, urea nitrogen concentration | |
| Study dates | Not stated | |
| Notes | We tried but failed to contact the author by phone. | |
| Risk of bias | ||
| Bias | Authors' judgement | Support for judgement |
| Random sequence generation (selection bias) | Unclear risk | The trial was described as being randomised, but it was unclear how the sequence was generated. |
| Allocation concealment (selection bias) | Unclear risk | The trial was described as being randomised, but it was unclear how the allocation was concealed. |
| Blinding of participants and personnel (performance bias) | High risk | Participants and personnel were not blinded. |
| Blinding of outcome assessment (detection bias) | Unclear risk | The procedure of blinding was insufficiently described. |
| Incomplete outcome data (attrition bias) | Unclear risk | The numbers and reasons for withdrawals and dropouts were not clearly stated. |
| Selective reporting (reporting bias) | Unclear risk | No protocol could be obtained and the trial did not report on all‐cause mortality. |
| For‐profit bias | Unclear risk | It was unclear how the trial was funded. |
| Other bias | Low risk | The trial appeared to be free of other components that could put it at risk of bias. |
| Methods | Randomised clinical trial, China | |
| Participants | 24 hospitalised adults undergoing abdominal elective surgery, at nutritional risk due to major surgery Male:Female = 15:9 Mean age = 53.5 years Exclusion criteria: Unclear | |
| Interventions | Experimental group A: Received the compound nutrition elements of Qingdao biochemical pharmaceutical factory (400 kcal, N 2.56g per 100 g) from the 1st day after the operation. It was infused as a 10% nutrient solution continuously with the speed of 50 ml/hr, reaching the maximum volume (25% of the daily nutrient solution 3000 ml) gradually within a few days according to tolerance. Oral intake was maintained during this time. The amount of perfusion was gradually decreased and the tube removed, when nutrition sufficed from oral intake.(n = 8) Experimental group B: enteral nutrition support after postoperative flatus, in the same way as experimental group A(n = 8) Control group: Conventional intravenous infusion after surgery. Some received albumin or blood transfusion once or twice.(n = 8) | |
| Outcomes | Complication, weight, daily calorie, nitrogen and liquid intake, albumin and transferrin, urea nitrogen concentration | |
| Study dates | Not stated | |
| Notes | We tried but failed to contact the author by phone. | |
| Risk of bias | ||
| Bias | Authors' judgement | Support for judgement |
| Random sequence generation (selection bias) | Unclear risk | The trial was described as being randomised, but it was unclear how the sequence was generated. |
| Allocation concealment (selection bias) | Unclear risk | The trial was described as being randomised, but it was unclear how the allocation was concealed. |
| Blinding of participants and personnel (performance bias) | High risk | Participants and personnel were not blinded. |
| Blinding of outcome assessment (detection bias) | Unclear risk | The procedure of blinding was insufficiently described. |
| Incomplete outcome data (attrition bias) | Unclear risk | The numbers and reasons for withdrawals and dropouts were not clearly stated. |
| Selective reporting (reporting bias) | Unclear risk | No protocol could be obtained and the trial did not report on all‐cause mortality. |
| For‐profit bias | Unclear risk | It was unclear how the trial was funded. |
| Other bias | Low risk | The trial appears to be free of other components that could put it at risk of bias. |
| Methods | Randomised clinical trial, China | |
| Participants | 30 hospitalised adults undergoing moderate or more elective abdominal surgery, at nutritional risk due to abdominal surgery Male:Female = 17:13. Exclusion criteria: Metabolic and infectious diseases, having taken steroids and/or immunosuppressive agents recently | |
| Interventions | Experimental group A: Enteral nutrition, Nutrison (product of Holland Nutricia company) were infused through a nutrition tube in upper jejunum at the first postoperative day, 1/3 of the total amount on the 1st day, 2/3 on the 2nd day, and full amount (125.4 KJ‐1·kg‐1·d‐1) on the 3rd day (n = 10) Experimental group B: Parenteral nutrition (n = 10) (Huarui company products) through peripheral or central vein from the 1st postoperative day, with the same usage of enteral nutrition group Control group: Conventional infusion for 8 days, the average calorie intake was about 2514 KJ·d‐1(n = 10) | |
| Outcomes | Complications, plasma protein (total protein, albumin and transferrin), CD3, CD4, CD8, D4/CD8 | |
| Study dates | Not stated | |
| Notes | We tried but failed to contact the author by phone. | |
| Risk of bias | ||
| Bias | Authors' judgement | Support for judgement |
| Random sequence generation (selection bias) | Unclear risk | The trial was described as being randomised, but it was unclear how the sequence was generated. |
| Allocation concealment (selection bias) | Unclear risk | The trial was described as being randomised, but it was unclear how the allocation was concealed. |
| Blinding of participants and personnel (performance bias) | High risk | Participants and personnel were not blinded. |
| Blinding of outcome assessment (detection bias) | Unclear risk | The procedure of blinding was insufficiently described. |
| Incomplete outcome data (attrition bias) | Unclear risk | The numbers and reasons for withdrawals and dropouts were not clearly stated. |
| Selective reporting (reporting bias) | Unclear risk | No protocol could be obtained and the trial did not report on all‐cause mortality. |
| For‐profit bias | Unclear risk | It was unclear how the trial was funded |
| Other bias | Low risk | The trial appeared to be free of other components that could put it at risk of bias. |
| Methods | Randomised clinical trial, China | |
| Participants | 30 hospitalised adults undergoing moderate or more elective abdominal surgery, at nutritional risk due to abdominal surgery Male:Female = 17:13 Exclusion criteria: Metabolic and infectious diseases, having taken steroids or immunosuppressive agents or both recently | |
| Interventions | Experimental group A: Enteral nutrition, Nutrison (product of Holland Nutricia company) were infused through a nutrition tube in upper jejunum on the 1st postoperative day, 1/3 of the total amount on the 1st day, 2/3 on the 2nd day, and full amount (125.4 KJ‐1·kg‐1·d‐1) on the 3rd day(n = 10) Experimental group B: Parenteral nutrition (Huarui company products) through peripheral or central vein from the 1st postoperative day, with the same usage of enteral nutrition group(n = 10) Control group: Conventional infusion for 8 days, the average calorie intake was about 2514 KJ·d‐1(n = 10) | |
| Outcomes | Complications, plasma protein (total protein, albumin and transferrin), CD3, CD4, CD8, D4/CD8. | |
| Study dates | Not stated | |
| Notes | Same trial as Chen 2000a. We tried but failed to contact the author by phone (0543‐3258597). | |
| Risk of bias | ||
| Bias | Authors' judgement | Support for judgement |
| Random sequence generation (selection bias) | Unclear risk | The trial was described as being randomised, but it was unclear how the sequence was generated. |
| Allocation concealment (selection bias) | Unclear risk | The trial was described as being randomised, but it was unclear how the allocation was concealed. |
| Blinding of participants and personnel (performance bias) | High risk | Participants and personnel were not blinded. |
| Blinding of outcome assessment (detection bias) | Unclear risk | The procedure of blinding was insufficiently described. |
| Incomplete outcome data (attrition bias) | Unclear risk | The numbers and reasons for withdrawals and dropouts were not clearly stated. |
| Selective reporting (reporting bias) | Unclear risk | No protocol could be obtained and the trial did not report on all‐cause mortality. |
| For‐profit bias | Unclear risk | It was unclear how the trial was funded. |
| Other bias | Low risk | The trial appeared to be free of other components that could put it at risk of bias. |
| Methods | Randomised clinical trial, China | |
| Participants | 41 hospitalised adults who were burned and admitted within 18 hours, at nutritional risk due to being in the ICU Male:Female = 24:17 Mean age = 33.5 years Exclusion criteria: 1. Severe metabolic diseases, such as diabetes, hyperthyroidism, or low, severe liver disease; 2. Unsuitable due to shock; 3. Acute renal failure and stress ulcer that occurred during the treatment; 4. Other severe traumas such as visceral rupture and traumatic brain injury; 5. Severe heart and lung deficiency | |
| Interventions | Experimental group: Via a nasogastric feeding tube, the participants were given protein enriched enteral nutrition mixed supplements (best, Nutricia, containing per 1000 ml; 40 g of protein, 389 g of fat, and 123 g of glucose), according to gastro‐intestinal tolerance and energy demand, at a rate, from 30 ˜ 50 ml/hr. It was gradually increased to 120 ˜ 150 ml/hr, so that on day 8 ‐ 9 the total amount given was 2500 ˜ 3000 ml as a restricted diet. It was unknown for how long the treatment was continued. (n = 21) Control group: Via a central venous catheter, the participants were given the required parenteral nutrition every day (1000 ml, containing 29 g of protein, 25 g of fat, and 62.5 g of glucose, thermal energy 2.78 MJ). They were encouraged to eat regularly as well. It was unknown for how long the treatment was continued. (n = 20) | |
| Outcomes | Biomarkers, health economics, adverse events | |
| Study dates | Not stated | |
| Notes | We tried but failed to contact the author by phone. | |
| Risk of bias | ||
| Bias | Authors' judgement | Support for judgement |
| Random sequence generation (selection bias) | Unclear risk | The trial was described as being randomised, but it was unclear how the sequence was generated. |
| Allocation concealment (selection bias) | Unclear risk | The trial was described as being randomised, but it was unclear how the allocation was concealed. |
| Blinding of participants and personnel (performance bias) | High risk | Participants and personnel were not blinded. |
| Blinding of outcome assessment (detection bias) | Unclear risk | The procedure of blinding was insufficiently described. |
| Incomplete outcome data (attrition bias) | Unclear risk | The numbers and reasons for withdrawals and dropouts were not clearly stated. |
| Selective reporting (reporting bias) | Unclear risk | No protocol could be obtained and the trial did not report on all‐cause mortality. |
| For‐profit bias | Unclear risk | It was unclear how the trial was funded. |
| Other bias | Low risk | The trial appeared to be free of other components that could put it at risk of bias. |
| Methods | Randomised clinical trial, USA | |
| Participants | 41 hospitalised adults undergoing PEG placement due to not being able to be orally fed, at nutritional risk due to trialist indication Male:Female = 41:0 Mean age = 72.3 years Exclusion: Inability to obtain an informed consent, not expected to survive the duration of the study, any contraindications for endoscopy, inability to successfully transilluminate the abdominal wall, ascites, massive organomegaly, coagulopathy, and systemic infection | |
| Interventions | Experimental: Feeding through tube started 3 hrs after PEG placement(n = 10) Control: no intervention (n = 10) Co‐intervention: PEG placement and full‐strength iso‐osmolar feeding after 24 hrs | |
| Outcomes | The outcomes assessed included maximum residual volumes for each group for each day, adverse events, 30‐day mortality, number of participants alive in each group at the termination of the study, mean number of days a participant lived after PEG placement, and the number of days between PEG placement and termination of the study. | |
| Study dates | Not stated | |
| Notes | ||
| Risk of bias | ||
| Bias | Authors' judgement | Support for judgement |
| Random sequence generation (selection bias) | Unclear risk | Not described |
| Allocation concealment (selection bias) | Unclear risk | Not described |
| Blinding of participants and personnel (performance bias) | Unclear risk | Not described |
| Blinding of outcome assessment (detection bias) | Unclear risk | Not described |
| Incomplete outcome data (attrition bias) | Unclear risk | The number of participants with incomplete data was not described. |
| Selective reporting (reporting bias) | Low risk | The trial reported mortality and adverse events. |
| For‐profit bias | Unclear risk | It was unclear how the trial was funded. |
| Other bias | Low risk | The trial appeared to be free of other components that could put it at risk of bias. |
| Methods | Randomised clinical trial, Greece | |
| Participants | 59 hospitalised adults admitted to the ICU, at nutritional risk due to being at the ICU Male:Female = 47:12 Mean age = 34.7 Exclusion criteria: Age < 18 or ≥ 70 years, GCS score ≤ 9, obesity (≥ 30 BMI), pregnancy, lactation, had received corticosteroids or thyroidal hormones or both during the previous month, any of the following conditions: Heart failure, respiratory problems, metabolic syndrome, immunodeficiency, diabetes, neurological problems, internal bleeding, indication for TPN, delay of admission to ICU > 24 hrs from injury | |
| Interventions | Experimental group: early (within 24 – 48 hrs) enteral feeding (EEF) In the EEF group, enteral feeding was established through the nasogastric tube and feeding began within 24 – 48 hrs from admission to the ICU. The initial administration rate was 30 mL/hr, and the rate reached 80 – 100 mL/hr within 48 hrs by subsequently increasing by 10 mL/hr every 4 – 6 hrs. (n = 34) Control group: Standard delayed enteral feeding (DEF): DEF was initiated when gastroparesis was resolved (> 48 hrs) but no later than 5 days after admission to the ICU, and the goal for the administration rate was to reach 100% of the needs within 4 days. (n = 25) | |
| Outcomes | The administration rate for the prescribed quantity was calculated for < 24 hrs, excessive gastric residue, frequent diarrhoea, ileus, and thrombocytopenia. Complications, mortality, duration of stay in the ICU, hormonal status | |
| Study dates | August 2003 to May 2005 | |
| Notes | We contacted the authors by email: [email protected] on 5th October 2015. We received no answer. | |
| Risk of bias | ||
| Bias | Authors' judgement | Support for judgement |
| Random sequence generation (selection bias) | Unclear risk | Not described |
| Allocation concealment (selection bias) | Unclear risk | Not described |
| Blinding of participants and personnel (performance bias) | High risk | "open‐labelled trial" |
| Blinding of outcome assessment (detection bias) | High risk | "open‐labelled trial" |
| Incomplete outcome data (attrition bias) | Low risk | There were complete data for all participants. |
| Selective reporting (reporting bias) | Low risk | Mortality and serious adverse events are reported. |
| For‐profit bias | Unclear risk | It was unclear how the trial was funded. |
| Other bias | Low risk | The trial appeared to be free of other components that could put it at risk of bias. |
| Methods | Randomised clinical trial, Thailand | |
| Participants | 38 hospitalised adults with severe traumatic injury, at nutritional risk due to being at the ICU Male:Female = 31:7 Mean age= 26 ‐ 33 years | |
| Interventions | Experimental group: Received either enteral feeding through a NG tube (30 ml/hr of .075 kcal/ml) or parenteral nutrition consisting of hypertonic glucose, amino acids and lipids(n = 21) | |
| Outcomes | Complications, serum albumin, mortality, ICU stay | |
| Study dates | June 1992 to January 1994 | |
| Notes | We contacted the authors on 3rd December 2015 by email: [email protected]. We received no reply. | |
| Risk of bias | ||
| Bias | Authors' judgement | Support for judgement |
| Random sequence generation (selection bias) | Unclear risk | Not described |
| Allocation concealment (selection bias) | Unclear risk | Not described |
| Blinding of participants and personnel (performance bias) | Unclear risk | Not described |
| Blinding of outcome assessment (detection bias) | Unclear risk | Not described |
| Incomplete outcome data (attrition bias) | Unclear risk | The number of participants with incomplete data was not reported. |
| Selective reporting (reporting bias) | Unclear risk | There was no protocol and the trial did not fully report complications. |
| For‐profit bias | High risk | The trial was supported by Bristol‐Meyer‐Squibb and Osothsapha. |
| Other bias | Low risk | The trial appeared to be free of other components that could put it at risk of bias. |
| Methods | Randomised clinical trial, Italy | |
| Participants | 50 hospitalised adults with neoplasms scheduled to receive at least 2 identical courses of chemotherapy, at nutritional risk according to the trialist Male:Female = 26:17 (gender not reported for two participants) Mean age = 59 years Exclusion criteria: weight loss of 6 ‐ 10% of their usual body weight (the study only included normally nourished or undernourished participants) and if one of the following conditions were present: Diabetes mellitus; heart, pulmonary, liver, and kidney failure; sepsis; and bone marrow involvement | |
| Interventions | Experimental group: TPN (Nonprotein caloric content was divided between dextrose (60%) and lipids (40%) (Intralipid, Kabi Pharmacia, Stockholm, Sweden). Crystalline amino acids (Freamine III, Kendall McGaw Laboratories, Irvine, CA) were provided at a calorie:nitrogen ratio of 160 kcal:l g of nitrogen (1.4 ± 0.2 g of amino acids per kilogram a day). Mineral salts (sodium, potassium, chlorine, magnesium, phosphorus, and calcium), as clinically indicated, and trace elements (5 mL of trace element mix, Don Baxter Laboratories, Trieste, Italy) were added to the nutrient mixture, which was prepared in ethylvinylacetate bags.(n = 24) Control group: No intervention (n = 26) Co‐interventions: Chemotherapy | |
| Outcomes | Chemotherapy‐related myelotoxicity (leukopenia, anaemia and thrombocytopenia), gastro‐intestinal toxicity(diarrhoea, nausea/vomiting) Fast‐turnover visceral protein and nitrogen balance | |
| Study dates | Not stated | |
| Notes | This is a cross‐over study, the 2 groups switch intervention after the 1st round of chemo. | |
| Risk of bias | ||
| Bias | Authors' judgement | Support for judgement |
| Random sequence generation (selection bias) | Unclear risk | Block randomisation ‐ blocks of 4. Not otherwise described. |
| Allocation concealment (selection bias) | Unclear risk | Not described. |
| Blinding of participants and personnel (performance bias) | Unclear risk | Not described. |
| Blinding of outcome assessment (detection bias) | Unclear risk | Not described. |
| Incomplete outcome data (attrition bias) | High risk | 7 patients dropped out ‐ 4 because of disease progression, 2 because of refusal of venous catheterization, and one patient died. |
| Selective reporting (reporting bias) | Unclear risk | No protocol could be obtained and the trial did not report all‐cause mortality and serious adverse events. |
| For‐profit bias | Low risk | "This study was supported by Grant 1580 from the Fondo Sanitario Nazionale. Regione Friuli‐Venezia Giulia, Italy." No industry involvement. |
| Other bias | Low risk | The trial appeared to be free of other components that could put it at risk of bias. |
| Methods | Randomised clinical trial, USA (Prior to randomisation, participants were stratified by extent of disease, weight loss over or under 2% during the 3 months prior to diagnosis, and performance score) | |
| Participants | 119 hospitalised adults that had histologically‐ or cytologically‐documented small cell lung cancer, with no previous therapy, measurable or evaluable disease, a life expectancy of more than 8 weeks, and a performance score of 3 or better on the ECOG scale, at nutritional risk, due to trialist indication Male:Female = 89:30 Mean age = 60 years Exclusion criteria: Leukocyte count less than 3000/mm3, platelet count < 100.000/mm3, bilirubin level more than 2 mg/dl, creatinine more than 2 mg/dl or blood urea nitrogen (BUN) level greater than 30 mg/dl, recent myocardial infarction, congestive heart failure or arrhythmia precluding adriamycin (doxorubicin) therapy, documented central nervous system metastases, superior vena cava obstruction, inappropriate antidiuretic hormone secretion, or significant other medical problems precluding central venous hyperalimentation | |
| Interventions | Experimental group: Central IVH for 28 days if no complications occurred. IVH was provided using an amino acid mixture (Travasol, Travenol Company, Deerfield, IL), glucose, and 10% lipid emulsion. Nonprotein calories were evenly divided between glucose and lipid. Electrolytes, multi‐vitamins, and trace elements were added daily; folate and vitamin K were given weekly. Vitamin B12 was given monthly. Participants nutritionally normal at entry to the study were started at 32 cal/kg/day and 1 g protein/kg/day. After 1 week, they were increased to 40 cal/kg and 1.25 g of protein/kg a day and maintained at this level for 3 weeks. Participants nutritionally depleted at entry into the study were started at 48 cal/kg and 1.5 g of protein/kg/day and increased to 56 cal/kg and 1.75 g/kg of protein a day. The IVH was started 1 week prior to the 1st dose of chemotherapy. Participants at the University of Toronto were maintained without oral intake while receiving IVH; at all other institutions participants were allowed to eat ad libitum during IVH. (n = 57) Control group: No intervention (n = 62) | |
| Outcomes | A nutritional assessment consisting of weight, serum albumin, total iron binding capacity, midarm muscle circumference, triceps skinfold thickness, and creatinine height index was obtained at the beginning of the study (baseline) and repeated every 3 weeks. 3‐day diet records were obtained before the initiation of treatment and at the end of 3 weeks after the 1st, 2nd, 4th, 8th, and 12th cycles of chemotherapy and at the end of 1 year. | |
| Study dates | Not stated | |
| Notes | We contacted the authors on 5th October 2015 by email: [email protected]; [email protected]. We received no reply. | |
| Risk of bias | ||
| Bias | Authors' judgement | Support for judgement |
| Random sequence generation (selection bias) | Unclear risk | Not described |
| Allocation concealment (selection bias) | Unclear risk | Not described |
| Blinding of participants and personnel (performance bias) | Unclear risk | Not described |
| Blinding of outcome assessment (detection bias) | Unclear risk | Not described |
| Incomplete outcome data (attrition bias) | Unclear risk | The number of participants with incomplete data was not reported. |
| Selective reporting (reporting bias) | High risk | No protocol could be obtained and the trial did not report all‐cause mortality or serious adverse events. |
| For‐profit bias | Low risk | This trial was sponsored and funded by the Diet, Nutrition and Cancer Program of the National Cancer Institute. |
| Other bias | Low risk | The trial appeared to be free of other components that could put it at risk of bias. |
| Methods | Randomised clinical trial, Portugal | |
| Participants | 37 undernourished hospitalised adults aged 60+ years, with recently‐diagnosed probable mild AD and who presented weight loss higher than 5% of body weight in the previous year, at nutritional risk due to anthropometrics Male:Female = 9:26 (gender not reported for one participants) Mean age = 78 years Exclusion criteria: having severe acute illness or being in terminal care, a diagnosis of cancer in the last 5 years, enteral or parenteral nutritional support, and receiving dietary advice or use of nutritional supplements in the preceding month | |
| Interventions | Experimental group: Oral nutrition. The participants received a 200 mL high‐protein, energy‐dense liquid, which provided 400 kcal/day (42.8 g carbohydrates, 17.4 g fat, and 18 g protein). The OS was available in 2 flavours (vanilla and apricot) and was consumed in the morning, between breakfast and lunch, or in the afternoon. The intervention lasted 21 days. (n = 20) Co‐interventions: All the participants received standard dietetic advice and they followed the treatment protocol in the Geriatric Unit that included folic acid and vitamin B12 supplementation. | |
| Outcomes | Mini Nutritional Assessment (MNA), weight, BMI, triceps skinfold, upper‐arm circumference, arm muscle circumference, cognitive function (MMSE), functional status (Barthel index), clock‐drawing test, serum nutritional biomarkers (albumin, total protein, total cholesterol, vitamin B12 and folic acid) and mortality | |
| Study dates | Not stated | |
| Notes | We contacted the authors on 1st January 2015 by email: [email protected]. We received no reply. | |
| Risk of bias | ||
| Bias | Authors' judgement | Support for judgement |
| Random sequence generation (selection bias) | Unclear risk | Not described |
| Allocation concealment (selection bias) | Unclear risk | Not described |
| Blinding of participants and personnel (performance bias) | High risk | The trial is described as non‐blinded. |
| Blinding of outcome assessment (detection bias) | High risk | The trial is described as non‐blinded. |
| Incomplete outcome data (attrition bias) | Unclear risk | There were no dropouts but it was unclear how many participants had missing data. |
| Selective reporting (reporting bias) | Unclear risk | The trial reports all‐cause mortality, but not serious adverse events. We found no protocol. |
| For‐profit bias | High risk | The nutritional supplements were offered by Novartis, Portugal. |
| Other bias | Low risk | The trial appeared to be free of other components that could put it at risk of bias. |
| Methods | Randomised clinical trial, Switzerland/France | |
| Participants | 59 hospitalised adults with a femoral neck fracture, at nutritional risk due to being frail elderly with fracture of the proximal femur Male:Female = 6:53 Mean age = 81 years Exlusion criteria: Younger than 60, fractures resulting from violent external trauma and pathological fractures due to tumours or non‐osteoporotic osteopathies, renal, hepatic, or endocrine disease, gastrectomy or malabsorption, or treatment with phenytoin, steroids, barbiturates, fluoride, or calcitonin | |
| Interventions | Experimental group: Oral supplements 250 ml of ONS provided 254 kcal, 20.4 g protein, 29 g carbohydrate, 5 ‐ 8 g lipid, 525 mg calcium, 750 IU vitamin A, 25 IU vitamin D3’ vitamins E, B, B2, B63 B12, C, nicotinamide, folate, calcium pantothenate, biotin, and minerals. Supplementation was started on admission to the orthopaedic unit and continued throughout the stay in the 2nd (recovery) hospital. The supplement was given for a mean period of 32 days at 2000 hrs. (n = 27) Control group: No intervention(n = 32) Co‐interventions: Voluntary oral intake | |
| Outcomes | Mortality, upper arm circumference, triceps skinfold thickness, complications, serum albumin levels, transferrin levels, alkaline phosphatase levels, osteocalcin levels, lenght of hospital stay | |
| Study dates | March 1985 to May 1985 | |
| Notes | We contacted the authors on 17th November 2015 by email: [email protected]. We received no reply. | |
| Risk of bias | ||
| Bias | Authors' judgement | Support for judgement |
| Random sequence generation (selection bias) | Unclear risk | Not described |
| Allocation concealment (selection bias) | Unclear risk | Not described |
| Blinding of participants and personnel (performance bias) | High risk | Not possible due to the nature of the intervention |
| Blinding of outcome assessment (detection bias) | Unclear risk | The procedure of blinding was not described |
| Incomplete outcome data (attrition bias) | Low risk | There were dropouts above 5%. |
| Selective reporting (reporting bias) | Low risk | No protocol could be obtained, but the trial reported serious adverse events and mortality. |
| For‐profit bias | Unclear risk | It was unclear how the trial was funded. |
| Other bias | Low risk | The trial appeared to be free of other components that could put it at risk of bias. |
| Methods | Randomised clinical trial (stratified for age, sex, and predicted probability of poor outcome), UK | |
| Participants | 4023 hospitalised adults with either: 1. admission to a hospital due to a stroke (1st or recurrent stroke) within 7 days of onset OR 2. suffering a stroke whilst already in hospital where the randomising clinician was uncertain about the best feeding policy and with consent or assent obtained from close relatives as well as having passed a shallow screen. The participants were at nutritional risk due having had a stroke. Male:Female: 53% male Mean age = 71 years Exclusion: (a) People with subarachnoid haemorrhage, people who experienced a transient ischaemic attack (TIA) or trivial stroke and were likely to remain in hospital for only a few days (b) people who could swallow but in whom nutritional supplementation was contraindicated (e.g. morbidly obese) (c) those in coma (i.e. unresponsive to pain) or who were very unlikely to survive more than a few days because of some severe non‐stroke illness OR (d) people who had already been entered into the same FOOD Trial | |
| Interventions | Experimental group: oral nutritional supplement (equivalent to 360 mL at 6·27 kJ/mL and 62·5 g/L in protein every day) and regular hospital diet(n = 2016) Control group: regular hospital diet(n = 2007) | |
| Outcomes | Death or poor outcome and overall survival at 6 months, health‐related QoL among survivors, time to hospital discharge, length of stay in hospital, number of days of tube‐feeding, adverse effects of feeding regimens, premature cessation of feeding regimens and reasons | |
| Study dates | Nov 1996 to August 2003 | |
| Notes | We contacted the authors on 12th November 2015 by email: [email protected]. We received data on quality of life. | |
| Risk of bias | ||
| Bias | Authors' judgement | Support for judgement |
| Random sequence generation (selection bias) | Low risk | Computer‐generated |
| Allocation concealment (selection bias) | Low risk | Locked computer |
| Blinding of participants and personnel (performance bias) | High risk | Not blinded. Participants knew their allocation. |
| Blinding of outcome assessment (detection bias) | High risk | Only a blinded assessment at 6 months follow‐up. |
| Incomplete outcome data (attrition bias) | Low risk | 7 dropouts but reasons for the dropouts were clearly stated and the trial used intention‐to‐treat. |
| Selective reporting (reporting bias) | Low risk | All clinically relevant outcomes were reported, as stated in the protocol. |
| For‐profit bias | Low risk | FOOD was funded by the NHS R&D Health Technology Assessment Programme (Reference 96/29/01), The Stroke Association (Reference 17/98) and Chest Heart and Stroke Scotland (Reference 97/4). The Singapore Medical Research Council supported the trial in Singapore. The Royal Australasian College of Physicians supported the trial in Hawkes Bay, New Zealand. |
| Other bias | Low risk | The trial appeared to be free of other components that could put it at risk of bias. |
| Methods | Randomised clinical trial, UK | |
| Participants | 859 hospitalised adults who were 1. either admitted to hospital with a stroke (1st or recurrent stroke) within 7 days of onset OR 2. suffering a stroke whilst already in hospital AND 3. randomising clinician uncertain about the best feeding policy AND 4. consent or assent from close relatives obtained and 5. did not pass shallow screen. The participants were at nutritional risk due to having had a stroke. Exclusion: Subarachnoid haemorrhage | |
| Interventions | Experimental group: early enteral tube‐feeding. (n = 429) Control group: no tube‐feeding for > 7 days (early versus avoid)(n = 430) | |
| Outcomes | Death or poor outcome and overall survival, proportion of participants who were dead at 6 months, health‐related QoL among survivors, time to hospital discharge, length of stay in hospital (which will provide a surrogate outcome for analysis of cost), number of days of tube‐feeding, adverse effects of feeding regimens, premature cessation of feeding regimens and reasons | |
| Study dates | Nov 1996 to August 2003 | |
| Notes | We contacted the authors on 12th November 2015 by email: [email protected]. We received data on quality of life. | |
| Risk of bias | ||
| Bias | Authors' judgement | Support for judgement |
| Random sequence generation (selection bias) | Low risk | Computer‐generated |
| Allocation concealment (selection bias) | Low risk | Locked computer |
| Blinding of participants and personnel (performance bias) | High risk | Not blinded. Participants knew their allocation. |
| Blinding of outcome assessment (detection bias) | High risk | Only a blinded assessment at 6 months follow‐up. |
| Incomplete outcome data (attrition bias) | Low risk | 1 lost to follow‐up |
| Selective reporting (reporting bias) | Low risk | All clinically relevant outcomes were reported, as stated in the protocol. |
| For‐profit bias | Low risk | FOOD was funded by the NHS R&D Health Technology Assessment Programme (Reference 96/29/01), The Stroke Association (Reference 17/98) and Chest Heart and Stroke Scotland (Reference 97/4). The Singapore Medical Research Council supported the trial in Singapore. The Royal Australasian College of Physicians supported the trial in Hawkes Bay, New Zealand. |
| Other bias | Low risk | The trial appeared to be free of other components that could put it at risk of bias. |
| Methods | Randomised clinical trial, China | |
| Participants | 60 hospitalised adults diagnosed with invasive gastric cancer by gastroscopy and pathology, at nutritional risk due to major surgery Male:Female =41:19 Mean age = 47.5 Exclusion criteria: Bad liquid quality, diabetes, hyperthyroidism and other metabolic diseases, poorly‐controlled heart and lung function which could not tolerate surgery, as well as other digestive system diseases such as intestinal obstruction, appendicitis, cholecystitis, vomiting, abdominal distension, diarrhoea | |
| Interventions | Experimental group: Oral supplement, Nutrison Fibre (Nutricia China,4184 kJ/L)1000 ml/day, based on baseline diet. It was started 3 days prior to the surgery, with the amount calculated based on the co‐intervention. (n = 21) Control group: Normal daily diet prior to surgery, with the amount based on the co‐intervention. (n = 21) Co‐interventions: Postoperative fasting and TPN support for 4 to 5 days, the ratio of nutrient solution to the venous nitrogen was 0.15 g/kg 1/day, nitrogen source was 18 amino acids, non‐protein calorie was 117.2 kJ/kg/day, fat emulsions were 30% ˜ 40% and glucose was 60% ˜ 70%. It was prepared as a nutrient mixture including insulin, potassium chloride, and vitamins in correct proportion. | |
| Outcomes | Albumin, immunoglobulin, body mass | |
| Study dates | Not stated | |
| Notes | We tried but failed to contact the authors by phone. | |
| Risk of bias | ||
| Bias | Authors' judgement | Support for judgement |
| Random sequence generation (selection bias) | Low risk | The sequence generation was achieved using a random‐numbers table. |
| Allocation concealment (selection bias) | Unclear risk | Not described |
| Blinding of participants and personnel (performance bias) | High risk | Participants and personnel were not blinded. |
| Blinding of outcome assessment (detection bias) | Unclear risk | The procedure of blinding was insufficiently described. |
| Incomplete outcome data (attrition bias) | Unclear risk | The numbers and reasons for withdrawals and dropouts were not clearly stated. |
| Selective reporting (reporting bias) | Unclear risk | No protocol could be obtained and the trial did not report all‐cause mortality. |
| For‐profit bias | Unclear risk | It was unclear how the trial was funded. |
| Other bias | Low risk | The trial appeared to be free of other components that could put it at risk of bias. |
| Methods | Randomised clinical trial, Italy | |
| Participants | 33 hospitalised adults with advanced gastric cancer, at nutritional risk due to major surgery Male:Female = 24:9 Mean age: 65 years Exclusion criteria: Not specified | |
| Interventions | Experimental group: parenteral or enteral hyperalimentation, or both. The total energy supply was 1.5 x BEE calculated according to the Harris‐Benedict formula: the ratio KcaYgN administered was adjusted to 130:1. (n = 7) Control group: oral alimentation as possible or peripheral fluids (n = 9) | |
| Outcomes | SH‐thymidine (3HT) | |
| Study dates | Not stated | |
| Notes | We contacted the author on 9th December 2015 by email: [email protected]. We received no reply. | |
| Risk of bias | ||
| Bias | Authors' judgement | Support for judgement |
| Random sequence generation (selection bias) | Unclear risk | Not described |
| Allocation concealment (selection bias) | Unclear risk | Not described |
| Blinding of participants and personnel (performance bias) | Unclear risk | Not described |
| Blinding of outcome assessment (detection bias) | Unclear risk | Not described |
| Incomplete outcome data (attrition bias) | Unclear risk | The number of participants with incomplete data was not reported. |
| Selective reporting (reporting bias) | High risk | No protocol could be obtained and the trial did not report all‐cause mortality or serious adverse events. |
| For‐profit bias | High risk | The trial was funded by Ajinomoto Co. Inc. |
| Other bias | Low risk | The trial appeared to be free of other components that could put it at risk of bias. |
| Methods | Randomised clinical trial, Italy | |
| Participants | 29 hospitalised adults affected by cancer undergoing total or subtotal gastrectomy, at nutritional risk due to major abdominal surgery Male:Female = 20:9 Mean age = 54 years Exclusion criteria: Not stated | |
| Interventions | Experimental group: Preoperative enteral nutrition support, which was administered as a supplement to the oral diet for at least 7 days, providing 30 kcal/kg a day (70% as dextrose and 30% as lipids) and 200 mg/kg a day of nitrogen(n = 13) Control group: Standard hospital oral diet (n = 16) | |
| Outcomes | Postoperative morbidity, mortality, septic complications | |
| Study dates | Not stated | |
| Notes | We contacted the authors on 26th June 2015 by email: [email protected]. We received no reply. | |
| Risk of bias | ||
| Bias | Authors' judgement | Support for judgement |
| Random sequence generation (selection bias) | Unclear risk | Not described |
| Allocation concealment (selection bias) | Unclear risk | Not described |
| Blinding of participants and personnel (performance bias) | High risk | Partipants and personnel were not blinded due to the nature of the intervention. |
| Blinding of outcome assessment (detection bias) | Unclear risk | Not described |
| Incomplete outcome data (attrition bias) | Low risk | There were no dropouts |
| Selective reporting (reporting bias) | Unclear risk | No protocol could be obtained and the trial did not report all‐cause mortality or serious adverse events. |
| For‐profit bias | Unclear risk | It was unclear how the trial was funded |
| Other bias | Low risk | The trial appeared to be free of other components that could put it at risk of bias.Other bias |
| Methods | Randomised clinical trial, multicenter, Italy | |
| Participants | 678 hospitalised adults undergoing elective abdominal surgery, at nutritional risk due to major elective abdominal surgery Male:Female = 392:286 Mean age = 61 years Exclusion criteria: < 18 and > 80, major concurrent illness, insulin‐dependent diabetes, refusal of informed consent, severe malnutrition | |
| Interventions | Experimental group: Received 1.16 ± 0.22 g/Kg/day amino acids for at least 5 postoperative days(n = 338) Control group: Received 150 g glucose daily for at least 5 postoperative days(n = 340) Co‐interventions: Additional fluids, electrolytes, vitamins, and trace elements were provided as clinically indicated. | |
| Outcomes | All‐cause mortality, major complications, minor complications | |
| Study dates | November 1992 to November 1994 | |
| Notes | We contacted the authors on 26th June 2015 by email: [email protected]. We received no reply. | |
| Risk of bias | ||
| Bias | Authors' judgement | Support for judgement |
| Random sequence generation (selection bias) | Low risk | Computer‐generated random numbers |
| Allocation concealment (selection bias) | Unclear risk | The trial was described as randomised, but it was unclear how the allocation was concealed. |
| Blinding of participants and personnel (performance bias) | High risk | No blinding was performed. |
| Blinding of outcome assessment (detection bias) | High risk | No blinding was performed. |
| Incomplete outcome data (attrition bias) | Unclear risk | The number of participants with incomplete data was not reported. |
| Selective reporting (reporting bias) | Low risk | Both all‐cause mortality and serious adverse events were reported. |
| For‐profit bias | Unclear risk | It was unclear how the trial was funded. |
| Other bias | Low risk | The trial appeared to be free of other components that could put it at risk of bias. |
| Methods | Randomised clinical trial, China | |
| Participants | 520 hospitalised adults undergoing oesophageal and gastric resection, at nutritional risk due to major surgery Male:Female = 340:180 Mean age = 56.5 years Exclusion criteria: None stated | |
| Interventions | Experimental group: Received enteral nutrition in the form of mixed milk post‐surgery On the first day,1000 ml mixed milk was given. If no side effect occurred, a minimum of 2500 ml a day were given from the 2nd day, up to 4 ‐ 6 times a day, at a speed of 30 ml per min. After 7 ‐ 9 days the nutrition tube was removed , if there were no serious adverse effects.(n = 256) Control group: No intervention(n = 264) Co‐interventions: Post‐surgery a daily supplement of glucose 150 ˜ 200 g was given, as well as a discontinuous transmission of plasma, blood or albumin, to maintain the water and electrolyte balance. This was continued until the oral intake was started again. | |
| Outcomes | Albumin, pre‐albumin, transferrin, weight difference, nitrogen balance | |
| Study dates | Not stated | |
| Notes | We could find no contact information for the author. | |
| Risk of bias | ||
| Bias | Authors' judgement | Support for judgement |
| Random sequence generation (selection bias) | Unclear risk | Not described |
| Allocation concealment (selection bias) | Unclear risk | Not described |
| Blinding of participants and personnel (performance bias) | High risk | Participants and personnel were not blinded |
| Blinding of outcome assessment (detection bias) | Unclear risk | Not described |
| Incomplete outcome data (attrition bias) | Unclear risk | The number of participants with incomplete data was not reproted |
| Selective reporting (reporting bias) | Unclear risk | No protocol could be obtained and the trial did not report all‐cause mortality or serious adverse events. |
| For‐profit bias | Unclear risk | It was unclear how the trial was funded |
| Other bias | Low risk | The trial appeared to be free of other components that could put it at risk of bias.Other bias |
| Methods | Randomised clinical trial, Sweden | |
| Participants | 23 hospitalised adults with nonseminomatous germ cell tumours of the testis, at nutritional risk due to trialist indication Male:Female = 23:0 Mean age = 28.5 years. Exclusion criteria: None stated | |
| Interventions | Experimental group: TPN administered 4 ‐ 5 days before chemotherapy initiation as well as during hospitalisation. Non‐eprotein calories were isocalorically divided between fat (intralipid 20%) and D‐glucose 30%. Control: Spontanous oral intake Co‐intervention: Chemotherapy | |
| Outcomes | Weight | |
| Study dates | Not stated | |
| Notes | We found no contact information for the author. | |
| Risk of bias | ||
| Bias | Authors' judgement | Support for judgement |
| Random sequence generation (selection bias) | Unclear risk | Not described |
| Allocation concealment (selection bias) | Unclear risk | Not described |
| Blinding of participants and personnel (performance bias) | Unclear risk | Not described |
| Blinding of outcome assessment (detection bias) | Unclear risk | Not described |
| Incomplete outcome data (attrition bias) | Unclear risk | The number of participants with incomplete data was not reported. |
| Selective reporting (reporting bias) | Unclear risk | No protocol could be obtained and the trial did not report all‐cause mortality and serious adverse events. |
| For‐profit bias | Low risk | Supported by the Swedish Cancer Society. |
| Other bias | Low risk | The trial appeared to be free of other components that could put it at risk of bias. |
| Methods | Randomised clinical trial, UK. | |
| Participants | 314 hospitalised adults undergoing surgery for hip fracture, at nutritional risk due to being frail elderly undergoing less than major surgery Male:Female = 0:314. Exclusion criteria: None stated | |
| Interventions | Experimental group: Received additional personal attention of the dietetic assistants in addition to standard care throughout the length of the intervention (n = 153) | |
| Outcomes | Mortality, length of stay, energy intake and nutritional status | |
| Study dates | May 2000 to August 2003. | |
| Notes | We contacted the authors on 12th December 2015 by email: [email protected]. We received no reply. | |
| Risk of bias | ||
| Bias | Authors' judgement | Support for judgement |
| Random sequence generation (selection bias) | Low risk | Randomisation was by sequentially‐numbered, opaque envelopes, in blocks of 10, prepared by a member of staff not directly involved in the trial. |
| Allocation concealment (selection bias) | Low risk | They used sealed envelopes. |
| Blinding of participants and personnel (performance bias) | High risk | Not blinded |
| Blinding of outcome assessment (detection bias) | Low risk | Outcome assessment was blinded. |
| Incomplete outcome data (attrition bias) | Low risk | They partly used intention‐to‐treat, but had a small number of dropouts. |
| Selective reporting (reporting bias) | Unclear risk | No protocol could be obtained and the trial did not report all‐cause mortality or serious adverse events. |
| For‐profit bias | High risk | The trial was funded by British Dietetic Association. |
| Other bias | Low risk | The trial appeared to be free of other components that could put it at risk of bias. |
| Methods | Randomised clinical trial, Canada | |
| Participants | 17 hospitalised adults who sustained an ASCI with an International Standards for Neurologic Classification of Spinal Cord Injury Impairment Scale15 grades A, B, C., had a last normal neurologic level between C2 and T1, and were admitted to the ASCIU within 72 hours of injury. At nutritional risk due to trauma. Male:Female = 15:2 Mean age = 43 years Exclusion criteria: 1. Had a pre‐existing medical condition such as active bowel disease or a premorbid condition with a significantly diminished nutritional status (e.g. AIDS, cancer). 2. Had surgical resection of a portion of the large or small bowel. 3. Had additional injuries that prevented feeding through a nasogastric tube. 4. Had major chest or abdominal trauma | |
| Interventions | Experimental: Enteral feeding from 72 hours using continuous enteral feeding. A registered dietitian evaluated the participant's conditions to determine their estimated energy requirements, using the Harris‐Benedict equation. The formulas used were Promote, Jevity, Jevity Plus, and Osmolite HN.(n = 7) Control: No intervention (n = 10) Co‐intervention: Enteral feeding from 120 hrs using Promote, Jevity, Jevity Plus, and Osmolite HN | |
| Outcomes | Complications (count data), length of stay | |
| Study dates | Not stated | |
| Notes | We did not contact the authors due to the late inclusion of the trial. | |
| Risk of bias | ||
| Bias | Authors' judgement | Support for judgement |
| Random sequence generation (selection bias) | Low risk | Computer program (omnistat) |
| Allocation concealment (selection bias) | Unclear risk | Not described |
| Blinding of participants and personnel (performance bias) | Unclear risk | Not described |
| Blinding of outcome assessment (detection bias) | Unclear risk | Not described |
| Incomplete outcome data (attrition bias) | Unclear risk | The number of participants with incomplete data was not described. |
| Selective reporting (reporting bias) | Unclear risk | No protocol could be obtained and the trial did not report mortality. |
| For‐profit bias | Low risk | Supported by the Mr. and Mrs. P. A. Woodward’s Foundation, Vancouver, BC, Canada. |
| Other bias | Low risk | The trial appeared to be free of other components that could put it at risk of bias. |
| Methods | Randomised clinical trial, Germany | |
| Participants | 20 hospitalised adults undergoing vaginal hysterectomy, at nutritional risk due to major surgery Male:Female = 0:20 Mean age = 53.5 years | |
| Interventions | Experimental group: Parenteral nutrition (40 ml/kg body weight 3.5% amino acid solution, 5% carbohydrates) for 3 days(n = 10) Control group: Water and electrolytes (standard treatment)(n = 10) | |
| Outcomes | Plasma proteins, nitrogen balance | |
| Study dates | Not stated | |
| Notes | We found no contact information for the author. | |
| Risk of bias | ||
| Bias | Authors' judgement | Support for judgement |
| Random sequence generation (selection bias) | Unclear risk | Not described |
| Allocation concealment (selection bias) | Unclear risk | Not described |
| Blinding of participants and personnel (performance bias) | Unclear risk | Not described |
| Blinding of outcome assessment (detection bias) | Unclear risk | Not described |
| Incomplete outcome data (attrition bias) | Unclear risk | The number of participants with incomplete data was not described. |
| Selective reporting (reporting bias) | Unclear risk | No protocol could be obtained, and the trial did not report all‐cause mortality or serious adverse events. |
| For‐profit bias | Unclear risk | It was unclear how the trial was funded. |
| Other bias | Low risk | The trial appeared to be free of other components that could put it at risk of bias. |
| Methods | Randomised clinical trial, Germany. | |
| Participants | 20 hospitalised adults undergoing curative resection of gastric cancer, at nutritional risk due to major surgery Male:female = 11:9 Mean age = 64 years | |
| Interventions | Experimental group: oral supplement with a proteinful, liquid sip feed (3 x 200 ml, 600 kcal/day, 54 g protein/day) starting on day 5 after surgery(n = 10) Control group: no intervention(n = 10) Co‐intervention: standard diet and parenteral nutrition until day 5 | |
| Outcomes | Plasma proteins, nitrogen balance | |
| Study dates | Not stated | |
| Notes | We found no contact information for the author. | |
| Risk of bias | ||
| Bias | Authors' judgement | Support for judgement |
| Random sequence generation (selection bias) | Unclear risk | Not described |
| Allocation concealment (selection bias) | Unclear risk | Not described |
| Blinding of participants and personnel (performance bias) | Unclear risk | Not described |
| Blinding of outcome assessment (detection bias) | Unclear risk | Not described |
| Incomplete outcome data (attrition bias) | Unclear risk | The number of participants with incomplete data was not reported. |
| Selective reporting (reporting bias) | Unclear risk | No protocol could be obtained and the trial did not report mortality. |
| For‐profit bias | Unclear risk | The trial was supported by a company that might have an interest in a given result (Fresemius AG). |
| Other bias | Low risk | The trial appeared to be free of other components that could put it at risk of bias. |
| Methods | Randomised clinical trial, Sweden | |
| Participants | 14 hospitalised adults undergoing elective open cholecystectomy, at nutritional risk due to major surgery Male:Female = 8:6 Mean age = 42.5 years | |
| Interventions | Experimental group: TPN immediately after surgery (T 135 kJ/kg body weight every 24 hrs)(n = 7) Co‐interventions: Saline infusion during surgery | |
| Outcomes | Biochemistry | |
| Study dates | Not stated | |
| Notes | We contacted the authors n 19th August 2015 by email: [email protected]. We received no reply. | |
| Risk of bias | ||
| Bias | Authors' judgement | Support for judgement |
| Random sequence generation (selection bias) | Unclear risk | The trial was described as randomised, but it was unclear how the sequence was generated. |
| Allocation concealment (selection bias) | Unclear risk | The trial was described as randomised, but it was unclear how the allocation was concealed. |
| Blinding of participants and personnel (performance bias) | Unclear risk | Not described |
| Blinding of outcome assessment (detection bias) | Unclear risk | Not described |
| Incomplete outcome data (attrition bias) | Unclear risk | The number of participants with incomplete data was not reported. |
| Selective reporting (reporting bias) | Unclear risk | No protocol could be obtained and the trial did not report all‐cause mortality or serious adverse events. |
| For‐profit bias | Low risk | The trial was funded by: "Wera EkstroÈm Foundation, the Frimurare Barnhuset Foundation, the Jerring Foundation, the Swedish Society for Medical Research, and the Swedish Medical Research Council (9941, 04210, 09101).". |
| Other bias | Low risk | The trial appeared to be free of other components that could put it at risk of bias. |
| Methods | Randomised clinical trial, Sweden | |
| Participants | 80 hospitalised adults admitted for hip surgery, at nutritional risk because of being frail elderly with minor surgery Male:Female = 17:63 Mean age = 81.5 years Exclusion criteria: Multiple fractures, pathologic fractures, malignant disease, inflammatory joint disease, pain or functional impairment other than the hip fracture which might hamper normal mobilisation, depression, dementia, acute psychosis, known alcohol or medication abuse, epileptic seizures, diseases of such severity that they might negatively influenced the supplementary treatment regimen | |
| Interventions | Experimental group: intravenous supplementary nutrition (1000 kcal/day) for 3 days followed by OSN (400 kcal/day) for 7 days or until discharge(n = 40) Co‐interventions: Standard hospital food and beverage | |
| Outcomes | Anthropometrics (triceps skin‐fold, arm muscle circumference, BMI), biochemistry, SGA‐screening | |
| Study dates | Not stated | |
| Notes | We contacted the authors on 12th November 2015 by email: [email protected]. We received a reply (allocation concealment). | |
| Risk of bias | ||
| Bias | Authors' judgement | Support for judgement |
| Random sequence generation (selection bias) | Unclear risk | The trial was described as being randomised, but it was unclear how the sequence was generated. |
| Allocation concealment (selection bias) | Low risk | The trial used sealed, opaque envelopes for allocation concealment. |
| Blinding of participants and personnel (performance bias) | High risk | The trial was described as being unblinded. |
| Blinding of outcome assessment (detection bias) | High risk | The trial was described as being unblinded. |
| Incomplete outcome data (attrition bias) | High risk | There were above 5% dropouts on BMI, and it was unclear who and how these were handled. |
| Selective reporting (reporting bias) | Low risk | No protocol could be obtained. The trial reported mortality and complications. |
| For‐profit bias | Low risk | This trial was supported by a non‐profit organisation (Medical Faculty of Lund University, the County of Skane and the Swedish National Board of Health and Welfare). |
| Other bias | Low risk | The trial appeared to be free of other components that could put it at risk of bias. |
| Methods | Randomised, placebo‐controlled clinical trial, Spain. | |
| Participants | 171 hospitalised adults hospitalised due to hip fracture, at nutritional risk due to being frail elderly Male:Female = 36:135 Mean age = 82.5 years Exclusion criteria: Younger than 70, advanced dementia, need for IVN, those with pathological fractures or fractures not due to accidental falls | |
| Interventions | Experimental group: Oral supplement of 20g protein and 800 mg calcium for 60 days(n = 85) Control group: Placebo (n = 86) Co‐interventions: Normal diet | |
| Outcomes | Mortality, complications, functional recovery, use of walking aids | |
| Study dates | Not stated | |
| Notes | We contacted the authors by email: [email protected]. We received no reply. | |
| Risk of bias | ||
| Bias | Authors' judgement | Support for judgement |
| Random sequence generation (selection bias) | Low risk | Computer‐generated in blocks of 4 |
| Allocation concealment (selection bias) | Low risk | Allocation concealment with sealed envelopes |
| Blinding of participants and personnel (performance bias) | Low risk | An independent pharmacist assigned the study number, and prepared the appropriate nutritional supplement. |
| Blinding of outcome assessment (detection bias) | Unclear risk | It was unclear how the outcome assessment was blinded. |
| Incomplete outcome data (attrition bias) | High risk | The pattern of dropouts was not clearly stated, and exceeded 5%. The trial did not use multiple imputation. |
| Selective reporting (reporting bias) | Unclear risk | No protocol could be obtained, and the trial did not report all‐cause mortality or serious adverse events. |
| For‐profit bias | High risk | The trial was funded by Clinical Nutrition SA. |
| Other bias | Low risk | The trial appeared to be free of other components that could put it at risk of bias. |
| Methods | Randomised clinical trial, presumably Sweden | |
| Participants | 17 hospitalised adults admitted for elective open cholecystectomy, at nutritional risk due to major surgery Male:Female = 3:14 Mean age = 42.5 Exclusion criteria: metabolically unhealthy | |
| Interventions | Experimental group: TPN (135 kj/kg body weight/day and 0.2 g/kg body weight/day protein) for 3 days (n = 9) Control group: saline infusion (n = 8) | |
| Outcomes | Rate of protein synthesis, urine excretion | |
| Study dates | Not stated | |
| Notes | We contacted the author on 12th November 2015 by Linkedin. We received no reply. | |
| Risk of bias | ||
| Bias | Authors' judgement | Support for judgement |
| Random sequence generation (selection bias) | Unclear risk | Not described |
| Allocation concealment (selection bias) | Unclear risk | Not described |
| Blinding of participants and personnel (performance bias) | Unclear risk | Not described |
| Blinding of outcome assessment (detection bias) | Unclear risk | Not described |
| Incomplete outcome data (attrition bias) | Unclear risk | The number of participants with incomplete data was not reported. |
| Selective reporting (reporting bias) | Unclear risk | No protocol could be obtained and the trial did not report all‐cause mortality or serious adverse events |
| For‐profit bias | High risk | The trial was supported by the company Kabi Baxter Infusion AB |
| Other bias | Low risk | The trial appeared to be free of other components that could put it at risk of bias |
| Methods | Randomised clinical trial, USA | |
| Participants | 52 hospitalised adults admitted for blunt trauma ICU, at nutritional risk due to being at an ICU department Male:Female = 22:16 (analysed participants) Mean age = 42.5 years Exclusion criteria: Contra‐indication for enteral feeding, new upper intestinal suture lines, unstable cervical fracture, admission creatinine level > 2 mg/dL, admission bilirubin > 3 mg/dL; pre‐existing malnutrition, use of steroids, radiation, chemotherapy, malignancy, acute spinal cord injury | |
| Interventions | Experimental group: Early feeding within < 24 hrs (Enteral nutrition: 1.33 kcal/mL, 125:1 nonprotein kcal/g. 58g protein, 158g carbohydrate, 52g fat) (n = 26) Control group: No intervention (n = 26) Co‐interventions: Enteral feeding after 72 hrs | |
| Outcomes | Urinary catecholamine, cortisol excretion, infections, ICU days, ventilation days, mortality | |
| Study dates | December 1988 to May 1991 | |
| Notes | We could obtain no contact information. | |
| Risk of bias | ||
| Bias | Authors' judgement | Support for judgement |
| Random sequence generation (selection bias) | Unclear risk | The trial was described as being randomised, but it was unclear how the sequence was generated. |
| Allocation concealment (selection bias) | Unclear risk | The trial used sealed envelopes to conceal the allocation, but it was unclear if the envelope was opaque. |
| Blinding of participants and personnel (performance bias) | High risk | The trial was described as unblinded. |
| Blinding of outcome assessment (detection bias) | Unclear risk | Not described |
| Incomplete outcome data (attrition bias) | Unclear risk | The number of participants with incomplete data was not reported. |
| Selective reporting (reporting bias) | Unclear risk | No protocol could be obtained, and the trial did not report all‐cause mortality or serious adverse events. |
| For‐profit bias | High risk | The trial was funded in part by Hoechst‐Roussel. |
| Other bias | Low risk | The trial appeared to be free of other components that could put it at risk of bias. |
| Methods | Randomised clinical trial, Hong Kong | |
| Participants | 40 hospitalised adults with oesophageal cancer, at nutritional risk due to major surgery Male:Female = 35:5 Mean age = 65 years Exclusion criteria: Not described. | |
| Interventions | Experimental group: Pre‐operative parenteral nutrition 14 days before surgery(n = 20) Co‐interventions: Oral feeding | |
| Outcomes | Nitrogen intake, calorie intake, weight, lymphocyte count before surgery, complications, mortality and albumin | |
| Study dates | April 1985 to November 1986 | |
| Notes | We contacted the authors in September 2015 by email: [email protected]. We received no reply. | |
| Risk of bias | ||
| Bias | Authors' judgement | Support for judgement |
| Random sequence generation (selection bias) | Unclear risk | It was only described that participants were randomised by "drawing sealed envelopes". |
| Allocation concealment (selection bias) | Unclear risk | It was only described that participants were randomised by "drawing sealed envelopes". |
| Blinding of participants and personnel (performance bias) | Unclear risk | Not described |
| Blinding of outcome assessment (detection bias) | Unclear risk | Not described |
| Incomplete outcome data (attrition bias) | Unclear risk | The number of participants with incomplete data was not described. |
| Selective reporting (reporting bias) | Low risk | There was no protocol. The trial reported all‐cause mortality and complications. |
| For‐profit bias | Unclear risk | It was unclear how the trial was funded. |
| Other bias | Low risk | The trial appeared to be free of other components that could put it at risk of bias. |
| Methods | Randomised clinical trial, Hong Kong | |
| Participants | 150 hospitalised adults undergoing resection of hepatocellular carcinoma, at nutritional risk due to major abdominal surgery Male:Female = 109:15 (gender not reported for 26 participants) Mean age = 53.5 years Exclusion criteria: Metastatic disease (exclusion was done after randomisation) | |
| Interventions | Experimental group: Perioperative parenteral nutrition started 7 days before hepatic resection and continued for 7 days after operation. PN consisted of 1.5 g amino acid a kilogram of body weight, dextrose and lipid emulsion providing 30 kcal a kilogram each day.(n = 75) Control group: No intervention except 5% dextrose in normal saline postoperatively(n = 75) Co‐interventions: Usual oral diet. Cefotaxime at the time of induction and postoperatively, and 25 g of albumin intravenously for 5 days | |
| Outcomes | All‐cause mortality, complications, morbidity, aspartate aminotransferase, glucose, urea, transferrin, prealbumin, retinol‐binding protein, body weight, midarm circumference, triceps skinfold, grip strength, serum immunoglobulin, hospital stay | |
| Study dates | September 1990 to June 1993 | |
| Notes | We contacted the authors on 23rd June 2015 by email: [email protected]. We received no reply. | |
| Risk of bias | ||
| Bias | Authors' judgement | Support for judgement |
| Random sequence generation (selection bias) | Unclear risk | Not described |
| Allocation concealment (selection bias) | Unclear risk | Not described |
| Blinding of participants and personnel (performance bias) | High risk | The trial was described as unblinded. |
| Blinding of outcome assessment (detection bias) | Unclear risk | It was determined by an independent observer, but not described that person was blinded. |
| Incomplete outcome data (attrition bias) | High risk | There were above 5% dropouts, and even though it was clearly stated who was removed from the trial, the trial did not use proper methodology to deal with incomplete outcome data. |
| Selective reporting (reporting bias) | Low risk | Seriours adverse events and all‐cause mortality were reported. No protocol could be found. |
| For‐profit bias | Unclear risk | It was unclear how the trial was funded. |
| Other bias | Low risk | The trial appeared to be free of other components that could put it at risk of bias. |
| Methods | Randomised clinical trial, Sweden | |
| Participants | 92 hospitalised adults undergoing major colorectal surgery for carcinoma of the large bowel or inflammatory bowel disease Male:Female = unknown Mean age = unknown Exclusion criteria: none specified | |
| Interventions | Experimental group: 48 participants were allocated to postoperative TPN for a minimum of 7 days or until an oral diet was tolerated. The TPN was given through a central venous catheter and included infusion of an amino acid solution to a mean nitrogen intake of 215+8 mg/ kg/ day, and 500 ml of a 20% fat emulsion plus 10% dextrose to 45 + 1.6 kcal/ kg/day. The TPN was given for 9.7 + 1.1 days. 20 mmol of phosphate was added daily to everyone in the TPN group. (n = 48) Co‐interventions:10% dextrose solution containing electrolytes according to individual needs until an oral diet was tolerated, these participants were given an IV fusion with a mean of 16 + 0.8 kcal/kg/day for 6.2 + 0.7 days (mean + SD). | |
| Outcomes | Overall mortality, serious adverse events (septic and non‐septic complications), morbidity | |
| Study dates | Not described | |
| Notes | We could obtain no contact information for the authors. | |
| Risk of bias | ||
| Bias | Authors' judgement | Support for judgement |
| Random sequence generation (selection bias) | Unclear risk | Not described |
| Allocation concealment (selection bias) | Unclear risk | Not described |
| Blinding of participants and personnel (performance bias) | Unclear risk | Not described |
| Blinding of outcome assessment (detection bias) | Unclear risk | Not described |
| Incomplete outcome data (attrition bias) | Unclear risk | The number of participants with incomplete data was not described. |
| Selective reporting (reporting bias) | Unclear risk | No protocol could be obtained and the trial did not report all‐cause mortality or serious adverse events. |
| For‐profit bias | High risk | The trial was funded by Vitrum AB. |
| Other bias | Low risk | The trial appeared to be free of other components that could put it at risk of bias. |
| Methods | Randomised clinical trial (multicentre study in 4 hospitals), Spain | |
| Participants | 70 hospitalised adults undergoing medium to major surgery, at nutritional risk due to major surgery Male:Female = 38:32 Mean age = 57 years Exclusion criteria: recent loss of more than 10% of body weight, serum albumin of 3 g/dl or less, serum creatinine above 2 mg/dl; diabetes, sepsis or recent haemorrhage, or both | |
| Interventions | Experimental group: hypocaloric peripheral parenteral nutrition (HPPN), consisting of 1 g of amino acids and 2 g of polyols (sorbitol and xylitol) a kg each day. The solution was started on the 1st postoperative day after normalisation of the haemodynamic status and remained in the study for a minimum of 5 days. (n = 41) The solution was started on the 1st postoperative day after normalisation of the haemodynamic status and remained in the study for a minimum of 5 days. (n = 29) | |
| Outcomes | Weight, urinary nitrogen excretion, serum albumin, total proteins, prealbumin, transferrin, glucose, urea, creatinine and cholesterol, hospital stay | |
| Study dates | ||
| Notes | We could obtain no contact information for the authors. | |
| Risk of bias | ||
| Bias | Authors' judgement | Support for judgement |
| Random sequence generation (selection bias) | Unclear risk | Not described |
| Allocation concealment (selection bias) | Low risk | Sealed envelopes |
| Blinding of participants and personnel (performance bias) | Unclear risk | Not described |
| Blinding of outcome assessment (detection bias) | Unclear risk | Not described |
| Incomplete outcome data (attrition bias) | Unclear risk | The number of participants with incomplete data was not reported. |
| Selective reporting (reporting bias) | Unclear risk | No protocol could be obtained. The trial reported complications and mortality. |
| For‐profit bias | Unclear risk | It was unclear how the trial was funded. |
| Other bias | Low risk | The trial appeared to be free of other components that could put it at risk of bias. |
| Methods | Randomised clinical trial, Australia | |
| Participants | 28 hospitalised adults admitted for aortic grafting, at nutritional risk due to major surgery Male:Female = 22:6 Mean age = 64 years | |
| Interventions | Experimental group 1: 1 litre of their daily intravenous fluid requirements given as TPN (250 gm dextrose, 40 gm amino acids)(n = 10) Control group: Standard intravenous fluids postoperatively(n = 5) | |
| Outcomes | Nitrogen intake and balance, mortality, complications, length of stay | |
| Study dates | Not stated | |
| Notes | Same as Fletcher 1986b. We only reported experimental group 1 vs control here. We contacted the authors 12th December 2015 by email: [email protected]. The author replied that he would give us the information some time in the future. We have not received the information at the time of writing. | |
| Risk of bias | ||
| Bias | Authors' judgement | Support for judgement |
| Random sequence generation (selection bias) | Unclear risk | The trial was described as being randomised, but it was unclear how the sequence was generated. |
| Allocation concealment (selection bias) | Unclear risk | The trial was described as being randomised, but it was unclear how the allocation was concealed. |
| Blinding of participants and personnel (performance bias) | High risk | Only experimental group two received an enteral tube. |
| Blinding of outcome assessment (detection bias) | Unclear risk | Not described |
| Incomplete outcome data (attrition bias) | Unclear risk | The number of participants with incomplete data was not reported. |
| Selective reporting (reporting bias) | Unclear risk | No protocol could be obtained, and the trial did not report serious adverse events properly (only total complications, not by group). |
| For‐profit bias | High risk | The trial was funded by Bristol‐Myers Squibb. |
| Other bias | Low risk | The trial appeared to be free of other components that could put it at risk of bias. |
| Methods | Randomised clinical trial, Australia | |
| Participants | 28 adult hospitalised patients admitted for aortic grafting, at nutritional risk due to major surgery Male:Female = 22:6 Mean age: 64 years | |
| Interventions | Experimental group 2: Enteral nutrition(n = 9) Control group: Standard intravenous fluids postoperatively(n = 4) | |
| Outcomes | Nitrogen intake and balance, mortality, complications, length of stay | |
| Study dates | ||
| Notes | ||
| Risk of bias | ||
| Bias | Authors' judgement | Support for judgement |
| Random sequence generation (selection bias) | Unclear risk | The trial was described as being randomised, but it was unclear how the sequence was generated. |
| Allocation concealment (selection bias) | Unclear risk | The trial was described as being randomised, but it was unclear how the allocation was concealed. |
| Blinding of participants and personnel (performance bias) | High risk | Only experimental group two received an enteral tube. |
| Blinding of outcome assessment (detection bias) | Unclear risk | Not described |
| Incomplete outcome data (attrition bias) | Unclear risk | The number of participants with incomplete data was not reported. |
| Selective reporting (reporting bias) | Unclear risk | No protocol could be obtained, and the trial did not report serious adverse events properly (only total complications, not by group). |
| For‐profit bias | High risk | The trial was funded by Bristol‐Myers Squibb. |
| Other bias | Low risk | The trial appeared to be free of other components that could put it at risk of bias. |
| Methods | Randomised clinical trial, Italy | |
| Participants | 64 hospitalised adults with obstructive jaundice, with serum bilirubin above 200 µmol undergoing percutaneous transhepatic biliary drainage, at nutritional risk due to undergoing major surgery Male:Female = 39:21 (gender not reported for four participants) Mean age = 63.5 years Exclusion criteria: None stated | |
| Interventions | Experimental group: Either enteral (19 participants) or parenteral nutrition (4 participants) or both (5 participants). Enteral nutrition was Precision BR with 10% peptides, 0.8% lipid, 81.9% carbohydrate; parenteral nutrition was Freamine III (50% dextrose and 8.5% amino acid). All nutrition was for at least 12 days preoperatively.(n = 28) Control group: no intervention(n = 32) Co‐interventions: percutaneous trans‐hepatic biliary drainage and standard care | |
| Outcomes | Complications, mortality | |
| Study dates | Not stated | |
| Notes | We contacted the authors on 6th April 2016 by email: [email protected]. We received no reply. | |
| Risk of bias | ||
| Bias | Authors' judgement | Support for judgement |
| Random sequence generation (selection bias) | Unclear risk | Not described |
| Allocation concealment (selection bias) | Unclear risk | Not described |
| Blinding of participants and personnel (performance bias) | Unclear risk | Not described |
| Blinding of outcome assessment (detection bias) | Unclear risk | Not described |
| Incomplete outcome data (attrition bias) | Unclear risk | There are > 5% dropouts and it is unclear how the trial handles missing data. |
| Selective reporting (reporting bias) | Low risk | The trial reports complications and mortality. |
| For‐profit bias | Unclear risk | It was unclear how the trial was funded. |
| Other bias | Low risk | The trial appeared to be free of other components that could put it at risk of bias. |
| Methods | Randomised clinical trial (stratified for age and sex), Norway | |
| Participants | 42 underweight hospitalised adults with end‐stage pulmonary disease referred to the hospital to be evaluated for lung transplantation, at nutritional risk due to low BMI Male:Female = 20:22 Mean age = 48.5 years Exclusion criteria: Unwillingness to participate and eat the prescribed diet, too sick to be able to co‐operate and leave of absence due to the possibility of eating meals outside the hospital | |
| Interventions | Experimental group: Energy‐rich diet 10 MJ/day + offered extra meals(n = 20) | |
| Outcomes | Weight, BMI, energy intake, mortality, pulmonary function | |
| Study dates | Not stated | |
| Notes | We could obtain no contact information for the authors. | |
| Risk of bias | ||
| Bias | Authors' judgement | Support for judgement |
| Random sequence generation (selection bias) | Low risk | The trial used random‐number tables. |
| Allocation concealment (selection bias) | Unclear risk | Not described |
| Blinding of participants and personnel (performance bias) | High risk | The trial was described as unblinded |
| Blinding of outcome assessment (detection bias) | High risk | The trial was described as unblinded |
| Incomplete outcome data (attrition bias) | High risk | Above 5% dropouts and the trial did not allow proper methodology for an intention‐to‐treat analysis. |
| Selective reporting (reporting bias) | Unclear risk | No protocol could be obtained, and the trial did not report all‐cause mortality or serious adverse events. |
| For‐profit bias | High risk | The trial was supported by the Research Council of Norway and the Norwegian Heart and Lung Association, as well as financial support from Pharmacia & Upjohn and Abbott Norway A/S. |
| Other bias | Low risk | The trial appeared to be free of other components that could put it at risk of bias. |
| Methods | Randomised clinical trial, UK | |
| Participants | 42 hospitalised adults admitted with an acute stroke and did not have problems with swallowing. The participants had to be conscious the 1st week after the stroke, and they had to show evidence of undernutrition measured with midarm circumference ˜1 SD below the Male:Female = 21:21 Mean age = 78 years Exclusion criteria: cerebral and subarachnoid haemorrhage, active | |
| Interventions | Experimental group: Daily oral food supplement for 4 weeks in addition to hospital food(n = 21) The nutritional support consisted of > 400 mL of Fortisip containing 600 kcal and 20 g protein. Control group: Received only hospital food for 4 weeks(n = 21) | |
| Outcomes | Energy and protein intakes during the intervention period, change in nutritional status, disability, infective complications, length of stay, and mortality | |
| Study dates | Not stated | |
| Notes | We contacted the authors on 19th August 2015 by email: [email protected] . We received no reply. | |
| Risk of bias | ||
| Bias | Authors' judgement | Support for judgement |
| Random sequence generation (selection bias) | Unclear risk | The trial was described as block‐randomised, but it was unclear how the sequence was generated. |
| Allocation concealment (selection bias) | Low risk | Randomisation blocks were kept separately by the dietitian, and allocation to the treatment group was done by telephone. |
| Blinding of participants and personnel (performance bias) | High risk | Nurses and participants were not blinded. |
| Blinding of outcome assessment (detection bias) | Low risk | Single‐blinded study, with the outcome assessors blinded |
| Incomplete outcome data (attrition bias) | High risk | Above 5% dropouts according to weight, and the trial did not allow proper methodology for intention‐to‐treat analysis. |
| Selective reporting (reporting bias) | Low risk | All‐cause mortality and serious adverse events were reported. A protocol was not found. |
| For‐profit bias | Unclear risk | It was unclear how the trial was funded. |
| Other bias | Low risk | The trial appeared to be free of other components that could put it at risk of bias. |
| Methods | Randomised clinical trial, UK. | |
| Participants | 445 hospitalised adults > 65 of age and able to swallow, at nutritional risk according to the trialist Male:Female = 234:211 Mean age = 76.7 Exclusion criteria: Undergone gastric surgery, diagnosed malabsorption and morbid obesity, in a coma, diagnosed severe dementia, malignancy, living in an institution, already taking supplements | |
| Interventions | Experimental group: Oral supplements (400 ml 995 kcal)(n = 223) Control group: Placebo (n = 222) Co‐interventions: Standard hospital diet | |
| Outcomes | 6 months of disability (Barthel score), non‐elective readmission, length of stay in hospital, discharge destination, morbidity (infective complications), mortality, nutritional status | |
| Study dates | Not stated | |
| Notes | We contacted the authors on 19th August 2015 by email: [email protected] . We received no reply. | |
| Risk of bias | ||
| Bias | Authors' judgement | Support for judgement |
| Random sequence generation (selection bias) | Unclear risk | The sequence was generated by the trial statistician but it was unclear how. |
| Allocation concealment (selection bias) | Low risk | Sealed opaque envelopes |
| Blinding of participants and personnel (performance bias) | Low risk | The trial was a placebo study. |
| Blinding of outcome assessment (detection bias) | Low risk | The trial was placebo and no‐one knew who received placebo or supplement. |
| Incomplete outcome data (attrition bias) | High risk | Above 5% dropouts according to BMI, and the trial did not allow proper methodology for intention‐to‐treat analysis. |
| Selective reporting (reporting bias) | Unclear risk | No protocol could be obtained, and the trial did not report all‐cause mortality or serious adverse events. |
| For‐profit bias | Unclear risk | It was unclear how the trial was funded. |
| Other bias | Low risk | The trial appeared to be free of other components that could put it at risk of bias. |
| Methods | Randomised clinical trial, Belgium | |
| Participants | 80 hospitalised adults, at nutritional risk based on Mini Nutritional Assessment Male:Female = 19:61 Mean age = 80 years | |
| Interventions | Experimental group: oral supplements (1.5 kcal/ml 500 kcal and 21 g protein a day in 200 ml cup)(n = 39) Control group: no intervention(n = 41) Co‐interventions: standard diet throughout the hospitalisation and after discharge for 2 months | |
| Outcomes | All‐cause mortality, weight change, MNA score | |
| Study dates | November 1999 to April 2000 | |
| Notes | We contacted the authors on 23rd June 2015 by email: [email protected]. We received no reply. | |
| Risk of bias | ||
| Bias | Authors' judgement | Support for judgement |
| Random sequence generation (selection bias) | Unclear risk | The trial was described as being randomised, but it was unclear how the sequence was generated. |
| Allocation concealment (selection bias) | Low risk | The allocation was concealed using sealed envelopes. |
| Blinding of participants and personnel (performance bias) | High risk | The trial was described as not blinded. |
| Blinding of outcome assessment (detection bias) | High risk | The trial was described as not blinded. |
| Incomplete outcome data (attrition bias) | High risk | Above 5% dropouts and the trial did not use proper methodology for intention‐to‐treat analysis. |
| Selective reporting (reporting bias) | Unclear risk | No protocol could be obtained, and the trial did not report all‐cause mortality or serious adverse events. |
| For‐profit bias | Low risk | It was unclear how the trial was funded. |
| Other bias | Low risk | The trial appeared to be free of other components that could put it at risk of bias. |
| Methods | Randomised clinical trial, China | |
| Participants | 24 hospitalised adults diagnosed with ulcerative colitis in accordance with China's diagnosis of inflammatory bowel disease and treatment standard of consensus on diagnostic criteria, at nutritional risk due to ulcerative colitis. Male:Female = 12:9 (gender not reported for three participants) Exclusion criteria: Unclear | |
| Interventions | Experimental group: short peptide enteral nutrition agent of 125 g (100 general, Nutricia Pharmaceutical Co. Ltd, Switzerland) for oral feeding, 4 times each day (n = 11) Control group: no intervention (n = 10) Co‐intervention: mesalazine 1.0 g (ADIS, ethypharm Pharmaceutical Group, France) by mouth, 4 times each day | |
| Outcomes | Fructose concentration, mannitol concentration, disease activity index, BMI, symptom relief | |
| Study dates | Not stated | |
| Notes | We tried but failed to contact the authors by phone. | |
| Risk of bias | ||
| Bias | Authors' judgement | Support for judgement |
| Random sequence generation (selection bias) | Low risk | The sequence generation was achieved using a random‐numbers table. |
| Allocation concealment (selection bias) | Unclear risk | The trial was described as being randomised, but it was unclear how the allocation was concealed. |
| Blinding of participants and personnel (performance bias) | High risk | Participants and personnel were not blinded. |
| Blinding of outcome assessment (detection bias) | Unclear risk | The procedure of blinding was insufficiently described. |
| Incomplete outcome data (attrition bias) | Unclear risk | The number of participants with incomplete data was not reported. |
| Selective reporting (reporting bias) | Unclear risk | No protocol could be obtained, and the trial did not report all‐cause mortality. |
| For‐profit bias | Unclear risk | It was unclear how the trial was funded. |
| Other bias | Low risk | The trial appeared to be free of other components that could put it at risk of bias. |
| Methods | Randomised clinical trial, Turkey | |
| Participants | 38 hospitalised adults with gastrointestinal tumours admitted for surgery, at nutritional risk according to the trialist Male:Female = 9:17 Mean age = 62.5 Exclusion criteria: Diabetes mellitus, renal or hepatic failure or both, active infection, a history of immunosuppressive drug use or clinical signs of vitamin or trace element deficiency | |
| Interventions | Experimental group: Standard enteral feeding (without RNA and omega3)(n = 19) Control group: Normal feeding planned by a dietitian(n = 19) | |
| Outcomes | Lymphocyte count, complications, length of hospital stay | |
| Study dates | Not stated | |
| Notes | There was also a 3rd group of immunonutrition, not included in this review. We contacted the authors on 19th August 2015 by email: [email protected] . We received no reply. | |
| Risk of bias | ||
| Bias | Authors' judgement | Support for judgement |
| Random sequence generation (selection bias) | Unclear risk | Not described |
| Allocation concealment (selection bias) | Unclear risk | Not described |
| Blinding of participants and personnel (performance bias) | High risk | Not blinded. Only the experimental group received a tube. |
| Blinding of outcome assessment (detection bias) | Unclear risk | Not described |
| Incomplete outcome data (attrition bias) | High risk | Above 5% dropouts and the trial did not allow proper methodology for intention‐to‐treat analysis. |
| Selective reporting (reporting bias) | Unclear risk | No protocol could be obtained, and the trial did not report all‐cause mortality or serious adverse events. |
| For‐profit bias | Unclear risk | It was unclear how the trial was funded. |
| Other bias | Low risk | The trial appeared to be free of other components that could put it at risk of bias. |
| Methods | Randomised clinical trial, UK | |
| Participants | 37 hospitalised adults undergoing hepatic or pancreatic surgery due to benign or malignant disease, at nutritional risk due to major surgery. Male:Female = not reported Mean age = not reported. Exclusion criteria = not stated | |
| Interventions | Experimental group: Received total enteral nutrition immediately postoperatively(n = 15) | |
| Outcomes | Oxidative stress | |
| Study dates | Not stated | |
| Notes | We contacted the authors on 12th December 2015 by email: [email protected]. The author could not provide any additional information. | |
| Risk of bias | ||
| Bias | Authors' judgement | Support for judgement |
| Random sequence generation (selection bias) | Unclear risk | The trial was described as being randomised, but it was unclear how the sequence was generated. |
| Allocation concealment (selection bias) | Unclear risk | The trial was described as being randomised, but it was unclear how the allocation was concealed. |
| Blinding of participants and personnel (performance bias) | Unclear risk | Not described |
| Blinding of outcome assessment (detection bias) | Unclear risk | Not described |
| Incomplete outcome data (attrition bias) | Unclear risk | The number of participants with incomplete data was not reported. |
| Selective reporting (reporting bias) | Unclear risk | No protocol could be obtained, and the trial did not report all‐cause mortality or serious adverse events. |
| For‐profit bias | Unclear risk | It was unclear how the trial was funded. |
| Other bias | Low risk | The trial appeared to be free of other components that could put it at risk of bias. |
| Methods | Randomised clinical trial, country unknown. | |
| Participants | 32 hospitalised adults awaiting liver transplant, at nutritional risk due to malnutrition Male:Female = not reported. Exclusion criteria: admitted to the ICU, grade 4 encephalopathy or with infections precluding liver transplant candidacy | |
| Interventions | Experimental group: Enteral nutrition. Fed via nasogastric tube with “Impact” (n = not reported) Co‐interventions: Oral diet with unrestricted protein/calorie supplements | |
| Outcomes | Nutritional intake, encephalopathy, gastro‐intestinal bleeding, infection, length of hospital stay and mortality | |
| Study dates | Not stated | |
| Notes | We found no contact information for the authors. | |
| Risk of bias | ||
| Bias | Authors' judgement | Support for judgement |
| Random sequence generation (selection bias) | Unclear risk | Not described |
| Allocation concealment (selection bias) | Unclear risk | Not described |
| Blinding of participants and personnel (performance bias) | Unclear risk | Not described |
| Blinding of outcome assessment (detection bias) | Unclear risk | Not described |
| Incomplete outcome data (attrition bias) | Unclear risk | The number of participants with incomplete data was not reported. |
| Selective reporting (reporting bias) | Unclear risk | No protocol could be obtained, and the trial did not report all‐cause mortality or serious adverse events. |
| For‐profit bias | Unclear risk | It was unclear how the trial was funded. |
| Other bias | Low risk | The trial appeared to be free of other components that could put it at risk of bias. |
| Methods | Randomised clinical trial, Norway | |
| Participants | 165 hospitalised adults admitted due to stroke, at nutritional risk due to MUST Male:Female = 60:64 (only reported for the participants that completed the study) Mean age = 79 years | |
| Interventions | Experimental group: Individualised nutritional care aiming to prevent weight loss(n = 84) Control group: Routine practice with use of oral sip feeding, or tube feeding at the discretion of the attending physician(n = 86) | |
| Outcomes | Number of participants with unintentional weight loss of 5% after 3 months, all‐cause mortality, weight change, quality of life, hand‐grip strength, length of hospital stay | |
| Study dates | May 2005 to December 2007 | |
| Notes | We contacted the authors on 12th December 2015 by email: [email protected]. We received information on serious adverse events and participants lost to follow‐up. | |
| Risk of bias | ||
| Bias | Authors' judgement | Support for judgement |
| Random sequence generation (selection bias) | Low risk | The randomisation sequence was computer‐generated in blocks of 20. |
| Allocation concealment (selection bias) | Low risk | The allocation was sequentially‐numbered, non‐transparent envelopes. |
| Blinding of participants and personnel (performance bias) | High risk | The personnel were not blinded to the treatment. |
| Blinding of outcome assessment (detection bias) | High risk | The assessor performing the outcome assessment was not blinded. |
| Incomplete outcome data (attrition bias) | High risk | Above 5% dropouts and the trial did not allow proper methodology for intention‐to‐treat analysis. |
| Selective reporting (reporting bias) | Low risk | The outcomes described in the protocol, were assessed in the trial. |
| For‐profit bias | Low risk | This study was supported by the South‐Eastern Norway Regional Health Authority and Østfold Hospital Trust. |
| Other bias | Low risk | The trial appeared to be free of other components that could put it at risk of bias. |
| Methods | Randomised clinical trial, the Netherlands | |
| Participants | 140 hospitalised adults admitted due to hip fracture and a pressure sore risk score of 8, at nutritional risk due to being frail elderly Male:Female = 16:113 (of participants analysed) Mean age = 83.7 years Exclusion criteria: Pressure sore of grade 2 or more at admission | |
| Interventions | Experimental group: Tube‐feeding consisting of 1 litre Nutrison Steriflo Energy (1500 kcal/1 energy, 60 gram/1 protein) which was administered with a feeding pump through a nasogastric feeding tube. Tube‐feeding was meant to be given for 2 weeks, and was administered between 21:00 and 05:00 to minimise interference with the normal hospital diet.(n = 70) Control group: No intervention(n = 70) | |
| Outcomes | Risk factors for pressure sores, pressure‐sore grade, mortality, serum protein, albumin | |
| Study dates | May 1993 to November 1995 | |
| Notes | We contacted the authors on 19th August 2015 by email: [email protected]. The authors did not keep records of any of the missing information. | |
| Risk of bias | ||
| Bias | Authors' judgement | Support for judgement |
| Random sequence generation (selection bias) | Unclear risk | Not described |
| Allocation concealment (selection bias) | Unclear risk | Not described |
| Blinding of participants and personnel (performance bias) | High risk | Participants and physicians were not blinded, since the control group did not receive a naso‐gastric tube. |
| Blinding of outcome assessment (detection bias) | Unclear risk | Not described |
| Incomplete outcome data (attrition bias) | High risk | The trial had more than 5% of participants with incomplete data, and the trial did not use proper methodology for intention‐to‐treat analysis. |
| Selective reporting (reporting bias) | Unclear risk | No protocol could be obtained, and the trial did not report all‐cause mortality or serious adverse events. |
| For‐profit bias | High risk | "The authors want to thank Nuldcia corp., Netherlands for their support of Nutrison tube feeding and the nasogastric tubes". |
| Other bias | Low risk | The trial appeared to be free of other components that could put it at risk of bias. |
| Methods | Randomised clinical trial, USA | |
| Participants | 50 hospitalised adults undergoing surgery with liver transplant, at nutritional risk due to major surgery Male:Female = 17:14 (completed the study) Mean age = 51 years Exclusion criteria: Dialysis requirements or choledochojejunostomy was performed at the time of transplant. | |
| Interventions | Experimental group: With feeding‐tube the participants were given full‐strength Reabilan HN (Elan Pharma, Cambridge, MA) 12 hours after surgery. The infusion rate was started at 20 ml/hr and was increased to 40 mL/hr 24 hrs after the initiation of the tube‐feeding. If tolerated 40 mL/hour, the feeding rate was increased to 60 mL/hr 12 hrs after the previous rate increased.(n = 25) Control group: Conventional IV electrolytes(n = 25) Co‐interventions: non‐feeding naso‐gastric tube | |
| Outcomes | Medical condition, tube‐feeding tolerance, signs of infection, calorie and protein intake, resting energy expenditure, respiratory quotient (RQ), urinary urea nitrogen (UUN), nitrogen balance, hand‐grip strength, length of hospital stay, rehospitalisation, overall cost, weight, chemical assays | |
| Study dates | Not stated | |
| Notes | We contacted the authors on 19th August 2015 by email: [email protected] . We received no reply. | |
| Risk of bias | ||
| Bias | Authors' judgement | Support for judgement |
| Random sequence generation (selection bias) | Unclear risk | Not described |
| Allocation concealment (selection bias) | Unclear risk | Not described |
| Blinding of participants and personnel (performance bias) | Unclear risk | Not described |
| Blinding of outcome assessment (detection bias) | Unclear risk | Not described |
| Incomplete outcome data (attrition bias) | High risk | The 2 groups could not be described as similar, and the dropout rate was above 5%. |
| Selective reporting (reporting bias) | Unclear risk | No protocol could be obtained, and the trial did not report all‐cause mortality. |
| For‐profit bias | High risk | The study was supported in part by grants from the Di‐etitians in Nutrition Support Practice Group Member Research Award, Elan Pharma. |
| Other bias | Low risk | The trial appeared to be free of other components that could put it at risk of bias. |
| Methods | Randomised clinical trial, Switzerland | |
| Participants | 305 hospitalised adults admitted to ICU for more than 3 days. They were expected to stay for more than 5 days at the ICU and to survive for more than 7 days. They received less than 60% of their energy target and were at nutritional risk due to being in a ICU. Male:Female = 215:90 Mean age = 60.5 years Exclusion criteria: Receiving PN, had persistent gastro‐intestinal dysfunction and ileus, were pregnant, refused to consent, or had been readmitted to the ICU after previous randomisation | |
| Interventions | Experimental group: supplemental parenteral feeding, 0.62 – 1.37 kcal/mL of energy (20% proteins, 29% lipids (15% medium‐chain triglycerides), and 51% carbohydrates) on day 3(n = 153) Control group: no intervention on day 3(n = 152) Co‐interventions: enteral nutrition | |
| Outcomes | Nosocomial infections, number of antibiotic‐free days, duration of invasive and non‐invasive mechanical ventilation, length of stay in the ICU and hospital, mortality in ICU, general mortality, duration of renal replacement therapy, glycaemia (crude blood glucose concentration and area under the curve (AUC)), phosphataemia, concentration of C‐reactive protein, liver test results, and drug administration (insulin, steroids, and antifungal agents). | |
| Study dates | Not stated | |
| Notes | We contacted the authors on 19th August 2015 by email: [email protected]. We received an initial reply, but obtained no further information. | |
| Risk of bias | ||
| Bias | Authors' judgement | Support for judgement |
| Random sequence generation (selection bias) | Low risk | Computer‐generated randomisation sequence |
| Allocation concealment (selection bias) | Low risk | Sequentially‐numbered, sealed, opaque envelopes |
| Blinding of participants and personnel (performance bias) | High risk | Treatment providers and participants were unblinded. |
| Blinding of outcome assessment (detection bias) | Low risk | The statistician did not know to which group the participants were allocated. |
| Incomplete outcome data (attrition bias) | Low risk | There were under 5% of participants with incomplete outcome data. |
| Selective reporting (reporting bias) | High risk | The trial did not report ICU complications as stated in the protocol. |
| For‐profit bias | High risk | Financial support came from the public Foundation Nutrition 2000Plus, APSI‐ICU quality funds of the Geneva University Hospital, Internal Service Resources of the Lausanne University Hospital, and from unconditional and non‐restrictive research grants from Baxter and Fresenius Kabi, representing less than 25% of the global expenses. RT has received a research award from the academic Société Nationale Française de Gastroentérologie. The sponsors did not place any restrictions on the study design. |
| Other bias | Low risk | The trial appeared to be free of other components that could put it at risk of bias. |
| Methods | Randomised clinical trial, Germany | |
| Participants | 36 hospitalised adults with advanced colorectal carcinoma, at nutritional risk due to trialist indication Male:Female = 20:16 Mean age = 52 years Exclusion criteria: None stated | |
| Interventions | Experimental group: a standard 10% amino acid solution, 40% dextrose and 10% fat solution over a 10‐day period(n = 18) Control group: No intervention(n = 18) Co‐intervention: chemotherapy | |
| Outcomes | Survival (not usable), side effects of parenteral nutrition | |
| Study dates | Not stated | |
| Notes | We could obtain no contact information for the authors. | |
| Risk of bias | ||
| Bias | Authors' judgement | Support for judgement |
| Random sequence generation (selection bias) | Unclear risk | Not described |
| Allocation concealment (selection bias) | Unclear risk | Not described |
| Blinding of participants and personnel (performance bias) | Unclear risk | Not described |
| Blinding of outcome assessment (detection bias) | Unclear risk | Not described |
| Incomplete outcome data (attrition bias) | Unclear risk | The number of participants with incomplete data was not reported. |
| Selective reporting (reporting bias) | Low risk | The trial reported survival and side effects. |
| For‐profit bias | Unclear risk | It was unclear how the trial was funded. |
| Other bias | Low risk | The trial appeared to be free of other components that could put it at risk of bias. |
| Methods | Randomised clinical trial, factorial design | |
| Participants | 74 hospitalised adults undergoing liver resection, at nutritional risk due to major surgery Male:Female = 38:30 (gender not reported for six participants) Median age = 62 years Exclusion criteria: Patients with a BMI of < 18 or greater than 30 kg/m2, pre‐existing conditions limiting mobility, underlying cirrhotic liver disease, a history of liver resection, and those in whom bile duct excision and central or extended hepatectomy was planned before randomisation | |
| Interventions | Experimental group: Received 800 ml oral carbohydrate loading drink (Nutricia Preop); Nutricia Clinical Care, Trowbridge, UK) at 22.00 hrs the night before surgery and 400 ml at 06.00 hrs on the morning of surgery. In addition, they received ONS (2 cartons a day comprising 400 ml, 600 kcal, 24 g protein, Nutricia Fortisip; Nutricia Clinical Care) from the day of surgery until day 30 (n = 36) Control group: no intervention (n = 38) Co‐interventions: standard care, laxatives (only in 2 of the arms) | |
| Outcomes | Mortality, morbidity, gastric emptying, length of hospital stay | |
| Study dates | Not stated | |
| Notes | We contacted the authors on 29th April 2016 by email: [email protected]. We have not received a reply at the time of writing. | |
| Risk of bias | ||
| Bias | Authors' judgement | Support for judgement |
| Random sequence generation (selection bias) | Low risk | The trial used a random‐numbers table. |
| Allocation concealment (selection bias) | Low risk | The trial used sealed opaque envelopes. |
| Blinding of participants and personnel (performance bias) | High risk | Not blinded |
| Blinding of outcome assessment (detection bias) | High risk | Not blinded |
| Incomplete outcome data (attrition bias) | Unclear risk | There were above 5% dropouts and it was unclear how the trial accounted for missing data. |
| Selective reporting (reporting bias) | Low risk | No prepublished protocol could be obtained but the trial reported mortality and morbidity (NCT00538954). |
| For‐profit bias | High risk | Nutricia Preop (Nutricia Nutridrink in The Netherlands) and Nutricia Fortisip drinks were supplied by Nutricia Clinical Care |
| Other bias | Low risk | The trial appeared to be free of other components that could put it at risk of bias. |
| Methods | Randomised clinical trial, Denmark | |
| Participants | 58 hospitalised adults admitted for bowel resection, at nutritional risk due to major surgery Male:Female = 21:37 Mean age = 63.7 years Exclusion criteria: inflammatory bowel disease, disseminated malignant disease, previous treatment for intra‐abdominal cancer, serious cardiovascular disease (New York Heart Association angina class III and IV) diabetes mellitus, disabling mental disease, dementia or a history of alcoholic, medicine or drug abuse | |
| Interventions | The night before surgery: Experimental group 1: 12.5 g/100 ml carbohydrate (maltodextrin) drink (n = 16) Control group: No treatment (n = 8) | |
| Outcomes | Voluntary grip and quadriceps strength, body composition, pulmonary function, VAS‐score of 8 parameters of well‐being, muscle biopsies and insulin, glucagon, IGF‐1 and free fatty acids | |
| Study dates | Not stated | |
| Notes | We contacted the authors on 19th August 2015 by email: [email protected] . We received a reply. | |
| Risk of bias | ||
| Bias | Authors' judgement | Support for judgement |
| Random sequence generation (selection bias) | Unclear risk | Not described |
| Allocation concealment (selection bias) | Unclear risk | The trial used sealed envelopes for allocation but it was unclear if they were opaque. |
| Blinding of participants and personnel (performance bias) | Unclear risk | Not described |
| Blinding of outcome assessment (detection bias) | Unclear risk | Nutritional status was described as blinded, but it was unclear how the rest of the outcomes were assessed. |
| Incomplete outcome data (attrition bias) | Unclear risk | The number of dropouts exceeds 5%. The dropouts were described, but it was unclear from which group they came. |
| Selective reporting (reporting bias) | Unclear risk | No protocol could be obtained, and the trial did not report all‐cause mortality or serious adverse events. |
| For‐profit bias | Unclear risk | It was unclear how the trial was funded. |
| Other bias | Low risk | The trial appeared to be free of other components that could put it at risk of bias. |
| Methods | Randomised clinical trial, Denmark | |
| Participants | 58 hospitalised adults admitted for bowel resection, at nutritional risk due to major surgery. Male:Female = 21:37 Mean age = 63.7 years Exclusion criteria: inflammatory bowel disease, disseminated malignant disease, previous treatment for intra‐abdominal cancer, serious cardiovascular disease (New York Heart Association angina class III and IV) diabetes mellitus, disabling mental disease, dementia or a history of alcoholic, medicine or drug abuse | |
| Interventions | The night before surgery: Experimental group 1: 12.5 g/100 ml carbohydrate (maltodextrin) drink (n = 16) Control group: No treatment (n = 8) | |
| Outcomes | Voluntary grip and quadriceps strength, body composition, pulmonary function, VAS‐score of 8 parameters of well‐being, muscle biopsies and insulin, glucagon, IGF‐1 and free fatty acids | |
| Study dates | Not stated | |
| Notes | We report here group 2 vs control group. We contacted the authors on 19th August 2015 by email: [email protected] . We received a reply. | |
| Risk of bias | ||
| Bias | Authors' judgement | Support for judgement |
| Random sequence generation (selection bias) | Unclear risk | Not described |
| Allocation concealment (selection bias) | Unclear risk | The trial used sealed envelopes for allocation but it was unclear if they were opaque |
| Blinding of participants and personnel (performance bias) | Unclear risk | There was no description of blinding of participants and personnel. |
| Blinding of outcome assessment (detection bias) | Unclear risk | Nutritional status was described as blinded, but it was unclear how the rest of the outcomes were assessed. |
| Incomplete outcome data (attrition bias) | Unclear risk | The number of dropouts exceeds 5%. The dropouts were described, but it was unclear from which group they came. |
| Selective reporting (reporting bias) | Unclear risk | No protocol could be obtained, and the trial did not report all‐cause mortality or serious adverse events. |
| For‐profit bias | Unclear risk | It was unclear how the trial was funded. |
| Other bias | Low risk | The trial appeared to be free of other components that could put it at risk of bias. |
| Methods | Randomised clinical trial, USA | |
| Participants | 28 hospitalised adults with burns > 50% of total body surface area, at nutritional risk due to trauma Mean age = 36 years | |
| Interventions | Experimental group: supplementary TPN (n = 13) Co‐interventions: peripheral intravenous fluids to meet fluid requirements | |
| Outcomes | Caloric intake, immune function, liver function, serum albumin, mortality | |
| Study dates | Not stated | |
| Notes | We contacted the authors on 19th August 2015 by email: [email protected]. We received no reply. | |
| Risk of bias | ||
| Bias | Authors' judgement | Support for judgement |
| Random sequence generation (selection bias) | Unclear risk | Not described |
| Allocation concealment (selection bias) | Unclear risk | Not described |
| Blinding of participants and personnel (performance bias) | Unclear risk | Not described |
| Blinding of outcome assessment (detection bias) | Unclear risk | Not described |
| Incomplete outcome data (attrition bias) | Unclear risk | The number of participants with incomplete data was not reported. |
| Selective reporting (reporting bias) | Unclear risk | No protocol could be obtained, and the trial did not report all‐cause mortality or serious adverse events. |
| For‐profit bias | Unclear risk | It was unclear how the trial was funded. |
| Other bias | Low risk | The trial appeared to be free of other components that could put it at risk of bias. |
| Methods | Randomised clinical trial, UK | |
| Participants | 18 hospitalised adults admitted for localised colorectal carcinoma, at nutritional risk due to major surgery Male:Female = not stated Mean age = 72 years | |
| Interventions | Experimental group: 20 hours of intravenous nutrition. Amino acids 1.25 g/kg body weight and 25 kcal/kg body weight (40% dextrose and 60% lipid)(n = 9) Co‐interventions: Vitamins and electrolytes + low‐residue diet given days 2 and 3 before surgery | |
| Outcomes | Tumour protein synthesis rate | |
| Study dates | Not stated | |
| Notes | We contacted the authors on 19th August 2015 by email: [email protected] . We received no reply. | |
| Risk of bias | ||
| Bias | Authors' judgement | Support for judgement |
| Random sequence generation (selection bias) | Unclear risk | Not described |
| Allocation concealment (selection bias) | Unclear risk | Not described |
| Blinding of participants and personnel (performance bias) | Unclear risk | Not described |
| Blinding of outcome assessment (detection bias) | Unclear risk | Not described |
| Incomplete outcome data (attrition bias) | Low risk | There were below 5% dropouts. |
| Selective reporting (reporting bias) | Unclear risk | No protocol could be obtained and the trial did not report all‐cause mortality or serious adverse events. |
| For‐profit bias | High risk | "We thank the Wellcome Trust, Grampian Health Board, Scottish Hospital Endowment Research Trust and Nestec Ltd." The trial was supported by a company that might have an interest in a given result. |
| Other bias | Low risk | The trial appeared to be free of other components that could put it at risk of bias. |
| Methods | Randomised clinical trial, UK | |
| Participants | 592 hospitalised adults admitted to 3 Medicine for the Elderly wards, at nutritional risk due to being frail elderly Male:Female = 219:373 Mean age = 82 years Exclusion criteria: unable to take food orally (e.g. unconscious, severe dysphagia), those not expected to survive the current admission, those who had discharge planned within 4 days, and those who were readmitted and had already participated in the trial | |
| Interventions | Experimental group: This group received additional nutritional care in the form of feeding support from a trained healthcare assistant (HCA), which began as soon as the participant was randomised. The health assistants helped in the following ways: 1. Identified reduced food intake and other risk factors for malnutrition and planned care to resolve these problems. 2. Encouraged and enabled participants in feeding and supported the ward staff in this role. 3. Offered snacks and drinks throughout the day.(n = 292) Co‐interventions: prescribed medical and nutritional therapy | |
| Outcomes | Mortality in hospital, infection rate, intravenous or subcutaneous fluids or both, length of hospital stay | |
| Study dates | Not stated | |
| Notes | We contacted the authors in September 2015 by email: [email protected]. We received a reply with the caloric intake. | |
| Risk of bias | ||
| Bias | Authors' judgement | Support for judgement |
| Random sequence generation (selection bias) | Low risk | Prepared by an independent group |
| Allocation concealment (selection bias) | Low risk | The randomisation code was concealed using sealed envelopes. |
| Blinding of participants and personnel (performance bias) | High risk | Not possible to blind |
| Blinding of outcome assessment (detection bias) | High risk | The trial stated that the researcher in charge of outcome assessment was not blinded. |
| Incomplete outcome data (attrition bias) | Unclear risk | The analysis was on an intention‐to‐ treat basis, but the method was not further described. There were many drop‐outs described. |
| Selective reporting (reporting bias) | Unclear risk | No protocol was found, but the study reported all‐cause mortality (while hospitalised). |
| For‐profit bias | Low risk | The trial was funded by the NHS. |
| Other bias | Low risk | The trial appeared to be free of other components that could put it at risk of bias. |
| Methods | Randomised clinical trial, USA | |
| Participants | 46 hospitalised multitrauma adults having an injury severity score (ISS) > 20, at nutritional risk due to being being multitrauma patient. Male:Female = unclear Mean age = 41 years Exclusion criteria: Not described | |
| Interventions | Experimental group: Enteral nutrition within 24 hours of injury(n = 22) | |
| Outcomes | Mortality, IL6, CRP, pneumonia | |
| Study dates | Not stated | |
| Notes | There was an additional group which did not fit our inclusion criteria. | |
| Risk of bias | ||
| Bias | Authors' judgement | Support for judgement |
| Random sequence generation (selection bias) | Unclear risk | Not described |
| Allocation concealment (selection bias) | Unclear risk | Not described |
| Blinding of participants and personnel (performance bias) | Unclear risk | Not described |
| Blinding of outcome assessment (detection bias) | Unclear risk | Not described |
| Incomplete outcome data (attrition bias) | Unclear risk | Not described |
| Selective reporting (reporting bias) | Unclear risk | No protocol could be obtained, and the trial did not report on serious adverse events (only pneumonia). |
| For‐profit bias | Unclear risk | It was unclear how the trial was funded. |
| Other bias | Low risk | The trial appeared to be free of other components that could put it at risk of bias. |
| Methods | Randomised clinical trial, Denmark | |
| Participants | 102 hospitalised adults undergoing surgery due to colorectal cancer, at nutritional risk due to major surgery Male:Female = not described Mean age = not reported. Exclusion criteria: Previous cancer diagnosis and hormonal disorders | |
| Interventions | Experimental group: Received TPN containing 4400 kcal a day, 45% fat/55% glucose, starting 3 days preoperatively and continued until 7 days post‐operation, except for the day of the operation(n = 51) Co‐interventions: Usual treatment | |
| Outcomes | Postoperative complications, mortality, length of hospital stay and weight loss | |
| Study dates | 1984‐1986 | |
| Notes | We could obtain no contact information for the authors. | |
| Risk of bias | ||
| Bias | Authors' judgement | Support for judgement |
| Random sequence generation (selection bias) | Unclear risk | Not described |
| Allocation concealment (selection bias) | Unclear risk | Not described |
| Blinding of participants and personnel (performance bias) | Unclear risk | Not described |
| Blinding of outcome assessment (detection bias) | Unclear risk | Not described |
| Incomplete outcome data (attrition bias) | Unclear risk | The pattern of dropouts was reported to be differently in the 2 intervention groups. |
| Selective reporting (reporting bias) | Low risk | No protocol available, but all‐cause mortality and serious adverse events are reported. |
| For‐profit bias | Unclear risk | It was unclear how the trial was funded. |
| Other bias | Low risk | The trial appeared to be free of other components that could put it at risk of bias. |
| Methods | Randomised clinical trial, USA | |
| Participants | 56 hospitalised adults undergoing open abdominal surgery, at nutritional risk due to major surgery Male:Female = not described Exclusion criteria: not described | |
| Interventions | Experimental group: parenteral nutrition. TPN began 72 hrs prior to surgery. At the time of surgery participants were receiving 80 cc/hr or approximately 2000 calories/day with approximately 80 g of protein equivalent, either in the form of casein hydrolysate or crystalline amino acids. Hyperalimentation was continued for a 10‐day period postoperatively or until 1500 calories were achieved by oral intake. (n = 30) Control group: Treatment as usual with blood and albumin infusions, as is routine. (n = 26) | |
| Outcomes | Mortality, complications, weight, serum albumin levels and time needed to archive full peri‐oral nutrition | |
| Study dates | Not stated | |
| Notes | We could not find any contact information for the authors. | |
| Risk of bias | ||
| Bias | Authors' judgement | Support for judgement |
| Random sequence generation (selection bias) | Low risk | Participants were randomised from a random‐numbers table. |
| Allocation concealment (selection bias) | Unclear risk | Not described |
| Blinding of participants and personnel (performance bias) | Unclear risk | Not described |
| Blinding of outcome assessment (detection bias) | Unclear risk | Not described |
| Incomplete outcome data (attrition bias) | Unclear risk | The number of participants with incomplete data was not reported. |
| Selective reporting (reporting bias) | Low risk | No protocol could be obtained, but the trial reported serious adverse events and mortality. |
| For‐profit bias | Unclear risk | It was unclear how the trial was funded. |
| Other bias | Low risk | The trial appeared to be free of other components that could put it at risk of bias. |
| Methods | Randomised clinical trial, Australia | |
| Participants | 143 hospitalised adults admitted to the geriatric ward due to falls, delirium and polypharmacy problems, at nutritional risk due to being elderly frail Male:Female = 61:82 Mean age = 83.5 Exclusion criteria: expected length of stay < 72 hrs, palliative unable to be nutritionally assessed (non‐English‐speaking, severe dementia/confusion, non‐co‐operative/refused), already seen by a dietitian during the admission (e.g. transferred from another ward) or enrolled in the study during a previous admission | |
| Interventions | Experimental group: General nutrition support. The Malnutrition Care Plan involved the modification of hospital meals (texture modification and fortification), prescription of nutrition supplements, i.e. nutrient‐dense drinks and snacks including commercial supplements, flagging for assistance with meals by ward‐based staff, education of participants and their caregivers regarding optimisation of nutrition intake and referral to other health professionals for discharge planning. The Malnutrition Care Plan was tailored to individual requirements based on the clinical dietitian’s assessment and prescription.(n = 71) Control group: Treatment as usual(n = 72) | |
| Outcomes | Weight, mortality, length of stay and cost of hospital admission | |
| Study dates | Between April 2006 and September 2006 | |
| Notes | We contacted the authors on 9th June 2015 by email: [email protected]. We received no reply. | |
| Risk of bias | ||
| Bias | Authors' judgement | Support for judgement |
| Random sequence generation (selection bias) | Low risk | Participants were randomised by computerised random‐number generator. |
| Allocation concealment (selection bias) | Unclear risk | Not described |
| Blinding of participants and personnel (performance bias) | High risk | Participants and personnel could not be blinded. |
| Blinding of outcome assessment (detection bias) | Unclear risk | Not described |
| Incomplete outcome data (attrition bias) | Unclear risk | The number of participants with incomplete data was not reported. |
| Selective reporting (reporting bias) | Unclear risk | No protocol could be obtained and the trial did not report serious adverse events. |
| For‐profit bias | High risk | The trial was funded by the Gut Foundation (Randwick, Australia) and funded by Pharmatel Fresenius Kabi Pty Ltd. |
| Other bias | Low risk | The trial appeared to be free of other components that could put it at risk of bias. |
| Methods | Randomised clinical trial, the Netherlands | |
| Participants | 103 hospitalised adults admitted for hip fracture and PO‐score > 8, at nutritional risk due to being frail elderly Male:Female = 19:84 Mean age = 81 years | |
| Interventions | Experimental group: 400 ml high‐protein nutritional supplement enriched with arginine, zinc and antioxidants with energy: 500 kcal, 40 g of protein (n = 51) Control group: 400 ml placebo (non‐caloric, water‐based drink only sweeteners, colourants and flavourings) Look and taste of the supplements were not exactly identical, but were given in similar, blinded packages to mask the differences. Participants received 400 ml daily between regular meals of either the study or placebo supplement starting immediately postoperatively for a period of 4 weeks or until discharge. (n = 52) Co‐intervention: regular diet (oral) | |
| Outcomes | Incidence of pressure ulcers and maximum wound size | |
| Study dates | Between April 1998 and December 1999 | |
| Notes | We contacted the authors by Linkedin. We received an initial response but no further response. | |
| Risk of bias | ||
| Bias | Authors' judgement | Support for judgement |
| Random sequence generation (selection bias) | Unclear risk | Not described |
| Allocation concealment (selection bias) | Unclear risk | Not described |
| Blinding of participants and personnel (performance bias) | Low risk | The control group received a placebo drink. |
| Blinding of outcome assessment (detection bias) | Unclear risk | It was unclear how the outcome assessment was performed. |
| Incomplete outcome data (attrition bias) | Low risk | There were below 5% dropouts and participants with incomplete data. |
| Selective reporting (reporting bias) | Unclear risk | No protocol could be obtained, and the trial did not report all‐cause mortality or serious adverse events. |
| For‐profit bias | High risk | The trial was funded by a company that might have conflict of interest (Numico). |
| Other bias | Low risk | The trial appeared to be free of other components that could put it at risk of bias. |
| Methods | Randomised clinical trial, Taiwan | |
| Participants | 80 hospitalised adults admitted for colon resection due to colorectal cancer, at nutritional risk due to major surgery Male:Female = 44:36 Mean age = 61.6 years Exclusion criteria: previous gastric resection, previous vagotomy, and active peptic ulcer | |
| Interventions | Experimental group 1: Received enteral nasogastric feeding, started from 500 kcal/day, and if tolerated increased to 1500 kcal/day, as well as Osmolite HN (protein: 4.2 g, fat: 3.5 g, carbohydrate: 13.4 g)/100 kcal (n = 20) Experimental group 3: Received enteral nasogastric feeding, started from 500 kcal/day, and if tolerated increased to 1500 kcal/day, as well as AlitraQ (protein: 4.2 g, fat: 2 .1 g, carbohydrate: 18.2 g)/100 kcal. (n = 20) Control group: No oral intake for a week(n = 20) | |
| Outcomes | Change of intragastric pH after surgery and change of intragastric pH after tube‐feeding | |
| Study dates | April 1997 to February 1998 | |
| Notes | Same trial as Hsu 2000b and Hsu 2000c with the results from experimental group 1 vs control. We contacted the authors on 13th December 2015 by email: [email protected]. We received no reply. | |
| Risk of bias | ||
| Bias | Authors' judgement | Support for judgement |
| Random sequence generation (selection bias) | Unclear risk | Not described |
| Allocation concealment (selection bias) | Unclear risk | Not described |
| Blinding of participants and personnel (performance bias) | Unclear risk | Not described |
| Blinding of outcome assessment (detection bias) | Unclear risk | Not described |
| Incomplete outcome data (attrition bias) | Unclear risk | The number of participants with incomplete data was not reported. |
| Selective reporting (reporting bias) | Unclear risk | The trial did not properly describe mortality,or serious adverse events. |
| For‐profit bias | Unclear risk | It was unclear how the trial was funded. |
| Other bias | Low risk | The trial appeared to be free of other components that could put it at risk of bias. |
| Methods | Randomised clinical trial, Taiwan | |
| Participants | 80 hospitalised adults admitted for colon resection due to colorectal cancer, at nutritional risk due to major surgery. Male:Female = 44:36 Mean age = 61.6 years Exclusion criteria: previous gastric resection, previous vagotomy, and active peptic ulcer | |
| Interventions | Experimental group 1: Received enteral nasogastric feeding, started from 500 kcal/day, and if tolerated increased to 1500 kcal/day, as well as Osmolite HN (protein: 4.2 g, fat: 3.5 g, carbohydrate: 13.4 g)/100 kcal(n = 20) Experimental group 3: Received enteral nasogastric feeding, started from 500 kcal/day, and if tolerated increased to 1500 kcal/day, as well as AlitraQ (protein: 4.2 g, fat: 2.1 g, carbohydrate: 18.2 g)/100 kcal(n = 20) Control group: No oral intake for a week (n = 20) | |
| Outcomes | Change of intragastric pH after surgery and change of intragastric pH after tube‐feeding | |
| Study dates | April 1997 to February 1998 | |
| Notes | Same trial as Hsu 2000a and Hsu 200c with the results from experimental group 2 vs control. We contacted the authors on 13th December 2015 by email: [email protected]. We received no reply. | |
| Risk of bias | ||
| Bias | Authors' judgement | Support for judgement |
| Random sequence generation (selection bias) | Unclear risk | Not described |
| Allocation concealment (selection bias) | Unclear risk | Not described |
| Blinding of participants and personnel (performance bias) | Unclear risk | Not described |
| Blinding of outcome assessment (detection bias) | Unclear risk | Not described |
| Incomplete outcome data (attrition bias) | Unclear risk | The number of participants with incomplete data was not reported. |
| Selective reporting (reporting bias) | Unclear risk | The trial did not properly describe mortality, or serious adverse events. |
| For‐profit bias | Unclear risk | It was unclear how the trial was funded. |
| Other bias | Low risk | The trial appeared to be free of other components that could put it at risk of bias. |
| Methods | Randomised clinical trial, Taiwan | |
| Participants | 80 hospitalised adults admitted for colon resection due to colorectal cancer, at nutritional risk due to major surgery Male:Female = 44:36 Mean age = 61.6 years Exclusion criteria: previous gastric resection, previous vagotomy, and active peptic ulcer | |
| Interventions | Experimental group 1: Received enteral nasogastric feeding, started from 500 kcal/day, and if tolerated increased to 1500 kcal/day, as well as Osmolite HN (protein: 4.2 g, fat: 3.5 g, carbohydrate: 13.4 g)/100 kcal(n = 20) Experimental group 3: Received enteral nasogastric feeding, started from 500 kcal/day, and if tolerated increased to 1500 kcal/day, as well as AlitraQ (protein: 4.2 g, fat: 2.1 g, carbohydrate: 18.2 g)/100 kcal(n = 20) Control group: No oral intake for a week(n = 20) | |
| Outcomes | Change of intragastric pH after surgery and change of intragastric pH after tube‐feeding | |
| Study dates | April 1997 to February 1998 | |
| Notes | Same trial as Hsu 2000a and Hsu 200b with the results from experimental group 3 vs control. We contacted the authors on 13th December 2015 by email: [email protected]. We received no reply. | |
| Risk of bias | ||
| Bias | Authors' judgement | Support for judgement |
| Random sequence generation (selection bias) | Unclear risk | Not described |
| Allocation concealment (selection bias) | Unclear risk | Not described |
| Blinding of participants and personnel (performance bias) | Unclear risk | Not described |
| Blinding of outcome assessment (detection bias) | Unclear risk | Not described |
| Incomplete outcome data (attrition bias) | Unclear risk | The number of participants with incomplete data was not reported. |
| Selective reporting (reporting bias) | Unclear risk | The trial did not properly describe mortality, or serious adverse events. |
| For‐profit bias | Unclear risk | It was unclear how the trial was funded. |
| Other bias | Low risk | The trial appeared to be free of other components that could put it at risk of bias. |
| Methods | Randomised clinical trial, USA | |
| Participants | 40 hospitalised adults admitted for 2‐stage anterior and posterior spinal reconstructive surgery, at nutritional risk due to major surgery Male:Female = 9:31 Mean age = 50.5 Exclusion criteria: Poorly‐controlled diabetes or had other medical contraindications | |
| Interventions | Experimental group: TPN through a subclavian Hone catheter. It was started on the 1st postoperative day at 40 ml/hr and increased until calculated nutritional needs were achieved. Weaning began when they could consume 50% of their daily requirements orally. (n = 20) Control group: Standard intravenous fluids (n = 20) | |
| Outcomes | Operative time, blood loss, transfusion requirements, all complications, length of hospital stay, albumin, pre‐albumin, weight, triceps skinfold, total lymphocyte count | |
| Study dates | May 1994 to June 1997 | |
| Notes | We contacted the authors on 23rd August 2015 by email: [email protected], and obtained additional information. | |
| Risk of bias | ||
| Bias | Authors' judgement | Support for judgement |
| Random sequence generation (selection bias) | Low risk | The trial used a random‐number list for the sequence generation. |
| Allocation concealment (selection bias) | Unclear risk | The trial was described as randomised, but it was unclear how the allocation was concealed. |
| Blinding of participants and personnel (performance bias) | High risk | Only the experimental group had placement of a catheter. |
| Blinding of outcome assessment (detection bias) | Unclear risk | It was unclear how the outcome was assessed. |
| Incomplete outcome data (attrition bias) | High risk | 1 of the participants was transferred from the experimental group to the control group due to not receiving the intervention. There was also over 5% dropouts not accounted for with proper methodology. |
| Selective reporting (reporting bias) | Unclear risk | No protocol could be obtained, and the trial did not report all‐cause mortality or serious adverse events properly. |
| For‐profit bias | Unclear risk | It was unclear how the trial was funded. |
| Other bias | Low risk | The trial appeared to be free of other components that could put it at risk of bias. |
| Methods | Randomised clinical trial, India | |
| Participants | 212 hospitalised adults admitted within 36 hours to either the medical or the surgical wards, and who were diagnosed with moderate or severe malnutrition based on the modified Subjective Global Assessment were eligible for inclusion. The participants were at nutritional risk due to being malnourished according to SGA. Male:Female = 115:92 (5 participants not included in this assessment) Mean age = 40 years Exclusion criteria: being less than 6 weeks post‐partum,active tuberculosis, acute hepatitis B or C, or HIV, diabetes type I and II, dementia, brain metastases, active malignancy, severe renal or liver failure, burn injury covering ≥ 15% of the body, clinically significant ascites, severe oedema, eating disorders or psychological conditions that might interfere with dietary intake, severe nausea, dysphagia, vomiting, active gastritis and gastrointestinal bleeding. Other exclusion criteria included taking progestational agents, steroids and growth hormone. | |
| Interventions | Experimental group: 2 servings of ONS a day for 12 weeks. The ONS was a commercially‐available powder product (Ensure; Abbott Healthcare Private Limited, Mumbai, India). For this study, the ONS was packaged in single serving sachets (53 g each) and labelled as clinical study product. When given twice daily, the ONS provided 432 kcal, 16 g of high‐quality protein, 60 g of carbohydrate, 14 g of fat and 28 micronutrients. (n = 106) Co‐interventions: 3 sessions of dietary counselling administered at baseline, weeks 4 and 8. During the hospital stay, participants from both groups consumed hospital‐prepared foods as prescribed by the dietitians. | |
| Outcomes | Weight, BMI, modified SGA score, pre‐albumin, albumin, haemoglobin, total protein and C‐reactive protein, changes in dietary intake and functionality using hand‐grip strength | |
| Study dates | Not stated | |
| Notes | The participants started the intervention during hospitalisation but received some of the intervention as outpatients. We only used the assessment at 4 weeks, due to the nature of the intervention. We contacted the author on 08th February 2016 by email: [email protected]. We received an initial reply but no further information. | |
| Risk of bias | ||
| Bias | Authors' judgement | Support for judgement |
| Random sequence generation (selection bias) | Low risk | Randomisation was performed using SAS. |
| Allocation concealment (selection bias) | Low risk | The envelopes were described as sealed and opaque. |
| Blinding of participants and personnel (performance bias) | High risk | The oral supplements were labelled as study supplement. |
| Blinding of outcome assessment (detection bias) | Unclear risk | Not described |
| Incomplete outcome data (attrition bias) | High risk | There were > 5% dropouts and the trial did not use proper methodology to account for the missing data for participants. |
| Selective reporting (reporting bias) | Low risk | The trial reported the outcomes in the pre‐published protocol (NCT01641770). |
| For‐profit bias | High risk | |
| Other bias | Low risk | |
| Methods | Randomised clinical trial, Taiwan | |
| Participants | 24 hospitalised adults undergoing choledocholithotomy, at nutritional risk according to the trialist Male:Female = 11:13 Mean age = 51.5 years Exclusion criteria: displayed prominent jaundice, sepsis or complicated medical problems | |
| Interventions | Experimental group: Enteral feeding (hospital blenderised diet consisting of 17% protein, 33% fat and 50% carbohydrate) through a tube on 1st postoperative day until the 4th day. (n = 12) Co‐interventions: Blenderised diet for additionally 4 days | |
| Outcomes | Daily intake/output and nitrogen balance, middle arm circumference, triceps skinfold, creatinine‐height index, liver function, serum albumin, pre‐albumin, transferrin, total lymphocyte count | |
| Study dates | Not stated | |
| Notes | We contacted the authors on 19th August 2015 by email: [email protected]. We received no reply. | |
| Risk of bias | ||
| Bias | Authors' judgement | Support for judgement |
| Random sequence generation (selection bias) | Unclear risk | The trial was described as being randomised, but it was unclear how the sequence was generated. |
| Allocation concealment (selection bias) | Unclear risk | The trial was described as being randomised, but it was unclear how the allocation was concealed. |
| Blinding of participants and personnel (performance bias) | Unclear risk | Not described |
| Blinding of outcome assessment (detection bias) | Unclear risk | Not described |
| Incomplete outcome data (attrition bias) | Unclear risk | The number of participants with incomplete data was not reported. |
| Selective reporting (reporting bias) | Unclear risk | No protocol could be obtained, but the trial did not report on all‐cause mortality and serious adverse events. |
| For‐profit bias | Unclear risk | It was unclear how the trial was funded. |
| Other bias | Low risk | The trial appeared to be free of other components that could put it at risk of bias. |
| Methods | Randomised clinical trial, USA | |
| Participants | 13 hospitalised adults undergoing abdominal surgery, at nutritional risk due to major abdominal surgery Male:Female = not stated Mean age = not stated Exclusion criteria: diabetes or steroid medications | |
| Interventions | Experimental group: TPN (30 nonprotein kcal/kg/day (34% fat as Intralipid), and 1.27 g protein as Aminosyn/kg/day (0.20 gmN/kg/day)) for 1 week(n = 6) Control group: Regular hospital diet (28.2 non‐protein kcal/kg/day (34% fat), and 1.25 g protein/kg/day (0.20 g N/kg/day))(n = 7) | |
| Outcomes | Brush‐border amino acid and glucose transport activity | |
| Study dates | Not stated | |
| Notes | We could obtain no contact information for the authors. | |
| Risk of bias | ||
| Bias | Authors' judgement | Support for judgement |
| Random sequence generation (selection bias) | Unclear risk | Not described |
| Allocation concealment (selection bias) | Unclear risk | Not described |
| Blinding of participants and personnel (performance bias) | Unclear risk | Not described |
| Blinding of outcome assessment (detection bias) | Unclear risk | Not described |
| Incomplete outcome data (attrition bias) | Unclear risk | The number of participants with incomplete data was not reported. |
| Selective reporting (reporting bias) | Unclear risk | There were no protocol, and the trial did not report on all‐cause mortality or serious adverse events. |
| For‐profit bias | Low risk | It was funded by an NIH grant CA45327 and a grant from the Veterans Administration Merit Review Board. (Dr. Souba). |
| Other bias | Low risk | The trial appeared to be free of other components that could put it at risk of bias. |
| Methods | Randomised clinical trial, Sweden | |
| Participants | 12 hospitalised adults undergoing surgery of the upper gastrointestinal tract, at nutritional risk due to major surgery Male:Female = 7:5 Mean age = 64 years Exclusion criteria: diabetes or steroid medications | |
| Interventions | Experimental group: Parenteral nutrition: TPN was supplied as an all‐in‐one bag (0.16 gN · kg−1 of body weight · day−1 (30 kcal · kg−1 of body weight · day−1); Kabiven® Perifer; Fresenius Kabi(n = 6) Control group: Placebo (saline)(n = 6) Infusions started between 16.00 and 17.00 hours on the day before the operation, and continued at a constant rate until muscle biopsies were taken from the rectus abdominis muscles directly after the induction of anaesthesia (15 – 16 hrs later) | |
| Outcomes | Levels of amino acids and substrates in peripheral blood, formation of 4E‐BPI‐eIF4E and eIF4G‐eIF4E complexes, 4E‐BPI phosphorylation, p70S6K phosphorylation | |
| Study dates | Not stated | |
| Notes | We contacted authors about risk of bias details on 6th September 2015 by email: [email protected]. We received additional information on randomisation sequence, blinding and incomplete outcome data. | |
| Risk of bias | ||
| Bias | Authors' judgement | Support for judgement |
| Random sequence generation (selection bias) | Low risk | Randomisation was done after the participant was recruited to the study by the responsible physician. Randomisation was done by a computer algorithm based on age, sex, cancer (type of cancer)/no cancer, height, weight, % weight loss (compared to pre‐disease weight). |
| Allocation concealment (selection bias) | Unclear risk | Not described |
| Blinding of participants and personnel (performance bias) | Low risk | Participants were blinded as the control group received placebo. |
| Blinding of outcome assessment (detection bias) | High risk | Blinding of outcome assessment was not performed. |
| Incomplete outcome data (attrition bias) | Low risk | There were no dropouts and complete data for all 12 participants. |
| Selective reporting (reporting bias) | Unclear risk | No protocol could be obtained and the trial did not report on all‐cause mortality or serious adverse events. |
| For‐profit bias | Low risk | The study was, in part, supported by grants from the Swedish Cancer Society (2014), the Swedish Research Council (08712), Tore Nilson Foundation, Assar |
| Other bias | Low risk | The trial appeared to be free of other components that could put it at risk of bias. |
| Methods | Randomised clinical trial, Japan | |
| Participants | 36 hospitalised adults with chronic liver disease and oesophageal and gastric varices, at nutritional risk defined by trialist Male:Female = 29:7 Mean age: 65.9 years Exclusion criteria: Ascites and renal failure | |
| Interventions | Experimental group: Oral supplement consisting of a 200 kcal CalorieMate Jelly(n = 18) | |
| Outcomes | Physical symptoms (thirst, light‐headedness, nausea, headache, palpitation and cold sweat) and mental symptoms(hunger, hypodynamia, fatigue, poor thinking, poor concentration, irritability) | |
| Study dates | Not stated | |
| Notes | The authors were contacted on 9.12.15 by email: [email protected]‐u.ac.jp. We received no reply. | |
| Risk of bias | ||
| Bias | Authors' judgement | Support for judgement |
| Random sequence generation (selection bias) | Unclear risk | Not described |
| Allocation concealment (selection bias) | Unclear risk | Not described |
| Blinding of participants and personnel (performance bias) | High risk | Participants were not blinded. |
| Blinding of outcome assessment (detection bias) | Low risk | Endoscopists were blinded. |
| Incomplete outcome data (attrition bias) | Low risk | No dropouts |
| Selective reporting (reporting bias) | Unclear risk | No protocol could be obtained and the trial did not report on all‐cause mortality or serious adverse event. |
| For‐profit bias | Low risk | The study was supported, in part, by a Grant‐in‐Aid for Young Scientists (B) (No.22790874 to T.K.) and a Grant‐in‐Aid for Scientific Research (C)(No. 21590865 to M.S.) from the Ministry of Education, Culture, Sports, Science and Technology of Japan, and by Health and Labour Sciences Research Grants for Research on Hepatis from the Ministry of Health, Labour and Welfare of Japan. |
| Other bias | Low risk | The trial appeared to be free of other components that could put it at risk of bias. |
| Methods | Randomised clinical trial, Germany | |
| Participants | 44 hospitalised adults undergoing major surgery and metabolically healthy, in need of ICU, at nutritional risk due to major surgery and iCU. Male:Female = 30:14 Mean age = 61.6 | |
| Interventions | Experimental group 1: Parenteral nutrition (3% amino acid solution) for 4 days(n = 17) Experimental group 2: Parenteral nutrition (carbohydrate and amino acid solution) for 4 days(n = 17) Control group: Saline solution only(n = 10) | |
| Outcomes | Mortality, glucose, insulin, lactate, betahydroxybuturat, glycerin and fatty acids, protein, creatinine | |
| Study dates | Not stated | |
| Notes | Same trial as Jauch 1995b with the results from experimental group 1 vs control. We contacted the authors on 13th December 2015 by email: Karl‐[email protected]‐muenchen.de. We received no reply. | |
| Risk of bias | ||
| Bias | Authors' judgement | Support for judgement |
| Random sequence generation (selection bias) | Unclear risk | Not described |
| Allocation concealment (selection bias) | Unclear risk | Not described |
| Blinding of participants and personnel (performance bias) | Unclear risk | Not described |
| Blinding of outcome assessment (detection bias) | Unclear risk | Not described |
| Incomplete outcome data (attrition bias) | Unclear risk | The amount of dropouts was not clearly stated. |
| Selective reporting (reporting bias) | Unclear risk | No protocol could be obtained, and the trial did not report on serious adverse events. |
| For‐profit bias | Unclear risk | It was unclear how the trial was funded. |
| Other bias | Low risk | The trial appeared to be free of other components that could put it at risk of bias. |
| Methods | Randomised clinical trial, Germany | |
| Participants | 44 hospitalised adults undergoing major surgery and metabolically healthy, in need of ICU, at nutritional risk due to major surgery and ICU. Male:Female = 30:14 Mean age = 61.6 | |
| Interventions | Experimental group 1: Parenteral nutrition (3% amino acid solution) for 4 days(n = 17) Experimental group 2: Parenteral nutrition (carbohydrate and amino acid solution) for 4 days(n = 17) Control group: Saline solution only(n = 10) | |
| Outcomes | Mortality, glucose, insulin, lactate, betahydroxybuturat, glycerin and fatty acids, protein, creatinine | |
| Study dates | Not stated | |
| Notes | Same trial as Jauch 1995a with the results from experimental group 2 vs control | |
| Risk of bias | ||
| Bias | Authors' judgement | Support for judgement |
| Random sequence generation (selection bias) | Unclear risk | Not described |
| Allocation concealment (selection bias) | Unclear risk | Not described |
| Blinding of participants and personnel (performance bias) | Unclear risk | Not described |
| Blinding of outcome assessment (detection bias) | Unclear risk | Not described |
| Incomplete outcome data (attrition bias) | Unclear risk | The amount of dropouts was not clearly stated. |
| Selective reporting (reporting bias) | Unclear risk | No protocol could be obtained, and the trial did not report on serious adverse events. |
| For‐profit bias | Unclear risk | It was unclear how the trial was funded. |
| Other bias | Low risk | The trial appeared to be free of other components that could put it at risk of bias. |
| Methods | Randomised clinical trial, Denmark | |
| Participants | 20 hospitalised adults admitted for rectal cancer, at nutritional risk due to major surgery. Male:Female = 12:8 Mean age = 61 years | |
| Interventions | Experimental group: Parenteral nutrition (40 ‐ 50 kcal/kg/day and 1.5 ‐ 2 g protein/kg/day) for 2 days preoperatively and 6 days postoperatively (n = 10) Control group: Standard i.v. fluids for 2 days preoperatively and 6 days postoperatively(n = 10) | |
| Outcomes | Complications, weight change, length of hospital stay, nitrogen balance | |
| Study dates | Not stated | |
| Notes | ||
| Risk of bias | ||
| Bias | Authors' judgement | Support for judgement |
| Random sequence generation (selection bias) | Unclear risk | The trial was described as being randomised, but it was unclear how the sequence was generated. |
| Allocation concealment (selection bias) | Unclear risk | The trial was described as being randomised, but it was unclear how the allocation was concealed. |
| Blinding of participants and personnel (performance bias) | High risk | The trial was described as being unblinded. |
| Blinding of outcome assessment (detection bias) | Unclear risk | Not described |
| Incomplete outcome data (attrition bias) | Unclear risk | The number of dropouts was unclear. |
| Selective reporting (reporting bias) | Unclear risk | No protocol could be obtained, and the trial did not report on all‐cause mortality. |
| For‐profit bias | Unclear risk | It was unclear how the trial was funded. |
| Other bias | Low risk | The trial appeared to be free of other components that could put it at risk of bias |
| Methods | Randomised clinical trial, China | |
| Participants | 41 hospitalised adults undergoing surgery of the digestive tract, at nutritional risk due to major surgery Male:Female = 23:7 (gender not reported for 11 participants) Mean age = 58.35 years Exclusion criteria: metabolic diseases | |
| Interventions | Experimental group: Participant was infused with saline 500 ml by using jejunum or gastrostomy nutrient catheter at 24 hrs after surgery, and followed by Nutrison Fibre 100 ml with the speed of 50 ml/hr, and 150 ml with the speed of 80 ‐ 120 ml/hr after 72 hrs if there were no adverse reactions. It was maintained at this amount and gradually reduced the amount of peripheral venous transfusion.(n = 22) Control group: conventional infusion therapy after surgery(n = 10) Co‐interventions: oral feeding after recovery of intestinal peristalsis | |
| Outcomes | TRF, Pre‐albumin, albumin, haemoglobin, thrombin time, GPT, AKP, Total bilirubin, conjugated bilirubin, BUN,Cr, Blood glucose, gastrin, weight | |
| Study dates | Not stated | |
| Notes | We contacted the author by phone 3 times, but he did not have time to answer any questions. | |
| Risk of bias | ||
| Bias | Authors' judgement | Support for judgement |
| Random sequence generation (selection bias) | Unclear risk | Not described |
| Allocation concealment (selection bias) | Unclear risk | Not described |
| Blinding of participants and personnel (performance bias) | High risk | Participants and personnel were not blinded. |
| Blinding of outcome assessment (detection bias) | Unclear risk | The procedure of blinding was insufficiently described. |
| Incomplete outcome data (attrition bias) | Unclear risk | The numbers and reasons for withdrawals and dropouts were not clearly stated. |
| Selective reporting (reporting bias) | Unclear risk | No protocol could be obtained and the trial dit not report on all‐cause mortality. |
| For‐profit bias | Unclear risk | It was unclear how the trial was funded. |
| Other bias | Low risk | The trial appeared to be free of other components that could put it at risk of bias. |
| Methods | Randomised clinical trial, China | |
| Participants | 69 hospitalised adults undergoing gastrointestinal surgery, at nutritional risk due to major surgery Male:Female = 46:23 Mean age = 49.3 years Exclusion criteria: Unclear | |
| Interventions | Experimental group 1: Enteral and parenteral nutrition: Enteral nutrition with Supportan (Sino‐Swed Pharmaceutical Corp. Ltd) by using nasogastric tube. (Energy 543 kJ, protein 5.85 g, fat 7.2 g, carbohydrate 10.4 g, sugar 3.6 g, fatty acid 0.3 g, dietary fiber 1.3 g, mineral substance) (n = 22) Experimental group 2: Parenteral nutrition with Novamin (N 8.5%, amino acid injection, Sino‐Swed Pharmaceutical Corp. Ltd), non‐protein calorie supported by glucose and fat emulsion (Sino‐Swed Pharmaceutical Corp. Ltd) on a one‐to‐one ratio, plus electrolytes, vitamin and microelement, total 3 L were infused through peripheral or central vein within 10 hrs. (Energy 120 kJ/kg/day, N 0.15 g/kg/day; NPC:N = 150:1)(n = 23) Control group: Conventional infusion with glucose (50 ‐ 100 g/L), total energy 250 ‐ 300 kJ/day(n = 22) | |
| Outcomes | Morbidity (rate), change of weight, length of stay, time to recovery of gastrointestinal function | |
| Study dates | Not stated | |
| Notes | We could obtain no contact information for the author. | |
| Risk of bias | ||
| Bias | Authors' judgement | Support for judgement |
| Random sequence generation (selection bias) | Unclear risk | Not described |
| Allocation concealment (selection bias) | Unclear risk | Not described |
| Blinding of participants and personnel (performance bias) | High risk | Participants and personnel were not blinded. |
| Blinding of outcome assessment (detection bias) | Unclear risk | Not described |
| Incomplete outcome data (attrition bias) | Unclear risk | The number of participants with incomplete data was not reported. |
| Selective reporting (reporting bias) | Unclear risk | No protocol could be obtained and the trial did not report on all‐cause mortality. |
| For‐profit bias | Unclear risk | It was unclear how the trial was funded. |
| Other bias | Low risk | The trial appeared to be free of other components that could put it at risk of bias. |
| Methods | Randomised clinical trial, China | |
| Participants | 69 hospitalised adults undergoing gastrointestinal surgery, at nutritional risk due to major surgery Male:Female = 46:23 Mean age = 49.3 years Exclusion criteria: Unclear | |
| Interventions | Experimental group 1: Enteral and parenteral nutrition: Enteral nutrition with Supportan (Sino‐Swed Pharmaceutical Corp. Ltd) by using nasogastric tube. (Energy 543 kJ, protein 5.85 g, fat 7.2 g, carbohydrate 10.4 g, sugar 3.6 g, fatty acid 0.3 g, dietary fibre 1.3 g, mineral substance) (n = 22) Experimental group 2: Parenteral nutrition with Novamin (N 8.5% amino acid injection, Sino‐Swed Pharmaceutical Corp. Ltd), non‐protein calorie supported by glucose and fat emulsion (Sino‐Swed Pharmaceutical Corp. Ltd) on a one‐to‐one ratio, plus electrolytes, vitamin and microelement, total 3L were infused through peripheral or central vein within 10 hrs. (Energy 120 kJ/kg/day, N 0.15 g/kg/day; NPC:N = 150:1)(n = 23) Control group: conventional infusion with glucose (50 ‐ 100 g/L), total energy 250 ‐ 300 kJ/day(n = 22) | |
| Outcomes | Morbidity (rate), change of weight, length of stay, time for recovery of gastrointestinal function | |
| Study dates | Not stated | |
| Notes | We could obtain no contact information for the authors. | |
| Risk of bias | ||
| Bias | Authors' judgement | Support for judgement |
| Random sequence generation (selection bias) | Unclear risk | Not described |
| Allocation concealment (selection bias) | Unclear risk | Not described |
| Blinding of participants and personnel (performance bias) | High risk | Participants and personnel were not blinded. |
| Blinding of outcome assessment (detection bias) | Unclear risk | Not described |
| Incomplete outcome data (attrition bias) | Unclear risk | The number of participants with incomplete data was not reported. |
| Selective reporting (reporting bias) | Unclear risk | No protocol could be obtained and the trial did not report on all‐cause mortality. |
| For‐profit bias | Unclear risk | It was unclear how the trial was funded. |
| Other bias | Low risk | The trial appeared to be free of other components that could put it at risk of bias. |
| Methods | Randomised clinical trial, Spain | |
| Participants | 75 hospitalised adults, at nutritional risk due to low levels of albumin or body weight below 95% of ideal weight Male:Female = not stated Mean age = not stated Exclusion: none stated | |
| Interventions | Experimental group 1: 59.1 g amino acids + 694 non‐protein calories (glucose)(n = 20) Experimental group 2: 57.9 g amino acids + 600 non‐protein calories (glycerol)(n = 20) Experimental group 3: 56.6 g amino acids + 590 non‐protein calories (sorbitol‐xylitol)(n = 20) Control group: Conventional infusion therapy (5% glucose)(n = 15) | |
| Outcomes | All‐cause mortality, complications, plasma concentrations | |
| Study dates | Not stated | |
| Notes | Same as Jimenez 1995b and Jimenez 1995c. We only report experimental group 1 vs control here. We contacted the authors on 13th December 2015 by email: [email protected]. We received no reply. | |
| Risk of bias | ||
| Bias | Authors' judgement | Support for judgement |
| Random sequence generation (selection bias) | Unclear risk | Not described |
| Allocation concealment (selection bias) | Unclear risk | Not described |
| Blinding of participants and personnel (performance bias) | Unclear risk | Not described |
| Blinding of outcome assessment (detection bias) | Unclear risk | Not described |
| Incomplete outcome data (attrition bias) | Low risk | There were no drop‐outs. |
| Selective reporting (reporting bias) | Low risk | All‐cause mortality and serious adverse events were assessed. |
| For‐profit bias | Low risk | The trial was funded by the Spanish Ministry of Health. |
| Other bias | Low risk | The trial appeared to be free of other components that could put it at risk of bias. |
| Methods | Randomised clinical trial, Spain | |
| Participants | 75 hospitalised adults, at nutritional risk due to low levels of albumin or body weight below 95% of ideal weight | |
| Interventions | Experimental group 1: 59.1 g amino acids + 694 non‐protein calories (glucose)(n = 20) Experimental group 3: 56.6 g amino acids + 590 non‐protein calories (sorbitol‐xylitol)(n = 20) Control group: Conventional infusion therapy (5% glucose)(n = 15) | |
| Outcomes | All‐cause mortality, complications, plasma concentrations | |
| Study dates | Not stated | |
| Notes | Same as Jimenez 1995a and Jimenenz 1995c. We only report experimental group 2 vs control here. We contacted the authors on 13th December 2015 by email: [email protected]. We received no reply. | |
| Risk of bias | ||
| Bias | Authors' judgement | Support for judgement |
| Random sequence generation (selection bias) | Unclear risk | Not described |
| Allocation concealment (selection bias) | Unclear risk | Not described |
| Blinding of participants and personnel (performance bias) | Unclear risk | Not described |
| Blinding of outcome assessment (detection bias) | Unclear risk | Not described |
| Incomplete outcome data (attrition bias) | Low risk | There were no drop‐outs. |
| Selective reporting (reporting bias) | Low risk | All‐cause mortality and serious adverse events were assessed. |
| For‐profit bias | Low risk | The trial was funded by the Spanish Ministry of Health. |
| Other bias | Low risk | The trial appeared to be free of other components that could put it at risk of bias. |
| Methods | Randomised clinical trial, Spain | |
| Participants | 75 hospitalised adults, at nutritional risk due to low levels of albumin or body weight below 95% of ideal weight | |
| Interventions | Experimental group 1: 59.1 g amino acids + 694 non‐protein calories (glucose)(n = 20) Experimental group 3: 56.6 g amino acids + 590 non‐protein calories (sorbitol‐xylitol)(n = 20) Control group: Conventional infusion therapy (5% glucose)(n = 15) | |
| Outcomes | All‐cause mortality, complications, plasma concentrations | |
| Study dates | Not stated | |
| Notes | Same as Jimenez 1995a and Jimenez 1995b. We only report experimental group 3 vs control here. We contacted the authors on 13th December 2015 by email: [email protected]. We received no reply. | |
| Risk of bias | ||
| Bias | Authors' judgement | Support for judgement |
| Random sequence generation (selection bias) | Unclear risk | Not described |
| Allocation concealment (selection bias) | Unclear risk | Not described |
| Blinding of participants and personnel (performance bias) | Unclear risk | Not described |
| Blinding of outcome assessment (detection bias) | Unclear risk | Not described |
| Incomplete outcome data (attrition bias) | Low risk | There were no drop‐outs. |
| Selective reporting (reporting bias) | Low risk | All‐cause mortality and serious adverse events were assessed. |
| For‐profit bias | Unclear risk | The trial was funded by the Spanish Ministry of Health. |
| Other bias | Low risk | The trial appeared to be free of other components that could put it at risk of bias. |
| Methods | Randomised clinical trial, China | |
| Participants | 92 hospitalised adults diagnosed with adenocarcinoma of the GI tract deemed operable by a consultant surgeon, at nutritional risk due to serum albumin < 30 g/L or a recent weight loss of > 10% body weight Male:Female = 58:34 Mean age = 57 years Exclusion:congestive heart failure, obstructive lung disease, metabolic diseases, clinically‐evident cirrhotic liver disease or renal disease | |
| Interventions | Experimental group 1: Parenteral nutrition: Preoperative PN provided 35 kcal/kg a day. Non‐protein caloric content was divided between dextrose (60%) and lipids (40%) (Intralipid; Kabi Pharmacia, Sweden). Crystalline amino acids (7% Vamin; Kabi Pharmacia, Sweden) were provided at a calorie:nitrogen ratio of 150:1 g of nitrogen (0.23 g of nitrogen a kilogram a day). Each day, the nutrient mixture, which was prepared in ethyl vinyl acetate bags, was infused through a subclavian polyurethane catheter over 24 hrs by an infusion pump. The catheter was inserted using a strict aseptic procedure in the operating room.(n = 23) Control group 1: No intervention(n = 23) | |
| Outcomes | Weight, complications, postoperative mortality and nutritional parametres including serum albumin (g/L), serum transferrin (g/L), nitrogen balance (g/L) | |
| Study dates | Not stated | |
| Notes | We could obtain no contact information for the authors. Same trial as Jin 1999b but with the experimental and control group that did not received chemotherapy. | |
| Risk of bias | ||
| Bias | Authors' judgement | Support for judgement |
| Random sequence generation (selection bias) | Unclear risk | Not described |
| Allocation concealment (selection bias) | Unclear risk | Not described |
| Blinding of participants and personnel (performance bias) | High risk | Participants and personnel were not blinded. |
| Blinding of outcome assessment (detection bias) | High risk | Outcome assessors were not blinded. |
| Incomplete outcome data (attrition bias) | Low risk | All participants completed the study. |
| Selective reporting (reporting bias) | Low risk | The protocol could not be obtained, but the trial reported on serious adverse events and mortality. |
| For‐profit bias | Unclear risk | It was unclear how the trial was funded. |
| Other bias | Low risk | The trial appeared to be free of other components that could put it at risk of bias. |
| Methods | Randomised clinical trial, China | |
| Participants | 92 hospitalised adults diagnosed with adenocarcinoma of the GI tract deemed operable by a consultant surgeon, at nutritional risk due to serum albumin < 30 g/L or a recent weight loss of > 10% body weight Male:Female = 58:34 Mean age = 57 years Exclusion: congestive heart failure, obstructive lung disease, metabolic diseases, clinically‐evident cirrhotic liver disease or renal disease | |
| Interventions | Experimental group 2: Parenteral nutrition: Preoperative PN provided 35 kcal/kg a day. Non‐protein caloric content was divided between dextrose (60%) and lipids (40%) (Intralipid; Kabi Pharmacia, Sweden). Crystalline amino acids (7% Vamin; Kabi Pharmacia, Sweden) were provided at a calorie:nitrogen ratio of 150:1 g of nitrogen (0.23 g of nitrogen a kilogram a day). Each day, the nutrient mixture, which was prepared in ethyl vinyl acetate bags, was infused through a subclavian polyurethane catheter over 24 hrs by an infusion pump. The catheter was inserted using a strict aseptic procedure in the operating room.(n = 23) Control group 2: No intervention (n = 23) Co‐interventions: chemotherapy | |
| Outcomes | Weight, complications, postoperative mortality and nutritional parametres including serum albumin (g/L), serum transferrin (g/L), nitrogen balance (g/L) | |
| Study dates | Not stated | |
| Notes | Same trial as Jin 1999a but with the experimental and control group that received chemotherapy as a co‐intervention. | |
| Risk of bias | ||
| Bias | Authors' judgement | Support for judgement |
| Random sequence generation (selection bias) | Unclear risk | Not described |
| Allocation concealment (selection bias) | Unclear risk | Not described |
| Blinding of participants and personnel (performance bias) | High risk | Participants and personnel were not blinded. |
| Blinding of outcome assessment (detection bias) | High risk | Outcome assessors were not blinded. |
| Incomplete outcome data (attrition bias) | Low risk | All participants completed the study. |
| Selective reporting (reporting bias) | Low risk | The protocol could not be obtained, but the trial reported on serious adverse events and mortality. |
| For‐profit bias | Low risk | The study received the support of the general surgical department and the image cytometry department of Zhong Shan Hospital at the Shanghai Medical University. This research was supported by a grant from the International Clinical Epidemiology Network. |
| Other bias | Low risk | The trial appeared to be free of other components that could put it at risk of bias. |
| Methods | Randomised clinical trial (stratified for age), Denmark | |
| Participants | 212 hospitalised adults, at nutritional risk due to NRS‐2012 Mean age = 62.2 years | |
| Interventions | Experimental group: A specialised nutritional team (nurse and dietitian) attended the participants and staff for motivation, detailed a nutritional plan, assured delivery of prescribed food and gave advice on enteral or parenteral nutrition when appropriate.(n = 108) Control group: Standard regimen used in the department(n = 104) | |
| Outcomes | All‐cause mortality, complications, designated length of hospital stay, quality of life | |
| Study dates | August 1st 2001 to March 1st 2002 | |
| Notes | We contacted the authors on 13th December 2012 by email: [email protected]. We received no reply. | |
| Risk of bias | ||
| Bias | Authors' judgement | Support for judgement |
| Random sequence generation (selection bias) | Low risk | The sequence was generated by a random‐numbers system. |
| Allocation concealment (selection bias) | Low risk | Sequentially‐numbered sealed opaque envelopes |
| Blinding of participants and personnel (performance bias) | High risk | The nurses and participants were not blinded. |
| Blinding of outcome assessment (detection bias) | High risk | Even though the investigator assessing the outcome was blinded, the nurses who reported the outcomes were not. |
| Incomplete outcome data (attrition bias) | High risk | There were above 5% dropouts, and the trial did not use proper intention‐to‐treat analysis. |
| Selective reporting (reporting bias) | Low risk | Both all‐cause mortality and serious adverse events were reported. |
| For‐profit bias | Low risk | The trial was not funded by any company that had an interest in the outcome. |
| Other bias | Low risk | The trial appeared to be free of other components that could put it at risk of bias. |
| Methods | Randomised clinical trial, South Korea | |
| Participants | 60 elderly hospitalised adults older than 65 years and admitted to the hospital for hip fracture surgery, at nutritional risk due to being frail elderly Male:female = not stated Mean age = 80.7 years | |
| Interventions | Experimental group: ONSs, trace elements supplements and dietetic counselling for 2 weeks postoperatively (n = 30) Control group: usual care (n = 30) | |
| Outcomes | MNA, hand‐grip strength | |
| Study dates | Not stated | |
| Notes | Only abstract. We could obtain no contact information for the authors. | |
| Risk of bias | ||
| Bias | Authors' judgement | Support for judgement |
| Random sequence generation (selection bias) | Unclear risk | Not described |
| Allocation concealment (selection bias) | Unclear risk | Not described |
| Blinding of participants and personnel (performance bias) | Unclear risk | Not described |
| Blinding of outcome assessment (detection bias) | Unclear risk | Not described |
| Incomplete outcome data (attrition bias) | Unclear risk | The number of participants with incomplete data was not reported. |
| Selective reporting (reporting bias) | Unclear risk | No protocol could be obtained, and the trial did not report on all‐cause mortality or serious adverse events. |
| For‐profit bias | Unclear risk | It was unclear how the trial was funded. |
| Other bias | Low risk | The trial appeared to be free of other components that could put it at risk of bias. |
| Methods | Randomised clinical trial, India | |
| Participants | 100 hospitalised adults undergoing open abdominal surgery, at nutritional risk due major surgery Male:Female = 79:21 Mean age = 36 years Exclusion criteria: dementia, diabetes, renal failure, or hepatic failure | |
| Interventions | Experimental group: Early Enteral Nutrition: Participants were given a hospital kitchen‐prepared feed through the nasojejunal tube 24 hrs after surgery. The 500 ml of feed contained 375 ml milk, 12.5 g sugar, 12.5 g butter, 12.5 g starch, 125 ml rice water, and half an egg. The feed provided 500 kcal energy, 16.66 g protein, 43.5 g carbohydrates, and 30 g fat. The feed was started at a rate of 50 ml/hr in the 1st 6 hrs and gradually increased to 100 ml/hr by the 3rd postoperative day. The nutritional goal was to deliver 35 ‐ 40 kcal/kg/day and 1.5 ‐ 2.0 g protein/kg/day. The nasogastric tube was taken out when gastric aspirate was minimal or nil and when participants started taking 2 L of feed a day, usually by the 4th or 5th postoperative day. (n = 50) Control group: Treatment as usual(n = 50) | |
| Outcomes | All cause‐mortality, hand‐grip strength, complications | |
| Study dates | April 2000 to March 2002 | |
| Notes | We contacted the authors on 9th June 2015 by email: [email protected]. We received no reply. | |
| Risk of bias | ||
| Bias | Authors' judgement | Support for judgement |
| Random sequence generation (selection bias) | Unclear risk | Not described |
| Allocation concealment (selection bias) | Unclear risk | Not described |
| Blinding of participants and personnel (performance bias) | High risk | Participants and personnel were not blinded. |
| Blinding of outcome assessment (detection bias) | Unclear risk | The method of blinding of outcome assessment was not described. |
| Incomplete outcome data (attrition bias) | Low risk | All participants completed the study. |
| Selective reporting (reporting bias) | Low risk | No protocol available, but serious adverse events and all‐cause mortality were reported. |
| For‐profit bias | Unclear risk | It was unclear how the trial was funded. |
| Other bias | Low risk | The trial appeared to be free of other components that could put it at risk of bias. |
| Methods | Randomised clinical trial, Japan | |
| Participants | 29 hospitalised adults with cirrhosis, at nutritional risk due to the trialist indication Male:Female = 18:11 Mean age = 63.2 years | |
| Interventions | Experimental group: Supplement 200 kcal(n = 18) | |
| Outcomes | Self‐rating questionnaire (physical symptoms and mental symptoms), biochemical parameters, CT or MRI. | |
| Study dates | April 2005 to July 2006 | |
| Notes | We contacted the authors on 19th August 2015 by email: [email protected]‐u.ac.jp . We received no reply. | |
| Risk of bias | ||
| Bias | Authors' judgement | Support for judgement |
| Random sequence generation (selection bias) | Unclear risk | Not described |
| Allocation concealment (selection bias) | Unclear risk | Not described |
| Blinding of participants and personnel (performance bias) | Unclear risk | Not described |
| Blinding of outcome assessment (detection bias) | Unclear risk | Not described |
| Incomplete outcome data (attrition bias) | Unclear risk | The number of participants with incomplete data was not reported. |
| Selective reporting (reporting bias) | Unclear risk | No protocol could be obtained and the trial did not report on all‐cause mortality or serious adverse events. |
| For‐profit bias | Low risk | The trial was funded by grants from the Ministry of Education, Culture, Sports, Science and Technology, Japan, the Vehicle Racing Commemorative Foundation, Japan, and the Ishibashi Foundation for the Promotion of Science, Japan. |
| Other bias | Low risk | The trial appeared to be free of other components that could put it at risk of bias. |
| Methods | Randomised clinical trial, USA | |
| Participants | 31 hospitalised adults with alcoholic liver disease, a serum bilirubin leve1 of > 5 l pmol/L, and one of the following: albumin < 30 g/L, prothrombin time prolonged ≥ 4 seconds over control, or presence of ascites on physical examination at nutritional risk due to trialist indication Male:Female = 21:10 Mean age = 44 years Exclusion criteria (prospectively): Objection to the length of the study, refusal of nasoduodenal (ND) tube placement, continuation of gastro‐intestinal bleeding, elevation of serum creatinine level to > 221 pmol/L, and inability to give informed consent | |
| Interventions | Experimental group: Enteral nutrition. The EN provided 167 kJ/kg and 1.5 g/kg of ideal body weight protein. A constant‐infusion pump delivered the solution through an 8F ND tube. 2‐gram sodium and 1500‐mL fluid restrictions were imposed in the presence of peripheral oedema or ascites. Participants remained on a medical ward until discharge. Subsequently, they stayed in the clinical research unit for the remaining 28 days. If appetite permitted, the treatment group drank the EN after transfer.(n = 16) Control group: No intervention(n = 15) Co‐interventions: Regular diet | |
| Outcomes | The average lengths of hospital stay, incidence of diarrhoea, renal insufficiency, gastro‐intestinal bleeding, changes in anthropometrics and ascites, weight, pneumonia, improvement of encephalopathy, change in metabolic rate, calorie intake, change in functional hepatic mass, survival, lactulose requirements. Biochemical outcomes: serum albumin, serum bilirubin, antipyrine elimination, alanine amino‐transferase, aspartate aminotransferase, y‐glutamyltransferase, alkaline phosphatase, pre‐albumin, thyroid‐binding globulin, and transferring | |
| Study dates | Not stated | |
| Notes | We contacted the authors on 1st October 2015 by email: [email protected]. We received a reply. | |
| Risk of bias | ||
| Bias | Authors' judgement | Support for judgement |
| Random sequence generation (selection bias) | Low risk | A random‐number generator was used, performed by personnel not a part of the clinical phase of the study. |
| Allocation concealment (selection bias) | Low risk | The random numbers were recorded and placed into numbered, opaque envelopes. |
| Blinding of participants and personnel (performance bias) | Low risk | Investigators and participants were blinded to allocation. |
| Blinding of outcome assessment (detection bias) | High risk | Outcome assessors were not blinded. |
| Incomplete outcome data (attrition bias) | Low risk | Each group had 3 participants drop out. Clinical characteristics of dropouts were well matched to those of participants completing the trial. The dropouts did not have missing data. Data were censored at the participant's death and last‐observed data points were used. |
| Selective reporting (reporting bias) | Low risk | No protocol available, but serious adverse events and all‐cause mortality were reported. |
| For‐profit bias | High risk | The trial was supported in part by Mead Johnson Nutritional Division Inc., Evansville, Indiana, and by National Institutes of Health Grant 22209. |
| Other bias | Low risk | The trial appeared to be free of other components that could put it at risk of bias. |
| Methods | Randomised clinical trial, UK | |
| Participants | 100 hospitalised adults admitted for major abdominal surgery, at nutritional risk due to major abdominal surgery Male:female = 48:38 (gender not reported for 14) Mean age: 62.5 years | |
| Interventions | Experimental group: Standard ward diet + oral supplements (200 ml (1.5 kcal/ml and 0.05 g protein/ml)(n = 47) Control group: Standard ward diet(n = 53) | |
| Outcomes | All‐cause mortality, complications, nutritional status, anthropometrics, hand‐grip strength | |
| Study dates | Not stated | |
| Notes | We could obtain no contact information for the authors. | |
| Risk of bias | ||
| Bias | Authors' judgement | Support for judgement |
| Random sequence generation (selection bias) | Unclear risk | Not described |
| Allocation concealment (selection bias) | Unclear risk | Not described |
| Blinding of participants and personnel (performance bias) | Unclear risk | Not described |
| Blinding of outcome assessment (detection bias) | Unclear risk | Not described |
| Incomplete outcome data (attrition bias) | High risk | There were above 5% dropouts, and the trial did not use proper intention‐to‐treat analysis. |
| Selective reporting (reporting bias) | Low risk | Both all‐cause mortality, and serious adverse events were reported. |
| For‐profit bias | High risk | The trial was funded by Nutricia research, which might have a conflict of interest. |
| Other bias | Low risk | The trial appeared to be free of other components that could put it at risk of bias. |
| Methods | Randomised clinical trial, USA | |
| Participants | 24 hospitalised adults undergoing orthognathic surgery and maxillomandibular fixation, at nutritional risk due major surgery to decreased food intake Male:Female = 5:17 (gender not reported for two participants) Mean age = 25 years Exclusion criteria: Participants who showed evidence of pathologic condition or systemic disease | |
| Interventions | Experimental group: Participants were instructed to consume a minimum of 50% of their calculated caloric requirements in the form of a nutritionally‐complete liquid supplement containing 1.5 cal/ml. The supplement consisted of 14.7% of calories as protein, 32% as fat and 53.3% as carbohydrates. The intervention lasted 6 weeks by mouth.(n = 12) Control group: No intervention (n = 12) Co‐interventions: Dextrose (5%) in water and ¼ normal saline solution were administered postoperatively at a rate consistent with each participant's requirement. Everyone consumed blenderised foods. All were required to refrain from consuming any other commercial supplement or vitamin preparation. | |
| Outcomes | Weight, mid‐arm muscle circumference, triceps skinfold, creatinine height index, serum albumin, transferrin, total lymphocyte count, urinary nitrogen and creatinine, serum chemistries, caloric intake, protein and carbohydrate intake, thiamine, niacin, zinc, folic acid and riboflavin intake and length of hospital stay | |
| Study dates | Not stated | |
| Notes | We could obtain no contact information for the authors. | |
| Risk of bias | ||
| Bias | Authors' judgement | Support for judgement |
| Random sequence generation (selection bias) | Unclear risk | Not described |
| Allocation concealment (selection bias) | Unclear risk | Not described |
| Blinding of participants and personnel (performance bias) | Unclear risk | Not described |
| Blinding of outcome assessment (detection bias) | Unclear risk | Not described |
| Incomplete outcome data (attrition bias) | Low risk | There were complete data for all participants. |
| Selective reporting (reporting bias) | Unclear risk | No protocol could be obtained, and the trial did not report on all‐cause mortality or serious adverse events. |
| For‐profit bias | Unclear risk | It was unclear how the trial was funded. |
| Other bias | Low risk | The trial appeared to be free of other components that could put it at risk of bias. |
| Methods | Randomised clinical trial, USA | |
| Participants | 48 hospitalised adults with Non‐Oat cell Lung Cancer, at nutritional risk due to decreased food intake Male:Female: Not reported Exclusion criteria: 1 person was excluded due to diagnosis mesothelioma | |
| Interventions | Experimental group: Parenteral Nutrition. TPN administered by central venous catheter at > 35 ckal/kg/day. TPN was initiated 7 days before the 1st course and 2 days before the 2nd course of chemotherapy. TPN was discontinued on day 12 of each course of chemotherapy. Thus the intervention group received 19 days with the 1st course and 14 days with the 2nd. (n = 14) | |
| Outcomes | Average time of survival, white cell count/granulocyte count | |
| Study dates | Not stated | |
| Notes | We contacted the authors on 13th November 2015 by email: [email protected]. We received no reply. | |
| Risk of bias | ||
| Bias | Authors' judgement | Support for judgement |
| Random sequence generation (selection bias) | Unclear risk | Not described |
| Allocation concealment (selection bias) | Unclear risk | Not described |
| Blinding of participants and personnel (performance bias) | Unclear risk | Not described |
| Blinding of outcome assessment (detection bias) | Unclear risk | Not described |
| Incomplete outcome data (attrition bias) | Unclear risk | The number of participants with incomplete data was not reported. |
| Selective reporting (reporting bias) | Unclear risk | No protocol could be obtained, and the trial did not report on all‐cause mortality or serious adverse events. |
| For‐profit bias | Unclear risk | It was unclear how the trial was funded. |
| Other bias | Low risk | The trial appeared to be free of other components that could put it at risk of bias. |
| Methods | Randomised clinical trial, Sweden | |
| Participants | 501 adults hospitalised at the geriatric ward, at nutritional risk due to being elderly Male:Female = 190:311 Mean age = 79 years Exclusion criteria: none stated | |
| Interventions | Experimental group: 400 ml dietary supplement containing 4 g of protein, 4 g of fat and 11.8 g of carbohydrate per 100 ml. Served in the morning and in the evening (n = 250) Co‐intervention: standard ward diet (2200 kcal/day) | |
| Outcomes | Nutritional status by anthropometry, serum protein analysis, delayed hypersensitivity skin test, mortality | |
| Study dates | Not stated | |
| Notes | We contacted the authors on 22nd August 2015 by email: [email protected]. We received an initial reply but no further reply. | |
| Risk of bias | ||
| Bias | Authors' judgement | Support for judgement |
| Random sequence generation (selection bias) | Unclear risk | Not described |
| Allocation concealment (selection bias) | Unclear risk | The randomisation code was concealed using sealed envelopes but it unclear if they were opaque. |
| Blinding of participants and personnel (performance bias) | Unclear risk | Not described |
| Blinding of outcome assessment (detection bias) | Unclear risk | Not described |
| Incomplete outcome data (attrition bias) | High risk | There were above 5% dropouts, and the trial did not use proper intention‐to‐treat analysis. |
| Selective reporting (reporting bias) | Unclear risk | No protocol could be obtained, and the trial did not report on serious adverse events. |
| For‐profit bias | High risk | The trial was supported from a company that might have an interest in a given result: "Grants from the Swedish Medical Research Council (project no. 07528 and 09330). the Research Fund of the County of Östergotland, the University Hospital and the University of Linkoping, and Kabi Nutrition, Sweden,". |
| Other bias | Low risk | The trial appeared to be free of other components that could put it at risk of bias. |
| Methods | Randomised clinical trial, France | |
| Participants | 22 hospitalised adults with cirrhosis and bleeding from oesophageal varices, at nutritional risk as defined by trialists Male:Female = 17:5 Mean age = 56 years Exclusion criteria: severe liver failure (defined as a hepatorenal syndrome or end‐stage cirrhosis), hepatocellular carcinoma, severe hepatic encephalopathy, 80 years old or older | |
| Interventions | Experimental group: Enteral nutrition: Polymeric enteral diet (Dripac Sondalis, Sopharga, France) was infused by bolus administration and provided 1665 kcal/day and 71 g of protein. A constant‐infusion pump delivered each Dripac in 3 hrs, by a 10 French nasogastric feeding tube. Participants received EN from day 1 through the 2nd sclerotherapy session.(n = 12) Control group: Treatment as usual (n = 10) From day 1 through day 3, participants received nil by mouth. On day 4, all received a standard low‐sodium milk diet (800 kcal), on day 5 a mixed, warm, low‐sodium diet (1400 kcal), and on day 6 a standard low‐sodium hospital diet (1800 kcal). | |
| Outcomes | Child‐Pugh’s score, occurrence of pneumonia, presence of gastro‐intestinal bleeding or diarrhoea, amount of ascites, degree of encephalopathy, height, triceps skinfold thickness, mid‐arm muscle circumference, BMI, serum creatinine level, liver function tests, prothrombin time, serum albumin and pre‐albumin, nitrogen balance and mortality | |
| Study dates | August 1994 through August 1995 | |
| Notes | We contacted the authors on 9th June 2015 by email: victor.deledinghen@chu‐bordeaux.fr. We received an initial reply but no reply after this. | |
| Risk of bias | ||
| Bias | Authors' judgement | Support for judgement |
| Random sequence generation (selection bias) | Unclear risk | Not described |
| Allocation concealment (selection bias) | Unclear risk | Not described |
| Blinding of participants and personnel (performance bias) | High risk | Participants and personnel were not blinded. |
| Blinding of outcome assessment (detection bias) | Unclear risk | Not described |
| Incomplete outcome data (attrition bias) | Low risk | There were no dropouts. |
| Selective reporting (reporting bias) | Low risk | The protocol could not be obtained, but the trial reported on all‐cause mortality and serious adverse events. |
| For‐profit bias | Unclear risk | It was unclear how the trial was funded. |
| Other bias | Low risk | The trial appeared to be free of other components that could put it at risk of bias. |
| Methods | Randomised clinical trial, Australia | |
| Participants | 100 hospitalised adults admitted to the ICU and critically ill, at nutritional risk due to inability to take food orally Male:Female = Not reported Mean age = Not reported Exclusion criteria: No bowel sounds, nasogastric aspirates for the previous day exceeded 300 ml/24 hrs, unstable, if the enteral feeding was an unsuitable feed, diarrhoea, or major bowel resection | |
| Interventions | Experimental group: Enteral feeding. The participants received a standard isotonic feed via nasogastric tube, initially at 40 ml/hr and increased by 20 ml/hr every 12 hrs until desired caloric load was reached. Enteral feeding was temporarily ceased if the residual gastric volume (RGV) exceeded 100 ml and reattempted after 4 hours. Each intervention period lasted for 3 days. (n = 19) Control group 1: No intervention(n = 7) Co‐interventions: All participants received nitrogen and calories from supplemental parenteral nutrition during the study. Enteral nutrition for the first 3 days of the study. | |
| Outcomes | Mortality, diarrhoea, stool frequency, colonising organisms from stool culture, serum albumin concentration, RGV and gastric colonisation | |
| Study dates | Not stated | |
| Notes | We here report the experimental group that received Experimental enteral feeding for 6 days versus the group that received it only for the 1st 3 days. We contacted the authors on 1st October 2015 by email: [email protected]. We received an initial reply but no answer to our specific questions. Note that for a large amount of participants, it was not stated which group they were randomised to. | |
| Risk of bias | ||
| Bias | Authors' judgement | Support for judgement |
| Random sequence generation (selection bias) | Unclear risk | Randomisation was performed by shuffling cards and producing batches of 15 protocol sheets to be used in order. Uncertain if it was performed by an independent person not otherwise involved in the trial |
| Allocation concealment (selection bias) | Unclear risk | The trial was described as being randomised, but it was unclear how the allocation was concealed. |
| Blinding of participants and personnel (performance bias) | High risk | Participants were blinded to treatment. Treatment providers were not blinded to feeding. |
| Blinding of outcome assessment (detection bias) | High risk | Outcome assessors were not blinded. |
| Incomplete outcome data (attrition bias) | High risk | Participants who failed to complete the first 3 days of the study were not analysed further, other than to record the cause of failure. This resulted in above 5% dropouts. The trial did not use proper methodology to deal with incomplete outcome data. |
| Selective reporting (reporting bias) | Low risk | The trial reported all‐cause mortality and serious adverse events. No protocol could be found. |
| For‐profit bias | Unclear risk | It was unclear how the trial was funded. |
| Other bias | Low risk | The trial appeared to be free of other components that could put it at risk of bias. |
| Methods | Randomised clinical trial, Australia | |
| Participants | 100 hospitalised adults admitted to the ICU and critically ill, at nutritional risk due to inability to take food orally Male:Female = Not reported Mean age = approximately 55 Exclusion criteria: no bowel sounds, nasogastric aspirates for the previous day exceeded 300 ml/24 hrs, if the enteral feeding was an unsuitable feed, diarrhoea, or major bowel resection | |
| Interventions | Experimental group: Enteral feeding. The participants received a standard isotonic feed via nasogastric tube, initially at 40 ml/hr and increased by 20 ml/hr every 12 hrs until desired caloric load was reached. Enteral feeding was temporarily ceased if the residual gastric volume (RGV) exceeded 100 ml and reattempted after 4 hrs. Each intervention period lasted for 3 days. (n = 19) Control group 2: No intervention (n = 17) Co‐interventions: All participants received nitrogen and calories from supplemental parenteral nutrition during the study. | |
| Outcomes | Mortality, diarrhoea, stool frequency, colonising organisms from stool culture, serum albumin concentration, RGV and gastric colonisation | |
| Study dates | Not stated | |
| Notes | We here report the experimental group that received Experimental enteral feeding for the last 3 days versus the group that did not receive enteral nutrition. | |
| Risk of bias | ||
| Bias | Authors' judgement | Support for judgement |
| Random sequence generation (selection bias) | Unclear risk | Randomisation was performed by shuffling cards and producing batches of 15 protocol sheets to be used in order. Uncertain if it was performed by an independent person not otherwise involved in the trial. |
| Allocation concealment (selection bias) | Unclear risk | Not described |
| Blinding of participants and personnel (performance bias) | High risk | Participants were blinded to treatment. Treatment providers were not blinded to feeding. |
| Blinding of outcome assessment (detection bias) | High risk | Outcome assessors were not blinded. |
| Incomplete outcome data (attrition bias) | High risk | Participants who failed to complete the first 3 days of the study were not analysed further, other than to record the cause of failure. This resulted in above 5% dropouts. The trial did not use proper methodology to deal with incomplete outcome data. |
| Selective reporting (reporting bias) | Low risk | The trial reported all‐cause mortality and serious adverse events. No protocol could be found. |
| For‐profit bias | Unclear risk | It was unclear how the trial was funded. |
| Other bias | Low risk | The trial appeared to be free of other components that could put it at risk of bias. |
| Methods | Randomised clinical trial, China | |
| Participants | 21 hospitalised adults diagnosed with COPD and critically ill according to the following criteria: diagnosed with pulmonary heart disease, pulmonary function test is FEV1/FVC < 70%, less than 10% increase of FEVI/FVC after using bronchus spasmolytic, arterial blood gas analysis: PaO2 < 60 mmHg and (or) PaCO2 > 50 mmHg. The participants were also diagnosed with malnutrition according to following criteria: 1. referred to the multiparameter nutritional index scoring system (MNI) by Laeabn JP, considering body weight (WT); 2. triceps skinfold (TSF); 3. mid‐arm muscle circumference (MAMC); 4. creatinine increased with normal liver and kidney function, at nutritional risk according to the trialist. Male:Female = 19:2 Mean age = 68 years Exclusion criteria: asthma, neuromuscular disease, chronic gastrointestinal malabsorption, diabetes, thyroid disease and cancer | |
| Interventions | Experimental group: Parenteral nutrition: 30 Kcal/ Kg each day, nitrogen 0.20˜ 0.25g/kg by amino acid, 35%˜45% calorie by fat emulsion. Treatment course was 14 days.(n = 10) Control group: Intravenous infusion: 100˜200Kcal glucose each day for 14 days.(n = 11) Co‐interventions: Food nutrition: hospital‐made nutrition diet(protein 17%, fat 30% and carbohydrate 53%). | |
| Outcomes | Serum albumin concentration, serum TRF, pre‐albumin concentration, CHI, SFAA. | |
| Study dates | Not stated | |
| Notes | We contacted the authorby phone 3 times, but he had no time to answer. | |
| Risk of bias | ||
| Bias | Authors' judgement | Support for judgement |
| Random sequence generation (selection bias) | Unclear risk | Not described |
| Allocation concealment (selection bias) | Unclear risk | Not described |
| Blinding of participants and personnel (performance bias) | High risk | Participants and personnel were not blinded. |
| Blinding of outcome assessment (detection bias) | Unclear risk | Not described |
| Incomplete outcome data (attrition bias) | Unclear risk | The number of participants with incomplete data was not reported. |
| Selective reporting (reporting bias) | Unclear risk | No protocol could be obtained and the trial did not report on all‐cause mortality or serious adverse event. |
| For‐profit bias | Unclear risk | It was unclear how the trial was funded. |
| Other bias | Low risk | The trial appeared to be free of other components that could put it at risk of bias. |
| Methods | Randomised clinical trial, China | |
| Participants | 20 hospitalised adults undergoing resection of pancreas and duodenum, at nutritional risk due to major surgery Male:Female = 16:4 Mean age = 56 years Exclusion criteria: Unclear | |
| Interventions | Experimental group: TPN through central vein from the 1st day after surgery for 7 days. The calorie was 125.52 ˜ 146 KJ/(kg/day), of which 35% ˜ 40% was provided by 10% Interlipid and others by glucose. Nitrogen supply was 0.2 g/kg/day ) provided by 15‐HBC (Tianjin amino acid); vitamin and trace elements(SSPC) were supplied as conventional amount; water and electrolyte according to the balance of intake and output. All nutrients were mixed in an infusion bag, and distributed uniformly over 24 hrs. (n = 10) Control group: Conventional infusion: 200 g glucose calorie by 10% glucose liquid, without exogenous nitrogen supply, for 7 days(n = 10) | |
| Outcomes | Weight, triceps skinfold thickness, arm circumference, and nitrogen balance | |
| Study dates | Not stated | |
| Notes | We contacted the author by phone 3 times, but he had no time to answer. | |
| Risk of bias | ||
| Bias | Authors' judgement | Support for judgement |
| Random sequence generation (selection bias) | Unclear risk | Not described |
| Allocation concealment (selection bias) | Unclear risk | Not described |
| Blinding of participants and personnel (performance bias) | High risk | Participants and personnel were not blinded. |
| Blinding of outcome assessment (detection bias) | Unclear risk | The procedure of blinding was insufficiently described. |
| Incomplete outcome data (attrition bias) | Unclear risk | The numbers and reasons for withdrawals and dropouts were not clearly stated. |
| Selective reporting (reporting bias) | Unclear risk | No protocol could be obtained and the trial dit not report on all‐cause mortality or serious adverse events. |
| For‐profit bias | Unclear risk | It was unclear how the trial was funded. |
| Other bias | Low risk | The trial appeared to be free of other components that could put it at risk of bias. |
| Methods | Randomised clinical trial, UK | |
| Participants | 120 hospitalised adults with planned curative resection and primary anastomosis of histologically‐confirmed colorectal cancer, at nutritional risk due to weight loss > 5% over the past 3 months. Male:Female = 61:57 (gender not reported for two participants) Mean age = approximately 70 years Exclusion criteria: younger than 18 years, inability to give informed consent, frailty (unlikely to be able to mobilise immediately after the operation), participation in another trial, pregnancy, diabetes, a preoperative fasting glucose > 7 mmol/l, use of steroids or immunosuppressants, history of abnormal gastric emptying, intestinal obstruction, or concurrent parenteral or enteral nutrition | |
| Interventions | Experimental group: Group B: Received carbohydrate drinks preoperatively. On the day of surgery, 400 ml of carbohydrate supplement was given 2 hrs before surgery. The supplement consisted of carbohydrate, 50 kcal per 100 ml, 290 mOsm/kg, pH 5.0(n = 30) Group C: Received a postoperative carbohydrate drink (Fortifresh!, Numico) consisting of 50 kcal per 100 ml, 965 mOsm/kg, pH 4.2(n = 32) Group D: Received the same preoperative carbohydrate drink as group B and the same postoperative carbohydrate drink as group C(n = 31) Control group (group A): received placebo(n = 27) Co‐interventions: free fluids permitted immediately after surgery and a light diet as tolerated | |
| Outcomes | Postoperative fluid balance, energy intake, Insulin resistance, hand‐grip strength, peak expiratory flow rate, intestinal permeability, bowel function, nausea, vomiting, abdominal pain, insulin, glucose, length of postoperative hospital stay, postoperative complications (wound infection, pneumonia, diarrhoea, septicaemia, anastomotic leak, intra‐abdominal collection, intestinal obstruction, ileus, stroke/transient Ischaemic attack, thrombosis, congestive cardiac failure, myocardial infarction, renal failure) and mortality | |
| Study dates | Not stated | |
| Notes | Same trial as Lidder 2013b and Lidder 2013c. We here report group B compared with control. We contacted the authors on 11th November 2015 by email: [email protected]. We received information on hand‐grip strength, BMI and weight. | |
| Risk of bias | ||
| Bias | Authors' judgement | Support for judgement |
| Random sequence generation (selection bias) | Low risk | Randomisation codes were computer‐generated using Microsoft Excel. |
| Allocation concealment (selection bias) | Low risk | Randomisation codes were held in sealed, opaque envelopes. |
| Blinding of participants and personnel (performance bias) | Low risk | Participants and investigators were blinded to the treatment allocation. The active and placebo products were packaged identically. |
| Blinding of outcome assessment (detection bias) | Low risk | Analysis was conducted by a trialist blinded to which intervention the participants received. |
| Incomplete outcome data (attrition bias) | Low risk | There were none lost to follow‐up. |
| Selective reporting (reporting bias) | Low risk | The trial reported all‐cause mortality and serious adverse events. |
| For‐profit bias | High risk | One of the authors received grants from "Numico Research". |
| Other bias | Low risk | The trial appeared to be free of other components that could put it at risk of bias. |
| Methods | Randomised clinical trial, UK | |
| Participants | 120 hospitalised adults with planned curative resection and primary anastomosis of histologically‐confirmed colorectal cancer, at nutritional risk due to weight loss > 5% over the past 3 months Male:Female = 61:57 (gender not reported for two participants) Mean age = approximately 70 years Exclusion criteria: younger than 18 years, inability to give informed consent, frailty (unlikely to be able to mobilise immediately after the operation), participation in another trial, pregnancy, diabetes, a preoperative fasting glucose > 7 mmol/l, use of steroids or immunosuppressants, history of abnormal gastric emptying, intestinal obstruction, or concurrent parenteral or enteral nutrition | |
| Interventions | Experimental group: Oral nutrition. Group B: Received carbohydrate drinks preoperatively. On the day of surgery, 400 ml of carbohydrate supplement was given 2 hrs before surgery. The supplement consisted of carbohydrate, 50 kcal per 100 ml, 290 mOsm/kg, pH 5.0(n = 30) Group C: Received a postoperative carbohydrate drink (Fortifresh!, Numico) consisting of 50 kcal per 100 ml, 965 mOsm/kg, pH 4.2(n = 32) Group D: Received the same preoperative carbohydrate drink as group B and the same postoperative carbohydrate drink as group C(n = 31) Control group (group A): received placebo preoperatively(n = 27) Co‐interventions: Postoperatively: Polymeric nutritional supplement drink (600 ml/day) from the period immediately after their operation until discharge. The supplement consisted of 150 kcal per 100 ml, 965 mOsm/kg, pH 4.2. Free fluids permitted immediately after surgery and a light diet as tolerated | |
| Outcomes | Postoperative fluid balance, energy intake, Insulin resistance, hand‐grip strength, peak expiratory flow rate, intestinal permeability, bowel function, nausea, vomiting, abdominal pain, insulin, glucose, length of postoperative hospital stay, postoperative complications (wound infection, pneumonia, diarrhoea, septicaemia, anastomotic leak, intra‐abdominal collection, intestinal obstruction, ileus, stroke/transient Ischaemic attack, thrombosis, congestive cardiac failure, myocardial infarction, renal failure) and mortality | |
| Study dates | Not stated | |
| Notes | Same trial as Lidder 2013a and Lidder 2013c, but group C compared with control | |
| Risk of bias | ||
| Bias | Authors' judgement | Support for judgement |
| Random sequence generation (selection bias) | Low risk | Randomisation codes were computer‐generated using Microsoft Excel. |
| Allocation concealment (selection bias) | Low risk | Randomisation codes were held in sealed, opaque envelopes. |
| Blinding of participants and personnel (performance bias) | Low risk | Participants and investigators were blinded to the treatment allocation. The active and placebo products were packaged identically. |
| Blinding of outcome assessment (detection bias) | Low risk | Analysis was conducted by a trialist blinded to which intervention the participants received. |
| Incomplete outcome data (attrition bias) | Low risk | There were none lost to follow‐up. |
| Selective reporting (reporting bias) | Low risk | The trial reported all‐cause mortality and serious adverse events. |
| For‐profit bias | High risk | One of the authors received grants from "Numico Research". |
| Other bias | Low risk | The trial appeared to be free of other components that could put it at risk of bias. |
| Methods | Randomised clinical trial, UK | |
| Participants | 120 hospitalised adults with planned curative resection and primary anastomosis of histologically‐confirmed colorectal cancer, at nutritional risk due to weight loss > 5% over the past 3 months Male:Female = 61:57(gender not reported for two participants) Mean age = approximately 70 years Exclusion criteria: younger than18 years, inability to give informed consent, frailty (unlikely to be able to mobilise immediately after the operation), participation in another trial, pregnancy, diabetes, a preoperative fasting glucose > 7 mmol/l, use of steroids or immunosuppressants, history of abnormal gastric emptying, intestinal obstruction, or concurrent parenteral or enteral nutrition | |
| Interventions | Experimental group: Group B: Received carbohydrate drinks preoperatively. On the day of surgery, 400 ml of carbohydrate supplement was given 2 hrs before surgery. The supplement consisted of carbohydrate, 50 kcal per 100 ml, 290 mOsm/kg, pH 5.0(n = 30) Group C: Received a postoperative carbohydrate drink (Fortifresh!, Numico) consisting of 50 kcal per 100 ml, 965 mOsm/kg, pH 4.2(n = 32) Group D: Received the same preoperative carbohydrate drink as group B and the same postoperative carbohydrate drink as group C(n = 31) Control group (group A): Received placebo(n = 27) Co‐interventions: Free fluids permitted immediately after surgery and a light diet as tolerated | |
| Outcomes | Postoperative fluid balance, energy intake, insulin resistance, hand‐grip strength, peak expiratory flow rate, intestinal permeability, bowel function, nausea, vomiting, abdominal pain, insulin, glucose, length of postoperative hospital stay, postoperative complications (wound infection, pneumonia, diarrhoea, septicaemia, anastamotic leak, intra‐abdominal collection, intestinal obstruction, ileus, stroke/transient ischaemic attack, thrombosis, congestive cardiac failure, myocardial infarction, renal failure) and mortality | |
| Study dates | Not stated | |
| Notes | Same trial as Lidder 2013a and Lidder 2013b, but group D compared with control. We contacted the authors on 11th November 2015 by email: [email protected]. We received information on hand‐grip strength, BMI and weight. | |
| Risk of bias | ||
| Bias | Authors' judgement | Support for judgement |
| Random sequence generation (selection bias) | Low risk | Randomisation codes were computer‐generated using Microsoft Excel. |
| Allocation concealment (selection bias) | Low risk | Randomisation codes were held in sealed, opaque envelopes. |
| Blinding of participants and personnel (performance bias) | Low risk | Participantsand investigators were blinded to the treatment allocation. The active and placebo products were packaged identically. |
| Blinding of outcome assessment (detection bias) | Low risk | Analysis was conducted by a trialist blinded to which intervention the participants received. |
| Incomplete outcome data (attrition bias) | Low risk | There were none lost to follow‐up. |
| Selective reporting (reporting bias) | Low risk | The trial reported all‐cause mortality and serious adverse events. |
| For‐profit bias | High risk | One of the authors received grants from "Numico Research". |
| Other bias | Low risk | The trial appeared to be free of other components that could put it at risk of bias. |
| Methods | Randomised clinical trial, China | |
| Participants | 12 hospitalised adults undergoing radical gastrectomy for advanced gastric antrum cancer and with normal liver and kidney function, at nutritional risk due to advanced gastric cancer after radical gastrectomy Male:Female = Unclear Mean age = 55 years Exclusion criteria: metabolic diseases | |
| Interventions | Experimental group: Intravenous nutrition with 134 ± 15.9 kJ/kg (32 ± 3.8 kcal/kg) calories a day, including the use of 14‐823 Compound amino acid liquid which was produced by Changzheng pharmaceutical factory, Shanghai, as a protein stroma with a dosage of 1.23 g/kg/day).(n = 6) Control group: conventional fluid infusion with 59 ± 5.0 kJ/kg (14 ± 1.2 kcal/kg) calories a day without exogenous protein intake (n = 6) Co‐interventions: after been hospitalised, all participants were given fixed diet (1.3 g/kg protein and 121 kJ/kg (29 kcal/kg) calories) a day for a week prior to the surgery. | |
| Outcomes | The decomposition rate of total protein, creatinine, urea nitrogen, 3‐methylhistidine (3‐MN), serum CPK and change of weight | |
| Study dates | Not stated | |
| Notes | We could obtain no contact information for the authors. | |
| Risk of bias | ||
| Bias | Authors' judgement | Support for judgement |
| Random sequence generation (selection bias) | Unclear risk | Not described |
| Allocation concealment (selection bias) | Unclear risk | Not described |
| Blinding of participants and personnel (performance bias) | High risk | Participants and personnel were not blinded |
| Blinding of outcome assessment (detection bias) | Unclear risk | The procedure of blinding was insufficiently described. |
| Incomplete outcome data (attrition bias) | Unclear risk | The number of participants with incomplete data was not reported. |
| Selective reporting (reporting bias) | Unclear risk | No protocol could be obtained and the trial did not report on all‐cause mortality or serious adverse event. |
| For‐profit bias | Unclear risk | It was unclear how the trial was funded. |
| Other bias | Low risk | The trial appeared to be free of other components that could put it at risk of bias. |
| Methods | Randomised clinical trial, China | |
| Participants | 29 hospitalised adults between 60 ˜ 80 year admitted with gastrointestinal disorders, at nutritional risk due major surgery Male:Female = 17:12 Mean age = 66.2 years Exclusion criteria: Other serious diseases, besides the gastrointestinal system | |
| Interventions | Experimental group: Parenteral nutrition was given through peripheral vein or central vein in perioperative period, and ½ ˜ ⅔ dose on surgery day. The treatment course was 5 ˜ 14 days. The non‐protein calorie was given as 150% of basic energy consumption (BEE) (calculated through Harris and Benedict equation), provided by prepared nutrient solution (7 g nitrogen and 25% glucose/L, and trace elements, vitamin, electrolyte). Control group: participants were encouraged to eat food, and given fluid supplement prior to the surgery; general intravenous infusion of glucose, isotonic saline and vitamin, etc. were given after surgery. | |
| Outcomes | Plasma albumin, lymphocyte count, weight, postoperative complications | |
| Study dates | Not stated | |
| Notes | We could obtain no contact information for the authors. | |
| Risk of bias | ||
| Bias | Authors' judgement | Support for judgement |
| Random sequence generation (selection bias) | Low risk | The sequence generation was achieved using a random‐numbers table. |
| Allocation concealment (selection bias) | Unclear risk | Not described |
| Blinding of participants and personnel (performance bias) | High risk | Participants and personnel were not blinded. |
| Blinding of outcome assessment (detection bias) | Unclear risk | The procedure of blinding was insufficiently described. |
| Incomplete outcome data (attrition bias) | Unclear risk | The number of participants with incomplete data was not reported. |
| Selective reporting (reporting bias) | Unclear risk | No protocol could be obtained and the trial did not report on all‐cause mortality. |
| For‐profit bias | Unclear risk | It was unclear how the trial was funded. |
| Other bias | Low risk | The trial appeared to be free of other components that could put it at risk of bias. |
| Methods | Randomised clinical trial, China | |
| Participants | 41 hospitalised adults admitted with COPD (diagnostic criteria standard), at nutritional risk due to being elderly with COPD Male:Female = 32:6 (gender not reported for three participants) Mean age = 66 years Exclusion criteria: Unclear | |
| Interventions | Experimental group: Normal diet + nutraceutical series made by Huarui Pharmaceutical Co. Ltd. 1. 20% Intralipid 250 ml+ Soluvit 10 ml, and 2.vamin N solution 250 ml+ Addamel 10 ml ivgtt, alternating twice a week(n = 29) Control group: no intervention(n = 9) Co‐interventions: Normal diet | |
| Outcomes | Weight, circumference of the upper arm, albumin, trace elements in plasma (Fe, Cu, Zn), lung function, humoral immunity, T cells (T3, T4, T8) | |
| Study dates | Not stated | |
| Notes | We contacted the author by phone 3 times, but he had no time to answer. | |
| Risk of bias | ||
| Bias | Authors' judgement | Support for judgement |
| Random sequence generation (selection bias) | Unclear risk | Not described |
| Allocation concealment (selection bias) | Unclear risk | Not described |
| Blinding of participants and personnel (performance bias) | High risk | Participants and personnel were not blinded. |
| Blinding of outcome assessment (detection bias) | Unclear risk | The procedure of blinding was insufficiently described. |
| Incomplete outcome data (attrition bias) | Unclear risk | The number of participants with incomplete data was not reported. |
| Selective reporting (reporting bias) | Unclear risk | No protocol could be obtained and the trial did not report on all‐cause mortality or serious adverse events. |
| For‐profit bias | Unclear risk | It was unclear how the trial was funded. |
| Other bias | Low risk | The trial appeared to be free of other components that could put it at risk of bias. |
| Methods | Randomised clinical trial, China | |
| Participants | 40 hospitalised adults admitted with advanced pancreatic carcinoma by pathological diagnosis and undergoing palliative operation, at nutritional risk due to major surgery Male:Female = 25:15 Mean age = 58 years Exclusion criteria: Unclear | |
| Interventions | Experimental group: TPN: total caloric value (NPC) 20 Kcal/(kg/day), N/Q = 1 g: 125 Kcal, glucose:fat = 6:4. The average course of treatment was 11.5 days (8 ˜ 15 days). (n = 20) Control group: Routine treatment; the detailed information and the course of the treatment were unclear.(n = 20) Co‐interventions: All participants received combined chemotherapy, with a regimen of 5‐Fu + CF + MMC+DDP/EPI (5‐fluorouracil + Calcium folniate + Cisplatin or Eplrubicin) or IFN‐γ(interferon‐γ). Dosages of drugs were modified for bone marrow toxicity, stomatitis and declining performance status. After 28 days, the regimen was repeated. | |
| Outcomes | Nutritional and immunological parameters, quality of life, effects of treatment | |
| Study dates | Not stated | |
| Notes | We could obtain no contact information for the authors. | |
| Risk of bias | ||
| Bias | Authors' judgement | Support for judgement |
| Random sequence generation (selection bias) | Unclear risk | Not described |
| Allocation concealment (selection bias) | Unclear risk | Not described |
| Blinding of participants and personnel (performance bias) | High risk | Participants and personnel were not blinded. |
| Blinding of outcome assessment (detection bias) | Unclear risk | The procedure of blinding was insufficiently described. |
| Incomplete outcome data (attrition bias) | Unclear risk | The number of participants with incomplete data was not reported. |
| Selective reporting (reporting bias) | Unclear risk | No protocol could be obtained and the trial did not report on all‐cause mortality. |
| For‐profit bias | Unclear risk | It was unclear how the trial was funded. |
| Other bias | Low risk | The trial appeared to be free of other components that could put it at risk of bias. |
| Methods | Randomised clinical trial, China | |
| Participants | 48 hospitalised adults admitted with thoracolumbar vertebral tuberculosis and had received anti‐tuberculosis treatment for 4 weeks, haemoglobin > 10 g/L, and did not have abortive tuberculosis in other parts; surgical indications where the following surgery could be conducted: anterior cervical lesions removal + autogenous iliac bone graft + anterior plate internal fixation, definitely diagnosed as TB by intraoperative rapid pathological section, and continue to anti‐tuberculosis after the surgery; agreed to participate in the trial and could co‐operate with researchers. At nutritional risk due to thoracolumbar spinal tuberculosis Male:Female = 25:23 Mean age = 48.25 years Exclusion criteria: Unclear | |
| Interventions | Experimental group: Parenteral nutrition (0.2 g/kg nitrogen and 104.6 KJ/kg calorie, nitrogen comes from aminophenol, 60% non‐protein calories provided by glucose, and 40% of them are provided by fat emulsion, aminophenol preparation was 8.5% Novamin, fat emulsion was 20%, 30% Introlipid). Given on the basis of the common diet, started 7 days prior to the surgery and lasted until 7 days after the operation. It was put into 3 L sacks,and infused through the jugular vein.(n = 24) Control group: Ordinary diet was given prior to the surgery, liquid diet and intravenous fluids (glucose and saline) were started from the 1st day after the surgery, and normal diet afterwards. (n = 24) | |
| Outcomes | Weight, serum albumin, ESR | |
| Study dates | Not stated | |
| Notes | We tried and failed 3 times to contact the author by phone. | |
| Risk of bias | ||
| Bias | Authors' judgement | Support for judgement |
| Random sequence generation (selection bias) | Unclear risk | Not described |
| Allocation concealment (selection bias) | Unclear risk | Not described |
| Blinding of participants and personnel (performance bias) | High risk | Participants and personnel were not blinded. |
| Blinding of outcome assessment (detection bias) | Unclear risk | The procedure of blinding was insufficiently described. |
| Incomplete outcome data (attrition bias) | Unclear risk | The number of participants with incomplete data was not reported. |
| Selective reporting (reporting bias) | Unclear risk | No protocol could be obtained and the trial did not report on all‐cause mortality. |
| For‐profit bias | Unclear risk | It was unclear how the trial was funded. |
| Other bias | Low risk | The trial appeared to be free of other components that could put it at risk of bias. |
| Methods | Randomised clinical trial, Sweden | |
| Participants | 60 hospitalised adults undergoing elective hip fracture surgery, at nutritional risk due to being frail elderly with hip fracture Male:Female = not reported Mean age = 69 years. Exclusion criteria: endocrinologic disorders, including diabetes, and treatment with cortisone | |
| Interventions | Experimental group: a carbohydrate drink (50 kcal/100 mL; Preop, NutriciaNordica AB, Stockholm, Sweden) 800 mL in the evening before the surgery (Day 0) and 400 mL 2 hrs before entering the operating room (Day 1) (n = 20) Control group: no food or water from midnight before the surgery (n = 20) | |
| Outcomes | Stress (cortisol in plasma and urine), muscle catabolism (urinary 3‐methylhistidine), well‐being, glucose clearance and insulin sensitivity | |
| Study dates | Not stated | |
| Notes | We contacted the authors on 2nd October 2015 by email: [email protected]. We received information on randomisation, quality of life, serious adverse events. | |
| Risk of bias | ||
| Bias | Authors' judgement | Support for judgement |
| Random sequence generation (selection bias) | Unclear risk | The randomisation was not performed by an independent party. It was performed by making envelopes with the intervention to be received and these envelopes were then put into a bag. It was unclear if this unorthodox method was at low risk of bias. |
| Allocation concealment (selection bias) | Low risk | The envelopes used for randomisation are described as sealed and opaque. |
| Blinding of participants and personnel (performance bias) | High risk | The study was not blinded. |
| Blinding of outcome assessment (detection bias) | High risk | The study was not blinded. |
| Incomplete outcome data (attrition bias) | Low risk | There were 5% dropouts. |
| Selective reporting (reporting bias) | Low risk | The outcomes stated in the protocol were reported on. |
| For‐profit bias | Low risk | Supported by: Olle Engkvist Byggmästare Foundation the Stockholm County Council (Grant number 2009 – 0433). |
| Other bias | Low risk | The trial appeared to be free of other components that could put it at risk of bias. |
| Methods | Randomised clinical trial, UK | |
| Participants | 29 hospitalised adults undergoing bone marrow transplantation Male:Female = 20:9 Mean age = 69 Exclusion criteria: none stated | |
| Interventions | Experimental group: TPN as a solution of dextrose (50%), intralipid (20%), amino acid (8.5%), sodium, potassium, magnesium, SolivitoH, Vitlipid; Addamel for 14 days (n = 14) Control group: 5% dextrose solution for 14 days (n = 15) Co‐intervention: standard care including standard oral diet | |
| Outcomes | Weight, albumin, transferrin, mortality | |
| Study dates | Not stated | |
| Notes | We found no contact information for the authors. | |
| Risk of bias | ||
| Bias | Authors' judgement | Support for judgement |
| Random sequence generation (selection bias) | Unclear risk | Not described |
| Allocation concealment (selection bias) | Unclear risk | The envelopes were described as sealed but it was unclear if they were opaque. |
| Blinding of participants and personnel (performance bias) | Unclear risk | Not described |
| Blinding of outcome assessment (detection bias) | Unclear risk | Not described |
| Incomplete outcome data (attrition bias) | Unclear risk | It was unclear how many participants had incomplete outcome data |
| Selective reporting (reporting bias) | Unclear risk | The trial reports survival at 100 days but does not report complications in general terms |
| For‐profit bias | Unclear risk | It was unclear how the trial was funded |
| Other bias | Low risk | The trial appeared to be free of other components that could put it at risk of bias |
| Methods | Randomised clinical trial, China | |
| Participants | 27 hospitalised adults undergoing radical total gastrectomy (RTG) due to gastric cardia cancer with a weight loss of at least 10% during the last 3 months, at nutritional risk due to major surgery Male:Female = 18:9 Mean age = 55(E), 40(C) Exclusion criteria: Unclear | |
| Interventions | Experimental group: TPN with 35 ˜ 40 Kcal/kg calories, 0.2 g/kg nitrogen each day. 30% ˜ 40% non‐protein calorie was provided by the 10% Intralipid, 60% to 70% of them was provided by glucose. The course of the treatment was unclear. (n = 17) Control group: partial parenteral nutrition with 15 ˜ 20 kcal/kg calories provided by glucose, and 0 ˜ 0.1 g/kg nitrogen each day. The course of the treatment was unclear. (n = 10) | |
| Outcomes | NK cell activity,T lymphocyte and its subsets (CD3+, CD4+, CD8+). | |
| Study dates | Not stated | |
| Notes | We tried to contact the author by phone 3 times, but the author was too busy to answer. | |
| Risk of bias | ||
| Bias | Authors' judgement | Support for judgement |
| Random sequence generation (selection bias) | Unclear risk | Not described |
| Allocation concealment (selection bias) | Unclear risk | Not described |
| Blinding of participants and personnel (performance bias) | High risk | Participants and personnel were not blinded. |
| Blinding of outcome assessment (detection bias) | Unclear risk | The procedure of blinding was insufficiently described. |
| Incomplete outcome data (attrition bias) | Unclear risk | The number of participants with incomplete data was not reported. |
| Selective reporting (reporting bias) | Unclear risk | No protocol could be obtained and the trial did not report on all‐cause mortality or serious adverse events. |
| For‐profit bias | Unclear risk | It was unclear how the trial was funded. |
| Other bias | Low risk | The trial appeared to be free of other components that could put it at risk of bias. |
| Methods | Randomised clinical trial, China | |
| Participants | 127 hospitalised adults admitted due to hip fracture surgery within 14 days of fracture and serum albumin levels < 38 g/l as well as moderately malnourished, at nutritional risk due to being frail elderly Male:Female = not stated Mean age = not stated Exclusion criteria: none stated | |
| Interventions | Experimental group: ONS 3 times a day (100 ml between meals and 200 ml as evening snack). Each 200 ml (389 kcal, 17 g protein, 18 g fat, 40 g CHO) for 28 days (n = 63) Control group: No intervention(n = 64) Co‐interventions: Standard hospital diet | |
| Outcomes | Weight, serum albumin, pre‐albumin, total protein, suture status and functional recovery status | |
| Study dates | Not stated | |
| Notes | We could obtain no contact information for the authors. | |
| Risk of bias | ||
| Bias | Authors' judgement | Support for judgement |
| Random sequence generation (selection bias) | Unclear risk | Not described |
| Allocation concealment (selection bias) | Unclear risk | Not described |
| Blinding of participants and personnel (performance bias) | Unclear risk | Not described |
| Blinding of outcome assessment (detection bias) | Unclear risk | Not described |
| Incomplete outcome data (attrition bias) | Unclear risk | The reasons for dropouts were unclear. |
| Selective reporting (reporting bias) | Unclear risk | No protocol could be obtained, and the trial did not report on all‐cause mortality or serious adverse events. |
| For‐profit bias | Unclear risk | It was unclear how the trial was funded. |
| Other bias | Low risk | The trial appeared to be free of other components that could put it at risk of bias. |
| Methods | Randomised clinical trial, China | |
| Participants | 60 hospitalised adults diagnosed with acute exacerbation of COPD, at nutritional risk due to trialist indication Male:Female = Unclear Mean age = Unclear Exclusion criteria: Malignant tumour, gastro‐intestinal bleeding, intestinal obstruction, gastroenteritis, severe haemodynamic instability, severe liver and kidney function, hyperthyroidism, diabetes, tuberculosis | |
| Interventions | Experimental group: A deep venous catheter was adopted for nutritional support. Amino acid was provided by 8.5% novamin, fat was provided by 20% medium long chain fat emulsion. Fat and glucose accounted for 50% of the energy. Supplement water‐soluble vitamins, fat‐soluble vitamins and micro elements were given each day. (n = 30) Control group: no intervention(n = 30) Co‐interventions: placement of nasogastric tube and started feeding at an amount of 20 ml/h nutrition by pumping. Residual gastric volume was checked every 4 hrs, and the feeding speed was increased with 20 ml/h every 8 hrs if residual gastric volume was below 200 ml and no abdominal distention, or diarrhoea occurred. It was continued until target quantity. The speed was suspended to give nutrition and assessed after 4 hrs if the gastric residual was above 200 ml or abdominal distension and diarrhoea occurred. Instead was chosen Nutrison Fibre (a balanced EN mixed suspension,with total protein fibre type, containing a variety of dietary fibre,16% protein, 35% fat and 49% carbohydrate, energy density of 6.276 kJ/ml,and calorie/nitrogen ratio of 548.1 kJ:lg) as nutraceutical. | |
| Outcomes | Urine nitrogen, nitrogen balance, the former protein, transferrin before and 7 days after treatment, 7‐day and 28‐day offline success rate, 28‐day incidence of ventilator‐associated pneumonia (VAP) and mortality at 28 days | |
| Study dates | Not stated | |
| Notes | We tried but failed to contact the authorsby phone. | |
| Risk of bias | ||
| Bias | Authors' judgement | Support for judgement |
| Random sequence generation (selection bias) | Low risk | The sequence generation was achieved using a random‐numbers table. |
| Allocation concealment (selection bias) | Unclear risk | Not described |
| Blinding of participants and personnel (performance bias) | High risk | Participants and personnel were not blinded. |
| Blinding of outcome assessment (detection bias) | Unclear risk | The procedure of blinding was insufficiently described. |
| Incomplete outcome data (attrition bias) | Unclear risk | The number of participants with incomplete data was not reported. |
| Selective reporting (reporting bias) | Unclear risk | No protocol could be obtained and the trial did not report on all‐cause mortality or serious adverse event. |
| For‐profit bias | Unclear risk | It was unclear how the trial was funded. |
| Other bias | Low risk | The trial appeared to be free of other components that could put it at risk of bias. |
| Methods | Randomised clinical trial, Spain | |
| Participants | 24 hospitalised adults undergoing elective gastroenterologic surgery, at nutritional risk due to undergoing major surgery Male:Female = not stated Mean age = not stated (between 30 ‐ 80) Exclusion criteria: no kidney or liver disease, no peritoneal carcinomatosis or known metastasis, no malnutrition (normal albumin and transthyretin, normal BMI, no weight loss greater than 10% in the last 3 months) and no metabolic disease | |
| Interventions | Experimental group: was given 3 different formulas of parenteral nutrition Group 2: 5% glucose, 30 g/L aminoacids(n = 6) Group 3: 6.7% carbohydrates, 30 g/L aminoacids, 16.6 g/L fat(n = 6) Group 4: 10% carbohydrates, 45 g/L amino acids, 44.4 g/L fat(n = 6) Control group: 5% glucose (n = 6) | |
| Outcomes | Whole body protein, nitrogen balance | |
| Study dates | Not stated | |
| Notes | We contacted the authors on 13th July 2016 by email: [email protected]. We received no reply. | |
| Risk of bias | ||
| Bias | Authors' judgement | Support for judgement |
| Random sequence generation (selection bias) | Low risk | Random‐numbers table |
| Allocation concealment (selection bias) | Unclear risk | Not described |
| Blinding of participants and personnel (performance bias) | Low risk | Coded black infusion bags |
| Blinding of outcome assessment (detection bias) | Unclear risk | Not described |
| Incomplete outcome data (attrition bias) | Unclear risk | The number of participants with incomplete data was not reported. |
| Selective reporting (reporting bias) | Unclear risk | No protocol could be obtained and the trial did not report mortality or serious adverse events. |
| For‐profit bias | Low risk | "This study was supported by the Spanish Ministry of Health Grant FIS 97/ 0932.". |
| Other bias | Low risk | The trial appeared to be free of other components that could put it at risk of bias. |
| Methods | Randomised clinical trial, UK | |
| Participants | 52 hospitalised adults undergoing elective major gastrointestinal surgery, at nutritional risk due to major gastrointestinal surgery Male:Female = 20:32 Mean age = 65 years Exclusion criteria: dementia, major concurrent metabolic problems, such as uncontrolled diabetes, advanced liver disease, or uraemia, and those requiring emergency surgery | |
| Interventions | Experimental group: Oral Dietary Supplements for at least 7 days Oral dietary supplements were available in 200‐mL cartons (Fortisip, Nutricia Ltd., Towbridge, Wiltshire, UK), in a variety of flavours providing 1.5 kcal, 0.05 g protein, and 0.18 g carbohydrate per mL. A fruit‐flavored supplement (Fortijuice, Nutricia Ltd.) was available as an alternative, providing 1.25 kcal, 0.025 g protein, and 0.285 g carbohydrate per mL. Participants were instructed to drink the supplements in addition to and not in place of their normal diet and were encouraged to take a minimum of 2 cartons daily. They were advised to drink only the volume of supplement they felt able to tolerate. (n = 27) Co‐interventions: Normal diet | |
| Outcomes | Nutritional status, voluntary food intake, weight loss, serum albumin, morbidity and mortality, anxiety and depression, postoperative activity levels, hand‐grip strenght, midarm circumference, triceps skinfold thickness and BMI | |
| Study dates | Not stated | |
| Notes | We include only the inpatient part of the trial. We contacted the author on 30th June 2015 by email: [email protected]. We received information on financial support and randomisation. | |
| Risk of bias | ||
| Bias | Authors' judgement | Support for judgement |
| Random sequence generation (selection bias) | Low risk | Randomisation was done by a random‐number sequence. |
| Allocation concealment (selection bias) | Low risk | Sealed envelopes were used. |
| Blinding of participants and personnel (performance bias) | High risk | Described as unblinded |
| Blinding of outcome assessment (detection bias) | High risk | Described as unblinded |
| Incomplete outcome data (attrition bias) | Unclear risk | The amount of dropouts was unclear. |
| Selective reporting (reporting bias) | Low risk | No protocol published, but the trial reported all‐cause mortality and serious adverse events. |
| For‐profit bias | Low risk | No financial support. |
| Other bias | Low risk | The trial appeared to be free of other components that could put it at risk of bias. |
| Methods | Randomised clinical trial, USA | |
| Participants | 18 hospitalised adults admitted following motor vehicle accidents, at nutritional risk due to trauma | |
| Interventions | Experimental group: intravenous hyperalimentation for at least 7 days(n = 9) Control group: no intravenous hyperalimentation (n = 9) | |
| Outcomes | Chemokinesis, chemotaxis | |
| Study dates | Not stated | |
| Notes | We could obtain no contact information for the authors. | |
| Risk of bias | ||
| Bias | Authors' judgement | Support for judgement |
| Random sequence generation (selection bias) | Unclear risk | Not described |
| Allocation concealment (selection bias) | Unclear risk | Not described |
| Blinding of participants and personnel (performance bias) | Unclear risk | Not described |
| Blinding of outcome assessment (detection bias) | Unclear risk | Not described |
| Incomplete outcome data (attrition bias) | Unclear risk | The number of participants with incomplete data was not reported. |
| Selective reporting (reporting bias) | Unclear risk | No protocol could be obtained, and the trial did not report on all‐cause mortality or serious adverse events. |
| For‐profit bias | Unclear risk | It was unclear how the trial was funded. |
| Other bias | Low risk | The trial appeared to be free of other components that could put it at risk of bias. |
| Methods | Randomised clinical trial, India | |
| Participants | 200 hospitalised adults undergoing surgical intervention for peritonitis following perforation of the gut, at nutritional risk due to major surgery Male:Female = 159:41 Mean age = 37 years Exclusion criteria: Undergoing ileostomy. | |
| Interventions | Experimental group: Early Enteral Nutrition (through a naso‐gastric tube) from the 2nd postoperative day 100 grams of a balanced diet formula (containing proteins, fats, carbohydrates, vitamins, minerals and fibre) dissolved in 500 ml of gram dry weight (GDW) 5% (600 Calories) was given slowly at the rate of 50 ml/hr by an intravenous drip set connected to a nasogastric tube. Participants received another 300 ‐ 400 calories in the form of intravenous dextrose. From the 5th postoperative day, in addition to enteral feeds, participants were kept on intravenous patency line. Between the 8th and t10th day the nasogastric tube was removed and complete oral feeds in the form of semi‐solid diet were begun. (n = 100) | |
| Outcomes | Complications: wound infection, wound dehiscence, pneumonia, leakage of anastomoses, abdominal distension, vomiting, diarrhoea, leak, septicaemia and death. Calorie intake, mean duration of stay, mean duration of ICU stay. Determination of weight on the 1st, 7th and 10th postoperative days or at the time of discharge, or both. | |
| Study dates | May 2000 and February 2003 | |
| Notes | On postoperative day 8, 84% from the experimental group and 0% from the control group received over 2500 calories a day. We have estimated this to be an adequate amount of nutrition for the experimental group and an inadequate amount for the control group. We could otain no contact information. | |
| Risk of bias | ||
| Bias | Authors' judgement | Support for judgement |
| Random sequence generation (selection bias) | Low risk | Randomisation was performed using random tables. |
| Allocation concealment (selection bias) | Unclear risk | Not described |
| Blinding of participants and personnel (performance bias) | High risk | Blinding was not performed. |
| Blinding of outcome assessment (detection bias) | Unclear risk | Not described |
| Incomplete outcome data (attrition bias) | Low risk | 5 left against medical advice. In the experimental group there were 3 drop outs because of side effects. |
| Selective reporting (reporting bias) | Low risk | No protocol published, but the trial reported all‐cause mortality and serious adverse events. |
| For‐profit bias | Unclear risk | It was unclear how the trial was funded. |
| Other bias | Low risk | The trial appeared to be free of other components that could put it at risk of bias. |
| Methods | Randomised clinical trial, USA | |
| Participants | 18 hospitalised adults admitted for rectal carcinoma surgery, at nutritional risk due to major surgery. Male:Female = not stated Mean age = not stated Exclusion criteria: none stated | |
| Interventions | Experimental group: Lipid‐based TPN(n = 9) | |
| Outcomes | Tumour protein synthesis | |
| Study dates | Not stated | |
| Notes | We contacted the author on 13th December 2015 by email: [email protected]. We received no reply. | |
| Risk of bias | ||
| Bias | Authors' judgement | Support for judgement |
| Random sequence generation (selection bias) | Unclear risk | Not described |
| Allocation concealment (selection bias) | Unclear risk | Not described |
| Blinding of participants and personnel (performance bias) | Unclear risk | Not described |
| Blinding of outcome assessment (detection bias) | Unclear risk | Not described |
| Incomplete outcome data (attrition bias) | Unclear risk | The reasons for dropouts were unclear. |
| Selective reporting (reporting bias) | Unclear risk | No protocol could be obtained, and the trial did not report on all‐cause mortality or serious adverse events. |
| For‐profit bias | Unclear risk | It was unclear how the trial was funded. |
| Other bias | Low risk | The trial appeared to be free of other components that could put it at risk of bias. |
| Methods | Randomised clinical trial, Thailand | |
| Participants | 56 hospitalised adult with proven cerebral plasmodium falciparum malaria, at nutritional risk due to being admitted to an ICU. Male:Female = 10:46 Mean age = 31 years | |
| Interventions | Experimental group: Enteral feeding at admission (1000 – 2000 kCal every 24 hrs for an adult weighing 50 kg) (n = 27) Co‐interventions: Nasogastric tube at admission + after 60 hours: continued enteral nutrition or oral feeding if the participants were able to | |
| Outcomes | Aspirations, pneumonia, death, sepsis | |
| Study dates | Not stated | |
| Notes | We contacted the author on 19th August 2015 by email: [email protected], and on 23rd August 2015 by email: [email protected]. We only received an initial response. | |
| Risk of bias | ||
| Bias | Authors' judgement | Support for judgement |
| Random sequence generation (selection bias) | Unclear risk | Not described |
| Allocation concealment (selection bias) | Low risk | The allocation was concealed in sealed envelopes. |
| Blinding of participants and personnel (performance bias) | High risk | The trial was unblinded. |
| Blinding of outcome assessment (detection bias) | High risk | The trial was unblinded. |
| Incomplete outcome data (attrition bias) | Unclear risk | There were no dropouts. |
| Selective reporting (reporting bias) | High risk | Time to stand was not described in the trial. |
| For‐profit bias | Low risk | The trial was funded by: Wellcome Trust of Great Britain (www.wellcome.ac.uk, grant number 077166/Z/05/Z). |
| Other bias | Low risk | The trial appeared to be free of other components that could put it at risk of bias. |
| Methods | Randomised clinical trial, USA | |
| Participants | 112 hospitalised adults with an appropriate clinical indication for PEG, 16 years of age or older, and life expectancy of 30 days or more, at nutritional risk due to trialist indication Male:Female = 63:49 Mean age = 63 years Exclusion: prior gastric surgery, evidence of gastro‐intestinal obstruction, known gastric or small bowel dysmotility, marked ascites, infection or cellultis at the anticipated PEG site, proximal small bowel fistula, neoplastic or infiltrative disease of the gastric wall, morbid obesity, extensive scarring of the anterior abdominal wall, prolonged prothrombin time not correctable to < 3 s of the control value, and platelet count < 50 K | |
| Interventions | Experimental: started enteral feeding (Isocal) through PEG after 4 hours(n = 57) Control: no intervention(n = 55) Co‐intervention: enteral feeding (Isocal) after 24 hrs | |
| Outcomes | Mortality, complications | |
| Study dates | Not stated | |
| Notes | We could find no contact information for the authors. | |
| Risk of bias | ||
| Bias | Authors' judgement | Support for judgement |
| Random sequence generation (selection bias) | Unclear risk | Not described |
| Allocation concealment (selection bias) | Unclear risk | Not described |
| Blinding of participants and personnel (performance bias) | Unclear risk | Not described |
| Blinding of outcome assessment (detection bias) | Unclear risk | Not described |
| Incomplete outcome data (attrition bias) | Unclear risk | The number of participants with incomplete data was not reported. |
| Selective reporting (reporting bias) | Low risk | The trial reports mortality and complications. |
| For‐profit bias | Unclear risk | It was unclear how the trial was funded. |
| Other bias | Low risk | The trial appeared to be free of other components that could put it at risk of bias. |
| Methods | Randomised clinical trial, UK | |
| Participants | 51 hospitalised elderly adults at the the acute geriatric ward, at nutritional risk due to weight below 85% of ideal weight for height, triceps skinfold thickness below 85% of standard values or serum albumin level < 34 g/l Male:Female = Not reported Mean age = Not reported Exclusion criteria: Malignant conditions or metabolic disease such as thyrotoxicosis or diabetes | |
| Interventions | Experimental group: received 2 sachets of “Build‐up” oral supplement daily providing 36.4 g protein and 644 kcal(n = 26) Control group: No intervention(n = 25) Co‐interventions: All received a normal hospital diet | |
| Outcomes | Weight, triceps skinfold thickness, mid‐upper arm circumference, serum albumin level and nutritional status | |
| Study dates | Not stated | |
| Notes | We could obtain no contact information for the authors. | |
| Risk of bias | ||
| Bias | Authors' judgement | Support for judgement |
| Random sequence generation (selection bias) | Unclear risk | Not described |
| Allocation concealment (selection bias) | Unclear risk | Not described |
| Blinding of participants and personnel (performance bias) | Unclear risk | Not described |
| Blinding of outcome assessment (detection bias) | Unclear risk | Not described |
| Incomplete outcome data (attrition bias) | Unclear risk | The number of participants with incomplete data was not reported. |
| Selective reporting (reporting bias) | Unclear risk | No protocol could be obtained, and the trial did not report on all‐cause mortality or serious adverse events. |
| For‐profit bias | Unclear risk | It was unclear how the trial was funded. |
| Other bias | Low risk | The trial appeared to be free of other components that could put it at risk of bias. |
| Methods | Randomised clinical trial, UK | |
| Participants | 86 hospitalised adults admitted to a medical ward, at nutritional risk according to anthropometric measurements 29 were mildly, 23 moderately, and 34 were severely nutritionally depleted Male:Female = Not reported Mean age = 71 years Exclusion criteria: Not described | |
| Interventions | Experimental group: Group 1: Participants received ONSs (n = 35) Group 2: Participants were tube‐fed, through nasogastric tube (n = 25) Feeding was continued until oral intake or nutritional status had improved sufficiently or when agreement between participant and medical staff deemed it appropriate, or on discharge from hospital. Nutrients were prescribed to make up the difference between inadequate oral intake and estimated energy requirements. Energy requirements were defined for each participant using the Schofield equation 24 corrected for stress and activity. All participants were fed for at least 7 days. Control group: No intervention(n = 26) Co‐interventions: Both intervention groups had access to hospital diet. | |
| Outcomes | Nutritional status, nutritional intake, weight, height, triceps skinfold thickness, mid‐arm muscle circumference | |
| Study dates | Not stated | |
| Notes | Same trial as McWhirter 1996b with the results of experimental group 1 vs control. We contacted the authors on 17th November 2015 by email: [email protected]. We received no additional information. | |
| Risk of bias | ||
| Bias | Authors' judgement | Support for judgement |
| Random sequence generation (selection bias) | Unclear risk | Not described |
| Allocation concealment (selection bias) | Unclear risk | Not described |
| Blinding of participants and personnel (performance bias) | Unclear risk | Not described |
| Blinding of outcome assessment (detection bias) | Unclear risk | Not described |
| Incomplete outcome data (attrition bias) | Unclear risk | The description of the number of dropouts is unclear. |
| Selective reporting (reporting bias) | Unclear risk | The trial did not report on all‐cause mortality or serious adverse events. |
| For‐profit bias | High risk | The trial was supported by Clintec Nutrition Ltd. which might have and interest in the outcome. |
| Other bias | Low risk | The trial appeared to be free of other components that could put it at risk of bias. |
| Methods | Randomised clinical trial, UK | |
| Participants | 86 hospitalised adults admitted to a medical ward, at nutritional risk according to anthropometric measurements 29 were mildly, 23 moderately, and 34 were severely nutritionally depleted. Male:Female = Not reported Mean age = 71 years Exclusion criteria: Not described | |
| Interventions | Experimental group: Group 1: Participants received ONSs. (n = 35) Group 2: Participants were tube‐fed, through nasogastric tube. (n = 25) Feeding was continued until oral intake or nutritional status had improved sufficiently or when agreement between participant and medical staff deemed it appropriate, or on discharge from hospital. Nutrients were prescribed to make up the difference between inadequate oral intake and estimated energy requirements. Energy requirements were defined for each participant using the Schofield equation 24 corrected for stress and activity. All participants were fed for at least 7 days. Control group: No intervention(n = 26) Co‐interventions: Both intervention groups had access to hospital diet. | |
| Outcomes | Nutritional status, nutritional intake, weight, height, triceps skinfold thickness, mid‐arm muscle circumference | |
| Study dates | Not stated | |
| Notes | Same trial as McWhirter 1996a with the results of experimental group 1 vs control. We contacted the authors on 17th November 2015 by email: [email protected]. We received no additional information. | |
| Risk of bias | ||
| Bias | Authors' judgement | Support for judgement |
| Random sequence generation (selection bias) | Unclear risk | Not described |
| Allocation concealment (selection bias) | Unclear risk | Not described |
| Blinding of participants and personnel (performance bias) | Unclear risk | Not described |
| Blinding of outcome assessment (detection bias) | Unclear risk | Not described |
| Incomplete outcome data (attrition bias) | Unclear risk | The description of the number of drop outs is unclear. |
| Selective reporting (reporting bias) | Unclear risk | The trial did not report on all‐cause mortality or serious adverse events. |
| For‐profit bias | High risk | The trial was supported by Clintec Nutrition Ltd. which might have and interest in the outcome. |
| Other bias | Low risk | The trial appeared to be free of other components that could put it at risk of bias. |
| Methods | Randomised clinical trial, China | |
| Participants | 64 hospitalised adults with hepatocellular carcinoma and cirrhosis, at nutritional risk due to hepatectomy Male:Female = 39:25 Mean age = 51 years Exclusion criteria: none specified | |
| Interventions | Enteral nutrition suspension (TP‐MCT) 500ml (1 bottle/day) orally on 3rd preoperative day, using jejunal nutrient canal with 500 ml normal saline during operation for 12 hrs, and enteral nutrition suspension (TP‐MCT) 1000 ml on postoperative days 2 to 4; Based on co‐intervention. Total treatment duration was 7 days.(n = 55) Control: treatment as usual (n = 54) | |
| Outcomes | Biomarkers, adverse events, complications | |
| Study dates | Not stated | |
| Notes | We tried to contact the authors by phone and by email: [email protected]. We received no reply. | |
| Risk of bias | ||
| Bias | Authors' judgement | Support for judgement |
| Random sequence generation (selection bias) | Low risk | Random‐number table |
| Allocation concealment (selection bias) | Unclear risk | Not described |
| Blinding of participants and personnel (performance bias) | High risk | Participants and personnel were not blinded. |
| Blinding of outcome assessment (detection bias) | Unclear risk | Not described |
| Incomplete outcome data (attrition bias) | Unclear risk | The number of participants with incomplete data was not described. |
| Selective reporting (reporting bias) | Low risk | No protocol but the trial reported on all‐cause mortality and serious adverse events. |
| For‐profit bias | Unclear risk | It was unclear how the trial was funded. |
| Other bias | Low risk | The trial appeared to be free of other components that could put it at risk of bias. |
| Methods | Randomised clinical trial, USA | |
| Participants | 54 hospitalised adults with severe alcoholic hepatitis, recent history of heavy alcohol ingestion, laboratory‐based liver disease discriminant function defined as 4.6 X prothrombin time + serum bilirubin > 85 (mg/dl) and the clinical and laboratory characteristics adopted by the International Association for the Study of the Liver for the diagnosis of alcoholic hepatitis Male:Female = 32:22 Mean age = 43 years Exclusion criteria: pregnancy, cardiovascular, pulmonary or chronic kidney disease; pancreatitis, type I diabetes, recent (within 1 month) gastro‐intestinal bleeding, peptic ulcer disease, or concurrent infection | |
| Interventions | Experimental group: 1L parenteral nutrition each 12 hour (25.8 g amino acids) for 30 days(n = 28) Co‐intervention: Standard hospital diet + parenteral nutrition (6.5% glucose) | |
| Outcomes | Biochemistry, mid‐arm circumference, triceps skinfold thickness, body weight, mortality | |
| Study dates | Not stated | |
| Notes | The trial was included late in the process of the review, so we did not contact the authors. | |
| Risk of bias | ||
| Bias | Authors' judgement | Support for judgement |
| Random sequence generation (selection bias) | Unclear risk | Not described |
| Allocation concealment (selection bias) | Low risk | The code was kept by the pharmaceutical company, and was not broken until the study was terminated. |
| Blinding of participants and personnel (performance bias) | Unclear risk | The participants and investigators were described as unaware of the allocation. However, the placebo was not described. |
| Blinding of outcome assessment (detection bias) | Unclear risk | It was described that the participants and investigators was unaware of the allocation. However, the placebo was not described. |
| Incomplete outcome data (attrition bias) | Unclear risk | More than 5% were lost to follow‐up, and the trial did not use proper methodology to deal with missing data. |
| Selective reporting (reporting bias) | Unclear risk | No protocol could be obtained, and the trial did not report serious adverse events. |
| For‐profit bias | Low risk | The trial was funded by the United States‐Spanish Joint Committee for Scientific and Technological Cooperation (grant CCA‐85101050). |
| Other bias | Low risk | The trial appeared to be free of other components that could put it at risk of bias. |
| Methods | Randomised clinical trial, Australia | |
| Participants | 100 hospitalised adults aged 70 or above and admitted with fall‐related lower limb fracture at nutritional risk due to being frail elderly with lower limb fracture Male:Female = 21:79 Mean age: 83 years Exclusion: Did not reside within southern Adelaide, unable to comprehend instructions relating to positioning of the upper arm for eligibility assessment, unable to fully weight‐bear on the side of the injury for more than 7 days post‐admission, not independently mobile prefracture, medically | |
| Interventions | Experimental group: Fortisip (Nutricia Australia Pty Ltd), a complete ONS (6.3 kJ (1.5 kcal)/mL, 16% protein, 35% fat and 49% carbohydrate). Between 580 ‐ 800 mL was given. (n = 25) Control: Attention control, with tri‐weekly visits (of equivalent duration) from weeks 1 to 6 and then weekly visits weeks 7 to 12, to match the home visits of the active intervention groups. (n = 26) Co‐intervention: usual clinical care, including general nutrition and exercise advice, usual dietetic and physiotherapy care, transfer to residential care, rehabilitation facility or directly home. | |
| Outcomes | Mid‐arm circumference, quality of life, weight, quadriceps strength, mortality | |
| Study dates | September 2000 and October 2002 | |
| Notes | The groups with nutrition + resistance training vs resistance training alone. We contacted the authors on 25th January 2016 by email: [email protected]. We received no reply. The trial starts as an inpatient trial but the intervention continues outside the hospital. | |
| Risk of bias | ||
| Bias | Authors' judgement | Support for judgement |
| Random sequence generation (selection bias) | Low risk | Computer‐generated allocation sequence |
| Allocation concealment (selection bias) | Low risk | Sealed opaque envelopes |
| Blinding of participants and personnel (performance bias) | Unclear risk | It was unclear if the trial was blinded. |
| Blinding of outcome assessment (detection bias) | Unclear risk | it was unclear if the participants were blinded, and the trial reported quality of life. |
| Incomplete outcome data (attrition bias) | High risk | There was above 5% dropouts for weight data and the trial did not account for the missing data properly. |
| Selective reporting (reporting bias) | Unclear risk | No protocol could be obtained. The trial reported all‐cause mortality but did not report serious adverse events. |
| For‐profit bias | High risk | Supported by: NHMRC Public Health Postgraduate Research Scholarship, Flinders University‐Industry Collaborative Research Grant and Nutricia Australia Pty Ltd. |
| Other bias | Low risk | The trial appeared to be free of other components that could put it at risk of bias. |
| Methods | Randomised clinical trial, Australia | |
| Participants | 100 hospitalised adults aged 70 or above and admitted with fall‐related lower limb fracture, at nutritional risk due to being frail elderly with lower limb fracture Male:female = 21:79 Mean age: 83 years Exclusion: Did not reside within southern Adelaide, unable to comprehend instructions relating to positioning of the upper arm for eligibility assessment, unable to fully weight‐bear on the side of the injury for more than 7 days post‐admission, not independently mobile prefracture, medically | |
| Interventions | Experimental group: Fortisip (Nutricia Australia Pty Ltd), a complete oral nutritional supplement (6.3 kJ (1.5 kcal)/mL, 16% protein, 35% fat and 49% carbohydrate). Between 580 ‐ 800 mL was given. (n = 24) Control: Attention control, with tri‐weekly visits (of equivalent duration) from weeks 1 to 6 and then weekly visits weeks 7 to 12, to match the home visits of the active intervention groups. (n = 25) Co‐intervention: usual clinical care (including general nutrition and exercise advice, usual dietetic and physiotherapy care, transfer to residential care, rehabilitation facility or directly home) and resistance training. | |
| Outcomes | Mid‐arm circumference, quality of life, weight, quadriceps strength, mortality | |
| Study dates | September 2000 and October 2002 | |
| Notes | Groups attention control vs nutrition supplements | |
| Risk of bias | ||
| Bias | Authors' judgement | Support for judgement |
| Random sequence generation (selection bias) | Low risk | Computer‐generated allocation sequence |
| Allocation concealment (selection bias) | Low risk | Sealed opaque envelopes |
| Blinding of participants and personnel (performance bias) | Unclear risk | It was unclear if the trial was blinded. |
| Blinding of outcome assessment (detection bias) | Unclear risk | it was unclear if the participants were blinded, and the trial reported quality of life. |
| Incomplete outcome data (attrition bias) | High risk | There was above 5% dropouts for weight data and the trial did not account for the missing data. |
| Selective reporting (reporting bias) | Unclear risk | No protocol could be obtained. The trial reported all‐cause mortality but did not report serious adverse events. |
| For‐profit bias | High risk | Supported by: NHMRC Public Health Postgraduate Research Scholarship, Flinders University‐Industry Collaborative Research Grant and Nutricia Australia Pty Ltd. |
| Other bias | Low risk | The trial appeared to be free of other components that could put it at risk of bias. |
| Methods | Randomised clinical trial, Belgium | |
| Participants | 136 hospitalised adults with severe alcoholic hepatitis, at nutritional risk by trialists Male:Female = 86:50 Mean age = 50 years Exclusion criteria: Not stated | |
| Interventions | Experimental group: Intensive enteral nutrition: Enteral nutrition was given using a feeding tube for 14 days and participants received Fresubin HP Energy (1.5 kcal/ml, 7.5 g prot/100 ml) as follows: 1 L/day if body weight < 60 kgs, 1.5 L if body weight was between 60 and 90 kgs, 2 L if body weight was > 90 kgs. (n = 68) Control group: Treatment as usual ("conventional nutrition")(n = 68) Co‐interventions: Methylprednisolone | |
| Outcomes | 6 months survival | |
| Study dates | Feburary 2010 to February 2013 | |
| Notes | We did not contact the authors since the trial was included late in the writing phase. | |
| Risk of bias | ||
| Bias | Authors' judgement | Support for judgement |
| Random sequence generation (selection bias) | Unclear risk | Not described |
| Allocation concealment (selection bias) | Low risk | Sealed opaque envelopes |
| Blinding of participants and personnel (performance bias) | High risk | Participants were not blinded. |
| Blinding of outcome assessment (detection bias) | Unclear risk | Not described |
| Incomplete outcome data (attrition bias) | Low risk | There was under 5% with missing data |
| Selective reporting (reporting bias) | Low risk | A protocol could not be obtain but the trial reported all‐cause mortality and serious adverse events (NCT01801332, published after completion). |
| For‐profit bias | High risk | Several of the authors received grants for trials which might have conflict of interest (Abbvie, Novartis). |
| Other bias | Low risk | The trial appeared to be free of other components that could put it at risk of bias. |
| Methods | Randomized clinical trial, Denmark | |
| Participants | 84 hospitalised adults at nutritional risk according to the Nutritional Risk Screening‐2002 (NRS‐2002) tool. Male:Female = 34:47 (gender not reported for three participants) Mean age = 75 years Exclusion criteria: terminally ill dysphagia, food allergy or intolerance, anatomical obstructions preventing oral food intake, those who exclusively received enteral or parenteral nutrition | |
| Interventions | Experimental group: Fortified foods: They received a special target food concept consisting of dishes fortified with natural energy and protein ingredients and with high‐quality protein powder. These dishes supplemented the standard hospital food. The final energy and protein fortified novel menu consisted of 23 small dishes. All dishes contained a minimum (range) of 6 g (6.1 – 11.5 g) of protein. The mean (range) energy density was 9.4 kJ/g (2.5 kJ/g to 19.8 kJ/g). All but 3 dishes (baked salmon, meat loaf, meat balls of veal) contained protein powder. The intervention menu was served a la carte with room service.(n = 44) Control group: No intervention (n = 40) Co‐intervention: Standard food service Buffet‐style serving system: 3 main meals + 2 ‐ 3 in‐between meals, e.g. snacks The national nutritional guidelines for the ‘hospital diet’, with energy‐ and protein‐rich beverage included, recommended that the hospital diet on average contained 9000 kJ, 95 g of protein (15% – 20% of energy), 100 g of fat (40% – 50% of energy) and 225 g of carbohydrate (40% – 45% of energy). | |
| Outcomes | Energy and protein intake, hand‐grip strength, average daily energy and protein intake, use of tube‐feeding, use of parenteral nutrition, length of stay, changes in body weight | |
| Study dates | October 2011 to February 2012 | |
| Notes | We contacted the authors on 11th February 2016 by email: [email protected]. We received additional information on the random sequence generation. | |
| Risk of bias | ||
| Bias | Authors' judgement | Support for judgement |
| Random sequence generation (selection bias) | Low risk | Participants were randomised using stratified block‐randomisation. The allocation sequence was generated by a secretary who was not otherwise involved in the trial by randomly allocating sealed opaque envelopes. |
| Allocation concealment (selection bias) | Low risk | Participants were randomised using sealed, opaque envelopes with a total of 9 blocks, each consisting of 10 envelopes. |
| Blinding of participants and personnel (performance bias) | High risk | Blinding of participants and personnel was not possible. |
| Blinding of outcome assessment (detection bias) | Low risk | Data analysis was blinded by allocating the letters A and B to the two groups. The analysis was undertaken by the principal investigator who was blinded to the randomisation. |
| Incomplete outcome data (attrition bias) | Low risk | 81 participants completed the trial, giving a completion rate of 96%. |
| Selective reporting (reporting bias) | Low risk | The protocol was published before the trial was begun and the outcomes stated in the protocol were reported on. |
| For‐profit bias | High risk | "We also thank the company ‘Toft Care System’ (Copenhagen, Denmark) for giving us the protein powder used free of charge. The sources of funding had no influence on the design of the study; the collection, analysis, or interpretation of the data; the writing of the manuscript; or the decision to submit for publication." |
| Other bias | Low risk | The trial appeared to be free of other components that could put it at risk of bias |
| Methods | Randomised clinical trial, USA | |
| Participants | 80 hospitalised adults with non‐surgically debrided pressure ulcers, at nutritional risk as defined by trialists Male:Female = 46:34 Mean age = 70.4 years Exclusion criteria: Not described | |
| Interventions | Experimental group: Prescribed nutritional support, including oral supplements, tube‐feedings, parenteral nutrition, vitamins, and trace elements according to the clinical condition and the nutritional assessment completed by the hospital nutritional support team (n = 25) Control group: No intervention (n = 20) Co‐interventions: Standard hospital care. This included both wound treatment and nutritional evaluation and recommendation by dietitians to attending physicians. | |
| Outcomes | Change in ulcers stage, changes in ulcer size, clinical assessment of treatment | |
| Study dates | Not stated | |
| Notes | We found no contact information for the authors. | |
| Risk of bias | ||
| Bias | Authors' judgement | Support for judgement |
| Random sequence generation (selection bias) | Unclear risk | Not described |
| Allocation concealment (selection bias) | Unclear risk | Not described |
| Blinding of participants and personnel (performance bias) | Unclear risk | Not described |
| Blinding of outcome assessment (detection bias) | Unclear risk | Not described |
| Incomplete outcome data (attrition bias) | Unclear risk | The number of participants with incomplete data was not reported. |
| Selective reporting (reporting bias) | High risk | No protocol could be obtained and the study did not report on all‐cause mortality or serious adverse events. |
| For‐profit bias | High risk | The study was supported by a grant from Ross Laboratories, who might have had an interest in the outcome assessment. |
| Other bias | Low risk | The trial appeared to be free of other components that could put it at risk of bias. |
| Methods | Randomised cclinical trial, Germany | |
| Participants | 160 hospitalised adults with carcinoma of the oesophagus, stomach, colon, rectum or pancreas, at nutritional risk due to major surgery of gastrointestinal carcinoma Male:Female = 77:48 (gender not reported for 35 participants) Mean age = 59 years Exclusion criteria: Total obstructions of the gut | |
| Interventions | Experimental group: Preoperativ parenteral nutrition. The experimental group received 10 days of preoperative parenteral nutrition group (1.5 g amino acids/kg body weight; 11 g glucose/kg body weight; electrolytes, trace elements, and vitamins) by a central venous catheter(n = 80) Control group: Treatment as usual They received regular hospital diet of 2400 kcal/day. (n = 40) | |
| Outcomes | Postoperative complications, mortality, serum protein levels (total protein, albumin, pre‐albumin, thyroxine‐binding globin, retinol‐binding protein, transferrin), immunological status (IgA, IgM, IgG, C3A, C4, skin tests). | |
| Study dates | Not stated | |
| Notes | We found no contact information for the authors. | |
| Risk of bias | ||
| Bias | Authors' judgement | Support for judgement |
| Random sequence generation (selection bias) | Unclear risk | Not described |
| Allocation concealment (selection bias) | Unclear risk | Not described |
| Blinding of participants and personnel (performance bias) | High risk | Blinding was not possible due to the nature of the intervention. |
| Blinding of outcome assessment (detection bias) | Unclear risk | Not described |
| Incomplete outcome data (attrition bias) | High risk | 33 (13%) of participants were withdrawn from the trial and analysis and reasons for withdrawal were clearly stated. |
| Selective reporting (reporting bias) | Low risk | No protocol could be obtained, but the trial reported mortality and serious adverse events. |
| For‐profit bias | Unclear risk | It was unclear how the trial was funded. |
| Other bias | Low risk | The trial appeared to be free of other components that could put it at risk of bias. |
| Methods | Randomised cclinical trial, Germany | |
| Participants | 160 hospitalised adults with carcinoma of the oesophagus, stomach, colon, rectum or pancreas, at nutritional risk due to major surgery of gastrointestinal carcinoma Male:Female = 77:48 (gender not reported for 35 participants) Mean age = 59 years Exclusion criteria: Total obstructions of the gut | |
| Interventions | Experimental group: Preoperativ parenteral nutrition: The experimental group received 10 days of preoperative parenteral nutrition group (1.5 g amino acids/kg body weight; 45 kcal/kg body weight with half derived from lipids; electrolytes, trace elements, and vitamins) by a central venous catheter(n =55) Control group: Treatment as usual. They received regular hospital diet of 2400 kcal/day. (n = 40) | |
| Outcomes | ||
| Study dates | ||
| Notes | ||
| Risk of bias | ||
| Bias | Authors' judgement | Support for judgement |
| Random sequence generation (selection bias) | Low risk | Random‐numbers table |
| Allocation concealment (selection bias) | Unclear risk | Not described |
| Blinding of participants and personnel (performance bias) | High risk | Blinding was not possible due to the nature of the intervention. |
| Blinding of outcome assessment (detection bias) | Unclear risk | Not described |
| Incomplete outcome data (attrition bias) | High risk | 33 (13%) of participants were withdrawn from the trial and analysis and reasons for withdrawal were clearly stated. |
| Selective reporting (reporting bias) | Low risk | No protocol could be obtained, but the trial reported mortality and serious adverse events. |
| For‐profit bias | Unclear risk | It was unclear how the trial was funded. |
| Other bias | Low risk | The trial appeared to be free of other components that could put it at risk of bias. |
| Methods | Randomised clinical trial, France | |
| Participants | 40 hospitalised adults with alcoholic cirrhosis and total serum bilirubin ≥ 5 mg a dL, at nutritional risk due trialist indication Male:Female = 25:15 Exclusion criteria: hepatocellular carcinoma, renal failure, hyponatraemia septicaemia, spontaneous bacterial peritonitis, gastro‐intestinal bleeding within 3 days or hepatic coma | |
| Interventions | Experimental group: Received daily through central catheter 40 kcal a kg of body weight measured before illness, given as equal proportions of glucose (50% glucose) and intravenous fat emulsion (20% Intralipid), and 200 mg nitrogen a kg of body measured weight before illness. This SPN provided electrolytes, minerals, vitamins and trace element requirements in a sodium‐free solution. (n = 20) In participants with ascites, the oral sodium intake was 400 mg a day; without ascites, the oral sodium was 4 mg a day. The intervention lasted 28 days. Control group: No intervention (n = 20) Co‐interventions: All were offered a daily diet containing 40 kcal a kg and 200 mg nitrogen a kg of their body weight measured before illness. | |
| Outcomes | Serum bilirubin, prothrombin time and proaccelerin expressed as percentage of normal, blood, urea nitrogen, hematocrit, plasma protein, serum creatinine, sodium, y‐glutamyl transpeptidase (GGT) and TSB/GGT ratio, SGOT, SGPT, albumin, alkaline phosphatase, transferrin, pre‐albumin, retinol binding protein, upper‐arm fat and upper‐arm muscle areas expressed as percentage of the standard value of the age‐ and sex‐specific 50th percentile and skin test, mortality and anthropometric measurements | |
| Study dates | Not stated | |
| Notes | We contacted the authors on 30th June 2015 by email: [email protected]‐hop‐paris.fr. We received only an initial reply. | |
| Risk of bias | ||
| Bias | Authors' judgement | Support for judgement |
| Random sequence generation (selection bias) | Low risk | Randomisation was performed using a computer programme. |
| Allocation concealment (selection bias) | Low risk | Serially‐numbered, sealed, opaque envelopes were used for random assignment of participants in 2 groups. |
| Blinding of participants and personnel (performance bias) | Unclear risk | Not described |
| Blinding of outcome assessment (detection bias) | Unclear risk | Not described |
| Incomplete outcome data (attrition bias) | Unclear risk | There was above 5% dropouts and it was unclear how the trial accounted for the participants. |
| Selective reporting (reporting bias) | Unclear risk | No protocol was available, but the numbers and reasons for all‐cause mortality and serious adverse events was reported. |
| For‐profit bias | Unclear risk | It was unclear how the trial was funded. |
| Other bias | Low risk | The trial appeared to be free of other components that could put it at risk of bias. |
| Methods | Randomised cclinical trial, the Netherlands | |
| Participants | 210 hospitalised adults at nutritional risk due to a > 10 % unintentional weight loss in the previous 6 months and/or > 5% unintentional weight loss in the previous month and/or a BMI < 20 kg/m2 Male:Female = 94:116 Mean age = 74 years. Exclusion criteria: Senile dementia, not able to understand the Dutch language or not able or willing to give fully‐informed consent | |
| Interventions | Experimental group: Fortified foods and general nutrition support. Participants received standardised nutritional support started at the hospital and continued until 3 months after discharge. It included: ‐ Energy‐ and protein‐enriched diet (during the stay at hospital) ‐ 2 additional servings of an ONS (Nutridrink!, Nutricia), leading to an expected increase in intake of 2520 kJ/day (1⁄4600 kilocalories/day and 24 g protein/day (during the entire study period)) ‐ 400 IE vitamin D3 and 500 mg calcium (Calci‐Chew D3!, Nycomed) a day (during the entire study period) ‐ Telephone counselling by a dietician in order to give advice and to stimulate compliance with the proposed nutritional intake (every other week after discharge from the hospital, 6 in total)(n = 105) Control group: Usual care(n = 105) Participants were given nutritional support only on prescription by their treating physician. In general, they did not receive post‐discharge nutritional support. | |
| Outcomes | QALY, body weight, BMI, fat‐free mass, hand‐grip strength, physical activity, fall incidence, mortality, cost effectiveness, functional limitations | |
| Study dates | Not stated | |
| Notes | We contacted the authors on 04th April 2016 by email: [email protected]. | |
| Risk of bias | ||
| Bias | Authors' judgement | Support for judgement |
| Random sequence generation (selection bias) | Low risk | Randomisation was performed using a random‐number generator. Block randomisation in blocks of 10 was used to ensure equal numbers of participants in each group. |
| Allocation concealment (selection bias) | Low risk | The randomisation was concealed using numbered, opaque envelopes. |
| Blinding of participants and personnel (performance bias) | High risk | Blinding of participants and personnel was not performed. |
| Blinding of outcome assessment (detection bias) | High risk | The participants were not blinded, and the trial reported quality of life. |
| Incomplete outcome data (attrition bias) | High risk | Data was incomplete for 60 (28.6%) participants.The trial performed intention‐to‐treat analysis but used last observation carried forward for missing data besides cost, which was imputed using multiple imputations. |
| Selective reporting (reporting bias) | Unclear risk | No protocol could be obtained and serious adverse events were not reported. |
| For‐profit bias | Low risk | The trial was funded by: The Netherlands Organisation for Health Research and Development (ZonMw) (94506203). |
| Other bias | Low risk | The trial appeared to be free of other components that could put it at risk of bias. |
| Methods | Randomised clinical trial, Finland | |
| Participants | 19 hospitalised adults undergoing major abdominal surgery and having 3 out of the following 7 criteria: weight loss > 5% a month, the weight‐for‐height index, arm muscle circumference, triceps skinfold thickness or creatinine‐height index was < 90% of normal or if the serum albumin concentration was < 32 g/l or the serum pre‐albumin concentration was < 0.08 g/l, at nutritional risk due major abdominal surgery Male:Female = 12:7 Mean age = 55 years Exclusion criteria: Not stated | |
| Interventions | Experimental group: TPN was started 10 days before the planned operation. The participants received nutrition through a central venous catheter which included 1 ‐ 2 g/kg/day amino acids, 150 ‐ 200 kcal/1gN (glucose and fat), 40 ‐ 60 ml/kg water together with the necessary minerals and vitamins(n = 9) Control group: No treatment(n = 10) | |
| Outcomes | Leucocyte counts, mitogen‐ and antigen‐induced lymphocyte proliferative responses, complications, mortality | |
| Study dates | Not stated | |
| Notes | We found no contact information for the authors. | |
| Risk of bias | ||
| Bias | Authors' judgement | Support for judgement |
| Random sequence generation (selection bias) | Unclear risk | Not described |
| Allocation concealment (selection bias) | Unclear risk | Not described |
| Blinding of participants and personnel (performance bias) | High risk | Participants and personnel were not blinded due to the nature of the intervention. |
| Blinding of outcome assessment (detection bias) | Unclear risk | Not described |
| Incomplete outcome data (attrition bias) | Low risk | There were no dropouts. |
| Selective reporting (reporting bias) | Low risk | No protocol could be obtained, but the trial reported serious adverse event and mortality. |
| For‐profit bias | Unclear risk | It was unclear how the trial was funded. |
| Other bias | Low risk | The trial appeared to be free of other components that could put it at risk of bias. |
| Methods | Randomised clinical trial, Australia | |
| Participants | 28 hospitalised adults admitted to a level 3 ICU due to being critically ill and able to receive enteral nutrition, and likely to receive mechanical ventilation for at least 4 days, at nutritional risk due to ICU hospitalisation Male:Female = 18:10 Mean age = 55.6 years | |
| Interventions | Experimental group: Early enteral feeding within 24 hrs of admission for 4 days (n = 14) Co‐intervention: Normal enteral feeding after 4 days, nasogastric tube | |
| Outcomes | Plasma 3‐OMG levels, duration of mechanical ventilation, prevalence of ventilator‐associated pneumonia, and mortality, length of stay at ICU, gastric emptying | |
| Study dates | Not stated | |
| Notes | We contacted the authors on 19th August 2015 by email: [email protected]. We received no reply. | |
| Risk of bias | ||
| Bias | Authors' judgement | Support for judgement |
| Random sequence generation (selection bias) | Low risk | Computer‐generated sequence |
| Allocation concealment (selection bias) | Low risk | List was maintained by an independent research co‐ordinator. |
| Blinding of participants and personnel (performance bias) | Unclear risk | Not described |
| Blinding of outcome assessment (detection bias) | Unclear risk | Not described |
| Incomplete outcome data (attrition bias) | Unclear risk | The number of participants with incomplete data was not reported. |
| Selective reporting (reporting bias) | Unclear risk | No protocol could be obtained, and the trial did not report on serious adverse events. |
| For‐profit bias | Low risk | The trial was funded by a non‐profit organisation (National Health and Medical Research Council, and by the Australian National Health and Research Council grant). |
| Other bias | Low risk | The trial appeared to be free of other components that could put it at risk of bias. |
| Methods | Randomised clinical trial, USA | |
| Participants | 50 hospitalised adults with advanced colorectal carcinoma, at nutritional risk according to the trialist Male:Female = 19:26 (gender not reported for five participants) Mean age = 58 years Exclusion criteria: severe heart or renal disease, antibiotic‐resistant infections, weight loss > 24% of premorbid level, or important nutrient losses from vomiting, diarrhoea, or fistulae. No surgery, radiation, or chemotherapy could have occurred for 2 weeks prior to study entry. | |
| Interventions | Experimental group: Total parenteral nutrition and chemotherapy. Participants were to receive 28 days of central parenteral hyperalimentation at the level of 30 ‐ 35 kcal and 0.2 ‐ 0.3 N/kg body weight/day. Chemotherapy (5‐fluorouracil + methyl CCNU) was begun on the 14th day after these nutrient levels were reached. Only 1 course of total parenteral nutrition was administered; afterwards total oral intake as wished was tolerated.(n = 25) Control group: No intervention. Control group were begun immediately on an identical chemotherapy regimen and allowed to eat as they wished. (n = 25) Co‐intervention: Chemotherapy | |
| Outcomes | Overall median survival (days) | |
| Study dates | Not stated | |
| Notes | We found no contact information for the authors. | |
| Risk of bias | ||
| Bias | Authors' judgement | Support for judgement |
| Random sequence generation (selection bias) | Unclear risk | Not described |
| Allocation concealment (selection bias) | Low risk | The trial used a sealed‐envelope system developed by the support contractor. |
| Blinding of participants and personnel (performance bias) | High risk | Blinding was not performed. |
| Blinding of outcome assessment (detection bias) | Unclear risk | Not described |
| Incomplete outcome data (attrition bias) | Unclear risk | 5 (10%) of the participants were withdrawn from the trial and the analyses. It was unclear how the trial dealt with missing data. |
| Selective reporting (reporting bias) | High risk | No protocol could be obtained and the trial did not report on all‐cause mortality or serious adverse events. |
| For‐profit bias | Low risk | The study was funded by NIH contract NO1‐CP‐65892, NIH Grants RR39 and 16255, the American Legion Gioia Osborne Cancer Research Fund, and the state of Georgia Contract Cancer‐Nutrition. |
| Other bias | Low risk | The trial appeared to be free of other components that could put it at risk of bias. |
| Methods | Randomised clinical trial, Germany | |
| Participants | 63 hospitalised adults admitted with decompensated liver cirrhosis, at nutritional risk according to the trialist Male:Female = not stated Mean age = not stated Exclusion criteria: none stated | |
| Interventions | Experimental group: Protein‐rich enteral nutrition (35 kcal/kg body weight and 1.5 g protein/kg body weight) for 14 days(n = 13) Control group: Standard hospital diet(n = 12) | |
| Outcomes | Muscle function, prothrombin time, hand‐grip strength, subjective global assessment, bilirubin, albumin | |
| Study dates | Not stated | |
| Notes | We contacted the authors on 19th August 2015 by email: [email protected]. We received no reply. | |
| Risk of bias | ||
| Bias | Authors' judgement | Support for judgement |
| Random sequence generation (selection bias) | Unclear risk | Not described |
| Allocation concealment (selection bias) | Unclear risk | Not described |
| Blinding of participants and personnel (performance bias) | Unclear risk | Not described |
| Blinding of outcome assessment (detection bias) | Unclear risk | Not described |
| Incomplete outcome data (attrition bias) | Unclear risk | The number of participants with incomplete data was not reporteded. |
| Selective reporting (reporting bias) | Unclear risk | No protocol could be obtained and the trial did not report on all‐cause mortality or serious adverse events. |
| For‐profit bias | Unclear risk | It was unclear how the trial was funded. |
| Other bias | Low risk | The trial appeared to be free of other components that could put it at risk of bias. |
| Methods | Randomised clinical trial, Korea | |
| Participants | 31 hospitalised adults with a diagnosis of advanced cancer with no future plans for anticancer treatment, at nutritional risk due to being in intensive care Male:Female = 19:12 Mean age = 59 years Exclusion criteria: cardiac or renal disease that restricted the administration of fluid; an electrolyte controlled diabetes (HbA1c > 8% despite therapy); an indication of unsuitability for participating in the trial as determined by the attending physician | |
| Interventions | Experimental group: Parenteral nutrition. The Nutritional Support Team determined the parenteral nutrition composition during initial periods of the study treatment. All types of marketed intravenous amino acid and fat emulsions were allowed, including ready‐to‐use products. Treatment was continued from randomisation until death or withdrawal of consent.(n = 16) Control group: Treatment as usual (n = 15) Cointervention: Participants received intravenous fluid. The total amount of fluid was determined by the attending physician with a maximum of 30 ml/kg a day in addition to replacement of abnormal losses from the previous day to meet the physiologic fluid requirement of healthy adults. The fluids were normal saline, half saline or dextrose water. Decision of total administered calories was made by the attending physician, but limited to under the 20 kcal/kg a day, which is the minimum energy requirement of a bedridden person. | |
| Outcomes | Overall survival, total administered calories | |
| Study dates | June 2011 to December 2011 | |
| Notes | We did not obtain the author's email until late in the writing phase of the review, and have not contacted them. | |
| Risk of bias | ||
| Bias | Authors' judgement | Support for judgement |
| Random sequence generation (selection bias) | Unclear risk | Not described |
| Allocation concealment (selection bias) | Low risk | Random allocation was made by research staff of Seoul Medical Center Research Institute. Allocated groups were announced to investigators at the time of assignment of each participant by telephone call. |
| Blinding of participants and personnel (performance bias) | High risk | No blinding of participants and personnel was performed. |
| Blinding of outcome assessment (detection bias) | Unclear risk | Not described |
| Incomplete outcome data (attrition bias) | Low risk | There were no dropouts. |
| Selective reporting (reporting bias) | Unclear risk | No protocol could be obtained, and all‐cause mortality and serious adverse events were not reported. |
| For‐profit bias | Low risk | This study received 2011 grant of Seoul Medical Center Research Institute. |
| Other bias | Low risk | The trial appeared to be free of other components that could put it at risk of bias. |
| Methods | Randomised clinical trial, Germany | |
| Participants | 32 hospitalised adults with acute leukaemia, at nutritional risk due to weight loss > 5% within 3 months or acute weight < 90% ideal body weight Male:Female = approximately 14:16 Exclusion criteria: metabolic diseases; renal or liver insufficiency; need for artificial nutrition | |
| Interventions | Experimental group: General nutrition support; intensified oral nutrition. Participants received nutrition education, daily visits by a dietitian and recording of food intake, as well as a weekly assessment of subjective well‐being. Intervention lasted throughout the whole tumour therapy (median 22 weeks). (n = 16) Control group: No intervention(n = 16) Co‐intervention: All received menus of free choice, with a daily offer of 1.0 ‐ 2.0 g protein, 30 ‐ 50 kcal/kg body weight, depending on the pretreatment nutritional status | |
| Outcomes | Septic episodes, days with body temperatures above 38.5 °C, mortality, nutritional status, weight, tumour treatment side effects, amount of complete remissions, energy intake, nutrient intake, quality of life (only experimental group) | |
| Study dates | Not stated | |
| Notes | We found no contact information for the authors. | |
| Risk of bias | ||
| Bias | Authors' judgement | Support for judgement |
| Random sequence generation (selection bias) | Unclear risk | The trial was described as being randomised, but it was unclear how the sequence was generated. |
| Allocation concealment (selection bias) | Unclear risk | No described |
| Blinding of participants and personnel (performance bias) | Unclear risk | Not described |
| Blinding of outcome assessment (detection bias) | Unclear risk | Not described |
| Incomplete outcome data (attrition bias) | Unclear risk | The number of participants with incomplete data was not reported. |
| Selective reporting (reporting bias) | Unclear risk | No protocol could be obtained, and the trial did not properly report serious adverse events. All‐cause mortality was reported. |
| For‐profit bias | Unclear risk | It was unclear how the trial was funded. |
| Other bias | Low risk | The trial appeared to be free of other components that could put it at risk of bias. |
| Methods | Randomised clinical trial, Italy | |
| Participants | 20 hospitalised adults with a clinical or pathologic diagnosis of cancer of the stomach, at nutritional risk due to weight loss of 10% with respect to usual body weight Male:Female = 10:10 Mean age = 69.5 years | |
| Interventions | Experimental group: standard hospital oral diet plus PN. The PN formula contained 0.2 g/kg/day of nitrogen and 30 nonprotein kcal/kg/day. The PN was given as a balanced mixture of D‐glucose, lipids (20% Intralipid), and amino acids, electrolytes, vitamins, and trace elements. (n = 10) Control group: standard hospital oral diet(n = 10) | |
| Outcomes | Percentage of cells incorporating bromodeoxyuridine in vitro and percentage of cells in the S‐phase as measured by flow cytometry | |
| Study dates | Not stated | |
| Notes | We contacted the authors on 23rd June 2015 by email: [email protected].. We received no reply. | |
| Risk of bias | ||
| Bias | Authors' judgement | Support for judgement |
| Random sequence generation (selection bias) | Low risk | Randomisation was performed by using a central computerised system. |
| Allocation concealment (selection bias) | Unclear risk | Not described |
| Blinding of participants and personnel (performance bias) | High risk | The personnel were not blinded. |
| Blinding of outcome assessment (detection bias) | Unclear risk | Not described |
| Incomplete outcome data (attrition bias) | Low risk | There were no dropouts or withdrawals. |
| Selective reporting (reporting bias) | High risk | No protocol could be obtained and the trial did not report on all‐cause mortality or serious adverse events. |
| For‐profit bias | Unclear risk | It was unclear how the trial was funded. |
| Other bias | Low risk | The trial appeared to be free of other components that could put it at risk of bias. |
| Methods | Randomised clinical trial, UK | |
| Participants | 40 hospitalised adults undergoing oesophageal resection for carcinoma, at nutritional risk due to major surgery Male:Female = 28:12 Mean age = 67.3 years | |
| Interventions | Experimental group: Isocaloric enteral feed (1048 kcal/l and 40 g protein/l)(n = 20) Control group: Standard intravenous fluids (5% glucose)(n = 20) | |
| Outcomes | Weight, BMI, haematological and serological parameters, days in hospital, duration of enteral feed, death, complications | |
| Study dates | Not stated | |
| Notes | We contacted the authors on 23rd June 2015 by email: richard.page@ccl‐tr.nwest.nhs.uk. We received no reply. | |
| Risk of bias | ||
| Bias | Authors' judgement | Support for judgement |
| Random sequence generation (selection bias) | Unclear risk | The trial was described as being randomised, but it was unclear how the sequence was generated. |
| Allocation concealment (selection bias) | Low risk | The trial used sealed envelopes. |
| Blinding of participants and personnel (performance bias) | Unclear risk | Not described |
| Blinding of outcome assessment (detection bias) | Unclear risk | Not described |
| Incomplete outcome data (attrition bias) | Unclear risk | The number of participants with incomplete data was not reported. |
| Selective reporting (reporting bias) | Low risk | The trial reported serious adverse events and all‐cause mortality. |
| For‐profit bias | Unclear risk | It was unclear how the trial was funded. |
| Other bias | Low risk | The trial appeared to be free of other components that could put it at risk of bias. |
| Methods | Randomised clinical trial, China | |
| Participants | 89 hospitalised adults undergoing either gastrointestinal, urologic neoplasms, cardiothoracic, hepatobiliary or pancreas surgery, at nutritional risk due to major surgery Male:Female = 47:42 Mean age = 46 years Exclusion criteria: none stated | |
| Interventions | Experimental group: Participants received continuous infusion of enteral nutrition liquid by using nasal‐jejunal feeding‐tube, infusion speed from 25 ml/hr to 100 ml/hr, for 15 days.(n = 49) Control group: Home‐made diet by oral feeding for 15 days(n = 40) | |
| Outcomes | Total lymphocyte counts, serum albumin, and wound‐healing rate, thyroxin and albumin levels, cost effectiveness | |
| Study dates | Not stated | |
| Notes | We tried and failed 5 times to contact the author by phone. | |
| Risk of bias | ||
| Bias | Authors' judgement | Support for judgement |
| Random sequence generation (selection bias) | Unclear risk | Not described |
| Allocation concealment (selection bias) | Unclear risk | Not described |
| Blinding of participants and personnel (performance bias) | High risk | Participants and personnel were not blinded. |
| Blinding of outcome assessment (detection bias) | Unclear risk | Not described |
| Incomplete outcome data (attrition bias) | Unclear risk | The number of participants with incomplete data was not reported. |
| Selective reporting (reporting bias) | Unclear risk | No protocol could be obtained and the trial did not report on all‐cause mortality or serious adverse events. |
| For‐profit bias | Unclear risk | It was unclear how the trial was funded. |
| Other bias | Low risk | The trial appeared to be free of other components that could put it at risk of bias. |
| Methods | Randomised clinical trial, USA | |
| Participants | 32 hospitalised adults either between 18 and 50 and admitted within 24 hours of burn injury with at least 20% of total body surface area burns, or younger than 18 or older than 50 and with at least 10% total body surface area burns, at nutritional risk due to trauma Male:Female = 19:8 (analysed) Mean age = 46.5 years Exclusion criteria: Pre‐existing medical conditions that led to inanition and wasting (e.g. such as adult immunodeficiency syndrome, cancer), had high‐voltage electrical injuries, were admitted to the burn centre for treatment of an exfoliative skin disorder, or were treated with the volumetric diffusive respirator (VDR) for smoke inhalation injury because of the inability to obtain indirect calorimetry measurements on the VDR | |
| Interventions | Experimental group: Early feeding through nasogastric tube group initiated within 24 hrs(n = 16) Control group: No intervention(n = 16) Co‐intervention: Nasogastric tube placement at admission. Normal oral feeding | |
| Outcomes | REE/BEE, weight, transthyretin, transferrin, urine urea nitrogen, feeding complications, infections, number of antibiotic days, number of ventilator days, number of ICU days, length of acute days, mortality | |
| Study dates | Not stated | |
| Notes | We contacted the authors on 19th August 2015 by email: [email protected]. We received no reply. | |
| Risk of bias | ||
| Bias | Authors' judgement | Support for judgement |
| Random sequence generation (selection bias) | Unclear risk | The trial was described as being randomised, but it was unclear how the sequence was generated. |
| Allocation concealment (selection bias) | Unclear risk | The trial used sealed envelopes but it was unclear if they were opaque. |
| Blinding of participants and personnel (performance bias) | Unclear risk | Not described |
| Blinding of outcome assessment (detection bias) | Unclear risk | Not described |
| Incomplete outcome data (attrition bias) | Unclear risk | The trial reported 5 dropouts, but it was unclear from which group and the trial did not allow proper intention‐to‐treat methodology. |
| Selective reporting (reporting bias) | Unclear risk | No protocol could be obtained, and the trial did not properly report serious adverse events. |
| For‐profit bias | Low risk | The trial was funded by a non‐profit organisation (Sponsored by the North Carolina Jaycee Burn Center and General Clinical Research Center Program of the Division of Research Resources). |
| Other bias | Low risk | The trial appeared to be free of other components that could put it at risk of bias. |
| Methods | Randomised clinical trial, China | |
| Participants | 22 hospitalised adults admitted with severe burn injuries (TBSA > 50%), at nutritional risk due to trauma Male:Female = 15:7 Mean age = 31 years Exclusion criteria: moderate‐to‐severe inhalation injury, diarrhoea or ileus | |
| Interventions | Experimental group: Early enteral feeding. Participants were given ENSURE (carbohydrate 54.5%, protein 14%, lipid 31.5%) oral or nasal feeding. 78 ‐ 80 ml/3hr, 0.75 Kcal/ml in first 24 hrs after burn, 100 ‐ 150 ml/3hr, 0.75 ‐ 1 Kcal/ml within the next 24 hrs.(n = 13) Control group: Delayed enteral feeding. Oral liquid diet 48 hrs after burn(n = 9) Co‐intervention: Conventional therapy | |
| Outcomes | Plasma, endotoxin TNF‐α, urine mannitol, urinary lactulose | |
| Study dates | Not stated | |
| Notes | We tried and failed 3 times to contact the author by phone. | |
| Risk of bias | ||
| Bias | Authors' judgement | Support for judgement |
| Random sequence generation (selection bias) | Unclear risk | Not described |
| Allocation concealment (selection bias) | Unclear risk | Not described |
| Blinding of participants and personnel (performance bias) | High risk | Participants and personnel were not blinded. |
| Blinding of outcome assessment (detection bias) | Unclear risk | Not described |
| Incomplete outcome data (attrition bias) | Unclear risk | The number of participants with incomplete data was not reported. |
| Selective reporting (reporting bias) | Unclear risk | No protocol could be obtained and the trial did not report on all‐cause mortality or serious adverse events. |
| For‐profit bias | Unclear risk | It was unclear how the trial was funded. |
| Other bias | Low risk | The trial appeared to be free of other components that could put it at risk of bias. |
| Methods | Randomised clinical trial, USA | |
| Participants | 42 hospitalised adults undergoing aggressive induction‐consolidation‐late intensification chemotherapy for advanced diffuse lymphoma Male:Female = 23:18 (gender not reported for 1 participant) Mean age = 42 years Exclusion: None stated | |
| Interventions | Experimental group: TPN during the first 14 days of each 28‐day induction and late intensification chemotherapy cycle. TPN contained 500 mL of Freamine II as well as vitamins and minerals. (n = 20) Control: no intervention (n = 21) Co‐intervention: chemotherapy with ProMACE and MOPP, oral intake as wished. | |
| Outcomes | Survival, nutritional markers, blood count | |
| Study dates | Not stated | |
| Notes | We could obtain no contact information for the authors. | |
| Risk of bias | ||
| Bias | Authors' judgement | Support for judgement |
| Random sequence generation (selection bias) | Unclear risk | Not described |
| Allocation concealment (selection bias) | Unclear risk | Not described |
| Blinding of participants and personnel (performance bias) | Unclear risk | Not described |
| Blinding of outcome assessment (detection bias) | Unclear risk | Not described |
| Incomplete outcome data (attrition bias) | Low risk | Under 5% of participants had incomplete outcome data. |
| Selective reporting (reporting bias) | Low risk | The trial reports mortality and nutrition‐related complications. |
| For‐profit bias | Unclear risk | It was unclear how the trial was funded. |
| Other bias | Low risk | The trial appeared to be free of other components that could put it at risk of bias. |
| Methods | Randomised clinical trial, UK | |
| Participants | 381 hospitalised elderly adults admitted from home and with no known malignancy, had the ability to swallow, and were not obese (BMI < 75th percentile), at nutritional risk according to anthropometrics. Male:Female = not reported Median age = 83.years Exclusion criteria: none specified | |
| Interventions | Experimental group: Normal ward diet + oral supplements (1.5 kcal/mL energy, intended to provide 22.5 g protein and 540 kcal energy a day. It was prescribed 3 times daily with 120 mL each time (8:00 AM, 2:00 PM, and 6:00 PM).(n =186) | |
| Outcomes | Total energy intake, weight, arm muscle circumference, mortality, functional recovery, discharge placement, length of hospital stay | |
| Study dates | Not stated | |
| Notes | We contacted the authors on 19th August 2015 by email: [email protected] . We received no reply. | |
| Risk of bias | ||
| Bias | Authors' judgement | Support for judgement |
| Random sequence generation (selection bias) | Unclear risk | Not described |
| Allocation concealment (selection bias) | Unclear risk | The trial used sealed envelopes, but it was unclear if they were opaque. |
| Blinding of participants and personnel (performance bias) | High risk | The trial was a non‐placebo trial, and the participants were not blinded. |
| Blinding of outcome assessment (detection bias) | Low risk | The dietician performing the outcome assessment was blinded to the intervention. |
| Incomplete outcome data (attrition bias) | Unclear risk | There were above 5% dropouts according to weight, and they were not accounted for using proper methodology. |
| Selective reporting (reporting bias) | Unclear risk | No protocol could be obtained and serious adverse events was not reported. |
| For‐profit bias | High risk | The trial received supplements from a company that might have conflict of interest (Frusenius UK Ltd). |
| Other bias | Low risk | The trial appeared to be free of other components that could put it at risk of bias. |
| Methods | Randomised clinical trial, Spain | |
| Participants | 84 hospitalised adults entering the Digestive Surgery Service and with planned surgery, at nutritional risk due to the trialist classifying them as at risk Male:Female = 33:51 Mean age = 57 years | |
| Interventions | Experimental group: Received peripheral parenteral nutrition (25.30 g amino acids/3L, 50 g carbohydrates/3L)(n = 22) Control group: Received conventional serum therapy of 5% glucose(n = 22) | |
| Outcomes | Percentage of ideal weight, albumin, haemoglobin, arm circumference, transferrin | |
| Study dates | Not stated | |
| Notes | We found no contact information for the authors. | |
| Risk of bias | ||
| Bias | Authors' judgement | Support for judgement |
| Random sequence generation (selection bias) | Unclear risk | Not described |
| Allocation concealment (selection bias) | Unclear risk | Not described |
| Blinding of participants and personnel (performance bias) | Unclear risk | Not described |
| Blinding of outcome assessment (detection bias) | Unclear risk | Not described |
| Incomplete outcome data (attrition bias) | Unclear risk | The number of participants with incomplete data was not reported. |
| Selective reporting (reporting bias) | Unclear risk | No protocol could be obtained and the trial did not report on all‐cause mortality or serious adverse events. |
| For‐profit bias | Unclear risk | It was unclear how the trial was funded. |
| Other bias | Low risk | The trial appeared to be free of other components that could put it at risk of bias. |
| Methods | Randomised clinical trial, Latvia | |
| Participants | 29 hospitalised adults undergoing surgery for severe pancreatitis, at nutritional risk due to major surgery Mean age = 51 years Male:female = not reported Exclusion criteria: not reported | |
| Interventions | Experimental group: Postoperative enteral nutrition during the first 24 hrs after operation with Pepti 2000 until the participant could receive standard nutrition.(n = 11) Co‐interventions: Conventional intravenous fluids | |
| Outcomes | APACHE‐score, number of complications, length of hospital stay, length of stay in ICU | |
| Study dates | January 1997 to February 1998 | |
| Notes | We contacted the authors on 23rd June 2015 by email: [email protected]. We received no reply. | |
| Risk of bias | ||
| Bias | Authors' judgement | Support for judgement |
| Random sequence generation (selection bias) | Unclear risk | Not described |
| Allocation concealment (selection bias) | Unclear risk | Not described |
| Blinding of participants and personnel (performance bias) | High risk | Only the experimental group had a tube. |
| Blinding of outcome assessment (detection bias) | Unclear risk | Not described |
| Incomplete outcome data (attrition bias) | Unclear risk | The number of participants with incomplete data was not reported. |
| Selective reporting (reporting bias) | Low risk | Serious adverse events and mortality were reported. |
| For‐profit bias | Unclear risk | It was unclear how the trial was funded. |
| Other bias | Low risk | The trial appeared to be free of other components that could put it at risk of bias |
| Methods | Randomised clinical trial, Latvia | |
| Participants | 60 hospitalised adults undergoing surgery for peritonitis and severe pancreatitis. None of the included participants received TPN before surgery. At nutritional risk due to major surgery Male:Female = 45:15 Mean age = 51.4 years Exclusion criteria: none specified | |
| Interventions | Experimental group: Jejunal feeding was started during the 1st 12 hrs postoperatively in the ICU with full‐strength whole‐protein formula (1 kcal/mL) or oligopeptide‐based formula (1 kcal/mL), providing at least 300 mL each day.(n = 30) Control group: Standard intravenous fluids(n = 30) | |
| Outcomes | Complications, SIRS, death caused by multiple organ dysfunction syndrome, mortality | |
| Study dates | January 1997 to April 1999 | |
| Notes | We contacted the authors on 23rd June 2015 by email: [email protected]. We received no reply. | |
| Risk of bias | ||
| Bias | Authors' judgement | Support for judgement |
| Random sequence generation (selection bias) | Unclear risk | Not described |
| Allocation concealment (selection bias) | Unclear risk | Not described |
| Blinding of participants and personnel (performance bias) | High risk | Only the experimental group received a tube. |
| Blinding of outcome assessment (detection bias) | Unclear risk | Not described |
| Incomplete outcome data (attrition bias) | Unclear risk | The number of participants with incomplete data was not reported. |
| Selective reporting (reporting bias) | Low risk | No protocol was found. Serious adverse events and all‐cause mortality were reported. |
| For‐profit bias | High risk | The trial was funded by Amaija ltd. (Nutrition manufacturer). |
| Other bias | Low risk | The trial appeared to be free of other components that could put it at risk of bias. |
| Methods | Randomised clinical trial, USA | |
| Participants | 116 hospitalised adults with 1. 1st acute stroke event within 4 weeks of admission to an inpatient rehabilitation facility; 2. haemorrhagic or ischaemic stroke documented clinically and by neuroimaging; 3. significant weight loss as indicated by unintentional weight loss of at least 2.5% within 2 weeks following Male:Female = 68:48 Mean age = 74.2 | |
| Interventions | Experimental group: The “intensive” nutritional supplement was Novasource 2.0 (240 calories, 11 g of proteins).(n = 58) Control group: The “standard” nutritional supplement was Resource Standard (127 calories, 5 g of protein).(n = 58) The supplements were always given within 72 hrs after arriving at the rehabilitation facility. | |
| Outcomes | FIM‐score, 2‐minute walking test, 6‐minute walking test, weight, albumin, transferrin, % IBW | |
| Study dates | Not stated | |
| Notes | We contacted the authors on 23rd June 2015 by email: [email protected]. We received no reply. | |
| Risk of bias | ||
| Bias | Authors' judgement | Support for judgement |
| Random sequence generation (selection bias) | Low risk | 10‐block randomisation |
| Allocation concealment (selection bias) | Low risk | Sealed opaque envelopes |
| Blinding of participants and personnel (performance bias) | Low risk | The trial was blinded to the participants and personnel. |
| Blinding of outcome assessment (detection bias) | Low risk | The investigators performing the outcome assessment were blinded. |
| Incomplete outcome data (attrition bias) | High risk | There were more than 5% dropouts, and the dropouts in the 2 groups could not be described as being similar. |
| Selective reporting (reporting bias) | Unclear risk | No protocol could be obtained and the trial did not report on all‐cause mortality or serious adverse events. |
| For‐profit bias | Low risk | No pharmaceutical company funded the trial. |
| Other bias | Low risk | The trial appeared to be free of other components that could put it at risk of bias. |
| Methods | Randomised clinical trial, country unknown. | |
| Participants | 54 hospitalised adults admitted for 1 of the following elective gastrointestinal surgical procedures: Gastro‐oesophagectomy, total and subtotal gastrectomy for carcinoma, open cholecystectomy, and exploration of common bile duct, palliative cholecystojejunostomy and enterostomy or choledochojejunostomy and enterostomy for carcinoma of the pancreas, ileocolonic resection, hemicolectomy or anterior resection of colon and abdominoperineal resection of colon; at nutritional risk due to major surgery Male:Female = 19:21 (only participants that completed the study) Mean age: 60.7 years (only participants that completed the study) | |
| Interventions | Experimental group: Oral nutrition sip feed of 200 ml. (1.5 kcal/ml, 7.8 g/L)(n = 27) Control group: No intervention(n = 27) Co‐intervention: Standard hospital diet | |
| Outcomes | Nutritional status, nutritional intake, monitoring and complications | |
| Study dates | Not stated | |
| Notes | We could obtain no contact information for the authors. | |
| Risk of bias | ||
| Bias | Authors' judgement | Support for judgement |
| Random sequence generation (selection bias) | Unclear risk | Not described |
| Allocation concealment (selection bias) | Unclear risk | Not described |
| Blinding of participants and personnel (performance bias) | Unclear risk | Not described |
| Blinding of outcome assessment (detection bias) | Unclear risk | Not described |
| Incomplete outcome data (attrition bias) | High risk | More than 5% dropped out, and the trial did not use proper methodology to deal with missing data. |
| Selective reporting (reporting bias) | Low risk | No protocol could be obtained but the trial reported serious adverse events and mortality. |
| For‐profit bias | High risk | The trial was funded by Nutricia. |
| Other bias | Low risk | The trial appeared to be free of other components that could put it at risk of bias. |
| Methods | Randomised clinical trial, USA | |
| Participants | 18 hospitalised adults with hypoalbuminaemic cirrhosis admitted for liver transplantation, at nutritional risk due to major surgery Male:Female = 9:9 Mean age = 47.5 years | |
| Interventions | Experimental group: TPN (non‐protein caloric intake 35 kcal/kg and 1.5 g/kg/day amino acids)(n = 10) Control group: No specific nutritional therapy, standard intravenous isotonic glucose solutions(n = 8) | |
| Outcomes | GCS, nitrogen balance, serum ammonia, bilirubin, days intubated, days in ICU, length of stay, hospital costs, mortality | |
| Study dates | Not stated | |
| Notes | We contacted the authors on 19th August 2015 by email: [email protected]. We received no reply. | |
| Risk of bias | ||
| Bias | Authors' judgement | Support for judgement |
| Random sequence generation (selection bias) | Unclear risk | Not described |
| Allocation concealment (selection bias) | Unclear risk | Not described |
| Blinding of participants and personnel (performance bias) | High risk | The trial was described as being partially blinded, but the control group was not blinded. |
| Blinding of outcome assessment (detection bias) | Unclear risk | Not described |
| Incomplete outcome data (attrition bias) | Unclear risk | The number of participants with incomplete data was not reported. |
| Selective reporting (reporting bias) | Unclear risk | No protocol could be obtained, and the trial did not report serious adverse events. |
| For‐profit bias | Unclear risk | It was unclear how the trial was funded. |
| Other bias | Low risk | The trial appeared to be free of other components that could put it at risk of bias. |
| Methods | Randomised clinical trial, USA | |
| Participants | 161 hospitalised adults undergoing major abdominal surgery, at nutritional risk due to major surgery Male:Female = 77:84 Mean age = 53.5 years | |
| Interventions | Experimental group: Early feeding group, clear liquid diet on 1st postoperative day, and advanced to a regular diet with 24 ‐ 48 hrs(n = 80) | |
| Outcomes | Vomiting, abdominal distention, length of ileus, tolerance of regular diet, length of hospitalisation, and complications | |
| Study dates | November 1992 and April 1994 | |
| Notes | We could obtain no contact information for the authors. | |
| Risk of bias | ||
| Bias | Authors' judgement | Support for judgement |
| Random sequence generation (selection bias) | Unclear risk | Not described |
| Allocation concealment (selection bias) | Unclear risk | Not described |
| Blinding of participants and personnel (performance bias) | Unclear risk | Not described |
| Blinding of outcome assessment (detection bias) | Unclear risk | Not described |
| Incomplete outcome data (attrition bias) | Unclear risk | The number of participants with incomplete data was not reported. |
| Selective reporting (reporting bias) | Low risk | All‐cause mortality and serious adverse events were reported. |
| For‐profit bias | Unclear risk | It was unclear how the trial was funded. |
| Other bias | Low risk | The trial appeared to be free of other components that could put it at risk of bias. |
| Methods | Randomised clinical trial, China | |
| Participants | 167 adult hospitalised adults, at nutritional risk due to orthopaedic injury operation Male:Female = 88:79 Mean age: 58.8 years Excluded criteria: None specified | |
| Interventions | Experimental group: Enteral nutrition: Short peptide nutrient solution was taken orally the 1st day after operation. 80 ‐ 160 g of short peptide nutrition was diluted to 300 ml with water and the treatment dose was dependent on participant's disease degree and health status.(n = 85) Control group: Standard care after the operation (n = 82) | |
| Outcomes | Time of leaving bed, hospital stays, anus exhaust time, effective rate and complications | |
| Study dates | Not stated | |
| Notes | We contacted the authors by phone. We received information on random sequence generation. | |
| Risk of bias | ||
| Bias | Authors' judgement | Support for judgement |
| Random sequence generation (selection bias) | Low risk | The randomisation was conducted by random table. |
| Allocation concealment (selection bias) | Unclear risk | Not described |
| Blinding of participants and personnel (performance bias) | High risk | The participants and personnel were not blinded. |
| Blinding of outcome assessment (detection bias) | Unclear risk | Whether the outcome assessors were blinded was not reported. |
| Incomplete outcome data (attrition bias) | Unclear risk | The numbers and reasons for withdrawals and dropouts were not reported. |
| Selective reporting (reporting bias) | Unclear risk | All‐cause mortality and serious adverse events were reported. |
| For‐profit bias | Unclear risk | It was unclear how the trial was funded. |
| Other bias | Low risk | The trial may or may not be free of other components that could put it at risk of bias. |
| Methods | Randomised clinical trial, France | |
| Participants | 20 hospitalised adults undergoing aortabifemoral bypass, at nutritional risk due to major surgery Male:female = not stated Mean age = 56.5 years Exclusion: diseases predisposing malnutrition, renal or hepatic disease | |
| Interventions | Experimental group: TPN from 12 hrs post‐operatively to day 4 at the rate of 0.16 N/kg/day and 16.7 kcal/kg/day with 50% from carbohydrates and 50% from lipids (n = 10) Control group: standard post‐operative fluids (n = 10) | |
| Outcomes | IPN prior to the surgery and on day 4, triceps skinfold thickness, albumin, transferrin, delayed cutaneus hypersensibility defined on a scale from 0 to 2, protein catabolism, blood loss during surgery, complications, length of hospital stay, cost benefit | |
| Study dates | Not stated | |
| Notes | We found no contact information for the authors. | |
| Risk of bias | ||
| Bias | Authors' judgement | Support for judgement |
| Random sequence generation (selection bias) | Unclear risk | Not described |
| Allocation concealment (selection bias) | Unclear risk | Not described |
| Blinding of participants and personnel (performance bias) | Unclear risk | Not described |
| Blinding of outcome assessment (detection bias) | Unclear risk | Not described |
| Incomplete outcome data (attrition bias) | Low risk | No dropouts |
| Selective reporting (reporting bias) | Unclear risk | Mortality was not reported. |
| For‐profit bias | Unclear risk | It was unclear how the trial was funded. |
| Other bias | Low risk | The trial appeared to be free of other components that could put it at risk of bias. |
| Methods | Randomised clinical trial, USA | |
| Participants | 55 hospitalised adults undergoing analogues marrow or blood transplantation Male:Female = not described Mean age = not described Exclusion criteria: Not reported | |
| Interventions | Experimental: TPN 30 ‐ 35 kcal/kg and 1.5 ‐ 1.75 g protein/kg(n = 28) Control: No intervention(n = 28) Co‐intervention: Oral diet | |
| Outcomes | Length of stay, albumin, hand‐grip strength (not used) | |
| Study dates | Not stated | |
| Notes | We contacted the authors by email: [email protected]. The author responded with information on blinding. | |
| Risk of bias | ||
| Bias | Authors' judgement | Support for judgement |
| Random sequence generation (selection bias) | Unclear risk | Not described |
| Allocation concealment (selection bias) | Unclear risk | Not described |
| Blinding of participants and personnel (performance bias) | High risk | Not blinded |
| Blinding of outcome assessment (detection bias) | High risk | The outcome assessors were not blinded. |
| Incomplete outcome data (attrition bias) | Unclear risk | The number of participants with incomplete data was not reported. |
| Selective reporting (reporting bias) | Unclear risk | No protocol could be obtained and the trial did not report mortality or complications. |
| For‐profit bias | Low risk | The trial was funded by the local hospital. |
| Other bias | Unclear risk | The trial appeared to be free of other components that could put it at risk of bias. |
| Methods | Randomised clinical trial, Switzerland | |
| Participants | 157 hospitalised adults undergoing surgery with pelvic lymph node dissection, cystectomy and ileal diversion for bladder cancer, at nutritional risk due to major surgery Male:Female = 106:51 Mean age = 67 years Exclusion criteria: previous pelvic lymph node dissection, previous radiation therapy, prior bowel surgery, severe hepatic or cardiac dysfunction, an inability to give fully informed consent | |
| Interventions | Experimental group: TPN consisting of Nutriflex special 70/240 (B. Braun Medical, Melsungen, Germany), a solution with a total energy of 1240 kcal/1000 ml and containing polyamino acids, glucose, and electrolytes. TPN (1500 ml/day; total 1860 kcal/day; 105 g polyamino acids/day; 360 g glucose/day; 0 g lipids/day) was administered continuously for 5 days starting on postoperative day 1. No intravenous supplementation of vitamins or trace elements were given. An additional 30 IU Actrapid HM (Novo Nordisk, Copenhagen, Denmark) and 1875 IU heparin (Liquemin; Drossapharm, Basel‐Stadt, Switzerland) every 24 hrs were added to the TPN solution. (n = 74) Control group: Ringer’s lactate solution Co‐interventions: Oral intake was started with clear fluids on the day of surgery, with fluids started on postoperative day 1. Solid diet was resumed on the return of active bowel sounds and when fluids were well tolerated. Perioperatively, a central venous catheter was placed in all participants. Perioperative antibiotic therapy consisted of aminoglycoside and metronidazole for 48 hrs and amoxicilin/clavulanic acid until removal of all stents and catheters. Perioperatively, 3000 ‐ 4000 ml of parenteral crystalloids were routinely administered. Combined general and epidural anaesthesia were given intra‐operatively. Postoperative epidural (T9 ‐ T10) analgesia was routinely used, but systemic morphine derivates were avoided. To stimulate postoperative bowel function, subcutaneous injections of 0.5 mg neostigmine methylsulfate up to 6 times a day were administered to all in similar distribution starting on postoperative day 2 and continuing until bowel activity resumed. Anti‐emetics and other prokinetic drugs were not routinely administered and only given as needed. Low‐molecular‐weight heparin (Fraxiparine) was started on the evening before surgery and maintained for at least 10 days. | |
| Outcomes | Occurence of postoperative complications, time to recovery of bowel function, biochemical nutritional (serum albumin, serum prealbumin, serum total protein) and inflammatory (C‐reactive protein) parametres, length of hospital stay, cost attributed to the TPN, time to full diet resumption | |
| Study dates | September 2008 and March 2011 | |
| Notes | We contacted the authors on 07th April 2016 by email: [email protected]. | |
| Risk of bias | ||
| Bias | Authors' judgement | Support for judgement |
| Random sequence generation (selection bias) | Low risk | Randomisation was done by a computer‐based programme. |
| Allocation concealment (selection bias) | Unclear risk | Not described |
| Blinding of participants and personnel (performance bias) | High risk | Blinding was not performed. |
| Blinding of outcome assessment (detection bias) | Unclear risk | Not described |
| Incomplete outcome data (attrition bias) | Low risk | No drop‐outs, none lost to follow‐up |
| Selective reporting (reporting bias) | Low risk | No protocol could be obtained but the trial reported complications and mortality. |
| For‐profit bias | Low risk | The trial was not funded by any company that might have a vested interest in the results. |
| Other bias | Low risk | The trial appeared to be free of other components that could put it at risk of bias. |
| Methods | Randomised clinical trial, Canada | |
| Participants | 31 hospitalised adults with small‐cell lung cancers, at nutritional risk due to trialist indication Male:Female = 21:10 Mean age = 55.8 years Exclusion criteria: (a) recent myocardial infarction (< 3 months from the date of diagnosis), congestive cardiac failure, or cardiac arrhythmia; (b) documented central nervous system metastases (c) superior vena cava obstruction precluding central venous catheterisation for TPN; (d) inappropriate antidiuretic hormone syndrome; (e) other comorbid disease which rendered treatment inappropriate; (f) performance status of 4 on the ECOG scale | |
| Interventions | Experimental: the TPN provided between 1 and 1.25 g/kg body weight/day of crystalline amino acids (Travasol; Baxter‐Travenol Laboratories of Canada) and a nonprotein calorie intake of between 32 and 40 kcal/kg body weight/day given as an equicaloric mixture of dextrose and lipid (Nutralipid; Pharmacia, Canada). Depleted participants (> 5% body weight loss in the 3 months prior to diagnosis) received an amino acid intake of between 1.50 and 2.0 g/kg body weight/day and a nonprotein calorie intake of 48 to 64 kcal/kg body weight/day. Both the protein and calorie intake were reassessed each week, and minor adjustments were made depending on clinical assessment of the nutritional status. Oral intake was restricted to noncaloric fluids. (n = 15) Control: continued to consume a self‐regulated oral diet(n = 16) Co‐interventions: chemotherapy | |
| Outcomes | Energy metabolism and substrate hormone profile | |
| Study dates | Not stated | |
| Notes | We could obtain no contact information for the authors. | |
| Risk of bias | ||
| Bias | Authors' judgement | Support for judgement |
| Random sequence generation (selection bias) | Unclear risk | Not described |
| Allocation concealment (selection bias) | Unclear risk | Not described |
| Blinding of participants and personnel (performance bias) | Unclear risk | Not described |
| Blinding of outcome assessment (detection bias) | Unclear risk | Not described |
| Incomplete outcome data (attrition bias) | Unclear risk | The number of participants with incomplete data was not reported. |
| Selective reporting (reporting bias) | Unclear risk | No protocol could be obtained and the trial did not report mortality or complications. |
| For‐profit bias | Unclear risk | It was unclear if the trial was supported by a company with an interest in a given result: "Supported by an NIH Contract with the University of Toronto (Contract NOICM‐ |
| Other bias | Low risk | The trial appeared to be free of other components that could put it at risk of bias. |
| Methods | Randomised clinical trial, Canada | |
| Participants | 10 hospitalised adults, at nutritional risk due to being 85% of ideal weight Male:Female = 5:5 Mean age = 68 years | |
| Interventions | Experimental group: nocturnal supplemental nasoenteric infusion (1000 kcal above usual caloric intake), or 1.7 times measured REE.(n = 6) Co‐intervention: normal diet | |
| Outcomes | Kcal/day, weight change, Vo2/min, RQ | |
| Study dates | Not stated | |
| Notes | We contacted the authors on 13th December 2015 by email: [email protected]. We received no reply. | |
| Risk of bias | ||
| Bias | Authors' judgement | Support for judgement |
| Random sequence generation (selection bias) | Unclear risk | Not described |
| Allocation concealment (selection bias) | Unclear risk | Not described |
| Blinding of participants and personnel (performance bias) | Low risk | The trial was a placebo study, and described how the participants and personnel were blinded. |
| Blinding of outcome assessment (detection bias) | Low risk | The trial was a placebo study, and described how the outcome assessment was blinded. |
| Incomplete outcome data (attrition bias) | Unclear risk | The number of participants with incomplete data was not reported. |
| Selective reporting (reporting bias) | Unclear risk | No protocol could be obtained, and the trial did not report on all‐cause mortality or serious adverse events. |
| For‐profit bias | High risk | The trial was funded by a pharmaceutical company (Bristol‐Myers Squibb). |
| Other bias | Low risk | The trial appeared to be free of other components that could put it at risk of bias. |
| Methods | Randomised clinical trial, Germany | |
| Participants | 80 hospitalised adults admitted for PEG placement, at nutritional risk due to being in an ICU | |
| Interventions | Experimental group: Enteral nutrition 3 hrs after PEG placement for 1 day(n = 40) Control group: i.v. fluids for 2 days(n = 40) | |
| Outcomes | RV, complications, mortality, pneumoperitoneum | |
| Study dates | Not stated | |
| Notes | We contacted the authors on 13th December 2015 by email: med2.keymling@klinikum‐meiningen.de. We received no reply. | |
| Risk of bias | ||
| Bias | Authors' judgement | Support for judgement |
| Random sequence generation (selection bias) | Unclear risk | Not described |
| Allocation concealment (selection bias) | Unclear risk | Not described |
| Blinding of participants and personnel (performance bias) | Unclear risk | Not described |
| Blinding of outcome assessment (detection bias) | Unclear risk | Not described |
| Incomplete outcome data (attrition bias) | Unclear risk | The number of participants with incomplete data was not reported. |
| Selective reporting (reporting bias) | Low risk | The trial reported serious adverse events and mortality. |
| For‐profit bias | Unclear risk | It was unclear how the trial was funded. |
| Other bias | Low risk | The trial appeared to be free of other components that could put it at risk of bias. |
| Methods | Randomised clinical trial, USA | |
| Participants | 17 hospitalised adults with severe closed‐head injury, at nutritional risk due to increased nutritional requirements Male:Female = not reported Mean age = 37.2 years Exclusion criteria: Pregnancy, age > 65 years, documented hepatic dysfunction (serum bilirubin > 2.0 mg/dL or a history of cirrhosis), hypertriglyceridaemia (> 300 mg/dL), or infection at the time of admission. People with significant intra‐abdominal injuries routinely received enteral nutrition through jejunal tubes and were not enrolled into the study. People requiring scheduled corticosteroid pharmacotherapy after the 1st 24 hrs of hospital admission were also excluded from the study. | |
| Interventions | Experimental group: Participants received parenteral nutrition (PN) at day 1 through a central venous catheter with a nutrient goal of 2 g protein/kg a day and 40 non‐protein kcal/kg a day. Maximum glucose administration was not allowed to exceed 6 mg/kg a minute. IV fat emulsion was administered and comprised 15% to 30% of non‐protein calories. The PN solution was supplemented with electrolytes and standard amounts of vitamins and trace elements.(n = 8) Control group: No intervention(n = 9) Co‐interventions: Participants were transitioned to enteral nutrition support as soon as the gastro‐intestinal tract became functional and accessible. | |
| Outcomes | T‐lymphocyte responsiveness to mitogen stimulation, proliferative response to Con A stimulation, T‐lymphocyte proliferative response, IL‐6 serum concentrations, pre‐albumin serum concentrations, A (Con A), phytohaemagglutinin (PHA), and pokeweed mitogens (PWM), peripheral blood mononuclear cells (PBMCs), urinary nitrogen excretion, immunologic function, nutrient, energy and protein intake and mortality | |
| Study dates | Not stated | |
| Notes | We contacted the authors on 30th June 2015 by email: [email protected]. We received a reply. | |
| Risk of bias | ||
| Bias | Authors' judgement | Support for judgement |
| Random sequence generation (selection bias) | Low risk | Random sequence generation was done using a table of random numbers. |
| Allocation concealment (selection bias) | Unclear risk | The allocation was concealed in sealed envelopes, but it was unclear if they were opaque. |
| Blinding of participants and personnel (performance bias) | Unclear risk | Not described |
| Blinding of outcome assessment (detection bias) | Unclear risk | Not described |
| Incomplete outcome data (attrition bias) | Unclear risk | The number of participants with incomplete data was not reported. |
| Selective reporting (reporting bias) | Unclear risk | No protocol could be obtained. The trial reported all‐cause mortality but not serious adverse events. |
| For‐profit bias | Low risk | No financial support. |
| Other bias | Low risk | The trial appeared to be free of other components that could put it at risk of bias. |
| Methods | Randomised clinical trial, Kosovo, parallel design, conducted between January 2010 – January 2012 | |
| Participants | 145 hospitalised adults undergoing open colorectal and open cholecystectomy, at nutritional risk due to undergoing major surgery Male:Female = 53:89 (3 missing) Mean age = 56 years Exclusion: type 1 or 2 diabetes mellitus, stomach‐emptying disorders or documented gastric oesophageal reflex disease, emergency surgery interventions | |
| Interventions | Experimental: the study group received 800 mL (by mouth) of carbohydrate beverage in the evening before surgery (22:00) and an additional 400 mL 2 hrs before anaesthesia induction. The beverage contained 12.5% carbohydrates (polycarbohydrates), 50 kcal/100 mL, 285 mOsmol/kg (NutriciapreOp, Nutricia Ltd.) (n = 44) Control: there were 2 control groups: 1. The placebo group received a non‐caloric colourless liquid with the same taste and without carbohydrates in the same amount as the participants in the experimental group. (n = 46) 2. The control group did not receive any of these drinks and were subject to the traditional preoperative fasting(n = 52) | |
| Outcomes | VAS score, length of stay | |
| Study dates | January 2010 – January 2012 | |
| Notes | Trial registration: ANZCTR.org.au: ACTRN12614000995673. | |
| Risk of bias | ||
| Bias | Authors' judgement | Support for judgement |
| Random sequence generation (selection bias) | Low risk | Throwing dice by an independent person, not otherwise involved in the trial |
| Allocation concealment (selection bias) | Unclear risk | Not described |
| Blinding of participants and personnel (performance bias) | Low risk | The placebo was identical in appearance and taste. |
| Blinding of outcome assessment (detection bias) | Low risk | The placebo was identical in appearance and taste. |
| Incomplete outcome data (attrition bias) | Low risk | Under 5% of participants had incomplete outcome data. |
| Selective reporting (reporting bias) | Unclear risk | The trial was retrospectively registered and did not report mortality or serious adverse events. |
| For‐profit bias | Unclear risk | The trial was sponsored by University Clinical Center of Kosovo and by an individual Avdyl Krasniqi. |
| Other bias | Low risk | The trial appeared to be free of other components that could put it at risk of bias. |
| Methods | Randomised clinical trial, India | |
| Participants | 20 hospitalised adults between 20 and 60 years undergoing major abdominal surgery, at nutritional risk due to major abdominal surgery | |
| Interventions | Experimental group: Received the standard ward diet plus the hospital kitchen‐prepared liquid sip feed of 500 ml, providing 500 kcal comprising 16.66 g protein, 43.5 g carbohydrate, and 30 g fat. The 500‐ml sip feed contained 375 ml milk, 12.5 g sugar, 12.5 g butter, 12.5 g colustarch, 125 ml rice water, and half an egg. (n = 19) Control group: Received a standard ward diet (n = 10) | |
| Outcomes | Weight, albumin, middle‐arm circumference (MAC), hand‐grip strength, lymphocyte count | |
| Study dates | April 1999 to March 2000 | |
| Notes | 1st comparison of the complete trial Saluja 2002. We contacted the authors by email [email protected]. The author could not remember the method of randomisation. | |
| Risk of bias | ||
| Bias | Authors' judgement | Support for judgement |
| Random sequence generation (selection bias) | Unclear risk | In the trial the randomisation was described as being done through drawing lots but it was unclear if this was done by an independent person. The author could not remember the method of randomisation. |
| Allocation concealment (selection bias) | Unclear risk | Not described |
| Blinding of participants and personnel (performance bias) | High risk | Not described |
| Blinding of outcome assessment (detection bias) | High risk | Not described |
| Incomplete outcome data (attrition bias) | Low risk | There were no dropouts or withdrawals. |
| Selective reporting (reporting bias) | Low risk | No protocol could be obtained, but we received information on all‐cause mortality and serious adverse events. |
| For‐profit bias | Unclear risk | It was unclear how the trial was funded. |
| Other bias | Low risk | The trial appeared to be free of other components that could put it at risk of bias. |
| Methods | Randomised clinical trial, India | |
| Participants | 20 hospitalised adults between 20 and 60 undergoing major abdominal surgery, at nutritional risk due to major abdominal surgery | |
| Interventions | Experimental group: Received the standard ward diet plus the hospital kitchen‐prepared liquid sip feed of 500 ml, providing 500 kcal comprising 16.66 g protein, 43.5 g carbohydrate, and 30 g fat. The 500‐ml sip feed contained 375 ml milk, 12.5 g sugar, 12.5 g butter, 12.5 g colostric, 125 ml rice water, and half an egg. (n = 10) Control group: Received a standard ward diet(n = 10) | |
| Outcomes | Weight, albumin, middle‐arm circumference (MAC), hand‐grip strength, lymphocyte count | |
| Study dates | April 1999 to March 2000 | |
| Notes | 2nd category of the complete trial Saluja 2002 | |
| Risk of bias | ||
| Bias | Authors' judgement | Support for judgement |
| Random sequence generation (selection bias) | Unclear risk | In the trial the randomisation was described as being done through drawing lots but it was unclear if this was done by an independent person. |
| Allocation concealment (selection bias) | Unclear risk | Not described |
| Blinding of participants and personnel (performance bias) | High risk | Not described |
| Blinding of outcome assessment (detection bias) | Unclear risk | Not described |
| Incomplete outcome data (attrition bias) | Low risk | There were no dropouts or withdrawals. |
| Selective reporting (reporting bias) | Low risk | No protocol could be obtained, but we received information on all‐cause mortality and serious adverse events. |
| For‐profit bias | Unclear risk | It was unclear how the trial was funded. |
| Other bias | Low risk | The trial appeared to be free of other components that could put it at risk of bias. |
| Methods | Randomised clinical trial, India | |
| Participants | 20 hospitalised adults between 20 and 60 undergoing major abdominal surgery, at nutritional risk due to major abdominal surgery | |
| Interventions | Experimental group: Received the standard ward diet plus the hospital kitchen‐prepared liquid sip feed of 500 ml, providing 500 kcal comprising 16.66 g protein, 43.5 g carbohydrate, and 30 g fat. The 500‐ml sip feed contained 375 ml milk, 12.5 g sugar, 12.5 g butter, 12.5 g colustarch, 125 ml rice water, and half an egg(n = 10) Control group: Received a standard ward diet(n = 10) | |
| Outcomes | Weight, albumin, middle‐arm circumference (MAC), hand‐grip strength, lymphocyte count | |
| Study dates | April 1999 to March 2000 | |
| Notes | 3rd category of the complete trial Saluja 2002 | |
| Risk of bias | ||
| Bias | Authors' judgement | Support for judgement |
| Random sequence generation (selection bias) | Unclear risk | In the trial the randomisation was described as being done through drawing lots but it was unclear if this was done by an independent person. |
| Allocation concealment (selection bias) | Unclear risk | Not described |
| Blinding of participants and personnel (performance bias) | High risk | Not described |
| Blinding of outcome assessment (detection bias) | Unclear risk | Not described |
| Incomplete outcome data (attrition bias) | Low risk | There were no dropouts or withdrawals. |
| Selective reporting (reporting bias) | Low risk | No protocol could be obtained, but we received information on all‐cause mortality and serious adverse events. |
| For‐profit bias | Unclear risk | It was unclear how the trial was funded. |
| Other bias | Low risk | The trial appeared to be free of other components that could put it at risk of bias. |
| Methods | Randomised clinical trial, USA | |
| Participants | 35 hospitalised adults admitted for stage III metastatic testicular cancer, at nutritional risk due to anthropometrics Male:Female = Not reported Mean age = Not reported Exclusion criteria: Participants characterised as severely malnourished (weight loss > 12%, duration not stated) | |
| Interventions | Experimental group: received intravenous hyperalimentation solution containing 25% dextrose with 4.25% amino acids, supplementary vitamins, electrolytes and trace elements, which provided 35 kcals/kg/day. Intervention started on day 1 of hospitalisation, and was continued throughout the course of the chemotherapy, terminating 24 hrs before discharge. The mean duration of IVH was 48 days for noninfected participants and 18 days for infected participants. (n = 20) Co‐intervention: Both groups was divided in 2, where 1 group received vinblastine and bleomycin, and the other received vinblastine, bleomycin and cisplatin. | |
| Outcomes | Mortality, weight, septicaemia, pneumonia, infections, liver function, leukopenia, serum albumin, serum transferrin, granulocyte count, granulocytopenic fever, platelet count and oral toxicity | |
| Study dates | Not stated | |
| Notes | We could obtain no contact information from the authors. The 35 patients were stratified into 3 nutritional‐status categories: well‐nourished, moderately malnourished and malnourished. | |
| Risk of bias | ||
| Bias | Authors' judgement | Support for judgement |
| Random sequence generation (selection bias) | Low risk | The trial was block‐randomised using random‐number tables. |
| Allocation concealment (selection bias) | Unclear risk | Allocation concealment was done using sealed envelopes but it was unclear if they were opaque. |
| Blinding of participants and personnel (performance bias) | Unclear risk | Not described |
| Blinding of outcome assessment (detection bias) | Unclear risk | Not described |
| Incomplete outcome data (attrition bias) | Low risk | There were no dropouts. |
| Selective reporting (reporting bias) | Low risk | No protocol could be obtained , but all‐cause‐mortality and serious adverse events were reported. |
| For‐profit bias | Low risk | Supported by contracts from the division of Cancer Cause and prevention, National Cancer institute, National Institutes of Health, Department of Health and Human Services. |
| Other bias | Low risk | The trial appeared to be free of other components that could put it at risk of bias. |
| Methods | Randomised clinical trial, Canada | |
| Participants | 33 hospitalised adults with COPD and a FEV1 ≤ 60% of the predicted value, admitted because of acute exacerbation, at nutritional risk due to trialist indication. Mean age = 69 (only participants who completed the study) Exclusion criteria: in need of mechanical ventilation, gastro‐intestinal tract disorder, active cancer or other conditions predisposing to weight loss, terminally ill, unable to communicate in English or French, suffered from mental confusion or followed a special diet | |
| Interventions | Experimental group: ONS. Participants received oral supplements; Ensure, Ensure Plus, puddings or extra snacks to assure a caloric intake of at least 1.5 x resting energy expenditure (REE) if their BMI was normal (20 to 27) and at least 1.7 x REE if their BMI was below 20. (n = 17) Control group: No intervention (n = 16) Co‐interventions: All participants received traditional hospital diet | |
| Outcomes | Lung function; FEV1, FVC, inspiratory muscle strength (PImax), respiratory muscle strength; Expiratory muscle strength (PEmax), hand‐grip strength, upper body strength, activities of daily living in older adults, nitrogen balance; glucocorticosteroid use, weight, mean energy and macronutrient intakes, degree of breathlessness, 6‐minute walk test, length of hospital stay and general well‐being (QoL) | |
| Study dates | November 1993 to May 1996 | |
| Notes | We contacted the authors on 13th November 2015 by email: [email protected] . The authors replied that additional data did not exist. | |
| Risk of bias | ||
| Bias | Authors' judgement | Support for judgement |
| Random sequence generation (selection bias) | Unclear risk | Not described |
| Allocation concealment (selection bias) | Unclear risk | Not described |
| Blinding of participants and personnel (performance bias) | Unclear risk | Not described |
| Blinding of outcome assessment (detection bias) | Unclear risk | All strength measurements were done by laboratory personnel who were blinded. Blinding of other outcome assessments was not described. |
| Incomplete outcome data (attrition bias) | Unclear risk | They did not use intention‐to‐treat analysis, but the numbers and reasons for dropouts were clearly stated. There were incomplete data for more than 5%. |
| Selective reporting (reporting bias) | Unclear risk | The trial reported all‐cause mortality, but not serious adverse events. No protocol could be obtained. |
| For‐profit bias | High risk | Supplements were provided by Abbott Laboratories, Montreal, Canada. |
| Other bias | Low risk | The trial appeared to be free of other components that could put it at risk of bias. |
| Methods | Randomised clinical trial, USA | |
| Participants | 55 hospitalised adults with acute pancreatitis, at nutritional risk according to the trialist Male:Female = 40:15 Mean age = 39.8 years | |
| Interventions | Experimental group: Early TPN (25% dextrose, 4.25% amino acid) for 7 days(n = 29) Control group: No intervention (n = 26) | |
| Outcomes | Length of hospital stay, serum amylase, glucose, alkaline phosphatase, bilirubin, albumin, total lymphocyte count, days until first oral intake, nitrogen balance, serum transferrin, complications, catheter sepsis, mortality | |
| Study dates | Not stated | |
| Notes | We contacted the authors on 23rd June 2015 on email: [email protected]. We received no reply. | |
| Risk of bias | ||
| Bias | Authors' judgement | Support for judgement |
| Random sequence generation (selection bias) | Unclear risk | Not described |
| Allocation concealment (selection bias) | Unclear risk | Not described |
| Blinding of participants and personnel (performance bias) | Unclear risk | Not described |
| Blinding of outcome assessment (detection bias) | Unclear risk | Not described |
| Incomplete outcome data (attrition bias) | Unclear risk | The number of participants with incomplete data was not reported. |
| Selective reporting (reporting bias) | Low risk | The trial reported all‐cause‐mortality and serious adverse events. |
| For‐profit bias | Unclear risk | It was unclear how the trial was funded. |
| Other bias | Low risk | The trial appeared to be free of other components that could put it at risk of bias. |
| Methods | Randomised clinical trial, Germany | |
| Participants | 40 hospitalised adults admitted because of polytraumatised and in need of ventilation, at nutritional risk due to being in an ICU. Male:Female = 26:14 Mean age = 35.4 | |
| Interventions | Experimental group 1: parenteral carbohydrates for 4 days(n = 10) Experimental group 3: parenteral carbohydrates + 2 g amino acids for 4 days(n = 10) Control group: i.v. fluids(n = 10) | |
| Outcomes | Serum and urinary biomarkers (glucose, fructose), xylitconcentration, energy, urea | |
| Study dates | Not stated | |
| Notes | We found no contact information for the authors. | |
| Risk of bias | ||
| Bias | Authors' judgement | Support for judgement |
| Random sequence generation (selection bias) | Unclear risk | Not described |
| Allocation concealment (selection bias) | Unclear risk | Not described |
| Blinding of participants and personnel (performance bias) | Unclear risk | Not described |
| Blinding of outcome assessment (detection bias) | Unclear risk | Not described |
| Incomplete outcome data (attrition bias) | Unclear risk | The number of participants with incomplete data was not reported. |
| Selective reporting (reporting bias) | Unclear risk | No protocol could be obtained, and the trial did not report on all‐cause mortality or serious adverse events. |
| For‐profit bias | Unclear risk | It was unclear how the trial was funded. |
| Other bias | Low risk | The trial appeared to be free of other components that could put it at risk of bias. |
| Methods | Randomised clinical trial, Canada. | |
| Participants | 22 hospitalised adults undergoing colorectal cancer surgery, at nutritional risk due to major surgery Male:Female = 13:9 Mean age = 62.5 Exclusion criteria: metastatic disease, weight loss 10% over the preceding 3 months, congestive heart failure, hepatic disease, diabetes, and those receiving drugs known to have metabolic effects such as corticosteroids or beta‐blockers | |
| Interventions | Experimental group: Preoperative nutrition (glucose and amino acids) for 2 days(n = 11) Control group: no intervention(n = 11) Co‐intervention: Postoperative nutrition (glucose and amino acids) | |
| Outcomes | Biochemistry, gaseous exchange | |
| Study dates | between June 2004 and June 2007 | |
| Notes | We contacted the authors on 24th August 2016 by email: [email protected]. | |
| Risk of bias | ||
| Bias | Authors' judgement | Support for judgement |
| Random sequence generation (selection bias) | Low risk | Computer‐generated random allocation |
| Allocation concealment (selection bias) | Unclear risk | The sealed envelope were not described as opaque. |
| Blinding of participants and personnel (performance bias) | Unclear risk | Not described |
| Blinding of outcome assessment (detection bias) | Low risk | The surgeon and investigators responsible for sample analyses and data analysis were not aware of group assignment. |
| Incomplete outcome data (attrition bias) | Low risk | No dropouts |
| Selective reporting (reporting bias) | Low risk | NCT00614133 ‐ all outcomes stated in the protocol were assessed. |
| For‐profit bias | Low risk | The trial was sponsored by McGill University Health Center |
| Other bias | Low risk | The trial appeared to be free of other components that could put it at risk of bias |
| Methods | Randomised clinical trial, New Zealand | |
| Participants | 32 hospitalised adults undergoing small or large bowel resection, at nutritional risk due to major gastrointestinal surgery Male:Female = 17:15 Mean age = 52 years Exclusion criteria: none stated | |
| Interventions | Experimental group: Enteral feeding was initiated postsurgically with 50 ml/hr and increased to 80 ml/hr if absorption was without problems (n = 16). Co‐interventions: Oral fluids and food were restarted usually depending on the presence of bowel sounds and passage of flatus. | |
| Outcomes | Complications, time to flatus, time to first bowel movement, weight loss, water loss, protein loss, fat loss, wound healing, muscle function, postoperative caloric intake and length of stay | |
| Study dates | Not stated | |
| Notes | 1 participant in the Experimental group had chronic renal failure, and was given a low‐protein modification of Osmolite. We contacted the authors in September 2015 by email: [email protected].. We received no reply. | |
| Risk of bias | ||
| Bias | Authors' judgement | Support for judgement |
| Random sequence generation (selection bias) | Unclear risk | Not described |
| Allocation concealment (selection bias) | Unclear risk | Not described |
| Blinding of participants and personnel (performance bias) | Unclear risk | Not described |
| Blinding of outcome assessment (detection bias) | Unclear risk | Not described |
| Incomplete outcome data (attrition bias) | Unclear risk | The number of participants with incomplete data was not reported. |
| Selective reporting (reporting bias) | Unclear risk | No protocol could be obtained and the trial did not report on all‐cause mortality. |
| For‐profit bias | High risk | The trial was funded by Abbott Laboratories. |
| Other bias | Low risk | The trial appeared to be free of other components that could put it at risk of bias. |
| Methods | Randomised clinical trial, country unknown. | |
| Participants | 22 hospitalised adults with liver cirrhosis, at nutritional risk due to increased nutritional requirements Male:Female = 16:6 Mean age = 60 years Exclusion criteria: None stated | |
| Interventions | Experimental group: Enteral nutrition. Tube‐feeding providing a high energy and protein intake for 2 weeks (n = unknown) Control group: No intervention (n = unknown) Co‐interventions: Both groups received normal diet | |
| Outcomes | Severity of hepatic encephalopathy with psychometric and neurophysiologic tests, and calorie consumption | |
| Study dates | Not stated | |
| Notes | We could obtain no contact information for the authors. | |
| Risk of bias | ||
| Bias | Authors' judgement | Support for judgement |
| Random sequence generation (selection bias) | Unclear risk | Not described |
| Allocation concealment (selection bias) | Unclear risk | Not described |
| Blinding of participants and personnel (performance bias) | Unclear risk | Not described |
| Blinding of outcome assessment (detection bias) | Unclear risk | Not described |
| Incomplete outcome data (attrition bias) | Unclear risk | The number of participants with incomplete data was not reported. |
| Selective reporting (reporting bias) | Unclear risk | No protocol could be obtained, and the trial did not report on all‐cause mortality or serious adverse events. |
| For‐profit bias | Unclear risk | It was unclear how the trial was funded. |
| Other bias | Low risk | The trial appeared to be free of other components that could put it at risk of bias. |
| Methods | Randomised clinical trial, UK | |
| Participants | 55 hospitalised adults undergoing colorectal surgery, at nutritional risk due to major gastro‐intestinal surgery Male:Female = 35:20 Mean age = 66 Exclusion criteria: Dementia, lactose intolerance, pregnancy, diabetes mellitus, age under 16, musculoskeletal conditions preventing accurate use of the hand‐grip dynamometer and unable to feed orally preoperatively. Postoperative exclusion criteria were postoperative admission to ICU or administration of TPN. | |
| Interventions | Experimental group: Received standard diet + 6 x 60 ml/day of Pro‐Cal (3.33 kcal/ml and 0.06 mg/ml of protein) for the duration of the hospital stay(n = 32) | |
| Outcomes | Primary outcome: Muscle strength at discharge Secondary outcome: Daily calorie intake, nausea, days to first flatus, days to first bowel movement and postoperative length of hospital stay | |
| Study dates | Between June 2007 and November 2010 | |
| Notes | We contacted the authors in September 2015 by email: [email protected]. We received no reply. | |
| Risk of bias | ||
| Bias | Authors' judgement | Support for judgement |
| Random sequence generation (selection bias) | Low risk | Computer‐generated |
| Allocation concealment (selection bias) | Unclear risk | The envelopes were described as sealed but not opaque. |
| Blinding of participants and personnel (performance bias) | High risk | Not blinded |
| Blinding of outcome assessment (detection bias) | Unclear risk | Not described |
| Incomplete outcome data (attrition bias) | High risk | 7 randomised participants were later excluded resulting in above 5% dropouts. The trial did not account for the missing participants. |
| Selective reporting (reporting bias) | Unclear risk | No protocol could be obtained and the trial did not report on all‐cause mortality or serious adverse events. |
| For‐profit bias | Low risk | "The resources of our department were utilized to conduct the study". |
| Other bias | Low risk | The trial appeared to be free of other components that could put it at risk of bias. |
| Methods | Randomised clinical trial, Russia | |
| Participants | 64 hospitalised adults with multiple organ failure because of diffuse purulent peritonitis, at nutritional risk due to increased nutritional requirements Male:Female = Not reported Exclusion criteria: Not reported | |
| Interventions | Experimental group: Enteral nutrition. Started from the 1st hours after operation (n = 33) Control group: No intervention(n = 31) | |
| Outcomes | Metabolic, hormonal and immunologic status change, stage of intestinal insufficiency syndrome, severity of organ disorders, severity of gastro‐intestinal function disorders, hepatic, cardiac and respiratory insufficiency, and mortality | |
| Study dates | Not stated | |
| Notes | We contacted the authors on 14th October 2015 by email: [email protected]. We received an initial reply but no further answer. | |
| Risk of bias | ||
| Bias | Authors' judgement | Support for judgement |
| Random sequence generation (selection bias) | Unclear risk | Not described |
| Allocation concealment (selection bias) | Unclear risk | Not described |
| Blinding of participants and personnel (performance bias) | Unclear risk | Not described |
| Blinding of outcome assessment (detection bias) | Unclear risk | Not described |
| Incomplete outcome data (attrition bias) | Unclear risk | The number of participants with incomplete data was not reported. |
| Selective reporting (reporting bias) | Unclear risk | No protocol could be obtained, and the trial did not report all‐cause mortality or serious adverse events. |
| For‐profit bias | Unclear risk | It was unclear how the trial was funded. |
| Other bias | Low risk | The trial appeared to be free of other components that could put it at risk of bias. |
| Methods | Randomised clinical trial, USA | |
| Participants | 34 hospitalised adults with moderate or severe alcoholic hepatitis (chronic ethanol ingestion > 80 g/day for at least 2 years and right lobe hepatomegaly), at nutritional risk according to the trialist Male:Female = 7:15(gender not reported for 12 participants) Mean age = 41.5 years (only for the severe malnourished) Exclusion criteria: acute pancreatitis, insulin‐dependent diabetes mellitus, positive HBsAg, malignancy, hypotension, congestive heart failure, sepsis, severe COPD, and recent severe trauma, surgery, mild disease or rapidly became moribund | |
| Interventions | Experimental group: 28 days of peripheral parenteral nutrition (2 litres a day). Each litre consisted of 35 g Aminosyn, 50 g dextrose, 500 ml of 10% Intralipid a day for a total of 1070 intravenous calories a day.(n = 16) Co‐interventions: diet consisting of 2400 calories and 100 g protein + can of Ensure | |
| Outcomes | Biochemistry, grade of encephalopathy, mortality, ascites, function tests | |
| Study dates | Not stated | |
| Notes | We contacted the authors on 19th August 2015 by email: [email protected]. We received no reply. | |
| Risk of bias | ||
| Bias | Authors' judgement | Support for judgement |
| Random sequence generation (selection bias) | Unclear risk | Not described |
| Allocation concealment (selection bias) | Unclear risk | The trial used sealed envelopes, but they were not described as being opaque. |
| Blinding of participants and personnel (performance bias) | High risk | The trial was described as "lack of blinding". |
| Blinding of outcome assessment (detection bias) | High risk | The trial was described as "lack of blinding". |
| Incomplete outcome data (attrition bias) | Unclear risk | The number of participants with incomplete data was not reported. |
| Selective reporting (reporting bias) | Unclear risk | No protocol could be obtained, and the trial did not report on serious adverse events. |
| For‐profit bias | Unclear risk | It was unclear how the trial was funded. |
| Other bias | Low risk | The trial appeared to be free of other components that could put it at risk of bias. |
| Methods | Randomised clinical trial, India | |
| Participants | 43 hospitalised adults with nontraumatic intestinal perforation and peritonitis, at nutritional risk due to major abdominal surgery Male:Female = not described Mean age = 39.9 years Exclusion criteria: renal, cardiac, or hepatic failure at the time of admission, surgery preformed elsewhere and subsequently referred to this hospital | |
| Interventions | Experimental group: Given a feeding jejunostomy in which they received enteral nutritional support by the following process: 12 – 24 hrs postoperatively: normal saline and 5% dextrose solution in a 1:3 ratio at 100 mL/hr; 24 – 48 hours postoperatively: 1.0 L of half‐strength feed at 50 mL/hr; 48 – 72 hrs postoperatively: 2.0 L of half‐strength feed at 100 mL/hr; and 72 hours onward: at least 2.0 L of full‐strength feed every 24 hrs Enteral nutrition consisted of a low‐residue, easily absorbable, milk‐based, blenderised diet which was made in the Dietetics Department at the hospital. Proprietary vitamin supplements were added. The intervention lasted 6.5 days on average.(n = 21) Control group: Received intravenous fluids and electrolyte supplements as needed(n = 22) | |
| Outcomes | Mortality, complications, nitrogen balance and caloric intake | |
| Study dates | Not stated | |
| Notes | e contacted the authors on 16th September 2015 by email: [email protected]. We received no reply. | |
| Risk of bias | ||
| Bias | Authors' judgement | Support for judgement |
| Random sequence generation (selection bias) | Unclear risk | Not described |
| Allocation concealment (selection bias) | Unclear risk | Not described |
| Blinding of participants and personnel (performance bias) | High risk | Not blinded. The experimental group received a jejunostomy whereas the control group did not. |
| Blinding of outcome assessment (detection bias) | Unclear risk | Not described |
| Incomplete outcome data (attrition bias) | Low risk | There were no incomplete data for any participants. |
| Selective reporting (reporting bias) | Low risk | We found no protocol. The trial reported all‐cause mortality and complications. |
| For‐profit bias | Unclear risk | It was unclear how the trial was funded. |
| Other bias | Low risk | The trial appeared to be free of other components that could put it at risk of bias. |
| Methods | Randomised clinical trial, UK, factorial design. | |
| Participants | 179 hospitalised adults undergoing elective moderate to major lower gastrointestinal tract surgery, at nutritional risk due to major surgery Male:Female = 100:79 Mean age = 60 years Exclusion criteria: Age under 18, pregnancy, overt dementia, emergency or laparoscopic surgery, receipt of other forms of preoperative nutritional support, and inability to take ONS for at least 7 days before operation | |
| Interventions | Experimental group 1: post‐operative supplements (drink containing 1.5 kcal and 0.05 g protein per ml. Participants were encouraged to drink this as wanted in small, frequent quantities between meals).(n = 42) Control group 1: No intervention (n = 48) Co‐interventions 1: pre‐operative supplements (drink containing 1.5 kcal and 0.05 g protein per ml. Participants were encouraged to drink this ad libitumas wanted in small, frequent quantities between meals). Standard diet. Experimental group 2: post‐operative supplements (drink containing 1.5 kcal and 0.05 g protein per ml. Participants were encouraged to drink this as wanted in small, frequent quantities between meals). (n = 39) Control group 2: No intervention (n = 50) Co‐interventions 2: standard diet | |
| Outcomes | Postoperative change in body weight, clinical complications, length of hospital stay, nutritional status, quality of life, cost of care, anthropometrics | |
| Study dates | Between October 1998 and March 2001 | |
| Notes | Same trial as Smedley 2004b with results from experimental group 1 vs control 1. We contacted the authors on 19th August 2015 by email: [email protected]‐tr.trent.nhs.uk. We received no reply. | |
| Risk of bias | ||
| Bias | Authors' judgement | Support for judgement |
| Random sequence generation (selection bias) | Unclear risk | Not described |
| Allocation concealment (selection bias) | Unclear risk | The trial used sealed envelopes, but they were not described as being opaque. |
| Blinding of participants and personnel (performance bias) | High risk | Not blinded. Only the experimental group received a supplement. |
| Blinding of outcome assessment (detection bias) | Unclear risk | Not described |
| Incomplete outcome data (attrition bias) | High risk | There were more than 5% dropouts, and the trial did not use proper intention‐to‐treat methodology. |
| Selective reporting (reporting bias) | Unclear risk | No protocol could be obtained, and the trial did not report on all‐cause mortality. |
| For‐profit bias | High risk | The trial was funded by a nutrition company (Numico Research). |
| Other bias | Low risk | The trial appeared to be free of other components that could put it at risk of bias. |
| Methods | Randomised clinical trial, UK | |
| Participants | 179 hospitalised adults undergoing elective moderate to major lower gastrointestinal tract surgery, at nutritional risk due to major surgery Male:Female = 100:79 Mean age = 60 years Exclusion criteria: Age under 18, pregnancy, overt dementia, emergency or laparoscopic surgery, receipt of other forms of preoperative nutritional support, and inability to take ONS for at least 7 days before operation | |
| Interventions | Experimental group 1: post‐operative supplements (drink containing 1.5 kcal and 0.05 g protein per ml. Participants were encouraged to drink this as wanted in small, frequent quantities between meals).(n = 42) Control group 1: No intervention (n = 48) Co‐interventions 1: pre‐operative supplements (drink containing 1.5 kcal and 0.05 g protein per ml. Participants were encouraged to drink this ad libitumas wanted in small, frequent quantities between meals). Standard diet. Experimental group 2: post‐operative supplements (drink containing 1.5 kcal and 0.05 g protein per ml. Participants were encouraged to drink this as wanted in small, frequent quantities between meals). (n = 39) Control group 2: No intervention (n = 50) Co‐interventions 2: standard diet | |
| Outcomes | Postoperative change in body weight, clinical complications, length of hospital stay, nutritional status, quality of life, cost of care, anthropometrics | |
| Study dates | Between October 1998 and March 2001 | |
| Notes | Same trial as Smedley 2004a with results from experimental group 2 vs control 2. We contacted the authors on 19th August 2015 by email: [email protected]‐tr.trent.nhs.uk. We received no reply. | |
| Risk of bias | ||
| Bias | Authors' judgement | Support for judgement |
| Random sequence generation (selection bias) | Unclear risk | Not described |
| Allocation concealment (selection bias) | Unclear risk | The trial used sealed envelopes, but they were not described as being opaque. |
| Blinding of participants and personnel (performance bias) | High risk | Only the experimental group received a supplement. |
| Blinding of outcome assessment (detection bias) | Unclear risk | Not described |
| Incomplete outcome data (attrition bias) | High risk | There were more than 5% dropouts, and the trial did not use proper intention‐to‐treat methodology. |
| Selective reporting (reporting bias) | Unclear risk | No protocol could be obtained, and the trial did not report on all‐cause mortality. |
| For‐profit bias | High risk | The trial was funded by a nutrition company (Numico Research). |
| Other bias | Low risk | The trial appeared to be free of other components that could put it at risk of bias. |
| Methods | Randomised clinical trial, Australia | |
| Participants | 50 hospitalised adults with gastro‐intestinal tract malignancy scheduled for surgical treatment, at nutritional risk due to undergoing major surgery Male:Female = 34:16 Mean age = 65 years Exclusion criteria: emergency cases, people with peritonitis or bowel obstruction | |
| Interventions | Experimental group: enteral nutrition (Isocal) containing 34 g protein, 44 g fat and 133 g glucose a litre (n = 25) Co‐intervention: intravenous isotonic fluids and standard hospital diet | |
| Outcomes | Mortality, complications, length of hospital stay | |
| Study dates | January 1981 to June 1983 | |
| Notes | We could obtain no contact information for the authors. | |
| Risk of bias | ||
| Bias | Authors' judgement | Support for judgement |
| Random sequence generation (selection bias) | Unclear risk | Randomly‐ordered cards |
| Allocation concealment (selection bias) | Unclear risk | Sealed envelopes but it was unclear if they were opaque. |
| Blinding of participants and personnel (performance bias) | Unclear risk | Not described |
| Blinding of outcome assessment (detection bias) | Unclear risk | Not described |
| Incomplete outcome data (attrition bias) | Unclear risk | It was unclear how many participants had incomplete outcome data. |
| Selective reporting (reporting bias) | Low risk | The trial reported mortality and complications. |
| For‐profit bias | Unclear risk | It was unclear how the trial was funded. |
| Other bias | Low risk | The trial appeared to be free of other components that could put it at risk of bias. |
| Methods | Randomised clinical trial, USA | |
| Participants | 34 hospitalised adults with major upper gastro‐intestinal surgery, at nutritional risk due to major surgery Male:Female = 27:7 Mean age = 67.5 years | |
| Interventions | Experimental group: preoperative intravenous nutrition 10 days before surgery. Infusing 50 ‐ 60 kcal/kg/day of glucose/amino acid IVN mixture, containing 150 kcal/l g of nitrogen(n = 17) | |
| Outcomes | Mortality, major complications, serum transferrin, length of hospital stay | |
| Study dates | Not stated | |
| Notes | We contacted the authors in December 2015 by email: [email protected]. We received information regarding blinding and nutritional intake in the study group. | |
| Risk of bias | ||
| Bias | Authors' judgement | Support for judgement |
| Random sequence generation (selection bias) | Low risk | Randomly‐ordered cards |
| Allocation concealment (selection bias) | Unclear risk | Sealed envelopes were used, but they were not described as opaque. |
| Blinding of participants and personnel (performance bias) | High risk | Blinding was not performed. |
| Blinding of outcome assessment (detection bias) | High risk | Blinding was not performed. |
| Incomplete outcome data (attrition bias) | Low risk | There were no dropouts. |
| Selective reporting (reporting bias) | Low risk | The trial reported all‐cause‐mortality and serious adverse events. |
| For‐profit bias | Unclear risk | It was unclear how the trial was funded. |
| Other bias | Low risk | The trial appeared to be free of other components that could put it at risk of bias. |
| Methods | Randomised clinical trial, Turkey | |
| Participants | 38 hospitalised adults with inflammatory bowel disease, at nutritional risk according to the trialist Male:Female = 28:10 Mean age = 37.1 years Exclusion criteria: none reported | |
| Interventions | Experimental group: Received a standard enteral product added into the hospital diet(n = 15) Control group: No intervention(n = 23) Co‐interventions: All received a normal hospital diet | |
| Outcomes | Hospitalisation period, subjective global assessment (SGA), BMI, bowel movements, change of nutritional state, general status, disease severity, changes of clinical findings, and consumption's of nutrients, fibre and water soluble‐fibre | |
| Study dates | Not stated | |
| Notes | We could not use this publication since it only presents results as per protocol. We contacted the authors on 30th June 2015 by email: [email protected] and again in September by email: [email protected]. We received no reply. | |
| Risk of bias | ||
| Bias | Authors' judgement | Support for judgement |
| Random sequence generation (selection bias) | Unclear risk | Not described |
| Allocation concealment (selection bias) | Unclear risk | Not described |
| Blinding of participants and personnel (performance bias) | Unclear risk | Not described |
| Blinding of outcome assessment (detection bias) | Unclear risk | Not described |
| Incomplete outcome data (attrition bias) | Low risk | There were complete data for all participants. |
| Selective reporting (reporting bias) | Unclear risk | No protocol could be obtained, and the trial did not report all‐cause mortality or serious adverse events. |
| For‐profit bias | Unclear risk | It was unclear how the trial was funded. |
| Other bias | Low risk | The trial appeared to be free of other components that could put it at risk of bias. |
| Methods | Randomised clinical trial, China | |
| Participants | 25 hospitalised adults with COPD and infection, PaO2 < 8 kPa, or PaCO2 > 6.7 kPa, at nutritional risk due to trialist characterising them as malnourished. Male:Female = 23:2 Mean age = 60.3 years Exclusion criteria: diabetes, hyperthyroidism or other endocrine and metabolic diseases | |
| Interventions | Experimental group: Received parenteral nutrition in the form of amino acids injection (5% Nutrisol‐S) 500 ml (Green Cross, Japan) and lipid emulsion (Intralipid: (1000 ml Intralipid contains rectification soybean oil 100 g, glycerinum 22.5 g rectification lecithin 12 g, PH 8.0, 4602.4 kJ/kg)) 500 ml (Sino‐Swed Pharmaceutical Corp. Ltd. China) for intravenous drip, once daily, for 10 to 20 days (10 of the participants were over 15 days). (n = 23) Control group: standard diet(n = 23) Co‐intervention: persistent low‐flow oxygen inspiration and anti‐infection, anti‐asthmatic and antitussive and standard diet | |
| Outcomes | All‐cause mortality, NEFA, ABG, serum amino acid | |
| Study dates | Not stated | |
| Notes | We tried and failed to contact the authors by phone. | |
| Risk of bias | ||
| Bias | Authors' judgement | Support for judgement |
| Random sequence generation (selection bias) | Unclear risk | Not described |
| Allocation concealment (selection bias) | Unclear risk | Not described |
| Blinding of participants and personnel (performance bias) | High risk | Participants and personnel were not blinded. |
| Blinding of outcome assessment (detection bias) | Unclear risk | Not described |
| Incomplete outcome data (attrition bias) | Unclear risk | The number of participants with incomplete data was not reported. |
| Selective reporting (reporting bias) | Low risk | No protocol could be obtained but all‐cause mortality was reported. |
| For‐profit bias | Unclear risk | It was unclear how the trial was funded. |
| Other bias | Low risk | The trial appeared to be free of other components that could put it at risk of bias. |
| Methods | Randomised clinical trial, France | |
| Participants | 26 hospitalised adults undergoing gastro‐intestinal surgery, at nutritional risk due to major surgery Male:Female = 17:9 Mean age = 46.5 years Exclusion criteria: Not reported | |
| Interventions | Experimental group: parenteral nutrition 12.4 g Nitrogen (1200 kcal) and 1200 kcal of glucose for 2 days(n = 11) | |
| Outcomes | Nitrogen balance, complications, mortality | |
| Study dates | Not stated | |
| Notes | We could find no contact information for the authors. | |
| Risk of bias | ||
| Bias | Authors' judgement | Support for judgement |
| Random sequence generation (selection bias) | Unclear risk | Not described |
| Allocation concealment (selection bias) | Unclear risk | Not described |
| Blinding of participants and personnel (performance bias) | Unclear risk | Not described |
| Blinding of outcome assessment (detection bias) | Unclear risk | Not described |
| Incomplete outcome data (attrition bias) | Low risk | There were no dropouts. |
| Selective reporting (reporting bias) | Low risk | The trial reported mortality and serious adverse events. |
| For‐profit bias | Unclear risk | It was unclear how the trial was funded. |
| Other bias | Low risk | The trial appeared to be free of other components that could put it at risk of bias. |
| Methods | Randomised clinical trial, Sweden/UK | |
| Participants | 20 hospitalised adults undergoing elective major colorectal surgery, at nutritional risk due to major surgery Male:Female = 12:6 (gender not reported for two participants) Mean age = 62 years Exclusion criteria: age below 18 years or above 80 years; BMI below 18 or above 30 kg/m2 | |
| Interventions | Experimental group: Immediate postoperative enteral nutrition with an energy‐dense residue‐free solution (1·5 kcal/ml Nutrison Energy, Nutricia)(n = 10) | |
| Outcomes | Urinary nitrogen losses, insulin resistance, blood glucose, complication and hospital stay | |
| Study dates | Not stated | |
| Notes | We contacted the authors in December 2015 by email: [email protected]. We received an initial reply but no further information was supplied. | |
| Risk of bias | ||
| Bias | Authors' judgement | Support for judgement |
| Random sequence generation (selection bias) | Unclear risk | Not described |
| Allocation concealment (selection bias) | Unclear risk | Not described |
| Blinding of participants and personnel (performance bias) | Low risk | The control group received a solution with an indistinguishable appearance. |
| Blinding of outcome assessment (detection bias) | Unclear risk | Not described |
| Incomplete outcome data (attrition bias) | Low risk | There were no dropouts. |
| Selective reporting (reporting bias) | Unclear risk | No protocol could be obtained and the trial did not report all‐cause mortality or serious adverse events. |
| For‐profit bias | High risk | Financial support from Numico Research. |
| Other bias | Low risk | The trial appeared to be free of other components that could put it at risk of bias. |
| Methods | Randomised clinical trial, UK | |
| Participants | 61 hospitalised adults with femoral neck fracture, at nutritional risk due to major surgery Male:Female = 0:61 Mean age = 81 Exclusion criteria: Not stated | |
| Interventions | Experimental group: Oral nutrition. Participants were encouraged to drink a liquid flavoured milk‐based nutrient supplement through their waking hours. 1 300‐ml package of the supplement contained 18.5 g protein, 11 g fat, and 40 g carbohydrate with vitamins and minerals, and provided 320 kcal per feed. Intervention period was for 10 days. Co‐interventions: All participants received normal ward meals and drinks. | |
| Outcomes | Weight, food consumption, protein and calorie intake, fluid balance, bowel action, daily nitrogen production, excreted and retained, calorie expenditure (physical activity), plasma urea concentration, urine creatinine and nitrogen | |
| Study dates | Not stated | |
| Notes | We could obtain no contact information for the authors. | |
| Risk of bias | ||
| Bias | Authors' judgement | Support for judgement |
| Random sequence generation (selection bias) | Unclear risk | Not described |
| Allocation concealment (selection bias) | Unclear risk | Not described |
| Blinding of participants and personnel (performance bias) | Unclear risk | Not described |
| Blinding of outcome assessment (detection bias) | Unclear risk | Not described. |
| Incomplete outcome data (attrition bias) | Unclear risk | There was insufficient information to assess whether missing data were likely to induce bias in the results. |
| Selective reporting (reporting bias) | Unclear risk | The trial reported all‐cause mortality and serious adverse events. No protocol could be obtained. |
| For‐profit bias | Low risk | The trial was funded by a grant from the South West Regional Hospital Board. |
| Other bias | Low risk | The trial appeared to be free of other components that could put it at risk of bias |
| Methods | Randomised clinical trial, Switzerland | |
| Participants | 134 hospitalised adults at nutritional risk according to NRS‐2002 Male:female = not reported Mean age: 72.5 years | |
| Interventions | Experimental group: Individual nutritional care, including a detailed nutritional assessment, individual food supply, fortification of meals with maltodextrin, rapeseed oil, cream or protein powder or both, in between snacks and oral nutritional supplements (n = 67) Control group: Standard nutritional care, including the prescription of ONSs and nutritional therapy prescribed by the physician independently of this study and according to the routine ward management (n = 67) | |
| Outcomes | Average daily intake, protein intake, changes in body weight, complications, antibiotic therapies, length of hospital stay, quality of life, mortality, compliance, plasma‐concentrations | |
| Study dates | Not stated | |
| Notes | We contacted the authors on 17th December 2015 by email: [email protected]. We received no reply. | |
| Risk of bias | ||
| Bias | Authors' judgement | Support for judgement |
| Random sequence generation (selection bias) | Low risk | The trial was randomised using a computer‐generated randomisation. |
| Allocation concealment (selection bias) | Unclear risk | Not described |
| Blinding of participants and personnel (performance bias) | Unclear risk | Not described |
| Blinding of outcome assessment (detection bias) | Unclear risk | Not described |
| Incomplete outcome data (attrition bias) | Unclear risk | The number of participants with incomplete data was not reported. |
| Selective reporting (reporting bias) | Low risk | Both all‐cause‐mortality and serious adverse events were reported. |
| For‐profit bias | High risk | The trial was funded by Nestlé. |
| Other bias | Low risk | The trial appeared to be free of other components that could put it at risk of bias. |
| Methods | Randomised clinical trial, Germany | |
| Participants | 80 hospitalised adults admitted to intensive or intermediate care with percutaneous endoscopic gastrostomy, at nutritional risk due to being ICU patients Male:Female = 33:47 Exclusion criteria: chronically ill admitted only for PEG placement, outpatients, not eligible for ICU or intermediate care, undergoing Billroth operation, and a PEG placed for relief of gastric outlet obstruction, and ascites | |
| Interventions | Experimental group: received enteral feeding within 1 hr, with feeding that was provided through a tube by a continuous feeding pump and consisted of a polymeric iso‐osmolar formula 1 kcal/ml(n = 40) Control group: no intervention for the first 24 hrs (n = 40) Co‐interventions: All participants were tube‐fed 24 hrs after PEG placement. Both groups received feedings at a rate of 30 ml/hr for 20 hrs on day 1, 70 on day 2, and 100 on day 3 after initiation of feeding. Thereafter the volume was adjusted to the individual nutritional requirements as recommended by the nutrition team. | |
| Outcomes | Gastric residual volume, frequency of complications (stomatitis, vomiting, bleeding, leakage, diarrhoea, aspiration, and pneumoperitoneum), vital signs, abdominal distension, presence of bowel sounds, abdominal tenderness, and mortality | |
| Study dates | Not stated | |
| Notes | Note that all participants were tube‐fed after 24 hrs, and therefore the co‐intervention lasts longer than the intervention period alone. Results for maximum follow‐up are after 30 days. We contacted the author on 1st October 2015 by email: [email protected]‐frankfurt.de. We received no reply. | |
| Risk of bias | ||
| Bias | Authors' judgement | Support for judgement |
| Random sequence generation (selection bias) | Unclear risk | Not described |
| Allocation concealment (selection bias) | Unclear risk | Not described |
| Blinding of participants and personnel (performance bias) | High risk | Blinding was not performed. |
| Blinding of outcome assessment (detection bias) | High risk | Blinding was not performed. |
| Incomplete outcome data (attrition bias) | Low risk | There were complete outcome data for all participants. |
| Selective reporting (reporting bias) | Unclear risk | The trial reported all‐cause mortality but not serious adverse events. No protocol could be obtained. |
| For‐profit bias | Unclear risk | It was unclear how the trial was funded. |
| Other bias | Low risk | The trial appeared to be free of other components that could put it at risk of bias. |
| Methods | Randomised clinical trial, Ireland | |
| Participants | 20 hospitalised adults admitted for abdominal aortic aneurysm repair, at nutritional risk due to major surgery Male:Female = not stated Mean age = not stated Exclusion criteria: none stated | |
| Interventions | Experimental group: peripheral parenteral nutrition from the second postoperative day and for 6 days(n = 10) | |
| Outcomes | Respiratory and skeletal muscle function, wound healing, postoperative stay and complications | |
| Study dates | Not stated | |
| Notes | We found no contact information for the author. | |
| Risk of bias | ||
| Bias | Authors' judgement | Support for judgement |
| Random sequence generation (selection bias) | Unclear risk | Not described |
| Allocation concealment (selection bias) | Unclear risk | Not described |
| Blinding of participants and personnel (performance bias) | Unclear risk | Not described |
| Blinding of outcome assessment (detection bias) | Unclear risk | Not described |
| Incomplete outcome data (attrition bias) | Unclear risk | The number of participants with incomplete data was not reported. |
| Selective reporting (reporting bias) | Unclear risk | No protocol could be obtained, and all‐cause mortality was not reported. |
| For‐profit bias | Unclear risk | It was unclear how the trial was funded. |
| Other bias | Low risk | The trial appeared to be free of other components that could put it at risk of bias. |
| Methods | Randomised clinical trial, USA | |
| Participants | 18 hospitalised adults > 64 years of age, and with an acute femoral neck or intertrochanteric fracture which required surgical intervention, at nutritional risk due to being frail elderly. Male:Female = 17:1 Mean age = 75.5 years Exclusion criteria: incapable of giving informed consent and did not have a legal guardian; pathological fracture (due to cancer or other non‐osteoporotic pathologies) or significant trauma to other organ systems (e.g. multi‐trauma from a motor vehicle accident); metastatic cancer, cirrhosis of the liver, a contraindication to the use of enteral feedings (e.g. severe short‐bowel syndrome), or organ failure which rendered the proposed intervention inappropriate | |
| Interventions | Experimental group: 1375 cc of polymeric enteral formula (Promotet, Ross Laboratories, 85.8 g protein, 4314 non‐nitrogenous kJ (1031 kcal)) over an 11‐hr period (125 cc/hr by enteral feeding pump) beginning at 7 p.m. each night for at least 3 consecutive days or until discharged from the hospital(n = 8) Control group: no intervention (n = 10) Co‐interventions: standard postoperative nutritional care receiving 3 meals a day | |
| Outcomes | Complications, life‐threatening complications, discharge data, mortality, MMSE, ADL‐score, albumin, transferrin, cholesterol, length of hospital stay | |
| Study dates | Not stated | |
| Notes | Notes taken from Avanell 2010. We contacted the authors on 8th February 2016 by email: [email protected]. We received no reply. | |
| Risk of bias | ||
| Bias | Authors' judgement | Support for judgement |
| Random sequence generation (selection bias) | Unclear risk | The trial was described as being randomised, but it was unclear how the sequence was generated. |
| Allocation concealment (selection bias) | Low risk | "The randomization process was prepared by the biostatistician, using a series of sealed envelopes. Security (lined) envelopes were used to assure that the assignment could not be read without opening the envelope. After consent had been obtained and the baseline assessment was completed, the next envelope in order was opened to reveal the group assignment. Each envelope contained a card. The card had the assignment for treatment or control pre‐printed. Space was provided to enter the patient name and ID as well as the date, time and person responsible for randomization. The study nurse completed the card, photocopied it, and returned the original to the biostatistician as a check that the randomization process was progressing appropriately. Subjects were randomized to either treatment or control within blocks to assure that there were roughly equal numbers of subjects in each group at the end of the study. The block sizes were randomly varied to minimize the ability to deduce the assignment for a particular patient before opening the envelope" Quote taken from (Avenell 2016). |
| Blinding of participants and personnel (performance bias) | High risk | The trial was described as non‐blinded: "this non‐blinded randomized controlled trial". |
| Blinding of outcome assessment (detection bias) | High risk | The trial was described as non‐blinded: "this non‐blinded randomized controlled trial". |
| Incomplete outcome data (attrition bias) | High risk | There were more than 5% dropouts, and the trial did not use proper methodology to deal with missing data. |
| Selective reporting (reporting bias) | Low risk | The trial reported mortality and serious adverse events. |
| For‐profit bias | High risk | The trial was funded by Ross Laboratories. |
| Other bias | Low risk | The trial appeared to be free of other components that could put it at risk of bias. |
| Methods | Randomised clinical trial, USA | |
| Participants | 57 hospitalised adults older than 64 who underwent surgical repair of an acute hip fracutre, at nutritonal risk due to being frail elderly Male:Female = 39:18 Mean age = 78.8 years Exclusion criteria: incapable of giving informed consent and did not have a legal guardian; pathological fracture (due to cancer or other non‐osteoporotic pathologies), trauma to other organ systems (e.g. multi‐trauma from a motor vehicle accident); metastatic cancer, cirrhosis of the liver, a contraindication to the use of enteral feedings (e.g. severe short‐bowel syndrome), or organ failure which rendered the proposed intervention inappropriate | |
| Interventions | Experimental group: The participants' ‘nutrient deficit’ for the day (‘target intake’ minus ‘volitional intake’) was calculated each evening. Nightly enteral feedings were initiated with a nutritionally complete, lactose‐free, polymeric enteral formula (Pro‐mote®, Ross Laboratories) that contained 1000 Kcal (4187kJ), 62.5 g protein (25% of calories), 26 g fat (23% of calories), and 130 grams carbohydrates (52% of calories) per litre. On the 1st night after the feeding tube was placed, the participant was provided enteral feedings at a rate of 50 cc/hr over an 11‐hr period beginning at 7 p.m. (i.e. a total of 550 cc of enteral formula, 34.5 g protein). If the participant tolerated the tube‐feedings, the rate was increased by 25 cc/hr each night to either: (a) a maximum of 125 cc/hr over an 11‐hr period beginning at 7 p.m.; or (b) the ‘nutrient deficit’ was reached. For example, if the participants' ‘target intake’ was calculated to be 2100 Kcal and his ‘volitional intake’ was 1400 Kcal, the enteral feeding rate that night was set to 64 cc/hr for a total of 700 cc over 11 hrs, which equalled his ‘nutrient deficit’. (n = 27) Control group: No intervention (n = 30) Co‐interventions: standard postoperative care | |
| Outcomes | Complications, life‐threatening complications, discharge data, mortality, length of stay, MMSE, ADL, albumin, pre‐albumin, cholesterol | |
| Study dates | Not stated | |
| Notes | Notes taken from Avanell 2010. We contacted the authors on 8th February 2016 by email: [email protected]. We received no reply. | |
| Risk of bias | ||
| Bias | Authors' judgement | Support for judgement |
| Random sequence generation (selection bias) | Unclear risk | The trial was described as being randomised, but it was unclear how the sequence was generated. |
| Allocation concealment (selection bias) | Low risk | "The randomisation process was prepared by the biostatistician, using a series of sealed envelopes. Security (lined) envelopes were used to assure that the assignment could not be read without opening the envelope. After consent had been obtained and the baseline assessment was completed, the next envelope in order was opened to reveal the group assignment. Each envelope contained a card. The card had the assignment for treatment or control pre‐printed. Space was provided to enter the patient name and ID as well as the date, time and person responsible for randomization. The study nurse completed the card, photocopied it, and returned the original to the biostatistician as a check that the randomization process was progressing appropriately. Subjects were randomized to either treatment or control within blocks to assure that there were roughly equal numbers of subjects in each group at the end of the study. The block sizes were randomly varied to minimize the ability to deduce the assignment for a particular patient before opening the envelope" Quote taken from (Avenell 2016). |
| Blinding of participants and personnel (performance bias) | Unclear risk | Not described |
| Blinding of outcome assessment (detection bias) | Unclear risk | Not described |
| Incomplete outcome data (attrition bias) | Low risk | There were no dropouts. |
| Selective reporting (reporting bias) | Low risk | The trial reported mortality and serious adverse events. |
| For‐profit bias | High risk | The trial was funded by Ross Laboratories: "We also wish to express our appreciation to Ross Laboratories for supplying the nutritional supplements and the nasogastric feeding tubes". |
| Other bias | Low risk | The trial appeared to be free of other components that could put it at risk of bias. |
| Methods | Randomised clinical trial, UK | |
| Participants | 20 hospitalised adults, at nutritional risk due to low levels of albumin Male:Female = 4:16 Mean age = 87.5 years Exclusion criteria: none stated | |
| Interventions | Experimental group: oral supplement (1365 kJ) twice daily (n = 10) | |
| Outcomes | Esterase activity, weight, middle‐arm circumference, triceps skinfold thickness | |
| Study dates | Not stated | |
| Notes | We contacted the authors on 13th December 2015 by email: [email protected]. We received no reply. | |
| Risk of bias | ||
| Bias | Authors' judgement | Support for judgement |
| Random sequence generation (selection bias) | Unclear risk | Not described |
| Allocation concealment (selection bias) | Unclear risk | Not described |
| Blinding of participants and personnel (performance bias) | Unclear risk | Not described |
| Blinding of outcome assessment (detection bias) | Unclear risk | Not described |
| Incomplete outcome data (attrition bias) | High risk | The dropouts exceeded 5% and the trial did not allow proper intention‐to‐treat methodology. |
| Selective reporting (reporting bias) | Unclear risk | No protocol could be obtained, and the trial did not report all‐cause mortality or serious adverse events. |
| For‐profit bias | Unclear risk | It was unclear how the trial was funded. |
| Other bias | Low risk | The trial appeared to be free of other components that could put it at risk of bias. |
| Methods | Randomised clinical trial, Croatia | |
| Participants | 40 hospitalised adults undergoing CABG surgery, at nutritional risk due to being ICU patients Male:Female = 30:10 Mean age = 58 years Exclusion criteria: anamnestic data about diseases of gastroduodenal part of digestive tract or endoscopic findings confirming gastric or duodenal ulceration in last 5 years; loss of weight of > 10% in last 3 months or extreme obesity (BMI > 35), diabetes mellitus, preoperative elevated biochemical parameters of hepatic (ASAT, ALAP, gamma GT and bilirubin) or renal function (urea, creatinine), preoperative intake of drugs which could influence gastric motility (cisapride, metoclopramide, erythromycin, dopamine in doses > 2 μg/kg/min) or the paracetamol absorption test (e.g. NSAID). Serious concomitant valvular disease, recent myocardial infarction (< 3 weeks), preoperative ejection fraction < 35% and intraoperative use of intra‐aortic balloon pump due to the possible influence of haemodynamic instability on gastric motility | |
| Interventions | Experimental group: Enteral feeding. The participants started with iso‐osmolar enteral feeding through the nasogastric tube 18 hrs after CABG surgery according to the following protocol: the first 3 hrs 30 ml/hr, next 3 hrs 50 ml/hr, i.e. with a total of 240 ml after 6 hrs. After 6 hrs of feeding (i.e. 24 hrs after surgery) the gastric supply was stopped. (n = 20) Control group: Placebo. Participants received only crystalloid solutions for first 24 hrs. (n = 20) | |
| Outcomes | Plasma paracetamol concentration, gastric motility, venous blood samples and emptying | |
| Study dates | Not stated | |
| Notes | We contacted the authors on 1st October 2015 and received a reply, see below. | |
| Risk of bias | ||
| Bias | Authors' judgement | Support for judgement |
| Random sequence generation (selection bias) | Low risk | According to correspondence with the author software randomisation was used. |
| Allocation concealment (selection bias) | Unclear risk | It was unclear from the author's response, how the allocation sequence was concealed. |
| Blinding of participants and personnel (performance bias) | Low risk | According to correspondence with the author participants and personnel were blinded. |
| Blinding of outcome assessment (detection bias) | Low risk | According to correspondence with the author outcome assessors were blinded. |
| Incomplete outcome data (attrition bias) | Unclear risk | The number of participants with incomplete data was not reported. Correspondence with the author provided no further information. |
| Selective reporting (reporting bias) | Unclear risk | No protocol could be obtained, and the trial did not report all‐cause mortality or serious adverse events. |
| For‐profit bias | Unclear risk | It was unclear how the trial was funded. |
| Other bias | Low risk | The trial appeared to be free of other components that could put it at risk of bias. |
| Methods | Randomised clinical trial, USA | |
| Participants | 25 hospitalised adults with cancer of the oesophagus undergoing elective oesophagogastrectomy, at nutritional risk due to major surgery Male:Female = 17:8 Mean age = 61 years Exclusion criteria: Undergoing emergency surgery for oesophagogastrectomy or an oesophagogastrectomy performed by surgeons other than a specific doctor | |
| Interventions | Experimental group: received feeding jejunostomy tube with immediate postoperative enteral nutrition support. These participants received either a full‐strength elemental or polymeric diet at 10 mL/hr within 24 hrs of operation. The enteral feeding infusion rate was gradually increased by 10 mL/hr every 12 to 24 hrs until nutritional needs were met (estimated 25 ‐ 30 kcal/kg body weight and 1.2 ‐ 1.5 g protein/kg body weight). After contrast radiographic demonstration of an intact anastomosis, they began oral feeding. (n = 13) Control group: Standard care. Participants received a conventional intravenous fluid and electrolyte replacement until postoperative day 4 or 5 when radiographic assessment demonstrated an intact anastomosis. A clear liquid diet was initially provided and was gradually progressed over a period of 1 to 3 days to a regular post‐oesophagogastrectomy diet consisting of 6 small meals daily. (n = 12) | |
| Outcomes | Length of hospital stay, number of days spent in the ICU, number of days fed enterally or parenterally, postoperative complications including infections, wound healing, anastomotic leak, wound dehiscence, feeding tube‐related complications, caloric intake, gastrointestinal signs and symptoms | |
| Study dates | January 1991 to June 1993 | |
| Notes | We could find no contact information for the authors. | |
| Risk of bias | ||
| Bias | Authors' judgement | Support for judgement |
| Random sequence generation (selection bias) | Unclear risk | Not described |
| Allocation concealment (selection bias) | Unclear risk | Not described |
| Blinding of participants and personnel (performance bias) | Unclear risk | Not described |
| Blinding of outcome assessment (detection bias) | Unclear risk | Not described |
| Incomplete outcome data (attrition bias) | Low risk | There were no dropouts. |
| Selective reporting (reporting bias) | Unclear risk | The trial reported complications, but not all‐cause mortality. No protocol could be obtained. |
| For‐profit bias | Unclear risk | It was unclear how the trial was funded. |
| Other bias | Low risk | The trial appeared to be free of other components that could put it at risk of bias. |
| Methods | Randomised clinical trial, USA | |
| Participants | 30 hospitalised adults with lymphoma or Ieukaemia undergoing allogenic or autologous bone marrow transplant, at nutritional risk due to major surgery Male:Female = 17:13 Mean age = approximately 38 years Exclusion criteria: not described | |
| Interventions | Experimental group: Participants received standard glutamine‐free PN, STD‐PN provided calories at 1.3 BEE, (500 kcal/day as fat emulsion) and protein at 1.5 g/kg/day. PN containing micronutrients alone, without dextrose or amino acids (n = 16) Control group: Participants received PN containing micronutrients alone, without dextrose or amino acids. It provided standard amounts of vitamins, trace elements, electrolytes and 50 kcal/day as fat emulsion (to maintain blinding). Considered to be placebo (n = 14) | |
| Outcomes | Length of hospital stay, infectious complications, non‐prophylactic antibiotic administration, fever, engraftment, and body weight changes from PN initiation until hospital discharge. Serum chemistries, electrolyte requirements and oral kcal as wanted and protein intake during the period of PN infusion | |
| Study dates | Not stated | |
| Notes | We contacted the authors on 13th December 2015 by email: [email protected]. We received no reply. | |
| Risk of bias | ||
| Bias | Authors' judgement | Support for judgement |
| Random sequence generation (selection bias) | Unclear risk | Not described |
| Allocation concealment (selection bias) | Unclear risk | Not described |
| Blinding of participants and personnel (performance bias) | Unclear risk | The trial was described as double‐blinded. Participants were blinded but it is unclear whether personnel were blinded. |
| Blinding of outcome assessment (detection bias) | Unclear risk | The trial was described as double‐blinded, but it was unclear if the outcome assessors were blinded. |
| Incomplete outcome data (attrition bias) | Unclear risk | They used intention‐to‐treat analysis, but did not describe how they dealt with missing participants. |
| Selective reporting (reporting bias) | Unclear risk | No protocol could be obtained, and the trial did not report all‐cause mortality, but they did report adverse events. |
| For‐profit bias | Unclear risk | It was unclear how the trial was funded. |
| Other bias | Low risk | The trial appeared to be free of other components that could put it at risk of bias. |
| Methods | Randomised clinical trial, USA | |
| Participants | 21 hospitalised adults with gastrointestinal cancer and a weight loss > 10 lb over 3 to 6 months prior to admission for major surgery, at nutritional risk due to major abdominal surgery Male:Female = 21:0 Mean age = 65 years Exclusion criteria: not stated | |
| Interventions | Experimental group: Parenteral nutrition. Participants received hyperalimentation 8 days preoperatively, 10 days postoperatively. The intervention consisted of intravenous PN, with crystalline amino acids in 25% Dextrose beginning at least 5 days preoperatively and continuing until a regular diet (1500 cal) postoperatively was tolerated. Infusion rates were to provide 40 ‐ 50 kcal/kg/day or approximately 2000 ‐ 4000 cal per day. (n = 12) Control group: standard care (n = 9) | |
| Outcomes | Major postoperative complications; abscess, anastomotic leak, wound infection, minor complications; urinary tract infection, superficial wound infection, prolonged atelectasis and complications directly related to total parenteral nutrition. Weight, serum albumin and mortality | |
| Study dates | Not stated | |
| Notes | We contacted the authors on 13th November 2015 by email: [email protected]. We received no reply. | |
| Risk of bias | ||
| Bias | Authors' judgement | Support for judgement |
| Random sequence generation (selection bias) | Unclear risk | Not described |
| Allocation concealment (selection bias) | Unclear risk | Not described |
| Blinding of participants and personnel (performance bias) | Unclear risk | Not described |
| Blinding of outcome assessment (detection bias) | Unclear risk | Not described |
| Incomplete outcome data (attrition bias) | Unclear risk | The number of participants with incomplete data was not reported. |
| Selective reporting (reporting bias) | Low risk | The trial reported all‐cause mortality and serious adverse events. No protocol could be found. |
| For‐profit bias | Unclear risk | It was unclear how the trial was funded. |
| Other bias | Low risk | The trial appeared to be free of other components that could put it at risk of bias. |
| Methods | Randomised clinical trial, China | |
| Participants | 126 hospitalised adults with gastrointestinal tumour, at nutritional risk due to major surgery Male:Female = 62:46 Mean age = 68.2 years Exclusion criteria: Body weight over or less than 15% of the participants usual body weight, diabetes and decompensate hyperthyroidism or serious hepatorenal dysfunction (ALT > 60 U/L, TBiL > 25.7 μmol/L, BUN 10.7 mmol/L, Cre > 132.9 μmol/L) and haemorrhagic shock | |
| Interventions | Experimental group 1: TPN after surgery (50 ml/kg/day, N/Q = 1 g:552 kJ) for intravenous drip (n = 45) Experimental group 2: Enteral nutrient fluids (50 ml/kg/day, N/Q = 1 g : 552 kJ) for infusion after gastrointestinal fistulation, 500 ml (40 ‐ 50 ml/hr) of the fluids after 1st 24 hrs, 1000 ml (80 ‐ 120 ml/hr) after 48 hrs, and 1500 ml (80 ‐ 120 ml/hr) after 72 hrs. Semi‐liquid diet after 6 ‐ 7 days of infusion. (n = 45) Control group: Conventional therapy of fluid infusion, transition diet after recovery of intestinal peristalsis (n = 36) | |
| Outcomes | Complications, body weight (9 days after treatment) | |
| Study dates | Not stated | |
| Notes | Same as Tong 2006b, but with experimental group 1 vs. control group. We tried but failed to contact the authors on 23rd September 2015 by phone and email: [email protected]. | |
| Risk of bias | ||
| Bias | Authors' judgement | Support for judgement |
| Random sequence generation (selection bias) | Unclear risk | Not described |
| Allocation concealment (selection bias) | Unclear risk | Not described |
| Blinding of participants and personnel (performance bias) | High risk | Participants and personnel were not blinded. |
| Blinding of outcome assessment (detection bias) | Unclear risk | Not described |
| Incomplete outcome data (attrition bias) | Unclear risk | The number of participants with incomplete data was not reported. |
| Selective reporting (reporting bias) | Unclear risk | No protocol could be obtained and the trial did not report on all‐cause mortality or serious adverse event. |
| For‐profit bias | Unclear risk | It was unclear how the trial was funded. |
| Other bias | Low risk | The trial appeared to be free of other components that could put it at risk of bias. |
| Methods | Randomised clinical trial, China | |
| Participants | 126 hospitalised adults with gastrointestinal tumour, at nutritional risk due to major surgery Male:Female = 62:46 Mean age = 68.2 years Exclusion criteria: Body weight over or less than 15% of the participants usual body weight, diabetes and decompensate hyperthyroidism or serious hepatorenal dysfunction (ALT > 60 U/L, TBiL > 25.7 μmol/L, BUN 10.7 mmol/L, Cre > 132.9 μmol/L) and haemorrhagic shock | |
| Interventions | Experimental group 1: TPN after surgery (50 ml/kg/day, N/Q = 1 g:552 kJ) for intravenous drip (n = 45) Experimental group 2: Enteral nutrient fluids (50 ml/kg/day, N/Q = 1 g : 552 kJ) for infusion after gastrointestinal fistulation, 500 ml (40 ‐ 50 ml/hr) of the fluids after 1st 24 hrs, 1000 ml (80 ‐ 120 ml/hr) after 48 hrs, and 1500 ml (80 ‐ 120 ml/hr) after 72 hrs. Semi‐liquid diet after 6 ‐ 7 days of infusion. (n = 45) Control group: Conventional therapy of fluid infusion, transition diet after recovery of intestinal peristalsis (n = 36) | |
| Outcomes | Complications, body weight (9 days after treatment) | |
| Study dates | Not stated | |
| Notes | Same as Tong 2006a, but with experimental group 2 vs. control group | |
| Risk of bias | ||
| Bias | Authors' judgement | Support for judgement |
| Random sequence generation (selection bias) | Unclear risk | Not described |
| Allocation concealment (selection bias) | Unclear risk | Not described |
| Blinding of participants and personnel (performance bias) | High risk | Participants and personnel were not blinded |
| Blinding of outcome assessment (detection bias) | Unclear risk | Not described |
| Incomplete outcome data (attrition bias) | Unclear risk | The number of participants with incomplete data was not reported. |
| Selective reporting (reporting bias) | Unclear risk | No protocol could be obtained and the trial did not report on all‐cause mortality or serious adverse events. |
| For‐profit bias | Unclear risk | It was unclear how the trial was funded. |
| Other bias | Low risk | The trial appeared to be free of other components that could put it at risk of bias |
| Methods | Randomised clinical trial, India | |
| Participants | 63 hospitalised adults undergoing elective upper gastrointestinal surgery, at nutritional risk due to major abdominal surgery Male:Female = 51:10 (only analysed participants) Mean age = 44 years (only analysed participants) Exclusion criteria: emergency upper gastro‐intestinal surgery, comorbid medical conditions (diabetes mellitus, gross renal or hepatic dysfunction), intolerance to milk‐based foods and unresectable tumours | |
| Interventions | Experimental group: Early postoperative enteral nutrition through a nasojejunal tube. The diet was milk‐based in a standard feeding protocol with an energy supply of 2296 kcal/day. The diet consisted of: skimmed milk powder 150 g, sugar 50 g, vegetable oil 20 g and whey water to make one litre. 12 hrs after surgery the feeding was started according to the protocol: 12 ‐ 24 hours: normal saline and 5% dextrose; 1:3 ratio at 100 ml/hr 24 ‐ 48 hrs: 1 litre of half‐strength feed at 50 ml/hr 48 ‐ 72 hrs: 2 litres of half‐strength feed at 100 ml/hr 72 hours onwards: 2 litres of full‐strength feed/24 hrs Enteral nutrition was continued until oral feeding was considered tolerable. (n = 32) | |
| Outcomes | Body weight, serum albumin, serum transferrin, bowel sounds, passage of flatus, diarrhoea, abdominal cramps, abdominal distension, ileus, wound infection, abdominal abscess, respiratory infection, urinary nitrogen, urinary tract infection, septicaemia, wound dehiscence, anastomotic leak, respiratory infection, vomiting and length of hospital stay | |
| Study dates | Not stated | |
| Notes | We contacted the authors on 26th October 2015 by email: [email protected]; [email protected]. We received no reply. | |
| Risk of bias | ||
| Bias | Authors' judgement | Support for judgement |
| Random sequence generation (selection bias) | Low risk | Patients were randomised into 2 groups using a random‐number table. |
| Allocation concealment (selection bias) | Unclear risk | The trial was described as being randomised, but it was unclear how the allocation was concealed. |
| Blinding of participants and personnel (performance bias) | Unclear risk | Not described |
| Blinding of outcome assessment (detection bias) | Unclear risk | Not described |
| Incomplete outcome data (attrition bias) | Unclear risk | They did not use intention‐to‐treat analysis and did not fully describe how they dealt with missing participants. |
| Selective reporting (reporting bias) | Unclear risk | The trial reported serious adverse events, but not all‐cause mortality. No protocol could be found. |
| For‐profit bias | Unclear risk | It was unclear how the trial was funded. |
| Other bias | Low risk | The trial appeared to be free of other components that could put it at risk of bias. |
| Methods | Randomised clinical trial, USA | |
| Participants | 65 hospitalised adults, previously untreated, with small cell bronchogenic carcinoma admitted for chemotherapy, at nutritional risk according to the trialist Male:Female = 40:18 Mean age = 59 years | |
| Interventions | Experimental group: Intravenous hyperalimentation 500 ml 50% glucose, 500 ml 8.5% amino acid(n = 30) Co‐intervention: oral nutrition as wanted + chemotherapy | |
| Outcomes | Myelosuppresive toxicity, infectious complications, weight, triceps skinfold, mid‐upper arm muscle circumference, days of hospitalisation, survival, remission | |
| Study dates | Not stated | |
| Notes | The same participants were randomised to prophylactic antibiotics or no prophylactic antibiotics. The 2 groups of antibiotics could be described as being similar in the 2 groups. We contacted the authors on 23rd June 2015 by email: [email protected]. The author replied that he had left the research environment and could not provide further information. | |
| Risk of bias | ||
| Bias | Authors' judgement | Support for judgement |
| Random sequence generation (selection bias) | Unclear risk | Not described |
| Allocation concealment (selection bias) | Unclear risk | Not described |
| Blinding of participants and personnel (performance bias) | Unclear risk | Not described |
| Blinding of outcome assessment (detection bias) | Unclear risk | Not described |
| Incomplete outcome data (attrition bias) | Unclear risk | There were above 5% dropouts, and the trial did not use proper methodology to deal with those lost to follow‐up. |
| Selective reporting (reporting bias) | Low risk | The trial reported mortality and serious adverse events. |
| For‐profit bias | Low risk | The trial was funded by a non‐profit organisation (National Cancer Institute). |
| Other bias | Low risk | The trial appeared to be free of other components that could put it at risk of bias. |
| Methods | Randomised clinical trial, the Netherlands | |
| Participants | 56 hospitalised adults admitted with acute exacerbation of COPD, at nutritional risk due to BMI < 22 kg/m2, or a BMI < 25 kg/m2 with > 5% weight loss in 1 month, or > 10% weight loss in 6 months prior to admission to the hospital Exclusion criteria: Diabetes mellitus 1, thyroid or intestinal diseases or carcinoma | |
| Interventions | Experimental group: 3 x 125 ml Respifors/day; 2.38 MJ/day, 20 energy% from protein, 20 energy% from fat and 60 energy% from carbohydrate (n = 29) Co‐intervention: Nutritional intervention was implemented in the standardised usual‐care management of these participants They received standardised hospital diet. Dietetic consultation was standardised during the study period and they were given 500 ml 5% glucose infusion. | |
| Outcomes | Weight, fat‐free mass, fat mass, FEV1%, IVC, Pi‐max, mean hand‐grip strength, quadriceps strength, dyspnoea score, loss of appetite score, early satiety score, bloating score, fatigue score, readmission to ward | |
| Study dates | Not stated | |
| Notes | We contacted the authors on 19th August 2015 by email: [email protected]. We received no reply. | |
| Risk of bias | ||
| Bias | Authors' judgement | Support for judgement |
| Random sequence generation (selection bias) | Unclear risk | Not described |
| Allocation concealment (selection bias) | Unclear risk | Not described |
| Blinding of participants and personnel (performance bias) | Low risk | The trial was double‐blinded, and the packages were described as being similar. |
| Blinding of outcome assessment (detection bias) | Unclear risk | Not described |
| Incomplete outcome data (attrition bias) | High risk | There were above 5% dropouts, and the trial did not use proper intention‐to‐treat methodology. |
| Selective reporting (reporting bias) | Unclear risk | No protocol could be obtained and the trial did not report on all‐cause mortality or serious adverse events. |
| For‐profit bias | High risk | The trial was funded by a nutrition company (Numico Research BV). |
| Other bias | Low risk | The trial appeared to be free of other components that could put it at risk of bias. |
| Methods | Randomised clinical trial, Croatia | |
| Participants | 101 hospitalised adults with burns covering more than 20% of the body surface, at nutritional risk due to being in the ICU Male:Female = 49:52 Mean age = 48 years | |
| Interventions | Experimental group: Fed via introduced nasojejunal probe equipped with enteral feeding. Basal feeding dose was 25 ml liquid enteral preparation each hr. (n = 52) Control group: Fed in standard manner by mouth (3 standard hospital meals) immediately after the 1st wound dressing(n = 49) | |
| Outcomes | Complete blood count, plasma electrolytes, plasma glucose, urea, creatinine, albumin, C‐reactive protein and transferrin, BMI, complications, death | |
| Study dates | Not stated | |
| Notes | We contacted the authors on 25th August 2015 by email: [email protected]. We received no reply. | |
| Risk of bias | ||
| Bias | Authors' judgement | Support for judgement |
| Random sequence generation (selection bias) | Low risk | "Subjects were divided into two groups using computer randomization process." |
| Allocation concealment (selection bias) | Unclear risk | Not described |
| Blinding of participants and personnel (performance bias) | High risk | The trial was not blinded since the participants were they only ones with tubes. |
| Blinding of outcome assessment (detection bias) | High risk | The trial was not blinded since the participants were they only ones with tubes. |
| Incomplete outcome data (attrition bias) | Unclear risk | The number of participants with incomplete data was not reported. |
| Selective reporting (reporting bias) | Low risk | There was no protocol. The trial reported complications and death. |
| For‐profit bias | Unclear risk | It was unclear how the trial was funded. |
| Other bias | Low risk | The trial appeared to be free of other components that could put it at risk of bias. |
| Methods | Randomised clinical trial, UK | |
| Participants | 549 hospitalised adults who were admitted acutely under the care of general medical, surgical or orthopaedic teams and were 'thin’ (5% ‐ 10% weight loss or BMI 18 ‐ 22), at nutritional risk due to anthropometrics Male:Female = 314:235 Mean age = 66.5 years Exclusion criteria: Planned admissions to medical or orthopaedic wards or to wards other than those 15 taking part in the trial, younger than 18, suffering mental illness, if water‐soluble vitamin supplementation was part of their standard treatment, if their admission would clearly be for 2 days or less, or if they had previously taken part in the trial. For the secondary randomisation to sip‐feed supplements, undernourished participants were excluded if; Their BMI was < 18 or if the unintentional weight loss exceeded 10%, to allow routine supplementation, were receiving therapeutic diets, e.g. insulin‐dependent diabetes, unable to swallow liquids, or if randomisation was considered clinically unacceptable. In practice, participants unable to communicate effectively and stroke victims could not be included because of consent issues. Weight loss, height and weight could not be documented in all participants. | |
| Interventions | Experimental group: 400 ml of a complete sip‐feed supplement (Ensure Plus, Abbott Laboratories Ltd) from the 2nd day (n = 275) | |
| Outcomes | Length of hospital stay, mortality | |
| Study dates | Not stated | |
| Notes | We contacted the authors on 8th February 2016 by email: [email protected]. We received no reply. | |
| Risk of bias | ||
| Bias | Authors' judgement | Support for judgement |
| Random sequence generation (selection bias) | Unclear risk | Not described |
| Allocation concealment (selection bias) | Unclear risk | The envelopes used to conceal the randomisation code were sealed but not described as opaque. |
| Blinding of participants and personnel (performance bias) | Unclear risk | It was unclear if the treatment providers were properly blinded: "The enteral feeds tasted different from each other and EnsurePlus was familiar to the ward nurses. The control feed, which tasted medicinal, was described as an alternative trial feed and we avoided discussion of which feed was ‘under test’. Nurses were not discouraged from assuming that it was the new, unfamiliar feed that was primarily under trial.". |
| Blinding of outcome assessment (detection bias) | Unclear risk | Not described |
| Incomplete outcome data (attrition bias) | High risk | There was more than 5% of participants without complete data. "Of 275 patients who received supplemental active sipfeed 97 had BMI data and 99 weight loss data and 54 had both." "274 patients received the placebo sip‐supplement of whom 101 had BMI data and 76 weight loss data and 44 both, and 133 had either one or other." The pattern of incomplete data could be described as being different in the 2 groups. |
| Selective reporting (reporting bias) | Unclear risk | There was no protocol and the trial did not report serious adverse events. |
| For‐profit bias | High risk | The trial received funds from the industry: "We are grateful also to Abbott Laboratories Ltd (especially Dr Stephen Coles, Dr Jackie Edington and Ms J Boorman) who supplied the sip feeds and placebo drinks and provided supplementary financial". |
| Other bias | Low risk | The trial appeared to be free of other components that could put it at risk of bias. |
| Methods | Randomised clinical trial, the Netherlands | |
| Participants | 151 hospitalised adults with newly‐detected, histologically‐proven gastric or colorectal carcinoma requiring surgical treatment, who had not undergone treatment for other malignant tumours Male:Female = 93:58 Mean age = 66.5 years Exclusion criteria: Patients above 80, patients with normal nutritional status, | |
| Interventions | Experimental groups: Group 1 (TPN): Participants in group 1 were planned to receive 150% of BEE, calculated using the Harris and Benedict equation, as non‐protein calories from a parenteral nutrition stock solution that contained 7g N/l (Synthamin 14) and 25% dextrose. Trace elements and vitamins (MVI) were added to conform to today’s standards. Electrolytes were added according to the individual participant’s needs. 500 ml of an intravenous fat emulsion (Intralipid 20%) was administered at least 3 times a week. Preoperative nutritional support lasted at least 10 days. (n = 51) Group 2 (TEN): Participants in group 2 received enteral nutrition (Precitene or Isotein) for at least 10 days preoperatively either by nasogastric tube or by mouth. Energy intake was planned to contain 150% of the calculated BEE.(n = 50) Control group: Group 3: No intervention (underwent immediate operation, which was assessed as an acceptable control intervention) (n = 50) | |
| Outcomes | Mortality, complications | |
| Study dates | Not stated | |
| Notes | We here report group 1 versus group 3. | |
| Risk of bias | ||
| Bias | Authors' judgement | Support for judgement |
| Random sequence generation (selection bias) | Unclear risk | Not described |
| Allocation concealment (selection bias) | Unclear risk | Not described |
| Blinding of participants and personnel (performance bias) | High risk | Not possible |
| Blinding of outcome assessment (detection bias) | High risk | Not possible |
| Incomplete outcome data (attrition bias) | Unclear risk | The number of participants with incomplete data was not reported. |
| Selective reporting (reporting bias) | Low risk | The trial reported mortality and complications. |
| For‐profit bias | High risk | The trial was funded by a company that might have an interest in a given result (Wander Research and Clintec). |
| Other bias | Low risk | The trial appeared free of other bias that might put it at risk. |
| Methods | Randomised clinical trial, the Netherlands | |
| Participants | 151 hospitalised adults with newly‐detected, histologically‐proven gastric or colorectal carcinoma requiring surgical treatment, who had not undergone treatment for other malignant tumours Male:Female = 93:58 Mean age = 66.5 years Exclusion criteria: Patients above 80, patients with normal nutritional status | |
| Interventions | Group 1 (TPN): Participants in group 1 were planned to receive 150% of BEE, calculated using the Harris and Benedict equation, as non‐protein calories from a parenteral nutrition stock solution that contained 7g N/l (Synthamin 14) and 25% dextrose. Trace elements and vitamins (MVI) were added to conform to today’s standards. Electrolytes were added according to the individual participant’s needs. 500 ml of an intravenous fat emulsion (Intralipid 20%) was administered at least 3 times a week. Preoperative nutritional support lasted at least 10 days. (n = 51) Group 2 (TEN): Participants in group 2 received enteral nutrition (Precitene or Isotein) for at least 10 days preoperatively either by nasogastric tube or by mouth. Energy intake was planned to contain 150% of the calculated BEE.(n = 50) Control Group: group 3, who received no intervention (underwent immediate operation, which was assessed as an acceptable control intervention) (n = 50) | |
| Outcomes | Mortality, complications | |
| Study dates | Not stated | |
| Notes | We here report group 2 versus group 3. | |
| Risk of bias | ||
| Bias | Authors' judgement | Support for judgement |
| Random sequence generation (selection bias) | Unclear risk | Not described |
| Allocation concealment (selection bias) | Unclear risk | Not described |
| Blinding of participants and personnel (performance bias) | Unclear risk | Not possible |
| Blinding of outcome assessment (detection bias) | Unclear risk | Not possible |
| Incomplete outcome data (attrition bias) | Unclear risk | The number of participants with incomplete data was not reported. |
| Selective reporting (reporting bias) | Low risk | The trial reported mortality and complications. |
| For‐profit bias | High risk | The trial was funded by a company that might have an interest in a given result (Wander Research and Clintec). |
| Other bias | Unclear risk | The trial appeared free of other bias that might put it at risk. |
| Methods | Randomised clinical trial, China | |
| Participants | 36 hospitalised adults with gastric cardia adenocarcinoma, gastric carcinoma, pancreatic carcinoma and biliary calculi, at nutritional risk due to open abdominal surgery Male:Female = 29:7 Mean age = approx 54 years | |
| Interventions | Experimental group 1: Parenteral nutrition. Central venous infusion at postoperative day, 105 ‐ 125 KJ/kg/d (25 ‐ 30 kcal/kg/day), 30% ‐ 40% of the nonprotein energy was provided by fat emulsion (10% intralipid SSPS). Nitrogen 0.12 ‐ 0.15 g/kg/day (7% Vamin SSPC), Energy:Nitrogen = 170 ‐ 220:1. Total infusion volume was 2500 ‐ 3000 ml nutrition support from the 1st postoperative day, for 7 days in total. (n = 12) Experimental group 2: Enteral nutrition. Tube‐feeding with Compound nutrition elements (Qingdao biochemical and pharmaceutical factory) at postoperative day, with the same intake of energy and nitrogen as experimental group 1. Peripheral intravenous infusion with energy and nitrogen from 24 to 48 hrs if the tube‐feeding was insufficient. Total infusion volume was 2500 ‐ 3000 ml nutrition support from the 1st day postoperative , for 7 days in total. (n = 12) Control group: Conventional therapy of peripheral intravenous infusion with glucose saline 2500 ml, including glucose 175 g, calorie 2926 kJ (700 kcal)/day). Total infusion volume was 2500 ‐ 3000 ml nutrition support from the 1st day postoperative for 7 days in total. (n = 12) | |
| Outcomes | Body weight | |
| Study dates | Not stated | |
| Notes | Same as Wong 1996b, but with experimental group 1 vs control group. We tried and failed to contact the authors by phone. | |
| Risk of bias | ||
| Bias | Authors' judgement | Support for judgement |
| Random sequence generation (selection bias) | Unclear risk | Not described |
| Allocation concealment (selection bias) | Unclear risk | Not described |
| Blinding of participants and personnel (performance bias) | High risk | Participants and personnel were not blinded. |
| Blinding of outcome assessment (detection bias) | Unclear risk | Not described |
| Incomplete outcome data (attrition bias) | Unclear risk | The number of participants with incomplete data was not reported. |
| Selective reporting (reporting bias) | Unclear risk | No protocol could be obtained and the trial did not report on all‐cause mortality or serious adverse events. |
| For‐profit bias | Unclear risk | It was unclear how the trial was funded. |
| Other bias | Low risk | The trial appeared to be free of other components that could put it at risk of bias. |
| Methods | Randomised clinical trial, China | |
| Participants | 36 hospitalised adults with gastric cardia adenocarcinoma, gastric carcinoma, pancreatic carcinoma and biliary calculi, at nutritional risk due to open abdominal surgery Male:Female = 29:7 Mean age = approx. 54 years Exclusion criteria: Not reported | |
| Interventions | Experimental group 1: Parenteral nutrition. Central venous infusion at postoperative day, 105 ‐ 125 KJ/kg/day (25 ‐ 30 kcal/kg/day), 30% ‐ 40% of the nonprotein energy was provided by fat emulsion (10% intralipid SSPS). Nitrogen 0.12 ‐ 0.15 g/kg/day (7% Vamin SSPC), Energy:Nitrogen = 170 ‐ 220:1. Total infusion volume was 2500 ‐ 3000 ml nutrition support from the 1st postoperative day, for 7 days in total. (n = 12) Experimental group 2: Enteral nutrition. Tube‐feeding with Compound nutrition elements (Qingdao biochemical and pharmaceutical factory) at postoperative day, with the same intake of energy and nitrogen as the experimental group 1. Peripheral intravenous infusion with energy and nitrogen from 24 to 48 hrs if the tube‐feeding was insufficient. Total infusion volume was 2500 ‐ 3000 ml nutrition support from the 1st day postoperative , for 7 days in total. (n = 12) Control group: Conventional therapy of peripheral intravenous infusion with glucose saline 2500 ml, including glucose 175 g, calorie 2926 kJ (700 kcal)/day). Total infusion volume was 2500 ‐ 3000 ml nutrition support from the 1st day postoperative for 7 days in total. (n = 12) | |
| Outcomes | Body weight | |
| Study dates | Not stated | |
| Notes | Same as Wang 1996a, but with experimental group 2 vs control group | |
| Risk of bias | ||
| Bias | Authors' judgement | Support for judgement |
| Random sequence generation (selection bias) | Unclear risk | Not described |
| Allocation concealment (selection bias) | Unclear risk | Not described |
| Blinding of participants and personnel (performance bias) | High risk | Participants and personnel were not blinded. |
| Blinding of outcome assessment (detection bias) | Unclear risk | Not described |
| Incomplete outcome data (attrition bias) | Unclear risk | The number of participants with incomplete data was not reported. |
| Selective reporting (reporting bias) | Unclear risk | No protocol could be obtained and the trial did not report on all‐cause mortality or serious adverse events. |
| For‐profit bias | Unclear risk | It was unclear how the trial was funded. |
| Other bias | Low risk | The trial appeared to be free of other components that could put it at risk of bias. |
| Methods | Randomised clinical trial, China | |
| Participants | 60 hospitalised adults with oesophageal cancer and cardiac cancer, at nutritional risk due to gastro‐oesophageal surgery Male:Female = 47:13 Mean age = 58.7 years Exclusion criteria: Not stated | |
| Interventions | Experimental group: Group 1: Recieved enteral nutrition of about 2.93 kJ/(kg/hr) calories from the 1st day post‐operation, which was gradually increased to 5.44 kJ/(kg/hr) calories until the 4th day, and then gradually reduced to 3.35 kJ/(kg/hr) calories from the 4th day until the 14th day; including 50 g aminophenol each day. After that conventional fluid infusion (4.18 kJ/(kg/hr) and 35 g aminophenol was given each day. The course of the treatment was 14 days. (n = 20) Group 2: Recieved parenteral feeding of about 2.93 kJ/(kg/hr) calories from the 1st day post‐operation, which was gradually increased to 5.44 kJ/(kg/hr) calories until the 4th day, and then gradually reduced to 3.35 kJ/(kg/hr) calories from the 4th day until the 14th day, including 50 g aminophenol each day. After that conventional fluid infusion (4.18 kJ/(kg/hr) and 35 g aminophenol was given each day. The course of the treatment was 14 days. (n = 20) Control group: Recieved conventional fluid and electrolyte infusion (about 1673.6 ˜ 2510.4 kJ calories), from the 1st until 5 ˜ 7 days after the operation. They then received a liquid diet, then gradually received semi‐liquid and ended with general food.The course of the treatment was 14 days. (n = 20) | |
| Outcomes | Triceps folds, forearm midpoint circumference, body weight, albumin, transferrin, blood biochemistry, liver function and the calculation of nitrogen balance | |
| Study dates | Not stated | |
| Notes | Same as Wang 1997c, but with experimental group 1 vs control. We could obtain no contact information for the authors. | |
| Risk of bias | ||
| Bias | Authors' judgement | Support for judgement |
| Random sequence generation (selection bias) | Unclear risk | Not described |
| Allocation concealment (selection bias) | Unclear risk | Not described |
| Blinding of participants and personnel (performance bias) | High risk | Participants and personnel were not blinded. |
| Blinding of outcome assessment (detection bias) | Unclear risk | Not described |
| Incomplete outcome data (attrition bias) | Unclear risk | The number of participants with incomplete data was not reported. |
| Selective reporting (reporting bias) | High risk | No protocol could be obtained and the trial did not report on all‐cause mortality and serious adverse events. |
| For‐profit bias | Unclear risk | It was unclear how the trial was funded. |
| Other bias | Low risk | The trial appeared to be free of other components that could put it at risk of bias. |
| Methods | Randomised clinical trial, China | |
| Participants | 60 hospitalised adults with oesophageal cancer and cardiac cancer, at nutritional risk due to gastro‐oesophageal surgery Male:Female = 47:13 Mean age = 58.7 years Exclusion criteria: not stated | |
| Interventions | Experimental group: Group 1: received enteral nutrition of about 2.93 kJ/(kg/hr) calories from the 1st day post‐operation, which was gradually increased to 5.44 kJ/(kg/hr) calories until the 4th day, and then gradually reduced to 3.35 kJ/(kg/hr) calories from the 4th day until the 14th day, including 50 g aminophenol each day. After that conventional fluid infusion (4.18 kJ/(kg/hr) and 35 g aminophenol was given each day. The course of the treatment was 14 days. (n = 20) Group 2: received parenteral feeding of about 2.93 kJ/(kg/hr) calories from the 1st day post‐operation, which was gradually increased to 5.44 kJ/(kg/hr) calories until the 4th day, and then gradually reduced to 3.35 kJ/(kg/hr) calories from the 4th day until the 14th day, including 50 g aminophenol each day. After that conventional fluid infusion (4.18 kJ/(kg/hr) and 35 g aminophenol was given each day. The course of the treatment was 14 days. (n = 20) Control group: received conventional fluid and electrolyte infusion (about 1673.6 ˜ 2510.4 kJ calories), from the 1st until 5 ˜ 7 days after the operation. They then received a liquid diet, then gradually received semi‐liquid and ended with general food.The course of the treatment was 14 days.(n = 20) | |
| Outcomes | Triceps folds, forearm midpoint circumference, body weight, albumin, transferrin, blood biochemistry, liver function and the calculation of nitrogen balance | |
| Study dates | Not stated | |
| Notes | Same as Wang 1997a, but with experimental group 2 vs control | |
| Risk of bias | ||
| Bias | Authors' judgement | Support for judgement |
| Random sequence generation (selection bias) | Unclear risk | Not described |
| Allocation concealment (selection bias) | Unclear risk | Not described |
| Blinding of participants and personnel (performance bias) | High risk | Participants and personnel were not blinded. |
| Blinding of outcome assessment (detection bias) | Unclear risk | Not described |
| Incomplete outcome data (attrition bias) | Unclear risk | The number of participants with incomplete data was not reported. |
| Selective reporting (reporting bias) | High risk | No protocol could be obtained and the trial did not report on all‐cause mortality or serious adverse events. |
| For‐profit bias | Unclear risk | It was unclear how the trial was funded. |
| Other bias | Low risk | The trial appeared to be free of other components that could put it at risk of bias. |
| Methods | Randomised clinical trial, China | |
| Participants | 64 hospitalised adults with severe acute pancreatitis, at nutritional risk due to digestive disorders Male:Female = 34:30 Mean age = 52 years Exclusion criteria: Not stated | |
| Interventions | Experimental group: Enteral nutrition by nasogastric feeding starting 48 ‐ 96 hrs after being hospitalised as well as conventional treatment. The course of the treatment was unclear. (n = 40) Control group: No intervention(n = 24) Co‐interventions: Conventional treatment including; fasting, gastro‐intestinal decompression, PPI due to acid, grease and octreotide Gabay enzyme inhibition, antibiotic therapy, colloid supplement and traditional Chinese medicine Qingyi Decotion orally | |
| Outcomes | The recovery time from symptoms, physical signs and laboratory parameters (white blood cell count, CRP and serum amylase), changes in body weight and serum albumin, cost of hospitalisation and length of stay | |
| Study dates | Not stated | |
| Notes | We tried but failed to contact the authors by phone and email: meteorcloud@yeahnet. | |
| Risk of bias | ||
| Bias | Authors' judgement | Support for judgement |
| Random sequence generation (selection bias) | Unclear risk | Not described |
| Allocation concealment (selection bias) | Unclear risk | Not described |
| Blinding of participants and personnel (performance bias) | High risk | Participants and personnel were not blinded. |
| Blinding of outcome assessment (detection bias) | Unclear risk | Not described |
| Incomplete outcome data (attrition bias) | Unclear risk | The number of participants with incomplete data was not reported. |
| Selective reporting (reporting bias) | High risk | No protocol could be obtained and the trial did not report on all‐cause mortality or serious adverse events. |
| For‐profit bias | Unclear risk | It was unclear how the trial was funded. |
| Other bias | Low risk | The trial appeared to be free of other components that could put it at risk of bias. |
| Methods | Randomised clinical trial, China | |
| Participants | 79 hospitalised adult with AIDS, at nutritional risk due to surgery or mechanical ventilation Male:Female = 41:38 Mean age = 38.2 years Exclusion criteria: diabetes mellitus, hyperthyroidism, severe liver and kidney dysfunction, CD4 cell count > 200 /μl | |
| Interventions | Experimental group: Enteral nutrition of non‐protein calorie 84 kJ/(kg/day), nitrogen 0.2 g/(kg/day). Participants received a guaranteed calorie intake every day of 83.6 ~ 146.3 kJ/(kg/day). The course of treatment was 5 ˜ 7 days. (n = 46) Control group: no intervention (n = 33) Co‐interventions: conventional treatment (glucose and saline as intravenous infusion) | |
| Outcomes | T lymphocytes (CD3, CD4, and CD8), blood biochemical parameters. | |
| Study dates | Not stated | |
| Notes | We contacted the authors on email: [email protected]. We received no reply. | |
| Risk of bias | ||
| Bias | Authors' judgement | Support for judgement |
| Random sequence generation (selection bias) | Low risk | The sequence generation was achieved using a random‐numbers table. |
| Allocation concealment (selection bias) | Unclear risk | Not described |
| Blinding of participants and personnel (performance bias) | High risk | Participants and personnel were not blinded. |
| Blinding of outcome assessment (detection bias) | Unclear risk | Not described |
| Incomplete outcome data (attrition bias) | Unclear risk | The number of participants with incomplete data was not reported. |
| Selective reporting (reporting bias) | Unclear risk | No protocol could be obtained and the trial did not report on all‐cause mortality or serious adverse events. |
| For‐profit bias | Unclear risk | It was unclear how the trial was funded. |
| Other bias | Low risk | The trial appeared to be free of other components that could put it at risk of bias. |
| Methods | Randomised clinical trial, China | |
| Participants | 48 hospitalised adults with colorectal cancer, at nutritional risk due to major surgery Male:Female = 27:21 Age range = 37 ‐ 73 years Exclusion criteria: Older than 80, received chemotherapy prior to the surgery, serious organ function disorder, low rectal cancer and having abdominoperineal resection, palliative operation, or emergency operation, severely obese, fatty or malnourished, metabolic and endocrine diseases such as hyperthyroidism 7, having Intestinal obstruction, perforation, or intestinal necrosis | |
| Interventions | Experimental group: Enteral nutrition: 500 ml Jevity each day was taken orally from the 1st day of admission to the hospital (500 ml Jevity contained 2196.6 KJ, protein 20 g, fat 17 g, carbohydrate 70 g and dietary fibre 5.3 g). A nasal tube was placed after the surgery, and water was given at the 1st postoperative day, and if there was no discomfort, 500 ml Jevity and water were administered on the 2nd postoperative day. From the 3rd day on, 1000 ml Jevity was given with certain nutrition liquid diet until hospital discharge. If the participants had symptoms like nausea, vomiting or abdominal distention, the dose of Jevity would be decreased or changed to another kind of nutrient.(n = 24) Control group: Standard usual care. Participants were administered venous transfusion after the surgery, and water was given after anal‐exsufflation. If there was no discomfort, the volume of water would be increased and a liquid diet considered. (n = 24) | |
| Outcomes | Postoperative exhaust time, hospital stay, treatment charge, bio markers postoperative complications such as pulmonary infection, the completion rate of nutrition agents | |
| Study dates | Not stated | |
| Notes | We contacted the authors on 09th December 2015 by phone and by email: [email protected]. We received no reply. | |
| Risk of bias | ||
| Bias | Authors' judgement | Support for judgement |
| Random sequence generation (selection bias) | Low risk | The randomisation method was random table. |
| Allocation concealment (selection bias) | Unclear risk | Not described |
| Blinding of participants and personnel (performance bias) | High risk | Participants and personnel were not blinded. |
| Blinding of outcome assessment (detection bias) | Unclear risk | Not described |
| Incomplete outcome data (attrition bias) | Unclear risk | The number of participants with incomplete data was not reported. |
| Selective reporting (reporting bias) | Unclear risk | No protocol could be obtained and the trial did not report on all‐cause mortality or serious adverse events. |
| For‐profit bias | Unclear risk | It was unclear how the trial was funded. |
| Other bias | Low risk | The trial appeared to be free of other components that could put it at risk of bias. |
| Methods | Randomised clinical trial, UK | |
| Participants | 8 hospitalised adults with ongoing gastrointestinal oncologic surgery, at nutritional risk due to major surgery Male:Female = not stated Mean age = 69.5 years Exclusion criteria: none stated | |
| Interventions | Experimental group: Enteral feeding of 1800 ‐ 2000 kcal in addition to the hospitals standard diet (1600 kcal) 7 ‐ 10 days before surgery (n = 8) | |
| Outcomes | Whole‐protein turnover and muscle protein synthesis | |
| Study dates | Not stated | |
| Notes | We found no contact information for the authors. | |
| Risk of bias | ||
| Bias | Authors' judgement | Support for judgement |
| Random sequence generation (selection bias) | Unclear risk | Not described |
| Allocation concealment (selection bias) | Unclear risk | Not described |
| Blinding of participants and personnel (performance bias) | High risk | Not blinded |
| Blinding of outcome assessment (detection bias) | Unclear risk | Not described |
| Incomplete outcome data (attrition bias) | Low risk | No dropouts |
| Selective reporting (reporting bias) | Unclear risk | Not described |
| For‐profit bias | High risk | Funded by Abbott Laboratories |
| Other bias | Low risk | The trial appears to be free of other components that could put it at risk of bias. |
| Methods | Randomised clinical trial, Canada | |
| Participants | 31 hospitalised adults undergoing oesophagectomy or pancreatoduodenectomy, at nutritional risk due to major abdominal surgery Male:Female = 22:6 (analysed participants only) Mean age = 62.5 Exclusion criteria: Metastases identified before surgery or at the time of surgery, diabetes mellitus,and corticosteroid use | |
| Interventions | Experimental group: Immediate postoperative enteral feeding (The enteral preparation provided 4.4 g protein and 445 kJ/100 mL) (n = 15) Co‐intervention: PEG placement | |
| Outcomes | Hand‐grip strength, spirometry, serum biochemistry, urine biochemistry, mobility | |
| Study dates | Not stated | |
| Notes | We could obtain no contact information for the authors. | |
| Risk of bias | ||
| Bias | Authors' judgement | Support for judgement |
| Random sequence generation (selection bias) | Low risk | The sequence generation was computer‐generated. |
| Allocation concealment (selection bias) | Low risk | The allocation was concealed in sealed envelopes. |
| Blinding of participants and personnel (performance bias) | High risk | The participants and personnel were unblinded. |
| Blinding of outcome assessment (detection bias) | High risk | The outcome assessment was unblinded. |
| Incomplete outcome data (attrition bias) | High risk | There were above 5% dropouts, and the trial did not allow proper intention‐to‐treat methodology. |
| Selective reporting (reporting bias) | Unclear risk | No protocol could be obtained, and all‐cause mortality was not reported. |
| For‐profit bias | Unclear risk | It was unclear how the trial was funded. |
| Other bias | Low risk | The trial appeared to be free of other components that could put it at risk of bias |
| Methods | Randomised clinical trial, China | |
| Participants | 79 hospitalised adults admitted for the 1st time with gastro‐intestinal cancer and distant metastasis undergoing Capecitabine monotherapy regimen for 2 cycles. They were younger than 60, KPS score > 60; had normal liver and kidney function, ECG, without chemotherapy contraindication, at nutritional risk due to trialist indication Male:Female = 42:37 Mean age = unknown Exclusion criteria: none stated | |
| Interventions | Experimental group: Parenteral and enteral nutrition. The participants were given parenteral nutrition support according to gastro‐intestinal function. If the oral intake was less than 60% of normal intake, a 30% fat emulsion injection was used (Intralipid force in Huarui Pharmaceutical Co. Ltd), as well as amino acid injection (Novamin, SSPC), fat‐soluble vitamins (Zhi Weibao, North China Pharmaceutical Limited by Share Ltd), water‐soluble vitamins (Soluvit, Huarui Pharmaceutical Co. Ltd), insulin, potassium chloride and sodium chloride to give parenteral nutrition for 3 14 days. The amount of enteral nutrition was increased gradually according to gastro‐intestinal tolerability, and reaching complete enteral nutrition when nausea, vomiting and diarrhoea were absent and the body state allowed for it. The enteral nutrition was given as an emulsion (Supportan, Huarui Pharmaceutical Co. Ltd.), with an initial dosage of 20% to 50% of the required nutrients. The calorie level was 80 kJ/(kg/day), protein was 1 g/(kg/day), and the ratio of non‐protein calorie versus nitrogen was 100:1. The treatment lasted for 2 cycles of chemotherapy. (n = 42) Control group: no intervention (n = 37) Co‐interventions: chemotherapy | |
| Outcomes | Nutritional statusKPS, toxic reaction and nosocomial infection rate | |
| Study dates | Not stated | |
| Notes | We contacted the authors on 21st January 2016 by phone. We received information on allocation sequence generation. | |
| Risk of bias | ||
| Bias | Authors' judgement | Support for judgement |
| Random sequence generation (selection bias) | Unclear risk | Random‐number table |
| Allocation concealment (selection bias) | Unclear risk | Not described |
| Blinding of participants and personnel (performance bias) | High risk | Participants and personnel were not blinded. |
| Blinding of outcome assessment (detection bias) | Unclear risk | Not described |
| Incomplete outcome data (attrition bias) | Unclear risk | The number of participants with incomplete data was not reported. |
| Selective reporting (reporting bias) | Unclear risk | No protocol could be obtained and the trial did not report on all‐cause mortality or serious adverse events. |
| For‐profit bias | Low risk | The trial was funded by Special funds of the central government (2012QN050). |
| Other bias | Low risk | The trial appeared to be free of other components that could put it at risk of bias. |
| Methods | Randomised clinical trial, Sweden | |
| Participants | 16 hospitalised adults admitted for elective abdominal surgery, at nutritional risk due to major surgery Male:Female = 7:9 Mean age = 57.2 years Exclusion criteria: metabolic disease | |
| Interventions | Experimental group: TPN (135 kj/body weight/day, carbohydrates and fat and an amino acid nitrogen supply). Control group: treatment as usual (electrolytes only) | |
| Outcomes | Polyribosomes/total ribosome, sucrose density gradient, nitrogen balance | |
| Study dates | Not stated | |
| Notes | We could obtain no contact information for the authors. | |
| Risk of bias | ||
| Bias | Authors' judgement | Support for judgement |
| Random sequence generation (selection bias) | Unclear risk | Not described |
| Allocation concealment (selection bias) | Unclear risk | Not described |
| Blinding of participants and personnel (performance bias) | Unclear risk | Not described |
| Blinding of outcome assessment (detection bias) | Unclear risk | Not described |
| Incomplete outcome data (attrition bias) | Low risk | No dropouts |
| Selective reporting (reporting bias) | Unclear risk | No protocol could be obtained. |
| For‐profit bias | Low risk | The trial was funded by the Swedish Medical Research Council and Trygg‐Hansa foundation. |
| Other bias | Low risk | The trial appeared to be free of other components that could put it at risk of bias. |
| Methods | Randomised clinical trial, Canada | |
| Participants | 10 hospitalised adults with COPD, at nutritional risk due to being malnourished Male:Female = 5:5 Mean age = 68 years Exclusion criteria: Congestive heart failure, clinically unstable, active respiratory infection, malabsorption or diabetes mellitus | |
| Interventions | Experimental group: Enteral feeding consisting of 1000 kcal/day for 16 days(n = 6) | |
| Outcomes | Weight, pulmonary function test | |
| Study dates | Not stated | |
| Notes | We contacted the authors were contacted on 9th December 2015 by email: [email protected]. We received no reply. | |
| Risk of bias | ||
| Bias | Authors' judgement | Support for judgement |
| Random sequence generation (selection bias) | Unclear risk | Not described |
| Allocation concealment (selection bias) | Unclear risk | Not described |
| Blinding of participants and personnel (performance bias) | Unclear risk | Not described |
| Blinding of outcome assessment (detection bias) | Unclear risk | Not described |
| Incomplete outcome data (attrition bias) | Low risk | No dropouts |
| Selective reporting (reporting bias) | Unclear risk | No protocol could be obtained and the trial did not report on all‐cause mortality or serious adverse events. |
| For‐profit bias | Unclear risk | It was unclear how the trial was funded. |
| Other bias | Low risk | The trial appeared to be free of other components that could put it at risk of bias. |
| Methods | Randomised clinical trial, UK | |
| Participants | 14 hospitalised adults with squamous cell carcinoma of the oesophagus, at nutritional risk according to the trialist Exclusion criteria: unable to swallow their saliva at presentation | |
| Interventions | Experimental group: fine‐bore enteral feeding (2400 ml of Isocal/24 hrs. (n = 7) Each litre = 33 g protein, 42 g of fat, 125 g carbohydrate) for 6 weeks Co‐interventions: standard ward diet | |
| Outcomes | Potassium, weight change | |
| Study dates | Not stated | |
| Notes | The trial found that very few of the experimental group had received the standard ward diet, because of the supplementary enteral feeding. The trial was terminated before it was finished, due to an increased effect of the experimental group. We contacted the authors by email:[email protected]. We received no reply. | |
| Risk of bias | ||
| Bias | Authors' judgement | Support for judgement |
| Random sequence generation (selection bias) | Unclear risk | Not described |
| Allocation concealment (selection bias) | Unclear risk | Not described |
| Blinding of participants and personnel (performance bias) | High risk | Not blinded. Only the experimental group received tube‐feeding. |
| Blinding of outcome assessment (detection bias) | Unclear risk | Not described |
| Incomplete outcome data (attrition bias) | Unclear risk | The number of participants with incomplete data was not reported. |
| Selective reporting (reporting bias) | Unclear risk | No protocol could be obtained and the trial did not report serious adverse events or mortality. |
| For‐profit bias | Unclear risk | It was unclear how the trial was funded. |
| Other bias | Low risk | The trial appeared to be free of other components that could put it at risk of bias. |
| Methods | Randomised clinical trial, unknown country. | |
| Participants | 64 hospitalised adults with acute alcoholic hepatitis, at nutritional risk defined by trialist Male:Female = 31:33 Mean age = 49 years Exclusion criteria: hepatocellular carcinoma | |
| Interventions | Experimental group: 2 litres daily of liquid diet providing, regardless of encephalopathy, approximately 2000 nonprotein kcal and 10 g nitrogen as 65 g of conventional protein administered enterally for 3 weeks (n = 21) Control group: No intervention (n = 22) Co‐intervention: The control diet yielded < 22 mol sodium, 1800 ‐ 2400 kcal and 70 ‐ 100 g protein. The adults receiving only the control diet were given vitamin K i.v. (10 mg x 3) and were subsequently managed with protein restriction (to 40 or 60 g) if indicated for control of encephalopathy, and by intravenous infusion of 5 ‐ 20% dextrose solutions if temporarily unable to take food orally. | |
| Outcomes | Mortality, complications, hepatic function (prothrombin time), indices of malnutrition and nitrogen balance | |
| Study dates | Not stated | |
| Notes | "The authors were not contacted since dr. Calvey died several years ago and no additional data was available" (Koretz 2012). | |
| Risk of bias | ||
| Bias | Authors' judgement | Support for judgement |
| Random sequence generation (selection bias) | Unclear risk | Not described |
| Allocation concealment (selection bias) | Unclear risk | Not described |
| Blinding of participants and personnel (performance bias) | Unclear risk | Not described |
| Blinding of outcome assessment (detection bias) | Unclear risk | Not described |
| Incomplete outcome data (attrition bias) | Unclear risk | The number of participants with incomplete data was not reported. |
| Selective reporting (reporting bias) | Low risk | The trial reported mortality and complications. |
| For‐profit bias | Low risk | The trial was supported by the Joint Research Committee of King's College Hospital and Medical School. |
| Other bias | Low risk | The trial appeared to be free of other components that could put it at risk of bias. |
| Methods | Randomised clinical trial, USA | |
| Participants | 459 hospitalised adults undergoing major abdominal or thoracic surgery, at nutritional risk according to Nutritional Risk Index (NRI) Male:Female = 455:4 Mean age = 62.9 years | |
| Interventions | Experimental group: 7 ‐ 15 days preoperative TPN (n = 231) | |
| Outcomes | Complications, all‐cause‐mortality | |
| Study dates | Not stated | |
| Notes | We could find no contact information for the authors. | |
| Risk of bias | ||
| Bias | Authors' judgement | Support for judgement |
| Random sequence generation (selection bias) | Low risk | The sequence was randomly computer‐generated. |
| Allocation concealment (selection bias) | Unclear risk | Not described |
| Blinding of participants and personnel (performance bias) | Unclear risk | Not described |
| Blinding of outcome assessment (detection bias) | Unclear risk | Not described |
| Incomplete outcome data (attrition bias) | High risk | There were above 5% dropouts, and the trial did not allow proper intention‐to‐treat methodology. |
| Selective reporting (reporting bias) | Low risk | The outcomes were as stated in the protocol. |
| For‐profit bias | High risk | The trial was funded by Armour Pharmaceutical. |
| Other bias | Low risk | The trial appeared to be free of other components that could put it at risk of bias. |
| Methods | Randomised clinical trial, USA | |
| Participants | 55 hospitalised adult men undergoing routine major surgery, at nutritional risk due to major surgery Male:Female = 55:0 Mean age = 54 years Exclusion criteria: none stated | |
| Interventions | Experimental group 1: TPN (90 g of crystalline amino acids, 3000 calories as glucose a day) from 2 weeks prior to surgery until 1 week after surgery (n = 10) Experimental group 3: parenteral nutrition: peripheral parenteral nutrition (90 g amino acids plus 1600 calories, 60% as fat a day)(n =15) Control group: treatment as usual (100 g glucose) (n = 15) | |
| Outcomes | Nitrogen balance, maintenance of body cell mass, serum albumin levels, exercise capacity | |
| Study dates | Not stated | |
| Notes | Group 1 could not be used in the analysis, since this group was not properly randomised (they had to have a certain degree of malnutrition, before being randomised to this group). | |
| Risk of bias | ||
| Bias | Authors' judgement | Support for judgement |
| Random sequence generation (selection bias) | Unclear risk | Not described |
| Allocation concealment (selection bias) | Unclear risk | Not described |
| Blinding of participants and personnel (performance bias) | Unclear risk | Not described |
| Blinding of outcome assessment (detection bias) | Unclear risk | Not described |
| Incomplete outcome data (attrition bias) | Unclear risk | Not described |
| Selective reporting (reporting bias) | Unclear risk | No protocol could be obtained, and the trial did not report mortality or serious adverse events. |
| For‐profit bias | Low risk | The trial was funded by the Veterans Affairs Administration. |
| Other bias | Low risk | The trial appeared to be free of other components that could put it at risk of bias. |
| Methods | Randomised clinical trial, USA | |
| Participants | 55 hospitalised adult men undergoing routine major surgery, at nutritional risk due to major surgery Male:Female = 55:0 Mean age = 54 years Exclusion criteria: none stated | |
| Interventions | Experimental group 1: total parenteral nutritionTPN (90 g of crystalline amino acids, 3,000 calories as glucose pera day) from 2 weeks prior to surgery until 1 week after surgery. (n = 10) Experimental group 3: parenteral nutrition: peripheral parenteral nutrition (90 g amino acids plus 1,600 calories, 60% percent as fat pera day).(n =15) Control group: treatment as usual (100 g glucose) (n = 15) | |
| Outcomes | Nitrogen balance, maintenance of body cell mass, serum albumin levels, exercise capacity | |
| Study dates | Not stated | |
| Notes | Group 1 could not be used in the analysis, since this group was not properly randomised (they had to have a certain degree of malnutrition, before being randomised to this group). | |
| Risk of bias | ||
| Bias | Authors' judgement | Support for judgement |
| Random sequence generation (selection bias) | Unclear risk | Not described |
| Allocation concealment (selection bias) | Unclear risk | Not described |
| Blinding of participants and personnel (performance bias) | Unclear risk | Not described |
| Blinding of outcome assessment (detection bias) | Unclear risk | Not described |
| Incomplete outcome data (attrition bias) | Unclear risk | Not described |
| Selective reporting (reporting bias) | Unclear risk | No protocol could be obtained, and the trial did not report mortality or serious adverse events. |
| For‐profit bias | Low risk | The trial was funded by the Veterans Affairs Administration. |
| Other bias | Low risk | The trial appeared to be free of other components that could put it at risk of bias. |
| Methods | Randomised clinical trial, UK | |
| Participants | 122 hospitalised adults with major thoracal/abdominal surgery Male:Female = 86:36 Mean age= 62.5 years Exclusion criteria: Unable to give consent (or refused), chronic renal or hepatic disease, diabetes mellitus requiring regular insulin treatment. Any use of systemic corticosteroids in the month prior to operation | |
| Interventions | Experimental group: Parenteral nutrition (Glucose: 9.2 g/kg previous body weight/24 hrs (35 kcal/kg/24 hrs); Amino‐acids as FreAmine II*: (1 mg amino‐acid N/175 kcal/non‐N energy); Intralipid 20%: 500 ml on days 2 and 5; Sodium: 150 mmol/24 hrs plus replacement of any significant extra‐renal losses. Control group: The basic solutions used in each participant were 1000 ml 0.9”” saline, and 2000 ml 5’j, glucose. All the other electrolytes and additives were given, calculated as if the participants were being fed. (n = 60) | |
| Outcomes | Any death, duration of hospital stay, complications, weight, anastomotic leakage, triceps skinfold, general progress, arm muscle circumference | |
| Study dates | Not stated | |
| Notes | We could find no contact information for the authors. | |
| Risk of bias | ||
| Bias | Authors' judgement | Support for judgement |
| Random sequence generation (selection bias) | Low risk | Random‐numbers table |
| Allocation concealment (selection bias) | Unclear risk | Short block sequence made it unclear if the investigators could foresee the allocation sequence. |
| Blinding of participants and personnel (performance bias) | Unclear risk | Although there was blinding the administration of Intralipid was not sufficiently described. |
| Blinding of outcome assessment (detection bias) | Unclear risk | The assessment was blinded but it was not stated who did the calculations and analyses and if they were blinded. |
| Incomplete outcome data (attrition bias) | High risk | There were above 5% missing data for weight and the trial did not account for the missing data. |
| Selective reporting (reporting bias) | Low risk | All clinical relevant outcomes were reported, despite no protocol published. |
| For‐profit bias | High risk | Funded by Boots UK. |
| Other bias | Low risk | The trial appeared to be free of other components that could put it at risk of bias. |
| Methods | Randomised clinical trial, China | |
| Participants | 646 hospitalised adults with gastrointestinal cancer, at nutritional risk due to gastro‐colorectal surgery Male:Female = 366:280 Mean age = 62 years Exclusion criteria: severe liver function damage (Child.Pugh class > B), severe impairment of renal function (serum creatinine > 265.2 mol/L or needed haemodialysis), severe respiratory dysfunction (arterial PaO2 < 70 mmHg), severe impairment of cardiac function (NYHA class > 3), already infected, (temperature > 37.6 °, WBC > 11.0 x 10⁹/L or bacteraemia), immune deficiency or damage (after radiotherapy or chemotherapy or WBC < 2.0 × 10⁹/L) | |
| Interventions | Experimental group: Group 1: enteral nutrition of 125.5 kJ (30 cal)/(kg/day), 0.25 g/(kg/day) nitrogen. The course of the treatment was 7 days. (n = 215) Group 2: parenteral nutrition of 125.5 kJ (30 cal)/(kg/day), 0.25 g/(kg/day) nitrogen, electrolyte, microelements and vitamins. The course of the treatment was 7 days. (n = 215) Control group: Conventional fluid infusion (5% and 10% glucose and electrolytes) until they resumed normal eating ( 43.9 ˜ 13.4) kJ (10.5 ˜ 3.2) kcal/(kg/day). The course of the treatment was unclear. (n = 216) | |
| Outcomes | Triceps folds, forearm midpoint circumference, body weight, albumin, transferrin, blood biochemistry, liver function and the calculation of nitrogen balance. Postoperative complications, mortality, serious adverse events, morbidity, postoperative length of hospital stay and weight change | |
| Study dates | Not stated | |
| Notes | Same as Wu 2007b, but with group 1 vs control. We found no contact information for the authors. | |
| Risk of bias | ||
| Bias | Authors' judgement | Support for judgement |
| Random sequence generation (selection bias) | Low risk | The sequence generation was achieved using computer random‐number generator. |
| Allocation concealment (selection bias) | Unclear risk | Not described |
| Blinding of participants and personnel (performance bias) | High risk | Participants and personnel were not blinded. |
| Blinding of outcome assessment (detection bias) | Unclear risk | Not described |
| Incomplete outcome data (attrition bias) | Unclear risk | The number of participants with incomplete data was not reported. |
| Selective reporting (reporting bias) | Unclear risk | No protocol could be obtained. |
| For‐profit bias | Unclear risk | It was unclear how the trial was funded. |
| Other bias | Low risk | The trial appeared to be free of other components that could put it at risk of bias. |
| Methods | Randomised clinical trial, China | |
| Participants | 725 hospitalised adults with gastro‐intestinal cancer, at nutritional risk due to gastro‐colorectal surgery Male:Female = 366:280 Mean age = 62 years Exclusion criteria: severe liver function damage (Child.Pugh class > B), severe impairment of renal function (serum creatinine > 265.2 mol/L or need haemodialysis), severe respiratory dysfunction (arterial PaO2 < 70 mmHg), severe impairment of cardiac function (NYHA class > 3), already infected (temperature > 37.6 °, WBC > 11.0 x 10⁹/L or bacteraemia), immune deficiency or damage (after radiotherapy or chemotherapy or WBC < 2.0 × 10⁹/L) | |
| Interventions | Experimental group: Group 1:Enteral nutrition of 125.5 kJ (30 cal)/(kg/day), 0,25 g/(kg/day) nitrogen. The course of the treatment was 7 days. (n = 215) Group 2: parenteral nutrition of 125.5 kJ (30 cal)/(kg/day), 0.25 g/(kg/day) nitrogen, electrolyte, microelements and vitamins. The course of the treatment was 7 days. (n = 215) Control group: Conventional fluid infusion (5% and 10% glucose and electrolytes) until resume normal eating (43.9 ˜ 13.4) kJ (10.5 ˜ 3.2) kcal/(kg/day). The course of the treatment was unclear. (n = 216) | |
| Outcomes | Triceps folds, forearm midpoint circumference, body weight, albumin, transferrin, blood biochemistry, liver function and the calculation of nitrogen balance. Postoperative complications, mortality, serious adverse events, morbidity, postoperative length of hospital stay and weight change | |
| Study dates | Not stated | |
| Notes | Same as Wu 2007a, but with group 2 vs control | |
| Risk of bias | ||
| Bias | Authors' judgement | Support for judgement |
| Random sequence generation (selection bias) | Low risk | The sequence generation was achieved using computer random‐number generator. |
| Allocation concealment (selection bias) | Unclear risk | Not described |
| Blinding of participants and personnel (performance bias) | High risk | Participants and personnel were not blinded. |
| Blinding of outcome assessment (detection bias) | Unclear risk | Not described |
| Incomplete outcome data (attrition bias) | Unclear risk | The number of participants with incomplete data was not reported. |
| Selective reporting (reporting bias) | Unclear risk | No protocol could be obtained. |
| For‐profit bias | Unclear risk | It was unclear how the trial was funded. |
| Other bias | Low risk | The trial appeared to be free of other components that could put it at risk of bias. |
| Methods | Randomised clinical trial, China. | |
| Participants | 120 hospitalised adults, at nutritional risk due to being frail elderly with hip fracture Male:Female = 66:54 Mean age = 69 Exclusion criteria: Not stated | |
| Interventions | Experimental group: Received early enteral nutrition. Stomach tube was inserted within 24 ‐ 48 hrs after surgery, and a small dose of fluid diet was given. If there was no obvious gastric retention, the diet was provided 48 hrs after surgery, started with ¼ of required volume, and increased by ¼ volume, so that at the 6 ‐ 7‐day the intake reached full volume, i.e. 2500 mL ± 500 mL. (n = 60) Control group: No treatment (n = 60) Co‐intervention: Intravenous drip of Esomeprazole 40 mg + saline 100 ml, twice a day | |
| Outcomes | Gastric juice PH, gastroscopic mucosa pathological variation, albumin, pre‐albumin, total protein, weight, digestive complications and adverse events | |
| Study dates | Not stated | |
| Notes | We tried and failed to contact the authors by phone and by email: [email protected]. | |
| Risk of bias | ||
| Bias | Authors' judgement | Support for judgement |
| Random sequence generation (selection bias) | Unclear risk | Not described |
| Allocation concealment (selection bias) | Unclear risk | Not described |
| Blinding of participants and personnel (performance bias) | High risk | Participants and personnel were not blinded. |
| Blinding of outcome assessment (detection bias) | Unclear risk | Not described |
| Incomplete outcome data (attrition bias) | Unclear risk | The number of participants with incomplete data was not reported. |
| Selective reporting (reporting bias) | Unclear risk | We found no protocol and the trial did not report serious adverse events or all‐cause mortality. |
| For‐profit bias | Unclear risk | It was unclear how the trial was funded. |
| Other bias | Low risk | The trial appeared to be free of other components that could put it at risk of bias. |
| Methods | Randomised clinical trial, China | |
| Participants | 32 hospitalised elderly adults admitted for gastro‐oesophageal, small intestine, colorectal surgery, at nutritional risk due to major surgery Male:Female = 19:13 Mean age = 67.6 years Exclusion criteria: none stated | |
| Interventions | Experimental group: Parenteral nutrition of 104.5 ˜ 146.4 kJ/(kg/day), 0.15 ˜ 0.24 g/(kg/day) nitrogen, 10% KCL 30 ml, 10% NaCL 40 ml, glucose, vitamin and exogenous insulin. The course of treatment was 7 days. (n = 16) Control group: conventional fluid infusion (the detailed composition of conventional fluid infusion and treatment course were unclear) (n = 16) | |
| Outcomes | Body weight, 24‐hr urinary nitrogen excretion, serum albumin, siderophilin, pre‐albumin, total lymphocyte count, nitrogen balance and morbidity | |
| Study dates | Not stated | |
| Notes | We found no contact information for the authors. | |
| Risk of bias | ||
| Bias | Authors' judgement | Support for judgement |
| Random sequence generation (selection bias) | Unclear risk | Not described |
| Allocation concealment (selection bias) | Unclear risk | Not described |
| Blinding of participants and personnel (performance bias) | High risk | Participants and personnel were not blinded. |
| Blinding of outcome assessment (detection bias) | Unclear risk | Not described |
| Incomplete outcome data (attrition bias) | Unclear risk | The number of participants with incomplete data was not reported. |
| Selective reporting (reporting bias) | High risk | The outcomes stated in the protocol are not reported. |
| For‐profit bias | Unclear risk | It was unclear how the trial was funded. |
| Other bias | Low risk | The trial appeared to be free of other components that could put it at risk of bias. |
| Methods | Randomised clinical trial, China | |
| Participants | 40 hospitalised adults with oesophageal cancer, at nutritional risk due to gastroenterologic surgery Male:Female = 28:12 Mean age = 45.6 years Exclusion criteria: abnormal function or disorder of the liver and kidney, metabolic disease | |
| Interventions | Experimental group: Nutrison Fibre enteral nutrition. Started on the 1st day after the surgery. The course of the treatment was unclear. (n = 20) Control group: Traditional Nutrison Fibre enteral nutrition. Started when the intestinal function began to recover. The course of the treatment was unclear. (n = 20) | |
| Outcomes | All‐cause mortality, serious adverse events, biomarkers, vital signs, recovery of gastrointestinal function and morbidity | |
| Study dates | Not stated | |
| Notes | We could find no contact information for the authors. | |
| Risk of bias | ||
| Bias | Authors' judgement | Support for judgement |
| Random sequence generation (selection bias) | Unclear risk | Not described |
| Allocation concealment (selection bias) | Unclear risk | Not described |
| Blinding of participants and personnel (performance bias) | High risk | Participants and personnel were not blinded. |
| Blinding of outcome assessment (detection bias) | Unclear risk | Not described |
| Incomplete outcome data (attrition bias) | Unclear risk | The number of participants with incomplete data was not reported. |
| Selective reporting (reporting bias) | Unclear risk | No protocol could be obtained, but the trial reported on all‐cause mortality and serious adverse events. |
| For‐profit bias | Unclear risk | It was unclear how the trial was funded. |
| Other bias | Low risk | The trial appeared to be free of other components that could put it at risk of bias. |
| Methods | Randomised clinical trial, Japan | |
| Participants | 34 hospitalised adults who had undergone gastrectomy, at nutritional risk due to major abdominal surgery Male:Female = Not described Exclusion criteria: older than 70 | |
| Interventions | Experimental group: TPN (24% glucose and 12% crystalline amino acids) with appropriate amounts of salts and minerals started on the 4th day after the surgery and continued for 14 days(n = 18) Co‐interventions: 5‐Fluorouracil, no oral restriction | |
| Outcomes | Mortality, complications, weight, serum values | |
| Study dates | ||
| Notes | We found no contact information for the authors. | |
| Risk of bias | ||
| Bias | Authors' judgement | Support for judgement |
| Random sequence generation (selection bias) | Unclear risk | Not described |
| Allocation concealment (selection bias) | Unclear risk | Not described |
| Blinding of participants and personnel (performance bias) | Unclear risk | Not described |
| Blinding of outcome assessment (detection bias) | Unclear risk | Not described |
| Incomplete outcome data (attrition bias) | Low risk | No incomplete data |
| Selective reporting (reporting bias) | Low risk | No protocol could be obtained but the trial did report all‐cause mortality and major complications. |
| For‐profit bias | Low risk | Supported by grants by the Japanese Ministry of Health and Welfare. |
| Other bias | Low risk | The trial appears to be free of other components that could put it at risk of bias. |
| Methods | Randomised clinical trial, China | |
| Participants | 21 hospitalised adults with gastric ulcer and cancer, at nutritional risk due to gastric surgery Male:Female = 13:8 Mean age = 48.9 years Exclusion criteria: not stated | |
| Interventions | Experimental group: from the 1st day after operation, the participants received Nutrison enteral nutrition (418 kJ calorie, 4.0 g protein, 3.9 g fat, 12.3 g carbohydrate per 100 ml). The intake was 500 ml at the beginning and increased with 500 ml a day, until it reached 2000 ml/day. The course of the treatment was 7 days. (n = 11) Control group: No intervention Liquid diet was started on the 3rd ˜ 5th day. (n = 10) Co‐interventions: Conventional fluid infusion to maintain water, electrolyte balance. Blood transfusion was given as needed. | |
| Outcomes | Serious adverse events, morbidity, urea nitrogen, nitrogen balance, plasma protein, T cell subsets and NK cell activity were calculated, body weight | |
| Study dates | Not stated | |
| Notes | We found no contact information for the authors. | |
| Risk of bias | ||
| Bias | Authors' judgement | Support for judgement |
| Random sequence generation (selection bias) | Unclear risk | Not described |
| Allocation concealment (selection bias) | Unclear risk | Not described |
| Blinding of participants and personnel (performance bias) | High risk | Participants and personnel were not blinded. |
| Blinding of outcome assessment (detection bias) | Unclear risk | Not described |
| Incomplete outcome data (attrition bias) | Low risk | The numbers and reasons for the withdrawals and dropouts were clearly stated. |
| Selective reporting (reporting bias) | Unclear risk | No protocol could be obtained. The trial reported on serious adverse events. |
| For‐profit bias | Unclear risk | It was unclear how the trial was funded. |
| Other bias | Low risk | The trial appeared to be free of other components that could put it at risk of bias. |
| Methods | Randomised clinical trial, China | |
| Participants | 83 hospitalised adults with carcinoma of oesophagus and cardia, at nutritional risk due to gastro‐oesophageal surgery Male:Female = 59:24 Mean age = 55 years Exclusion criteria: Heart, lung, liver, kidney or endocrine diseases | |
| Interventions | Experimental group: Group 2: Based on the conventional treatment, enteral nutrition (homemade homogenate liquid made of: rice, lean meat, egg, carrot, milk powder, sugar, etc.) was started from the 5th ˜ 6th day after the surgery. The treatment course was about 6 to 10 days (average 7 days). The average calorie supply was 3562 KJ. (n = 16) Control group: conventional fluid infusion through peripheral vein from the 1st day after surgery; the liquid volume was about 3000 ml; the calories were about 3562 KJ (n = 37) | |
| Outcomes | Reduced weight/ideal body weight, BMI, morbidity and the times of stool after EN | |
| Study dates | Not stated | |
| Notes | We did not include group 1 as the experimental group received an elemental diet. We found no contact information for the authors. | |
| Risk of bias | ||
| Bias | Authors' judgement | Support for judgement |
| Random sequence generation (selection bias) | Unclear risk | Not described |
| Allocation concealment (selection bias) | Unclear risk | Not described |
| Blinding of participants and personnel (performance bias) | High risk | Participants and personnel were not blinded. |
| Blinding of outcome assessment (detection bias) | Unclear risk | Not described |
| Incomplete outcome data (attrition bias) | Unclear risk | The number of participants with incomplete data was not reported. |
| Selective reporting (reporting bias) | Unclear risk | No protocol could be obtained. |
| For‐profit bias | Unclear risk | It was unclear how the trial was funded. |
| Other bias | Low risk | The trial appeared to be free of other components that could put it at risk of bias. |
| Methods | Randomised clinical trial, China. | |
| Participants | 25 hospitalised adults with advanced gastric cancer and undergoing surgery, at nutrition risk due to having major surgery Male:Female = 13:12 Mean age = 61 years | |
| Interventions | Experimental group: participants received intravenous nutrition through vein catheterisation 5 days before the operation. The amount of nitrogen was 0.15 g/kg/day, and non‐protein calorie 28 kcal/kg/day, added with insuline, potassium chloride and moderate vitamins and microelements. (n = 6) Control group: no intervention (n = 6) Co‐interventions: chemotherapy | |
| Outcomes | Serum pre‐albumin, transferrin, NK and LAK cell viability and FCM analysis | |
| Study dates | Not stated | |
| Notes | We tried but failed to contact the authors by phone. | |
| Risk of bias | ||
| Bias | Authors' judgement | Support for judgement |
| Random sequence generation (selection bias) | Unclear risk | Not described |
| Allocation concealment (selection bias) | Unclear risk | Not described |
| Blinding of participants and personnel (performance bias) | High risk | Participants and personnel were not blinded. |
| Blinding of outcome assessment (detection bias) | Unclear risk | Not described |
| Incomplete outcome data (attrition bias) | Unclear risk | The number of participants with incomplete data was not reported. |
| Selective reporting (reporting bias) | Unclear risk | No protocol could be obtained and the trial did not report on all‐cause mortality or serious adverse events. |
| For‐profit bias | Unclear risk | It was unclear how the trial was funded. |
| Other bias | Low risk | The trial appeared to be free of other components that could put it at risk of bias. |
| Methods | Randomised clinical trial, UK | |
| Participants | 30 hospitalised adults with gastro‐intestinal neoplasms, at nutritional risk due to having lost more than 5 kg of weight over the last 3 months Male:Female = 21:9 Mean age = 65 years | |
| Interventions | Experimental group: Group A) IVN for 3 days (0.18 g N/kg/day as amino acid; 30 kcal/kg/day as glucose)(n = 10) Group B) IVN for 7 days (n = 10) | |
| Outcomes | Plasma proteins, plasma amino acids, liver protein synthesis rate | |
| Study dates | Not stated | |
| Notes | Same trial as Young 1989b with the results from experimental Group (A) vs control. We could obtain no contact information for the authors. | |
| Risk of bias | ||
| Bias | Authors' judgement | Support for judgement |
| Random sequence generation (selection bias) | Unclear risk | Not described |
| Allocation concealment (selection bias) | Unclear risk | Not described |
| Blinding of participants and personnel (performance bias) | Unclear risk | Not described |
| Blinding of outcome assessment (detection bias) | Unclear risk | Not described |
| Incomplete outcome data (attrition bias) | Unclear risk | The number of participants with incomplete data was not reported. |
| Selective reporting (reporting bias) | High risk | No protocol could be obtained and the trial did not report on all‐cause mortality or serious adverse events. |
| For‐profit bias | Unclear risk | It was unclear how the trial was funded. |
| Other bias | Low risk | The trial appeared to be free of other components that could put it at risk of bias. |
| Methods | Randomised clinical trial, UK | |
| Participants | 30 hospitalised adults with gastro‐intestinal neoplasms, at nutritional risk due to having lost more than 5 kg of weight over the last 3 months Male:Female = 21:9 Mean age = 65 years | |
| Interventions | Experimental group: Group A) IVN for 3 days (0.18 g N/kg/day as amino acid; 30 kcal/kg/day as glucose) (n = 10) Group B) IVN for 7 days (n = 10) | |
| Outcomes | Plasma proteins, plasma amino acids, liver protein synthesis rate | |
| Study dates | Not stated | |
| Notes | Same trial as Young 1989a with the results from experimental Group (B) vs control | |
| Risk of bias | ||
| Bias | Authors' judgement | Support for judgement |
| Random sequence generation (selection bias) | Unclear risk | Not described |
| Allocation concealment (selection bias) | Unclear risk | Not described |
| Blinding of participants and personnel (performance bias) | Unclear risk | Not described |
| Blinding of outcome assessment (detection bias) | Unclear risk | Not described |
| Incomplete outcome data (attrition bias) | Unclear risk | The number of participants with incomplete data was not reported. |
| Selective reporting (reporting bias) | Unclear risk | No protocol could be obtained and the trial did not report on all‐cause mortality or serious adverse events. |
| For‐profit bias | Unclear risk | It was unclear how the trial was funded. |
| Other bias | Low risk | The trial appeared to be free of other components that could put it at risk of bias. |
| Methods | Randomised clinical trial, Poland | |
| Participants | 75 hospitalised adults undergoing elective gastric and large intestine cancer surgery, at nutritional risk due to major surgery Male:Female = 38:37 Mean age = 66 years Exclusion: frank diabetes; preoperatively‐diagnosed resistance to insulin; stomach emptying disorders, undernourishment (according to SGA and NRS 2002) | |
| Interventions | Experimental group: Group II: 25 participants who received an “all in one” type of TPN for 5 days prior to surgical procedure. The mixture contained carbohydrates (glucose solutions), lipids (lipid emulsions) and amino acid solutions. Vitamins, 10% NaCl‐20ml, 15% KCl‐10ml, 20% MgSO4‐4ml and microelements were added to the TPN bag. Total energy value was 10 kcal/kg of body weight. (n = 25) Control group: Received no preparations influencing the perioperative insulin resistance level (n = 25) Co‐intervention: They had standard hospital meals for 4 days prior to the surgery. | |
| Outcomes | Insulin resistance level | |
| Study dates | "Between 2008‐2009" | |
| Notes | Same trial as Zareba 2013b but with group I vs II We contacted the authors on 25th September 2015 by email: [email protected]. We received no reply. | |
| Risk of bias | ||
| Bias | Authors' judgement | Support for judgement |
| Random sequence generation (selection bias) | Unclear risk | Not described |
| Allocation concealment (selection bias) | Unclear risk | Not described |
| Blinding of participants and personnel (performance bias) | High risk | Trial was not blinded. |
| Blinding of outcome assessment (detection bias) | High risk | Trial was not blinded |
| Incomplete outcome data (attrition bias) | Unclear risk | The number of participants with incomplete data was not reported. |
| Selective reporting (reporting bias) | Unclear risk | No protocol could be obtained and the trial did not report on all‐cause mortality or serious adverse events. |
| For‐profit bias | Unclear risk | It was unclear how the trial was funded. |
| Other bias | Low risk | The trial appeared to be free of other components that could put it at risk of bias. |
| Methods | Randomised clinical trial, Poland | |
| Participants | 75 hospitalised adults undergoing elective gastric and large intestine cancer surgery, at nutritional risk due to major surgery Male:Female = 38:37 Mean age = 66 years Exclusion: frank diabetes; preoperatively‐diagnosed resistance to insulin; stomach emptying disorders, undernourishment (according to SGA and NRS 2002) | |
| Interventions | Experimental group: Group III: 25 participants who received standard hospital diet and TPN (with the same ingredients and energy value as in group II), as well as prior to the surgery; oral preoperative preparation. The evening before the surgery, the participants were given 800 ml of the preparation and 400 ml again on the actual day of the surgery (but no later than 2 hours prior to the start of surgery) (n = 25) Control group: Received no preparations influencing the perioperative insulin resistance level (n = 25) Co‐intervention: They had standard hospital meals for 4 days prior to the surgery. | |
| Outcomes | Insulin resistance level | |
| Study dates | "Between 2008‐2009" | |
| Notes | Same trial as Zareba 2013a but with group I vs III. We contacted the authors on 25th September 2015 by email: [email protected]. We received no reply. | |
| Risk of bias | ||
| Bias | Authors' judgement | Support for judgement |
| Random sequence generation (selection bias) | Unclear risk | Not described |
| Allocation concealment (selection bias) | Unclear risk | Not described |
| Blinding of participants and personnel (performance bias) | High risk | Trial was not blinded. |
| Blinding of outcome assessment (detection bias) | High risk | Trial was not blinded. |
| Incomplete outcome data (attrition bias) | Unclear risk | The number of participants with incomplete data was not reported. |
| Selective reporting (reporting bias) | Unclear risk | No protocol could be obtained and the trial did not report all‐cause mortality or serious adverse events. |
| For‐profit bias | Unclear risk | It was unclear how the trial was funded. |
| Other bias | Low risk | The trial appeared to be free of other components that could put it at risk of bias. |
| Methods | Randomised clinical trial, UK | |
| Participants | 30 hospitalised adults undergoing elective resection of a gastrointestinal cancer who had lost more than 5 kg in weight over the previous 3 months, at nutritional risk due to a weight loss of 5% during the last 3 months Male:Female = 21:9 Mean age = 69 years Exclusion criteria: weight loss of < 5 kg in the 3 months prior to admission or uncertainty about change in body weight | |
| Interventions | Experimental group 1: Intravenous nutrition for 3 days before operation. The feeding regimen consisted of glucose infused at a rate of 126 kJ/kg body weight/day and amino acids (FreAmine III, Boots Co. plc, Nottingham, UK) infused at 0.18 g nitrogen/kg/24 hrs (1 g protein/kg/day). In addition, 10 ml of multivitamin solution (Multibionta, E. Merck, Hampshire, UK) and 5 ml of trace element solution (Pharmacy Department, Leeds General Infirmary) were infused daily. Electrolytes were provided as required, according to daily measurements of the plasma concentrations. In order to replete essential fatty acids, and in keeping with the standard hospital regimen, fat emulsion (500 ml of 20% ‘Intralipid’, KabiVitrum, Ealing, UK) was given on the 1st day only, with an equicaloric reduction in the amount of glucose provided. (n = 10) Co‐interventions: Hospital diet (HD group): free access to routine diet for 7 days before operation | |
| Outcomes | Weight, height, mid‐arm circumference and hand‐grip strength. Skin‐fold thickness was measured at 3 sites (biceps, triceps and subcapsular). Haematological and immunological variables. Biochemical determinations. Preoperative determination of protein synthetic rate in vitro | |
| Study dates | Not stated | |
| Notes | Same as Zeiderman 1989a, comparing experimental group 1 and control group. We could obtain no contact information for the authors. | |
| Risk of bias | ||
| Bias | Authors' judgement | Support for judgement |
| Random sequence generation (selection bias) | Unclear risk | Not described |
| Allocation concealment (selection bias) | Unclear risk | Not described |
| Blinding of participants and personnel (performance bias) | Unclear risk | Not described |
| Blinding of outcome assessment (detection bias) | Unclear risk | Not described |
| Incomplete outcome data (attrition bias) | Unclear risk | The number of participants with incomplete data was not reported. |
| Selective reporting (reporting bias) | Unclear risk | No protocol could be obtained and the trial did not report on all‐cause mortality or serious adverse events. |
| For‐profit bias | High risk | The trial was supported by Boots Company PLC. |
| Other bias | Low risk | The trial appeared to be free of other components that could put it at risk of bias. |
| Methods | Randomised clinical trial, UK | |
| Participants | 30 hospitalised adults undergoing elective resection of a gastrointestinal cancer who had lost more than 5 kg in weight over the previous 3 months, at nutritional risk due to a weight loss of 5% during the last 3 month. Mean age = 69 years Exclusion criteria: Weight loss of < 5 kg in the 3 months prior to admission or uncertainty about change in body weight | |
| Interventions | Experimental group 2: Intravenous nutrition for 7 days before operation. The feeding regimen consisted of glucose infused at a rate of 126 kJ/kg body weight/day and amino acids (FreAmine III, Boots Co. plc, Nottingham, UK) infused at 0.18 g nitrogen/kg/24 hrs (1 g protein/kg/day). In addition, 10 ml of multivitamin solution (Multibionta, E. Merck, Hampshire, UK) and 5 ml of trace element solution (Pharmacy Department, Leeds General Infirmary) were infused daily. Electrolytes were provided as required, according to daily measurements of the plasma concentrations. In order to replete essential fatty acids, and in keeping with the standard hospital regimen, fat emulsion (500 ml of 20% ‘Intralipid’, KabiVitrum, Ealing, UK) was given on the 1st day only, with an equicaloric reduction in the amount of glucose provided. (n = 10) Co‐interventions: Hospital diet (HD group): free access to routine diet for 7 days before operation | |
| Outcomes | Weight, height, mid‐arm circumference and hand‐grip strength. Skin‐fold thickness was measured at 3 sites (biceps, triceps and subcapsular). Haematological and immunological variables. Biochemical determinations. Preoperative determination of protein synthetic rate in vitro | |
| Study dates | Not stated | |
| Notes | Same as Ziederman 1989a, comparing experimental group 2 and control group | |
| Risk of bias | ||
| Bias | Authors' judgement | Support for judgement |
| Random sequence generation (selection bias) | Unclear risk | Not described |
| Allocation concealment (selection bias) | Unclear risk | Not described |
| Blinding of participants and personnel (performance bias) | Unclear risk | Not described |
| Blinding of outcome assessment (detection bias) | Unclear risk | Not described |
| Incomplete outcome data (attrition bias) | Unclear risk | The number of participants with incomplete data was not reported. |
| Selective reporting (reporting bias) | Unclear risk | No protocol could be obtained and the trial did not report on all‐cause mortality or serious adverse events. |
| For‐profit bias | High risk | The trial was supported by Boots Company PLC. |
| Other bias | Low risk | The trial appeared to be free of other components that could put it at risk of bias. |
| Methods | Randomised clinical trial, Croatia | |
| Participants | 40 hospitalised adults with colon, upper rectal or rectosigmoid cancer undergoing surgery, at nutritional risk due to major abdominal surgery Male:Female = 24:16 Mean age = 69 years Exclusion criteria: Previous operations, metastatic disease, diabetes mellitus, BMI > 30, ASA grade III ‐ IV, conditions that might impair gastrointestinal motility, gastro‐oesophageal reflux, potential difficulty with airway management | |
| Interventions | Experimental group: Carbohydrate‐rich beverage (12.5 g/100 mL carbohydrate, 12% monosaccharide, 12% disaccharides, 76% polysaccharides, 285 mosmol/k;Nutricia Preop; Numico, Zoetermeer, Netherlands) ingested 800 mL the evening before surgery and 400 mL 2 hours before surgery(n = 20) | |
| Outcomes | IL‐10, IL‐6, morbidity | |
| Study dates | ||
| Notes | We contacted the authors on 14th October 2015 by email: [email protected]. We received no reply. | |
| Risk of bias | ||
| Bias | Authors' judgement | Support for judgement |
| Random sequence generation (selection bias) | Unclear risk | The trial was described as being randomised but only stated that it used the "closed envelope technique". |
| Allocation concealment (selection bias) | Unclear risk | The trial was described as being randomised but only stated it used the "closed envelope technique". |
| Blinding of participants and personnel (performance bias) | High risk | The trial stated it was blinded but "the investigator was informed of the allocation, being responsible for the preoperative information of the participants". |
| Blinding of outcome assessment (detection bias) | Low risk | The trial gave the impression that the outcome assessors were blinded. |
| Incomplete outcome data (attrition bias) | Unclear risk | The number of participants with incomplete data was not reported. |
| Selective reporting (reporting bias) | Unclear risk | There was no protocol and the trial did not report all‐cause mortality or serious adverse events. |
| For‐profit bias | Unclear risk | It was unclear how the trial was funded. |
| Other bias | Low risk | The trial appeared to be free of other components that could put it at risk of bias. |
| Methods | Randomised clinical trial, China | |
| Participants | 100 hospitalised adults with viral hepatitis, and alcoholic liver disease, at nutritional risk according to the trialist. Male:Female = 80:20 Mean age = 49 years Exclusion criteria: Upper gastro‐intestinal haemorrhage within 2 weeks before admission, uncontrolled diabetes, malignant tumour, clinical manifestations of hepatic encephalopathy, clear infection, antiviral indications of hepatitis B cirrhosis in the prevention and treatment guidelines of chronic hepatitis (2010 version), but did not want to or could not receive nucleoside analogue antiviral treatment | |
| Interventions | Experimental group: Enteral nutrition: Weekly recipes were prepared with 35 ˜ 40 kcal/(kg/day) , 1.2 ˜ 1.5 g/(kg/day) protein, 0.8 ˜ 1.2 g/(kg/day) amino acid and 350 ˜ 500 g/day carbohydrate. Additionally supplemented vitamins A, D, e, K, B and Se, were included on the 4th day in the daily meals. They were given yoghurt (or hot milk) of 100 ml and 15 g Noveliver compound protein granule (purchased from the Global Partner of Institute for Liver Cell Media, Myer Otec Co. California USA, which contained 18 kinds of amino acids including all essential amino acids, and folic acid, selenium, etc.) at bedtime. Nutrition intervention lasted for 4 weeks.(n = 50) Control group: Conventional diet(n = 50) Co‐interventions: Protecting liver therapy and antiviral therapy | |
| Outcomes | Triceps skin fold, BMI, mid‐arm circumference, mid‐arm muscle circumference, self‐conscious symptoms, growth and decline of ascites, Albumin, pre‐albumin, cholinesterase, transaminase and bilirubin, blood coagulation index, HBV DNA and complications | |
| Study dates | Not stated | |
| Notes | We contacted the author by phone and received information on mortality, follow‐up length, and funding. | |
| Risk of bias | ||
| Bias | Authors' judgement | Support for judgement |
| Random sequence generation (selection bias) | Unclear risk | The author told us that he could not remember the specific method of randomisation. |
| Allocation concealment (selection bias) | Unclear risk | Not described |
| Blinding of participants and personnel (performance bias) | High risk | Participants and personnel were not blinded. |
| Blinding of outcome assessment (detection bias) | Unclear risk | Not described |
| Incomplete outcome data (attrition bias) | Unclear risk | The number of participants with incomplete data was not reported. |
| Selective reporting (reporting bias) | Unclear risk | No protocol could be obtained and the trial did not report on all‐cause mortality or serious adverse events. |
| For‐profit bias | Low risk | The trial was funded by Major special projects of science and technology bureau of Changchun (10SF05). |
| Other bias | Low risk | The trial appeared to be free of other components that could put it at risk of bias. |
| Methods | Randomised clinical trial, China | |
| Participants | 64 hospitalised adults with acute non‐lymphocytic leukaemia, at nutritional risk according to trialist indication Male:Female = not stated Mean age = 32.8 years Exclusion criteria: acute disease exacerbation; chronic diseases such as concomitant with diabetes, hypertension, liver and kidney dysfunction; concomitant with serious allergy and other immune system diseases; pregnant or lactating; within 6 months after surgery; end‐stage leukaemia | |
| Interventions | Experimental group: Standard nutrition support provided to the participants with established nutrition risk (NRS‐2002 ≥ 3) during the next chemotherapy course. The participants should have high protein and high energy intake 3 days before and 1 week after chemotherapy, which was achieved with oral Enteral Nutritional Powder (TP) 40 g. Control group: Standard hospital diet(n = 32) | |
| Outcomes | Prealbumin, haemoglobin, red blood cell, albumin, total protein, BMI | |
| Study dates | Not stated | |
| Notes | We had trouble understanding the language in this trial, hence limited descriptions. We contacted the authors on 25th September 2015 by email: [email protected]. We received no reply. | |
| Risk of bias | ||
| Bias | Authors' judgement | Support for judgement |
| Random sequence generation (selection bias) | Unclear risk | Not described |
| Allocation concealment (selection bias) | Unclear risk | Not described |
| Blinding of participants and personnel (performance bias) | Unclear risk | Not described |
| Blinding of outcome assessment (detection bias) | Unclear risk | Not described |
| Incomplete outcome data (attrition bias) | Unclear risk | The number of participants with incomplete data was not reported. |
| Selective reporting (reporting bias) | Unclear risk | No protocol could be obtained and the trial did not report all‐cause mortality or serious adverse events. |
| For‐profit bias | Low risk | Trial was supported by the Creative Foundation of Navy General Hospital (CX201113). |
| Other bias | Low risk | The trial appeared to be free of other components that could put it at risk of bias. |
| Methods | Randomised clinical trial, China | |
| Participants | 135 hospitalised adults with chronic damage in hepatic function receiving surgical treatment, at nutritional risk according to trialist classification. Male:Female = not reported Mean age = unknown Exclusion criteria: No other diease except the primary disease affecting the metabolism | |
| Interventions | Experimental group: In the EN group, Nutrison Fibre was selected. After the participants had received PN for 2 days EN was started on the 3rd day post‐operatively through the jejunostomy tube. 1st day was given 500 mL Nutrison fibre. If there was no malaise, 500 mL dose would be increased each day until the volume of 1500 mL/day was reached, while the PN was decreased until it was substituted by EN. This dose was given for at least 7 days. (n = 30)(n = 10) | |
| Outcomes | Lactulose/mannitol ratio, weight, circumference of upper arm, liver function, kidney function and electrolyte markers | |
| Study dates | Not stated | |
| Notes | Same trial as Zheng 2001b but with the enteral group. We could obtain no contact information for the authors. | |
| Risk of bias | ||
| Bias | Authors' judgement | Support for judgement |
| Random sequence generation (selection bias) | Unclear risk | Not described |
| Allocation concealment (selection bias) | Unclear risk | Not described |
| Blinding of participants and personnel (performance bias) | Unclear risk | Not described |
| Blinding of outcome assessment (detection bias) | Unclear risk | Not described |
| Incomplete outcome data (attrition bias) | Low risk | There was only 1 dropout. |
| Selective reporting (reporting bias) | Unclear risk | No protocol could be obtained and the trial did not report all‐cause mortality or serious adverse events. |
| For‐profit bias | Unclear risk | It was unclear how the trial was funded. |
| Other bias | Low risk | The trial appeared to be free of other components that could put it at risk of bias. |
| Methods | Randomised clinical trial, China | |
| Participants | 76 hospitalised adults with chronic damage in hepatic function receiving surgical treatment, at nutritional risk according to trialist classification Male:female = Mean age = unknown | |
| Interventions | Experimental group: In the PN group the participants received 30 kcal/kg/day and 0.16 g N/kg/day. 25 ‐ 33% of nonprotein calories were fat and the remainder was given as carbohydrates. The solution was given through a peripheral vein from day 1 until at least day 7 (n = 26). Control group: No nutritional support(n = 10) | |
| Outcomes | Lactulose/mannitol ratio, weight, circumference of upper arm, liver function, kidney function and electrolyte markers | |
| Study dates | Not stated | |
| Notes | Same trial as Zheng 2001a but with the parenteral group | |
| Risk of bias | ||
| Bias | Authors' judgement | Support for judgement |
| Random sequence generation (selection bias) | Unclear risk | Not described |
| Allocation concealment (selection bias) | Unclear risk | Not described |
| Blinding of participants and personnel (performance bias) | Unclear risk | Not described |
| Blinding of outcome assessment (detection bias) | Unclear risk | Not described |
| Incomplete outcome data (attrition bias) | Low risk | There was only 1 dropout. |
| Selective reporting (reporting bias) | Unclear risk | No protocol could be obtained and the trial did not report all‐cause mortality or serious adverse events. |
| For‐profit bias | Unclear risk | It was unclear how the trial was funded. |
| Other bias | Low risk | The trial appeared to be free of other components that could put it at risk of bias. |
| Methods | Randomised clinical trial, China | |
| Participants | 146 hospitalised adult with acute stroke, at nutritional risk according to the trialist Male:Female = 85:61 Mean age = 71.6 years Exclusion criteria: Transient ischaemic attack, subarachnoid haemorrhage, severe endocrine or metabolic disorders, hematological disorders, malignancies, chronic lung and heart dysfunction, severe liver or kidney failure, stress ulcer of the digestive system, those who died within a week of admission, and received thrombolytic therapy | |
| Interventions | Experimental group: Nutrison fibre (Nutricia; Groupe Danone, Paris France), Swiss High (RAE; 4.18– 6.27 kJ/ml), or a solution with high nutrition content made by nutritionists in the hospital and based on condition, body weight, and nutritional status. Energy requirements were in the range of 83.68 – 125.52 kJ/kg/day (1 kcalth = 4.184 kJ). These solutions were infused by gravity under the supervision of nurses with a starting speed of 40 – 60 ml/hr. If there were no adverse events such as reflux, diarrhoea or flatulence the speed was adjusted to 100 – 125 ml/hr. The total volume for the 1st day was 500 ml followed by an increase of 500 ml/day until the requirement was met. (n = 75) Control group: Regular food from their families which consisted of milk, soy milk, juice, vegetable juice, broth, congee and eggs(n = 71) Co‐interventions: Similar pharmacological treatment and those who were confirmed to have dysphagia were supported with nasogastric nutrition within 72 hrs of admission, which lasted at least 10 days | |
| Outcomes | Nutritional status and rate of malnutrition, nosocomial infection, mortality, and neurological evaluation | |
| Study dates | Not stated | |
| Notes | We contacted authors on 8th February 2016 by email: [email protected]. We received no reply. | |
| Risk of bias | ||
| Bias | Authors' judgement | Support for judgement |
| Random sequence generation (selection bias) | Unclear risk | Not described |
| Allocation concealment (selection bias) | Unclear risk | Not described |
| Blinding of participants and personnel (performance bias) | Unclear risk | Not described |
| Blinding of outcome assessment (detection bias) | Low risk | The doctors performing measurements were blinded to the intervention. |
| Incomplete outcome data (attrition bias) | Low risk | There were no dropouts. |
| Selective reporting (reporting bias) | Unclear risk | No protocol could be obtained, and the trial did not report serious adverse events. |
| For‐profit bias | Unclear risk | It was unclear how the trial was funded. |
| Other bias | Low risk | The trial appeared to be free of other components that could put it at risk of bias. |
| Methods | Randomised clinical trial, China | |
| Participants | 25 hospitalised adults with hepatobiliary cancer operation, at nutritional risk due to having major surgery Male:Female = 10:15 Mean age = 65 years | |
| Interventions | Experimental group: Parenteral nutrition. Participants received infusion of nutrient solution (non‐protein calorie 20 ‐ 25 Kcal/kg/day, nitrogen 0.1 ‐ 0.15 g/kg/day) and appropriate insulin and vitamin supplements from the 1st day of operation for 7 days. (n = 13) Control group: Conventional liquid infusion with non‐protein calorie < 10 kcal/kg/day for 7 days after operation, and liquid or semi‐liquid diets since the 4th day after operation (n = 12) | |
| Outcomes | Nitrogen‐related index (urinary urea nitrogen, nitrogen balance), nutrition and biochemistry index. | |
| Study dates | Not stated | |
| Notes | We tried but failed to contact the authors by phone. | |
| Risk of bias | ||
| Bias | Authors' judgement | Support for judgement |
| Random sequence generation (selection bias) | Unclear risk | Not described |
| Allocation concealment (selection bias) | Unclear risk | Not described |
| Blinding of participants and personnel (performance bias) | Unclear risk | Not described |
| Blinding of outcome assessment (detection bias) | Unclear risk | Not described |
| Incomplete outcome data (attrition bias) | Unclear risk | The number of participants with incomplete data was not reported. |
| Selective reporting (reporting bias) | Unclear risk | No protocol could be obtained and the trial did not report on all‐cause mortality or serious adverse events. |
| For‐profit bias | Unclear risk | It was unclear how the trial was funded. |
| Other bias | Low risk | The trial appeared to be free of other components that could put it at risk of bias. |
| Methods | Randomised clinical trial, China | |
| Participants | 42 hospitalised adults admitted for colon/rectum cancer operation, at nutritional risk due to major surgery Male:Female = 28:14 Mean age = 67 years Exclusion criteria: without obvious ileus, severe heart, lung or kidney disease | |
| Interventions | Experimental group: Enteral nutrition support, consisted of 1500 ‐ 2000 ml/day Nutrison Fibre, for 3 days before until 16 hrs before the surgery (n = 21) Control group: Oral nutrition support, consisted of semi‐liquid diets, liquid diets, fasting and liquid infusion, for 3 days before the operation until the morning of the surgery (n = 21) | |
| Outcomes | Side effects, times of intestinal lavage, nutritional parameters including weight. | |
| Study dates | Not stated | |
| Notes | We tried but failed to contact the authors by phone and email: [email protected]. | |
| Risk of bias | ||
| Bias | Authors' judgement | Support for judgement |
| Random sequence generation (selection bias) | Unclear risk | Not described |
| Allocation concealment (selection bias) | Unclear risk | Not described |
| Blinding of participants and personnel (performance bias) | High risk | Participants and personnel were not blinded. |
| Blinding of outcome assessment (detection bias) | Unclear risk | Not described |
| Incomplete outcome data (attrition bias) | Unclear risk | The number of participants with incomplete data was not reported. |
| Selective reporting (reporting bias) | Unclear risk | No protocol could be obtained and the trial did not report on all‐cause mortality or serious adverse event. |
| For‐profit bias | Unclear risk | It was unclear how the trial was funded. |
| Other bias | Low risk | The trial appeared to be free of other components that could put it at risk of bias. |
| Methods | Randomised clinical trial, China | |
| Participants | 120 hospitalised adults with severe cerebrovascular disease, at nutritional risk due to stroke Male:Female = 67:53 Mean age = 59.1 years Exclusion criteria: no metabolic and endocrine disorders before onset, no organic disease of important organs | |
| Interventions | Experimental group: Early enteral nutrition. Adopted perfusion of nutrient solution from low concentration and low speed, and gradually accelerated dosage to the full amount. On the 1st day the perfusion was about 20 ml/hr, and it was increased by 20 ml/hr each day, until the maximum speed of 125 ml/hr (the nutrient solution temperature should be moderate). The treatment duration was unclear. (n = 60) Control group: Conventional nutrition according to physical circumstances, and given enteral nutrition after 72 hrs(n = 60) | |
| Outcomes | Dietary intakes, defaecation volume, cure condition, mortality, morbidity and sequellae | |
| Study dates | Not stated | |
| Notes | We contacted the authors by phone. The authors did not know when they would have time to provide information. | |
| Risk of bias | ||
| Bias | Authors' judgement | Support for judgement |
| Random sequence generation (selection bias) | Unclear risk | Not described |
| Allocation concealment (selection bias) | Unclear risk | Not described |
| Blinding of participants and personnel (performance bias) | High risk | Participantsand personnel were not blinded. |
| Blinding of outcome assessment (detection bias) | Unclear risk | Not described |
| Incomplete outcome data (attrition bias) | Unclear risk | The number of participants with incomplete data was not reported. |
| Selective reporting (reporting bias) | Unclear risk | No protocol could be obtained. |
| For‐profit bias | Unclear risk | It was unclear how the trial was funded. |
| Other bias | Low risk | The trial appeared to be free of other components that could put it at risk of bias. |
| Methods | Randomised clinical trial, China | |
| Participants | 98 hospitalised adults undergoing gastric operation, at nutritional risk due to having major surgery Male:Female = 60:38 Mean age = 47.8 years | |
| Interventions | Experimental group: Enteral nutrition support. On the 1st day a half‐dose, 66.9 Kj/kg/day, dripping speed of 60 ‐ 100 ml/hr; increased on the 2nd day up to full dose, dripping speed of 120 ‐ 150 ml/hr through nasal‐jejunum tube for 7 days.(n = 48) Control group: Conventional infusion of 2494.4 Kj/day and without protein for 7 days after operation (n = 50) | |
| Outcomes | Serum cytokine levels (IL‐2, IFN‐γ, IL‐2Rα, sIL‐2R) | |
| Study dates | Not stated | |
| Notes | We tried but failed to contact the authors were att by phone. | |
| Risk of bias | ||
| Bias | Authors' judgement | Support for judgement |
| Random sequence generation (selection bias) | Unclear risk | Not described |
| Allocation concealment (selection bias) | Unclear risk | Not described |
| Blinding of participants and personnel (performance bias) | High risk | Not mentioned, but the trial compared fluid infusion with enteral nutrition, which can be judged as high risk of bias |
| Blinding of outcome assessment (detection bias) | Unclear risk | Not described |
| Incomplete outcome data (attrition bias) | Unclear risk | The numbers and reasons for withdrawals and dropouts were not clearly stated or not stated at all. |
| Selective reporting (reporting bias) | Unclear risk | There is no protocol and the outcomes all‐cause mortality and serious adverse events are not reported on. |
| For‐profit bias | Unclear risk | It was unclear how the trial was funded. |
| Other bias | Low risk | The trial appeared to be free of other components that could put it at risk of bias. |
| Methods | Randomised clinical trial, China | |
| Participants | 42 hospitalised adults undergoing gastric operation, at nutritional risk due to major surgery Male:Female = 29:13 Mean age = 58.6 years Exclusion criteria: Metabolic and endocrine diseases, abnormal liver or kidney function | |
| Interventions | Experimental group: Enteral nutrition support. The amount of calories was 125.5 kJ (30 kcal)/(kg/day), and nitrogen was 0.2 g/(kg/day). It was given through a nasal‐duodenal tube for 7 days (half‐dose for the first 2 days).The nutrition was provided by Nutrition Fiber (protein 20 g, fat 19.5 g,carbohydrate 61.5 g, minerals 3 g, food fibre 7.5 g, energy 4.18 Kj(1 kcal)/ml per 500ml).(n = 24) Control group: Conventional infusion which consisted of 5% ‐ 10% glucose, electrolytes, and vitamins, about 2500 kJ (600 kcal)/day, without exogenous nitrogen (n = 18) | |
| Outcomes | All‐cause mortality, severe complications, adverse events, nutritive index including body weight, biochemical index, immune index (IgA, IgM, IgG,lymphocyte). | |
| Study dates | Not stated | |
| Notes | The authors were attempted contacted by phone. No contact was made. | |
| Risk of bias | ||
| Bias | Authors' judgement | Support for judgement |
| Random sequence generation (selection bias) | Unclear risk | Not described |
| Allocation concealment (selection bias) | Unclear risk | Not described |
| Blinding of participants and personnel (performance bias) | High risk | Participants and personnel were not blinded. |
| Blinding of outcome assessment (detection bias) | Unclear risk | Not described |
| Incomplete outcome data (attrition bias) | Unclear risk | The number of participants with incomplete data was not reported. |
| Selective reporting (reporting bias) | Low risk | No protocol could be obtained but the trial did report on all‐cause mortality and serious adverse event. |
| For‐profit bias | Unclear risk | It was unclear how the trial was funded. |
| Other bias | Low risk | The trial appeared to be free of other components that could put it at risk of bias. |
| Methods | Randomised clinical trial, China | |
| Participants | 97 hospitalised adults admitted with stroke, at nutritional risk due to stroke Male:Female = 56:41 Mean age = 72 years Exclusion criteria: None | |
| Interventions | Experimental group 1: Received both enteral and parenteral supplements.The energy was 84 ‐ 105 kj/kg/day, and increased to the target volume 126 ‐ 147 kj/kg/day, based on participant's recovery condition. Whole protein supplements (6.3 kJ/ml) were given through nasogastric tube, and the sugar, fat and protein were provided through vein tube.(n = 33) Experimental group 2: Received only enteral supplements. The energy was 84 ‐ 105 kj/kg/day, and increased to the target volume 126 ‐ 147 kj/kg/day based on participant's recovery condition. All the nutrition was provided through the nasogastric tube. (n = 32) Control group: The nutrition (6.3 kJ/ml)was given through nasogastric tube under the control of a specialist nurse(n = 32) | |
| Outcomes | Triceps skinfold thickness, arm muscle circumference, haemoglobin, albumin, prealbumin, triglyceride, incidence rate of malnutrition; infection rate, mortality, NIHSS, Barthel Index | |
| Study dates | Not stated | |
| Notes | Same as Zhu 2012b, but with experimental group 1 vs control group. We found no contact information for the authors. | |
| Risk of bias | ||
| Bias | Authors' judgement | Support for judgement |
| Random sequence generation (selection bias) | Low risk | Not described |
| Allocation concealment (selection bias) | Unclear risk | Not described |
| Blinding of participants and personnel (performance bias) | High risk | The participants and personnel were not blinded. |
| Blinding of outcome assessment (detection bias) | Unclear risk | Not described |
| Incomplete outcome data (attrition bias) | Unclear risk | The number of participants with incomplete data was not reported. |
| Selective reporting (reporting bias) | Low risk | No protocol could be obtained but the trial did report on all‐cause mortality and serious adverse events. |
| For‐profit bias | Unclear risk | It was unclear how the trial was funded. |
| Other bias | Low risk | The trial appeared to be free of other components that could put it at risk of bias. |
| Methods | Randomised clinical trial, China | |
| Participants | 97 hospitalised adults admitted with stroke, at nutritional risk due to stroke Male:Female = 56:41 Mean age = 73 years Exclusion criteria: None | |
| Interventions | Experimental group 1: Received both enteral and parenteral supplements.The energy was 84 ‐ 105 kj/kg/day, and increased to the target volume 126 ‐ 147 kj/kg/day based on participant's recovery condition. Whole protein supplements (6.3 kJ/ml) were given through nasogastric tube, and the sugar, fat and protein were provided through vein tube.(n = 33) Experimental group 2: Received only enteral supplements. The energy was 84 ‐ 105 kj/kg/day, and increased to the target volume 126 ‐ 147 kj/kg/day based on participant's recovery condition. All the nutrition was provided through the nasogastric tube.(n = 32) Control group: The nutrition (6.3 kJ/ml) was given through nasogastric tube under the control of a specialist nurse.(n = 32) | |
| Outcomes | Triceps skinfold thickness, arm muscle circumference, haemoglobin, albumin, prealbumin, triglyceride, incidence rate of malnutrition;,infection rate, mortality, NIHSS, Barthel Index | |
| Study dates | ||
| Notes | Same as Zhu 2012a, but with experimental group 2 vs control group | |
| Risk of bias | ||
| Bias | Authors' judgement | Support for judgement |
| Random sequence generation (selection bias) | Low risk | Not described |
| Allocation concealment (selection bias) | Unclear risk | Not described |
| Blinding of participants and personnel (performance bias) | High risk | The participants and personnel were not blinded. |
| Blinding of outcome assessment (detection bias) | Unclear risk | Not described |
| Incomplete outcome data (attrition bias) | Unclear risk | The number of participants with incomplete data was not reported. |
| Selective reporting (reporting bias) | Low risk | No protocol could be obtained but the trial did report on all‐cause mortality and serious adverse events. |
| For‐profit bias | Unclear risk | It was unclear how the trial was funded. |
| Other bias | Low risk | The trial appeared to be free of other components that could put it at risk of bias. |
6‐MWD: 6‐minute walking distance
ABG: arterial blood gas
AD: Alhzeimer's disease
ADL: activities of daily living
AKP: alkaline phosphatase
ASCI(U): Acute Spinal Cord Injury (Unit)
BEE: basal energy expenditure
BMI: body mass index
BUN: blood urea nitrogen
CABG: coronary artery bypass graft
COPD: chronic obstructive pulmonary disease
CRP: C‐reactive protein
ECOG: Eastern Co‐operative Oncology Scale
EN: enteral nutrition
ESR: erythrocyte sedimentation rate
FCM: flow cytometry
FEV: forced expiratory volume
FIM: functional independence measure
FVC: forced volume capacity
GCS: Glasgow coma scale
GPT: glutamate pyruvate transaminase
IBW: ideal body weight
ICU: intensive care unit
i.v.: intravenous
IVH: intrravenous hyperalimentation
IVN: intravenous nutrition
KPS: Karnofsky performance score
MMSE: Mini metal state examination
MNA: mini nutritional assessment
MUST: Malnutrition Universal Screening Tool
NEFA: non‐essential fatty acids
NIHSS: NIH stroke scale
NRS: Nutritional Risk Screening
NSAID: non‐steroidal anti‐inflammatory drug
NYHA: New York Heart Association
ONS: oral nutrition supplement
PEG: percutaneous endoscopic gastrotomy
PN: parenteral nutrition
QALYs: quality‐adjusted life years
QoL: quality of life
REE: resting energy expenditure
RQ: respiratory quotient
SD: standard deviation
SFAA: serum‐free amino acid
SGOT: serum glutamic oxaloacetic transaminase
SGPT: serum glutamate pyruvate transaminase
SIRS: sepsis inflammatory response syndrome
SPN: supplementary parenteral nutrition
TBSA: total body surface area
TPN: total parenteral nutrition
WBC: white blood cell
Characteristics of excluded studies [ordered by study ID]
| Study | Reason for exclusion |
| Wrong control group (enteral feeding) | |
| Wrong control (all 3 groups received total parenteral nutrition) | |
| Multi‐intervention (experimental group received cortisol and heparin in addition to their nutrition intervention) | |
| Wrong intervention group (the intervention group did not receive nutritional support (early oral feeding)) | |
| Not randomised | |
| Not adults | |
| Wrong intervention group (The intervention is preoperative glutamine supplement) | |
| Wrong intervention group (glutamine supplementation as primary intervention) | |
| Wrong control group (control group not described as standard care) | |
| Outpatients | |
| Outpatients | |
| Outpatients | |
| Not at nutritional risk (after correspondence with author) | |
| Wrong control group (control group did not receive standard care) | |
| Not randomised (the study was an observational study) | |
| Wrong control group (both the intervention and control group received oral nutrition support) | |
| Wrong control group (control group not described as standard care) | |
| Not randomised (clinical case study) | |
| Not randomised | |
| Not randomised | |
| Wrong control group (control group receives parenteral nutrition) | |
| Protocol to the trial Bakker 2014 | |
| Participants were pregnant (elective C‐section) | |
| Not at nutritional risk (undergoing elective laparoscopic surgery and the trialist does not describe participants as at nutritional risk) | |
| Not randomised | |
| Wrong intervention group (experimental group received both reduced portion size and fortifications) | |
| Wrong control group (the trial compared two different enteral feedings (trophic food)) | |
| Wrong intervention group (immunonutrition) | |
| Wrong intervention group (both the experimental group and control group received an isocaloric supplement. Not nutritional support) | |
| Wrong intervention group (both the experimental group and control group received an isocaloric supplement. Not nutritional support) | |
| Not randomised (the control group were not randomised) | |
| Outpatients | |
| Wrong control group (control group received enteral nutrition as standard care) | |
| Wrong intervention (experimental group received early oral feeding) | |
| Wrong intervention group (the experimental group received early oral feeding) | |
| Wrong control group (there was no control group in this trial); not described as randomised | |
| Wrong control group (control group was not described as standard care) | |
| Participants were younger than 18 years old | |
| Not randomised | |
| Not randomised | |
| Wrong control group (both groups receives parenteral nutrition) | |
| Cluster‐randomised trial | |
| Wrong control group (control group received parenteral nutrition) | |
| Wrong control group (control group received parenteral nutrition) | |
| Not randomised | |
| The control group receives hypocaloric PN | |
| Wrong intervention (experimental group received diet enriched with arginine, omega‐3 fatty acid and RNA) | |
| Wrong control group (control group receives enteral or parenteral nutrition as part of standard care) | |
| Cluster‐randomised trial | |
| Wrong intervention group (the experimental group received immunonutrition) | |
| Not randomised | |
| Outpatients | |
| Protocol. The finished review could not be obtained, and may never have been conducted | |
| Wrong control group | |
| Wrong control group (the comparison of the study is EN (dietary fibre + glucose + protein) versus EN (glucose + protein)) | |
| Wrong control group (the comparison of the study is EN versus PN) | |
| Wrong control group (the control group received an intervention the experimental group did not (milk)) | |
| Outpatients (participants were with cancer and having chemotherapy) | |
| Not randomised | |
| Wrong intervention group (not nutritional support) | |
| Wrong intervention group (early oral feeding) | |
| Not at nutritional risk (meeting abstract). Authors could not be found for further information. | |
| Wrong control group (the comparison of the study is early EN versus PN) | |
| Wrong control group (the comparison of the study is EN versus PN) | |
| Wrong control group (the comparison of the study is EN versus PN) | |
| Not a randomised clinical trial, and the comparison is EN versus PN | |
| Not randomised | |
| Not a randomised trial | |
| The study said it had randomised participants according to the "case‐control method". We could not be sure it was a randomised clinical trial. | |
| Not randomised | |
| Wrong intervention group (the experimental group received early oral feeding (not nutritional support)) | |
| Outpatients | |
| Not a randomised clinical trial | |
| Not a randomised clinical trial | |
| Wrong control group (EN (nasogastric tube) vs EN ((nasogastric tube) + PN (venous)) vs + PN (venous)) | |
| Wrong intervention group (the experimental group received early oral feeding (not nutritional support)) | |
| Not randomised | |
| Not randomised clinical trial | |
| Wrong control group (control group receives isocaloric enteral nutrition) | |
| Outpatients | |
| Wrong intervention group (the experimental group received early oral feeding (not nutritional support)) | |
| Not at nutritional risk | |
| Not randomised | |
| Comment on Kearns 1992 | |
| Wrong control group (control group received hospital‐made enteral nutrition as standard care) | |
| Wrong intervention group (the experimental group did not receive nutritional support (glutamine)) | |
| Participants were pregnant women. | |
| Wrong control group (control group receives enteral nutrition) | |
| Multi‐intervention (including megestrol acetate) | |
| Outpatients | |
| Wrong control group | |
| Glutatemine enriched nutritional support | |
| Wrong intervention (does not receive a nutrition intervention) | |
| Wrong control group (the comparison of the study is EN versus PN) | |
| Not randomised | |
| Outpatients | |
| Not randomised | |
| Early oral feeding | |
| Not at nutritional risk. Trialists investigate tumor kinetics following TPN and do not indicate that their participants are at nutritional risk. | |
| Outpatients | |
| Wrong intervention group (the experimental group received early oral feeding, not nutritional support) | |
| Not randomised | |
| Wrong intervention group (the intervention group received elemental diet) | |
| Not randomised | |
| Outpatients | |
| Not randomised | |
| Outpatients | |
| Not randomised | |
| Dialysis | |
| Wrong control group (there was no control group. The trial compared group 2 and 3 as one). | |
| Wrong intervention group (the experimental group received early oral feeding. Not nutritional support) | |
| Multiintervention (early oral feeding) | |
| Outpatients (not hospitalised. Both groups received parenteral nutrition) | |
| Outpatients | |
| Outpatients | |
| Wrong intervention group (experimental group receives early oral feeding (not nutrition support)) | |
| Wrong intervention group (experimental group did not receive nutritional support) | |
| Not randomised | |
| Outpatients (the participants were not hospitalised, but were admitted to a Clinical Research Centre) | |
| Publication of the outpatient phase of Förli 2001 | |
| Outpatients | |
| Outpatients and control intervention not described as standard care | |
| Not randomised | |
| Not randomised | |
| Outpatients | |
| Quasi‐randomised | |
| Wrong control group (control group received parenteral feeding) | |
| Wrong control group (the diet of the control group was not described as standard care but rather Early natural nutrition) | |
| Wrong control group (both groups receives nutritional intervention) | |
| Quasi‐randomised | |
| Outpatients | |
| Not randomised | |
| Wrong control group (fixed oral diet versus patient‐controlled oral diet) | |
| Wrong intervention group (experimental group was not described as nutritional support) | |
| Outpatients | |
| The trial was retracted | |
| Outpatients | |
| Not a randomised clinical trial | |
| Quasi‐randomised (participants were randomly allocated into 1 of 2 groups according to odd or even year of birth) | |
| Not randomised | |
| Wrong intervention group (immunonutrition) | |
| Not randomised to nutrition support (randomised to oral hygiene) | |
| Wrong control group (2 different enteral solutions) | |
| Wrong intervention group (intervention group received immunonutrition containing arginine) | |
| Not randomised | |
| Early oral feeding | |
| Not adults (infants) | |
| Not a randomised clinical trial | |
| Wrong control group (control group did not receive standard care) | |
| Wrong control group (both groups were intervention groups receiving the same intervention in different time periods) | |
| Wrong control group (both groups were intervention groups, and both of them had enteral feeding) | |
| Wrong control group (No participants received a control diet) | |
| Outpatients | |
| Outpatients | |
| Outpatients | |
| No group received standard care (enteral nutrition versus oral nutrition versus enteral plus oral nutrition) | |
| Wrong control group (all groups received different parenteral nutrition therapy) | |
| Not randomised (patients was chosen in consecutive manner and compared to patients during a preceeding 20‐year period) | |
| Not adults | |
| Not a randomised clinical trial. | |
| Wrong control group (the comparison of the study is EN versus PN) | |
| Wrong control group (the comparison of the study is EN versus PN) | |
| Wrong control group (the comparison of the study is EN versus PN) | |
| Wrong control group (the comparison of the study is hypocaloric PN vs traditional PN) | |
| Wrong control group (early EN versus PN plus EN) | |
| Not randomised | |
| Not a randomised clinical trial | |
| Wrong control group (the control group receives PN) | |
| Wrong control group (2 intervention groups (hypercaloric vs hypocaloric)) | |
| Wrong control group (control group received enteral nutrition as standard care) | |
| Outpatients | |
| Not randomised | |
| Outpatients | |
| Wrong control group (control group received a different enteral formula) | |
| Outpatients | |
| Wrong control group (control group received nutrition support until 50% of energy requirements were met) | |
| Outpatients | |
| Outpatients | |
| Trial to test the efficacy of providing less protein in diet | |
| Wrong control group. There were 4 intervention groups: standard enteral nutrition, immunmodulating enteral nutrition, standard parenteral nutrition, immunmodulating parenteral nutrition, and therefore no control group | |
| Outpatients (ambulatory) | |
| Not adults | |
| Wrong control group (both groups were intervention groups receiving enteral nutrition at different times) | |
| Wrong control group (control group receives total parenteral nutrition) | |
| Not randomised | |
| Not randomised | |
| Outpatients | |
| Not a randomised clinical trial (observational study) | |
| Not adults | |
| Not randomised (quasi‐randomised according to birth date) | |
| Early oral feeding | |
| Outpatients | |
| Not randomised | |
| Outpatients | |
| Not adults (neonatal patients) | |
| Outpatients | |
| Wrong intervention group (immunonutrition) | |
| Wrong control group (comparison of the study is EN versus PN) | |
| Multi‐intervention | |
| Not a randomised clinical trial | |
| Not a randomised clinical trial, and the comparison is EN versus PN | |
| Not a randomised clinical trial | |
| Wrong control group (the control group received 100% parenteral nutrition, while the intervention group received 70% parenteral nutrition, and 30% enteral nutrition) | |
| Outpatients | |
| Not at nutritional risk (healthy learning adults) | |
| Not a randomised clinical trial | |
| Multi‐intervention (PEG‐sonde versus nasogastric tube) | |
| Not a randomised clinical trial | |
| Wrong control group (the comparison of the study is (146kj/kg/day + glucose, protein, lipid + electrolyte + vitamins) versus (105 kj/kg/day + glucose, protein, lipid + electrolyte + vitamins)) | |
| Wrong control group (control group receives enteral nutrition) | |
| Not a randomised clinical trial | |
| Wrong control group (control described as receiving nutrition support) | |
| Wrong control group (control groups received enteral nutrition) | |
| Wrong intervention group (experimental group receives early oral feeding (not nutrition support)) | |
| Wrong control group | |
| Outpatients | |
| Wrong intervention group (early oral feeding) | |
| Not adults | |
| Outpatients | |
| Wrong control group (comparison of the study is EN versus PN) | |
| Wrong control group (comparison of the study is standard caloric PN versus hypercaloric PN) | |
| Not a randomised clinical trial | |
| Wrong intervention group (experimental group received early oral feeding) | |
| Not randomised | |
| Not a randomised clinical trial | |
| Wrong control group | |
| Outpatients (participants were not hospitalised at time of randomisation) | |
| Not a randomised clinical trial (prospective cohort study) | |
| Outpatients | |
| Wrong control group (control group received a different parenteral nutrition solution than experimental) | |
| Cluster‐randomised trial | |
| Wrong control group (control group received parenteral nutrition) | |
| The trial compares nutrition support guided by energy expenditure compared with being blinded to energy expenditure. Both groups receive nutrition support. | |
| Not at nutritional risk | |
| Wrong control group (both groups received total parenteral nutrition) | |
| Wrong control group (received trophic feeds of enteral nutrition) | |
| Pregnant participants | |
| Not a nutritional risk (participants received laparoscopic surgery, and the authors did not describe them as at nutritional risk) | |
| Wrong intervention group (experimental group received a nutrition supplement high in calories, protein and branched‐chain amino acids, hence is immunonutrition) | |
| Wrong control group (intervention were not comparable between groups) | |
| Multi‐intervention (intervention group receives insulin in addition to the nutrition support) | |
| Wrong intervention group (additionally the experimental group received immunonutrition) | |
| Wrong intervention group (experimental group received early oral feeding) | |
| Not randomised | |
| Not randomised | |
| Experimental group received elemental diet | |
| Wrong experimental intervention (received elemental diet) | |
| Wrong experimental intervention (received elemental diet) | |
| Outpatients | |
| Wrong control group (there was no control group) | |
| Outpatients | |
| Wrong control group (EN vs PN + EN (different dosages)) | |
| Outpatients | |
| Wrong control group (control group receives parenteral feeding or enteral feeding) | |
| Outpatients (institutionalised) | |
| Outpatients | |
| Outpatients | |
| Wrong control group (control group receives parenteral feeding or enteral feeding) | |
| Outpatients | |
| Most likely not hospitalised (no contact information for first author could be found) | |
| Not randomised | |
| Wrong control group (control group receives enteral nutrition) | |
| Not randomised (non‐randomised cluster study) | |
| Multi‐intervention (intervention group received a list of multi‐interventions that included ones that were not nutrition support) | |
| Wrong control group (control group receives enteral nutrition) | |
| Outpatients (ambulant) | |
| Wrong control (control group received nasogastric feeding) | |
| Wrong control group (supplement versus dense supplement) | |
| Outpatients | |
| Not a randomised clinical trial | |
| Early oral feeding | |
| Wrong intervention group (immunonutrition) and outpatients | |
| Outpatients | |
| Not randomised (cancer patients compared with healthy patients) | |
| Not randomised (quasi‐randomised) | |
| Not randomised | |
| Outpatients | |
| Wrong control group (control group received another advice intervention) and trial was in outpatients | |
| Multi‐intervention (both prokinetics and higher gastric threshold) | |
| Wrong control group | |
| Outpatients | |
| Not at nutritional risk (test if nutrition helps on inflammatory response) | |
| Not randomised | |
| Outpatients | |
| Quasi‐randomised (participants randomised by last digit in hospital registration number) | |
| Not randomised | |
| Wrong intervention group (immunonutrition) | |
| Not a randomised clinical trial | |
| Outpatients | |
| Not a randomised clinical trial (retrospective study) | |
| Wrong control group (all groups received total parenteral nutrition) | |
| Outpatients | |
| Outpatients | |
| Wrong control group (2 intervention groups (trophic vs full). No standard care) | |
| Wrong control group (control received a different enteral nutrition than the experimental group (trophic)) | |
| Not adults | |
| Not randomised | |
| Outpatients, and not randomised | |
| Control participants were not hospitalised | |
| Not randomised (intervention based on enrolment to specific hospital) | |
| Wrong control group (2 intervention groups: oral supplements and nutritional therapy group) | |
| Wrong intervention group (early oral feeding) | |
| Wrong intervention group (immunonutrition) | |
| Wrong control group (control group received enteral nutrition) | |
| Wrong control group (not standard care (10% or 20% glucose)) | |
| Wrong intervention group (nasogastric decompression, versus no nasogastric decompression) | |
| Outpatients | |
| Wrong control group (4 different parenteral solutions) | |
| Wrong intervention group (the experimental group received early oral nutrition) | |
| Not a randomised clinical trial (article is a comment on Bozetti 1998) | |
| Outpatients | |
| Wrong control group (control group were not described as standard care) | |
| Wrong control group (all 3 groups received total parenteral nutrition) | |
| Outpatients | |
| Primarily outpatients | |
| Not randomised | |
| Multi‐intervention | |
| Outpatients (not all participants were hospitalised) | |
| Not at nutritional risk | |
| Not at nutritional risk | |
| Wrong intervention group (no nutrition) | |
| Wrong control group (not described as standard care) | |
| Not a randomised clinical trial | |
| Not adults (We wrote to the author ([email protected]) for separate data for the adults. The author did not have separate data). | |
| Wrong control group (both groups received EN and PN in different volumes) | |
| The trial was retracted | |
| Wrong control group (control group receives TPN) | |
| Not a randomised clinical trial | |
| Not adults | |
| Wrong control group (participants with inflammatory bowel disease in intervention group received PN containing lipids, while control group received PN without lipids) | |
| Wrong control group (EN vs PN) | |
| Wrong control group (EN vs PN) | |
| Outpatients | |
| Not randomised | |
| Wrong intervention group (elemental diet) | |
| Wrong intervention group (intervention is a prophylatic PEG) | |
| Outpatients | |
| Outpatients | |
| Outpatients | |
| Wrong control group (both groups received different enteral nutrition) | |
| Outpatients | |
| Wrong control group (control group received parenteral nutrition) | |
| Wrong control group (both groups received nutritional support) | |
| Wrong intervention group (immunonutrition vs standard nutrition). We contacted the authors in September 2015 by email to get specific information on groups 3 and 4: [email protected]. We received no reply. | |
| Not randomised | |
| Wrong control group (oral feeding 48 to 72 hours after surgery versus oral feeding 10 to 12 days after surgery) | |
| Wrong intervention group (participants in intervention group reveived EN contains 2 types of nutritious supplementary while control group received EN contains only 1 type) | |
| Wrong intervention group (immunonutrition) | |
| Wrong control group (control group receives enteral nutrition) | |
| Not randomised | |
| Wrong intervention group (early oral feeding) | |
| Outpatients | |
| Wrong control group (control group receives enteral nutrition) | |
| Not described as randomised | |
| Wrong control group (control group receives an oral nutritional intervention in addition to standard hospital diet) | |
| Not a randomised clinical trial | |
| Outpatients | |
| Wrong control group (PN vs EN) | |
| Wrong control group (PN vs EN) | |
| This study aims to find out the relationship between education and nutrition support. | |
| Wrong intervention group (experimental group received immunonutrition) | |
| Wrong control group (control group received enteral nutrition) | |
| Wrong intervention group (early oral feeding) | |
| Outpatients | |
| Outpatients | |
| Not randomised | |
| Controls received oral supplement that differed only in the amount of protein | |
| Not at nutritional risk | |
| Wrong control group (EN vs PN) | |
| Not randomised | |
| Early oral feeding | |
| Wrong control group (both groups received nutritional intervention) | |
| Outpatients | |
| Wrong control group (control group not standard care, high carbohydrate versus high fat content supplements) | |
| Outpatients | |
| Not adults | |
| Not randomised | |
| Wrong control group (PN vs EN) | |
| Not a randomised clinical trial | |
| Wrong control group (discontinued PN vs continued PN) | |
| Wrong control group (PN vs EN) | |
| Not a randomised clinical trial | |
| Not a randomised clinical trial | |
| Not a randomised clinical trial | |
| Outpatients | |
| Wrong control group | |
| Multi‐intervention (both nutrition and early mobilisation) | |
| Outpatients | |
| Wrong intervention group (elemental diet) | |
| Wrong control group (2 intervention groups) | |
| Not randomised | |
| Wrong control group (control group does not receive standard care) | |
| Outpatients | |
| Not adults | |
| Not a randomised clinical trial (quasi‐randomised) | |
| Outpatients | |
| Outpatients | |
| Wrong control group (control group receives enteral nutrition) | |
| Outpatients | |
| Not a randomised clinical trial (quasi‐randomised) | |
| Wrong control group (portal vein nutrition in intervention group versus peripheral vein nutrition in control group) | |
| Wrong control group (EN vs PN) | |
| Wrong control group (control group did not receive standard care (hypocalorisk + protein postoperatively)) | |
| No information on experimental group or control group | |
| Not a randomised clinical trial (observational study) | |
| Not a randomised clinical trial | |
| Not a randomised clinical trial | |
| Not a randomised clinical trial | |
| Wrong control group (EN vs PN) | |
| Not at nutritional risk | |
| Wrong intervention group | |
| Not a randomised clinical trial (quasi‐randomised) | |
| Wrong intervention group (this type of comparison could not find which kind of intervention worked. Clinical intervention combined with food intake as wishes in intervention group versus clinical intervention combined with intake of high‐energy high protein food in control group) | |
| Wrong intervention group (stomach tube homogenate diets and yogurt in intervention group versus stomach tube homogenate diets in control group) | |
| Wrong control group (EN vs. PN) | |
| This study is on the effectiveness of rehabilitation not nutritional support. Rehabilitation treatment plus oral feeding of Nutren versus rehabilitation plus oral feeding of normal food like poridge versus oral feeding of normal food like poridge. | |
| Wrong control group (food with different calories and protein and intravenous nutrition were performed in 2 different groups) | |
| Not described as randomised | |
| Wrong control group (control group received enteral nutrition) | |
| Not at nutritional risk | |
| Wrong control group (PN in different ways in 2 groups, one is portal vein nutrition, the other is central vein nutrition) | |
| Wrong control group (EN vs PN): (PN (after 48 hrs) plus EN (after 1 week replaced with EN) vs PN (after 48 hrs normal feeding resumes, at least 2 weeks) vs EN) | |
| Not a randomised clinical trial | |
| Wrong control group (control group receives enteral nutrition) | |
| Wrong control group (EN of different nutrition (different ratio of protein, lipid)) | |
| Wrong control group (control group receives EN or TPN) | |
| Not a randomised clinical trial | |
| Wrong intervention group (early oral feeding) | |
| Retracted | |
| Wrong control group (EN vs TPN) | |
| Wrong control group (control group receives enteral nutrition) | |
| Not a randomised clinical trial | |
| Multi‐intervention (both experimental groups had removal of nasogastric tube, and oral feeding, while the control group had no feeding, and kept the nasogastric tube until flatus) | |
| Wrong control group (EN vs PN) | |
| Wrong control group (EN vs PN) | |
| Wrong control group (control group receives enteral nutrition) | |
| Wrong control group (early EN+PN vs TPN+EN) | |
| Outpatients |
EN: enteral nutrition
PN: parenteral nutrition
TPN: total parenteral nutrition
Characteristics of studies awaiting assessment [ordered by study ID]
| Methods | Could not be found |
| Participants | |
| Interventions | |
| Outcomes | |
| Notes |
| Methods | Could not be found |
| Participants | |
| Interventions | |
| Outcomes | |
| Notes |
| Methods | Could not be found |
| Participants | |
| Interventions | |
| Outcomes | |
| Notes |
| Methods | Could not be found |
| Participants | |
| Interventions | |
| Outcomes | |
| Notes |
| Methods | Could not be found |
| Participants | |
| Interventions | |
| Outcomes | |
| Notes |
| Methods | Could not be found |
| Participants | |
| Interventions | |
| Outcomes | |
| Notes |
| Methods | Could not be found |
| Participants | |
| Interventions | |
| Outcomes | |
| Notes |
| Methods | Could not be found |
| Participants | |
| Interventions | |
| Outcomes | |
| Notes |
| Methods | Could not be found |
| Participants | |
| Interventions | |
| Outcomes | |
| Notes |
| Methods | Could not be found |
| Participants | |
| Interventions | |
| Outcomes | |
| Notes |
| Methods | Could not be found |
| Participants | |
| Interventions | |
| Outcomes | |
| Notes |
| Methods | Could not be found |
| Participants | |
| Interventions | |
| Outcomes | |
| Notes |
| Methods | Could not be found |
| Participants | |
| Interventions | |
| Outcomes | |
| Notes |
| Methods | Could not be found |
| Participants | |
| Interventions | |
| Outcomes | |
| Notes |
| Methods | Could not be found |
| Participants | |
| Interventions | |
| Outcomes | |
| Notes |
| Methods | Could not be found |
| Participants | |
| Interventions | |
| Outcomes | |
| Notes |
| Methods | Could not be found |
| Participants | |
| Interventions | |
| Outcomes | |
| Notes |
| Methods | Could not be found |
| Participants | |
| Interventions | |
| Outcomes | |
| Notes |
| Methods | Could not be found |
| Participants | |
| Interventions | |
| Outcomes | |
| Notes |
| Methods | Could not be found |
| Participants | |
| Interventions | |
| Outcomes | |
| Notes |
| Methods | Could not be found |
| Participants | |
| Interventions | |
| Outcomes | |
| Notes |
| Methods | Could not be found |
| Participants | |
| Interventions | |
| Outcomes | |
| Notes |
| Methods | Could not be found |
| Participants | |
| Interventions | |
| Outcomes | |
| Notes |
| Methods | Could not be found |
| Participants | |
| Interventions | |
| Outcomes | |
| Notes |
| Methods | Could not be found |
| Participants | |
| Interventions | |
| Outcomes | |
| Notes |
| Methods | Could not be found |
| Participants | |
| Interventions | |
| Outcomes | |
| Notes |
| Methods | Could not be found |
| Participants | |
| Interventions | |
| Outcomes | |
| Notes |
| Methods | Could not be found |
| Participants | |
| Interventions | |
| Outcomes | |
| Notes |
| Methods | Could not be found |
| Participants | |
| Interventions | |
| Outcomes | |
| Notes |
| Methods | Could not be found |
| Participants | |
| Interventions | |
| Outcomes | |
| Notes |
| Methods | Could not be found |
| Participants | |
| Interventions | |
| Outcomes | |
| Notes |
| Methods | Could not be found |
| Participants | |
| Interventions | |
| Outcomes | |
| Notes |
| Methods | Could not be found |
| Participants | |
| Interventions | |
| Outcomes | |
| Notes |
Characteristics of ongoing studies [ordered by study ID]
| Trial name or title | Efficacy of parenteral nutrition in patients at the palliative phase of cancer (Alim‐K) |
| Methods | Multicenter randomised clinical trial, France |
| Participants | Hospitalised adults, aged > 18 years suffering from cancer at the palliative stage, i.e. patients in whom the main aim of treatment is to limit pain and discomfort, curative treatment has either been discontinued, or may still be ongoing but with little expected benefit in terms of overall survival. Life expectancy must be > 2 months, participants must have a functional digestive tract, present malnutrition defined as a BMI < 18.5 kg/m² in those aged < 70 years or < 21 kg/m² in those aged ≥70 years; or weight loss of 2% in 1 week, 5% in 1 month, or 10% in 6 months, participants with antalgic radiotherapy or scheduled to undergo palliative surgery; participants must already have a functional central venous catheter in place. Exclusion criteria: non‐functional digestive tract (intestinal occlusion, tumour compression, subocclusive peritoneal carcinosis), any disorder preventing oral ingestion (cancer of the upper aerodigestive tract, oesophagus or stomach); parenteral nutrition that is ongoing or dating from < 1 month; intravenous chemotherapy through a pump lasting > 48 hours, as this is incompatible with administration of parenteral nutritional through the central venous line; presence of gastrostomy or jejunostomy; persisting sensation of hunger in aphagic patients with haematological cancers undergoing bone marrow transplant, acute renal failure (defined as creatinine clearance < 30 ml/min) or heart failure (defined as a left ventricular ejection fraction < 30%); adult patients under legal guardianship unable to respond to the 'quality of life' questionnaire (due to psychiatric disorders, attention disorders, or cognitive disorders). Patients participating in another ongoing clinical trial |
| Interventions | Experimental group: Parenteral nutrition Control group: Standard care |
| Outcomes | Quality of life, survival, body weight, albumin, C‐Reactive Protein |
| Starting date | May 2014 |
| Contact information | |
| Notes | Status: Currently recruiting. Expected finish June 2016 NCT02151214 |
| Trial name or title | Nutritional intervention program in malnourished patients admitted for heart failure (PICNIC) |
| Methods | Multicentre, randomised, blinded, controlled study |
| Participants | Hospitalised adults aged over 18 years who are admitted for acute heart failure, whether chronic and uncompensated or of new onset, in a state of malnutrition (score on the MNA < 17 points) at nutritional risk due to MNA. Expected number: 182 |
| Interventions | Experimental group: Diet optimisation, specific recommendations, nutritional supplements Control group: No intervention Co‐intervention: conventional treatment for heart failure |
| Outcomes | Quality of life (Minnesota living with heart failure questionnaire), morbidity, mortality, readmission |
| Starting date | 11th November 2011 |
| Contact information | |
| Notes | Status: terminated due to beneficial effect of the experimental group, no data has yet been reported. NCT01472237 |
| Trial name or title | Effect of early nutritional therapy on frailty, functional outcomes and recovery of undernourished medical inpatients trial (EFFORT) |
| Methods | Multicentre randomised clinical trial, Switzerland |
| Participants | Hospitalised adults at risk for undernutrition defined by the nutritional risk score (NRS 2002) and an expected hospital length of stay > 5 days, at nutritional risk according to screening tools. Expected number: 2000 ‐ 3000. Exclusion criteria: Initially admitted to critical care units (except intermediate care), scheduled for surgery or in an immediate postoperative state, unable to ingest oral nutrition and thus need for enteral or parenteral nutrition, admitted with, or scheduled for, total parenteral nutrition or tube‐feeding, currently under nutritional therapy (defined by at least 1 visit with a dietician in the last month), who are hospitalised because of anorexia nervosa, in terminal condition (end‐of‐life situation), hospitalised due to acute pancreatitis, hospitalised due to acute liver failure, earlier inclusion into this trial, cystic fibrosis, patients after gastric bypass operations, stem cell transplantation, any contraindication against nutritional therapy (i.e. enteral or parenteral or both) |
| Interventions | Experimental group: These guidelines specify a reinforced nutritional therapy strategy to cover nutritional requirements, focusing on nutritional targets based on the specific nutritional diagnoses defined by the IDNT. The nutritional guidelines may vary according to important medical diagnoses (e.g. renal failure). They specify not only nutritional targets, but also escalation of the route (e.g. food fortification, oral, enteral, parenteral) if targets cannot be achieved (≤ 75%) every 5 hours. Nutritional goals are being assessed daily in participants in the intervention group. Control group: Usual care ("appetite‐guided") controls |
| Outcomes | All‐cause mortality, admission to the ICU from the medical ward, major complications, unplanned hospital readmissions, decline in functional outcome from admission to day 30 assessed by Barthel`s index (‐10%); each single component of the primary endpoint, short‐term nutritional and functional outcomes from inclusion to day 10 or hospital discharge; hospital outcomes; 30‐day and 180‐day outcomes, Other safety endpoints including adverse gastrointestinal effects associated with nutritional therapy assessed daily until hospital discharge. |
| Starting date | July 30, 2015 |
| Contact information | |
| Notes | Status: Recruiting NCT02517476 |
| Trial name or title | Oral nutrition supplementation in hospitalized patients (NutriSuP Oral) |
| Methods | Randomised clinical trial, Switzerland |
| Participants | Hospitalised adults admitted to a general medical ward and recruited within 48 hours, over the age of 65 years, and malnourished (subjective global assessment categories B or C patients), at nutritional risk according to a screening tool. Expected number: 60 participants Exclusion criteria: have an allergy or intolerance to any component of the oral supplement, are designated palliative care, are currently suffering from refeeding syndrome, have a pre‐existing medical condition that prevents oral intake of full fluids, or a contraindication to administration of fluid (i.e. are in volume overloaded state, are being given IV furosemide, or have end‐stage renal disease requiring renal replacement therapy with haemodialysis or peritoneal dialysis), have a diagnosis or suspicion of septic shock, have an expected length of stay of < 48 hours from the time of assessment, have suspected ischaemic stroke as cause for admission, reside in a residential care home, are unable to walk prior to current illness, are pregnant/breastfeeding, have a current diagnosis of diabetic ketoacidosis or hyperglycemic hyperosmolar syndrome |
| Interventions | Experimental group: 2 cans of Ensure (or similar product) a day while in hospital and will continue 2 cans a day of Ensure when discharged home until they have been receiving the enhanced ONS for a total of 90 days Control group: No intervention Co‐intervention: Standard care |
| Outcomes | Readmission rate, adherence to treatment |
| Starting date | December 4th 2015 |
| Contact information | |
| Notes | Status: not yet recruiting NCT02624752 |
| Trial name or title | Nutritional supplementation in hospitalized patients (NutriSuP) |
| Methods | Randomised clinical trial, Canada |
| Participants | Hospitalised adults with a Subjective Global Assessment (SGA) category B or C and have been hospitalised for < 48 hours, at nutritional risk according to a screening tool. Expected number: 100 Exclusion criteria: Have an allergy or intolerance to any component of the oral supplement or parenteral nutrition, have a contraindication to administration of IV fluid (i.e. are in volume overloaded state, are being given IV furosemide), are currently suffering from refeeding syndrome, have a pre‐existing medical condition that prevents oral intake of full fluids, have a diagnosis or suspicion of septic shock, have an expected length of stay of < 48 hours from the time of assessment, or have a current diagnosis of diabetic ketoacidosis or hyperglycaemic hyperosmolar syndrome |
| Interventions | Experimental group 1: Peripheral parenteral nutrition and enhanced oral supplementation Experimental group 2: Standard care for parenteral fluid administration and enhanced oral supplementation; Control group 2: Standard care for parenteral fluid administration and standard of care for oral supplementation |
| Outcomes | Quality of life, physical function, and nutrition‐related variables |
| Starting date | December 3rd 2015 |
| Contact information | |
| Notes | Status: Not yet recruiting NCT02632630 |
| Trial name or title | Supplemental parenteral nutrition in critically ill adults: a pilot randomised controlled trial |
| Methods | Stratified prospective multicentre unblinded randomised phase II study |
| Participants | Hospitalised adults Admitted to intensive care between 48 hours and 72 hours previously. Mechanically ventilated at the time of enrolment and expected to remain ventilated until the day after |
| Interventions | Experimental group: supplementary parenteral nutrition Control group: no intervention Co‐intervention: standard enteral nutrition |
| Outcomes | Energy amount in calories, antibiotic usage, sequential organ failure assessment score, mechanical ventilation duration, length of hospital stay, mortality, quality of life |
| Starting date | April 22nd 2013 |
| Contact information | |
| Notes | Last updated October 13th 2015 (still recruiting) NCT01847534 |
IDNT: Internation Dietetics and Nutrition Terminology
Data and analyses
| Outcome or subgroup title | No. of studies | No. of participants | Statistical method | Effect size |
| 1 All‐cause mortality ‐ overall Show forest plot | 127 | 21758 | Risk Ratio (M‐H, Random, 95% CI) | 0.94 [0.86, 1.03] |
| Analysis 1.1  Comparison 1 All‐cause mortality ‐ end of intervention, Outcome 1 All‐cause mortality ‐ overall. | ||||
| 2 All‐cause mortality ‐ bias Show forest plot | 127 | 21758 | Risk Ratio (M‐H, Random, 95% CI) | 0.94 [0.86, 1.03] |
| Analysis 1.2  Comparison 1 All‐cause mortality ‐ end of intervention, Outcome 2 All‐cause mortality ‐ bias. | ||||
| 2.1 High risk of bias | 127 | 21758 | Risk Ratio (M‐H, Random, 95% CI) | 0.94 [0.86, 1.03] |
| 2.2 Low risk of bias | 0 | 0 | Risk Ratio (M‐H, Random, 95% CI) | 0.0 [0.0, 0.0] |
| 3 All‐cause mortality ‐ mode of delivery Show forest plot | 127 | 21758 | Risk Ratio (M‐H, Random, 95% CI) | 0.94 [0.86, 1.03] |
| Analysis 1.3  Comparison 1 All‐cause mortality ‐ end of intervention, Outcome 3 All‐cause mortality ‐ mode of delivery. | ||||
| 3.1 General nutrition support | 6 | 1420 | Risk Ratio (M‐H, Random, 95% CI) | 1.18 [0.74, 1.87] |
| 3.2 Fortified foods | 2 | 290 | Risk Ratio (M‐H, Random, 95% CI) | 1.24 [0.61, 2.54] |
| 3.3 Oral nutrition | 33 | 8529 | Risk Ratio (M‐H, Random, 95% CI) | 0.94 [0.79, 1.11] |
| 3.4 Enteral nutrition | 36 | 3722 | Risk Ratio (M‐H, Random, 95% CI) | 0.88 [0.75, 1.03] |
| 3.5 Parenteral nutrition | 43 | 7313 | Risk Ratio (M‐H, Random, 95% CI) | 0.98 [0.83, 1.16] |
| 3.6 Mixed | 7 | 484 | Risk Ratio (M‐H, Random, 95% CI) | 0.67 [0.29, 1.55] |
| 4 All‐cause mortality ‐ medical specialty Show forest plot | 127 | 21758 | Risk Ratio (M‐H, Random, 95% CI) | 0.94 [0.86, 1.03] |
| Analysis 1.4  Comparison 1 All‐cause mortality ‐ end of intervention, Outcome 4 All‐cause mortality ‐ medical specialty. | ||||
| 4.1 Cardiology | 0 | 0 | Risk Ratio (M‐H, Random, 95% CI) | 0.0 [0.0, 0.0] |
| 4.2 Medical gastro‐enterology and hepatology | 13 | 627 | Risk Ratio (M‐H, Random, 95% CI) | 0.90 [0.58, 1.38] |
| 4.3 Geriatrics | 13 | 2554 | Risk Ratio (M‐H, Random, 95% CI) | 0.85 [0.66, 1.08] |
| 4.4 Pulmonary disease | 3 | 118 | Risk Ratio (M‐H, Random, 95% CI) | 0.44 [0.15, 1.28] |
| 4.5 Endocrinology | 0 | 0 | Risk Ratio (M‐H, Random, 95% CI) | 0.0 [0.0, 0.0] |
| 4.6 Infectious diseases | 1 | 56 | Risk Ratio (M‐H, Random, 95% CI) | 1.61 [0.66, 3.92] |
| 4.7 Rheumatology | 0 | 0 | Risk Ratio (M‐H, Random, 95% CI) | 0.0 [0.0, 0.0] |
| 4.8 Haematology | 0 | 0 | Risk Ratio (M‐H, Random, 95% CI) | 0.0 [0.0, 0.0] |
| 4.9 Nephrology | 0 | 0 | Risk Ratio (M‐H, Random, 95% CI) | 0.0 [0.0, 0.0] |
| 4.10 Gastro‐enterologic surgery | 46 | 3943 | Risk Ratio (M‐H, Random, 95% CI) | 0.82 [0.62, 1.09] |
| 4.11 Trauma surgery | 4 | 184 | Risk Ratio (M‐H, Random, 95% CI) | 0.93 [0.55, 1.57] |
| 4.12 Orthopaedics | 12 | 1210 | Risk Ratio (M‐H, Random, 95% CI) | 1.39 [0.87, 2.22] |
| 4.13 Plastic, reconstructive and aesthetic surgery | 0 | 0 | Risk Ratio (M‐H, Random, 95% CI) | 0.0 [0.0, 0.0] |
| 4.14 Vascular surgery | 2 | 28 | Risk Ratio (M‐H, Random, 95% CI) | 0.0 [0.0, 0.0] |
| 4.15 Transplant surgery | 3 | 84 | Risk Ratio (M‐H, Random, 95% CI) | 0.58 [0.23, 1.50] |
| 4.16 Urology | 0 | 0 | Risk Ratio (M‐H, Random, 95% CI) | 0.0 [0.0, 0.0] |
| 4.17 Thoracic surgery | 3 | 592 | Risk Ratio (M‐H, Random, 95% CI) | 0.71 [0.16, 3.22] |
| 4.18 Neurological surgery | 0 | 0 | Risk Ratio (M‐H, Random, 95% CI) | 0.0 [0.0, 0.0] |
| 4.19 Oro‐maxillo‐facial surgery | 1 | 32 | Risk Ratio (M‐H, Random, 95% CI) | 3.38 [0.15, 77.12] |
| 4.20 Anaesthesiology | 0 | 0 | Risk Ratio (M‐H, Random, 95% CI) | 0.0 [0.0, 0.0] |
| 4.21 Emergency medicine | 7 | 5198 | Risk Ratio (M‐H, Random, 95% CI) | 0.99 [0.80, 1.22] |
| 4.22 Psychiatry | 0 | 0 | Risk Ratio (M‐H, Random, 95% CI) | 0.0 [0.0, 0.0] |
| 4.23 Neurology | 7 | 5168 | Risk Ratio (M‐H, Random, 95% CI) | 0.81 [0.60, 1.11] |
| 4.24 Oncology | 5 | 313 | Risk Ratio (M‐H, Random, 95% CI) | 1.19 [0.44, 3.21] |
| 4.25 Dermatology | 0 | 0 | Risk Ratio (M‐H, Random, 95% CI) | 0.0 [0.0, 0.0] |
| 4.26 Gynaecology | 0 | 0 | Risk Ratio (M‐H, Random, 95% CI) | 0.0 [0.0, 0.0] |
| 4.27 Mixed | 7 | 1651 | Risk Ratio (M‐H, Random, 95% CI) | 1.22 [0.88, 1.70] |
| 5 All‐cause mortality ‐ based on adequacy of the amount of calories Show forest plot | 127 | 21758 | Risk Ratio (M‐H, Random, 95% CI) | 0.94 [0.86, 1.03] |
| Analysis 1.5 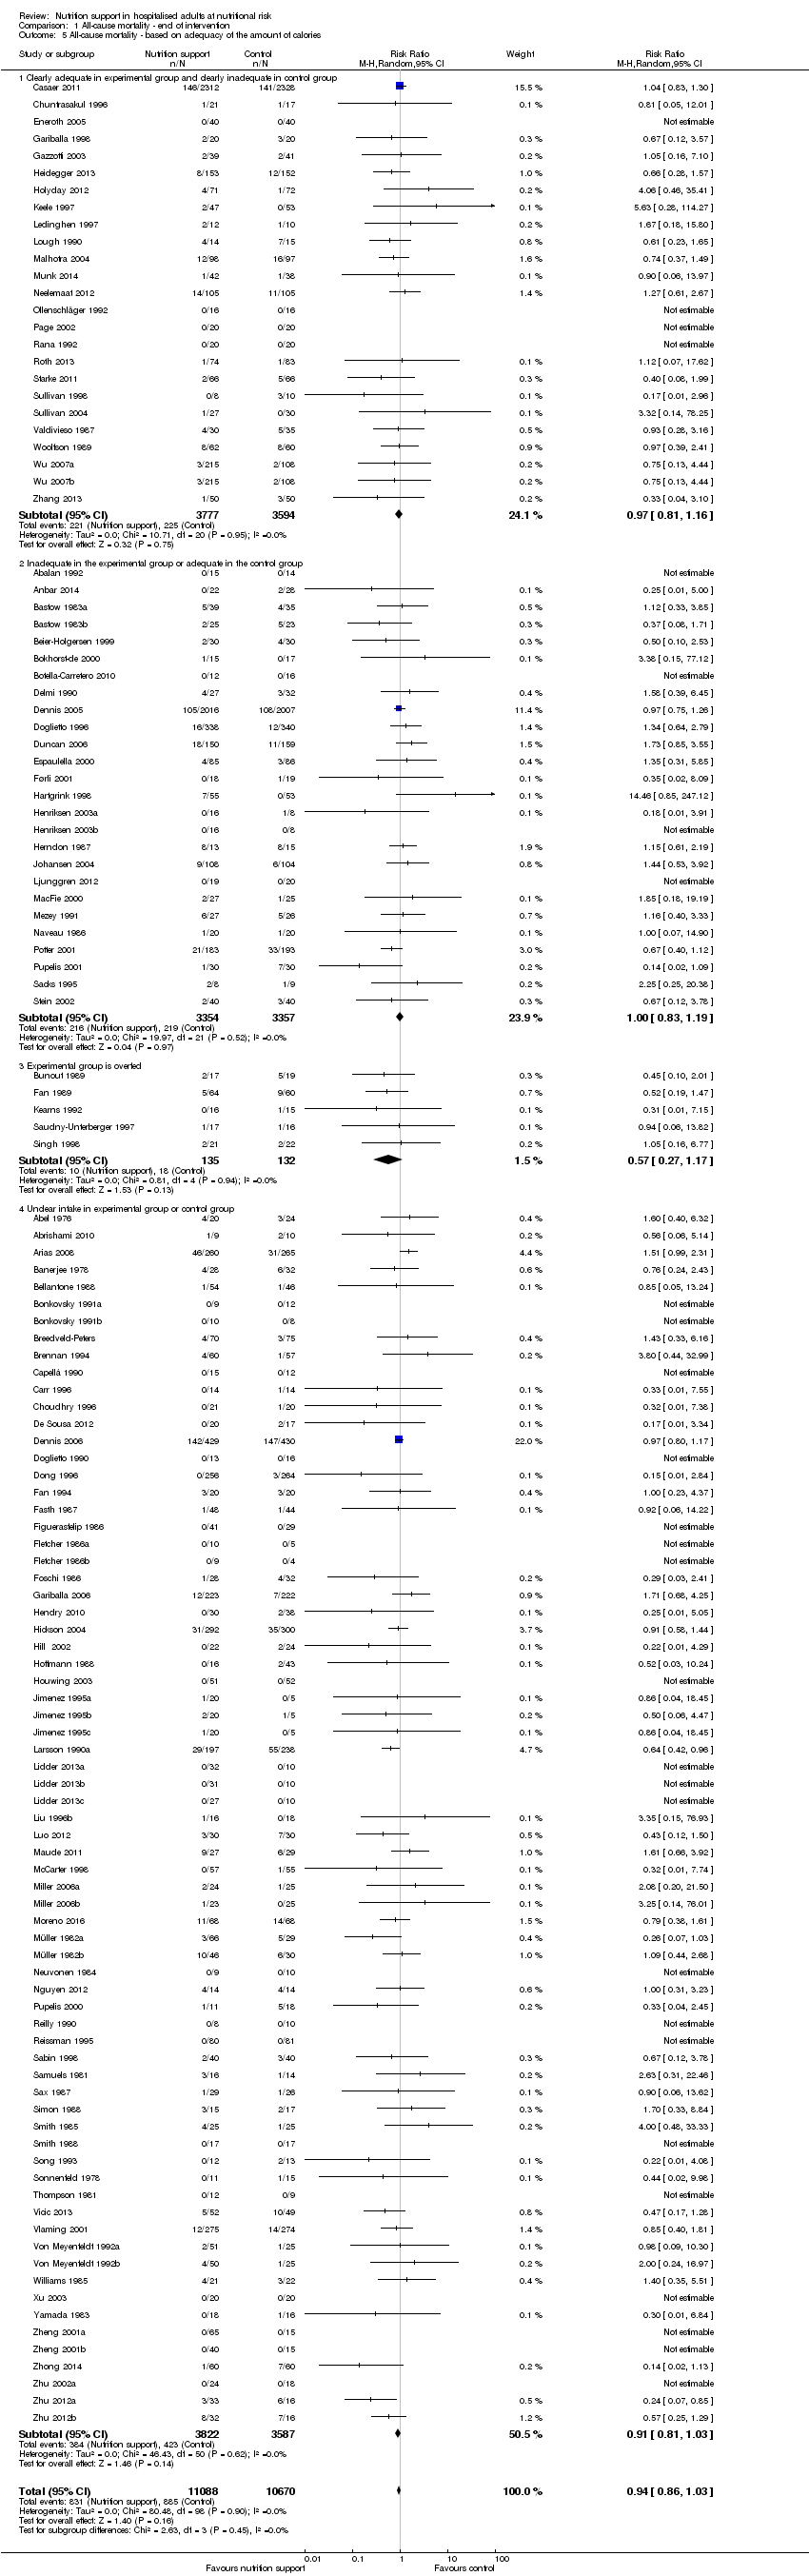 Comparison 1 All‐cause mortality ‐ end of intervention, Outcome 5 All‐cause mortality ‐ based on adequacy of the amount of calories. | ||||
| 5.1 Clearly adequate in experimental group and clearly inadequate in control group | 25 | 7371 | Risk Ratio (M‐H, Random, 95% CI) | 0.97 [0.81, 1.16] |
| 5.2 Inadequate in the experimental group or adequate in the control group | 26 | 6711 | Risk Ratio (M‐H, Random, 95% CI) | 1.00 [0.83, 1.19] |
| 5.3 Experimental group is overfed | 5 | 267 | Risk Ratio (M‐H, Random, 95% CI) | 0.57 [0.27, 1.17] |
| 5.4 Unclear intake in experimental group or control group | 71 | 7409 | Risk Ratio (M‐H, Random, 95% CI) | 0.91 [0.81, 1.03] |
| 6 All‐cause mortality ‐ different screening tools Show forest plot | 127 | 21758 | Risk Ratio (M‐H, Random, 95% CI) | 0.94 [0.86, 1.03] |
| Analysis 1.6  Comparison 1 All‐cause mortality ‐ end of intervention, Outcome 6 All‐cause mortality ‐ different screening tools. | ||||
| 6.1 NRS 2002 | 4 | 5064 | Risk Ratio (M‐H, Random, 95% CI) | 1.04 [0.84, 1.29] |
| 6.2 MUST | 0 | 0 | Risk Ratio (M‐H, Random, 95% CI) | 0.0 [0.0, 0.0] |
| 6.3 MNA | 2 | 117 | Risk Ratio (M‐H, Random, 95% CI) | 0.61 [0.12, 3.18] |
| 6.4 SGA | 3 | 1171 | Risk Ratio (M‐H, Random, 95% CI) | 1.41 [0.94, 2.10] |
| 6.5 Other means | 118 | 15406 | Risk Ratio (M‐H, Random, 95% CI) | 0.90 [0.81, 0.99] |
| 7 All‐cause mortality ‐ participants characterised as 'at nutritional risk' due to one of the following conditions Show forest plot | 127 | 21758 | Risk Ratio (M‐H, Random, 95% CI) | 0.94 [0.86, 1.03] |
| Analysis 1.7 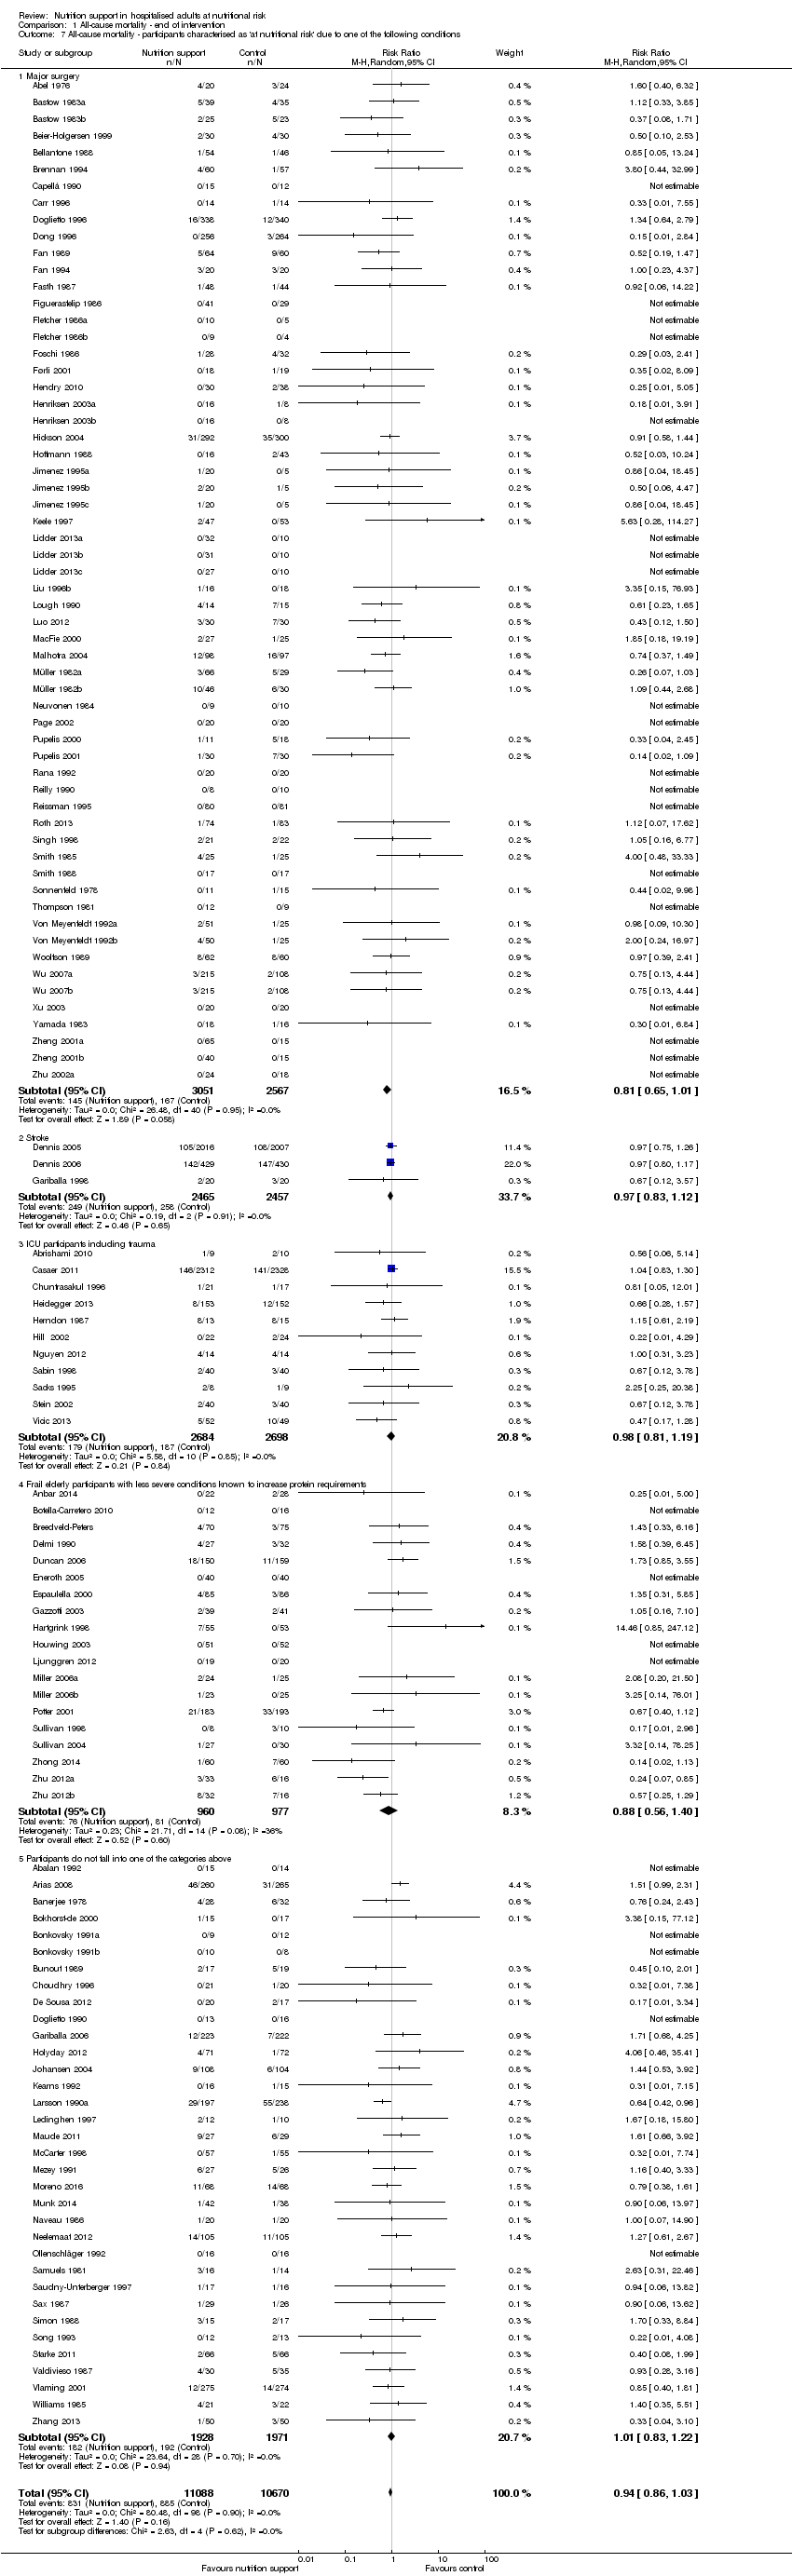 Comparison 1 All‐cause mortality ‐ end of intervention, Outcome 7 All‐cause mortality ‐ participants characterised as 'at nutritional risk' due to one of the following conditions. | ||||
| 7.1 Major surgery | 60 | 5618 | Risk Ratio (M‐H, Random, 95% CI) | 0.81 [0.65, 1.01] |
| 7.2 Stroke | 3 | 4922 | Risk Ratio (M‐H, Random, 95% CI) | 0.97 [0.83, 1.12] |
| 7.3 ICU participants including trauma | 11 | 5382 | Risk Ratio (M‐H, Random, 95% CI) | 0.98 [0.81, 1.19] |
| 7.4 Frail elderly participants with less severe conditions known to increase protein requirements | 19 | 1937 | Risk Ratio (M‐H, Random, 95% CI) | 0.88 [0.56, 1.40] |
| 7.5 Participants do not fall into one of the categories above | 34 | 3899 | Risk Ratio (M‐H, Random, 95% CI) | 1.01 [0.83, 1.22] |
| 8 All‐cause mortality ‐ participants characterised as 'at nutritional risk' due to one of the following criteria Show forest plot | 127 | 21758 | Risk Ratio (M‐H, Random, 95% CI) | 0.94 [0.86, 1.03] |
| Analysis 1.8  Comparison 1 All‐cause mortality ‐ end of intervention, Outcome 8 All‐cause mortality ‐ participants characterised as 'at nutritional risk' due to one of the following criteria. | ||||
| 8.1 BMI less than 20.5 kg/m2 | 2 | 247 | Risk Ratio (M‐H, Random, 95% CI) | 1.19 [0.58, 2.45] |
| 8.2 Weight loss of at least 5% during the last three months | 1 | 32 | Risk Ratio (M‐H, Random, 95% CI) | 0.0 [0.0, 0.0] |
| 8.3 Weight loss of at least 10% during the last six months | 1 | 32 | Risk Ratio (M‐H, Random, 95% CI) | 3.38 [0.15, 77.12] |
| 8.4 Insufficient food intake during the last week (50% of requirements or less) | 0 | 0 | Risk Ratio (M‐H, Random, 95% CI) | 0.0 [0.0, 0.0] |
| 8.5 Participants characterised as 'at nutritional risk' by other means | 123 | 21447 | Risk Ratio (M‐H, Random, 95% CI) | 0.93 [0.86, 1.02] |
| 9 All‐cause mortality ‐ participants characterised as 'at nutritional risk' due to biomarkers or anthropometrics Show forest plot | 127 | 21758 | Risk Ratio (M‐H, Random, 95% CI) | 0.94 [0.86, 1.03] |
| Analysis 1.9 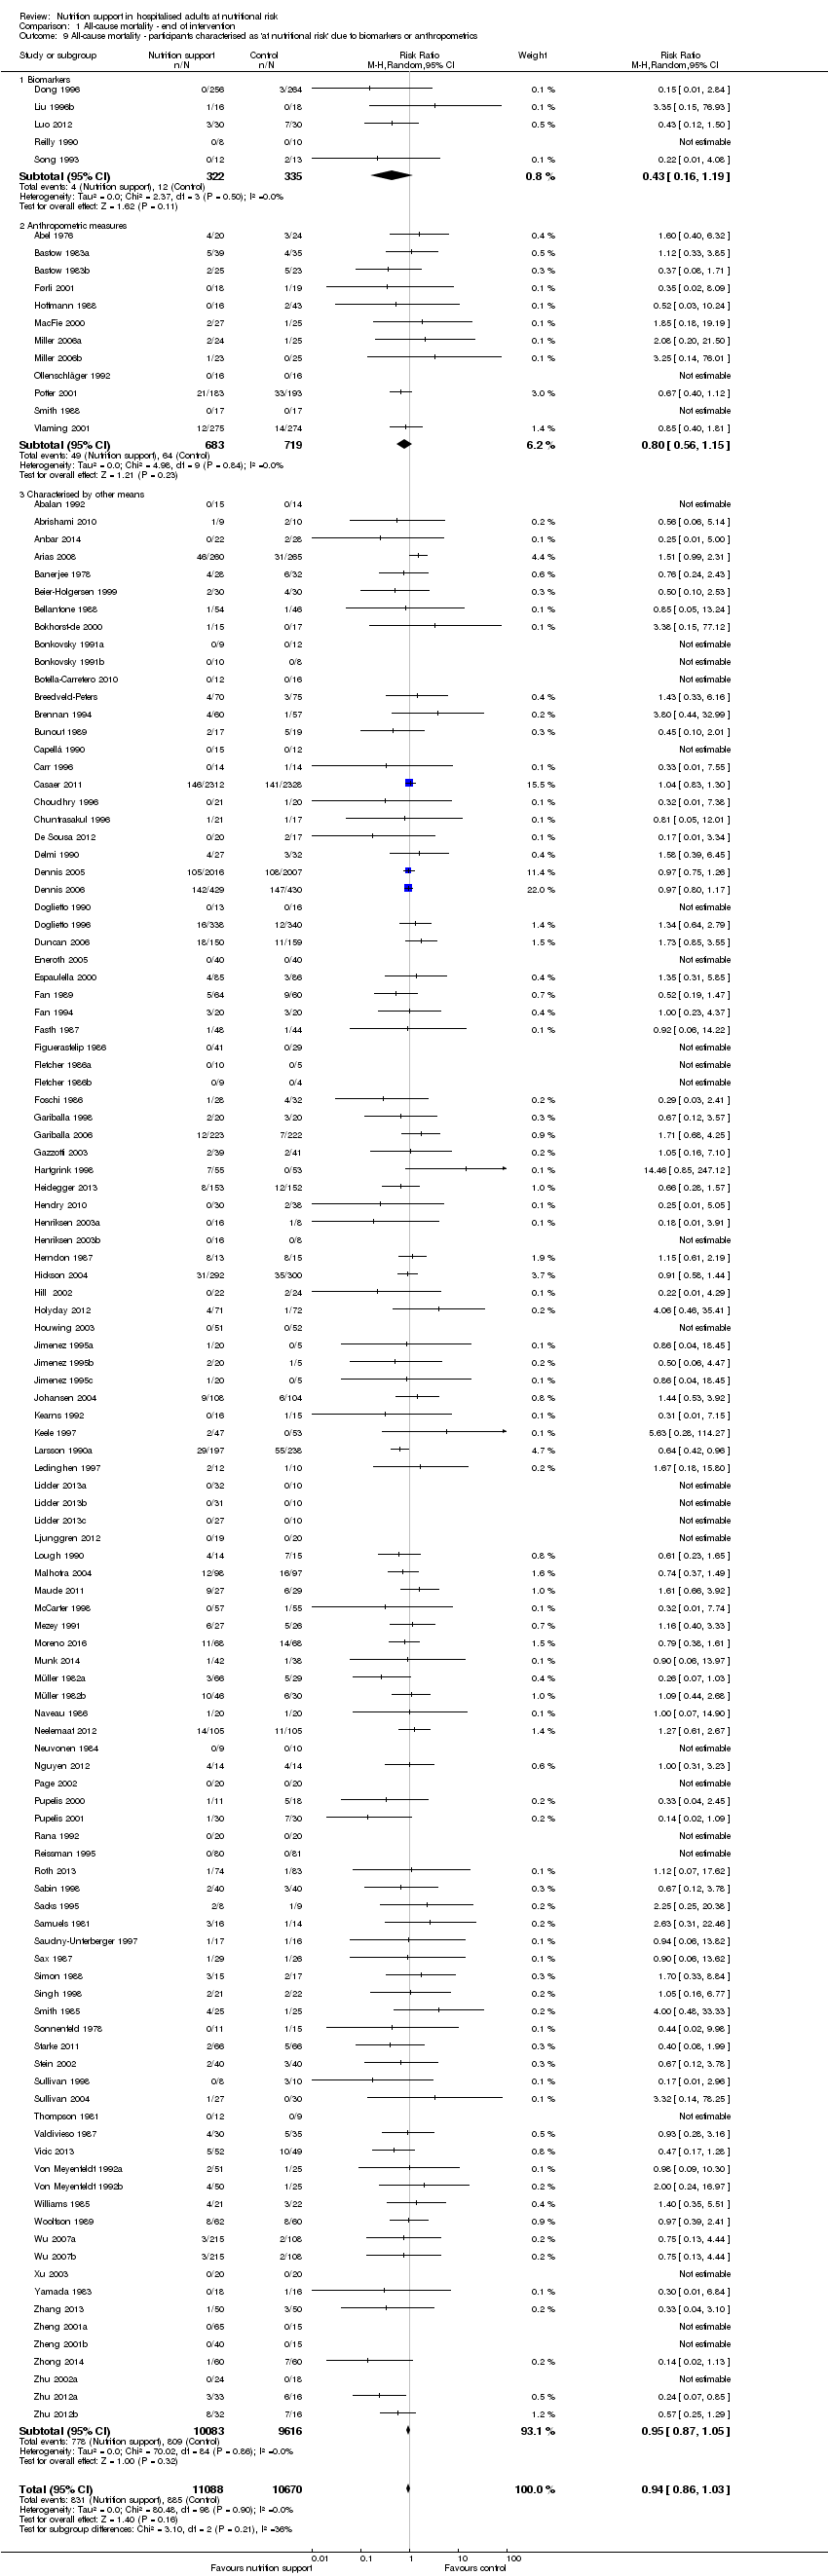 Comparison 1 All‐cause mortality ‐ end of intervention, Outcome 9 All‐cause mortality ‐ participants characterised as 'at nutritional risk' due to biomarkers or anthropometrics. | ||||
| 9.1 Biomarkers | 5 | 657 | Risk Ratio (M‐H, Random, 95% CI) | 0.43 [0.16, 1.19] |
| 9.2 Anthropometric measures | 12 | 1402 | Risk Ratio (M‐H, Random, 95% CI) | 0.80 [0.56, 1.15] |
| 9.3 Characterised by other means | 110 | 19699 | Risk Ratio (M‐H, Random, 95% CI) | 0.95 [0.87, 1.05] |
| 10 All‐cause mortality ‐ randomisation year Show forest plot | 127 | 21758 | Risk Ratio (M‐H, Random, 95% CI) | 0.94 [0.86, 1.03] |
| Analysis 1.10  Comparison 1 All‐cause mortality ‐ end of intervention, Outcome 10 All‐cause mortality ‐ randomisation year. | ||||
| 10.1 Before 1960 | 0 | 0 | Risk Ratio (M‐H, Random, 95% CI) | 0.0 [0.0, 0.0] |
| 10.2 1960 to 1979 | 5 | 181 | Risk Ratio (M‐H, Random, 95% CI) | 1.11 [0.50, 2.46] |
| 10.3 1980 to 1999 | 79 | 11350 | Risk Ratio (M‐H, Random, 95% CI) | 0.91 [0.81, 1.02] |
| 10.4 After 1999 | 43 | 10227 | Risk Ratio (M‐H, Random, 95% CI) | 0.95 [0.80, 1.12] |
| 11 All‐cause mortality ‐ trials where the intervention lasts fewer than three days compared with trials where the intervention lasts three days or more Show forest plot | 127 | 21758 | Risk Ratio (M‐H, Random, 95% CI) | 0.94 [0.86, 1.03] |
| Analysis 1.11  Comparison 1 All‐cause mortality ‐ end of intervention, Outcome 11 All‐cause mortality ‐ trials where the intervention lasts fewer than three days compared with trials where the intervention lasts three days or more. | ||||
| 11.1 Three days or more | 111 | 20434 | Risk Ratio (M‐H, Random, 95% CI) | 0.92 [0.84, 1.01] |
| 11.2 Fewer than three days | 13 | 722 | Risk Ratio (M‐H, Random, 95% CI) | 0.76 [0.39, 1.45] |
| 11.3 Unknown | 3 | 602 | Risk Ratio (M‐H, Random, 95% CI) | 1.16 [0.33, 4.06] |
| 12 All‐cause mortality ‐ 'best‐worst case' scenario Show forest plot | 127 | 22207 | Risk Ratio (M‐H, Random, 95% CI) | 0.74 [0.65, 0.84] |
| Analysis 1.12  Comparison 1 All‐cause mortality ‐ end of intervention, Outcome 12 All‐cause mortality ‐ 'best‐worst case' scenario. | ||||
| 13 All‐cause mortality ‐ 'worst‐best case' scenario Show forest plot | 127 | 22207 | Risk Ratio (M‐H, Random, 95% CI) | 1.13 [0.97, 1.31] |
| Analysis 1.13  Comparison 1 All‐cause mortality ‐ end of intervention, Outcome 13 All‐cause mortality ‐ 'worst‐best case' scenario. | ||||
| 14 All‐cause mortality co‐interventions Show forest plot | 127 | 21758 | Risk Ratio (M‐H, Fixed, 95% CI) | 0.93 [0.86, 1.02] |
| Analysis 1.14 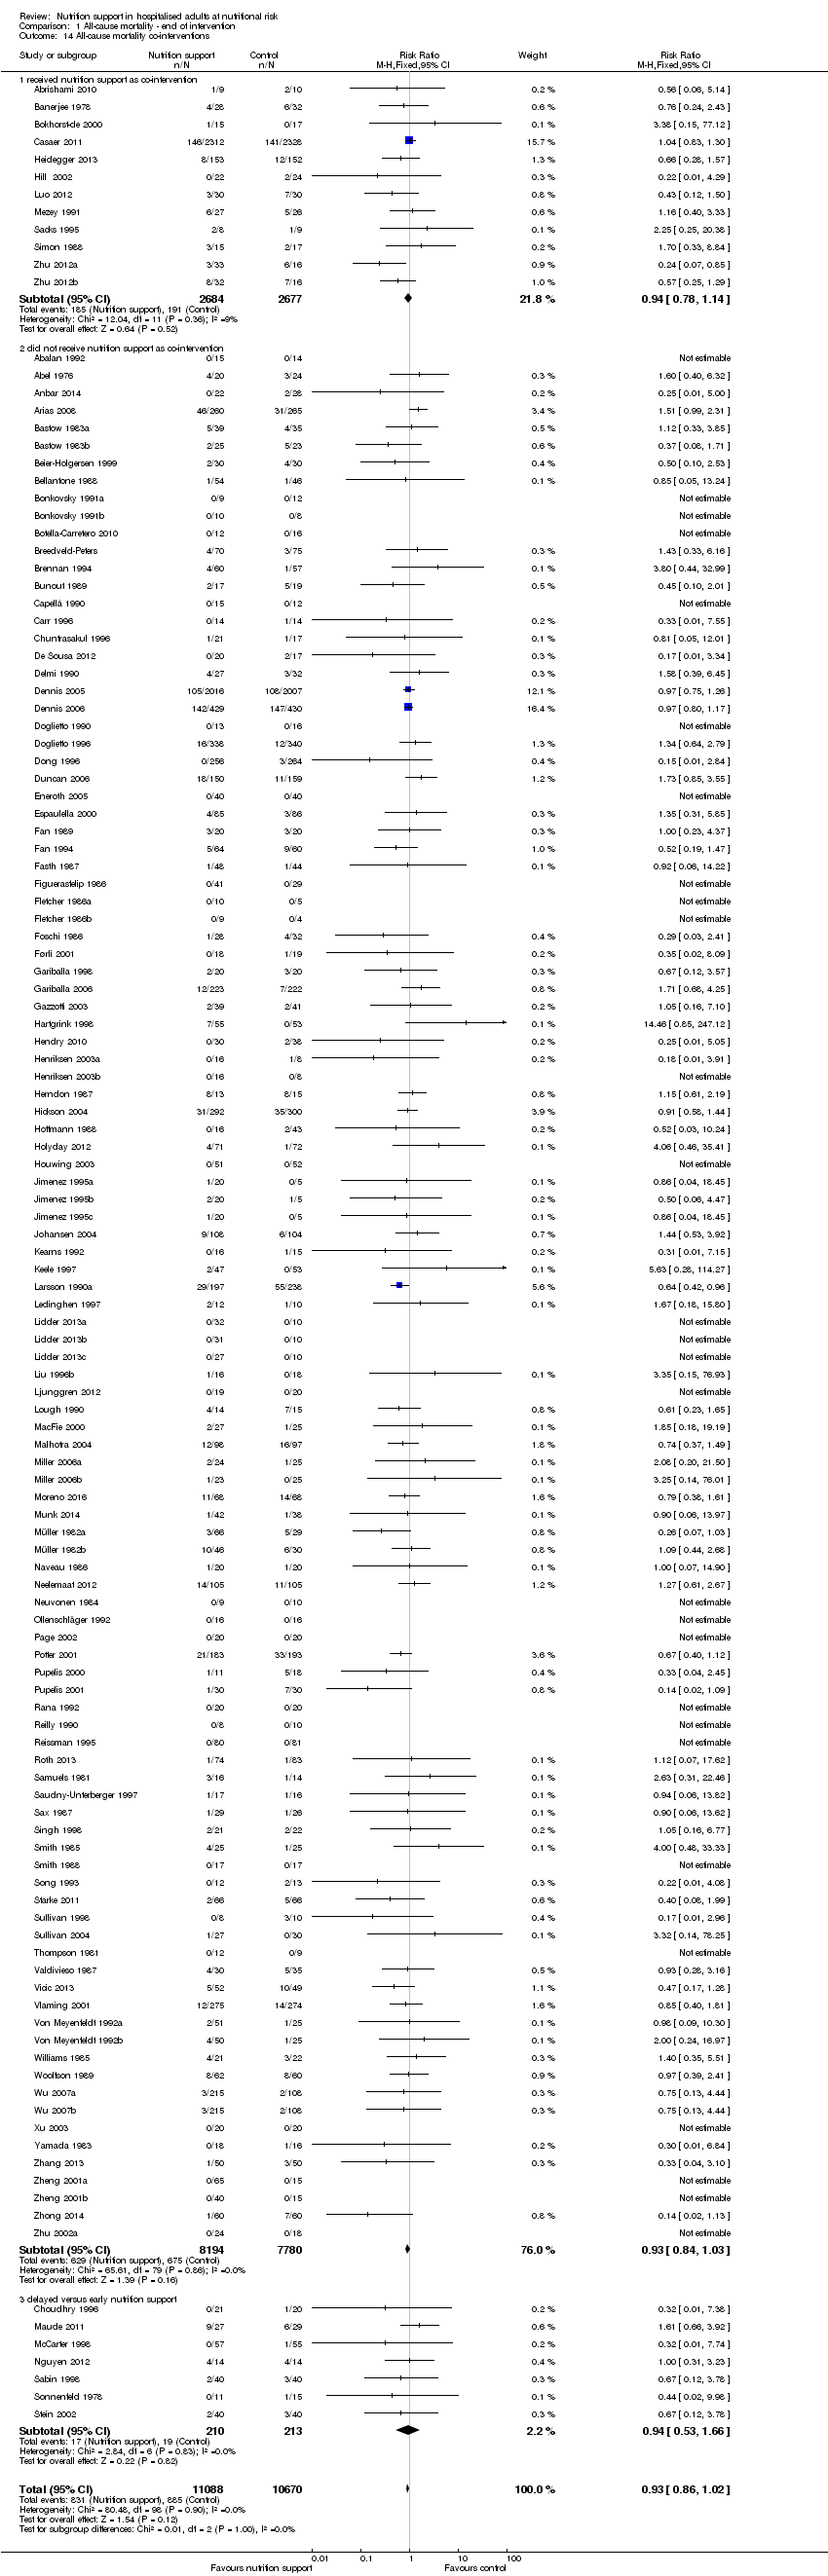 Comparison 1 All‐cause mortality ‐ end of intervention, Outcome 14 All‐cause mortality co‐interventions. | ||||
| 14.1 received nutrition support as co‐intervention | 12 | 5361 | Risk Ratio (M‐H, Fixed, 95% CI) | 0.94 [0.78, 1.14] |
| 14.2 did not receive nutrition support as co‐intervention | 108 | 15974 | Risk Ratio (M‐H, Fixed, 95% CI) | 0.93 [0.84, 1.03] |
| 14.3 delayed versus early nutrition support | 7 | 423 | Risk Ratio (M‐H, Fixed, 95% CI) | 0.94 [0.53, 1.66] |
| Outcome or subgroup title | No. of studies | No. of participants | Statistical method | Effect size |
| 1 All‐cause mortality ‐ overall Show forest plot | 141 | 23170 | Risk Ratio (M‐H, Random, 95% CI) | 0.93 [0.88, 0.99] |
| Analysis 2.1  Comparison 2 All‐cause mortality ‐ maximum follow‐up, Outcome 1 All‐cause mortality ‐ overall. | ||||
| 2 All‐cause mortality ‐ bias Show forest plot | 141 | 23170 | Risk Ratio (M‐H, Random, 95% CI) | 0.93 [0.88, 0.99] |
| Analysis 2.2  Comparison 2 All‐cause mortality ‐ maximum follow‐up, Outcome 2 All‐cause mortality ‐ bias. | ||||
| 2.1 High risk of bias | 141 | 23170 | Risk Ratio (M‐H, Random, 95% CI) | 0.93 [0.88, 0.99] |
| 2.2 Low risk of bias | 0 | 0 | Risk Ratio (M‐H, Random, 95% CI) | 0.0 [0.0, 0.0] |
| 3 All‐cause mortality ‐ mode of delivery Show forest plot | 141 | 23170 | Risk Ratio (M‐H, Random, 95% CI) | 0.93 [0.88, 0.99] |
| Analysis 2.3 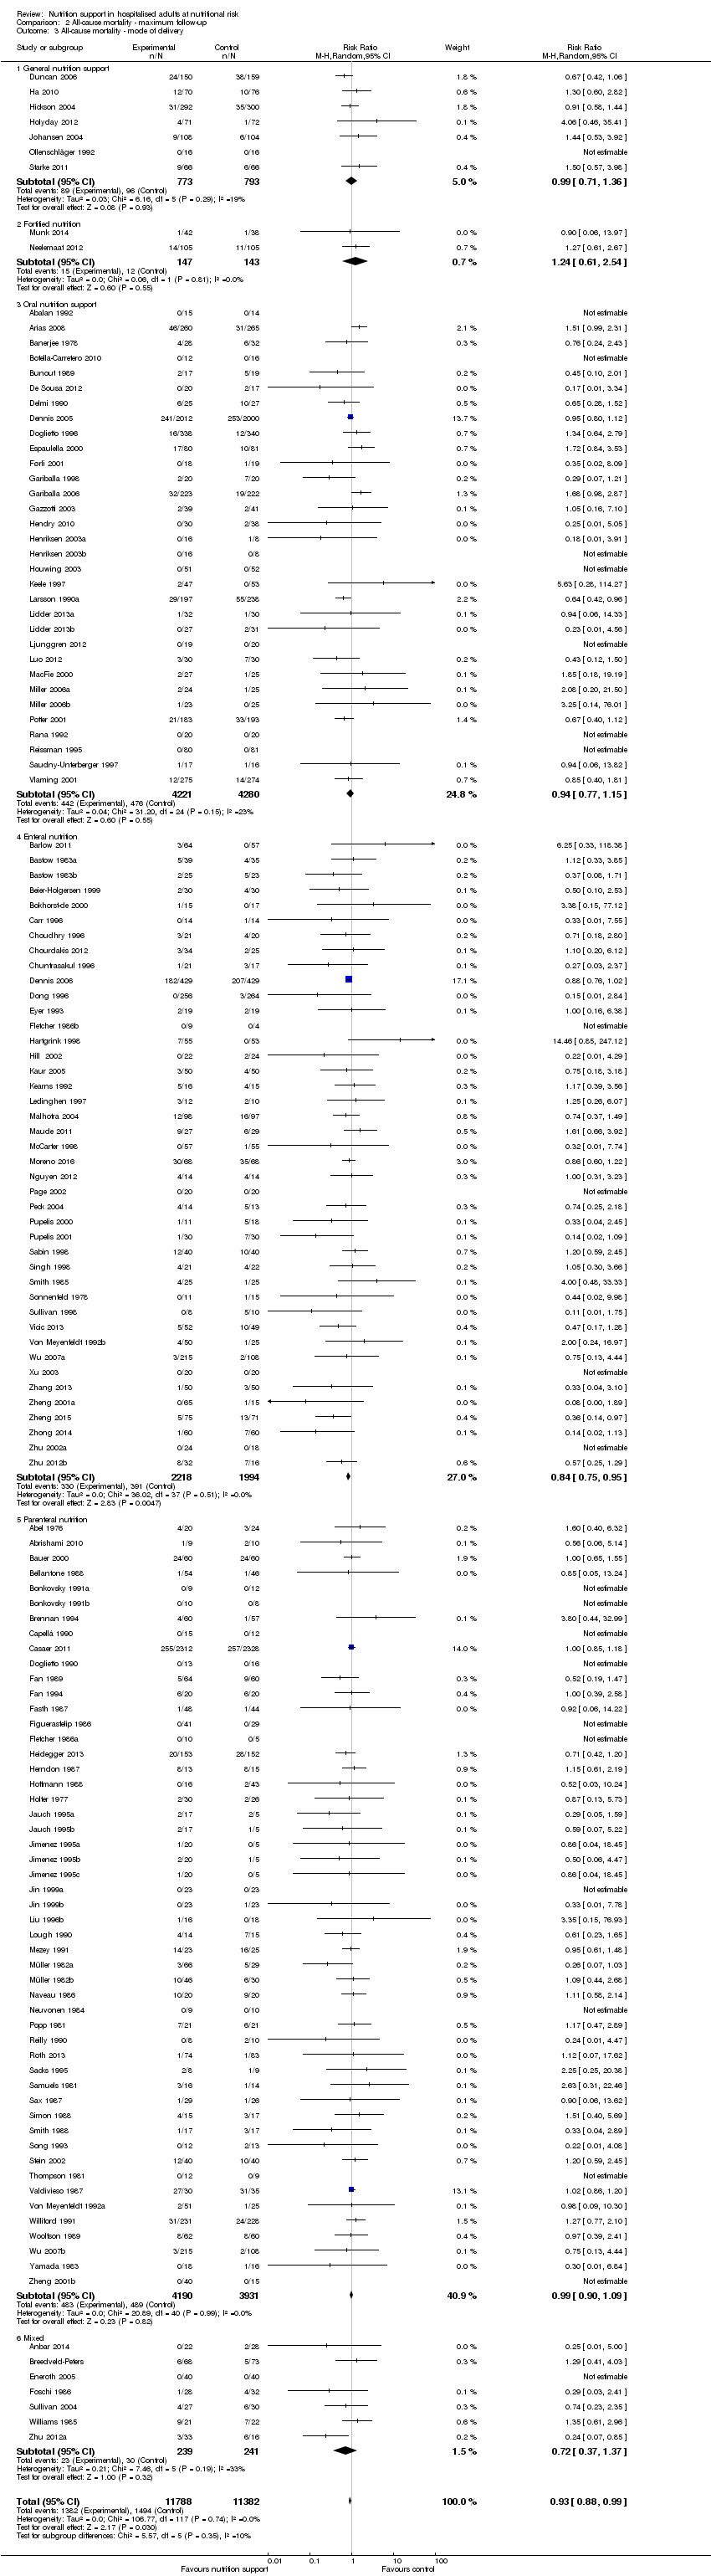 Comparison 2 All‐cause mortality ‐ maximum follow‐up, Outcome 3 All‐cause mortality ‐ mode of delivery. | ||||
| 3.1 General nutrition support | 7 | 1566 | Risk Ratio (M‐H, Random, 95% CI) | 0.99 [0.71, 1.36] |
| 3.2 Fortified nutrition | 2 | 290 | Risk Ratio (M‐H, Random, 95% CI) | 1.24 [0.61, 2.54] |
| 3.3 Oral nutrition support | 32 | 8501 | Risk Ratio (M‐H, Random, 95% CI) | 0.94 [0.77, 1.15] |
| 3.4 Enteral nutrition | 42 | 4212 | Risk Ratio (M‐H, Random, 95% CI) | 0.84 [0.75, 0.95] |
| 3.5 Parenteral nutrition | 51 | 8121 | Risk Ratio (M‐H, Random, 95% CI) | 0.99 [0.90, 1.09] |
| 3.6 Mixed | 7 | 480 | Risk Ratio (M‐H, Random, 95% CI) | 0.72 [0.37, 1.37] |
| 4 All‐cause mortality ‐ medical specialty Show forest plot | 141 | 23170 | Risk Ratio (M‐H, Random, 95% CI) | 0.93 [0.88, 0.99] |
| Analysis 2.4  Comparison 2 All‐cause mortality ‐ maximum follow‐up, Outcome 4 All‐cause mortality ‐ medical specialty. | ||||
| 4.1 Cardiology | 0 | 0 | Risk Ratio (M‐H, Random, 95% CI) | 0.0 [0.0, 0.0] |
| 4.2 Medical gastro‐enterology and hepatology | 13 | 622 | Risk Ratio (M‐H, Random, 95% CI) | 0.96 [0.77, 1.19] |
| 4.3 Geriatrics | 13 | 2547 | Risk Ratio (M‐H, Random, 95% CI) | 0.88 [0.67, 1.17] |
| 4.4 Pulmonary disease | 3 | 118 | Risk Ratio (M‐H, Random, 95% CI) | 0.44 [0.15, 1.28] |
| 4.5 Endocrinology | 0 | 0 | Risk Ratio (M‐H, Random, 95% CI) | 0.0 [0.0, 0.0] |
| 4.6 Infectious diseases | 1 | 56 | Risk Ratio (M‐H, Random, 95% CI) | 1.61 [0.66, 3.92] |
| 4.7 Rheumatology | 0 | 0 | Risk Ratio (M‐H, Random, 95% CI) | 0.0 [0.0, 0.0] |
| 4.8 Haematology | 0 | 0 | Risk Ratio (M‐H, Random, 95% CI) | 0.0 [0.0, 0.0] |
| 4.9 Nephrology | 0 | 0 | Risk Ratio (M‐H, Random, 95% CI) | 0.0 [0.0, 0.0] |
| 4.10 Gastroenterologic surgery | 50 | 4715 | Risk Ratio (M‐H, Random, 95% CI) | 0.89 [0.70, 1.12] |
| 4.11 Trauma surgery | 6 | 249 | Risk Ratio (M‐H, Random, 95% CI) | 0.86 [0.55, 1.34] |
| 4.12 Ortopaedics | 12 | 1196 | Risk Ratio (M‐H, Random, 95% CI) | 1.00 [0.61, 1.62] |
| 4.13 Plastic, reconstructive, and aesthetic surgery | 0 | 0 | Risk Ratio (M‐H, Random, 95% CI) | 0.0 [0.0, 0.0] |
| 4.14 Vascular surgery | 2 | 28 | Risk Ratio (M‐H, Random, 95% CI) | 0.0 [0.0, 0.0] |
| 4.15 Transplant surgery | 3 | 84 | Risk Ratio (M‐H, Random, 95% CI) | 0.54 [0.22, 1.31] |
| 4.16 Urology | 0 | 0 | Risk Ratio (M‐H, Random, 95% CI) | 0.0 [0.0, 0.0] |
| 4.17 Thoracic surgery | 3 | 592 | Risk Ratio (M‐H, Random, 95% CI) | 0.71 [0.16, 3.22] |
| 4.18 Neurological surgery | 0 | 0 | Risk Ratio (M‐H, Random, 95% CI) | 0.0 [0.0, 0.0] |
| 4.19 Oro‐maxillo‐facial surgery | 1 | 32 | Risk Ratio (M‐H, Random, 95% CI) | 3.38 [0.15, 77.12] |
| 4.20 Anaesthesiology | 0 | 0 | Risk Ratio (M‐H, Random, 95% CI) | 0.0 [0.0, 0.0] |
| 4.21 Emergency medicine | 11 | 5421 | Risk Ratio (M‐H, Random, 95% CI) | 0.97 [0.85, 1.12] |
| 4.22 Psychiatry | 0 | 0 | Risk Ratio (M‐H, Random, 95% CI) | 0.0 [0.0, 0.0] |
| 4.23 Neurology | 9 | 5448 | Risk Ratio (M‐H, Random, 95% CI) | 0.77 [0.59, 0.99] |
| 4.24 Oncology | 7 | 411 | Risk Ratio (M‐H, Random, 95% CI) | 1.03 [0.87, 1.21] |
| 4.25 Dermatology | 0 | 0 | Risk Ratio (M‐H, Random, 95% CI) | 0.0 [0.0, 0.0] |
| 4.26 Gynaecology | 0 | 0 | Risk Ratio (M‐H, Random, 95% CI) | 0.0 [0.0, 0.0] |
| 4.27 Mixed | 7 | 1651 | Risk Ratio (M‐H, Random, 95% CI) | 1.28 [0.94, 1.75] |
| 5 All‐cause mortality ‐ based on adequacy of the amount of calories Show forest plot | 141 | 23170 | Risk Ratio (M‐H, Random, 95% CI) | 0.93 [0.88, 0.99] |
| Analysis 2.5  Comparison 2 All‐cause mortality ‐ maximum follow‐up, Outcome 5 All‐cause mortality ‐ based on adequacy of the amount of calories. | ||||
| 5.1 Clearly adequate in intervention and clearly inadequate in control | 28 | 7589 | Risk Ratio (M‐H, Random, 95% CI) | 0.98 [0.88, 1.09] |
| 5.2 Inadequate in the experimental or adequate in the control | 27 | 6824 | Risk Ratio (M‐H, Random, 95% CI) | 0.95 [0.82, 1.10] |
| 5.3 Experimental group is overfed | 10 | 974 | Risk Ratio (M‐H, Random, 95% CI) | 0.98 [0.69, 1.41] |
| 5.4 Unclear intake in control or experimental | 76 | 7783 | Risk Ratio (M‐H, Random, 95% CI) | 0.89 [0.81, 0.98] |
| 6 All‐cause mortality ‐ different screening tools Show forest plot | 141 | 23170 | Risk Ratio (M‐H, Random, 95% CI) | 0.93 [0.88, 0.99] |
| Analysis 2.6  Comparison 2 All‐cause mortality ‐ maximum follow‐up, Outcome 6 All‐cause mortality ‐ different screening tools. | ||||
| 6.1 NRS 2002 | 4 | 5064 | Risk Ratio (M‐H, Random, 95% CI) | 1.02 [0.87, 1.19] |
| 6.2 MUST | 1 | 146 | Risk Ratio (M‐H, Random, 95% CI) | 1.30 [0.60, 2.82] |
| 6.3 MNA | 2 | 117 | Risk Ratio (M‐H, Random, 95% CI) | 0.61 [0.12, 3.18] |
| 6.4 SGA | 3 | 1171 | Risk Ratio (M‐H, Random, 95% CI) | 1.41 [0.94, 2.10] |
| 6.5 Other means | 131 | 16672 | Risk Ratio (M‐H, Random, 95% CI) | 0.91 [0.85, 0.97] |
| 7 All‐cause mortality ‐ participants characterised as 'at nutritional risk' due to one of the following conditions Show forest plot | 141 | 23170 | Risk Ratio (M‐H, Random, 95% CI) | 0.93 [0.88, 0.99] |
| Analysis 2.7 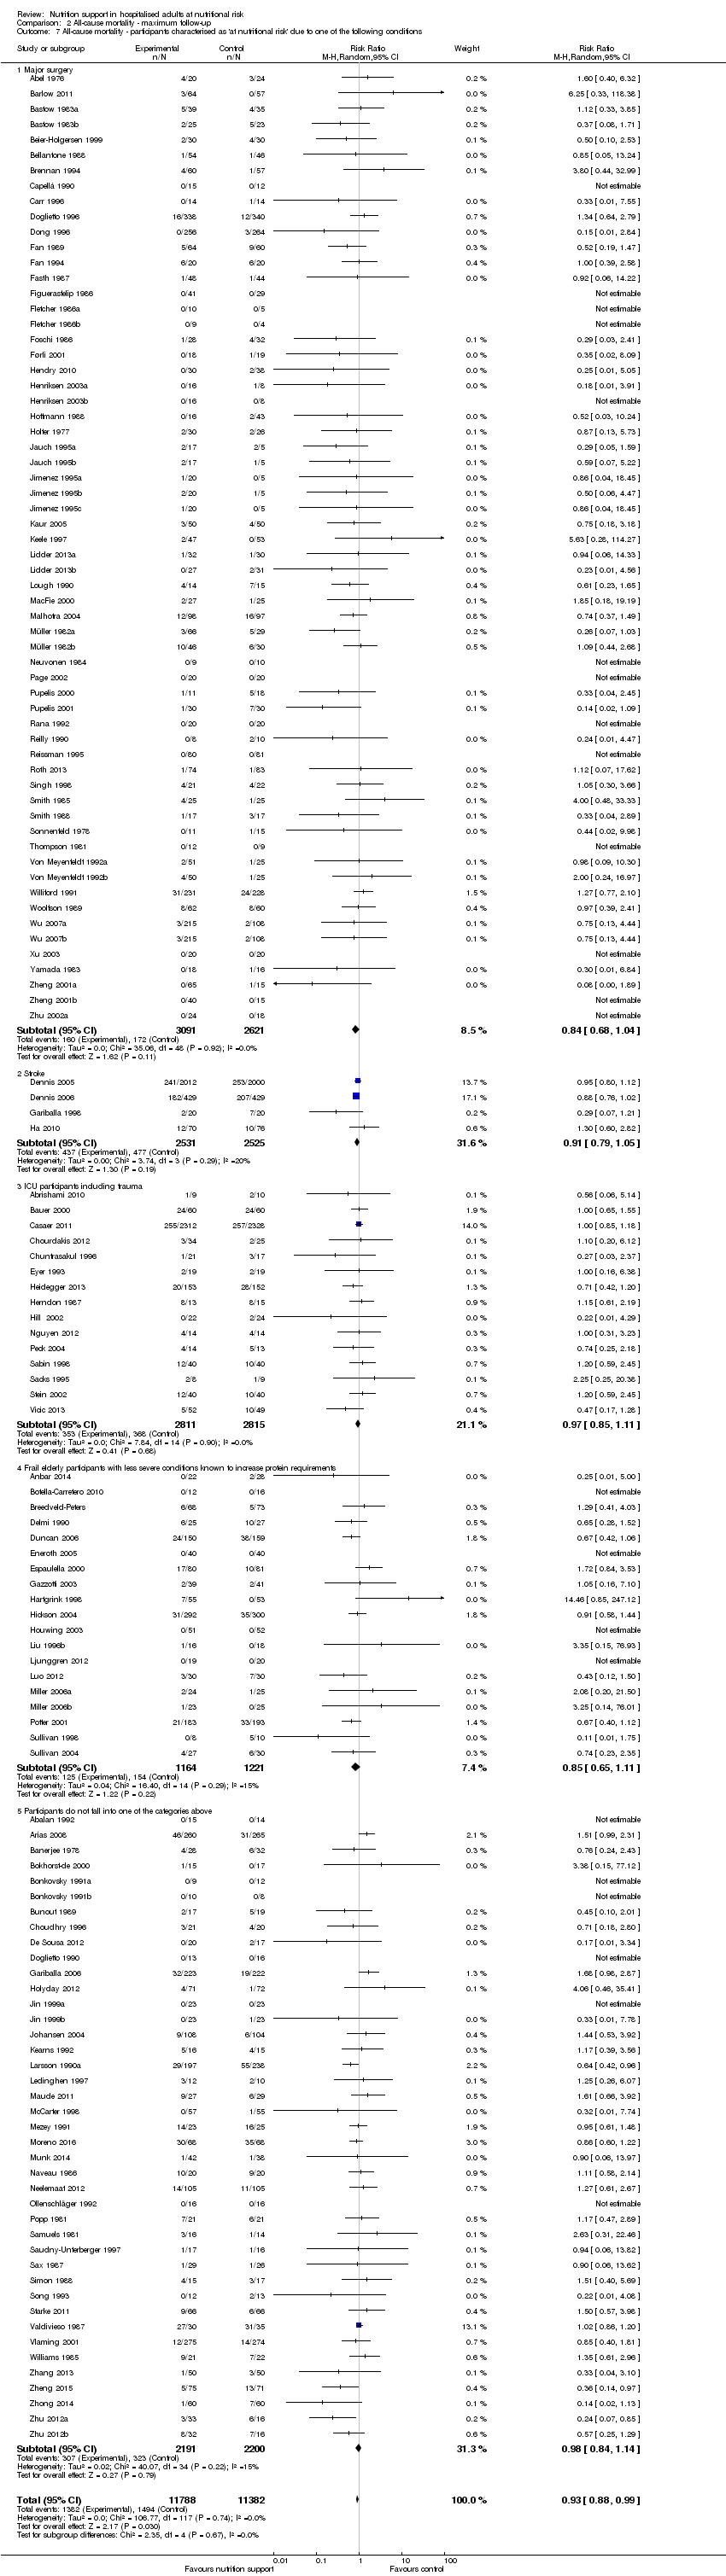 Comparison 2 All‐cause mortality ‐ maximum follow‐up, Outcome 7 All‐cause mortality ‐ participants characterised as 'at nutritional risk' due to one of the following conditions. | ||||
| 7.1 Major surgery | 62 | 5712 | Risk Ratio (M‐H, Random, 95% CI) | 0.84 [0.68, 1.04] |
| 7.2 Stroke | 4 | 5056 | Risk Ratio (M‐H, Random, 95% CI) | 0.91 [0.79, 1.05] |
| 7.3 ICU participants including trauma | 15 | 5626 | Risk Ratio (M‐H, Random, 95% CI) | 0.97 [0.85, 1.11] |
| 7.4 Frail elderly participants with less severe conditions known to increase protein requirements | 19 | 2385 | Risk Ratio (M‐H, Random, 95% CI) | 0.85 [0.65, 1.11] |
| 7.5 Participants do not fall into one of the categories above | 41 | 4391 | Risk Ratio (M‐H, Random, 95% CI) | 0.98 [0.84, 1.14] |
| 8 All‐cause mortality ‐ participants characterised as 'at nutritional risk' due to one of the following criteria Show forest plot | 141 | 23170 | Risk Ratio (M‐H, Random, 95% CI) | 0.93 [0.88, 0.99] |
| Analysis 2.8  Comparison 2 All‐cause mortality ‐ maximum follow‐up, Outcome 8 All‐cause mortality ‐ participants characterised as 'at nutritional risk' due to one of the following criteria. | ||||
| 8.1 BMI less than 20.5 kg/m2 | 2 | 247 | Risk Ratio (M‐H, Random, 95% CI) | 1.19 [0.58, 2.45] |
| 8.2 Weight loss of at least 5% during the last three months | 1 | 32 | Risk Ratio (M‐H, Random, 95% CI) | 0.0 [0.0, 0.0] |
| 8.3 Weight loss of at least 10% during the last six months | 3 | 124 | Risk Ratio (M‐H, Random, 95% CI) | 1.07 [0.11, 10.33] |
| 8.4 Insufficient food intake during the last week (50% of requirements or less) | 0 | 0 | Risk Ratio (M‐H, Random, 95% CI) | 0.0 [0.0, 0.0] |
| 8.5 Participants characterised as 'at nutritional risk' by other means | 135 | 22767 | Risk Ratio (M‐H, Random, 95% CI) | 0.93 [0.88, 0.99] |
| 9 All‐cause mortality ‐ participants characterised as 'at nutritional risk' due to biomarkers or anthropometrics Show forest plot | 141 | 23170 | Risk Ratio (M‐H, Random, 95% CI) | 0.93 [0.88, 0.99] |
| Analysis 2.9 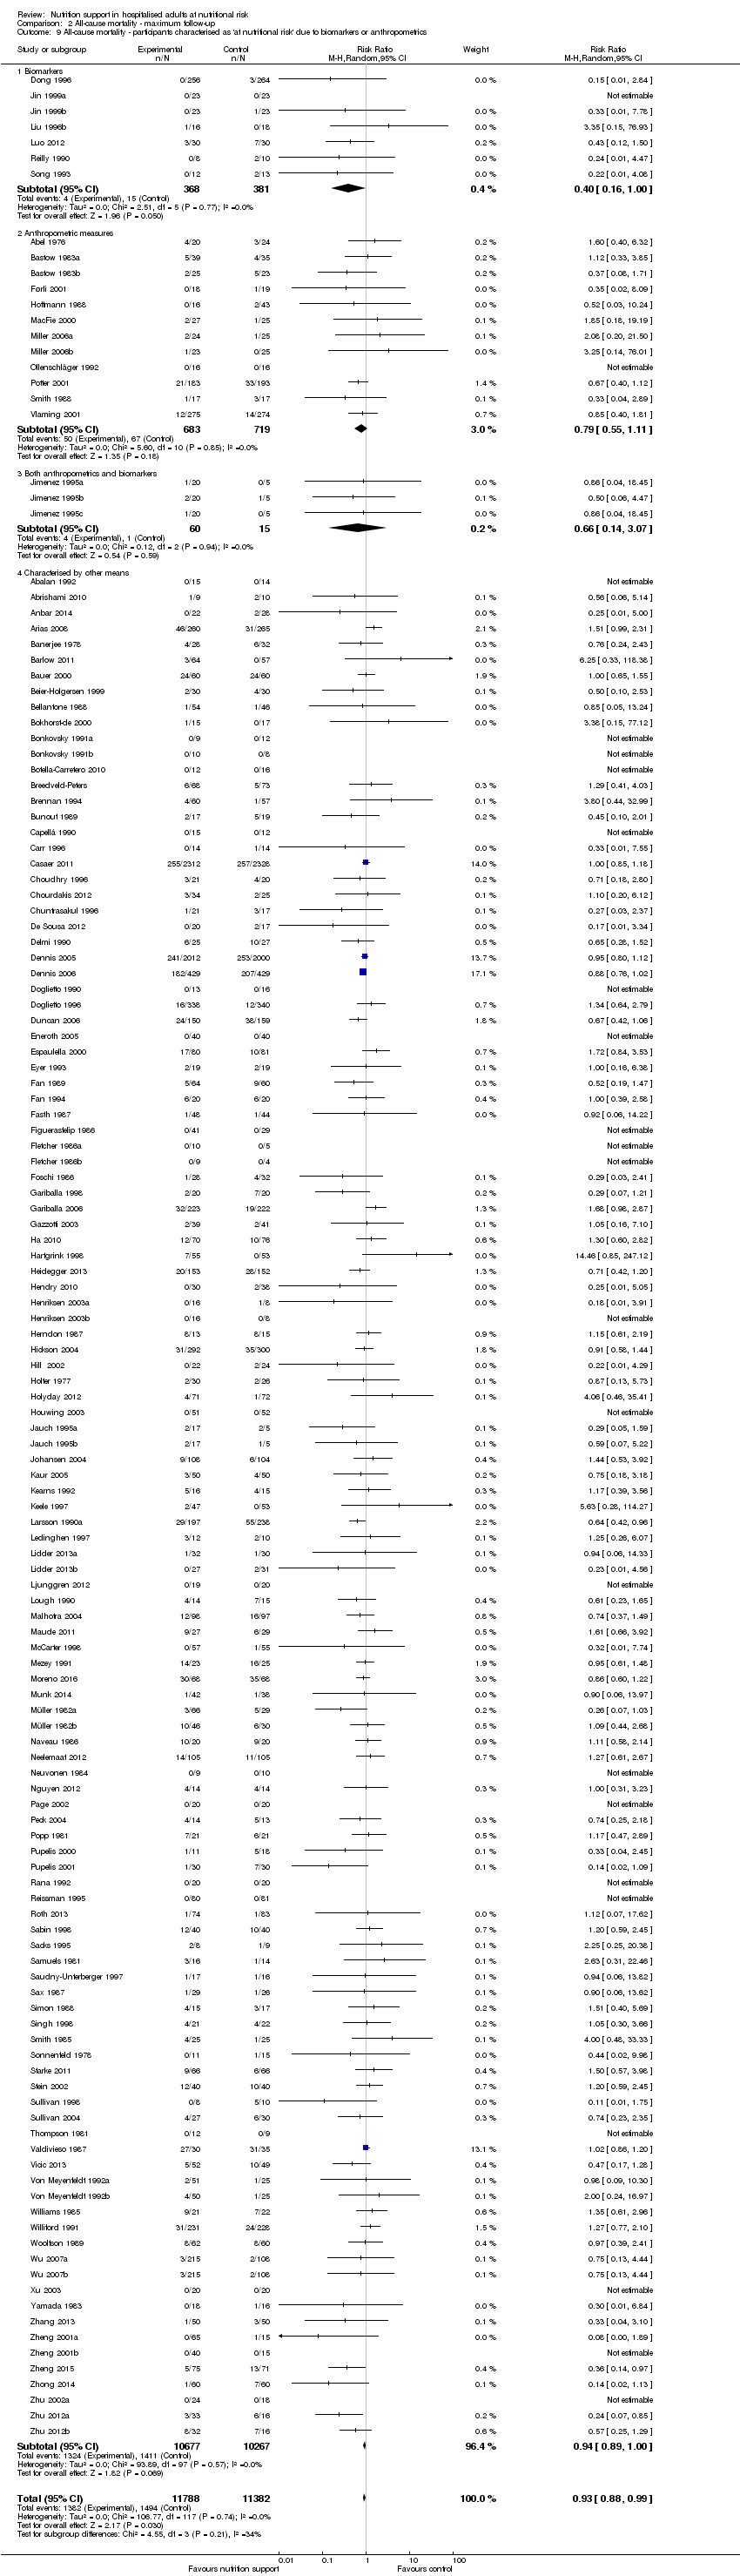 Comparison 2 All‐cause mortality ‐ maximum follow‐up, Outcome 9 All‐cause mortality ‐ participants characterised as 'at nutritional risk' due to biomarkers or anthropometrics. | ||||
| 9.1 Biomarkers | 7 | 749 | Risk Ratio (M‐H, Random, 95% CI) | 0.40 [0.16, 1.00] |
| 9.2 Anthropometric measures | 12 | 1402 | Risk Ratio (M‐H, Random, 95% CI) | 0.79 [0.55, 1.11] |
| 9.3 Both anthropometrics and biomarkers | 3 | 75 | Risk Ratio (M‐H, Random, 95% CI) | 0.66 [0.14, 3.07] |
| 9.4 Characterised by other means | 119 | 20944 | Risk Ratio (M‐H, Random, 95% CI) | 0.94 [0.89, 1.00] |
| 10 All‐cause mortality ‐ randomisation year Show forest plot | 141 | 23170 | Risk Ratio (M‐H, Random, 95% CI) | 0.93 [0.88, 0.99] |
| Analysis 2.10 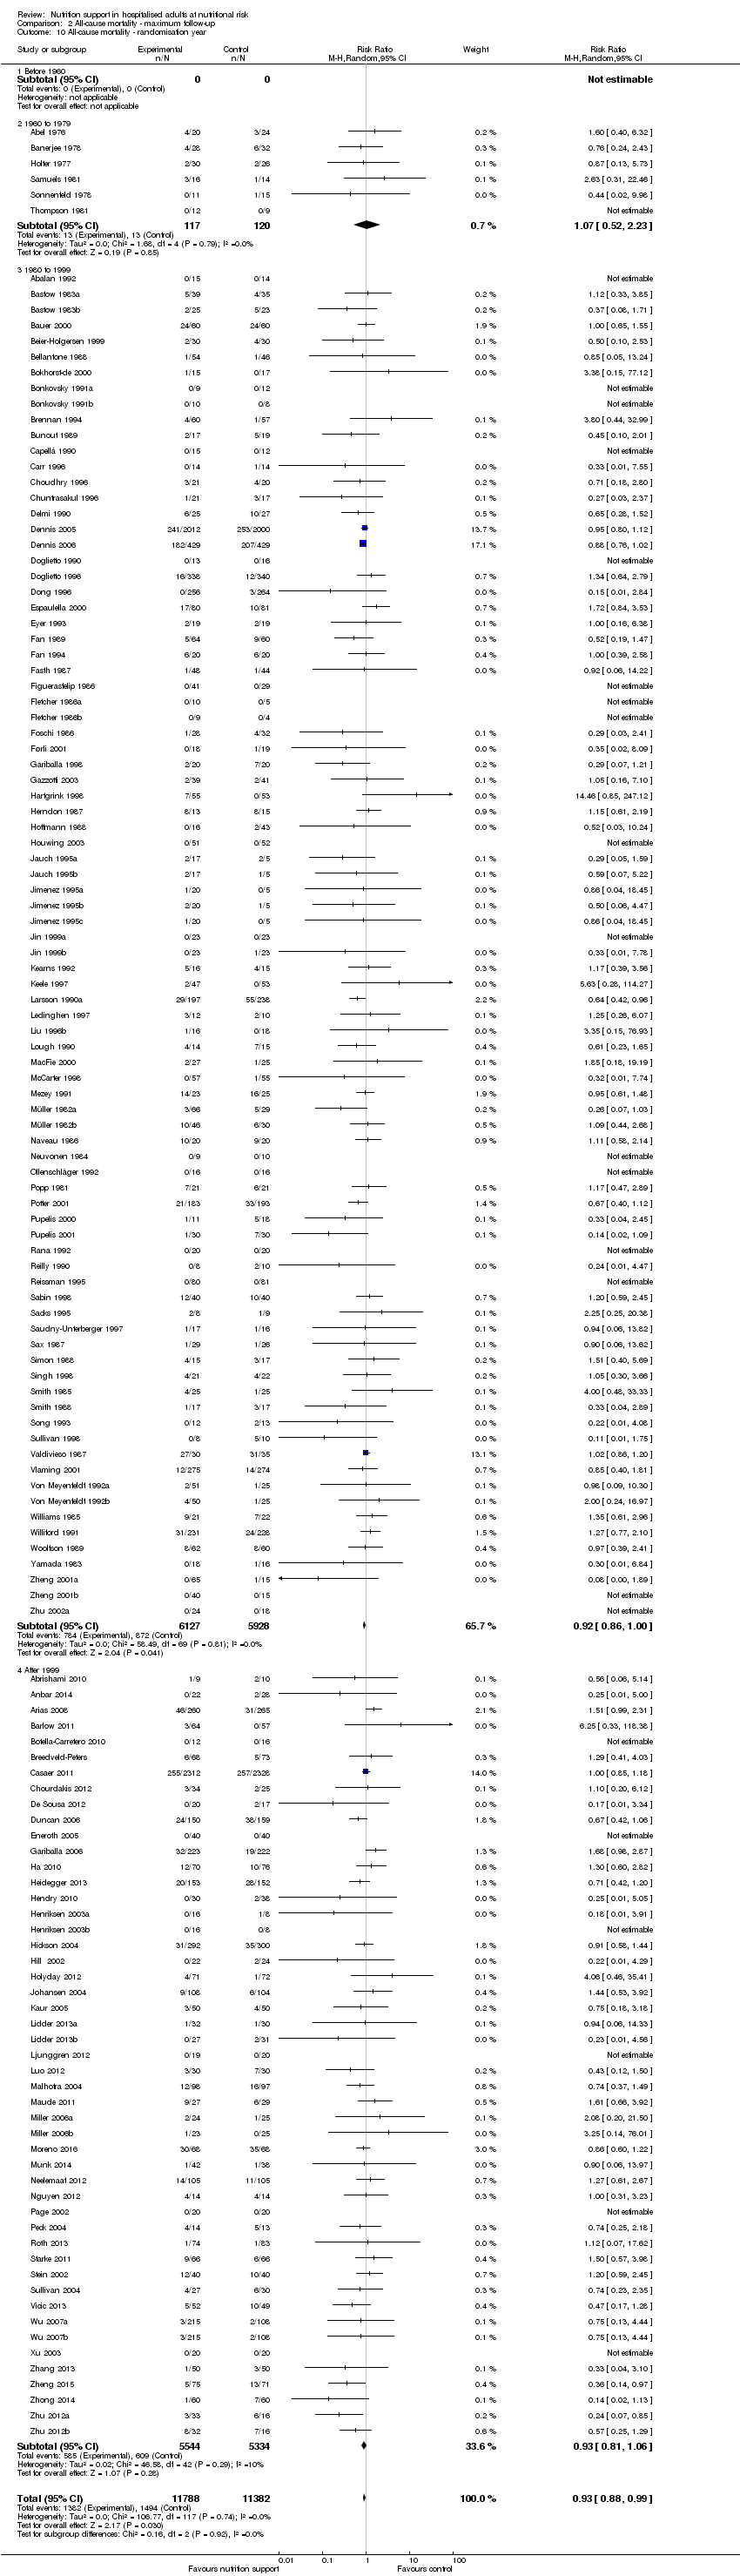 Comparison 2 All‐cause mortality ‐ maximum follow‐up, Outcome 10 All‐cause mortality ‐ randomisation year. | ||||
| 10.1 Before 1960 | 0 | 0 | Risk Ratio (M‐H, Random, 95% CI) | 0.0 [0.0, 0.0] |
| 10.2 1960 to 1979 | 6 | 237 | Risk Ratio (M‐H, Random, 95% CI) | 1.07 [0.52, 2.23] |
| 10.3 1980 to 1999 | 86 | 12055 | Risk Ratio (M‐H, Random, 95% CI) | 0.92 [0.86, 1.00] |
| 10.4 After 1999 | 49 | 10878 | Risk Ratio (M‐H, Random, 95% CI) | 0.93 [0.81, 1.06] |
| 11 All‐cause mortality ‐ trials where the intervention lasts fewer than three days compared with trials where the intervention lasts three days or more Show forest plot | 141 | 23170 | Risk Ratio (M‐H, Random, 95% CI) | 0.93 [0.88, 0.99] |
| Analysis 2.11 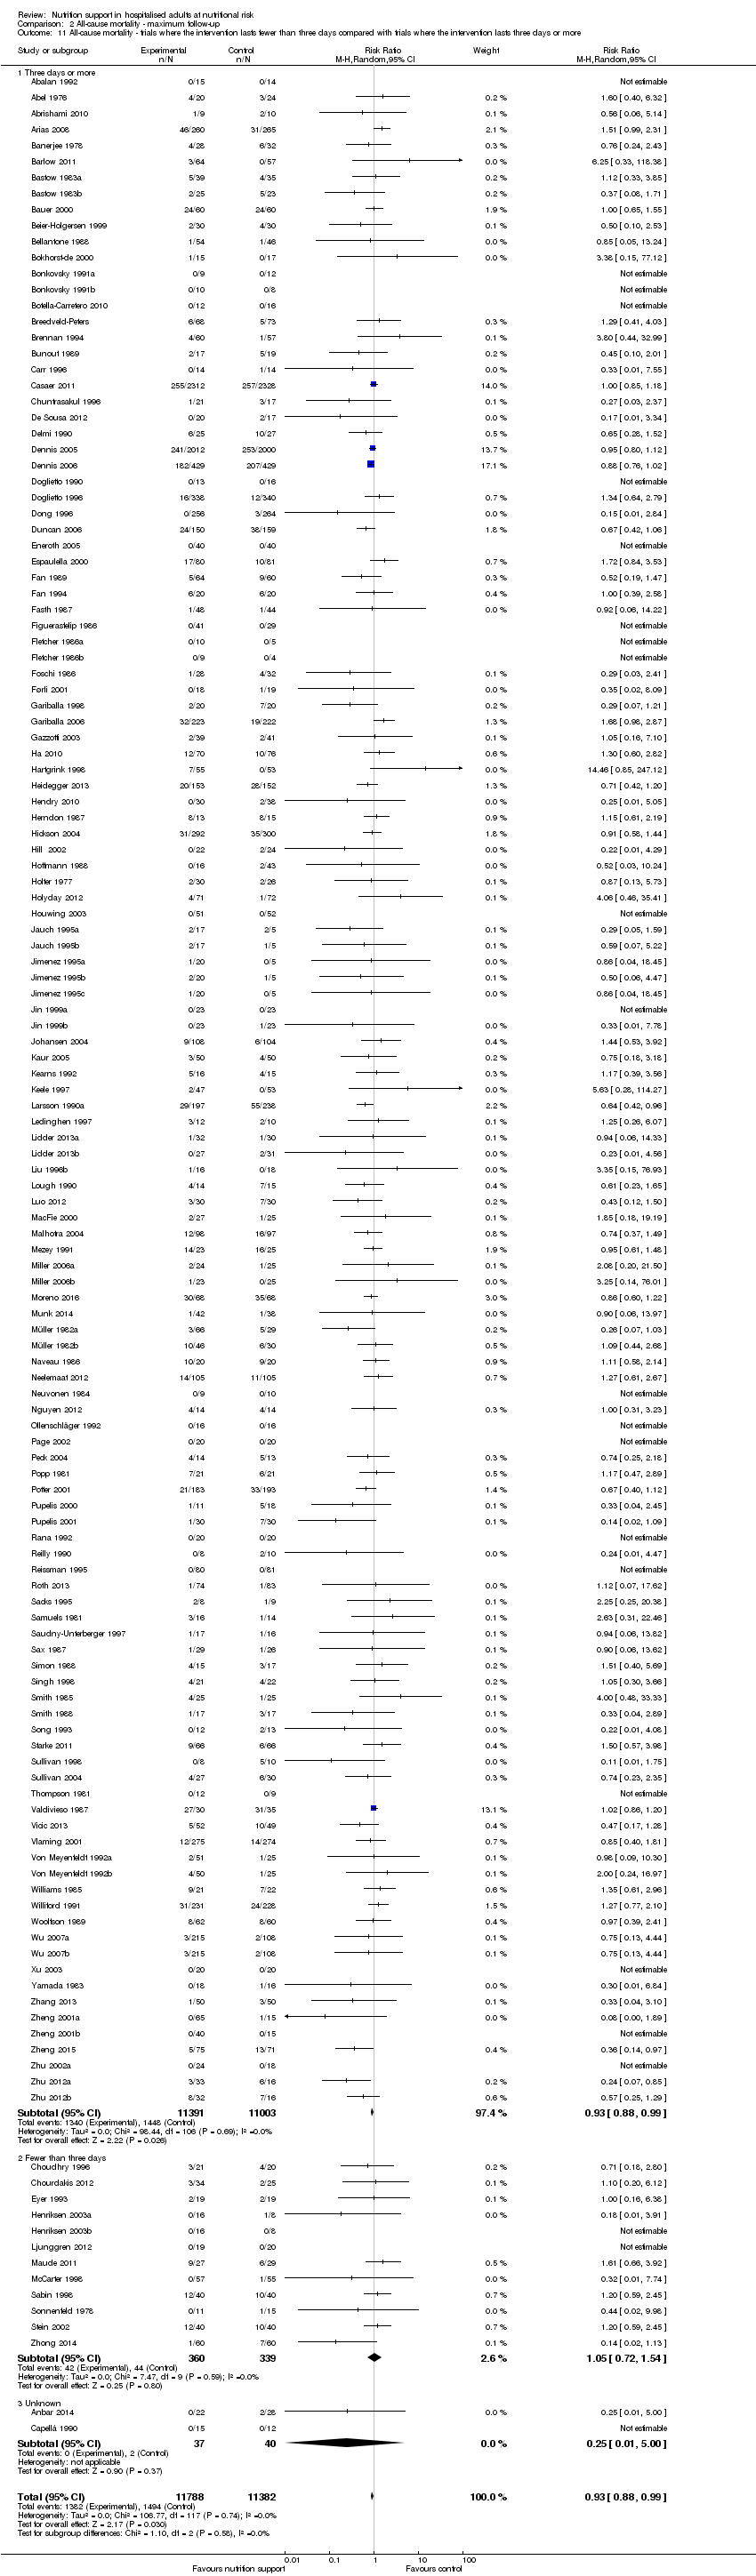 Comparison 2 All‐cause mortality ‐ maximum follow‐up, Outcome 11 All‐cause mortality ‐ trials where the intervention lasts fewer than three days compared with trials where the intervention lasts three days or more. | ||||
| 11.1 Three days or more | 127 | 22394 | Risk Ratio (M‐H, Random, 95% CI) | 0.93 [0.88, 0.99] |
| 11.2 Fewer than three days | 12 | 699 | Risk Ratio (M‐H, Random, 95% CI) | 1.05 [0.72, 1.54] |
| 11.3 Unknown | 2 | 77 | Risk Ratio (M‐H, Random, 95% CI) | 0.25 [0.01, 5.00] |
| 12 All‐cause mortality ‐ 'best‐worst case' scenario Show forest plot | 141 | 23700 | Risk Ratio (M‐H, Random, 95% CI) | 0.77 [0.69, 0.85] |
| Analysis 2.12 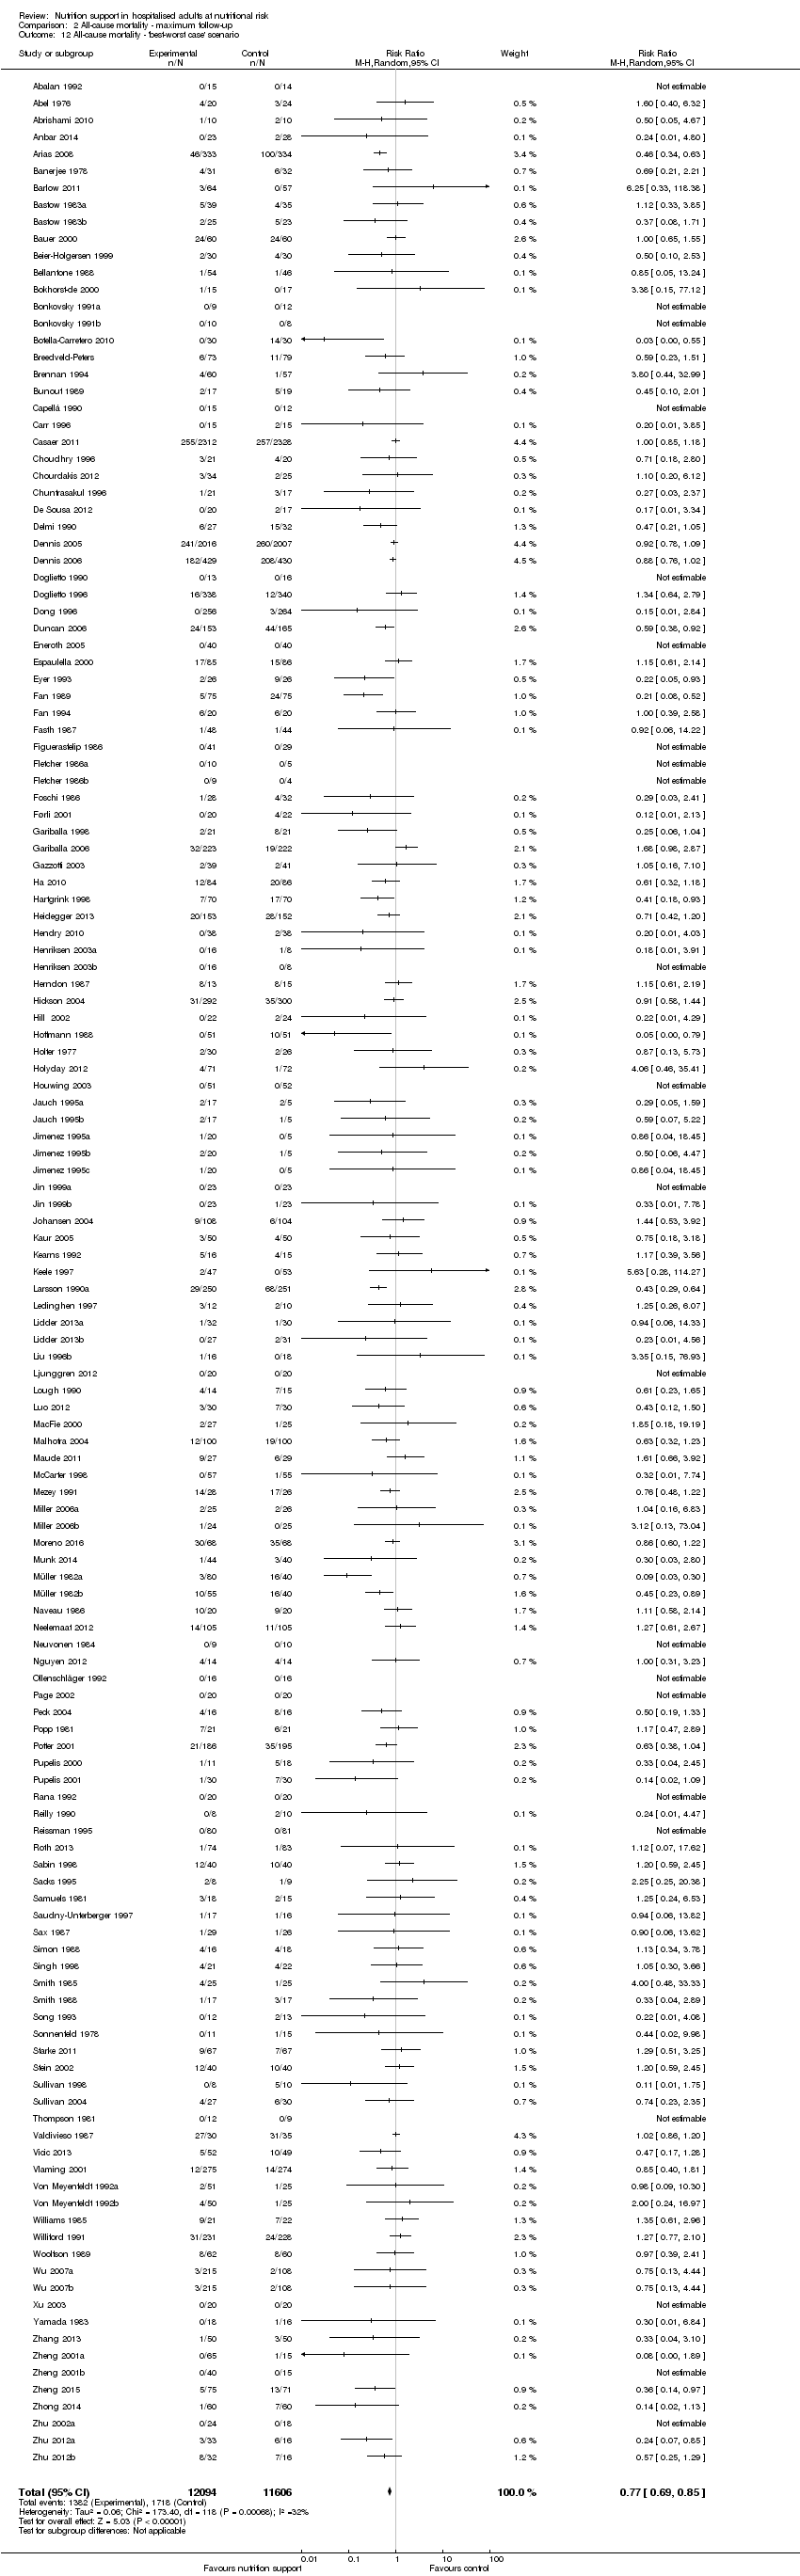 Comparison 2 All‐cause mortality ‐ maximum follow‐up, Outcome 12 All‐cause mortality ‐ 'best‐worst case' scenario. | ||||
| 13 All‐cause mortality ‐ 'worst‐best case' scenario Show forest plot | 141 | 23700 | Risk Ratio (M‐H, Random, 95% CI) | 1.09 [0.98, 1.23] |
| Analysis 2.13  Comparison 2 All‐cause mortality ‐ maximum follow‐up, Outcome 13 All‐cause mortality ‐ 'worst‐best case' scenario. | ||||
| 14 All‐cause mortality co‐interventions Show forest plot | 141 | 23170 | Risk Ratio (M‐H, Fixed, 95% CI) | 0.92 [0.86, 0.98] |
| Analysis 2.14 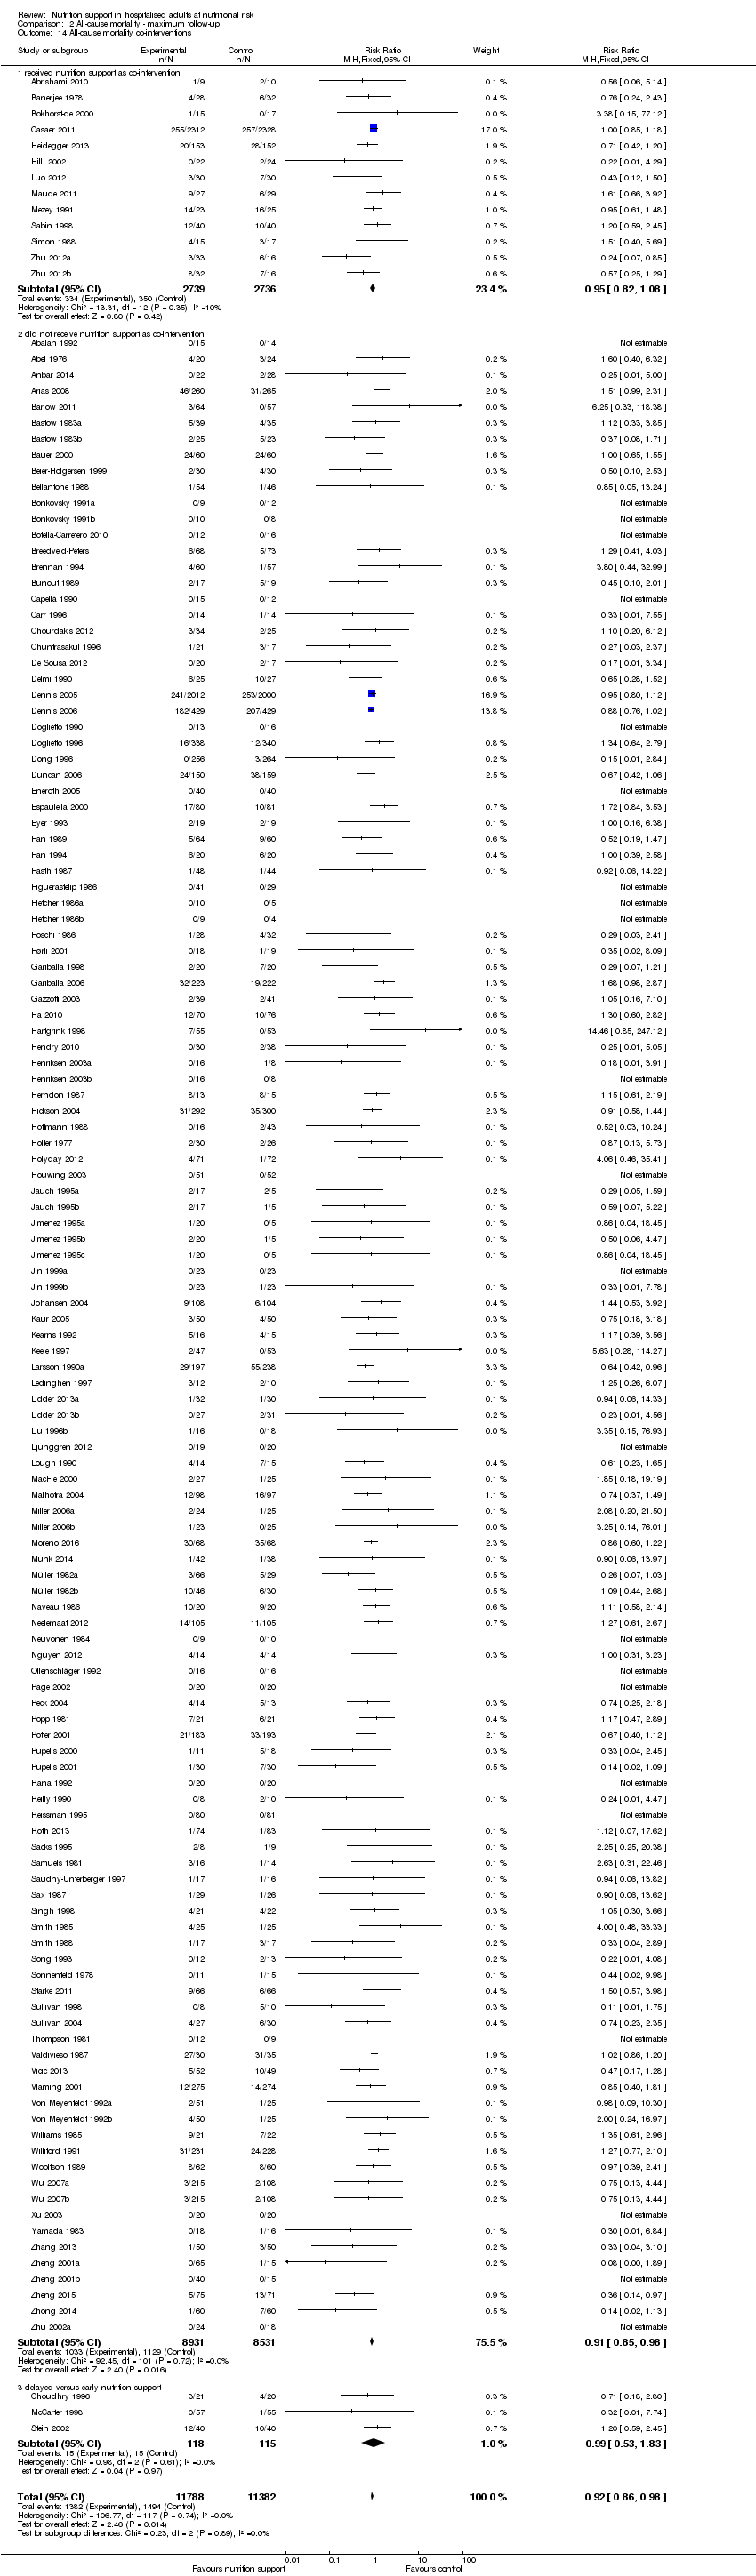 Comparison 2 All‐cause mortality ‐ maximum follow‐up, Outcome 14 All‐cause mortality co‐interventions. | ||||
| 14.1 received nutrition support as co‐intervention | 13 | 5475 | Risk Ratio (M‐H, Fixed, 95% CI) | 0.95 [0.82, 1.08] |
| 14.2 did not receive nutrition support as co‐intervention | 125 | 17462 | Risk Ratio (M‐H, Fixed, 95% CI) | 0.91 [0.85, 0.98] |
| 14.3 delayed versus early nutrition support | 3 | 233 | Risk Ratio (M‐H, Fixed, 95% CI) | 0.99 [0.53, 1.83] |
| Outcome or subgroup title | No. of studies | No. of participants | Statistical method | Effect size |
| 1 Serious adverse events ‐ overall Show forest plot | 137 | 22087 | Risk Ratio (M‐H, Random, 95% CI) | 0.93 [0.86, 1.01] |
| Analysis 3.1  Comparison 3 Serious adverse event end of intervention, Outcome 1 Serious adverse events ‐ overall. | ||||
| 2 Serious adverse events ‐ bias Show forest plot | 137 | 22087 | Risk Ratio (M‐H, Random, 95% CI) | 0.93 [0.86, 1.01] |
| Analysis 3.2  Comparison 3 Serious adverse event end of intervention, Outcome 2 Serious adverse events ‐ bias. | ||||
| 2.1 High risk of bias | 137 | 22087 | Risk Ratio (M‐H, Random, 95% CI) | 0.93 [0.86, 1.01] |
| 2.2 Low risk of bias | 0 | 0 | Risk Ratio (M‐H, Random, 95% CI) | 0.0 [0.0, 0.0] |
| 3 Serious adverse events ‐ mode of delivery Show forest plot | 137 | 22087 | Risk Ratio (M‐H, Random, 95% CI) | 0.93 [0.86, 1.01] |
| Analysis 3.3  Comparison 3 Serious adverse event end of intervention, Outcome 3 Serious adverse events ‐ mode of delivery. | ||||
| 3.1 General nutrition support | 6 | 1420 | Risk Ratio (M‐H, Random, 95% CI) | 1.19 [0.79, 1.78] |
| 3.2 Fortified | 2 | 290 | Risk Ratio (M‐H, Random, 95% CI) | 1.24 [0.61, 2.54] |
| 3.3 Oral | 33 | 8569 | Risk Ratio (M‐H, Random, 95% CI) | 0.92 [0.79, 1.06] |
| 3.4 Enteral | 43 | 3935 | Risk Ratio (M‐H, Random, 95% CI) | 0.85 [0.74, 0.98] |
| 3.5 Parenteral | 48 | 7519 | Risk Ratio (M‐H, Random, 95% CI) | 0.98 [0.85, 1.14] |
| 3.6 Mixed | 5 | 354 | Risk Ratio (M‐H, Random, 95% CI) | 0.77 [0.33, 1.76] |
| 4 Serious adverse events ‐ by medical specialty Show forest plot | 137 | 22087 | Risk Ratio (M‐H, Random, 95% CI) | 0.93 [0.86, 1.01] |
| Analysis 3.4 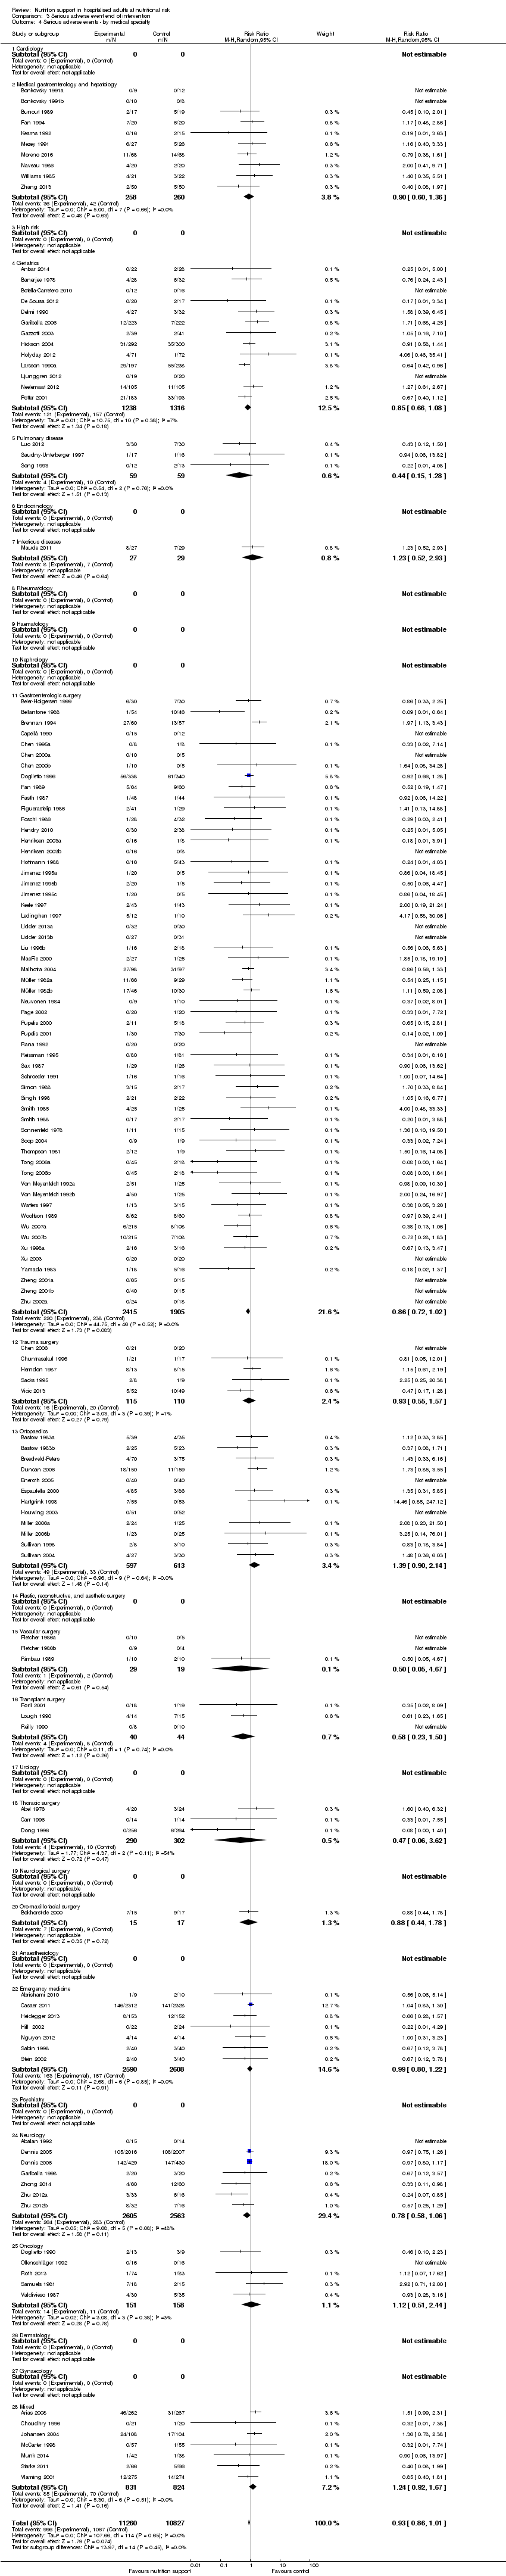 Comparison 3 Serious adverse event end of intervention, Outcome 4 Serious adverse events ‐ by medical specialty. | ||||
| 4.1 Cardiology | 0 | 0 | Risk Ratio (M‐H, Random, 95% CI) | 0.0 [0.0, 0.0] |
| 4.2 Medical gastroenterology and hepatology | 10 | 518 | Risk Ratio (M‐H, Random, 95% CI) | 0.90 [0.60, 1.36] |
| 4.3 High risk | 0 | 0 | Risk Ratio (M‐H, Random, 95% CI) | 0.0 [0.0, 0.0] |
| 4.4 Geriatrics | 13 | 2554 | Risk Ratio (M‐H, Random, 95% CI) | 0.85 [0.66, 1.08] |
| 4.5 Pulmonary disease | 3 | 118 | Risk Ratio (M‐H, Random, 95% CI) | 0.44 [0.15, 1.28] |
| 4.6 Endocrinology | 0 | 0 | Risk Ratio (M‐H, Random, 95% CI) | 0.0 [0.0, 0.0] |
| 4.7 Infectious diseases | 1 | 56 | Risk Ratio (M‐H, Random, 95% CI) | 1.23 [0.52, 2.93] |
| 4.8 Rheumatology | 0 | 0 | Risk Ratio (M‐H, Random, 95% CI) | 0.0 [0.0, 0.0] |
| 4.9 Haematology | 0 | 0 | Risk Ratio (M‐H, Random, 95% CI) | 0.0 [0.0, 0.0] |
| 4.10 Nephrology | 0 | 0 | Risk Ratio (M‐H, Random, 95% CI) | 0.0 [0.0, 0.0] |
| 4.11 Gastroenterologic surgery | 57 | 4320 | Risk Ratio (M‐H, Random, 95% CI) | 0.86 [0.72, 1.02] |
| 4.12 Trauma surgery | 5 | 225 | Risk Ratio (M‐H, Random, 95% CI) | 0.93 [0.55, 1.57] |
| 4.13 Ortopaedics | 12 | 1210 | Risk Ratio (M‐H, Random, 95% CI) | 1.39 [0.90, 2.14] |
| 4.14 Plastic, reconstructive, and aesthetic surgery | 0 | 0 | Risk Ratio (M‐H, Random, 95% CI) | 0.0 [0.0, 0.0] |
| 4.15 Vascular surgery | 3 | 48 | Risk Ratio (M‐H, Random, 95% CI) | 0.5 [0.05, 4.67] |
| 4.16 Transplant surgery | 3 | 84 | Risk Ratio (M‐H, Random, 95% CI) | 0.58 [0.23, 1.50] |
| 4.17 Urology | 0 | 0 | Risk Ratio (M‐H, Random, 95% CI) | 0.0 [0.0, 0.0] |
| 4.18 Thoracic surgery | 3 | 592 | Risk Ratio (M‐H, Random, 95% CI) | 0.47 [0.06, 3.62] |
| 4.19 Neurological surgery | 0 | 0 | Risk Ratio (M‐H, Random, 95% CI) | 0.0 [0.0, 0.0] |
| 4.20 Oro‐maxillo‐facial surgery | 1 | 32 | Risk Ratio (M‐H, Random, 95% CI) | 0.88 [0.44, 1.78] |
| 4.21 Anaesthesiology | 0 | 0 | Risk Ratio (M‐H, Random, 95% CI) | 0.0 [0.0, 0.0] |
| 4.22 Emergency medicine | 7 | 5198 | Risk Ratio (M‐H, Random, 95% CI) | 0.99 [0.80, 1.22] |
| 4.23 Psychiatry | 0 | 0 | Risk Ratio (M‐H, Random, 95% CI) | 0.0 [0.0, 0.0] |
| 4.24 Neurology | 7 | 5168 | Risk Ratio (M‐H, Random, 95% CI) | 0.78 [0.58, 1.06] |
| 4.25 Oncology | 5 | 309 | Risk Ratio (M‐H, Random, 95% CI) | 1.12 [0.51, 2.44] |
| 4.26 Dermatology | 0 | 0 | Risk Ratio (M‐H, Random, 95% CI) | 0.0 [0.0, 0.0] |
| 4.27 Gynaecology | 0 | 0 | Risk Ratio (M‐H, Random, 95% CI) | 0.0 [0.0, 0.0] |
| 4.28 Mixed | 7 | 1655 | Risk Ratio (M‐H, Random, 95% CI) | 1.24 [0.92, 1.67] |
| 5 Serious adverse events ‐ based on adequacy of the amount of calories Show forest plot | 137 | 22087 | Risk Ratio (M‐H, Random, 95% CI) | 0.93 [0.86, 1.01] |
| Analysis 3.5  Comparison 3 Serious adverse event end of intervention, Outcome 5 Serious adverse events ‐ based on adequacy of the amount of calories. | ||||
| 5.1 Clearly adequate in intervention and clearly inadequate in control | 28 | 7405 | Risk Ratio (M‐H, Random, 95% CI) | 0.95 [0.80, 1.11] |
| 5.2 Inadequate in the experimental or adequate in the control | 28 | 7335 | Risk Ratio (M‐H, Random, 95% CI) | 0.97 [0.84, 1.13] |
| 5.3 Experimental group is overfed | 6 | 224 | Risk Ratio (M‐H, Random, 95% CI) | 0.85 [0.44, 1.67] |
| 5.4 Unclear intake in control or experimental | 75 | 7123 | Risk Ratio (M‐H, Random, 95% CI) | 0.83 [0.70, 0.98] |
| 6 Serious adverse events ‐ different screening tools Show forest plot | 137 | 22087 | Risk Ratio (M‐H, Random, 95% CI) | 0.93 [0.86, 1.01] |
| Analysis 3.6 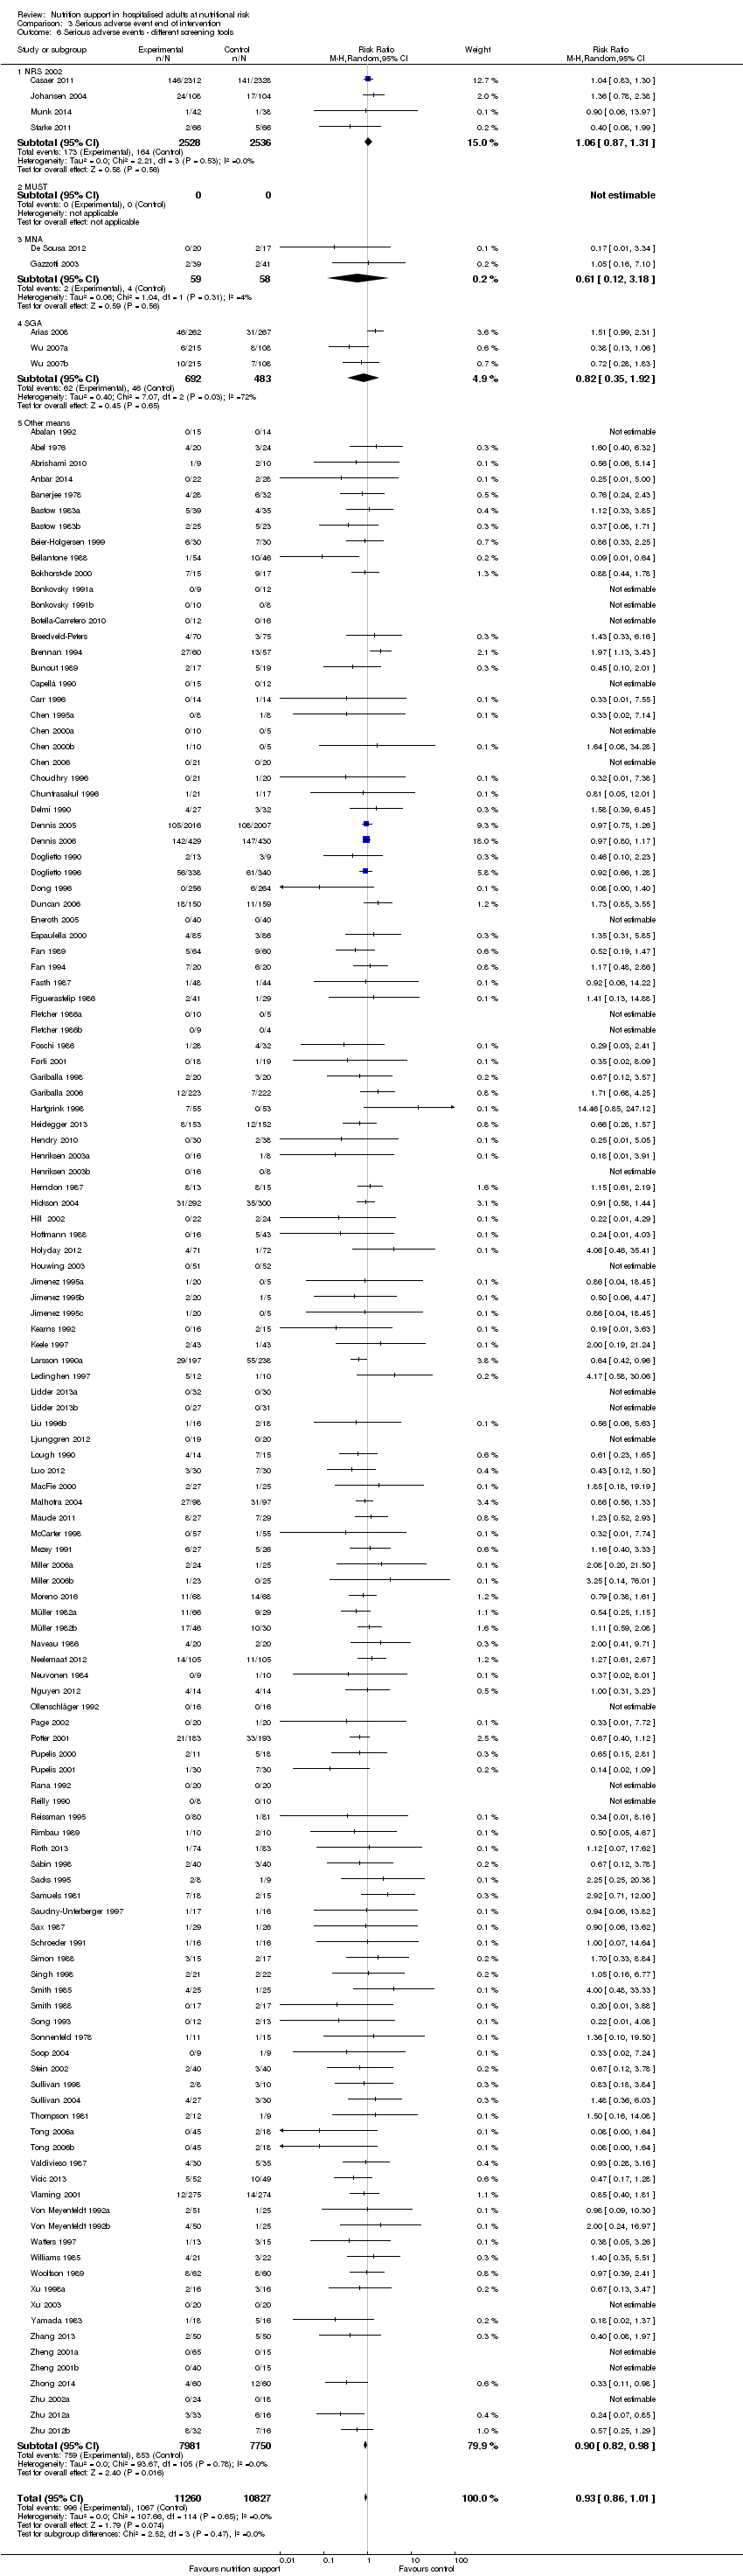 Comparison 3 Serious adverse event end of intervention, Outcome 6 Serious adverse events ‐ different screening tools. | ||||
| 6.1 NRS 2002 | 4 | 5064 | Risk Ratio (M‐H, Random, 95% CI) | 1.06 [0.87, 1.31] |
| 6.2 MUST | 0 | 0 | Risk Ratio (M‐H, Random, 95% CI) | 0.0 [0.0, 0.0] |
| 6.3 MNA | 2 | 117 | Risk Ratio (M‐H, Random, 95% CI) | 0.61 [0.12, 3.18] |
| 6.4 SGA | 3 | 1175 | Risk Ratio (M‐H, Random, 95% CI) | 0.82 [0.35, 1.92] |
| 6.5 Other means | 128 | 15731 | Risk Ratio (M‐H, Random, 95% CI) | 0.90 [0.82, 0.98] |
| 7 Serious adverse events ‐ participants characterised as 'at nutritional risk' due to one of the following conditions Show forest plot | 137 | 22087 | Risk Ratio (M‐H, Random, 95% CI) | 0.93 [0.86, 1.01] |
| Analysis 3.7  Comparison 3 Serious adverse event end of intervention, Outcome 7 Serious adverse events ‐ participants characterised as 'at nutritional risk' due to one of the following conditions. | ||||
| 7.1 Major surgery | 65 | 5180 | Risk Ratio (M‐H, Random, 95% CI) | 0.84 [0.71, 0.99] |
| 7.2 Stroke | 6 | 5139 | Risk Ratio (M‐H, Random, 95% CI) | 0.78 [0.58, 1.06] |
| 7.3 ICU participants including trauma | 12 | 5423 | Risk Ratio (M‐H, Random, 95% CI) | 0.98 [0.81, 1.19] |
| 7.4 Frail elderly participants with less severe conditions known to increase protein requirements | 19 | 2406 | Risk Ratio (M‐H, Random, 95% CI) | 0.97 [0.75, 1.26] |
| 7.5 Participants do not fall into one of the categories above | 35 | 3939 | Risk Ratio (M‐H, Random, 95% CI) | 1.01 [0.85, 1.21] |
| 8 Serious adverse events ‐ participants characterised as 'at nutritional risk' due to one of the following criteria Show forest plot | 137 | 22087 | Risk Ratio (M‐H, Random, 95% CI) | 0.93 [0.86, 1.01] |
| Analysis 3.8  Comparison 3 Serious adverse event end of intervention, Outcome 8 Serious adverse events ‐ participants characterised as 'at nutritional risk' due to one of the following criteria. | ||||
| 8.1 BMI less than 20.5 kg/m2 | 2 | 247 | Risk Ratio (M‐H, Random, 95% CI) | 1.19 [0.58, 2.45] |
| 8.2 Weight loss of at least 5% during the last three months | 1 | 32 | Risk Ratio (M‐H, Random, 95% CI) | 0.0 [0.0, 0.0] |
| 8.3 Weight loss of at least 10% during the last six months | 1 | 32 | Risk Ratio (M‐H, Random, 95% CI) | 0.88 [0.44, 1.78] |
| 8.4 Insufficient food intake during the last week (50% of requirements or less) | 0 | 0 | Risk Ratio (M‐H, Random, 95% CI) | 0.0 [0.0, 0.0] |
| 8.5 Participants characterised as 'at nutritional risk' by other means | 133 | 21776 | Risk Ratio (M‐H, Random, 95% CI) | 0.93 [0.86, 1.01] |
| 9 Serious adverse events ‐ participants characterised as 'at nutritional risk' due to biomarkers or anthropometrics Show forest plot | 137 | 22087 | Risk Ratio (M‐H, Random, 95% CI) | 0.93 [0.86, 1.01] |
| Analysis 3.9 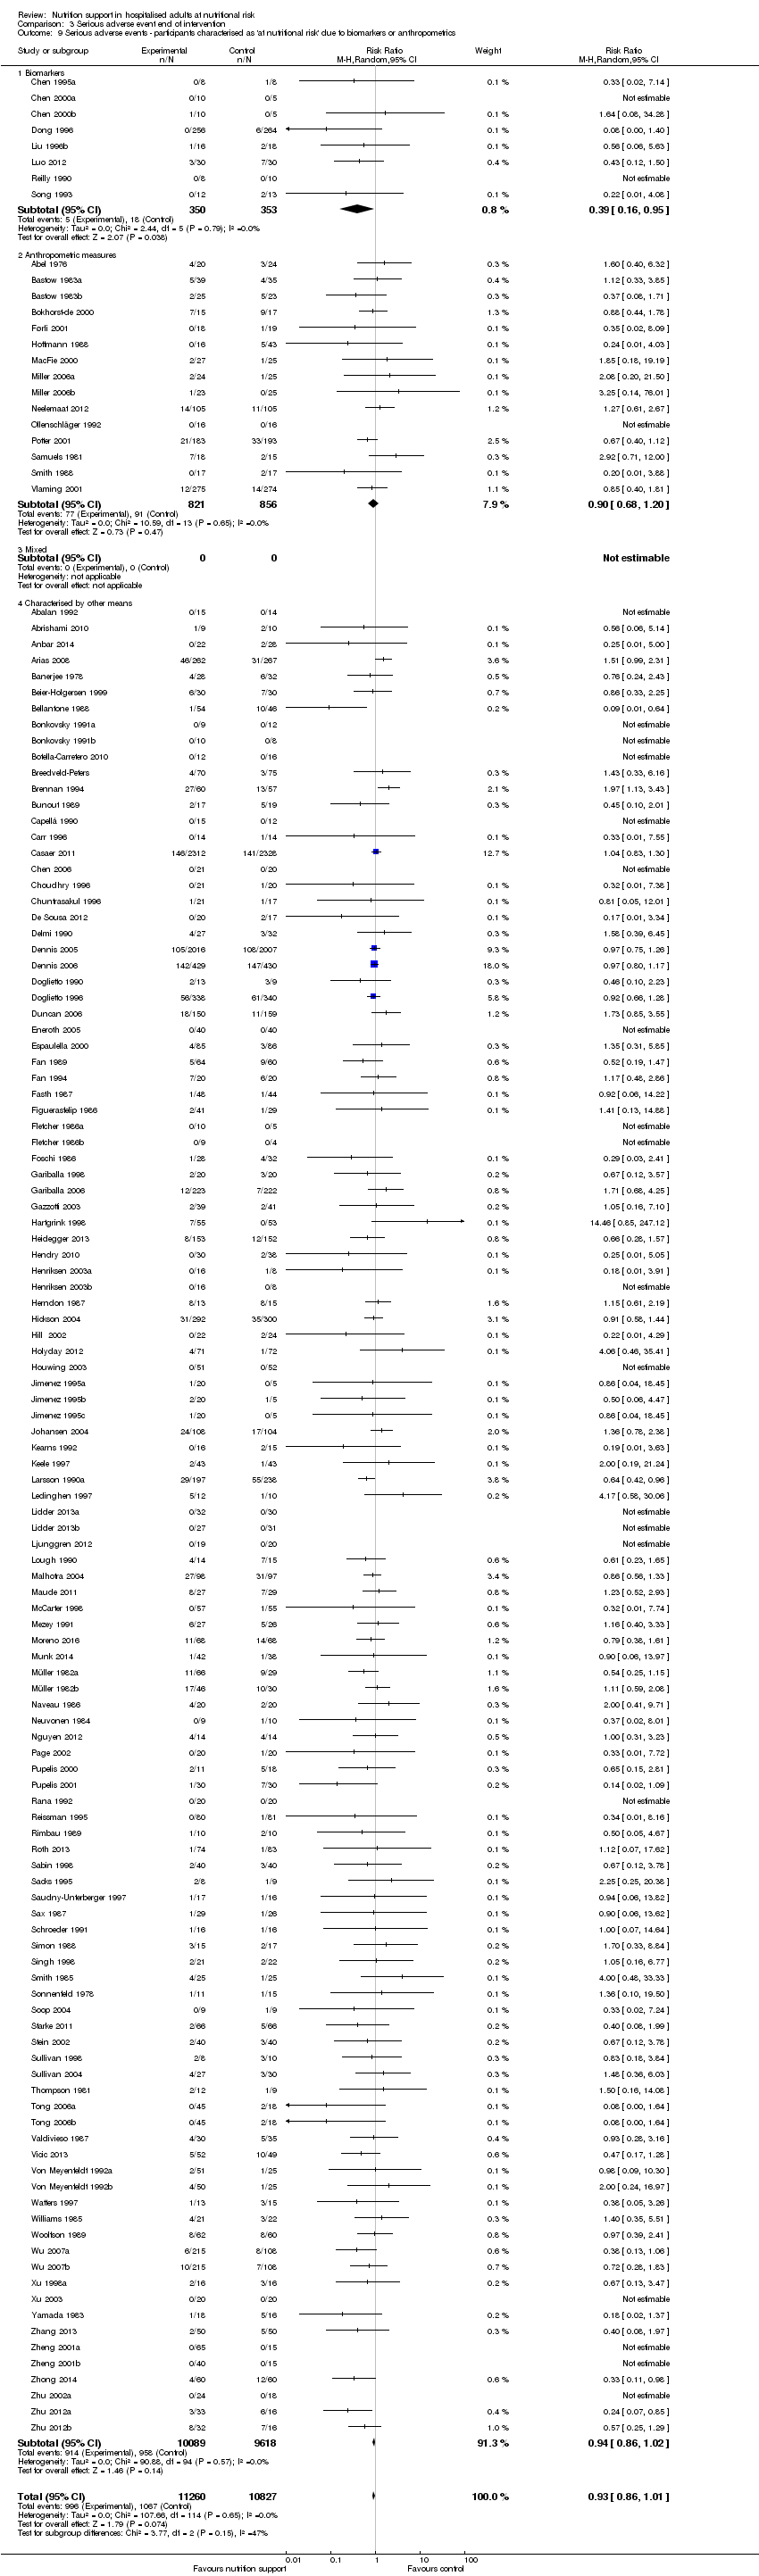 Comparison 3 Serious adverse event end of intervention, Outcome 9 Serious adverse events ‐ participants characterised as 'at nutritional risk' due to biomarkers or anthropometrics. | ||||
| 9.1 Biomarkers | 8 | 703 | Risk Ratio (M‐H, Random, 95% CI) | 0.39 [0.16, 0.95] |
| 9.2 Anthropometric measures | 15 | 1677 | Risk Ratio (M‐H, Random, 95% CI) | 0.90 [0.68, 1.20] |
| 9.3 Mixed | 0 | 0 | Risk Ratio (M‐H, Random, 95% CI) | 0.0 [0.0, 0.0] |
| 9.4 Characterised by other means | 114 | 19707 | Risk Ratio (M‐H, Random, 95% CI) | 0.94 [0.86, 1.02] |
| 10 Serious adverse events ‐ randomisation year Show forest plot | 137 | 22087 | Risk Ratio (M‐H, Random, 95% CI) | 0.93 [0.86, 1.01] |
| Analysis 3.10  Comparison 3 Serious adverse event end of intervention, Outcome 10 Serious adverse events ‐ randomisation year. | ||||
| 10.1 Before 1960 | 0 | 0 | Risk Ratio (M‐H, Random, 95% CI) | 0.0 [0.0, 0.0] |
| 10.2 1960 to 1979 | 5 | 184 | Risk Ratio (M‐H, Random, 95% CI) | 1.40 [0.70, 2.78] |
| 10.3 1980 to 1999 | 86 | 11472 | Risk Ratio (M‐H, Random, 95% CI) | 0.91 [0.82, 1.00] |
| 10.4 After 1999 | 46 | 10431 | Risk Ratio (M‐H, Random, 95% CI) | 0.89 [0.75, 1.06] |
| 11 Serious adverse events ‐ trials where the intervention lasts fewer than three days compared with trials where the intervention lasts three days or more Show forest plot | 137 | 22087 | Risk Ratio (M‐H, Random, 95% CI) | 0.93 [0.86, 1.01] |
| Analysis 3.11  Comparison 3 Serious adverse event end of intervention, Outcome 11 Serious adverse events ‐ trials where the intervention lasts fewer than three days compared with trials where the intervention lasts three days or more. | ||||
| 11.1 Three days or more | 125 | 21408 | Risk Ratio (M‐H, Random, 95% CI) | 0.94 [0.86, 1.02] |
| 11.2 Less than three days | 10 | 602 | Risk Ratio (M‐H, Random, 95% CI) | 0.67 [0.39, 1.16] |
| 11.3 Unknown | 2 | 77 | Risk Ratio (M‐H, Random, 95% CI) | 0.25 [0.01, 5.00] |
| 12 Serious adverse events ‐ 'best‐worst case' scenario Show forest plot | 137 | 22557 | Risk Ratio (M‐H, Random, 95% CI) | 0.74 [0.65, 0.83] |
| Analysis 3.12  Comparison 3 Serious adverse event end of intervention, Outcome 12 Serious adverse events ‐ 'best‐worst case' scenario. | ||||
| 13 Serious adverse events ‐ 'worst‐best case' scenario Show forest plot | 137 | 22557 | Risk Ratio (M‐H, Random, 95% CI) | 1.06 [0.92, 1.21] |
| Analysis 3.13  Comparison 3 Serious adverse event end of intervention, Outcome 13 Serious adverse events ‐ 'worst‐best case' scenario. | ||||
| 14 Serious adverse events co‐interventions Show forest plot | 137 | 22087 | Risk Ratio (M‐H, Fixed, 95% CI) | 0.91 [0.84, 0.99] |
| Analysis 3.14 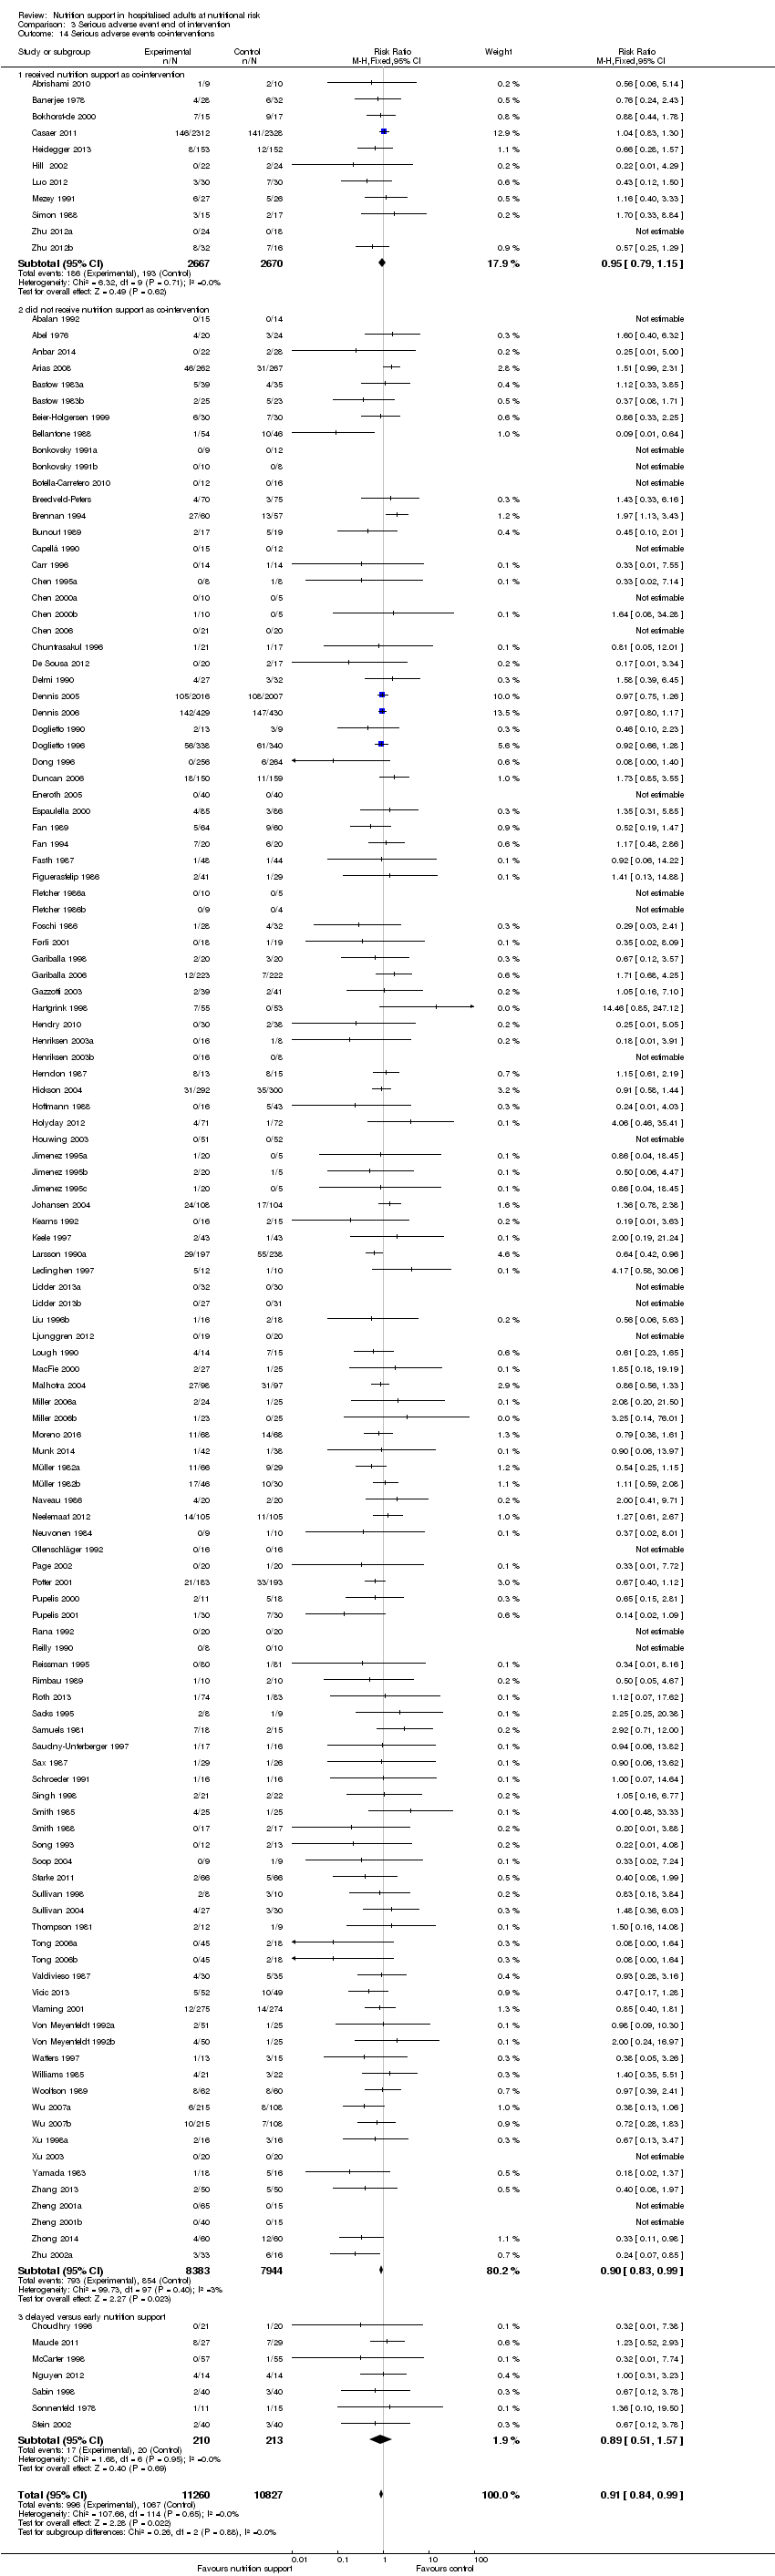 Comparison 3 Serious adverse event end of intervention, Outcome 14 Serious adverse events co‐interventions. | ||||
| 14.1 received nutrition support as co‐intervention | 11 | 5337 | Risk Ratio (M‐H, Fixed, 95% CI) | 0.95 [0.79, 1.15] |
| 14.2 did not receive nutrition support as co‐intervention | 119 | 16327 | Risk Ratio (M‐H, Fixed, 95% CI) | 0.90 [0.83, 0.99] |
| 14.3 delayed versus early nutrition support | 7 | 423 | Risk Ratio (M‐H, Fixed, 95% CI) | 0.89 [0.51, 1.57] |
| Outcome or subgroup title | No. of studies | No. of participants | Statistical method | Effect size |
| 1 Serious adverse events ‐ overall Show forest plot | 152 | 23413 | Risk Ratio (M‐H, Random, 95% CI) | 0.91 [0.85, 0.97] |
| Analysis 4.1  Comparison 4 Serious adverse event maximum follow‐up, Outcome 1 Serious adverse events ‐ overall. | ||||
| 2 Serious adverse events ‐ bias Show forest plot | 152 | 23413 | Risk Ratio (M‐H, Random, 95% CI) | 0.91 [0.85, 0.97] |
| Analysis 4.2  Comparison 4 Serious adverse event maximum follow‐up, Outcome 2 Serious adverse events ‐ bias. | ||||
| 2.1 High risk of bias | 152 | 23413 | Risk Ratio (M‐H, Random, 95% CI) | 0.91 [0.85, 0.97] |
| 2.2 Low risk of bias | 0 | 0 | Risk Ratio (M‐H, Random, 95% CI) | 0.0 [0.0, 0.0] |
| 3 Serious adverse events ‐ mode of delivery Show forest plot | 152 | 23413 | Risk Ratio (M‐H, Random, 95% CI) | 0.91 [0.85, 0.97] |
| Analysis 4.3  Comparison 4 Serious adverse event maximum follow‐up, Outcome 3 Serious adverse events ‐ mode of delivery. | ||||
| 3.1 General nutrition support | 7 | 1544 | Risk Ratio (M‐H, Random, 95% CI) | 1.04 [0.76, 1.44] |
| 3.2 Fortified nutrition | 2 | 290 | Risk Ratio (M‐H, Random, 95% CI) | 1.24 [0.61, 2.54] |
| 3.3 Oral nutrition support | 33 | 8541 | Risk Ratio (M‐H, Random, 95% CI) | 0.89 [0.74, 1.07] |
| 3.4 Enteral nutrition | 49 | 4425 | Risk Ratio (M‐H, Random, 95% CI) | 0.82 [0.73, 0.91] |
| 3.5 Parenteral nutrition | 56 | 8263 | Risk Ratio (M‐H, Random, 95% CI) | 0.98 [0.90, 1.07] |
| 3.6 Mixed | 5 | 350 | Risk Ratio (M‐H, Random, 95% CI) | 0.74 [0.37, 1.48] |
| 4 Serious adverse events ‐ by medical specialty Show forest plot | 152 | 23413 | Risk Ratio (M‐H, Random, 95% CI) | 0.91 [0.85, 0.97] |
| Analysis 4.4  Comparison 4 Serious adverse event maximum follow‐up, Outcome 4 Serious adverse events ‐ by medical specialty. | ||||
| 4.1 Cardiology | 0 | 0 | Risk Ratio (M‐H, Random, 95% CI) | 0.0 [0.0, 0.0] |
| 4.2 Medical gastroenterology and hepatology | 13 | 706 | Risk Ratio (M‐H, Random, 95% CI) | 0.94 [0.75, 1.17] |
| 4.3 Geriatrics | 13 | 2547 | Risk Ratio (M‐H, Random, 95% CI) | 0.88 [0.67, 1.17] |
| 4.4 Pulmonary disease | 3 | 118 | Risk Ratio (M‐H, Random, 95% CI) | 0.44 [0.15, 1.28] |
| 4.5 Endocrinology | 0 | 0 | Risk Ratio (M‐H, Random, 95% CI) | 0.0 [0.0, 0.0] |
| 4.6 Infectious diseases | 1 | 56 | Risk Ratio (M‐H, Random, 95% CI) | 1.23 [0.52, 2.93] |
| 4.7 Rheumatology | 0 | 0 | Risk Ratio (M‐H, Random, 95% CI) | 0.0 [0.0, 0.0] |
| 4.8 Haematology | 0 | 0 | Risk Ratio (M‐H, Random, 95% CI) | 0.0 [0.0, 0.0] |
| 4.9 Nephrology | 0 | 0 | Risk Ratio (M‐H, Random, 95% CI) | 0.0 [0.0, 0.0] |
| 4.10 Gastroenterologic surgery | 59 | 4835 | Risk Ratio (M‐H, Random, 95% CI) | 0.83 [0.71, 0.97] |
| 4.11 Trauma surgery | 7 | 290 | Risk Ratio (M‐H, Random, 95% CI) | 0.86 [0.55, 1.34] |
| 4.12 Ortopaedics | 12 | 1196 | Risk Ratio (M‐H, Random, 95% CI) | 0.98 [0.63, 1.51] |
| 4.13 Plastic, reconstructive, and aesthetic surgery | 0 | 0 | Risk Ratio (M‐H, Random, 95% CI) | 0.0 [0.0, 0.0] |
| 4.14 Vascular surgery | 3 | 48 | Risk Ratio (M‐H, Random, 95% CI) | 0.5 [0.05, 4.67] |
| 4.15 Transplant surgery | 3 | 84 | Risk Ratio (M‐H, Random, 95% CI) | 0.54 [0.22, 1.31] |
| 4.16 Urology | 0 | 0 | Risk Ratio (M‐H, Random, 95% CI) | 0.0 [0.0, 0.0] |
| 4.17 Thoracic surgery | 3 | 592 | Risk Ratio (M‐H, Random, 95% CI) | 0.47 [0.06, 3.62] |
| 4.18 Neurological surgery | 0 | 0 | Risk Ratio (M‐H, Random, 95% CI) | 0.0 [0.0, 0.0] |
| 4.19 Oro‐maxillo‐facial surgery | 1 | 32 | Risk Ratio (M‐H, Random, 95% CI) | 0.88 [0.44, 1.78] |
| 4.20 Anaesthesiology | 0 | 0 | Risk Ratio (M‐H, Random, 95% CI) | 0.0 [0.0, 0.0] |
| 4.21 Emergency medicine | 11 | 5421 | Risk Ratio (M‐H, Random, 95% CI) | 0.96 [0.84, 1.10] |
| 4.22 Psychiatry | 0 | 0 | Risk Ratio (M‐H, Random, 95% CI) | 0.0 [0.0, 0.0] |
| 4.23 Neurology | 9 | 5426 | Risk Ratio (M‐H, Random, 95% CI) | 0.75 [0.58, 0.98] |
| 4.24 Oncology | 7 | 407 | Risk Ratio (M‐H, Random, 95% CI) | 1.02 [0.87, 1.20] |
| 4.25 Dermatology | 0 | 0 | Risk Ratio (M‐H, Random, 95% CI) | 0.0 [0.0, 0.0] |
| 4.26 Gynaecology | 0 | 0 | Risk Ratio (M‐H, Random, 95% CI) | 0.0 [0.0, 0.0] |
| 4.27 Mixed | 7 | 1655 | Risk Ratio (M‐H, Random, 95% CI) | 1.29 [0.97, 1.71] |
| 5 Serious adverse events ‐ based on adequacy of the amount of calories Show forest plot | 152 | 23413 | Risk Ratio (M‐H, Random, 95% CI) | 0.91 [0.85, 0.97] |
| Analysis 4.5 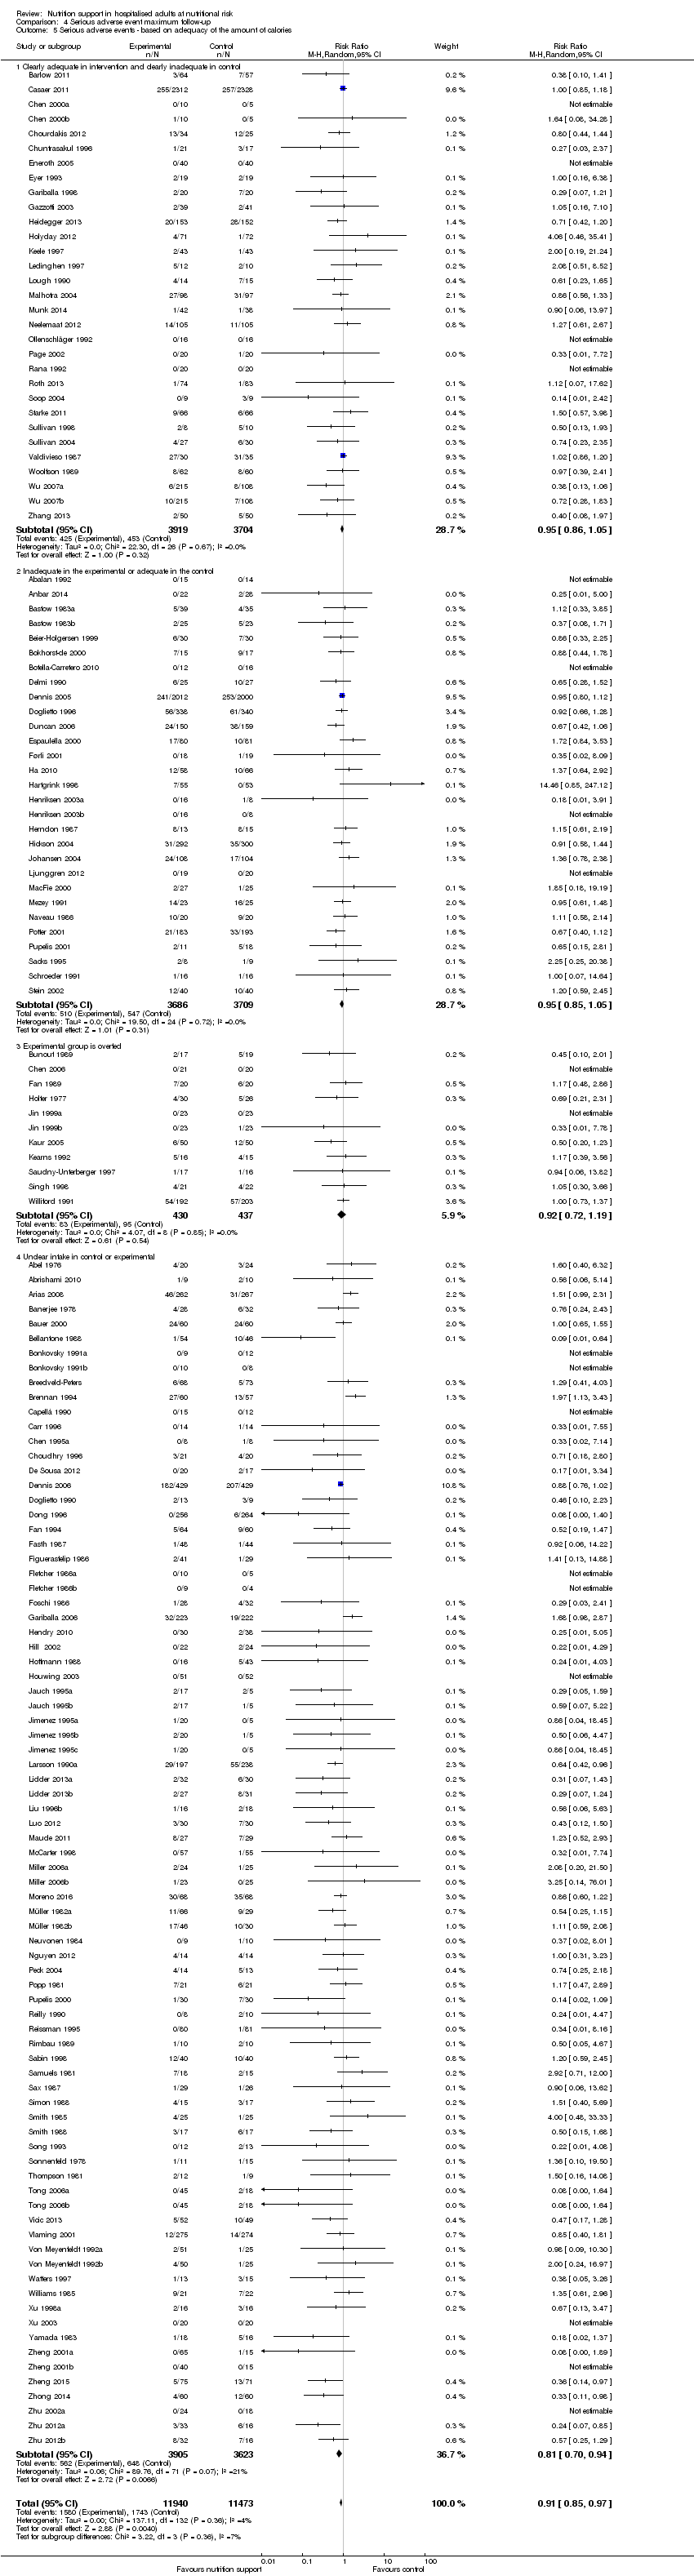 Comparison 4 Serious adverse event maximum follow‐up, Outcome 5 Serious adverse events ‐ based on adequacy of the amount of calories. | ||||
| 5.1 Clearly adequate in intervention and clearly inadequate in control | 31 | 7623 | Risk Ratio (M‐H, Random, 95% CI) | 0.95 [0.86, 1.05] |
| 5.2 Inadequate in the experimental or adequate in the control | 29 | 7395 | Risk Ratio (M‐H, Random, 95% CI) | 0.95 [0.85, 1.05] |
| 5.3 Experimental group is overfed | 11 | 867 | Risk Ratio (M‐H, Random, 95% CI) | 0.92 [0.72, 1.19] |
| 5.4 Unclear intake in control or experimental | 81 | 7528 | Risk Ratio (M‐H, Random, 95% CI) | 0.81 [0.70, 0.94] |
| 6 Serious adverse events ‐ different screening tools Show forest plot | 152 | 23413 | Risk Ratio (M‐H, Random, 95% CI) | 0.91 [0.85, 0.97] |
| Analysis 4.6 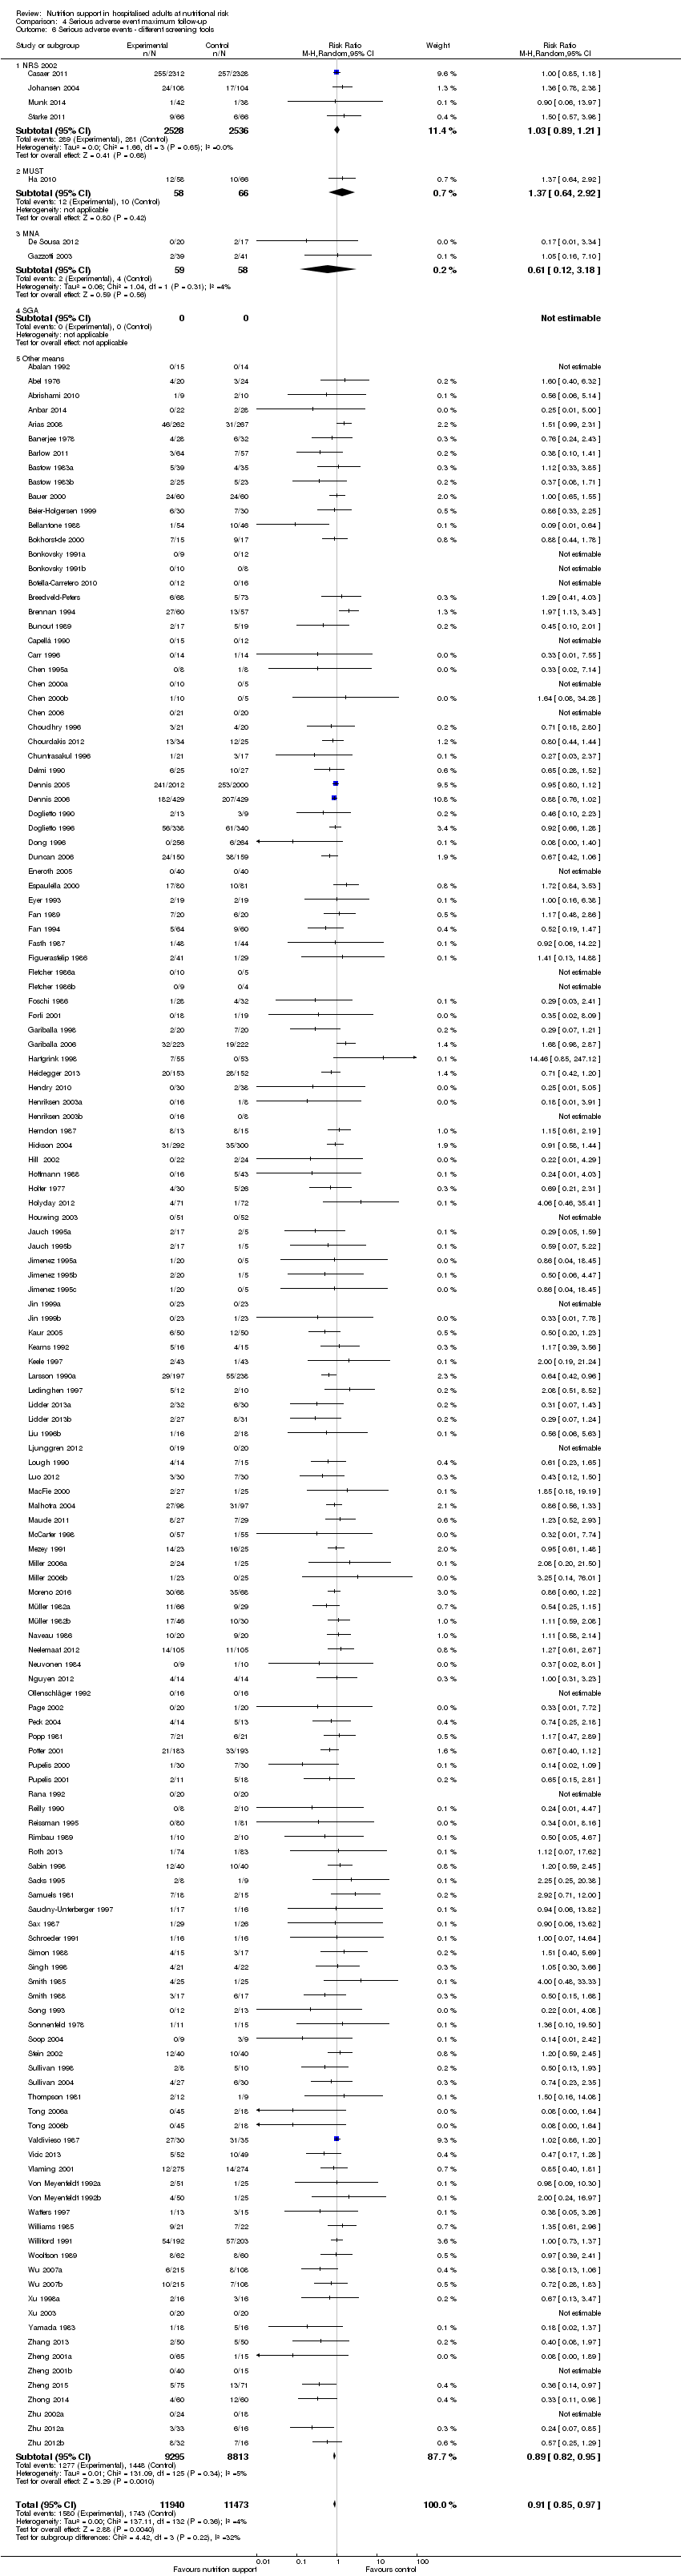 Comparison 4 Serious adverse event maximum follow‐up, Outcome 6 Serious adverse events ‐ different screening tools. | ||||
| 6.1 NRS 2002 | 4 | 5064 | Risk Ratio (M‐H, Random, 95% CI) | 1.03 [0.89, 1.21] |
| 6.2 MUST | 1 | 124 | Risk Ratio (M‐H, Random, 95% CI) | 1.37 [0.64, 2.92] |
| 6.3 MNA | 2 | 117 | Risk Ratio (M‐H, Random, 95% CI) | 0.61 [0.12, 3.18] |
| 6.4 SGA | 0 | 0 | Risk Ratio (M‐H, Random, 95% CI) | 0.0 [0.0, 0.0] |
| 6.5 Other means | 145 | 18108 | Risk Ratio (M‐H, Random, 95% CI) | 0.89 [0.82, 0.95] |
| 7 Serious adverse events ‐ participants characterised as 'at nutritional risk' due to one of the following conditions Show forest plot | 152 | 23413 | Risk Ratio (M‐H, Random, 95% CI) | 0.91 [0.85, 0.97] |
| Analysis 4.7  Comparison 4 Serious adverse event maximum follow‐up, Outcome 7 Serious adverse events ‐ participants characterised as 'at nutritional risk' due to one of the following conditions. | ||||
| 7.1 Major surgery | 72 | 5936 | Risk Ratio (M‐H, Random, 95% CI) | 0.82 [0.71, 0.94] |
| 7.2 Stroke | 8 | 5397 | Risk Ratio (M‐H, Random, 95% CI) | 0.75 [0.58, 0.98] |
| 7.3 ICU participants including trauma | 16 | 5667 | Risk Ratio (M‐H, Random, 95% CI) | 0.96 [0.84, 1.10] |
| 7.4 Frail elderly participants with less severe conditions known to increase protein requirements | 19 | 2385 | Risk Ratio (M‐H, Random, 95% CI) | 0.82 [0.65, 1.03] |
| 7.5 Participants do not fall into one of the categories above | 37 | 4028 | Risk Ratio (M‐H, Random, 95% CI) | 1.03 [0.92, 1.15] |
| 8 Serious adverse events ‐ participants characterised as 'at nutritional risk' due to one of the following criteria Show forest plot | 152 | 23413 | Risk Ratio (M‐H, Random, 95% CI) | 0.91 [0.85, 0.97] |
| Analysis 4.8  Comparison 4 Serious adverse event maximum follow‐up, Outcome 8 Serious adverse events ‐ participants characterised as 'at nutritional risk' due to one of the following criteria. | ||||
| 8.1 BMI less than 20.5 kg/m2 | 2 | 247 | Risk Ratio (M‐H, Random, 95% CI) | 1.19 [0.58, 2.45] |
| 8.2 Weight loss of at least 5% during the last three months | 1 | 32 | Risk Ratio (M‐H, Random, 95% CI) | 0.0 [0.0, 0.0] |
| 8.3 Weight loss of at least 10% during the last six months | 3 | 124 | Risk Ratio (M‐H, Random, 95% CI) | 0.84 [0.42, 1.67] |
| 8.4 Insufficient food intake during the last week (50% of requirements or less) | 0 | 0 | Risk Ratio (M‐H, Random, 95% CI) | 0.0 [0.0, 0.0] |
| 8.5 Participants characterised as 'at nutritional risk' by other means | 146 | 23010 | Risk Ratio (M‐H, Random, 95% CI) | 0.90 [0.84, 0.97] |
| 9 Serious adverse events ‐ participants characterised as 'at nutritional risk' due to biomarkers or anthropometrics Show forest plot | 152 | 23413 | Risk Ratio (M‐H, Random, 95% CI) | 0.91 [0.85, 0.97] |
| Analysis 4.9  Comparison 4 Serious adverse event maximum follow‐up, Outcome 9 Serious adverse events ‐ participants characterised as 'at nutritional risk' due to biomarkers or anthropometrics. | ||||
| 9.1 Biomarkers | 10 | 795 | Risk Ratio (M‐H, Random, 95% CI) | 0.37 [0.16, 0.85] |
| 9.2 Anthropometric measures | 12 | 1402 | Risk Ratio (M‐H, Random, 95% CI) | 0.76 [0.54, 1.08] |
| 9.3 Both | 3 | 75 | Risk Ratio (M‐H, Random, 95% CI) | 0.66 [0.14, 3.07] |
| 9.4 Characterised by other means | 127 | 21141 | Risk Ratio (M‐H, Random, 95% CI) | 0.91 [0.85, 0.98] |
| 10 Serious adverse events ‐ randomisation year Show forest plot | 152 | 23413 | Risk Ratio (M‐H, Random, 95% CI) | 0.91 [0.85, 0.97] |
| Analysis 4.10  Comparison 4 Serious adverse event maximum follow‐up, Outcome 10 Serious adverse events ‐ randomisation year. | ||||
| 10.1 Before 1960 | 0 | 0 | Risk Ratio (M‐H, Random, 95% CI) | 0.0 [0.0, 0.0] |
| 10.2 1960 to 1979 | 6 | 240 | Risk Ratio (M‐H, Random, 95% CI) | 1.18 [0.65, 2.14] |
| 10.3 1980 to 1999 | 93 | 12128 | Risk Ratio (M‐H, Random, 95% CI) | 0.92 [0.86, 0.99] |
| 10.4 After 1999 | 53 | 11045 | Risk Ratio (M‐H, Random, 95% CI) | 0.83 [0.72, 0.97] |
| 11 Serious adverse events ‐ trials where the intervention lasts fewer than three days compared with trials where the intervention lasts three days or more Show forest plot | 152 | 23413 | Risk Ratio (M‐H, Random, 95% CI) | 0.91 [0.85, 0.97] |
| Analysis 4.11 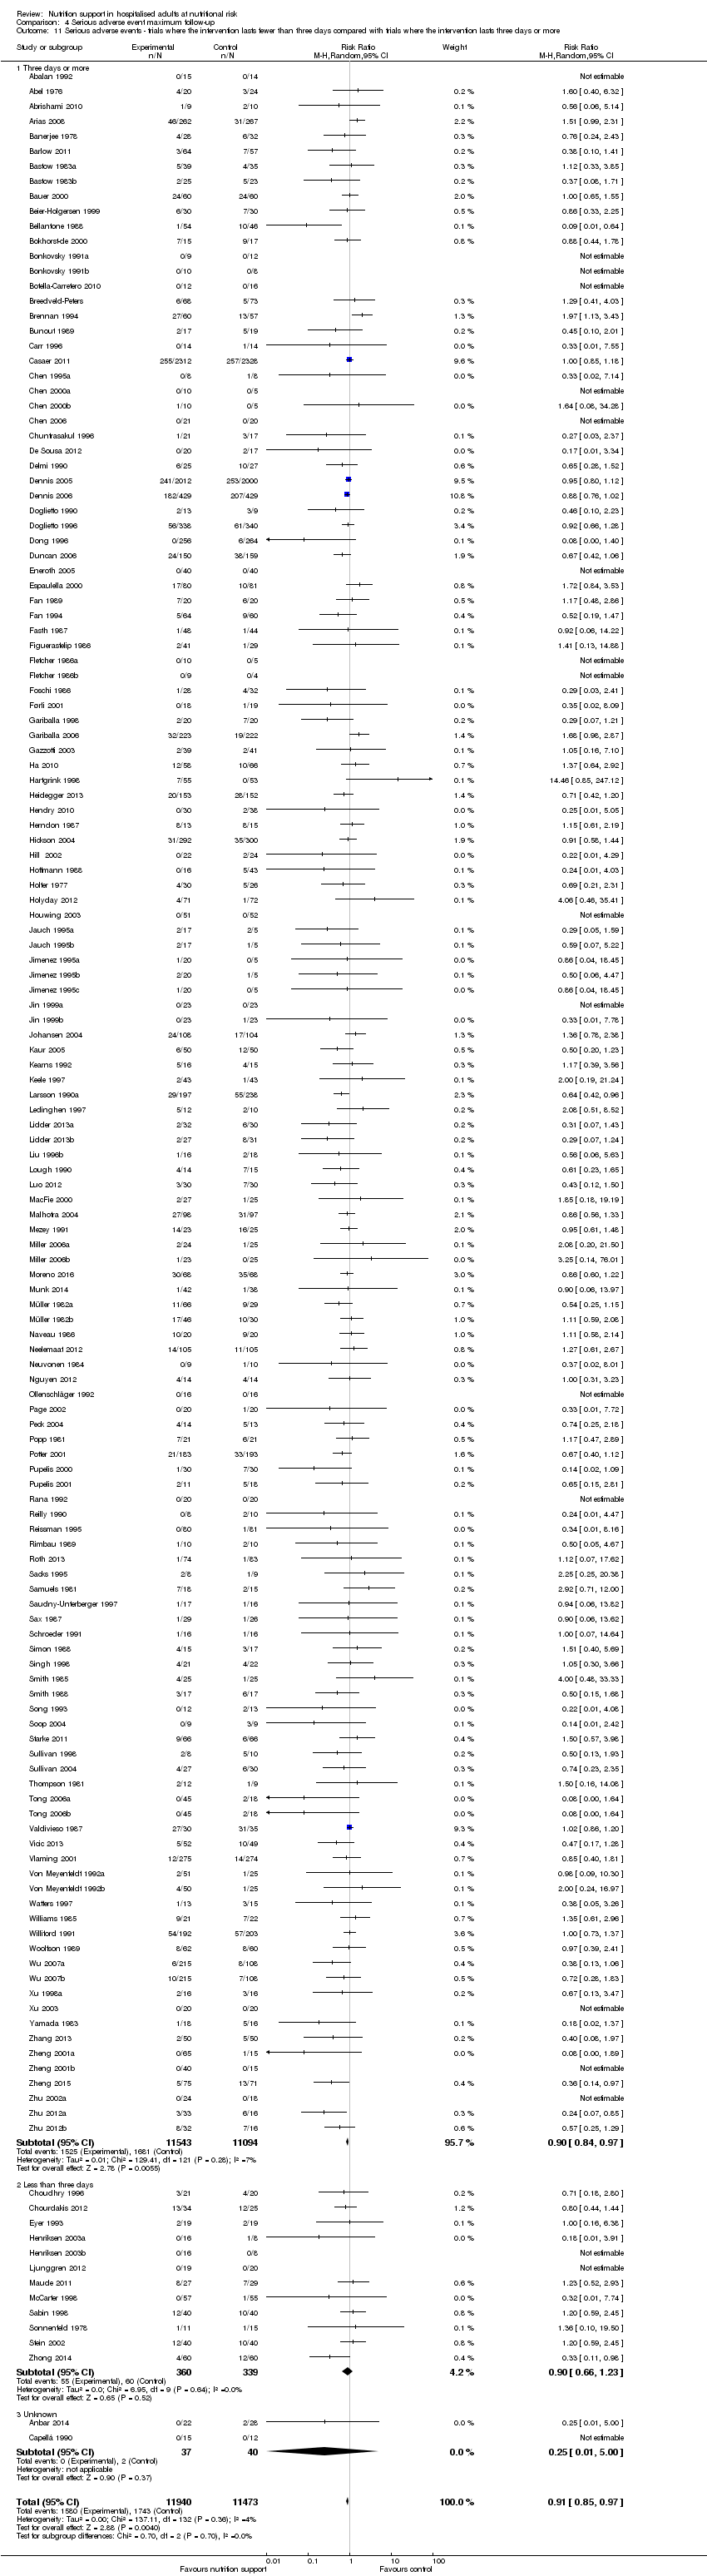 Comparison 4 Serious adverse event maximum follow‐up, Outcome 11 Serious adverse events ‐ trials where the intervention lasts fewer than three days compared with trials where the intervention lasts three days or more. | ||||
| 11.1 Three days or more | 138 | 22637 | Risk Ratio (M‐H, Random, 95% CI) | 0.90 [0.84, 0.97] |
| 11.2 Less than three days | 12 | 699 | Risk Ratio (M‐H, Random, 95% CI) | 0.90 [0.66, 1.23] |
| 11.3 Unknown | 2 | 77 | Risk Ratio (M‐H, Random, 95% CI) | 0.25 [0.01, 5.00] |
| 12 Serious adverse events ‐ 'best‐worst case' scenario Show forest plot | 152 | 24315 | Risk Ratio (M‐H, Random, 95% CI) | 0.72 [0.65, 0.79] |
| Analysis 4.12  Comparison 4 Serious adverse event maximum follow‐up, Outcome 12 Serious adverse events ‐ 'best‐worst case' scenario. | ||||
| 13 Serious adverse events ‐ 'worst‐best case' scenario Show forest plot | 152 | 24082 | Risk Ratio (M‐H, Random, 95% CI) | 1.05 [0.94, 1.17] |
| Analysis 4.13 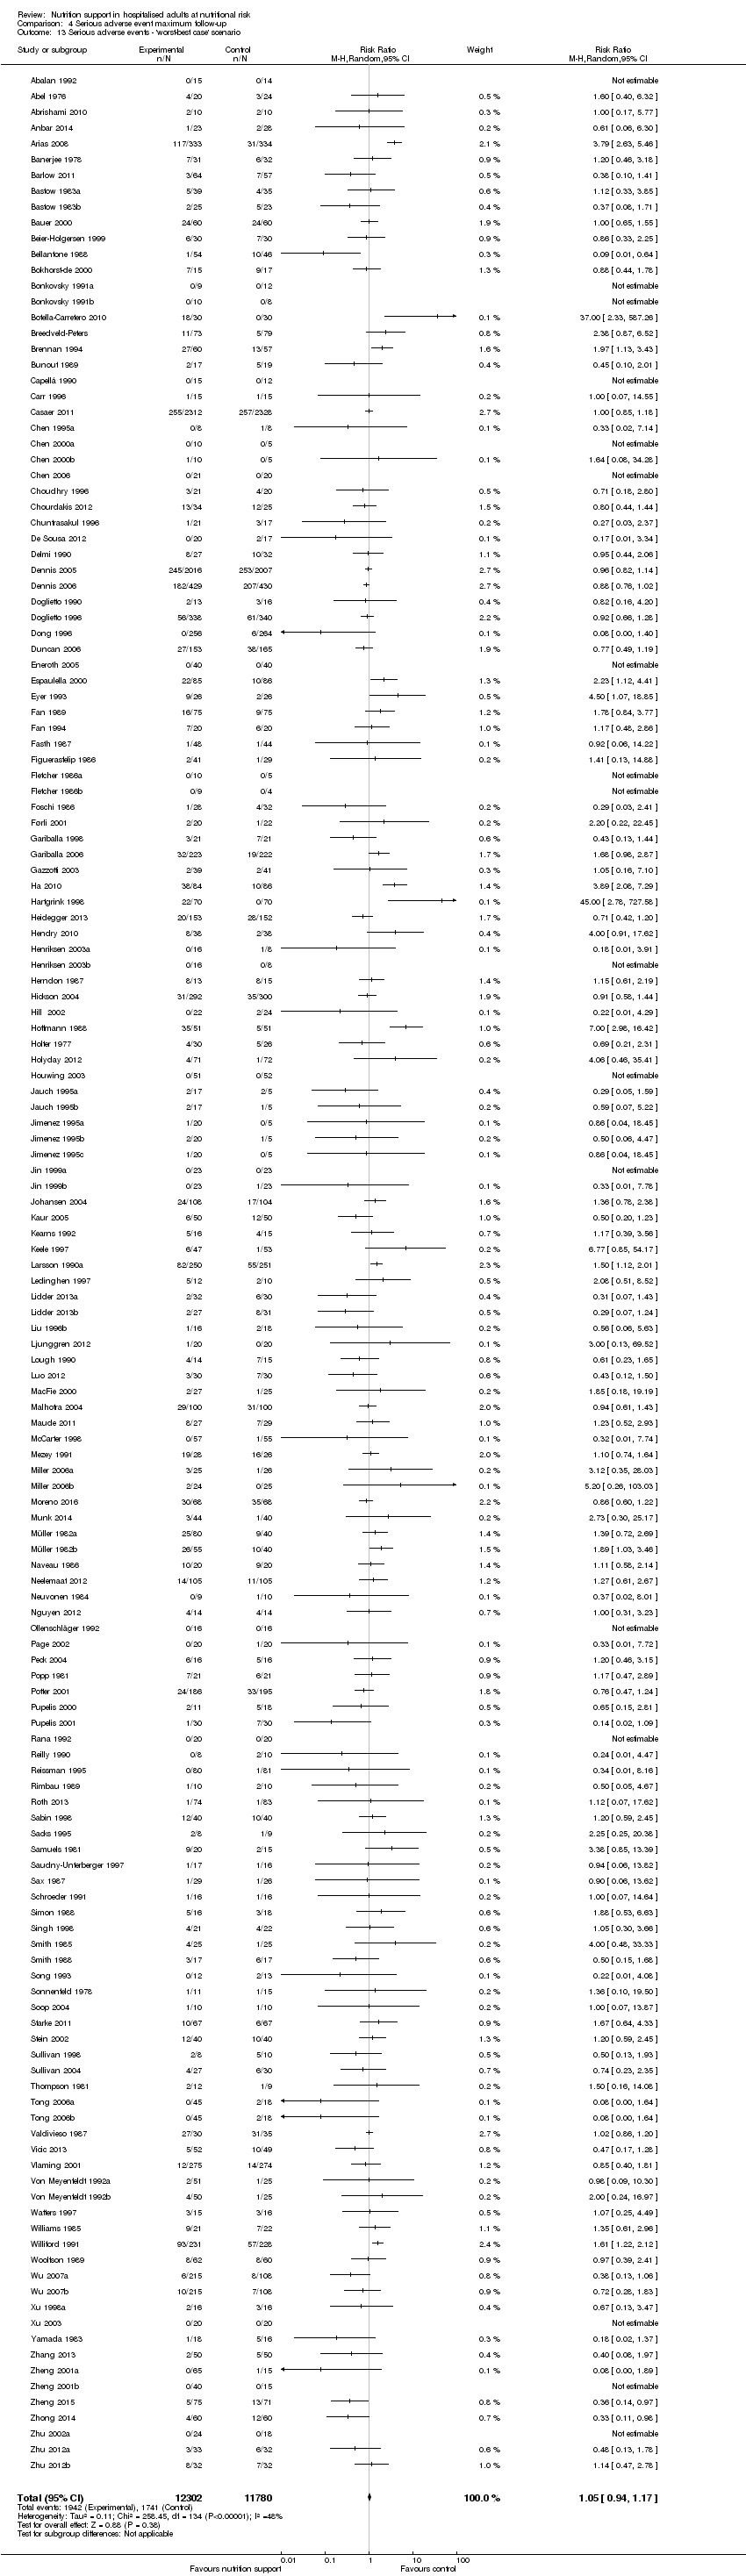 Comparison 4 Serious adverse event maximum follow‐up, Outcome 13 Serious adverse events ‐ 'worst‐best case' scenario. | ||||
| 14 Serious adverse events co‐interventions Show forest plot | 152 | 23413 | Risk Ratio (M‐H, Fixed, 95% CI) | 0.89 [0.84, 0.95] |
| Analysis 4.14 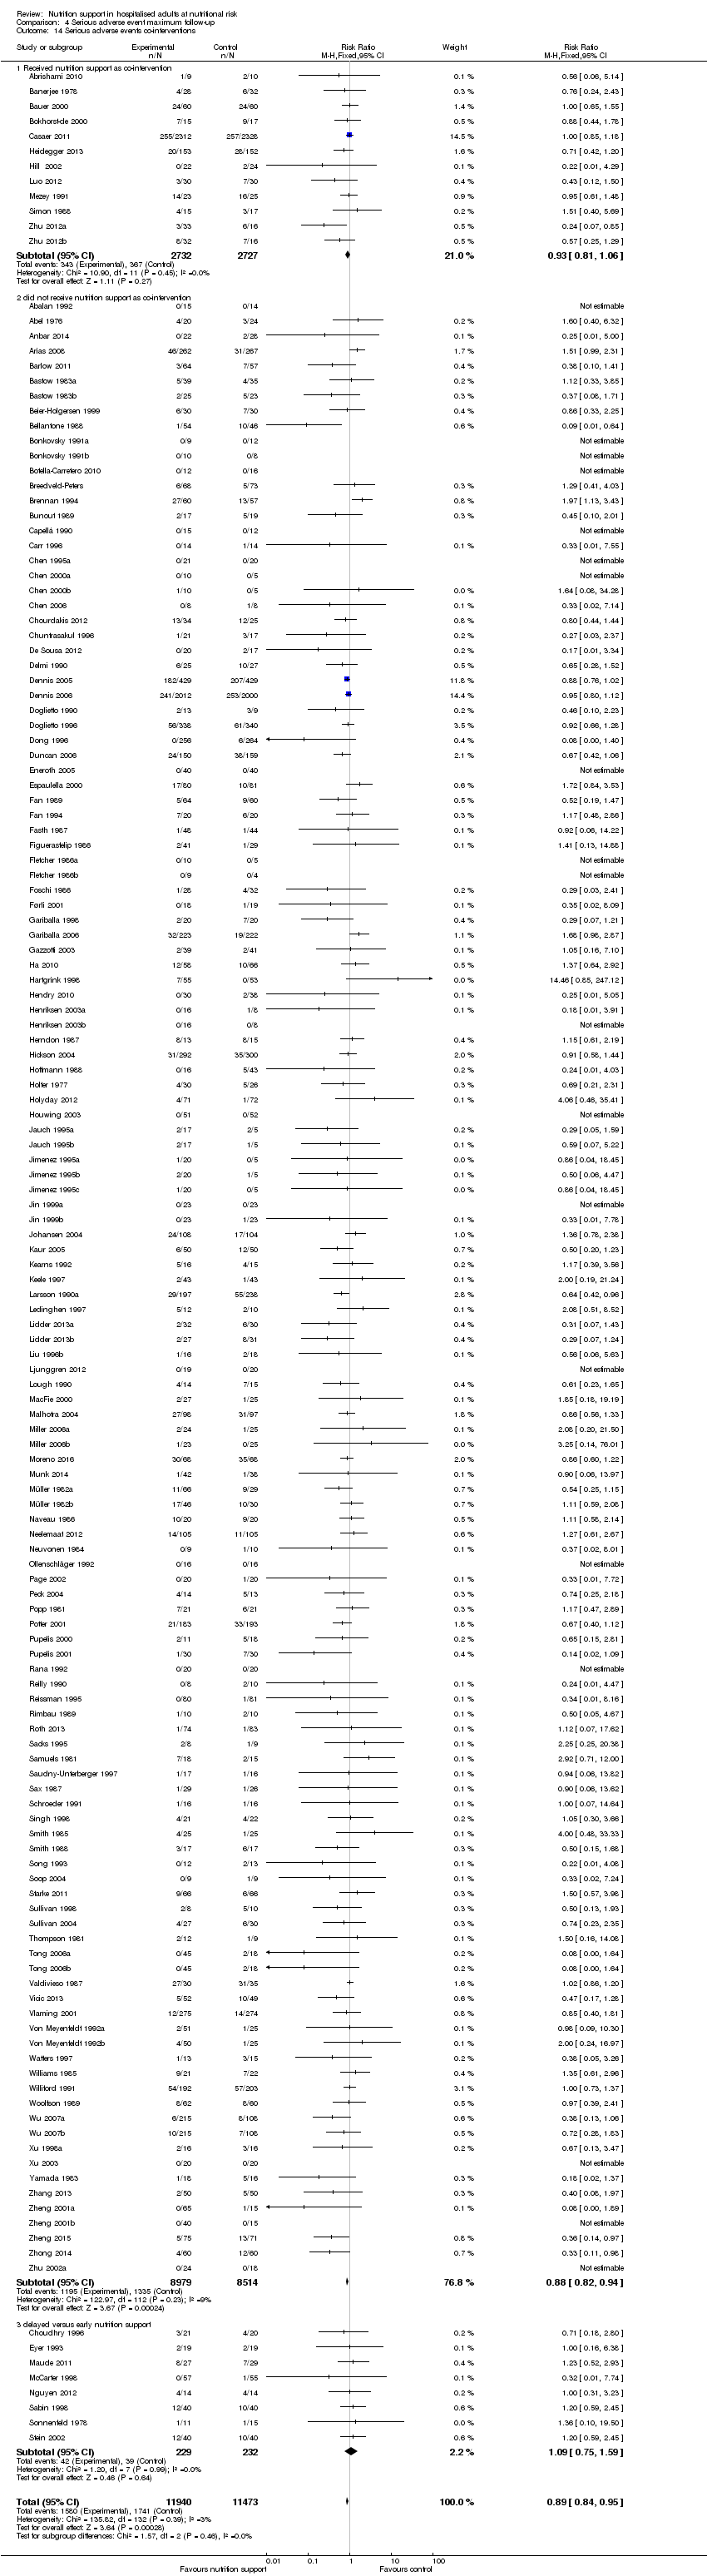 Comparison 4 Serious adverse event maximum follow‐up, Outcome 14 Serious adverse events co‐interventions. | ||||
| 14.1 Received nutrition support as co‐intervention | 12 | 5459 | Risk Ratio (M‐H, Fixed, 95% CI) | 0.93 [0.81, 1.06] |
| 14.2 did not receive nutrition support as co‐intervention | 132 | 17493 | Risk Ratio (M‐H, Fixed, 95% CI) | 0.88 [0.82, 0.94] |
| 14.3 delayed versus early nutrition support | 8 | 461 | Risk Ratio (M‐H, Fixed, 95% CI) | 1.09 [0.75, 1.59] |
| 15 Serious adverse events ‐ 'best‐worse case' scenario (enteral nutrition) Show forest plot | 46 | 4415 | Risk Ratio (M‐H, Random, 95% CI) | 0.62 [0.51, 0.75] |
| Analysis 4.15  Comparison 4 Serious adverse event maximum follow‐up, Outcome 15 Serious adverse events ‐ 'best‐worse case' scenario (enteral nutrition). | ||||
| 16 Serious adverse events ‐ 'worst‐best case' scenario (enteral nutrition) Show forest plot | 46 | 4415 | Risk Ratio (M‐H, Random, 95% CI) | 0.81 [0.69, 0.96] |
| Analysis 4.16  Comparison 4 Serious adverse event maximum follow‐up, Outcome 16 Serious adverse events ‐ 'worst‐best case' scenario (enteral nutrition). | ||||
| Outcome or subgroup title | No. of studies | No. of participants | Statistical method | Effect size |
| 1 Quality of life ‐ overall Show forest plot | 2 | 242 | Mean Difference (IV, Random, 95% CI) | 2.35 [‐2.94, 7.65] |
| Analysis 5.1  Comparison 5 Quality of life (SF36 ‐ Physical performance) ‐ end of intervention, Outcome 1 Quality of life ‐ overall. | ||||
| Outcome or subgroup title | No. of studies | No. of participants | Statistical method | Effect size |
| 1 Quality of life ‐ overall Show forest plot | 3 | 289 | Mean Difference (IV, Random, 95% CI) | 1.54 [‐2.47, 5.55] |
| Analysis 6.1  Comparison 6 Quality of life (SF36 ‐ Physical performance) ‐ maximum follow‐up, Outcome 1 Quality of life ‐ overall. | ||||
| Outcome or subgroup title | No. of studies | No. of participants | Statistical method | Effect size |
| 1 Quality of life ‐ overall Show forest plot | 2 | 242 | Mean Difference (IV, Random, 95% CI) | ‐0.90 [‐3.92, 2.13] |
| Analysis 7.1 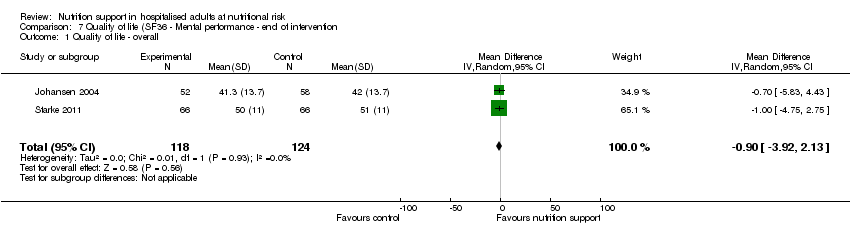 Comparison 7 Quality of life (SF36 ‐ Mental performance ‐ end of intervention, Outcome 1 Quality of life ‐ overall. | ||||
| Outcome or subgroup title | No. of studies | No. of participants | Statistical method | Effect size |
| 1 Quality of life ‐ overall Show forest plot | 3 | 289 | Mean Difference (IV, Random, 95% CI) | ‐0.25 [‐3.02, 2.53] |
| Analysis 8.1 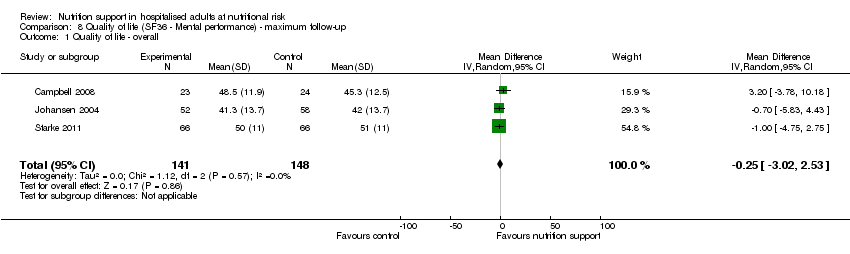 Comparison 8 Quality of life (SF36 ‐ Mental performance) ‐ maximum follow‐up, Outcome 1 Quality of life ‐ overall. | ||||
| Outcome or subgroup title | No. of studies | No. of participants | Statistical method | Effect size |
| 1 Quality of life ‐ overall Show forest plot | 2 | 3961 | Mean Difference (IV, Random, 95% CI) | ‐0.01 [‐0.03, 0.01] |
| Analysis 9.1  Comparison 9 Quality of life (EuroQoL) ‐ maximum follow‐up, Outcome 1 Quality of life ‐ overall. | ||||
| Outcome or subgroup title | No. of studies | No. of participants | Statistical method | Effect size |
| 1 Pneumonia Show forest plot | 28 | 12443 | Risk Ratio (M‐H, Random, 95% CI) | 1.06 [0.96, 1.16] |
| Analysis 10.1  Comparison 10 Pneumonia, Outcome 1 Pneumonia. | ||||
| Outcome or subgroup title | No. of studies | No. of participants | Statistical method | Effect size |
| 1 Wound dehiscence Show forest plot | 14 | 2280 | Risk Ratio (M‐H, Random, 95% CI) | 0.71 [0.40, 1.24] |
| Analysis 11.1  Comparison 11 Wound dehiscence, Outcome 1 Wound dehiscence. | ||||
| Outcome or subgroup title | No. of studies | No. of participants | Statistical method | Effect size |
| 1 Renal failure Show forest plot | 5 | 6359 | Risk Ratio (M‐H, Random, 95% CI) | 1.00 [0.83, 1.20] |
| Analysis 12.1  Comparison 12 Renal failure, Outcome 1 Renal failure. | ||||
| Outcome or subgroup title | No. of studies | No. of participants | Statistical method | Effect size |
| 1 Wound infection Show forest plot | 28 | 8324 | Risk Ratio (M‐H, Random, 95% CI) | 0.81 [0.60, 1.10] |
| Analysis 13.1  Comparison 13 Wound infection, Outcome 1 Wound infection. | ||||
| Outcome or subgroup title | No. of studies | No. of participants | Statistical method | Effect size |
| 1 Heart failure Show forest plot | 3 | 1041 | Risk Ratio (M‐H, Random, 95% CI) | 1.11 [0.34, 3.61] |
| Analysis 14.1 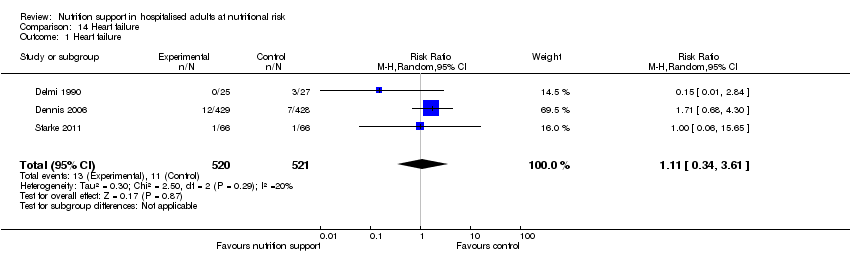 Comparison 14 Heart failure, Outcome 1 Heart failure. | ||||
| Outcome or subgroup title | No. of studies | No. of participants | Statistical method | Effect size |
| 1 AcM ‐ EoI Show forest plot | 6 | 5578 | Risk Ratio (M‐H, Fixed, 95% CI) | 1.01 [0.81, 1.25] |
| Analysis 15.1 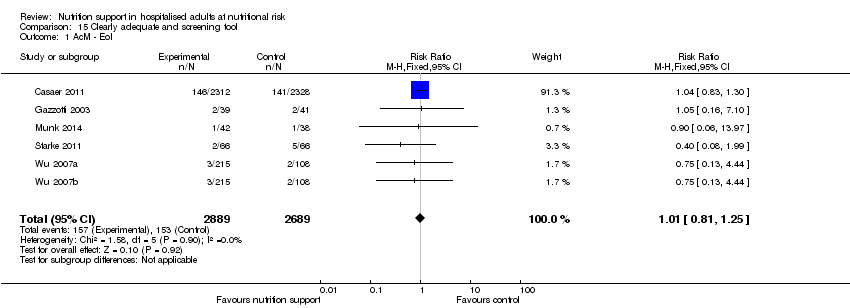 Comparison 15 Clearly adequate and screening tool, Outcome 1 AcM ‐ EoI. | ||||
| 2 AcM ‐ MF Show forest plot | 6 | 5578 | Risk Ratio (M‐H, Random, 95% CI) | 1.01 [0.86, 1.18] |
| Analysis 15.2  Comparison 15 Clearly adequate and screening tool, Outcome 2 AcM ‐ MF. | ||||
| 3 SaE ‐ EoI Show forest plot | 6 | 5578 | Risk Ratio (M‐H, Fixed, 95% CI) | 0.96 [0.78, 1.19] |
| Analysis 15.3  Comparison 15 Clearly adequate and screening tool, Outcome 3 SaE ‐ EoI. | ||||
| 4 SaE ‐ MF Show forest plot | 6 | 5578 | Risk Ratio (M‐H, Random, 95% CI) | 0.98 [0.84, 1.14] |
| Analysis 15.4  Comparison 15 Clearly adequate and screening tool, Outcome 4 SaE ‐ MF. | ||||
| Outcome or subgroup title | No. of studies | No. of participants | Statistical method | Effect size |
| 1 AcM ‐ EoI Show forest plot | 17 | 6760 | Risk Ratio (M‐H, Random, 95% CI) | 0.99 [0.82, 1.20] |
| Analysis 16.1 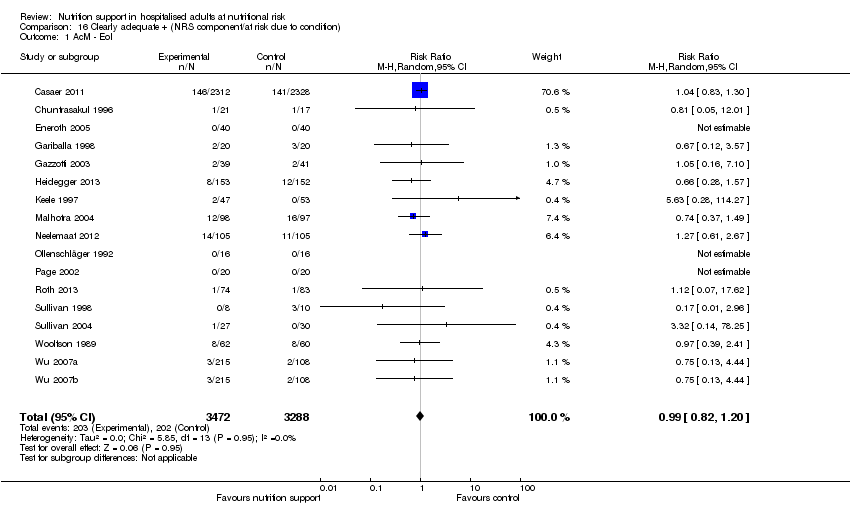 Comparison 16 Clearly adequate + (NRS component/at risk due to condition), Outcome 1 AcM ‐ EoI. | ||||
| 2 AcM ‐ MF Show forest plot | 20 | 6978 | Risk Ratio (M‐H, Random, 95% CI) | 0.95 [0.82, 1.09] |
| Analysis 16.2  Comparison 16 Clearly adequate + (NRS component/at risk due to condition), Outcome 2 AcM ‐ MF. | ||||
| 3 SaE ‐ EoI Show forest plot | 20 | 6794 | Risk Ratio (M‐H, Fixed, 95% CI) | 0.96 [0.81, 1.14] |
| Analysis 16.3  Comparison 16 Clearly adequate + (NRS component/at risk due to condition), Outcome 3 SaE ‐ EoI. | ||||
| 4 SaE ‐ MF Show forest plot | 23 | 7012 | Risk Ratio (M‐H, Random, 95% CI) | 0.91 [0.80, 1.03] |
| Analysis 16.4  Comparison 16 Clearly adequate + (NRS component/at risk due to condition), Outcome 4 SaE ‐ MF. | ||||
| Outcome or subgroup title | No. of studies | No. of participants | Statistical method | Effect size |
| 1 All‐cause mortality ‐ overall Show forest plot | 33 | 8529 | Risk Ratio (M‐H, Random, 95% CI) | 0.94 [0.79, 1.11] |
| Analysis 17.1 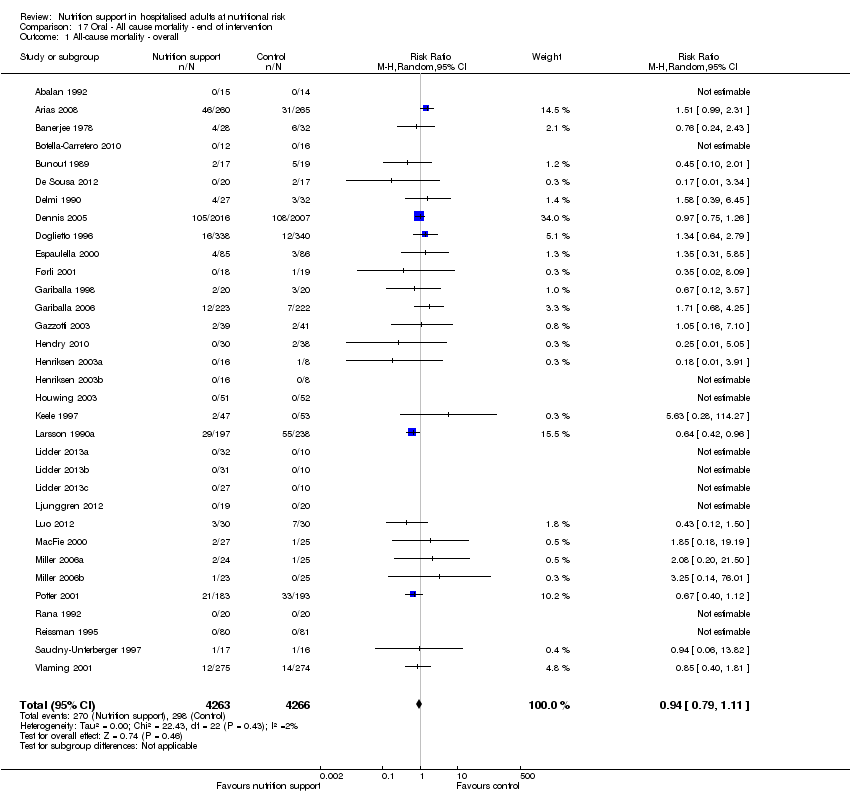 Comparison 17 Oral ‐ All cause mortality ‐ end of intervention, Outcome 1 All‐cause mortality ‐ overall. | ||||
| 2 All‐cause mortality ‐ bias Show forest plot | 33 | 8529 | Risk Ratio (M‐H, Random, 95% CI) | 0.94 [0.79, 1.11] |
| Analysis 17.2  Comparison 17 Oral ‐ All cause mortality ‐ end of intervention, Outcome 2 All‐cause mortality ‐ bias. | ||||
| 2.1 High risk of bias | 33 | 8529 | Risk Ratio (M‐H, Random, 95% CI) | 0.94 [0.79, 1.11] |
| 2.2 Low risk of bias | 0 | 0 | Risk Ratio (M‐H, Random, 95% CI) | 0.0 [0.0, 0.0] |
| 3 All‐cause mortality ‐ medical speciality Show forest plot | 33 | 8529 | Risk Ratio (M‐H, Random, 95% CI) | 0.95 [0.80, 1.12] |
| Analysis 17.3  Comparison 17 Oral ‐ All cause mortality ‐ end of intervention, Outcome 3 All‐cause mortality ‐ medical speciality. | ||||
| 3.1 Cardiology | 0 | 0 | Risk Ratio (M‐H, Random, 95% CI) | 0.0 [0.0, 0.0] |
| 3.2 Medical gastroenterology and hepatology | 1 | 36 | Risk Ratio (M‐H, Random, 95% CI) | 0.45 [0.10, 2.01] |
| 3.3 Geriatrics | 9 | 1559 | Risk Ratio (M‐H, Random, 95% CI) | 0.75 [0.56, 0.99] |
| 3.4 Pulmonary disease | 2 | 93 | Risk Ratio (M‐H, Random, 95% CI) | 0.49 [0.16, 1.54] |
| 3.5 Endocrinology | 0 | 0 | Risk Ratio (M‐H, Random, 95% CI) | 0.0 [0.0, 0.0] |
| 3.6 Infectious diseases | 0 | 0 | Risk Ratio (M‐H, Random, 95% CI) | 0.0 [0.0, 0.0] |
| 3.7 Rheumatology | 0 | 0 | Risk Ratio (M‐H, Random, 95% CI) | 0.0 [0.0, 0.0] |
| 3.8 Haematology | 0 | 0 | Risk Ratio (M‐H, Random, 95% CI) | 0.0 [0.0, 0.0] |
| 3.9 Nephrology | 0 | 0 | Risk Ratio (M‐H, Random, 95% CI) | 0.0 [0.0, 0.0] |
| 3.10 Gastroenterologic surgery | 11 | 1267 | Risk Ratio (M‐H, Random, 95% CI) | 1.24 [0.65, 2.38] |
| 3.11 Trauma surgery | 0 | 0 | Risk Ratio (M‐H, Random, 95% CI) | 0.0 [0.0, 0.0] |
| 3.12 Orthopaedics | 4 | 371 | Risk Ratio (M‐H, Random, 95% CI) | 1.69 [0.53, 5.36] |
| 3.13 Plastic, reconstructive and aesthetic surgery | 0 | 0 | Risk Ratio (M‐H, Random, 95% CI) | 0.0 [0.0, 0.0] |
| 3.14 Vascular surgery | 0 | 0 | Risk Ratio (M‐H, Random, 95% CI) | 0.0 [0.0, 0.0] |
| 3.15 Transplant surgery | 1 | 37 | Risk Ratio (M‐H, Random, 95% CI) | 0.35 [0.02, 8.09] |
| 3.16 Urology | 0 | 0 | Risk Ratio (M‐H, Random, 95% CI) | 0.0 [0.0, 0.0] |
| 3.17 Thoracic surgery | 0 | 0 | Risk Ratio (M‐H, Random, 95% CI) | 0.0 [0.0, 0.0] |
| 3.18 Neurological surgery | 0 | 0 | Risk Ratio (M‐H, Random, 95% CI) | 0.0 [0.0, 0.0] |
| 3.19 Oro‐maxillo‐facial surgery | 0 | 0 | Risk Ratio (M‐H, Random, 95% CI) | 0.0 [0.0, 0.0] |
| 3.20 Anaesthesiology | 0 | 0 | Risk Ratio (M‐H, Random, 95% CI) | 0.0 [0.0, 0.0] |
| 3.21 Emergency medicine | 0 | 0 | Risk Ratio (M‐H, Random, 95% CI) | 0.0 [0.0, 0.0] |
| 3.22 Psychiatry | 0 | 0 | Risk Ratio (M‐H, Random, 95% CI) | 0.0 [0.0, 0.0] |
| 3.23 Neurology | 3 | 4092 | Risk Ratio (M‐H, Random, 95% CI) | 0.99 [0.76, 1.27] |
| 3.24 Oncology | 0 | 0 | Risk Ratio (M‐H, Random, 95% CI) | 0.0 [0.0, 0.0] |
| 3.25 Dermatology | 0 | 0 | Risk Ratio (M‐H, Random, 95% CI) | 0.0 [0.0, 0.0] |
| 3.26 Gynaecology | 0 | 0 | Risk Ratio (M‐H, Random, 95% CI) | 0.0 [0.0, 0.0] |
| 3.27 Mixed | 2 | 1074 | Risk Ratio (M‐H, Random, 95% CI) | 1.24 [0.73, 2.12] |
| 4 All‐cause mortality ‐ based on adequacy of the amount of calories Show forest plot | 33 | 8529 | Risk Ratio (M‐H, Random, 95% CI) | 0.94 [0.79, 1.11] |
| Analysis 17.4  Comparison 17 Oral ‐ All cause mortality ‐ end of intervention, Outcome 4 All‐cause mortality ‐ based on adequacy of the amount of calories. | ||||
| 4.1 Clearly adequate in experimental group and clearly inadequate in control group | 4 | 260 | Risk Ratio (M‐H, Random, 95% CI) | 1.08 [0.34, 3.47] |
| 4.2 Inadequate in the experimental group or adequate in the control group | 12 | 5540 | Risk Ratio (M‐H, Random, 95% CI) | 0.94 [0.76, 1.17] |
| 4.3 Experimental group is overfed | 2 | 69 | Risk Ratio (M‐H, Random, 95% CI) | 0.53 [0.14, 1.98] |
| 4.4 Unclear intake in experimental group or control group | 15 | 2660 | Risk Ratio (M‐H, Random, 95% CI) | 0.93 [0.62, 1.38] |
| 5 All‐cause mortality ‐ different screening tools Show forest plot | 33 | 8529 | Risk Ratio (M‐H, Random, 95% CI) | 0.94 [0.79, 1.11] |
| Analysis 17.5  Comparison 17 Oral ‐ All cause mortality ‐ end of intervention, Outcome 5 All‐cause mortality ‐ different screening tools. | ||||
| 5.1 NRS 2002 | 0 | 0 | Risk Ratio (M‐H, Random, 95% CI) | 0.0 [0.0, 0.0] |
| 5.2 MUST | 0 | 0 | Risk Ratio (M‐H, Random, 95% CI) | 0.0 [0.0, 0.0] |
| 5.3 MNA | 2 | 117 | Risk Ratio (M‐H, Random, 95% CI) | 0.61 [0.12, 3.18] |
| 5.4 SGA | 1 | 525 | Risk Ratio (M‐H, Random, 95% CI) | 1.51 [0.99, 2.31] |
| 5.5 Other means | 30 | 7887 | Risk Ratio (M‐H, Random, 95% CI) | 0.87 [0.73, 1.04] |
| 6 All‐cause mortality ‐ participants characterised as 'at nutritional risk' due to one of the following conditions Show forest plot | 33 | 8529 | Risk Ratio (M‐H, Random, 95% CI) | 0.94 [0.79, 1.11] |
| Analysis 17.6  Comparison 17 Oral ‐ All cause mortality ‐ end of intervention, Outcome 6 All‐cause mortality ‐ participants characterised as 'at nutritional risk' due to one of the following conditions. | ||||
| 6.1 Major surgery | 13 | 1364 | Risk Ratio (M‐H, Random, 95% CI) | 0.92 [0.49, 1.72] |
| 6.2 Stroke | 2 | 4063 | Risk Ratio (M‐H, Random, 95% CI) | 0.96 [0.74, 1.24] |
| 6.3 ICU participants including trauma | 0 | 0 | Risk Ratio (M‐H, Random, 95% CI) | 0.0 [0.0, 0.0] |
| 6.4 Frail elderly participants with less severe conditions known to increase protein requirements | 9 | 953 | Risk Ratio (M‐H, Random, 95% CI) | 0.85 [0.55, 1.30] |
| 6.5 Participants do not fall into one of the categories above | 9 | 2149 | Risk Ratio (M‐H, Random, 95% CI) | 0.93 [0.62, 1.39] |
| 7 All‐cause mortality ‐ participants characterised as 'at nutritional risk' due to one of the following criteria Show forest plot | 33 | 8529 | Risk Ratio (M‐H, Random, 95% CI) | 0.94 [0.79, 1.11] |
| Analysis 17.7  Comparison 17 Oral ‐ All cause mortality ‐ end of intervention, Outcome 7 All‐cause mortality ‐ participants characterised as 'at nutritional risk' due to one of the following criteria. | ||||
| 7.1 BMI less than 20.5 kg/m2 | 1 | 37 | Risk Ratio (M‐H, Random, 95% CI) | 0.35 [0.02, 8.09] |
| 7.2 Weight loss of at least 5% during the last three months | 0 | 0 | Risk Ratio (M‐H, Random, 95% CI) | 0.0 [0.0, 0.0] |
| 7.3 Weight loss of at least 10% during the last six months | 0 | 0 | Risk Ratio (M‐H, Random, 95% CI) | 0.0 [0.0, 0.0] |
| 7.4 Insufficient food intake during the last week (50% of requirements or less) | 0 | 0 | Risk Ratio (M‐H, Random, 95% CI) | 0.0 [0.0, 0.0] |
| 7.5 Participants characterised as 'at nutritional risk' by other means | 32 | 8492 | Risk Ratio (M‐H, Random, 95% CI) | 0.94 [0.79, 1.12] |
| 8 All‐cause mortality ‐ participants characterised as 'at nutritional risk' due to biomarkers or anthropometrics Show forest plot | 33 | 8529 | Risk Ratio (M‐H, Random, 95% CI) | 0.94 [0.79, 1.11] |
| Analysis 17.8  Comparison 17 Oral ‐ All cause mortality ‐ end of intervention, Outcome 8 All‐cause mortality ‐ participants characterised as 'at nutritional risk' due to biomarkers or anthropometrics. | ||||
| 8.1 Biomarkers | 1 | 60 | Risk Ratio (M‐H, Random, 95% CI) | 0.43 [0.12, 1.50] |
| 8.2 Anthropometric measures | 6 | 1111 | Risk Ratio (M‐H, Random, 95% CI) | 0.78 [0.52, 1.16] |
| 8.3 Characterised by other means | 26 | 7358 | Risk Ratio (M‐H, Random, 95% CI) | 1.00 [0.80, 1.25] |
| 9 All‐cause mortality ‐ randomisation year Show forest plot | 33 | 8529 | Risk Ratio (M‐H, Random, 95% CI) | 0.94 [0.79, 1.11] |
| Analysis 17.9 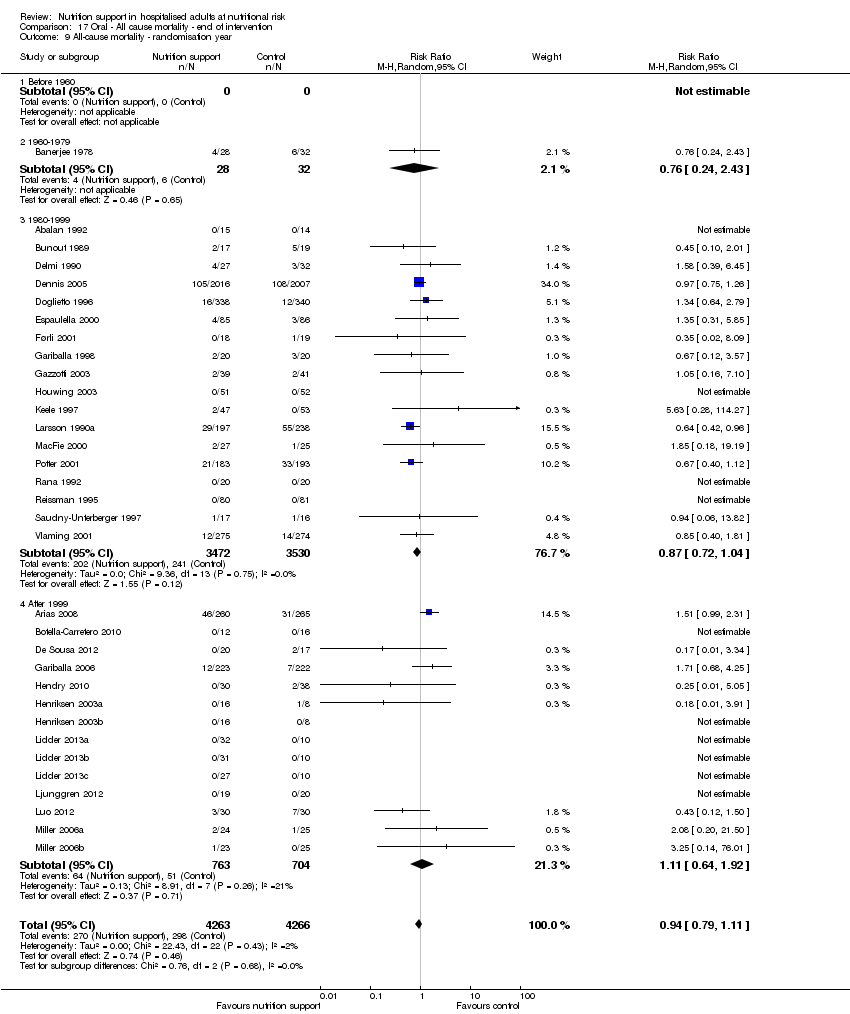 Comparison 17 Oral ‐ All cause mortality ‐ end of intervention, Outcome 9 All‐cause mortality ‐ randomisation year. | ||||
| 9.1 Before 1960 | 0 | 0 | Risk Ratio (M‐H, Random, 95% CI) | 0.0 [0.0, 0.0] |
| 9.2 1960‐1979 | 1 | 60 | Risk Ratio (M‐H, Random, 95% CI) | 0.76 [0.24, 2.43] |
| 9.3 1980‐1999 | 18 | 7002 | Risk Ratio (M‐H, Random, 95% CI) | 0.87 [0.72, 1.04] |
| 9.4 After 1999 | 14 | 1467 | Risk Ratio (M‐H, Random, 95% CI) | 1.11 [0.64, 1.92] |
| 10 All‐cause mortality ‐ trials where the intervention lasts fewer than three days compared with trials where the intervention lasts three days or more Show forest plot | 33 | 8529 | Risk Ratio (M‐H, Random, 95% CI) | 0.94 [0.79, 1.11] |
| Analysis 17.10  Comparison 17 Oral ‐ All cause mortality ‐ end of intervention, Outcome 10 All‐cause mortality ‐ trials where the intervention lasts fewer than three days compared with trials where the intervention lasts three days or more. | ||||
| 10.1 Three days or more | 26 | 7797 | Risk Ratio (M‐H, Random, 95% CI) | 0.87 [0.74, 1.04] |
| 10.2 Less than three days | 6 | 207 | Risk Ratio (M‐H, Random, 95% CI) | 0.18 [0.01, 3.91] |
| 10.3 Unknown | 1 | 525 | Risk Ratio (M‐H, Random, 95% CI) | 1.51 [0.99, 2.31] |
| 11 All‐cause mortality ‐ 'best‐worst case' scenario Show forest plot | 33 | 8793 | Risk Ratio (M‐H, Random, 95% CI) | 0.72 [0.55, 0.95] |
| Analysis 17.11 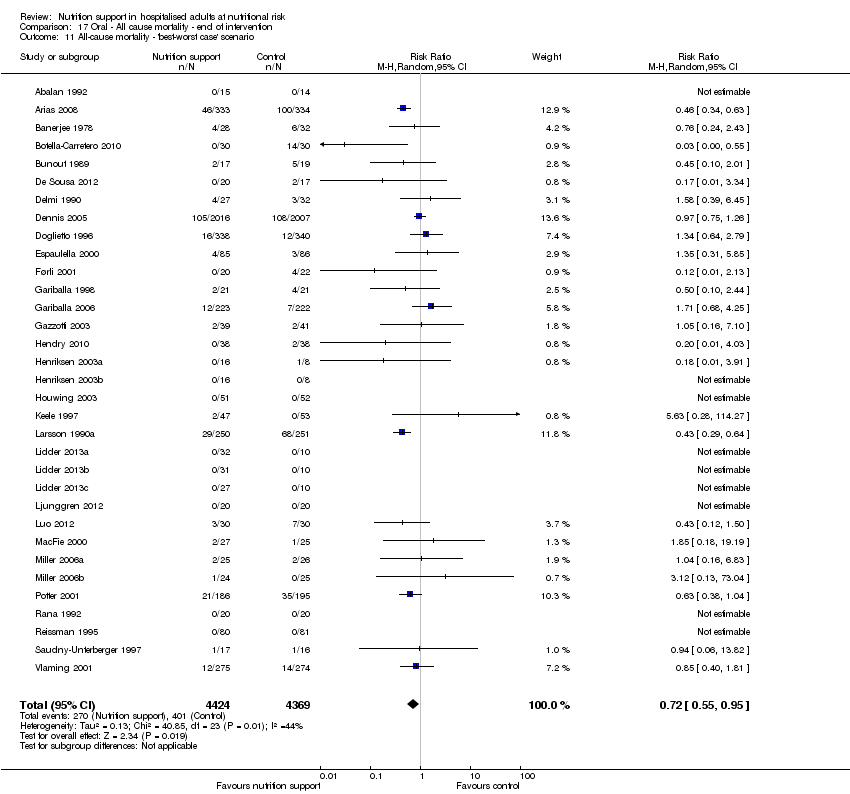 Comparison 17 Oral ‐ All cause mortality ‐ end of intervention, Outcome 11 All‐cause mortality ‐ 'best‐worst case' scenario. | ||||
| 12 All‐cause mortality ‐ 'worst‐best case' scenario Show forest plot | 33 | 8793 | Risk Ratio (M‐H, Random, 95% CI) | 1.33 [0.95, 1.86] |
| Analysis 17.12 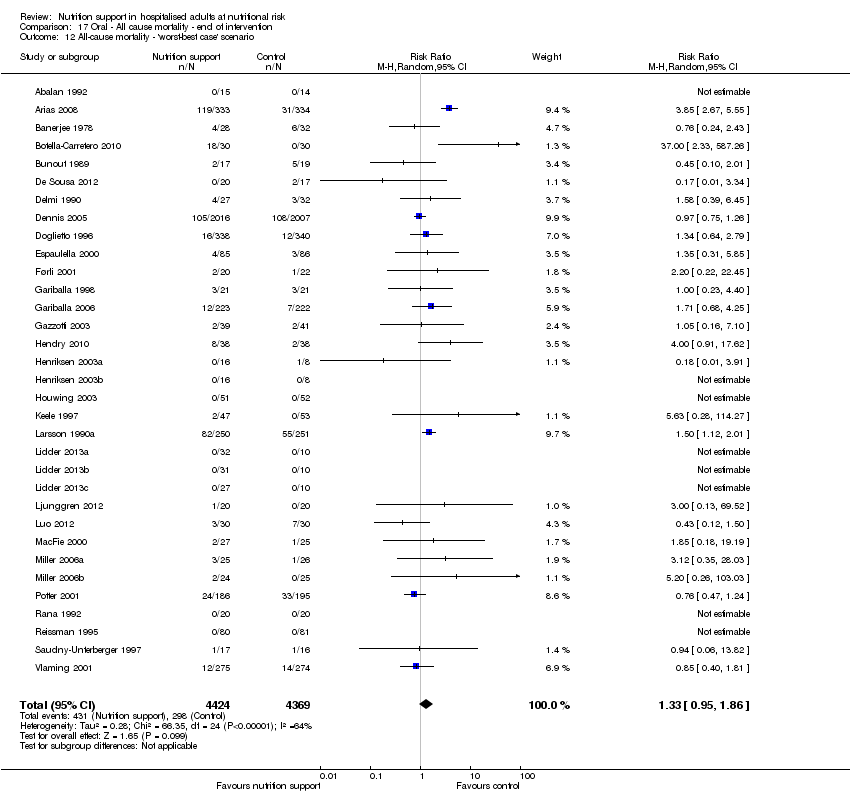 Comparison 17 Oral ‐ All cause mortality ‐ end of intervention, Outcome 12 All‐cause mortality ‐ 'worst‐best case' scenario. | ||||
| 13 All‐cause mortality co‐interventions Show forest plot | 33 | 8529 | Risk Ratio (M‐H, Random, 95% CI) | 0.94 [0.79, 1.11] |
| Analysis 17.13  Comparison 17 Oral ‐ All cause mortality ‐ end of intervention, Outcome 13 All‐cause mortality co‐interventions. | ||||
| 13.1 received nutrition support as co‐intervention | 1 | 60 | Risk Ratio (M‐H, Random, 95% CI) | 0.43 [0.12, 1.50] |
| 13.2 did not receive nutrition support as co‐intervention | 32 | 8469 | Risk Ratio (M‐H, Random, 95% CI) | 0.95 [0.81, 1.12] |
| 13.3 delayed versus early nutrition support | 0 | 0 | Risk Ratio (M‐H, Random, 95% CI) | 0.0 [0.0, 0.0] |
| Outcome or subgroup title | No. of studies | No. of participants | Statistical method | Effect size |
| 1 All‐cause mortality ‐ overall Show forest plot | 32 | 8501 | Risk Ratio (M‐H, Random, 95% CI) | 0.94 [0.77, 1.15] |
| Analysis 18.1  Comparison 18 Oral ‐ All cause mortality ‐ maximum follow‐up, Outcome 1 All‐cause mortality ‐ overall. | ||||
| 2 All‐cause mortality ‐ bias Show forest plot | 32 | 8501 | Risk Ratio (M‐H, Random, 95% CI) | 0.94 [0.77, 1.15] |
| Analysis 18.2  Comparison 18 Oral ‐ All cause mortality ‐ maximum follow‐up, Outcome 2 All‐cause mortality ‐ bias. | ||||
| 2.1 High risk of bias | 32 | 8501 | Risk Ratio (M‐H, Random, 95% CI) | 0.94 [0.77, 1.15] |
| 2.2 Low risk of bias | 0 | 0 | Risk Ratio (M‐H, Random, 95% CI) | 0.0 [0.0, 0.0] |
| 3 All‐cause mortality ‐ medical speciality Show forest plot | 32 | 8501 | Risk Ratio (M‐H, Random, 95% CI) | 0.94 [0.77, 1.15] |
| Analysis 18.3  Comparison 18 Oral ‐ All cause mortality ‐ maximum follow‐up, Outcome 3 All‐cause mortality ‐ medical speciality. | ||||
| 3.1 Cardiology | 0 | 0 | Risk Ratio (M‐H, Random, 95% CI) | 0.0 [0.0, 0.0] |
| 3.2 Medical gastroenterology and hepatology | 1 | 36 | Risk Ratio (M‐H, Random, 95% CI) | 0.45 [0.10, 2.01] |
| 3.3 Geriatrics | 9 | 1552 | Risk Ratio (M‐H, Random, 95% CI) | 0.81 [0.55, 1.19] |
| 3.4 Pulmonary disease | 2 | 93 | Risk Ratio (M‐H, Random, 95% CI) | 0.49 [0.16, 1.54] |
| 3.5 Endocrinology | 0 | 0 | Risk Ratio (M‐H, Random, 95% CI) | 0.0 [0.0, 0.0] |
| 3.6 Infectious diseases | 0 | 0 | Risk Ratio (M‐H, Random, 95% CI) | 0.0 [0.0, 0.0] |
| 3.7 Rheumatology | 0 | 0 | Risk Ratio (M‐H, Random, 95% CI) | 0.0 [0.0, 0.0] |
| 3.8 Haematology | 0 | 0 | Risk Ratio (M‐H, Random, 95% CI) | 0.0 [0.0, 0.0] |
| 3.9 Nephrology | 0 | 0 | Risk Ratio (M‐H, Random, 95% CI) | 0.0 [0.0, 0.0] |
| 3.10 Gastroenterologic surgery | 10 | 1267 | Risk Ratio (M‐H, Random, 95% CI) | 1.14 [0.61, 2.12] |
| 3.11 Trauma surgery | 0 | 0 | Risk Ratio (M‐H, Random, 95% CI) | 0.0 [0.0, 0.0] |
| 3.12 Ortopaedics | 4 | 361 | Risk Ratio (M‐H, Random, 95% CI) | 1.80 [0.92, 3.52] |
| 3.13 Plastic, reconstructive, and aesthetic surgery | 0 | 0 | Risk Ratio (M‐H, Random, 95% CI) | 0.0 [0.0, 0.0] |
| 3.14 Vascular surgery | 0 | 0 | Risk Ratio (M‐H, Random, 95% CI) | 0.0 [0.0, 0.0] |
| 3.15 Transplant surgery | 1 | 37 | Risk Ratio (M‐H, Random, 95% CI) | 0.35 [0.02, 8.09] |
| 3.16 Urology | 0 | 0 | Risk Ratio (M‐H, Random, 95% CI) | 0.0 [0.0, 0.0] |
| 3.17 Thoracic surgery | 0 | 0 | Risk Ratio (M‐H, Random, 95% CI) | 0.0 [0.0, 0.0] |
| 3.18 Neurological surgery | 0 | 0 | Risk Ratio (M‐H, Random, 95% CI) | 0.0 [0.0, 0.0] |
| 3.19 Oro‐maxillo‐facial surgery | 0 | 0 | Risk Ratio (M‐H, Random, 95% CI) | 0.0 [0.0, 0.0] |
| 3.20 Anaesthesiology | 0 | 0 | Risk Ratio (M‐H, Random, 95% CI) | 0.0 [0.0, 0.0] |
| 3.21 Emergency medicine | 0 | 0 | Risk Ratio (M‐H, Random, 95% CI) | 0.0 [0.0, 0.0] |
| 3.22 Psychiatry | 0 | 0 | Risk Ratio (M‐H, Random, 95% CI) | 0.0 [0.0, 0.0] |
| 3.23 Neurology | 3 | 4081 | Risk Ratio (M‐H, Random, 95% CI) | 0.65 [0.22, 1.93] |
| 3.24 Oncology | 0 | 0 | Risk Ratio (M‐H, Random, 95% CI) | 0.0 [0.0, 0.0] |
| 3.25 Dermatology | 0 | 0 | Risk Ratio (M‐H, Random, 95% CI) | 0.0 [0.0, 0.0] |
| 3.26 Gynaecology | 0 | 0 | Risk Ratio (M‐H, Random, 95% CI) | 0.0 [0.0, 0.0] |
| 3.27 Mixed | 2 | 1074 | Risk Ratio (M‐H, Random, 95% CI) | 1.24 [0.73, 2.12] |
| 4 All‐cause mortality ‐ based on adequacy of the amount of calories Show forest plot | 32 | 8501 | Risk Ratio (M‐H, Random, 95% CI) | 0.94 [0.77, 1.15] |
| Analysis 18.4  Comparison 18 Oral ‐ All cause mortality ‐ maximum follow‐up, Outcome 4 All‐cause mortality ‐ based on adequacy of the amount of calories. | ||||
| 4.1 Clearly adequate in intervention and clearly inadequate in control | 4 | 260 | Risk Ratio (M‐H, Random, 95% CI) | 0.80 [0.17, 3.70] |
| 4.2 Inadequate in the experimental or adequate in the control | 12 | 5512 | Risk Ratio (M‐H, Random, 95% CI) | 0.94 [0.76, 1.17] |
| 4.3 Experimental group is overfed | 2 | 69 | Risk Ratio (M‐H, Random, 95% CI) | 0.53 [0.14, 1.98] |
| 4.4 Unclear intake in control or experimental | 14 | 2660 | Risk Ratio (M‐H, Random, 95% CI) | 0.95 [0.65, 1.38] |
| 5 All‐cause mortality ‐ different screening tools Show forest plot | 32 | 8501 | Risk Ratio (M‐H, Random, 95% CI) | 0.94 [0.77, 1.15] |
| Analysis 18.5 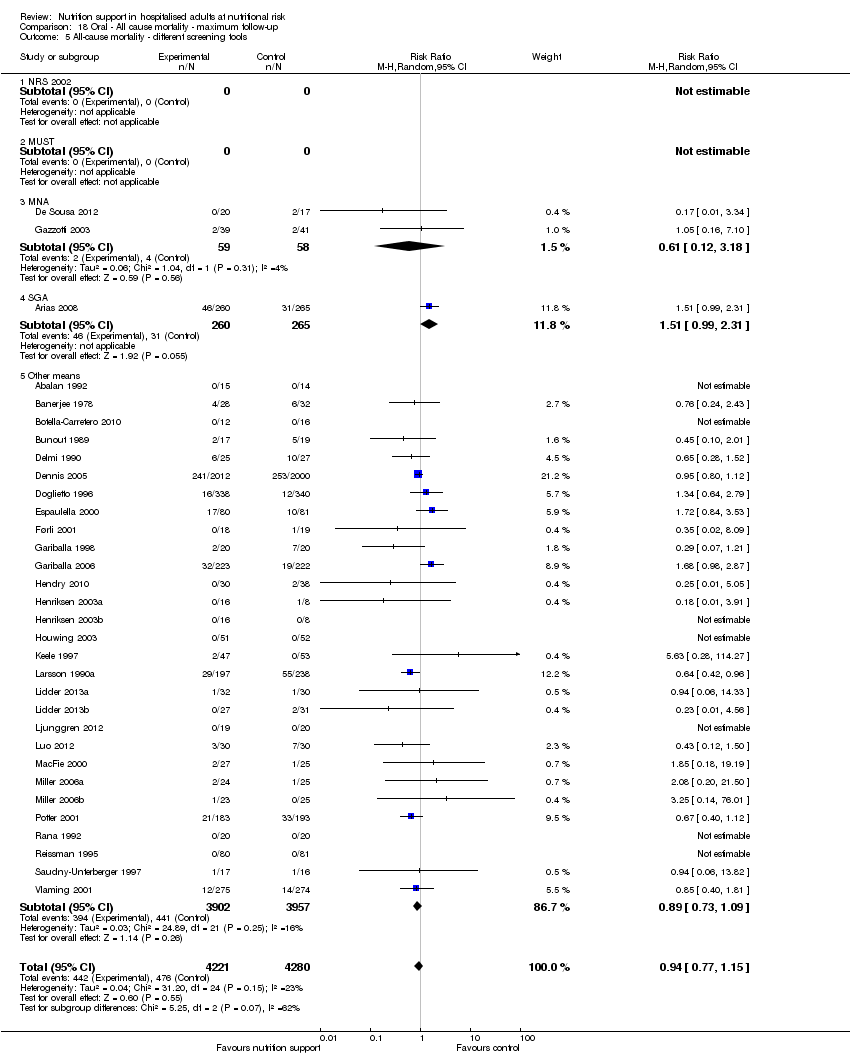 Comparison 18 Oral ‐ All cause mortality ‐ maximum follow‐up, Outcome 5 All‐cause mortality ‐ different screening tools. | ||||
| 5.1 NRS 2002 | 0 | 0 | Risk Ratio (M‐H, Random, 95% CI) | 0.0 [0.0, 0.0] |
| 5.2 MUST | 0 | 0 | Risk Ratio (M‐H, Random, 95% CI) | 0.0 [0.0, 0.0] |
| 5.3 MNA | 2 | 117 | Risk Ratio (M‐H, Random, 95% CI) | 0.61 [0.12, 3.18] |
| 5.4 SGA | 1 | 525 | Risk Ratio (M‐H, Random, 95% CI) | 1.51 [0.99, 2.31] |
| 5.5 Other means | 29 | 7859 | Risk Ratio (M‐H, Random, 95% CI) | 0.89 [0.73, 1.09] |
| 6 All‐cause mortality ‐ participants characterised as 'at nutritional risk' due to one of the following conditions Show forest plot | 32 | 8501 | Risk Ratio (M‐H, Random, 95% CI) | 0.94 [0.77, 1.15] |
| Analysis 18.6  Comparison 18 Oral ‐ All cause mortality ‐ maximum follow‐up, Outcome 6 All‐cause mortality ‐ participants characterised as 'at nutritional risk' due to one of the following conditions. | ||||
| 6.1 Major surgery | 11 | 1304 | Risk Ratio (M‐H, Random, 95% CI) | 1.09 [0.59, 2.00] |
| 6.2 Stroke | 2 | 4052 | Risk Ratio (M‐H, Random, 95% CI) | 0.65 [0.22, 1.93] |
| 6.3 ICU participants including trauma | 0 | 0 | Risk Ratio (M‐H, Random, 95% CI) | 0.0 [0.0, 0.0] |
| 6.4 Frail elderly participants with less severe conditions known to increase protein requirements | 10 | 996 | Risk Ratio (M‐H, Random, 95% CI) | 0.87 [0.57, 1.34] |
| 6.5 Participants do not fall into one of the categories above | 9 | 2149 | Risk Ratio (M‐H, Random, 95% CI) | 0.96 [0.64, 1.46] |
| 7 All‐cause mortality ‐ participants characterised as 'at nutritional risk' due to one of the following criteria Show forest plot | 32 | 8501 | Risk Ratio (M‐H, Random, 95% CI) | 0.94 [0.77, 1.15] |
| Analysis 18.7  Comparison 18 Oral ‐ All cause mortality ‐ maximum follow‐up, Outcome 7 All‐cause mortality ‐ participants characterised as 'at nutritional risk' due to one of the following criteria. | ||||
| 7.1 BMI less than 20.5 kg/m2 | 1 | 37 | Risk Ratio (M‐H, Random, 95% CI) | 0.35 [0.02, 8.09] |
| 7.2 Weight loss of at least 5% during the last three months | 0 | 0 | Risk Ratio (M‐H, Random, 95% CI) | 0.0 [0.0, 0.0] |
| 7.3 Weight loss of at least 10% during the last six months | 0 | 0 | Risk Ratio (M‐H, Random, 95% CI) | 0.0 [0.0, 0.0] |
| 7.4 Insufficient food intake during the last week (50% of requirements or less) | 0 | 0 | Risk Ratio (M‐H, Random, 95% CI) | 0.0 [0.0, 0.0] |
| 7.5 Participants characterised as 'at nutritional risk' by other means | 31 | 8464 | Risk Ratio (M‐H, Random, 95% CI) | 0.94 [0.77, 1.16] |
| 8 All‐cause mortality ‐ participants characterised as 'at nutritional risk' due to biomarkers or anthropometrics Show forest plot | 32 | 8501 | Risk Ratio (M‐H, Random, 95% CI) | 0.94 [0.77, 1.15] |
| Analysis 18.8  Comparison 18 Oral ‐ All cause mortality ‐ maximum follow‐up, Outcome 8 All‐cause mortality ‐ participants characterised as 'at nutritional risk' due to biomarkers or anthropometrics. | ||||
| 8.1 Biomarkers | 1 | 60 | Risk Ratio (M‐H, Random, 95% CI) | 0.43 [0.12, 1.50] |
| 8.2 Anthropometric measures | 6 | 1111 | Risk Ratio (M‐H, Random, 95% CI) | 0.78 [0.52, 1.16] |
| 8.3 Both anthropometrics and biomarkers | 0 | 0 | Risk Ratio (M‐H, Random, 95% CI) | 0.0 [0.0, 0.0] |
| 8.4 Characterised by other means | 25 | 7330 | Risk Ratio (M‐H, Random, 95% CI) | 0.99 [0.77, 1.26] |
| 9 All‐cause mortality ‐ randomisation year Show forest plot | 32 | 8501 | Risk Ratio (M‐H, Random, 95% CI) | 0.94 [0.77, 1.15] |
| Analysis 18.9  Comparison 18 Oral ‐ All cause mortality ‐ maximum follow‐up, Outcome 9 All‐cause mortality ‐ randomisation year. | ||||
| 9.1 Before 1960 | 0 | 0 | Risk Ratio (M‐H, Random, 95% CI) | 0.0 [0.0, 0.0] |
| 9.2 1960 to 1979 | 1 | 60 | Risk Ratio (M‐H, Random, 95% CI) | 0.76 [0.24, 2.43] |
| 9.3 1980 to 1999 | 18 | 6974 | Risk Ratio (M‐H, Random, 95% CI) | 0.86 [0.71, 1.05] |
| 9.4 After 1999 | 13 | 1467 | Risk Ratio (M‐H, Random, 95% CI) | 1.19 [0.77, 1.83] |
| 10 All‐cause mortality ‐ trials where the intervention lasts fewer than three days compared with trials where the intervention lasts three days or more Show forest plot | 32 | 8501 | Risk Ratio (M‐H, Random, 95% CI) | 0.94 [0.77, 1.15] |
| Analysis 18.10 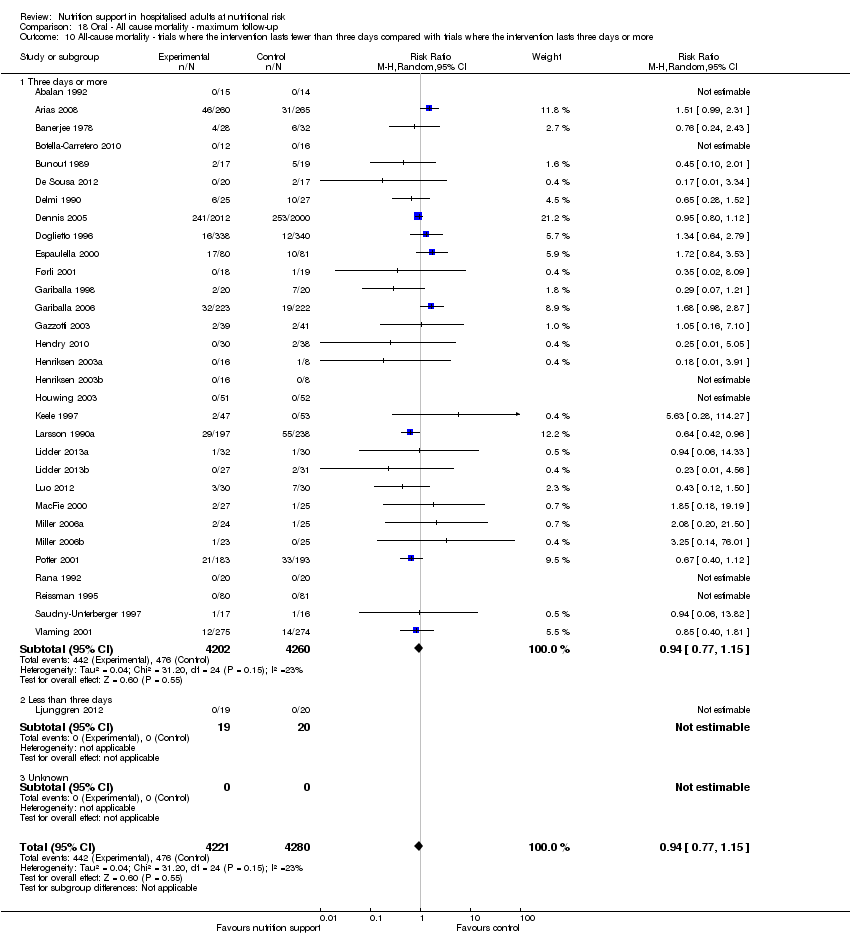 Comparison 18 Oral ‐ All cause mortality ‐ maximum follow‐up, Outcome 10 All‐cause mortality ‐ trials where the intervention lasts fewer than three days compared with trials where the intervention lasts three days or more. | ||||
| 10.1 Three days or more | 31 | 8462 | Risk Ratio (M‐H, Random, 95% CI) | 0.94 [0.77, 1.15] |
| 10.2 Less than three days | 1 | 39 | Risk Ratio (M‐H, Random, 95% CI) | 0.0 [0.0, 0.0] |
| 10.3 Unknown | 0 | 0 | Risk Ratio (M‐H, Random, 95% CI) | 0.0 [0.0, 0.0] |
| 11 All‐cause mortality ‐ 'best‐worst case' scenario Show forest plot | 32 | 8793 | Risk Ratio (M‐H, Random, 95% CI) | 0.70 [0.54, 0.91] |
| Analysis 18.11  Comparison 18 Oral ‐ All cause mortality ‐ maximum follow‐up, Outcome 11 All‐cause mortality ‐ 'best‐worst case' scenario. | ||||
| 12 All‐cause mortality ‐ 'worst‐best case' scenario Show forest plot | 32 | 8793 | Risk Ratio (M‐H, Random, 95% CI) | 1.27 [0.93, 1.73] |
| Analysis 18.12  Comparison 18 Oral ‐ All cause mortality ‐ maximum follow‐up, Outcome 12 All‐cause mortality ‐ 'worst‐best case' scenario. | ||||
| 13 All‐cause mortality co‐interventions Show forest plot | 131 | 22435 | Risk Ratio (M‐H, Fixed, 95% CI) | 0.91 [0.86, 0.98] |
| Analysis 18.13 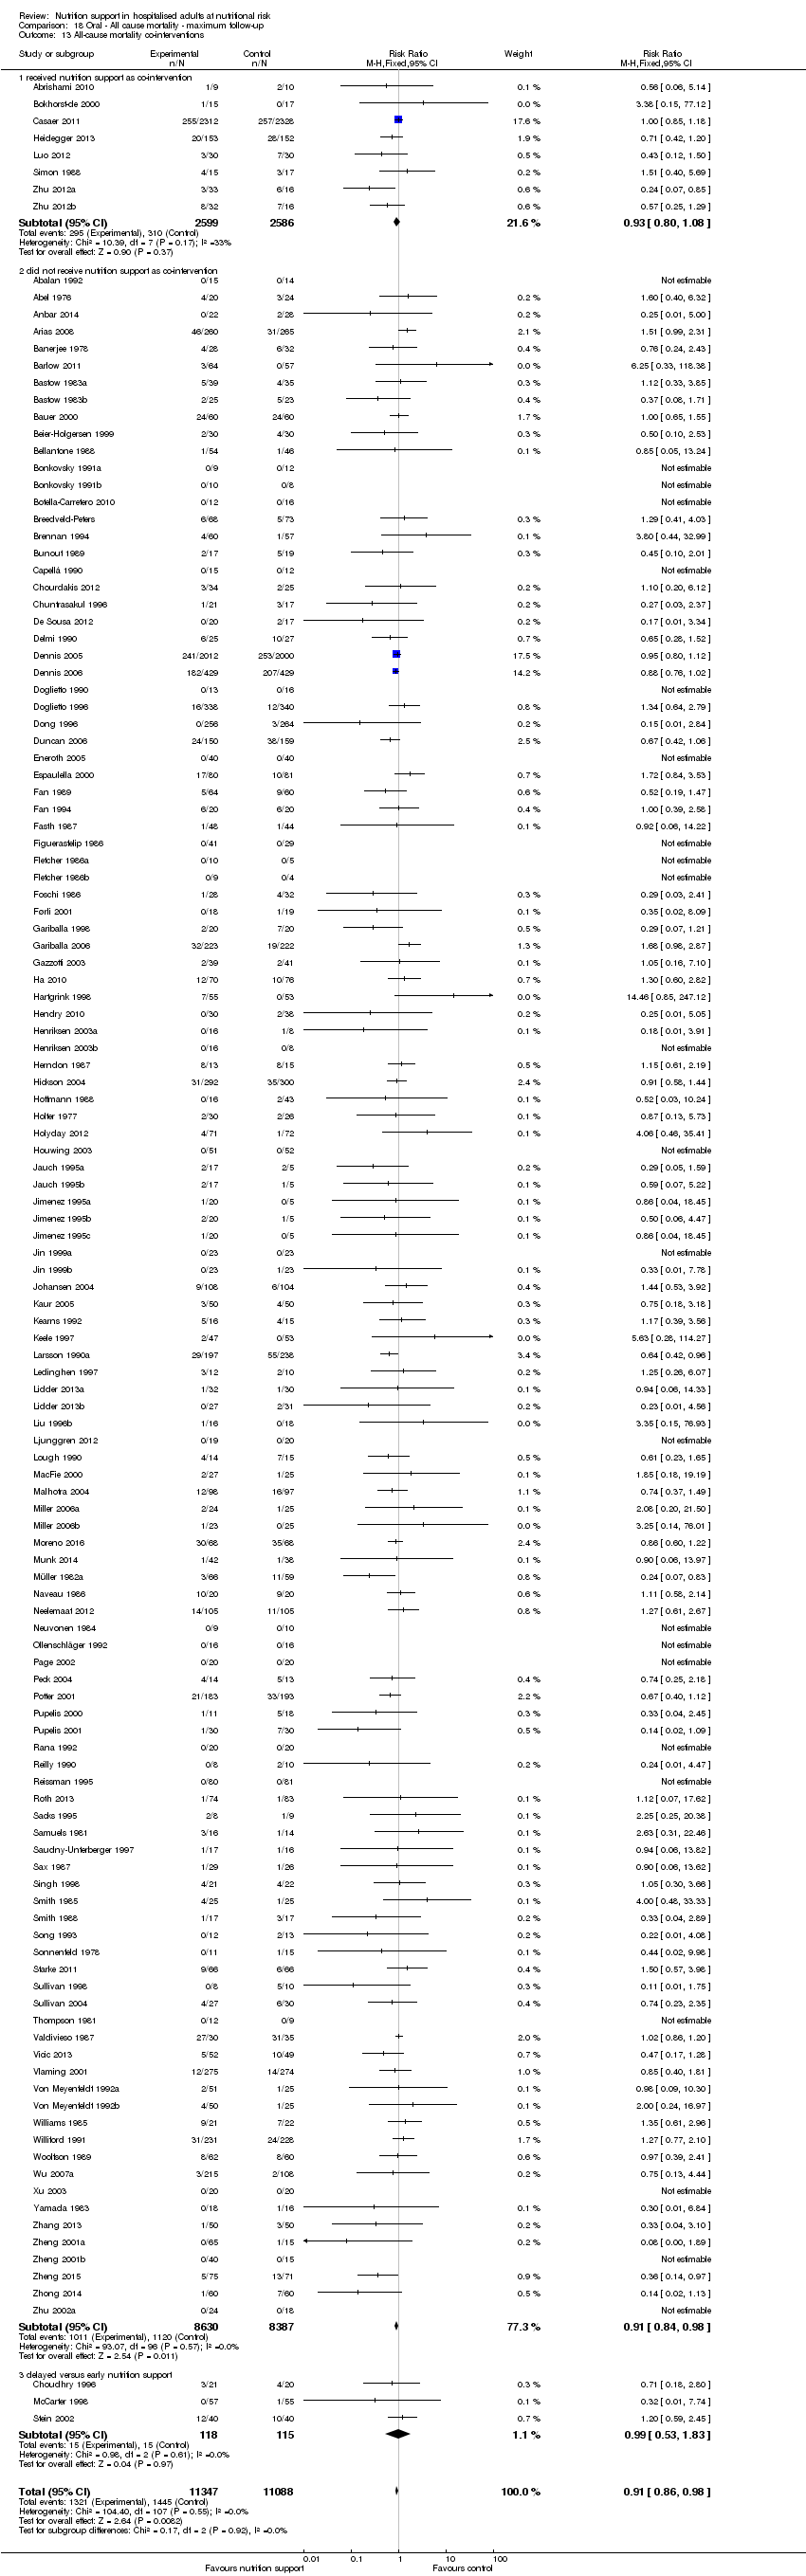 Comparison 18 Oral ‐ All cause mortality ‐ maximum follow‐up, Outcome 13 All‐cause mortality co‐interventions. | ||||
| 13.1 received nutrition support as co‐intervention | 8 | 5185 | Risk Ratio (M‐H, Fixed, 95% CI) | 0.93 [0.80, 1.08] |
| 13.2 did not receive nutrition support as co‐intervention | 120 | 17017 | Risk Ratio (M‐H, Fixed, 95% CI) | 0.91 [0.84, 0.98] |
| 13.3 delayed versus early nutrition support | 3 | 233 | Risk Ratio (M‐H, Fixed, 95% CI) | 0.99 [0.53, 1.83] |
| Outcome or subgroup title | No. of studies | No. of participants | Statistical method | Effect size |
| 1 Serious adverse events ‐ overall Show forest plot | 33 | 8569 | Risk Ratio (M‐H, Random, 95% CI) | 0.92 [0.79, 1.06] |
| Analysis 19.1 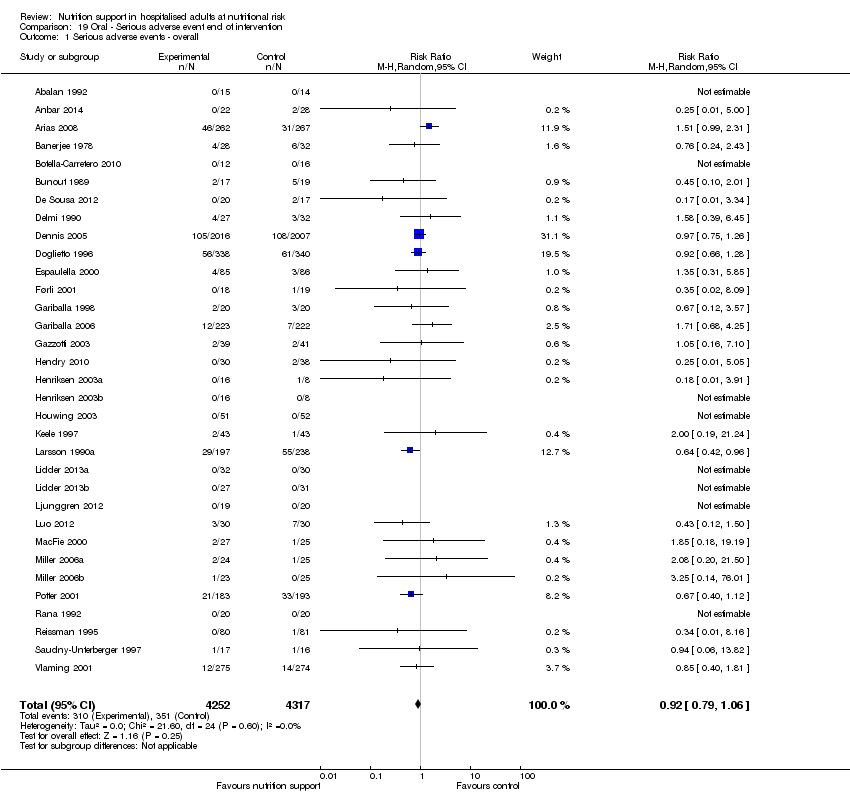 Comparison 19 Oral ‐ Serious adverse event end of intervention, Outcome 1 Serious adverse events ‐ overall. | ||||
| 2 Serious adverse events ‐ bias Show forest plot | 33 | 8569 | Risk Ratio (M‐H, Random, 95% CI) | 0.92 [0.79, 1.06] |
| Analysis 19.2 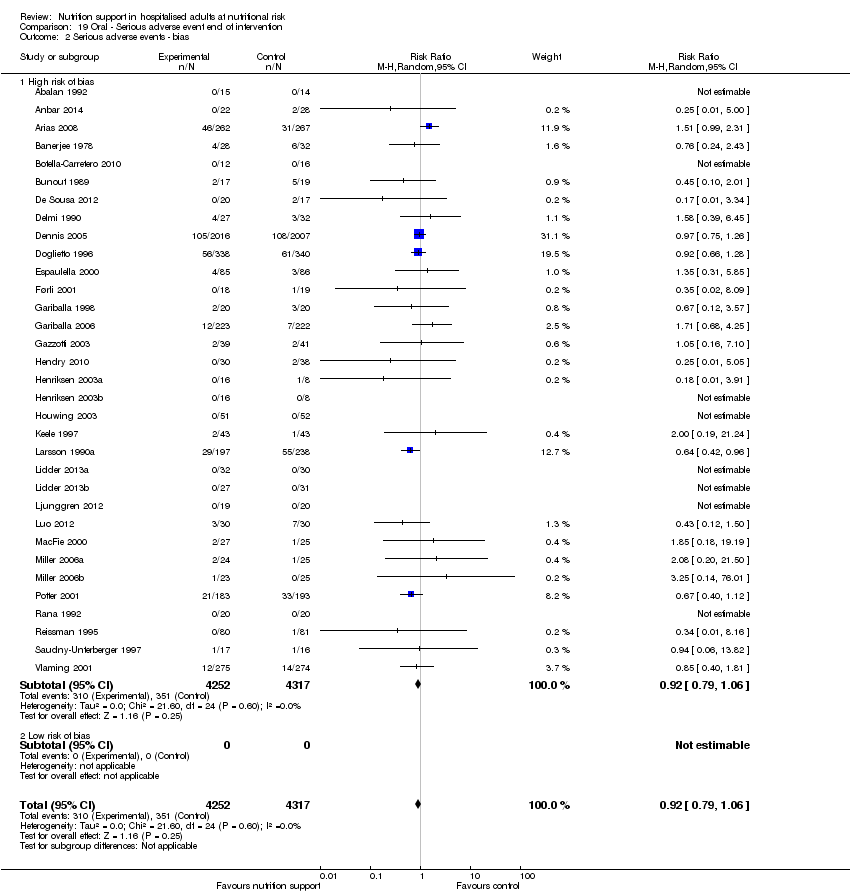 Comparison 19 Oral ‐ Serious adverse event end of intervention, Outcome 2 Serious adverse events ‐ bias. | ||||
| 2.1 High risk of bias | 33 | 8569 | Risk Ratio (M‐H, Random, 95% CI) | 0.92 [0.79, 1.06] |
| 2.2 Low risk of bias | 0 | 0 | Risk Ratio (M‐H, Random, 95% CI) | 0.0 [0.0, 0.0] |
| 3 Serious adverse events ‐ by medical specialty Show forest plot | 33 | 8569 | Risk Ratio (M‐H, Random, 95% CI) | 0.92 [0.79, 1.06] |
| Analysis 19.3  Comparison 19 Oral ‐ Serious adverse event end of intervention, Outcome 3 Serious adverse events ‐ by medical specialty. | ||||
| 3.1 Cardiology | 0 | 0 | Risk Ratio (M‐H, Random, 95% CI) | 0.0 [0.0, 0.0] |
| 3.2 Medical gastroenterology and hepatology | 1 | 36 | Risk Ratio (M‐H, Random, 95% CI) | 0.45 [0.10, 2.01] |
| 3.3 Geriatrics | 10 | 1609 | Risk Ratio (M‐H, Random, 95% CI) | 0.74 [0.56, 0.97] |
| 3.4 Pulmonary disease | 2 | 93 | Risk Ratio (M‐H, Random, 95% CI) | 0.49 [0.16, 1.54] |
| 3.5 Endocrinology | 0 | 0 | Risk Ratio (M‐H, Random, 95% CI) | 0.0 [0.0, 0.0] |
| 3.6 Infectious diseases | 0 | 0 | Risk Ratio (M‐H, Random, 95% CI) | 0.0 [0.0, 0.0] |
| 3.7 Rheumatology | 0 | 0 | Risk Ratio (M‐H, Random, 95% CI) | 0.0 [0.0, 0.0] |
| 3.8 Haematology | 0 | 0 | Risk Ratio (M‐H, Random, 95% CI) | 0.0 [0.0, 0.0] |
| 3.9 Nephrology | 0 | 0 | Risk Ratio (M‐H, Random, 95% CI) | 0.0 [0.0, 0.0] |
| 3.10 Gastroenterologic surgery | 10 | 1253 | Risk Ratio (M‐H, Random, 95% CI) | 0.91 [0.66, 1.25] |
| 3.11 Trauma surgery | 0 | 0 | Risk Ratio (M‐H, Random, 95% CI) | 0.0 [0.0, 0.0] |
| 3.12 Ortopaedics | 4 | 371 | Risk Ratio (M‐H, Random, 95% CI) | 1.69 [0.53, 5.36] |
| 3.13 Plastic, reconstructive, and aesthetic surgery | 0 | 0 | Risk Ratio (M‐H, Random, 95% CI) | 0.0 [0.0, 0.0] |
| 3.14 Vascular surgery | 0 | 0 | Risk Ratio (M‐H, Random, 95% CI) | 0.0 [0.0, 0.0] |
| 3.15 Transplant surgery | 1 | 37 | Risk Ratio (M‐H, Random, 95% CI) | 0.35 [0.02, 8.09] |
| 3.16 Urology | 0 | 0 | Risk Ratio (M‐H, Random, 95% CI) | 0.0 [0.0, 0.0] |
| 3.17 Thoracic surgery | 0 | 0 | Risk Ratio (M‐H, Random, 95% CI) | 0.0 [0.0, 0.0] |
| 3.18 Neurological surgery | 0 | 0 | Risk Ratio (M‐H, Random, 95% CI) | 0.0 [0.0, 0.0] |
| 3.19 Oro‐maxillo‐facial surgery | 0 | 0 | Risk Ratio (M‐H, Random, 95% CI) | 0.0 [0.0, 0.0] |
| 3.20 Anaesthesiology | 0 | 0 | Risk Ratio (M‐H, Random, 95% CI) | 0.0 [0.0, 0.0] |
| 3.21 Emergency medicine | 0 | 0 | Risk Ratio (M‐H, Random, 95% CI) | 0.0 [0.0, 0.0] |
| 3.22 Psychiatry | 0 | 0 | Risk Ratio (M‐H, Random, 95% CI) | 0.0 [0.0, 0.0] |
| 3.23 Neurology | 3 | 4092 | Risk Ratio (M‐H, Random, 95% CI) | 0.96 [0.74, 1.24] |
| 3.24 Oncology | 0 | 0 | Risk Ratio (M‐H, Random, 95% CI) | 0.0 [0.0, 0.0] |
| 3.25 Dermatology | 0 | 0 | Risk Ratio (M‐H, Random, 95% CI) | 0.0 [0.0, 0.0] |
| 3.26 Gynaecology | 0 | 0 | Risk Ratio (M‐H, Random, 95% CI) | 0.0 [0.0, 0.0] |
| 3.27 Mixed | 2 | 1078 | Risk Ratio (M‐H, Random, 95% CI) | 1.24 [0.73, 2.12] |
| 4 Serious adverse events ‐ based on adequacy of the amount of calories Show forest plot | 33 | 8569 | Risk Ratio (M‐H, Random, 95% CI) | 0.92 [0.79, 1.06] |
| Analysis 19.4  Comparison 19 Oral ‐ Serious adverse event end of intervention, Outcome 4 Serious adverse events ‐ based on adequacy of the amount of calories. | ||||
| 4.1 Clearly adequate in intervention and clearly inadequate in control | 4 | 246 | Risk Ratio (M‐H, Random, 95% CI) | 0.99 [0.33, 3.02] |
| 4.2 Inadequate in the experimental or adequate in the control | 13 | 5590 | Risk Ratio (M‐H, Random, 95% CI) | 0.91 [0.76, 1.10] |
| 4.3 Experimental group is overfed | 2 | 69 | Risk Ratio (M‐H, Random, 95% CI) | 0.53 [0.14, 1.98] |
| 4.4 Unclear intake in control or experimental | 14 | 2664 | Risk Ratio (M‐H, Random, 95% CI) | 0.92 [0.63, 1.34] |
| 5 Serious adverse events ‐ different screening tools Show forest plot | 33 | 8569 | Risk Ratio (M‐H, Random, 95% CI) | 0.92 [0.79, 1.06] |
| Analysis 19.5  Comparison 19 Oral ‐ Serious adverse event end of intervention, Outcome 5 Serious adverse events ‐ different screening tools. | ||||
| 5.1 NRS 2002 | 0 | 0 | Risk Ratio (M‐H, Random, 95% CI) | 0.0 [0.0, 0.0] |
| 5.2 MUST | 0 | 0 | Risk Ratio (M‐H, Random, 95% CI) | 0.0 [0.0, 0.0] |
| 5.3 MNA | 2 | 117 | Risk Ratio (M‐H, Random, 95% CI) | 0.61 [0.12, 3.18] |
| 5.4 SGA | 1 | 529 | Risk Ratio (M‐H, Random, 95% CI) | 1.51 [0.99, 2.31] |
| 5.5 Other means | 30 | 7923 | Risk Ratio (M‐H, Random, 95% CI) | 0.86 [0.74, 1.01] |
| 6 Serious adverse events ‐ participants characterised as 'at nutritional risk' due to one of the following conditions Show forest plot | 33 | 8569 | Risk Ratio (M‐H, Random, 95% CI) | 0.92 [0.79, 1.06] |
| Analysis 19.6  Comparison 19 Oral ‐ Serious adverse event end of intervention, Outcome 6 Serious adverse events ‐ participants characterised as 'at nutritional risk' due to one of the following conditions. | ||||
| 6.1 Major surgery | 10 | 612 | Risk Ratio (M‐H, Random, 95% CI) | 0.67 [0.22, 2.08] |
| 6.2 Stroke | 2 | 4063 | Risk Ratio (M‐H, Random, 95% CI) | 0.96 [0.74, 1.24] |
| 6.3 ICU participants including trauma | 0 | 0 | Risk Ratio (M‐H, Random, 95% CI) | 0.0 [0.0, 0.0] |
| 6.4 Frail elderly participants with less severe conditions known to increase protein requirements | 11 | 1063 | Risk Ratio (M‐H, Random, 95% CI) | 0.77 [0.52, 1.15] |
| 6.5 Participants do not fall into one of the categories above | 10 | 2831 | Risk Ratio (M‐H, Random, 95% CI) | 0.94 [0.70, 1.26] |
| 7 Serious adverse events ‐ participants characterised as 'at nutritional risk' due to one of the following criteria Show forest plot | 33 | 8569 | Risk Ratio (M‐H, Random, 95% CI) | 0.92 [0.79, 1.06] |
| Analysis 19.7  Comparison 19 Oral ‐ Serious adverse event end of intervention, Outcome 7 Serious adverse events ‐ participants characterised as 'at nutritional risk' due to one of the following criteria. | ||||
| 7.1 BMI less than 20.5 kg/m2 | 1 | 37 | Risk Ratio (M‐H, Random, 95% CI) | 0.35 [0.02, 8.09] |
| 7.2 Weight loss of at least 5% during the last three months | 0 | 0 | Risk Ratio (M‐H, Random, 95% CI) | 0.0 [0.0, 0.0] |
| 7.3 Weight loss of at least 10% during the last six months | 0 | 0 | Risk Ratio (M‐H, Random, 95% CI) | 0.0 [0.0, 0.0] |
| 7.4 Insufficient food intake during the last week (50% of requirements or less) | 0 | 0 | Risk Ratio (M‐H, Random, 95% CI) | 0.0 [0.0, 0.0] |
| 7.5 Participants characterised as 'at nutritional risk' by other means | 32 | 8532 | Risk Ratio (M‐H, Random, 95% CI) | 0.92 [0.79, 1.06] |
| 8 Serious adverse events ‐ participants characterised as 'at nutritional risk' due to biomarkers or anthropometrics Show forest plot | 33 | 8569 | Risk Ratio (M‐H, Random, 95% CI) | 0.92 [0.79, 1.06] |
| Analysis 19.8  Comparison 19 Oral ‐ Serious adverse event end of intervention, Outcome 8 Serious adverse events ‐ participants characterised as 'at nutritional risk' due to biomarkers or anthropometrics. | ||||
| 8.1 Biomarkers | 1 | 60 | Risk Ratio (M‐H, Random, 95% CI) | 0.43 [0.12, 1.50] |
| 8.2 Anthropometric measures | 6 | 1111 | Risk Ratio (M‐H, Random, 95% CI) | 0.78 [0.52, 1.16] |
| 8.3 Mixed | 0 | 0 | Risk Ratio (M‐H, Random, 95% CI) | 0.0 [0.0, 0.0] |
| 8.4 Characterised by other means | 26 | 7398 | Risk Ratio (M‐H, Random, 95% CI) | 0.95 [0.81, 1.12] |
| 9 Serious adverse events ‐ randomisation year Show forest plot | 33 | 8569 | Risk Ratio (M‐H, Random, 95% CI) | 0.92 [0.79, 1.06] |
| Analysis 19.9  Comparison 19 Oral ‐ Serious adverse event end of intervention, Outcome 9 Serious adverse events ‐ randomisation year. | ||||
| 9.1 Before 1960 | 0 | 0 | Risk Ratio (M‐H, Random, 95% CI) | 0.0 [0.0, 0.0] |
| 9.2 1960 to 1979 | 1 | 60 | Risk Ratio (M‐H, Random, 95% CI) | 0.76 [0.24, 2.43] |
| 9.3 1980 to 1999 | 18 | 6988 | Risk Ratio (M‐H, Random, 95% CI) | 0.86 [0.73, 1.01] |
| 9.4 After 1999 | 14 | 1521 | Risk Ratio (M‐H, Random, 95% CI) | 1.05 [0.61, 1.82] |
| 10 Serious adverse events ‐ trials where the intervention lasts fewer than three days compared with trials where the intervention lasts three days or more Show forest plot | 33 | 8569 | Risk Ratio (M‐H, Random, 95% CI) | 0.92 [0.79, 1.06] |
| Analysis 19.10  Comparison 19 Oral ‐ Serious adverse event end of intervention, Outcome 10 Serious adverse events ‐ trials where the intervention lasts fewer than three days compared with trials where the intervention lasts three days or more. | ||||
| 10.1 Three days or more | 31 | 8480 | Risk Ratio (M‐H, Random, 95% CI) | 0.92 [0.80, 1.06] |
| 10.2 Less than three days | 1 | 39 | Risk Ratio (M‐H, Random, 95% CI) | 0.0 [0.0, 0.0] |
| 10.3 Unknown | 1 | 50 | Risk Ratio (M‐H, Random, 95% CI) | 0.25 [0.01, 5.00] |
| 11 Serious adverse events ‐ 'best‐worst case' scenario Show forest plot | 33 | 8844 | Risk Ratio (M‐H, Random, 95% CI) | 0.67 [0.52, 0.86] |
| Analysis 19.11  Comparison 19 Oral ‐ Serious adverse event end of intervention, Outcome 11 Serious adverse events ‐ 'best‐worst case' scenario. | ||||
| 12 Serious adverse events ‐ 'worst‐best case' scenario Show forest plot | 33 | 8844 | Risk Ratio (M‐H, Random, 95% CI) | 1.27 [0.92, 1.75] |
| Analysis 19.12  Comparison 19 Oral ‐ Serious adverse event end of intervention, Outcome 12 Serious adverse events ‐ 'worst‐best case' scenario. | ||||
| 13 Serious adverse events co‐interventions Show forest plot | 134 | 21960 | Risk Ratio (M‐H, Fixed, 95% CI) | 0.91 [0.84, 0.99] |
| Analysis 19.13  Comparison 19 Oral ‐ Serious adverse event end of intervention, Outcome 13 Serious adverse events co‐interventions. | ||||
| 13.1 received nutrition support as co‐intervention | 8 | 5178 | Risk Ratio (M‐H, Fixed, 95% CI) | 0.96 [0.79, 1.17] |
| 13.2 did not receive nutrition support as co‐intervention | 119 | 16359 | Risk Ratio (M‐H, Fixed, 95% CI) | 0.90 [0.83, 0.99] |
| 13.3 delayed versus early nutrition support | 7 | 423 | Risk Ratio (M‐H, Fixed, 95% CI) | 0.89 [0.51, 1.57] |
| Outcome or subgroup title | No. of studies | No. of participants | Statistical method | Effect size |
| 1 Serious adverse events ‐ overall Show forest plot | 33 | 8541 | Risk Ratio (M‐H, Random, 95% CI) | 0.89 [0.74, 1.07] |
| Analysis 20.1  Comparison 20 Oral ‐ Serious adverse event maximum follow‐up, Outcome 1 Serious adverse events ‐ overall. | ||||
| 2 Serious adverse events ‐ bias Show forest plot | 33 | 8541 | Risk Ratio (M‐H, Random, 95% CI) | 0.89 [0.74, 1.07] |
| Analysis 20.2 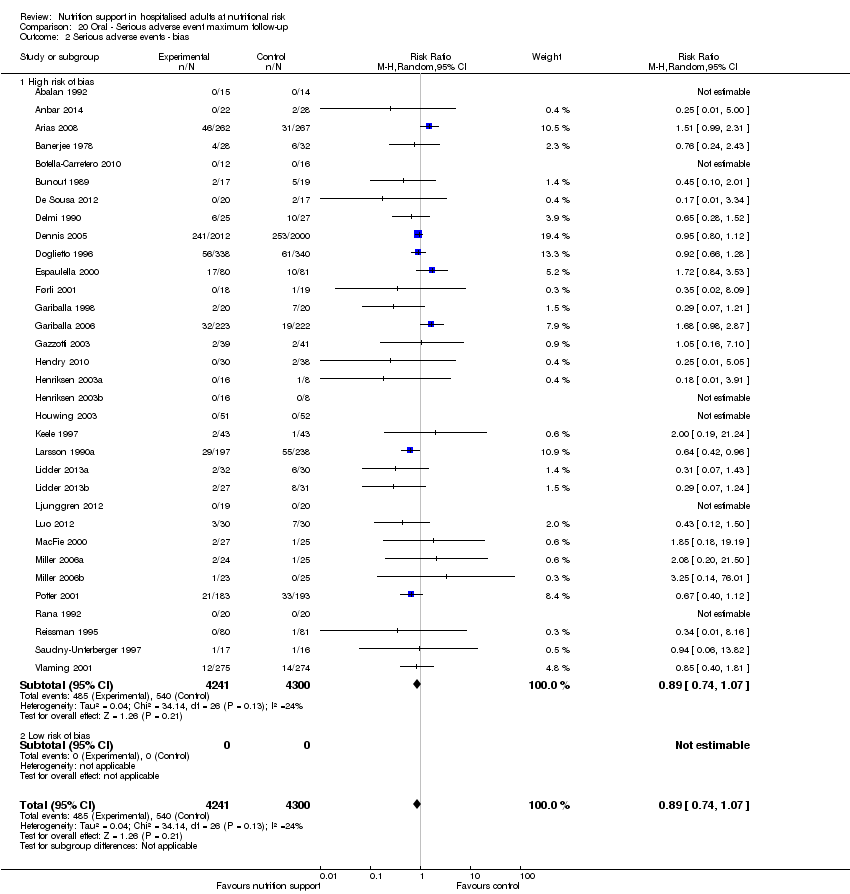 Comparison 20 Oral ‐ Serious adverse event maximum follow‐up, Outcome 2 Serious adverse events ‐ bias. | ||||
| 2.1 High risk of bias | 33 | 8541 | Risk Ratio (M‐H, Random, 95% CI) | 0.89 [0.74, 1.07] |
| 2.2 Low risk of bias | 0 | 0 | Risk Ratio (M‐H, Random, 95% CI) | 0.0 [0.0, 0.0] |
| 3 Serious adverse events ‐ by medical speciality Show forest plot | 33 | 8541 | Risk Ratio (M‐H, Random, 95% CI) | 0.89 [0.74, 1.07] |
| Analysis 20.3  Comparison 20 Oral ‐ Serious adverse event maximum follow‐up, Outcome 3 Serious adverse events ‐ by medical speciality. | ||||
| 3.1 Cardiology | 0 | 0 | Risk Ratio (M‐H, Random, 95% CI) | 0.0 [0.0, 0.0] |
| 3.2 Medical gastroenterology and hepatology | 1 | 36 | Risk Ratio (M‐H, Random, 95% CI) | 0.45 [0.10, 2.01] |
| 3.3 Geriatrics | 10 | 1602 | Risk Ratio (M‐H, Random, 95% CI) | 0.80 [0.55, 1.15] |
| 3.4 Pulmonary disease | 2 | 93 | Risk Ratio (M‐H, Random, 95% CI) | 0.49 [0.16, 1.54] |
| 3.5 Endocrinology | 0 | 0 | Risk Ratio (M‐H, Random, 95% CI) | 0.0 [0.0, 0.0] |
| 3.6 Infectious diseases | 0 | 0 | Risk Ratio (M‐H, Random, 95% CI) | 0.0 [0.0, 0.0] |
| 3.7 Rheumatology | 0 | 0 | Risk Ratio (M‐H, Random, 95% CI) | 0.0 [0.0, 0.0] |
| 3.8 Haematology | 0 | 0 | Risk Ratio (M‐H, Random, 95% CI) | 0.0 [0.0, 0.0] |
| 3.9 Nephrology | 0 | 0 | Risk Ratio (M‐H, Random, 95% CI) | 0.0 [0.0, 0.0] |
| 3.10 Gastroenterologic surgery | 10 | 1253 | Risk Ratio (M‐H, Random, 95% CI) | 0.83 [0.61, 1.12] |
| 3.11 Trauma surgery | 0 | 0 | Risk Ratio (M‐H, Random, 95% CI) | 0.0 [0.0, 0.0] |
| 3.12 Ortopaedics | 4 | 361 | Risk Ratio (M‐H, Random, 95% CI) | 1.80 [0.92, 3.52] |
| 3.13 Plastic, reconstructive, and aesthetic surgery | 0 | 0 | Risk Ratio (M‐H, Random, 95% CI) | 0.0 [0.0, 0.0] |
| 3.14 Vascular surgery | 0 | 0 | Risk Ratio (M‐H, Random, 95% CI) | 0.0 [0.0, 0.0] |
| 3.15 Transplant surgery | 1 | 37 | Risk Ratio (M‐H, Random, 95% CI) | 0.35 [0.02, 8.09] |
| 3.16 Urology | 0 | 0 | Risk Ratio (M‐H, Random, 95% CI) | 0.0 [0.0, 0.0] |
| 3.17 Thoracic surgery | 0 | 0 | Risk Ratio (M‐H, Random, 95% CI) | 0.0 [0.0, 0.0] |
| 3.18 Neurological surgery | 0 | 0 | Risk Ratio (M‐H, Random, 95% CI) | 0.0 [0.0, 0.0] |
| 3.19 Oro‐maxillo‐facial surgery | 0 | 0 | Risk Ratio (M‐H, Random, 95% CI) | 0.0 [0.0, 0.0] |
| 3.20 Anaesthesiology | 0 | 0 | Risk Ratio (M‐H, Random, 95% CI) | 0.0 [0.0, 0.0] |
| 3.21 Emergency medicine | 0 | 0 | Risk Ratio (M‐H, Random, 95% CI) | 0.0 [0.0, 0.0] |
| 3.22 Psychiatry | 0 | 0 | Risk Ratio (M‐H, Random, 95% CI) | 0.0 [0.0, 0.0] |
| 3.23 Neurology | 3 | 4081 | Risk Ratio (M‐H, Random, 95% CI) | 0.65 [0.22, 1.93] |
| 3.24 Oncology | 0 | 0 | Risk Ratio (M‐H, Random, 95% CI) | 0.0 [0.0, 0.0] |
| 3.25 Dermatology | 0 | 0 | Risk Ratio (M‐H, Random, 95% CI) | 0.0 [0.0, 0.0] |
| 3.26 Gynaecology | 0 | 0 | Risk Ratio (M‐H, Random, 95% CI) | 0.0 [0.0, 0.0] |
| 3.27 Mixed | 2 | 1078 | Risk Ratio (M‐H, Random, 95% CI) | 1.24 [0.73, 2.12] |
| 4 Serious adverse events ‐ based on adequacy of the amount of calories Show forest plot | 33 | 8541 | Risk Ratio (M‐H, Random, 95% CI) | 0.89 [0.74, 1.07] |
| Analysis 20.4  Comparison 20 Oral ‐ Serious adverse event maximum follow‐up, Outcome 4 Serious adverse events ‐ based on adequacy of the amount of calories. | ||||
| 4.1 Clearly adequate in intervention and clearly inadequate in control | 4 | 246 | Risk Ratio (M‐H, Random, 95% CI) | 0.64 [0.20, 2.00] |
| 4.2 Inadequate in the experimental or adequate in the control | 13 | 5562 | Risk Ratio (M‐H, Random, 95% CI) | 0.93 [0.81, 1.06] |
| 4.3 Experimental group is overfed | 2 | 69 | Risk Ratio (M‐H, Random, 95% CI) | 0.53 [0.14, 1.98] |
| 4.4 Unclear intake in control or experimental | 14 | 2664 | Risk Ratio (M‐H, Random, 95% CI) | 0.83 [0.56, 1.23] |
| 5 Serious adverse events ‐ different screening tools Show forest plot | 33 | 8541 | Risk Ratio (M‐H, Random, 95% CI) | 0.89 [0.74, 1.07] |
| Analysis 20.5 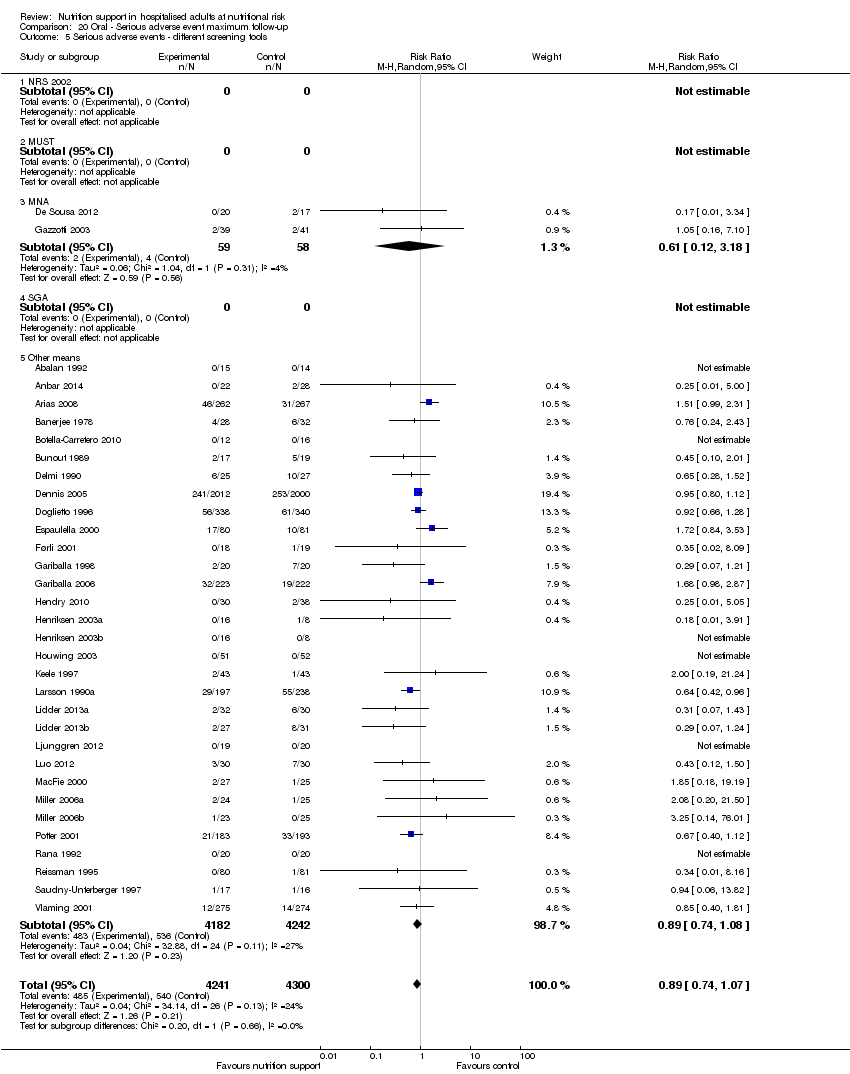 Comparison 20 Oral ‐ Serious adverse event maximum follow‐up, Outcome 5 Serious adverse events ‐ different screening tools. | ||||
| 5.1 NRS 2002 | 0 | 0 | Risk Ratio (M‐H, Random, 95% CI) | 0.0 [0.0, 0.0] |
| 5.2 MUST | 0 | 0 | Risk Ratio (M‐H, Random, 95% CI) | 0.0 [0.0, 0.0] |
| 5.3 MNA | 2 | 117 | Risk Ratio (M‐H, Random, 95% CI) | 0.61 [0.12, 3.18] |
| 5.4 SGA | 0 | 0 | Risk Ratio (M‐H, Random, 95% CI) | 0.0 [0.0, 0.0] |
| 5.5 Other means | 31 | 8424 | Risk Ratio (M‐H, Random, 95% CI) | 0.89 [0.74, 1.08] |
| 6 Serious adverse events ‐ participants characterised as 'at nutritional risk' due to one of the following conditions Show forest plot | 33 | 8541 | Risk Ratio (M‐H, Random, 95% CI) | 0.89 [0.74, 1.07] |
| Analysis 20.6  Comparison 20 Oral ‐ Serious adverse event maximum follow‐up, Outcome 6 Serious adverse events ‐ participants characterised as 'at nutritional risk' due to one of the following conditions. | ||||
| 6.1 Major surgery | 11 | 1290 | Risk Ratio (M‐H, Random, 95% CI) | 0.82 [0.61, 1.11] |
| 6.2 Stroke | 2 | 4052 | Risk Ratio (M‐H, Random, 95% CI) | 0.65 [0.22, 1.93] |
| 6.3 ICU participants including trauma | 0 | 0 | Risk Ratio (M‐H, Random, 95% CI) | 0.0 [0.0, 0.0] |
| 6.4 Frail elderly participants with less severe conditions known to increase protein requirements | 11 | 1046 | Risk Ratio (M‐H, Random, 95% CI) | 0.85 [0.57, 1.27] |
| 6.5 Participants do not fall into one of the categories above | 9 | 2153 | Risk Ratio (M‐H, Random, 95% CI) | 0.96 [0.64, 1.46] |
| 7 Serious adverse events ‐ participants characterised as 'at nutritional risk' due to one of the following criteria Show forest plot | 33 | 8541 | Risk Ratio (M‐H, Random, 95% CI) | 0.89 [0.74, 1.07] |
| Analysis 20.7  Comparison 20 Oral ‐ Serious adverse event maximum follow‐up, Outcome 7 Serious adverse events ‐ participants characterised as 'at nutritional risk' due to one of the following criteria. | ||||
| 7.1 BMI less than 20.5 kg/m2 | 1 | 37 | Risk Ratio (M‐H, Random, 95% CI) | 0.35 [0.02, 8.09] |
| 7.2 Weight loss of at least 5% during the last three months | 0 | 0 | Risk Ratio (M‐H, Random, 95% CI) | 0.0 [0.0, 0.0] |
| 7.3 Weight loss of at least 10% during the last six months | 0 | 0 | Risk Ratio (M‐H, Random, 95% CI) | 0.0 [0.0, 0.0] |
| 7.4 Insufficient food intake during the last week (50% of requirements or less) | 0 | 0 | Risk Ratio (M‐H, Random, 95% CI) | 0.0 [0.0, 0.0] |
| 7.5 Participants characterised as 'at nutritional risk' by other means | 32 | 8504 | Risk Ratio (M‐H, Random, 95% CI) | 0.89 [0.74, 1.07] |
| 8 Serious adverse events ‐ participants characterised as 'at nutritional risk' due to biomarkers or anthropometrics Show forest plot | 33 | 8541 | Risk Ratio (M‐H, Random, 95% CI) | 0.89 [0.74, 1.07] |
| Analysis 20.8  Comparison 20 Oral ‐ Serious adverse event maximum follow‐up, Outcome 8 Serious adverse events ‐ participants characterised as 'at nutritional risk' due to biomarkers or anthropometrics. | ||||
| 8.1 Biomarkers | 1 | 60 | Risk Ratio (M‐H, Random, 95% CI) | 0.43 [0.12, 1.50] |
| 8.2 Anthropometric measures | 6 | 1111 | Risk Ratio (M‐H, Random, 95% CI) | 0.78 [0.52, 1.16] |
| 8.3 Both | 0 | 0 | Risk Ratio (M‐H, Random, 95% CI) | 0.0 [0.0, 0.0] |
| 8.4 Characterised by other means | 26 | 7370 | Risk Ratio (M‐H, Random, 95% CI) | 0.91 [0.72, 1.13] |
| 9 Serious adverse events ‐ randomisation year Show forest plot | 33 | 8541 | Risk Ratio (M‐H, Random, 95% CI) | 0.89 [0.74, 1.07] |
| Analysis 20.9  Comparison 20 Oral ‐ Serious adverse event maximum follow‐up, Outcome 9 Serious adverse events ‐ randomisation year. | ||||
| 9.1 Before 1960 | 0 | 0 | Risk Ratio (M‐H, Random, 95% CI) | 0.0 [0.0, 0.0] |
| 9.2 1960 to 1979 | 1 | 60 | Risk Ratio (M‐H, Random, 95% CI) | 0.76 [0.24, 2.43] |
| 9.3 1980 to 1999 | 18 | 6960 | Risk Ratio (M‐H, Random, 95% CI) | 0.88 [0.78, 1.00] |
| 9.4 After 1999 | 14 | 1521 | Risk Ratio (M‐H, Random, 95% CI) | 0.79 [0.45, 1.39] |
| 10 Serious adverse events ‐ trials where the intervention lasts fewer than three days compared with trials where the intervention lasts three days or more Show forest plot | 32 | 8501 | Risk Ratio (M‐H, Random, 95% CI) | 0.89 [0.74, 1.07] |
| Analysis 20.10  Comparison 20 Oral ‐ Serious adverse event maximum follow‐up, Outcome 10 Serious adverse events ‐ trials where the intervention lasts fewer than three days compared with trials where the intervention lasts three days or more. | ||||
| 10.1 Three days or more | 30 | 8412 | Risk Ratio (M‐H, Random, 95% CI) | 0.89 [0.74, 1.07] |
| 10.2 Less than three days | 1 | 39 | Risk Ratio (M‐H, Random, 95% CI) | 0.0 [0.0, 0.0] |
| 10.3 Unknown | 1 | 50 | Risk Ratio (M‐H, Random, 95% CI) | 0.25 [0.01, 5.00] |
| 11 Serious adverse events ‐ 'best‐worst case' scenario Show forest plot | 33 | 8844 | Risk Ratio (M‐H, Random, 95% CI) | 0.64 [0.50, 0.81] |
| Analysis 20.11  Comparison 20 Oral ‐ Serious adverse event maximum follow‐up, Outcome 11 Serious adverse events ‐ 'best‐worst case' scenario. | ||||
| 12 Serious adverse events ‐ 'worst‐best case' scenario Show forest plot | 33 | 8844 | Risk Ratio (M‐H, Random, 95% CI) | 1.15 [0.86, 1.55] |
| Analysis 20.12  Comparison 20 Oral ‐ Serious adverse event maximum follow‐up, Outcome 12 Serious adverse events ‐ 'worst‐best case' scenario. | ||||
| 13 Serious adverse events co‐interventions Show forest plot | 33 | 8541 | Risk Ratio (M‐H, Fixed, 95% CI) | 0.92 [0.82, 1.03] |
| Analysis 20.13  Comparison 20 Oral ‐ Serious adverse event maximum follow‐up, Outcome 13 Serious adverse events co‐interventions. | ||||
| 13.1 Received nutrition support as co‐intervention | 1 | 60 | Risk Ratio (M‐H, Fixed, 95% CI) | 0.43 [0.12, 1.50] |
| 13.2 did not receive nutrition support as co‐intervention | 32 | 8481 | Risk Ratio (M‐H, Fixed, 95% CI) | 0.92 [0.82, 1.04] |
| 13.3 delayed versus early nutrition support | 0 | 0 | Risk Ratio (M‐H, Fixed, 95% CI) | 0.0 [0.0, 0.0] |
| Outcome or subgroup title | No. of studies | No. of participants | Statistical method | Effect size |
| 1 All‐cause mortality ‐ overall Show forest plot | 36 | 3722 | Risk Ratio (M‐H, Random, 95% CI) | 0.88 [0.75, 1.03] |
| Analysis 21.1  Comparison 21 Enteral ‐ All cause mortality ‐ end of intervention, Outcome 1 All‐cause mortality ‐ overall. | ||||
| 2 All‐cause mortality ‐ bias Show forest plot | 36 | 3722 | Risk Ratio (M‐H, Random, 95% CI) | 0.88 [0.75, 1.03] |
| Analysis 21.2  Comparison 21 Enteral ‐ All cause mortality ‐ end of intervention, Outcome 2 All‐cause mortality ‐ bias. | ||||
| 2.1 High risk of bias | 36 | 3722 | Risk Ratio (M‐H, Random, 95% CI) | 0.88 [0.75, 1.03] |
| 2.2 Low risk of bias | 0 | 0 | Risk Ratio (M‐H, Random, 95% CI) | 0.0 [0.0, 0.0] |
| 3 All‐cause mortality ‐ medical speciality Show forest plot | 36 | 3722 | Risk Ratio (M‐H, Random, 95% CI) | 0.88 [0.75, 1.03] |
| Analysis 21.3  Comparison 21 Enteral ‐ All cause mortality ‐ end of intervention, Outcome 3 All‐cause mortality ‐ medical speciality. | ||||
| 3.1 Cardiology | 0 | 0 | Risk Ratio (M‐H, Random, 95% CI) | 0.0 [0.0, 0.0] |
| 3.2 Medical gastroenterology and hepatology | 4 | 289 | Risk Ratio (M‐H, Random, 95% CI) | 0.75 [0.40, 1.42] |
| 3.3 Geriatrics | 0 | 0 | Risk Ratio (M‐H, Random, 95% CI) | 0.0 [0.0, 0.0] |
| 3.4 Pulmonary disease | 0 | 0 | Risk Ratio (M‐H, Random, 95% CI) | 0.0 [0.0, 0.0] |
| 3.5 Endocrinology | 0 | 0 | Risk Ratio (M‐H, Random, 95% CI) | 0.0 [0.0, 0.0] |
| 3.6 Infectious diseases | 1 | 56 | Risk Ratio (M‐H, Random, 95% CI) | 1.61 [0.66, 3.92] |
| 3.7 Rheumatology | 0 | 0 | Risk Ratio (M‐H, Random, 95% CI) | 0.0 [0.0, 0.0] |
| 3.8 Haematology | 0 | 0 | Risk Ratio (M‐H, Random, 95% CI) | 0.0 [0.0, 0.0] |
| 3.9 Nephrology | 0 | 0 | Risk Ratio (M‐H, Random, 95% CI) | 0.0 [0.0, 0.0] |
| 3.10 Gastroenterologic surgery | 13 | 1063 | Risk Ratio (M‐H, Random, 95% CI) | 0.72 [0.44, 1.18] |
| 3.11 Trauma surgery | 2 | 139 | Risk Ratio (M‐H, Random, 95% CI) | 0.50 [0.20, 1.28] |
| 3.12 Orthopaedics | 4 | 248 | Risk Ratio (M‐H, Random, 95% CI) | 0.89 [0.21, 3.81] |
| 3.13 Plastic, reconstructive and aesthetic surgery | 0 | 0 | Risk Ratio (M‐H, Random, 95% CI) | 0.0 [0.0, 0.0] |
| 3.14 Vascular surgery | 1 | 13 | Risk Ratio (M‐H, Random, 95% CI) | 0.0 [0.0, 0.0] |
| 3.15 Transplant surgery | 0 | 0 | Risk Ratio (M‐H, Random, 95% CI) | 0.0 [0.0, 0.0] |
| 3.16 Urology | 0 | 0 | Risk Ratio (M‐H, Random, 95% CI) | 0.0 [0.0, 0.0] |
| 3.17 Thoracic surgery | 2 | 548 | Risk Ratio (M‐H, Random, 95% CI) | 0.22 [0.03, 1.86] |
| 3.18 Neurological surgery | 0 | 0 | Risk Ratio (M‐H, Random, 95% CI) | 0.0 [0.0, 0.0] |
| 3.19 Oro‐maxillo‐facial surgery | 1 | 32 | Risk Ratio (M‐H, Random, 95% CI) | 3.38 [0.15, 77.12] |
| 3.20 Anaesthesiology | 0 | 0 | Risk Ratio (M‐H, Random, 95% CI) | 0.0 [0.0, 0.0] |
| 3.21 Emergency medicine | 3 | 154 | Risk Ratio (M‐H, Random, 95% CI) | 0.77 [0.31, 1.94] |
| 3.22 Psychiatry | 0 | 0 | Risk Ratio (M‐H, Random, 95% CI) | 0.0 [0.0, 0.0] |
| 3.23 Neurology | 3 | 1027 | Risk Ratio (M‐H, Random, 95% CI) | 0.67 [0.33, 1.37] |
| 3.24 Oncology | 0 | 0 | Risk Ratio (M‐H, Random, 95% CI) | 0.0 [0.0, 0.0] |
| 3.25 Dermatology | 0 | 0 | Risk Ratio (M‐H, Random, 95% CI) | 0.0 [0.0, 0.0] |
| 3.26 Gynaecology | 0 | 0 | Risk Ratio (M‐H, Random, 95% CI) | 0.0 [0.0, 0.0] |
| 3.27 Mixed | 2 | 153 | Risk Ratio (M‐H, Random, 95% CI) | 0.32 [0.03, 2.99] |
| 4 All‐cause mortality ‐ based on adequacy of the amount of calories Show forest plot | 36 | 3722 | Risk Ratio (M‐H, Random, 95% CI) | 0.88 [0.75, 1.03] |
| Analysis 21.4  Comparison 21 Enteral ‐ All cause mortality ‐ end of intervention, Outcome 4 All‐cause mortality ‐ based on adequacy of the amount of calories. | ||||
| 4.1 Clearly adequate in experimental group and clearly inadequate in control group | 7 | 736 | Risk Ratio (M‐H, Random, 95% CI) | 0.70 [0.40, 1.25] |
| 4.2 Inadequate in the experimental group or adequate in the control group | 7 | 410 | Risk Ratio (M‐H, Random, 95% CI) | 0.72 [0.28, 1.85] |
| 4.3 Experimental group is overfed | 2 | 74 | Risk Ratio (M‐H, Random, 95% CI) | 0.76 [0.15, 3.79] |
| 4.4 Unclear intake in experimental group or control group | 20 | 2502 | Risk Ratio (M‐H, Random, 95% CI) | 0.89 [0.73, 1.08] |
| 5 All‐cause mortality ‐ different screening tools Show forest plot | 36 | 3722 | Risk Ratio (M‐H, Random, 95% CI) | 0.88 [0.75, 1.03] |
| Analysis 21.5 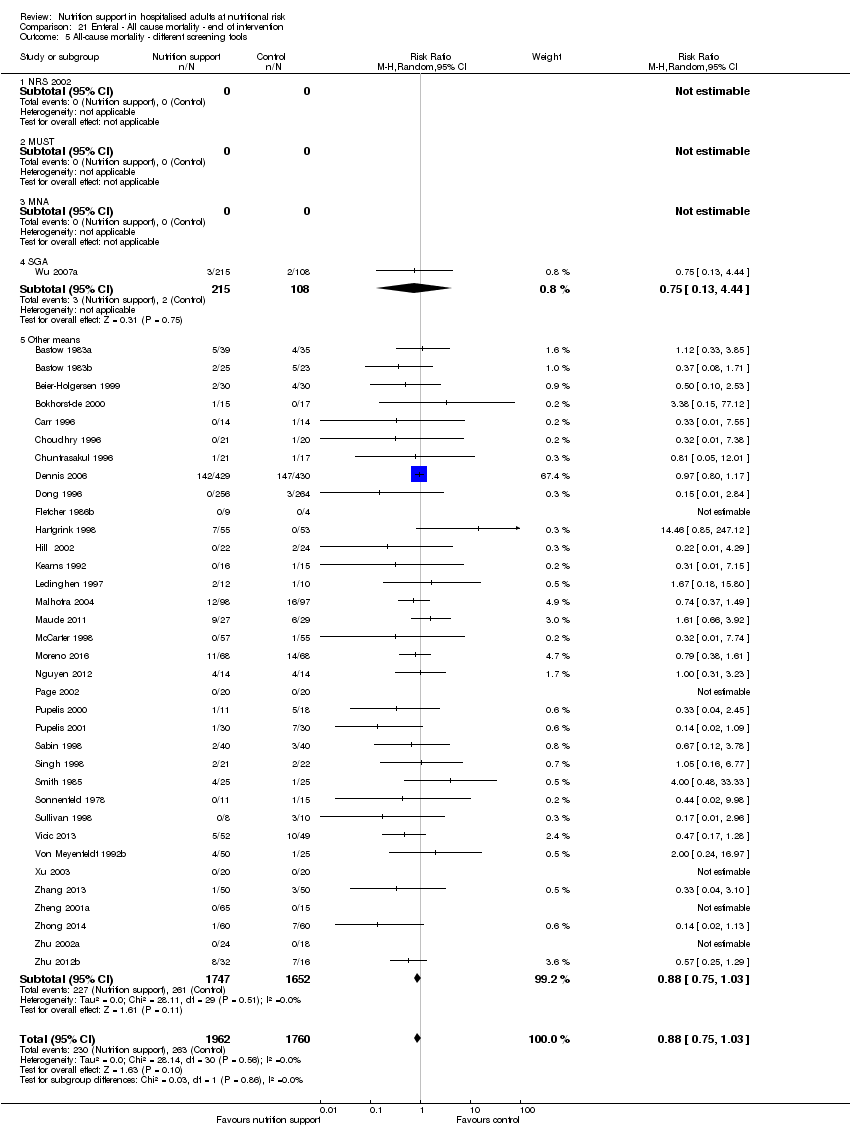 Comparison 21 Enteral ‐ All cause mortality ‐ end of intervention, Outcome 5 All‐cause mortality ‐ different screening tools. | ||||
| 5.1 NRS 2002 | 0 | 0 | Risk Ratio (M‐H, Random, 95% CI) | 0.0 [0.0, 0.0] |
| 5.2 MUST | 0 | 0 | Risk Ratio (M‐H, Random, 95% CI) | 0.0 [0.0, 0.0] |
| 5.3 MNA | 0 | 0 | Risk Ratio (M‐H, Random, 95% CI) | 0.0 [0.0, 0.0] |
| 5.4 SGA | 1 | 323 | Risk Ratio (M‐H, Random, 95% CI) | 0.75 [0.13, 4.44] |
| 5.5 Other means | 35 | 3399 | Risk Ratio (M‐H, Random, 95% CI) | 0.88 [0.75, 1.03] |
| 6 All‐cause mortality ‐ participants characterised as 'at nutritional risk' due to one of the following conditions Show forest plot | 36 | 3722 | Risk Ratio (M‐H, Random, 95% CI) | 0.88 [0.75, 1.03] |
| Analysis 21.6  Comparison 21 Enteral ‐ All cause mortality ‐ end of intervention, Outcome 6 All‐cause mortality ‐ participants characterised as 'at nutritional risk' due to one of the following conditions. | ||||
| 6.1 Major surgery | 18 | 1746 | Risk Ratio (M‐H, Random, 95% CI) | 0.69 [0.45, 1.06] |
| 6.2 Stroke | 3 | 1027 | Risk Ratio (M‐H, Random, 95% CI) | 0.67 [0.33, 1.37] |
| 6.3 ICU participants including trauma | 5 | 293 | Risk Ratio (M‐H, Random, 95% CI) | 0.62 [0.32, 1.21] |
| 6.4 Frail elderly participants with less severe conditions known to increase protein requirements | 2 | 126 | Risk Ratio (M‐H, Random, 95% CI) | 1.59 [0.02, 125.73] |
| 6.5 Participants do not fall into one of the categories above | 8 | 530 | Risk Ratio (M‐H, Random, 95% CI) | 0.95 [0.58, 1.56] |
| 7 All‐cause mortality ‐ participants characterised as 'at nutritional risk' due to one of the following criteria Show forest plot | 36 | 3722 | Risk Ratio (M‐H, Random, 95% CI) | 0.88 [0.75, 1.03] |
| Analysis 21.7  Comparison 21 Enteral ‐ All cause mortality ‐ end of intervention, Outcome 7 All‐cause mortality ‐ participants characterised as 'at nutritional risk' due to one of the following criteria. | ||||
| 7.1 BMI less than 20.5 kg/m2 | 0 | 0 | Risk Ratio (M‐H, Random, 95% CI) | 0.0 [0.0, 0.0] |
| 7.2 Weight loss of at least 5% during the last three months | 0 | 0 | Risk Ratio (M‐H, Random, 95% CI) | 0.0 [0.0, 0.0] |
| 7.3 Weight loss of at least 10% during the last six months | 1 | 32 | Risk Ratio (M‐H, Random, 95% CI) | 3.38 [0.15, 77.12] |
| 7.4 Insufficient food intake during the last week (50% of requirements or less) | 0 | 0 | Risk Ratio (M‐H, Random, 95% CI) | 0.0 [0.0, 0.0] |
| 7.5 Participants characterised as 'at nutritional risk' by other means | 35 | 3690 | Risk Ratio (M‐H, Random, 95% CI) | 0.88 [0.75, 1.02] |
| 8 All‐cause mortality ‐ participants characterised as 'at nutritional risk' due to biomarkers or anthropometrics Show forest plot | 36 | 3722 | Risk Ratio (M‐H, Random, 95% CI) | 0.88 [0.75, 1.03] |
| Analysis 21.8 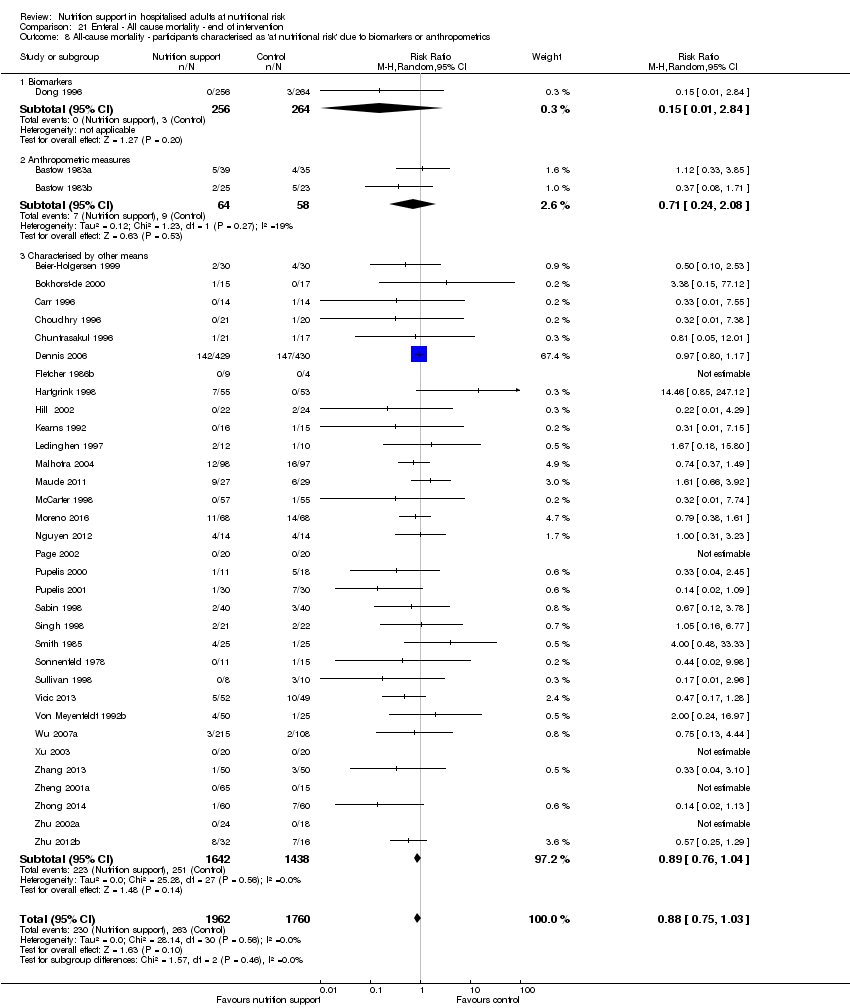 Comparison 21 Enteral ‐ All cause mortality ‐ end of intervention, Outcome 8 All‐cause mortality ‐ participants characterised as 'at nutritional risk' due to biomarkers or anthropometrics. | ||||
| 8.1 Biomarkers | 1 | 520 | Risk Ratio (M‐H, Random, 95% CI) | 0.15 [0.01, 2.84] |
| 8.2 Anthropometric measures | 2 | 122 | Risk Ratio (M‐H, Random, 95% CI) | 0.71 [0.24, 2.08] |
| 8.3 Characterised by other means | 33 | 3080 | Risk Ratio (M‐H, Random, 95% CI) | 0.89 [0.76, 1.04] |
| 9 All‐cause mortality ‐ randomisation year Show forest plot | 36 | 3722 | Risk Ratio (M‐H, Random, 95% CI) | 0.88 [0.75, 1.03] |
| Analysis 21.9 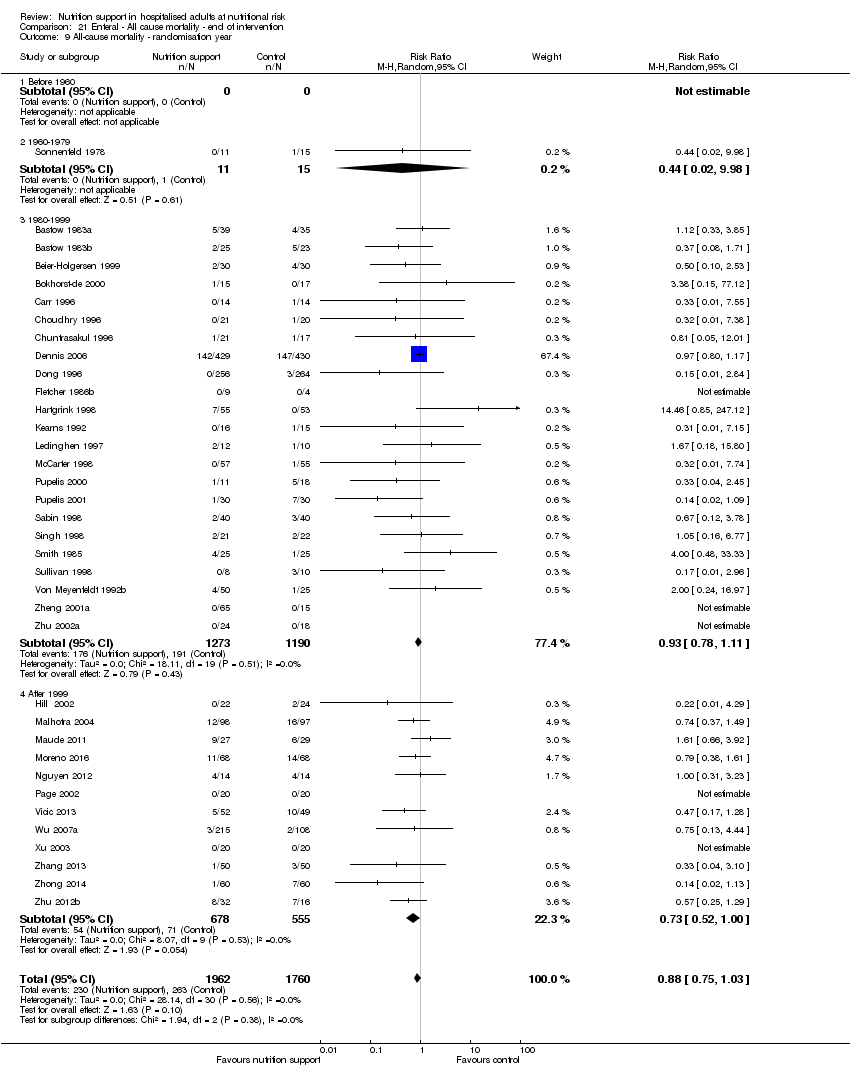 Comparison 21 Enteral ‐ All cause mortality ‐ end of intervention, Outcome 9 All‐cause mortality ‐ randomisation year. | ||||
| 9.1 Before 1960 | 0 | 0 | Risk Ratio (M‐H, Random, 95% CI) | 0.0 [0.0, 0.0] |
| 9.2 1960‐1979 | 1 | 26 | Risk Ratio (M‐H, Random, 95% CI) | 0.44 [0.02, 9.98] |
| 9.3 1980‐1999 | 23 | 2463 | Risk Ratio (M‐H, Random, 95% CI) | 0.93 [0.78, 1.11] |
| 9.4 After 1999 | 12 | 1233 | Risk Ratio (M‐H, Random, 95% CI) | 0.73 [0.52, 1.00] |
| 10 All‐cause mortality ‐ trials where the intervention lasts fewer than three days compared with trials where the intervention lasts three days or more Show forest plot | 36 | 3722 | Risk Ratio (M‐H, Random, 95% CI) | 0.88 [0.75, 1.03] |
| Analysis 21.10  Comparison 21 Enteral ‐ All cause mortality ‐ end of intervention, Outcome 10 All‐cause mortality ‐ trials where the intervention lasts fewer than three days compared with trials where the intervention lasts three days or more. | ||||
| 10.1 Three days or more | 30 | 3287 | Risk Ratio (M‐H, Random, 95% CI) | 0.88 [0.75, 1.03] |
| 10.2 Less than three days | 6 | 435 | Risk Ratio (M‐H, Random, 95% CI) | 0.68 [0.28, 1.65] |
| 10.3 Unknown | 0 | 0 | Risk Ratio (M‐H, Random, 95% CI) | 0.0 [0.0, 0.0] |
| 11 All‐cause mortality ‐ 'best‐worst case' scenario Show forest plot | 36 | 3759 | Risk Ratio (M‐H, Random, 95% CI) | 0.84 [0.72, 0.98] |
| Analysis 21.11  Comparison 21 Enteral ‐ All cause mortality ‐ end of intervention, Outcome 11 All‐cause mortality ‐ 'best‐worst case' scenario. | ||||
| 12 All‐cause mortality ‐ 'worst‐best case' scenario Show forest plot | 36 | 3759 | Risk Ratio (M‐H, Fixed, 95% CI) | 0.92 [0.79, 1.06] |
| Analysis 21.12 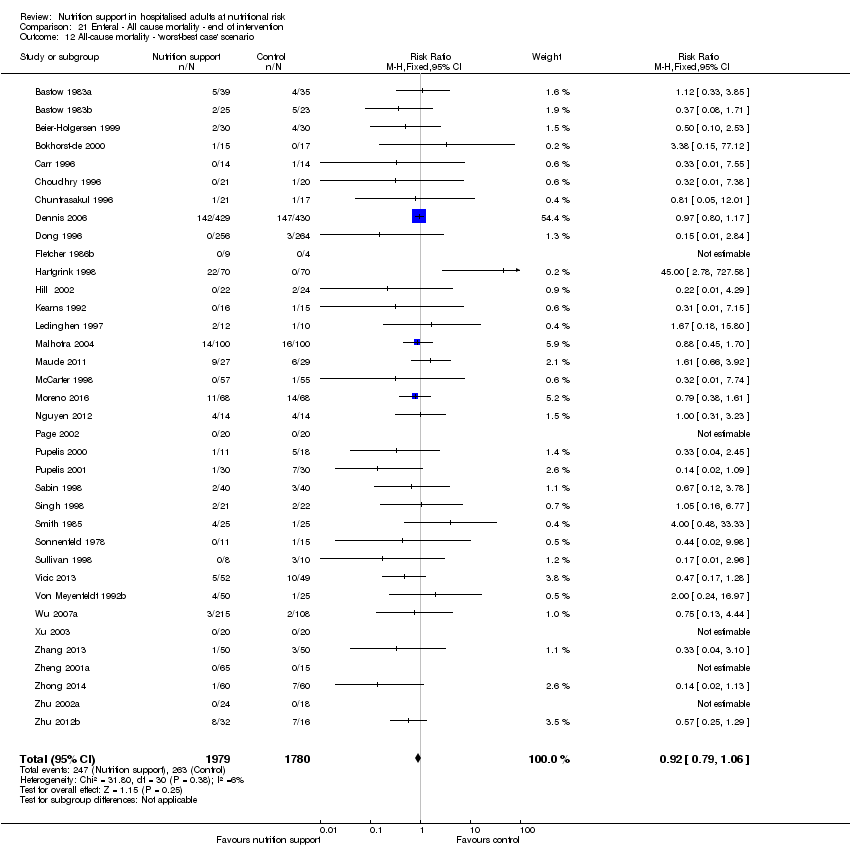 Comparison 21 Enteral ‐ All cause mortality ‐ end of intervention, Outcome 12 All‐cause mortality ‐ 'worst‐best case' scenario. | ||||
| 13 All‐cause mortality co‐interventions Show forest plot | 36 | 3722 | Risk Ratio (M‐H, Random, 95% CI) | 0.88 [0.75, 1.03] |
| Analysis 21.13  Comparison 21 Enteral ‐ All cause mortality ‐ end of intervention, Outcome 13 All‐cause mortality co‐interventions. | ||||
| 13.1 received nutrition support as co‐intervention | 3 | 126 | Risk Ratio (M‐H, Random, 95% CI) | 0.60 [0.28, 1.28] |
| 13.2 did not receive nutrition support as co‐intervention | 27 | 3253 | Risk Ratio (M‐H, Random, 95% CI) | 0.79 [0.62, 1.02] |
| 13.3 delayed versus early nutrition support | 6 | 343 | Risk Ratio (M‐H, Random, 95% CI) | 1.06 [0.57, 1.97] |
| Outcome or subgroup title | No. of studies | No. of participants | Statistical method | Effect size |
| 1 All‐cause mortality ‐ overall Show forest plot | 42 | 4212 | Risk Ratio (M‐H, Random, 95% CI) | 0.84 [0.75, 0.95] |
| Analysis 22.1  Comparison 22 Enteral ‐ All cause mortality ‐ maximum follow‐up, Outcome 1 All‐cause mortality ‐ overall. | ||||
| 2 All‐cause mortality ‐ bias Show forest plot | 42 | 4212 | Risk Ratio (M‐H, Random, 95% CI) | 0.84 [0.75, 0.95] |
| Analysis 22.2  Comparison 22 Enteral ‐ All cause mortality ‐ maximum follow‐up, Outcome 2 All‐cause mortality ‐ bias. | ||||
| 2.1 High risk of bias | 42 | 4212 | Risk Ratio (M‐H, Random, 95% CI) | 0.84 [0.75, 0.95] |
| 2.2 Low risk of bias | 0 | 0 | Risk Ratio (M‐H, Random, 95% CI) | 0.0 [0.0, 0.0] |
| 3 All‐cause mortality ‐ medical speciality Show forest plot | 42 | 4212 | Risk Ratio (M‐H, Random, 95% CI) | 0.84 [0.75, 0.95] |
| Analysis 22.3 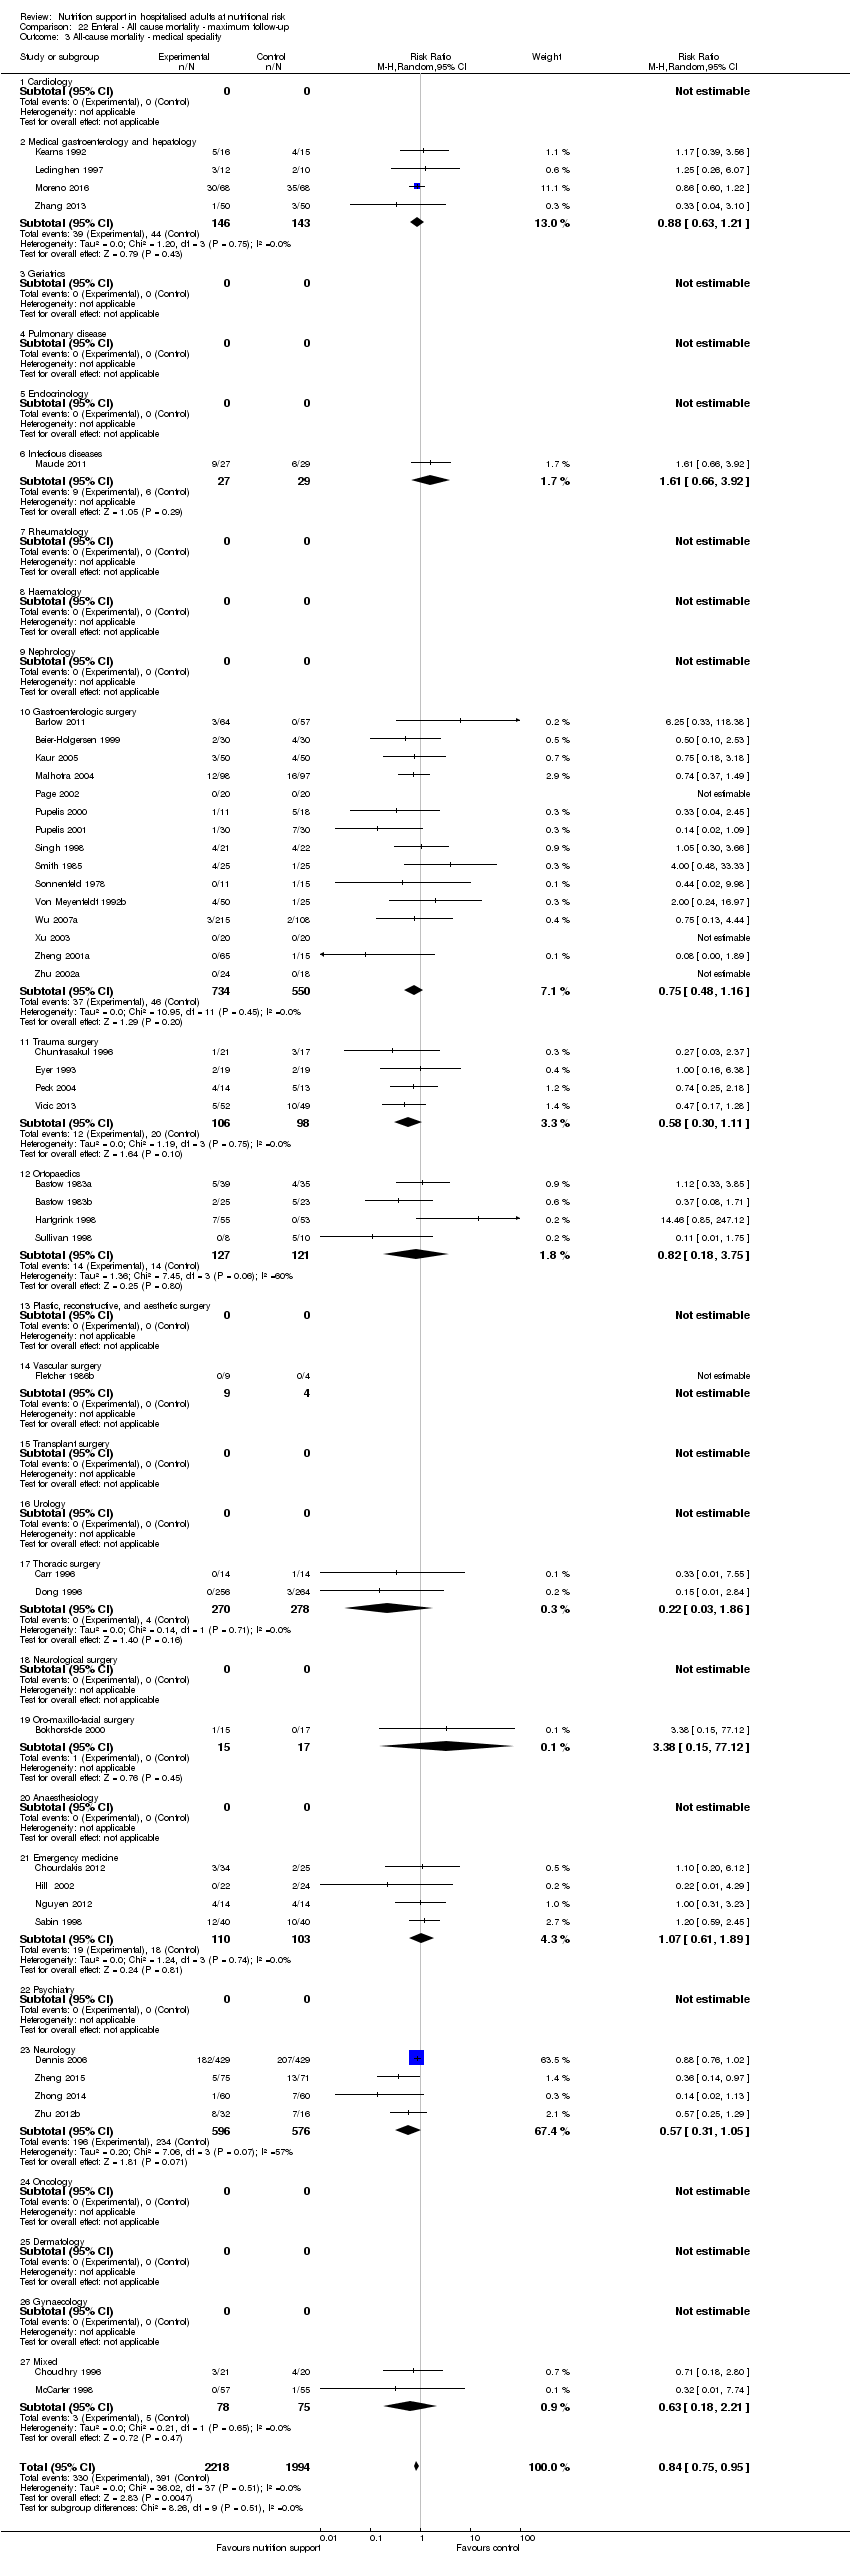 Comparison 22 Enteral ‐ All cause mortality ‐ maximum follow‐up, Outcome 3 All‐cause mortality ‐ medical speciality. | ||||
| 3.1 Cardiology | 0 | 0 | Risk Ratio (M‐H, Random, 95% CI) | 0.0 [0.0, 0.0] |
| 3.2 Medical gastroenterology and hepatology | 4 | 289 | Risk Ratio (M‐H, Random, 95% CI) | 0.88 [0.63, 1.21] |
| 3.3 Geriatrics | 0 | 0 | Risk Ratio (M‐H, Random, 95% CI) | 0.0 [0.0, 0.0] |
| 3.4 Pulmonary disease | 0 | 0 | Risk Ratio (M‐H, Random, 95% CI) | 0.0 [0.0, 0.0] |
| 3.5 Endocrinology | 0 | 0 | Risk Ratio (M‐H, Random, 95% CI) | 0.0 [0.0, 0.0] |
| 3.6 Infectious diseases | 1 | 56 | Risk Ratio (M‐H, Random, 95% CI) | 1.61 [0.66, 3.92] |
| 3.7 Rheumatology | 0 | 0 | Risk Ratio (M‐H, Random, 95% CI) | 0.0 [0.0, 0.0] |
| 3.8 Haematology | 0 | 0 | Risk Ratio (M‐H, Random, 95% CI) | 0.0 [0.0, 0.0] |
| 3.9 Nephrology | 0 | 0 | Risk Ratio (M‐H, Random, 95% CI) | 0.0 [0.0, 0.0] |
| 3.10 Gastroenterologic surgery | 15 | 1284 | Risk Ratio (M‐H, Random, 95% CI) | 0.75 [0.48, 1.16] |
| 3.11 Trauma surgery | 4 | 204 | Risk Ratio (M‐H, Random, 95% CI) | 0.58 [0.30, 1.11] |
| 3.12 Ortopaedics | 4 | 248 | Risk Ratio (M‐H, Random, 95% CI) | 0.82 [0.18, 3.75] |
| 3.13 Plastic, reconstructive, and aesthetic surgery | 0 | 0 | Risk Ratio (M‐H, Random, 95% CI) | 0.0 [0.0, 0.0] |
| 3.14 Vascular surgery | 1 | 13 | Risk Ratio (M‐H, Random, 95% CI) | 0.0 [0.0, 0.0] |
| 3.15 Transplant surgery | 0 | 0 | Risk Ratio (M‐H, Random, 95% CI) | 0.0 [0.0, 0.0] |
| 3.16 Urology | 0 | 0 | Risk Ratio (M‐H, Random, 95% CI) | 0.0 [0.0, 0.0] |
| 3.17 Thoracic surgery | 2 | 548 | Risk Ratio (M‐H, Random, 95% CI) | 0.22 [0.03, 1.86] |
| 3.18 Neurological surgery | 0 | 0 | Risk Ratio (M‐H, Random, 95% CI) | 0.0 [0.0, 0.0] |
| 3.19 Oro‐maxillo‐facial surgery | 1 | 32 | Risk Ratio (M‐H, Random, 95% CI) | 3.38 [0.15, 77.12] |
| 3.20 Anaesthesiology | 0 | 0 | Risk Ratio (M‐H, Random, 95% CI) | 0.0 [0.0, 0.0] |
| 3.21 Emergency medicine | 4 | 213 | Risk Ratio (M‐H, Random, 95% CI) | 1.07 [0.61, 1.89] |
| 3.22 Psychiatry | 0 | 0 | Risk Ratio (M‐H, Random, 95% CI) | 0.0 [0.0, 0.0] |
| 3.23 Neurology | 4 | 1172 | Risk Ratio (M‐H, Random, 95% CI) | 0.57 [0.31, 1.05] |
| 3.24 Oncology | 0 | 0 | Risk Ratio (M‐H, Random, 95% CI) | 0.0 [0.0, 0.0] |
| 3.25 Dermatology | 0 | 0 | Risk Ratio (M‐H, Random, 95% CI) | 0.0 [0.0, 0.0] |
| 3.26 Gynaecology | 0 | 0 | Risk Ratio (M‐H, Random, 95% CI) | 0.0 [0.0, 0.0] |
| 3.27 Mixed | 2 | 153 | Risk Ratio (M‐H, Random, 95% CI) | 0.63 [0.18, 2.21] |
| 4 All‐cause mortality ‐ based on adequacy of the amount of calories Show forest plot | 42 | 4212 | Risk Ratio (M‐H, Random, 95% CI) | 0.84 [0.75, 0.95] |
| Analysis 22.4 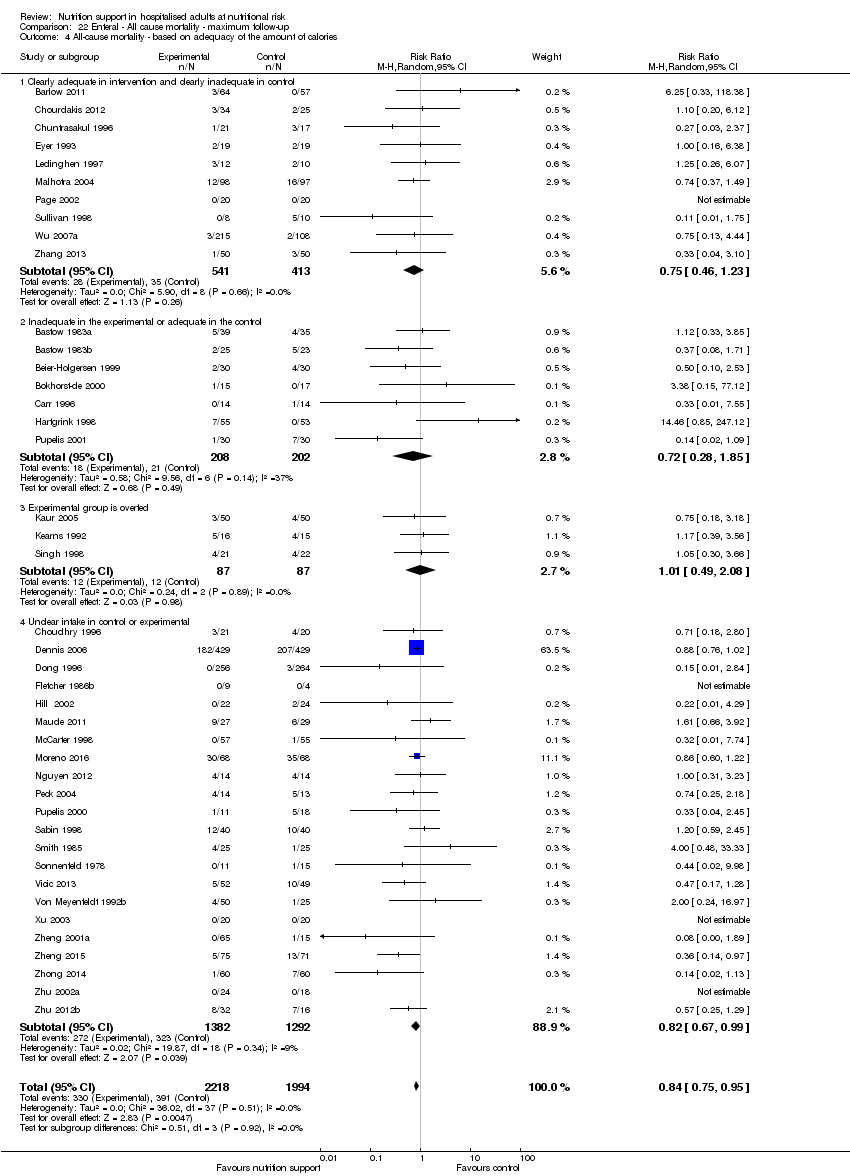 Comparison 22 Enteral ‐ All cause mortality ‐ maximum follow‐up, Outcome 4 All‐cause mortality ‐ based on adequacy of the amount of calories. | ||||
| 4.1 Clearly adequate in intervention and clearly inadequate in control | 10 | 954 | Risk Ratio (M‐H, Random, 95% CI) | 0.75 [0.46, 1.23] |
| 4.2 Inadequate in the experimental or adequate in the control | 7 | 410 | Risk Ratio (M‐H, Random, 95% CI) | 0.72 [0.28, 1.85] |
| 4.3 Experimental group is overfed | 3 | 174 | Risk Ratio (M‐H, Random, 95% CI) | 1.01 [0.49, 2.08] |
| 4.4 Unclear intake in control or experimental | 22 | 2674 | Risk Ratio (M‐H, Random, 95% CI) | 0.82 [0.67, 0.99] |
| 5 All‐cause mortality ‐ different screening tools Show forest plot | 42 | 4212 | Risk Ratio (M‐H, Random, 95% CI) | 0.84 [0.75, 0.95] |
| Analysis 22.5  Comparison 22 Enteral ‐ All cause mortality ‐ maximum follow‐up, Outcome 5 All‐cause mortality ‐ different screening tools. | ||||
| 5.1 NRS 2002 | 0 | 0 | Risk Ratio (M‐H, Random, 95% CI) | 0.0 [0.0, 0.0] |
| 5.2 MUST | 0 | 0 | Risk Ratio (M‐H, Random, 95% CI) | 0.0 [0.0, 0.0] |
| 5.3 MNA | 0 | 0 | Risk Ratio (M‐H, Random, 95% CI) | 0.0 [0.0, 0.0] |
| 5.4 SGA | 1 | 323 | Risk Ratio (M‐H, Random, 95% CI) | 0.75 [0.13, 4.44] |
| 5.5 Other means | 41 | 3889 | Risk Ratio (M‐H, Random, 95% CI) | 0.84 [0.75, 0.95] |
| 6 All‐cause mortality ‐ participants characterised as 'at nutritional risk' due to one of the following conditions Show forest plot | 42 | 4212 | Risk Ratio (M‐H, Random, 95% CI) | 0.84 [0.75, 0.95] |
| Analysis 22.6  Comparison 22 Enteral ‐ All cause mortality ‐ maximum follow‐up, Outcome 6 All‐cause mortality ‐ participants characterised as 'at nutritional risk' due to one of the following conditions. | ||||
| 6.1 Major surgery | 20 | 1967 | Risk Ratio (M‐H, Random, 95% CI) | 0.71 [0.48, 1.06] |
| 6.2 Stroke | 4 | 1172 | Risk Ratio (M‐H, Random, 95% CI) | 0.57 [0.31, 1.05] |
| 6.3 ICU participants including trauma | 8 | 417 | Risk Ratio (M‐H, Random, 95% CI) | 0.82 [0.54, 1.26] |
| 6.4 Frail elderly participants with less severe conditions known to increase protein requirements | 2 | 126 | Risk Ratio (M‐H, Random, 95% CI) | 1.25 [0.01, 150.42] |
| 6.5 Participants do not fall into one of the categories above | 8 | 530 | Risk Ratio (M‐H, Random, 95% CI) | 0.93 [0.69, 1.25] |
| 7 All‐cause mortality ‐ participants characterised as 'at nutritional risk' due to one of the following criteria Show forest plot | 42 | 4212 | Risk Ratio (M‐H, Random, 95% CI) | 0.84 [0.75, 0.95] |
| Analysis 22.7  Comparison 22 Enteral ‐ All cause mortality ‐ maximum follow‐up, Outcome 7 All‐cause mortality ‐ participants characterised as 'at nutritional risk' due to one of the following criteria. | ||||
| 7.1 BMI less than 20.5 kg/m2 | 0 | 0 | Risk Ratio (M‐H, Random, 95% CI) | 0.0 [0.0, 0.0] |
| 7.2 Weight loss of at least 5% during the last three months | 0 | 0 | Risk Ratio (M‐H, Random, 95% CI) | 0.0 [0.0, 0.0] |
| 7.3 Weight loss of at least 10% during the last six months | 1 | 32 | Risk Ratio (M‐H, Random, 95% CI) | 3.38 [0.15, 77.12] |
| 7.4 Insufficient food intake during the last week (50% of requirements or less) | 0 | 0 | Risk Ratio (M‐H, Random, 95% CI) | 0.0 [0.0, 0.0] |
| 7.5 Participants characterised as 'at nutritional risk' by other means | 41 | 4180 | Risk Ratio (M‐H, Random, 95% CI) | 0.84 [0.75, 0.95] |
| 8 All‐cause mortality ‐ participants characterised as 'at nutritional risk' due to biomarkers or anthropometrics Show forest plot | 42 | 4212 | Risk Ratio (M‐H, Random, 95% CI) | 0.84 [0.75, 0.95] |
| Analysis 22.8  Comparison 22 Enteral ‐ All cause mortality ‐ maximum follow‐up, Outcome 8 All‐cause mortality ‐ participants characterised as 'at nutritional risk' due to biomarkers or anthropometrics. | ||||
| 8.1 Biomarkers | 1 | 520 | Risk Ratio (M‐H, Random, 95% CI) | 0.15 [0.01, 2.84] |
| 8.2 Anthropometric measures | 2 | 122 | Risk Ratio (M‐H, Random, 95% CI) | 0.71 [0.24, 2.08] |
| 8.3 Both anthropometrics and biomarkers | 0 | 0 | Risk Ratio (M‐H, Random, 95% CI) | 0.0 [0.0, 0.0] |
| 8.4 Characterised by other means | 39 | 3570 | Risk Ratio (M‐H, Random, 95% CI) | 0.85 [0.75, 0.96] |
| 9 All‐cause mortality ‐ randomisation year Show forest plot | 42 | 4212 | Risk Ratio (M‐H, Random, 95% CI) | 0.84 [0.75, 0.95] |
| Analysis 22.9  Comparison 22 Enteral ‐ All cause mortality ‐ maximum follow‐up, Outcome 9 All‐cause mortality ‐ randomisation year. | ||||
| 9.1 Before 1960 | 0 | 0 | Risk Ratio (M‐H, Random, 95% CI) | 0.0 [0.0, 0.0] |
| 9.2 1960 to 1979 | 1 | 26 | Risk Ratio (M‐H, Random, 95% CI) | 0.44 [0.02, 9.98] |
| 9.3 1980 to 1999 | 24 | 2500 | Risk Ratio (M‐H, Random, 95% CI) | 0.87 [0.69, 1.08] |
| 9.4 After 1999 | 17 | 1686 | Risk Ratio (M‐H, Random, 95% CI) | 0.76 [0.60, 0.96] |
| 10 All‐cause mortality ‐ trials where the intervention lasts fewer than three days compared with trials where the intervention lasts three days or more Show forest plot | 42 | 4212 | Risk Ratio (M‐H, Random, 95% CI) | 0.84 [0.75, 0.95] |
| Analysis 22.10  Comparison 22 Enteral ‐ All cause mortality ‐ maximum follow‐up, Outcome 10 All‐cause mortality ‐ trials where the intervention lasts fewer than three days compared with trials where the intervention lasts three days or more. | ||||
| 10.1 Three days or more | 34 | 3680 | Risk Ratio (M‐H, Random, 95% CI) | 0.82 [0.71, 0.94] |
| 10.2 Less than three days | 8 | 532 | Risk Ratio (M‐H, Random, 95% CI) | 1.03 [0.66, 1.63] |
| 10.3 Unknown | 0 | 0 | Risk Ratio (M‐H, Random, 95% CI) | 0.0 [0.0, 0.0] |
| 11 All‐cause mortality ‐ 'best‐worst case' scenario Show forest plot | 42 | 4269 | Risk Ratio (M‐H, Random, 95% CI) | 0.75 [0.63, 0.89] |
| Analysis 22.11 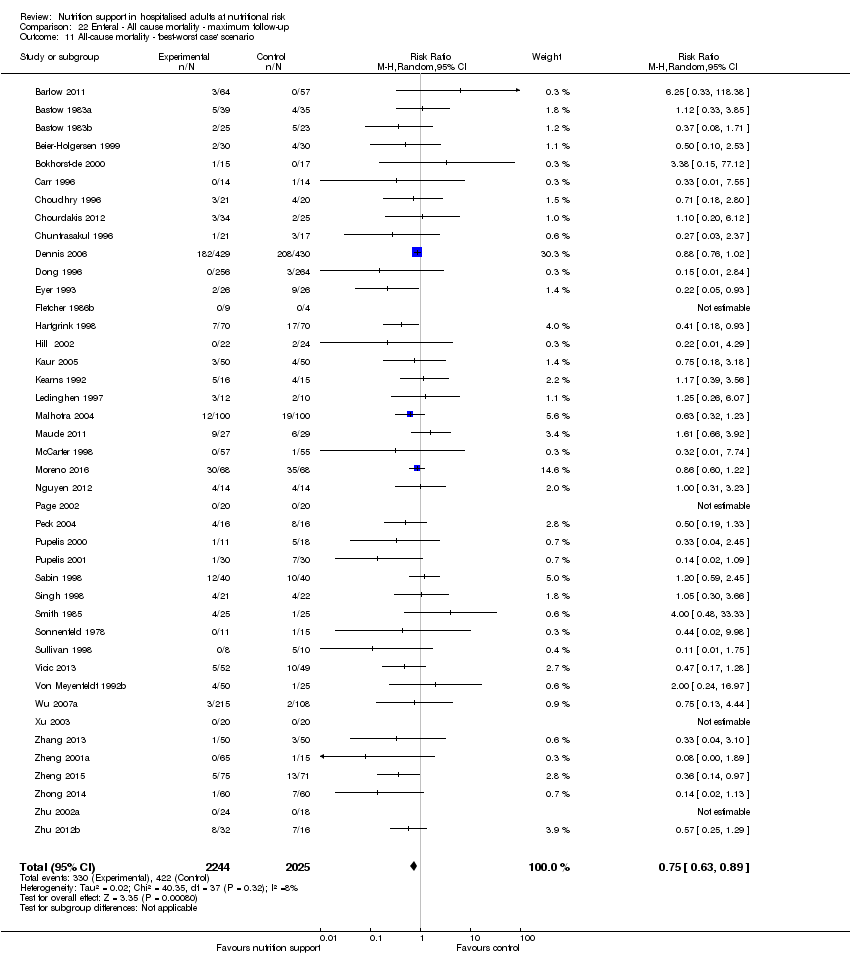 Comparison 22 Enteral ‐ All cause mortality ‐ maximum follow‐up, Outcome 11 All‐cause mortality ‐ 'best‐worst case' scenario. | ||||
| 12 All‐cause mortality ‐ 'worst‐best case' scenario Show forest plot | 42 | 4269 | Risk Ratio (M‐H, Random, 95% CI) | 0.84 [0.68, 1.03] |
| Analysis 22.12  Comparison 22 Enteral ‐ All cause mortality ‐ maximum follow‐up, Outcome 12 All‐cause mortality ‐ 'worst‐best case' scenario. | ||||
| 13 All‐cause mortality co‐interventions Show forest plot | 42 | 4212 | Risk Ratio (M‐H, Fixed, 95% CI) | 0.82 [0.73, 0.92] |
| Analysis 22.13  Comparison 22 Enteral ‐ All cause mortality ‐ maximum follow‐up, Outcome 13 All‐cause mortality co‐interventions. | ||||
| 13.1 received nutrition support as co‐intervention | 5 | 262 | Risk Ratio (M‐H, Fixed, 95% CI) | 1.03 [0.66, 1.60] |
| 13.2 did not receive nutrition support as co‐intervention | 35 | 3797 | Risk Ratio (M‐H, Fixed, 95% CI) | 0.81 [0.71, 0.91] |
| 13.3 delayed versus early nutrition support | 2 | 153 | Risk Ratio (M‐H, Fixed, 95% CI) | 0.61 [0.17, 2.12] |
| Outcome or subgroup title | No. of studies | No. of participants | Statistical method | Effect size |
| 1 Serious adverse events ‐ overall Show forest plot | 43 | 3935 | Risk Ratio (M‐H, Random, 95% CI) | 0.85 [0.74, 0.98] |
| Analysis 23.1  Comparison 23 Enteral ‐ Serious adverse event end of intervention, Outcome 1 Serious adverse events ‐ overall. | ||||
| 2 Serious adverse events ‐ bias Show forest plot | 43 | 3935 | Risk Ratio (M‐H, Random, 95% CI) | 0.85 [0.74, 0.98] |
| Analysis 23.2  Comparison 23 Enteral ‐ Serious adverse event end of intervention, Outcome 2 Serious adverse events ‐ bias. | ||||
| 2.1 High risk of bias | 43 | 3935 | Risk Ratio (M‐H, Random, 95% CI) | 0.85 [0.74, 0.98] |
| 2.2 Low risk of bias | 0 | 0 | Risk Ratio (M‐H, Random, 95% CI) | 0.0 [0.0, 0.0] |
| 3 Serious adverse events ‐ by medical specialty Show forest plot | 43 | 3935 | Risk Ratio (M‐H, Random, 95% CI) | 0.85 [0.74, 0.98] |
| Analysis 23.3  Comparison 23 Enteral ‐ Serious adverse event end of intervention, Outcome 3 Serious adverse events ‐ by medical specialty. | ||||
| 3.1 Cardiology | 0 | 0 | Risk Ratio (M‐H, Random, 95% CI) | 0.0 [0.0, 0.0] |
| 3.2 Medical gastroenterology and hepatology | 4 | 289 | Risk Ratio (M‐H, Random, 95% CI) | 0.79 [0.32, 1.96] |
| 3.3 High risk | 0 | 0 | Risk Ratio (M‐H, Random, 95% CI) | 0.0 [0.0, 0.0] |
| 3.4 Geriatrics | 0 | 0 | Risk Ratio (M‐H, Random, 95% CI) | 0.0 [0.0, 0.0] |
| 3.5 Pulmonary disease | 0 | 0 | Risk Ratio (M‐H, Random, 95% CI) | 0.0 [0.0, 0.0] |
| 3.6 Endocrinology | 0 | 0 | Risk Ratio (M‐H, Random, 95% CI) | 0.0 [0.0, 0.0] |
| 3.7 Infectious diseases | 1 | 56 | Risk Ratio (M‐H, Random, 95% CI) | 1.23 [0.52, 2.93] |
| 3.8 Rheumatology | 0 | 0 | Risk Ratio (M‐H, Random, 95% CI) | 0.0 [0.0, 0.0] |
| 3.9 Haematology | 0 | 0 | Risk Ratio (M‐H, Random, 95% CI) | 0.0 [0.0, 0.0] |
| 3.10 Nephrology | 0 | 0 | Risk Ratio (M‐H, Random, 95% CI) | 0.0 [0.0, 0.0] |
| 3.11 Gastroenterologic surgery | 19 | 1235 | Risk Ratio (M‐H, Random, 95% CI) | 0.75 [0.54, 1.03] |
| 3.12 Trauma surgery | 3 | 180 | Risk Ratio (M‐H, Random, 95% CI) | 0.50 [0.20, 1.28] |
| 3.13 Ortopaedics | 4 | 248 | Risk Ratio (M‐H, Random, 95% CI) | 1.05 [0.34, 3.26] |
| 3.14 Plastic, reconstructive, and aesthetic surgery | 0 | 0 | Risk Ratio (M‐H, Random, 95% CI) | 0.0 [0.0, 0.0] |
| 3.15 Vascular surgery | 1 | 13 | Risk Ratio (M‐H, Random, 95% CI) | 0.0 [0.0, 0.0] |
| 3.16 Transplant surgery | 0 | 0 | Risk Ratio (M‐H, Random, 95% CI) | 0.0 [0.0, 0.0] |
| 3.17 Urology | 0 | 0 | Risk Ratio (M‐H, Random, 95% CI) | 0.0 [0.0, 0.0] |
| 3.18 Thoracic surgery | 2 | 548 | Risk Ratio (M‐H, Random, 95% CI) | 0.15 [0.02, 1.27] |
| 3.19 Neurological surgery | 0 | 0 | Risk Ratio (M‐H, Random, 95% CI) | 0.0 [0.0, 0.0] |
| 3.20 Oro‐maxillo‐facial surgery | 1 | 32 | Risk Ratio (M‐H, Random, 95% CI) | 0.88 [0.44, 1.78] |
| 3.21 Anaesthesiology | 0 | 0 | Risk Ratio (M‐H, Random, 95% CI) | 0.0 [0.0, 0.0] |
| 3.22 Emergency medicine | 3 | 154 | Risk Ratio (M‐H, Random, 95% CI) | 0.77 [0.31, 1.94] |
| 3.23 Psychiatry | 0 | 0 | Risk Ratio (M‐H, Random, 95% CI) | 0.0 [0.0, 0.0] |
| 3.24 Neurology | 3 | 1027 | Risk Ratio (M‐H, Random, 95% CI) | 0.67 [0.37, 1.24] |
| 3.25 Oncology | 0 | 0 | Risk Ratio (M‐H, Random, 95% CI) | 0.0 [0.0, 0.0] |
| 3.26 Dermatology | 0 | 0 | Risk Ratio (M‐H, Random, 95% CI) | 0.0 [0.0, 0.0] |
| 3.27 Gynaecology | 0 | 0 | Risk Ratio (M‐H, Random, 95% CI) | 0.0 [0.0, 0.0] |
| 3.28 Mixed | 2 | 153 | Risk Ratio (M‐H, Random, 95% CI) | 0.32 [0.03, 2.99] |
| 4 Serious adverse events ‐ based on adequacy of the amount of calories Show forest plot | 43 | 3935 | Risk Ratio (M‐H, Random, 95% CI) | 0.85 [0.74, 0.98] |
| Analysis 23.4  Comparison 23 Enteral ‐ Serious adverse event end of intervention, Outcome 4 Serious adverse events ‐ based on adequacy of the amount of calories. | ||||
| 4.1 Clearly adequate in intervention and clearly inadequate in control | 9 | 769 | Risk Ratio (M‐H, Random, 95% CI) | 0.77 [0.54, 1.10] |
| 4.2 Inadequate in the experimental or adequate in the control | 8 | 411 | Risk Ratio (M‐H, Random, 95% CI) | 0.86 [0.55, 1.35] |
| 4.3 Experimental group is overfed | 3 | 115 | Risk Ratio (M‐H, Random, 95% CI) | 0.64 [0.13, 3.12] |
| 4.4 Unclear intake in control or experimental | 23 | 2640 | Risk Ratio (M‐H, Random, 95% CI) | 0.73 [0.55, 0.98] |
| 5 Serious adverse events ‐ different screening tools Show forest plot | 43 | 3935 | Risk Ratio (M‐H, Random, 95% CI) | 0.85 [0.74, 0.98] |
| Analysis 23.5  Comparison 23 Enteral ‐ Serious adverse event end of intervention, Outcome 5 Serious adverse events ‐ different screening tools. | ||||
| 5.1 NRS 2002 | 0 | 0 | Risk Ratio (M‐H, Random, 95% CI) | 0.0 [0.0, 0.0] |
| 5.2 MUST | 0 | 0 | Risk Ratio (M‐H, Random, 95% CI) | 0.0 [0.0, 0.0] |
| 5.3 MNA | 0 | 0 | Risk Ratio (M‐H, Random, 95% CI) | 0.0 [0.0, 0.0] |
| 5.4 SGA | 1 | 323 | Risk Ratio (M‐H, Random, 95% CI) | 0.38 [0.13, 1.06] |
| 5.5 Other means | 42 | 3612 | Risk Ratio (M‐H, Random, 95% CI) | 0.87 [0.75, 1.00] |
| 6 Serious adverse events ‐ participants characterised as 'at nutritional risk' due to one of the following conditions Show forest plot | 43 | 3935 | Risk Ratio (M‐H, Random, 95% CI) | 0.85 [0.74, 0.98] |
| Analysis 23.6  Comparison 23 Enteral ‐ Serious adverse event end of intervention, Outcome 6 Serious adverse events ‐ participants characterised as 'at nutritional risk' due to one of the following conditions. | ||||
| 6.1 Major surgery | 24 | 1918 | Risk Ratio (M‐H, Random, 95% CI) | 0.72 [0.53, 0.97] |
| 6.2 Stroke | 3 | 1027 | Risk Ratio (M‐H, Random, 95% CI) | 0.67 [0.37, 1.24] |
| 6.3 ICU participants including trauma | 6 | 334 | Risk Ratio (M‐H, Random, 95% CI) | 0.62 [0.32, 1.21] |
| 6.4 Frail elderly participants with less severe conditions known to increase protein requirements | 2 | 126 | Risk Ratio (M‐H, Random, 95% CI) | 2.84 [0.12, 66.14] |
| 6.5 Participants do not fall into one of the categories above | 8 | 530 | Risk Ratio (M‐H, Random, 95% CI) | 0.87 [0.58, 1.30] |
| 7 Serious adverse events ‐ participants characterised as 'at nutritional risk' due to one of the following criteria Show forest plot | 43 | 3935 | Risk Ratio (M‐H, Random, 95% CI) | 0.85 [0.74, 0.98] |
| Analysis 23.7  Comparison 23 Enteral ‐ Serious adverse event end of intervention, Outcome 7 Serious adverse events ‐ participants characterised as 'at nutritional risk' due to one of the following criteria. | ||||
| 7.1 BMI less than 20.5 kg/m2 | 0 | 0 | Risk Ratio (M‐H, Random, 95% CI) | 0.0 [0.0, 0.0] |
| 7.2 Weight loss of at least 5% during the last three months | 0 | 0 | Risk Ratio (M‐H, Random, 95% CI) | 0.0 [0.0, 0.0] |
| 7.3 Weight loss of at least 10% during the last six months | 1 | 32 | Risk Ratio (M‐H, Random, 95% CI) | 0.88 [0.44, 1.78] |
| 7.4 Insufficient food intake during the last week (50% of requirements or less) | 0 | 0 | Risk Ratio (M‐H, Random, 95% CI) | 0.0 [0.0, 0.0] |
| 7.5 Participants characterised as 'at nutritional risk' by other means | 42 | 3903 | Risk Ratio (M‐H, Random, 95% CI) | 0.85 [0.74, 0.98] |
| 8 Serious adverse events ‐ participants characterised as 'at nutritional risk' due to biomarkers or anthropometrics Show forest plot | 43 | 3935 | Risk Ratio (M‐H, Random, 95% CI) | 0.85 [0.74, 0.98] |
| Analysis 23.8  Comparison 23 Enteral ‐ Serious adverse event end of intervention, Outcome 8 Serious adverse events ‐ participants characterised as 'at nutritional risk' due to biomarkers or anthropometrics. | ||||
| 8.1 Biomarkers | 3 | 551 | Risk Ratio (M‐H, Random, 95% CI) | 0.16 [0.02, 1.26] |
| 8.2 Anthropometric measures | 2 | 122 | Risk Ratio (M‐H, Random, 95% CI) | 0.71 [0.24, 2.08] |
| 8.3 Mixed | 0 | 0 | Risk Ratio (M‐H, Random, 95% CI) | 0.0 [0.0, 0.0] |
| 8.4 Characterised by other means | 38 | 3262 | Risk Ratio (M‐H, Random, 95% CI) | 0.86 [0.75, 1.00] |
| 9 Serious adverse events ‐ randomisation year Show forest plot | 43 | 3935 | Risk Ratio (M‐H, Random, 95% CI) | 0.85 [0.74, 0.98] |
| Analysis 23.9  Comparison 23 Enteral ‐ Serious adverse event end of intervention, Outcome 9 Serious adverse events ‐ randomisation year. | ||||
| 9.1 Before 1960 | 0 | 0 | Risk Ratio (M‐H, Random, 95% CI) | 0.0 [0.0, 0.0] |
| 9.2 1960 to 1979 | 1 | 26 | Risk Ratio (M‐H, Random, 95% CI) | 1.36 [0.10, 19.50] |
| 9.3 1980 to 1999 | 28 | 2749 | Risk Ratio (M‐H, Random, 95% CI) | 0.92 [0.79, 1.08] |
| 9.4 After 1999 | 14 | 1160 | Risk Ratio (M‐H, Random, 95% CI) | 0.60 [0.43, 0.83] |
| 10 Serious adverse events ‐ trials where the intervention lasts fewer than three days compared with trials where the intervention lasts three days or more Show forest plot | 43 | 3935 | Risk Ratio (M‐H, Random, 95% CI) | 0.85 [0.74, 0.98] |
| Analysis 23.10  Comparison 23 Enteral ‐ Serious adverse event end of intervention, Outcome 10 Serious adverse events ‐ trials where the intervention lasts fewer than three days compared with trials where the intervention lasts three days or more. | ||||
| 10.1 Three days or more | 37 | 3500 | Risk Ratio (M‐H, Random, 95% CI) | 0.86 [0.75, 1.00] |
| 10.2 Less than three days | 6 | 435 | Risk Ratio (M‐H, Random, 95% CI) | 0.71 [0.39, 1.27] |
| 10.3 Unknown | 0 | 0 | Risk Ratio (M‐H, Random, 95% CI) | 0.0 [0.0, 0.0] |
| 11 Serious adverse events ‐ 'best‐worst case' scenario Show forest plot | 43 | 3977 | Risk Ratio (M‐H, Random, 95% CI) | 0.82 [0.72, 0.94] |
| Analysis 23.11  Comparison 23 Enteral ‐ Serious adverse event end of intervention, Outcome 11 Serious adverse events ‐ 'best‐worst case' scenario. | ||||
| 12 Serious adverse events ‐ 'worst‐best case' scenario Show forest plot | 43 | 3977 | Risk Ratio (M‐H, Random, 95% CI) | 0.83 [0.70, 0.99] |
| Analysis 23.12  Comparison 23 Enteral ‐ Serious adverse event end of intervention, Outcome 12 Serious adverse events ‐ 'worst‐best case' scenario. | ||||
| 13 Serious adverse events co‐interventions Show forest plot | 43 | 3935 | Risk Ratio (M‐H, Fixed, 95% CI) | 0.83 [0.72, 0.95] |
| Analysis 23.13  Comparison 23 Enteral ‐ Serious adverse event end of intervention, Outcome 13 Serious adverse events co‐interventions. | ||||
| 13.1 received nutrition support as co‐intervention | 3 | 126 | Risk Ratio (M‐H, Fixed, 95% CI) | 0.66 [0.39, 1.12] |
| 13.2 did not receive nutrition support as co‐intervention | 34 | 3466 | Risk Ratio (M‐H, Fixed, 95% CI) | 0.83 [0.72, 0.96] |
| 13.3 delayed versus early nutrition support | 6 | 343 | Risk Ratio (M‐H, Fixed, 95% CI) | 0.93 [0.51, 1.69] |
| Outcome or subgroup title | No. of studies | No. of participants | Statistical method | Effect size |
| 1 Serious adverse events ‐ overall Show forest plot | 49 | 4425 | Risk Ratio (M‐H, Random, 95% CI) | 0.82 [0.73, 0.91] |
| Analysis 24.1  Comparison 24 Enteral ‐ Serious adverse event maximum follow‐up, Outcome 1 Serious adverse events ‐ overall. | ||||
| 2 Serious adverse events ‐ bias Show forest plot | 49 | 4425 | Risk Ratio (M‐H, Random, 95% CI) | 0.82 [0.73, 0.91] |
| Analysis 24.2  Comparison 24 Enteral ‐ Serious adverse event maximum follow‐up, Outcome 2 Serious adverse events ‐ bias. | ||||
| 2.1 High risk of bias | 49 | 4425 | Risk Ratio (M‐H, Random, 95% CI) | 0.82 [0.73, 0.91] |
| 2.2 Low risk of bias | 0 | 0 | Risk Ratio (M‐H, Random, 95% CI) | 0.0 [0.0, 0.0] |
| 3 Serious adverse events ‐ by medical speciality Show forest plot | 49 | 4425 | Risk Ratio (M‐H, Random, 95% CI) | 0.82 [0.73, 0.91] |
| Analysis 24.3  Comparison 24 Enteral ‐ Serious adverse event maximum follow‐up, Outcome 3 Serious adverse events ‐ by medical speciality. | ||||
| 3.1 Cardiology | 0 | 0 | Risk Ratio (M‐H, Random, 95% CI) | 0.0 [0.0, 0.0] |
| 3.2 Medical gastroenterology and hepatology | 4 | 289 | Risk Ratio (M‐H, Random, 95% CI) | 0.89 [0.65, 1.23] |
| 3.3 Geriatrics | 0 | 0 | Risk Ratio (M‐H, Random, 95% CI) | 0.0 [0.0, 0.0] |
| 3.4 Pulmonary disease | 0 | 0 | Risk Ratio (M‐H, Random, 95% CI) | 0.0 [0.0, 0.0] |
| 3.5 Endocrinology | 0 | 0 | Risk Ratio (M‐H, Random, 95% CI) | 0.0 [0.0, 0.0] |
| 3.6 Infectious diseases | 1 | 56 | Risk Ratio (M‐H, Random, 95% CI) | 1.23 [0.52, 2.93] |
| 3.7 Rheumatology | 0 | 0 | Risk Ratio (M‐H, Random, 95% CI) | 0.0 [0.0, 0.0] |
| 3.8 Haematology | 0 | 0 | Risk Ratio (M‐H, Random, 95% CI) | 0.0 [0.0, 0.0] |
| 3.9 Nephrology | 0 | 0 | Risk Ratio (M‐H, Random, 95% CI) | 0.0 [0.0, 0.0] |
| 3.10 Gastroenterologic surgery | 21 | 1456 | Risk Ratio (M‐H, Random, 95% CI) | 0.68 [0.51, 0.91] |
| 3.11 Trauma surgery | 5 | 245 | Risk Ratio (M‐H, Random, 95% CI) | 0.58 [0.30, 1.11] |
| 3.12 Ortopaedics | 4 | 248 | Risk Ratio (M‐H, Random, 95% CI) | 0.91 [0.28, 2.96] |
| 3.13 Plastic, reconstructive, and aesthetic surgery | 0 | 0 | Risk Ratio (M‐H, Random, 95% CI) | 0.0 [0.0, 0.0] |
| 3.14 Vascular surgery | 1 | 13 | Risk Ratio (M‐H, Random, 95% CI) | 0.0 [0.0, 0.0] |
| 3.15 Transplant surgery | 0 | 0 | Risk Ratio (M‐H, Random, 95% CI) | 0.0 [0.0, 0.0] |
| 3.16 Urology | 0 | 0 | Risk Ratio (M‐H, Random, 95% CI) | 0.0 [0.0, 0.0] |
| 3.17 Thoracic surgery | 2 | 548 | Risk Ratio (M‐H, Random, 95% CI) | 0.15 [0.02, 1.27] |
| 3.18 Neurological surgery | 0 | 0 | Risk Ratio (M‐H, Random, 95% CI) | 0.0 [0.0, 0.0] |
| 3.19 Oro‐maxillo‐facial surgery | 1 | 32 | Risk Ratio (M‐H, Random, 95% CI) | 0.88 [0.44, 1.78] |
| 3.20 Anaesthesiology | 0 | 0 | Risk Ratio (M‐H, Random, 95% CI) | 0.0 [0.0, 0.0] |
| 3.21 Emergency medicine | 4 | 213 | Risk Ratio (M‐H, Random, 95% CI) | 0.92 [0.60, 1.40] |
| 3.22 Psychiatry | 0 | 0 | Risk Ratio (M‐H, Random, 95% CI) | 0.0 [0.0, 0.0] |
| 3.23 Neurology | 4 | 1172 | Risk Ratio (M‐H, Random, 95% CI) | 0.58 [0.34, 1.00] |
| 3.24 Oncology | 0 | 0 | Risk Ratio (M‐H, Random, 95% CI) | 0.0 [0.0, 0.0] |
| 3.25 Dermatology | 0 | 0 | Risk Ratio (M‐H, Random, 95% CI) | 0.0 [0.0, 0.0] |
| 3.26 Gynaecology | 0 | 0 | Risk Ratio (M‐H, Random, 95% CI) | 0.0 [0.0, 0.0] |
| 3.27 Mixed | 2 | 153 | Risk Ratio (M‐H, Random, 95% CI) | 0.63 [0.18, 2.21] |
| 4 Serious adverse events ‐ based on adequacy of the amount of calories Show forest plot | 49 | 4425 | Risk Ratio (M‐H, Random, 95% CI) | 0.82 [0.73, 0.91] |
| Analysis 24.4 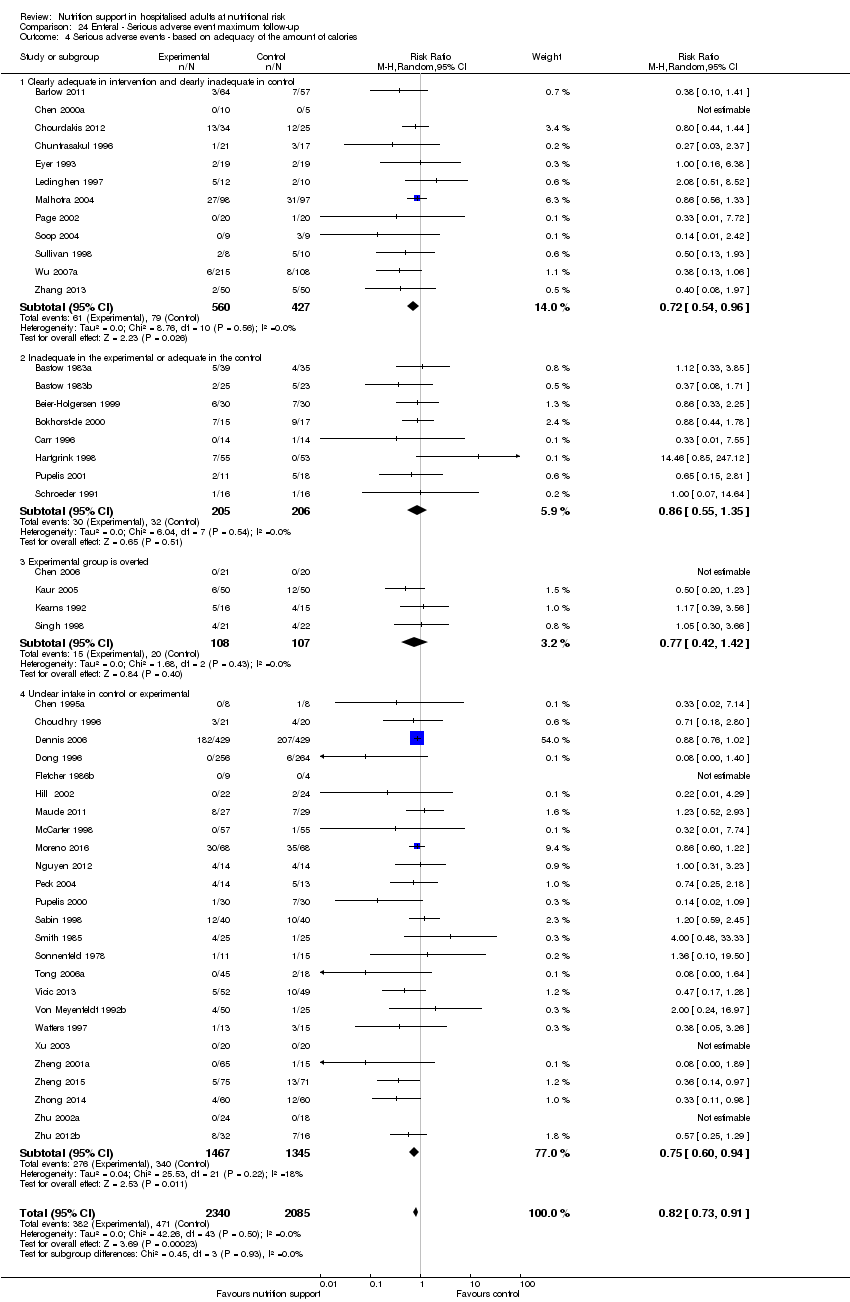 Comparison 24 Enteral ‐ Serious adverse event maximum follow‐up, Outcome 4 Serious adverse events ‐ based on adequacy of the amount of calories. | ||||
| 4.1 Clearly adequate in intervention and clearly inadequate in control | 12 | 987 | Risk Ratio (M‐H, Random, 95% CI) | 0.72 [0.54, 0.96] |
| 4.2 Inadequate in the experimental or adequate in the control | 8 | 411 | Risk Ratio (M‐H, Random, 95% CI) | 0.86 [0.55, 1.35] |
| 4.3 Experimental group is overfed | 4 | 215 | Risk Ratio (M‐H, Random, 95% CI) | 0.77 [0.42, 1.42] |
| 4.4 Unclear intake in control or experimental | 25 | 2812 | Risk Ratio (M‐H, Random, 95% CI) | 0.75 [0.60, 0.94] |
| 5 Serious adverse events ‐ different screening tools Show forest plot | 49 | 4425 | Risk Ratio (M‐H, Random, 95% CI) | 0.82 [0.73, 0.91] |
| Analysis 24.5  Comparison 24 Enteral ‐ Serious adverse event maximum follow‐up, Outcome 5 Serious adverse events ‐ different screening tools. | ||||
| 5.1 NRS 2002 | 0 | 0 | Risk Ratio (M‐H, Random, 95% CI) | 0.0 [0.0, 0.0] |
| 5.2 MUST | 0 | 0 | Risk Ratio (M‐H, Random, 95% CI) | 0.0 [0.0, 0.0] |
| 5.3 MNA | 0 | 0 | Risk Ratio (M‐H, Random, 95% CI) | 0.0 [0.0, 0.0] |
| 5.4 SGA | 1 | 323 | Risk Ratio (M‐H, Random, 95% CI) | 0.38 [0.13, 1.06] |
| 5.5 Other means | 48 | 4102 | Risk Ratio (M‐H, Random, 95% CI) | 0.82 [0.74, 0.92] |
| 6 Serious adverse events ‐ participants characterised as 'at nutritional risk' due to one of the following conditions Show forest plot | 49 | 4425 | Risk Ratio (M‐H, Random, 95% CI) | 0.82 [0.73, 0.91] |
| Analysis 24.6  Comparison 24 Enteral ‐ Serious adverse event maximum follow‐up, Outcome 6 Serious adverse events ‐ participants characterised as 'at nutritional risk' due to one of the following conditions. | ||||
| 6.1 Major surgery | 26 | 2139 | Risk Ratio (M‐H, Random, 95% CI) | 0.67 [0.51, 0.88] |
| 6.2 Stroke | 4 | 1172 | Risk Ratio (M‐H, Random, 95% CI) | 0.58 [0.34, 1.00] |
| 6.3 ICU participants including trauma | 9 | 458 | Risk Ratio (M‐H, Random, 95% CI) | 0.80 [0.56, 1.14] |
| 6.4 Frail elderly participants with less severe conditions known to increase protein requirements | 2 | 126 | Risk Ratio (M‐H, Random, 95% CI) | 2.24 [0.05, 95.92] |
| 6.5 Participants do not fall into one of the categories above | 8 | 530 | Risk Ratio (M‐H, Random, 95% CI) | 0.90 [0.69, 1.19] |
| 7 Serious adverse events ‐ participants characterised as 'at nutritional risk' due to one of the following criteria Show forest plot | 49 | 4425 | Risk Ratio (M‐H, Random, 95% CI) | 0.82 [0.73, 0.91] |
| Analysis 24.7  Comparison 24 Enteral ‐ Serious adverse event maximum follow‐up, Outcome 7 Serious adverse events ‐ participants characterised as 'at nutritional risk' due to one of the following criteria. | ||||
| 7.1 BMI less than 20.5 kg/m2 | 0 | 0 | Risk Ratio (M‐H, Random, 95% CI) | 0.0 [0.0, 0.0] |
| 7.2 Weight loss of at least 5% during the last three months | 0 | 0 | Risk Ratio (M‐H, Random, 95% CI) | 0.0 [0.0, 0.0] |
| 7.3 Weight loss of at least 10% during the last six months | 1 | 32 | Risk Ratio (M‐H, Random, 95% CI) | 0.88 [0.44, 1.78] |
| 7.4 Insufficient food intake during the last week (50% of requirements or less) | 0 | 0 | Risk Ratio (M‐H, Random, 95% CI) | 0.0 [0.0, 0.0] |
| 7.5 Participants characterised as 'at nutritional risk' by other means | 48 | 4393 | Risk Ratio (M‐H, Random, 95% CI) | 0.81 [0.72, 0.91] |
| 8 Serious adverse events ‐ participants characterised as 'at nutritional risk' due to biomarkers or anthropometrics Show forest plot | 49 | 4425 | Risk Ratio (M‐H, Random, 95% CI) | 0.82 [0.73, 0.91] |
| Analysis 24.8  Comparison 24 Enteral ‐ Serious adverse event maximum follow‐up, Outcome 8 Serious adverse events ‐ participants characterised as 'at nutritional risk' due to biomarkers or anthropometrics. | ||||
| 8.1 Biomarkers | 3 | 551 | Risk Ratio (M‐H, Random, 95% CI) | 0.16 [0.02, 1.26] |
| 8.2 Anthropometric measures | 2 | 122 | Risk Ratio (M‐H, Random, 95% CI) | 0.71 [0.24, 2.08] |
| 8.3 Both | 0 | 0 | Risk Ratio (M‐H, Random, 95% CI) | 0.0 [0.0, 0.0] |
| 8.4 Characterised by other means | 44 | 3752 | Risk Ratio (M‐H, Random, 95% CI) | 0.82 [0.74, 0.92] |
| 9 Serious adverse events ‐ randomisation year Show forest plot | 49 | 4425 | Risk Ratio (M‐H, Random, 95% CI) | 0.82 [0.73, 0.91] |
| Analysis 24.9  Comparison 24 Enteral ‐ Serious adverse event maximum follow‐up, Outcome 9 Serious adverse events ‐ randomisation year. | ||||
| 9.1 Before 1960 | 0 | 0 | Risk Ratio (M‐H, Random, 95% CI) | 0.0 [0.0, 0.0] |
| 9.2 1960 to 1979 | 1 | 26 | Risk Ratio (M‐H, Random, 95% CI) | 1.36 [0.10, 19.50] |
| 9.3 1980 to 1999 | 28 | 2591 | Risk Ratio (M‐H, Random, 95% CI) | 0.88 [0.77, 1.00] |
| 9.4 After 1999 | 20 | 1808 | Risk Ratio (M‐H, Random, 95% CI) | 0.70 [0.58, 0.85] |
| 10 Serious adverse events ‐ trials where the intervention lasts fewer than three days compared with trials where the intervention lasts three days or more Show forest plot | 49 | 4425 | Risk Ratio (M‐H, Random, 95% CI) | 0.82 [0.73, 0.91] |
| Analysis 24.10  Comparison 24 Enteral ‐ Serious adverse event maximum follow‐up, Outcome 10 Serious adverse events ‐ trials where the intervention lasts fewer than three days compared with trials where the intervention lasts three days or more. | ||||
| 10.1 Three days or more | 41 | 3893 | Risk Ratio (M‐H, Random, 95% CI) | 0.77 [0.66, 0.89] |
| 10.2 Less than three days | 8 | 532 | Risk Ratio (M‐H, Random, 95% CI) | 0.86 [0.60, 1.22] |
| 10.3 Unknown | 0 | 0 | Risk Ratio (M‐H, Random, 95% CI) | 0.0 [0.0, 0.0] |
| 11 Serious adverse events co‐interventions Show forest plot | 49 | 4425 | Risk Ratio (M‐H, Fixed, 95% CI) | 0.78 [0.70, 0.87] |
| Analysis 24.11 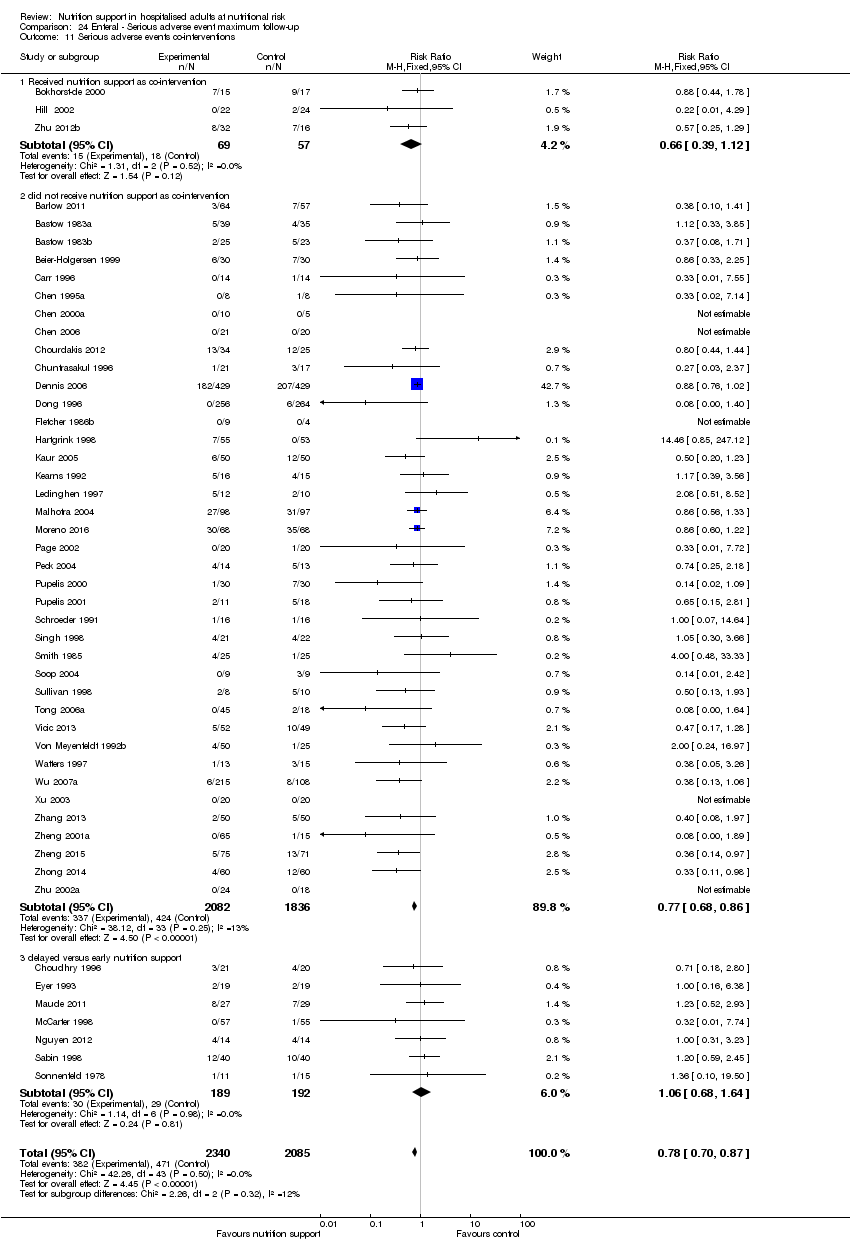 Comparison 24 Enteral ‐ Serious adverse event maximum follow‐up, Outcome 11 Serious adverse events co‐interventions. | ||||
| 11.1 Received nutrition support as co‐intervention | 3 | 126 | Risk Ratio (M‐H, Fixed, 95% CI) | 0.66 [0.39, 1.12] |
| 11.2 did not receive nutrition support as co‐intervention | 39 | 3918 | Risk Ratio (M‐H, Fixed, 95% CI) | 0.77 [0.68, 0.86] |
| 11.3 delayed versus early nutrition support | 7 | 381 | Risk Ratio (M‐H, Fixed, 95% CI) | 1.06 [0.68, 1.64] |
| 12 Serious adverse events ‐ 'best‐worse case' scenario (enteral nutrition) Show forest plot | 48 | 4489 | Risk Ratio (M‐H, Random, 95% CI) | 0.62 [0.51, 0.75] |
| Analysis 24.12  Comparison 24 Enteral ‐ Serious adverse event maximum follow‐up, Outcome 12 Serious adverse events ‐ 'best‐worse case' scenario (enteral nutrition). | ||||
| 13 Serious adverse events ‐ 'worst‐best case' scenario (enteral nutrition) Show forest plot | 48 | 4489 | Risk Ratio (M‐H, Random, 95% CI) | 0.81 [0.69, 0.95] |
| Analysis 24.13 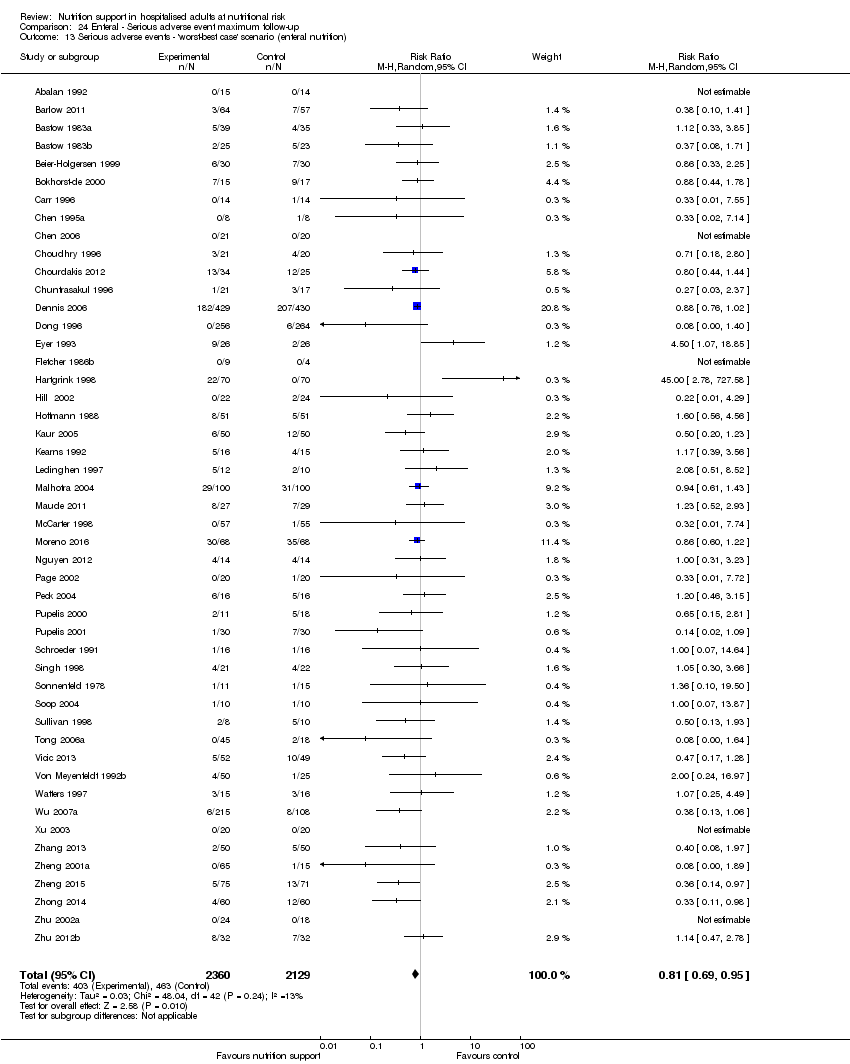 Comparison 24 Enteral ‐ Serious adverse event maximum follow‐up, Outcome 13 Serious adverse events ‐ 'worst‐best case' scenario (enteral nutrition). | ||||
| Outcome or subgroup title | No. of studies | No. of participants | Statistical method | Effect size |
| 1 All‐cause mortality ‐ overall Show forest plot | 43 | 7313 | Risk Ratio (M‐H, Random, 95% CI) | 0.98 [0.83, 1.16] |
| Analysis 25.1  Comparison 25 Parenteral ‐ All cause mortality ‐ end of intervention, Outcome 1 All‐cause mortality ‐ overall. | ||||
| 2 All‐cause mortality ‐ bias Show forest plot | 43 | 7313 | Risk Ratio (M‐H, Random, 95% CI) | 0.98 [0.83, 1.16] |
| Analysis 25.2  Comparison 25 Parenteral ‐ All cause mortality ‐ end of intervention, Outcome 2 All‐cause mortality ‐ bias. | ||||
| 2.1 High risk of bias | 43 | 7313 | Risk Ratio (M‐H, Random, 95% CI) | 0.98 [0.83, 1.16] |
| 2.2 Low risk of bias | 0 | 0 | Risk Ratio (M‐H, Random, 95% CI) | 0.0 [0.0, 0.0] |
| 3 All‐cause mortality ‐ medical speciality Show forest plot | 43 | 7313 | Risk Ratio (M‐H, Random, 95% CI) | 0.98 [0.83, 1.16] |
| Analysis 25.3  Comparison 25 Parenteral ‐ All cause mortality ‐ end of intervention, Outcome 3 All‐cause mortality ‐ medical speciality. | ||||
| 3.1 Cardiology | 0 | 0 | Risk Ratio (M‐H, Random, 95% CI) | 0.0 [0.0, 0.0] |
| 3.2 Medical gastroenterology and hepatology | 7 | 259 | Risk Ratio (M‐H, Random, 95% CI) | 1.17 [0.58, 2.37] |
| 3.3 Geriatrics | 0 | 0 | Risk Ratio (M‐H, Random, 95% CI) | 0.0 [0.0, 0.0] |
| 3.4 Pulmonary disease | 1 | 25 | Risk Ratio (M‐H, Random, 95% CI) | 0.22 [0.01, 4.08] |
| 3.5 Endocrinology | 0 | 0 | Risk Ratio (M‐H, Random, 95% CI) | 0.0 [0.0, 0.0] |
| 3.6 Infectious diseases | 0 | 0 | Risk Ratio (M‐H, Random, 95% CI) | 0.0 [0.0, 0.0] |
| 3.7 Rheumatology | 0 | 0 | Risk Ratio (M‐H, Random, 95% CI) | 0.0 [0.0, 0.0] |
| 3.8 Haematology | 0 | 0 | Risk Ratio (M‐H, Random, 95% CI) | 0.0 [0.0, 0.0] |
| 3.9 Nephrology | 0 | 0 | Risk Ratio (M‐H, Random, 95% CI) | 0.0 [0.0, 0.0] |
| 3.10 Gastroenterologic surgery | 21 | 1553 | Risk Ratio (M‐H, Random, 95% CI) | 0.79 [0.52, 1.20] |
| 3.11 Trauma surgery | 2 | 45 | Risk Ratio (M‐H, Random, 95% CI) | 1.22 [0.66, 2.25] |
| 3.12 Orthopaedics | 0 | 0 | Risk Ratio (M‐H, Random, 95% CI) | 0.0 [0.0, 0.0] |
| 3.13 Plastic, reconstructive and aesthetic surgery | 0 | 0 | Risk Ratio (M‐H, Random, 95% CI) | 0.0 [0.0, 0.0] |
| 3.14 Vascular surgery | 1 | 15 | Risk Ratio (M‐H, Random, 95% CI) | 0.0 [0.0, 0.0] |
| 3.15 Transplant surgery | 2 | 47 | Risk Ratio (M‐H, Random, 95% CI) | 0.61 [0.23, 1.65] |
| 3.16 Urology | 0 | 0 | Risk Ratio (M‐H, Random, 95% CI) | 0.0 [0.0, 0.0] |
| 3.17 Thoracic surgery | 1 | 44 | Risk Ratio (M‐H, Random, 95% CI) | 1.6 [0.40, 6.32] |
| 3.18 Neurological surgery | 0 | 0 | Risk Ratio (M‐H, Random, 95% CI) | 0.0 [0.0, 0.0] |
| 3.19 Oro‐maxillo‐facial surgery | 0 | 0 | Risk Ratio (M‐H, Random, 95% CI) | 0.0 [0.0, 0.0] |
| 3.20 Anaesthesiology | 0 | 0 | Risk Ratio (M‐H, Random, 95% CI) | 0.0 [0.0, 0.0] |
| 3.21 Emergency medicine | 4 | 5044 | Risk Ratio (M‐H, Random, 95% CI) | 1.00 [0.81, 1.24] |
| 3.22 Psychiatry | 0 | 0 | Risk Ratio (M‐H, Random, 95% CI) | 0.0 [0.0, 0.0] |
| 3.23 Neurology | 0 | 0 | Risk Ratio (M‐H, Random, 95% CI) | 0.0 [0.0, 0.0] |
| 3.24 Oncology | 4 | 281 | Risk Ratio (M‐H, Random, 95% CI) | 1.19 [0.44, 3.21] |
| 3.25 Dermatology | 0 | 0 | Risk Ratio (M‐H, Random, 95% CI) | 0.0 [0.0, 0.0] |
| 3.26 Gynaecology | 0 | 0 | Risk Ratio (M‐H, Random, 95% CI) | 0.0 [0.0, 0.0] |
| 3.27 Mixed | 0 | 0 | Risk Ratio (M‐H, Random, 95% CI) | 0.0 [0.0, 0.0] |
| 4 All‐cause mortality ‐ based on adequacy of the amount of calories Show forest plot | 43 | 7313 | Risk Ratio (M‐H, Random, 95% CI) | 0.98 [0.83, 1.16] |
| Analysis 25.4  Comparison 25 Parenteral ‐ All cause mortality ‐ end of intervention, Outcome 4 All‐cause mortality ‐ based on adequacy of the amount of calories. | ||||
| 4.1 Clearly adequate in experimental group and clearly inadequate in control group | 7 | 5641 | Risk Ratio (M‐H, Random, 95% CI) | 0.98 [0.80, 1.20] |
| 4.2 Inadequate in the experimental group or adequate in the control group | 1 | 53 | Risk Ratio (M‐H, Random, 95% CI) | 1.16 [0.40, 3.33] |
| 4.3 Experimental group is overfed | 0 | 0 | Risk Ratio (M‐H, Random, 95% CI) | 0.0 [0.0, 0.0] |
| 4.4 Unclear intake in experimental group or control group | 35 | 1619 | Risk Ratio (M‐H, Random, 95% CI) | 0.95 [0.68, 1.32] |
| 5 All‐cause mortality ‐ different screening tools Show forest plot | 43 | 7313 | Risk Ratio (M‐H, Random, 95% CI) | 0.98 [0.83, 1.16] |
| Analysis 25.5  Comparison 25 Parenteral ‐ All cause mortality ‐ end of intervention, Outcome 5 All‐cause mortality ‐ different screening tools. | ||||
| 5.1 NRS 2002 | 1 | 4640 | Risk Ratio (M‐H, Random, 95% CI) | 1.04 [0.83, 1.30] |
| 5.2 MUST | 0 | 0 | Risk Ratio (M‐H, Random, 95% CI) | 0.0 [0.0, 0.0] |
| 5.3 MNA | 0 | 0 | Risk Ratio (M‐H, Random, 95% CI) | 0.0 [0.0, 0.0] |
| 5.4 SGA | 1 | 323 | Risk Ratio (M‐H, Random, 95% CI) | 0.75 [0.13, 4.44] |
| 5.5 Other means | 41 | 2350 | Risk Ratio (M‐H, Random, 95% CI) | 0.90 [0.69, 1.17] |
| 6 All‐cause mortality ‐ participants characterised as 'at nutritional risk' due to one of the following conditions Show forest plot | 43 | 7313 | Risk Ratio (M‐H, Random, 95% CI) | 0.98 [0.83, 1.16] |
| Analysis 25.6 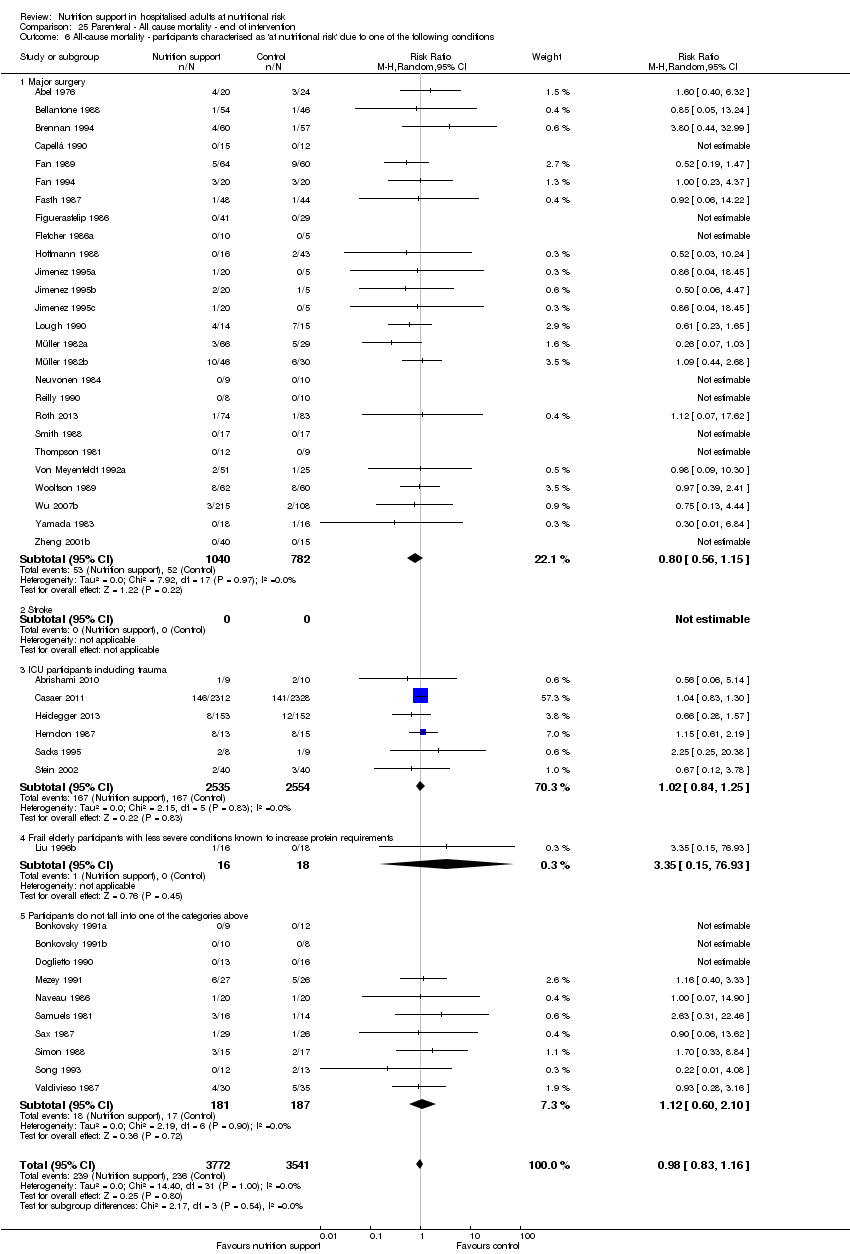 Comparison 25 Parenteral ‐ All cause mortality ‐ end of intervention, Outcome 6 All‐cause mortality ‐ participants characterised as 'at nutritional risk' due to one of the following conditions. | ||||
| 6.1 Major surgery | 26 | 1822 | Risk Ratio (M‐H, Random, 95% CI) | 0.80 [0.56, 1.15] |
| 6.2 Stroke | 0 | 0 | Risk Ratio (M‐H, Random, 95% CI) | 0.0 [0.0, 0.0] |
| 6.3 ICU participants including trauma | 6 | 5089 | Risk Ratio (M‐H, Random, 95% CI) | 1.02 [0.84, 1.25] |
| 6.4 Frail elderly participants with less severe conditions known to increase protein requirements | 1 | 34 | Risk Ratio (M‐H, Random, 95% CI) | 3.35 [0.15, 76.93] |
| 6.5 Participants do not fall into one of the categories above | 10 | 368 | Risk Ratio (M‐H, Random, 95% CI) | 1.12 [0.60, 2.10] |
| 7 All‐cause mortality ‐ participants characterised as 'at nutritional risk' due to one of the following criteria Show forest plot | 43 | 7313 | Risk Ratio (M‐H, Random, 95% CI) | 0.98 [0.83, 1.16] |
| Analysis 25.7  Comparison 25 Parenteral ‐ All cause mortality ‐ end of intervention, Outcome 7 All‐cause mortality ‐ participants characterised as 'at nutritional risk' due to one of the following criteria. | ||||
| 7.1 BMI less than 20.5 kg/m2 | 0 | 0 | Risk Ratio (M‐H, Random, 95% CI) | 0.0 [0.0, 0.0] |
| 7.2 Weight loss of at least 5% during the last three months | 0 | 0 | Risk Ratio (M‐H, Random, 95% CI) | 0.0 [0.0, 0.0] |
| 7.3 Weight loss of at least 10% during the last six months | 0 | 0 | Risk Ratio (M‐H, Random, 95% CI) | 0.0 [0.0, 0.0] |
| 7.4 Insufficient food intake during the last week (50% of requirements or less) | 0 | 0 | Risk Ratio (M‐H, Random, 95% CI) | 0.0 [0.0, 0.0] |
| 7.5 Participants characterised as 'at nutritional risk' by other means | 43 | 7313 | Risk Ratio (M‐H, Random, 95% CI) | 0.98 [0.83, 1.16] |
| 8 All‐cause mortality ‐ participants characterised as 'at nutritional risk' due to biomarkers or anthropometrics Show forest plot | 43 | 7313 | Risk Ratio (M‐H, Random, 95% CI) | 0.98 [0.83, 1.16] |
| Analysis 25.8  Comparison 25 Parenteral ‐ All cause mortality ‐ end of intervention, Outcome 8 All‐cause mortality ‐ participants characterised as 'at nutritional risk' due to biomarkers or anthropometrics. | ||||
| 8.1 Biomarkers | 2 | 43 | Risk Ratio (M‐H, Random, 95% CI) | 0.22 [0.01, 4.08] |
| 8.2 Anthropometric measures | 3 | 137 | Risk Ratio (M‐H, Random, 95% CI) | 1.31 [0.38, 4.58] |
| 8.3 Both | 3 | 75 | Risk Ratio (M‐H, Random, 95% CI) | 0.66 [0.14, 3.07] |
| 8.4 Characterised by other means | 35 | 7058 | Risk Ratio (M‐H, Random, 95% CI) | 0.98 [0.83, 1.17] |
| 9 All‐cause mortality ‐ randomisation year Show forest plot | 43 | 7313 | Risk Ratio (M‐H, Random, 95% CI) | 0.98 [0.83, 1.16] |
| Analysis 25.9  Comparison 25 Parenteral ‐ All cause mortality ‐ end of intervention, Outcome 9 All‐cause mortality ‐ randomisation year. | ||||
| 9.1 Before 1960 | 0 | 0 | Risk Ratio (M‐H, Random, 95% CI) | 0.0 [0.0, 0.0] |
| 9.2 1960‐1979 | 3 | 95 | Risk Ratio (M‐H, Random, 95% CI) | 1.85 [0.58, 5.88] |
| 9.3 1980‐1999 | 34 | 1694 | Risk Ratio (M‐H, Random, 95% CI) | 0.91 [0.68, 1.21] |
| 9.4 After 1999 | 6 | 5524 | Risk Ratio (M‐H, Random, 95% CI) | 1.00 [0.81, 1.23] |
| 10 All‐cause mortality ‐ trials where the intervention lasts fewer than three days compared with trials where the intervention lasts three days or more Show forest plot | 43 | 7313 | Risk Ratio (M‐H, Random, 95% CI) | 0.98 [0.83, 1.16] |
| Analysis 25.10  Comparison 25 Parenteral ‐ All cause mortality ‐ end of intervention, Outcome 10 All‐cause mortality ‐ trials where the intervention lasts fewer than three days compared with trials where the intervention lasts three days or more. | ||||
| 10.1 Three days or more | 41 | 7206 | Risk Ratio (M‐H, Random, 95% CI) | 0.98 [0.83, 1.16] |
| 10.2 Less than three days | 1 | 80 | Risk Ratio (M‐H, Random, 95% CI) | 0.67 [0.12, 3.78] |
| 10.3 Unknown | 1 | 27 | Risk Ratio (M‐H, Random, 95% CI) | 0.0 [0.0, 0.0] |
| 11 All‐cause mortality ‐ 'best‐worst case' scenario Show forest plot | 43 | 7432 | Risk Ratio (M‐H, Random, 95% CI) | 0.73 [0.56, 0.97] |
| Analysis 25.11 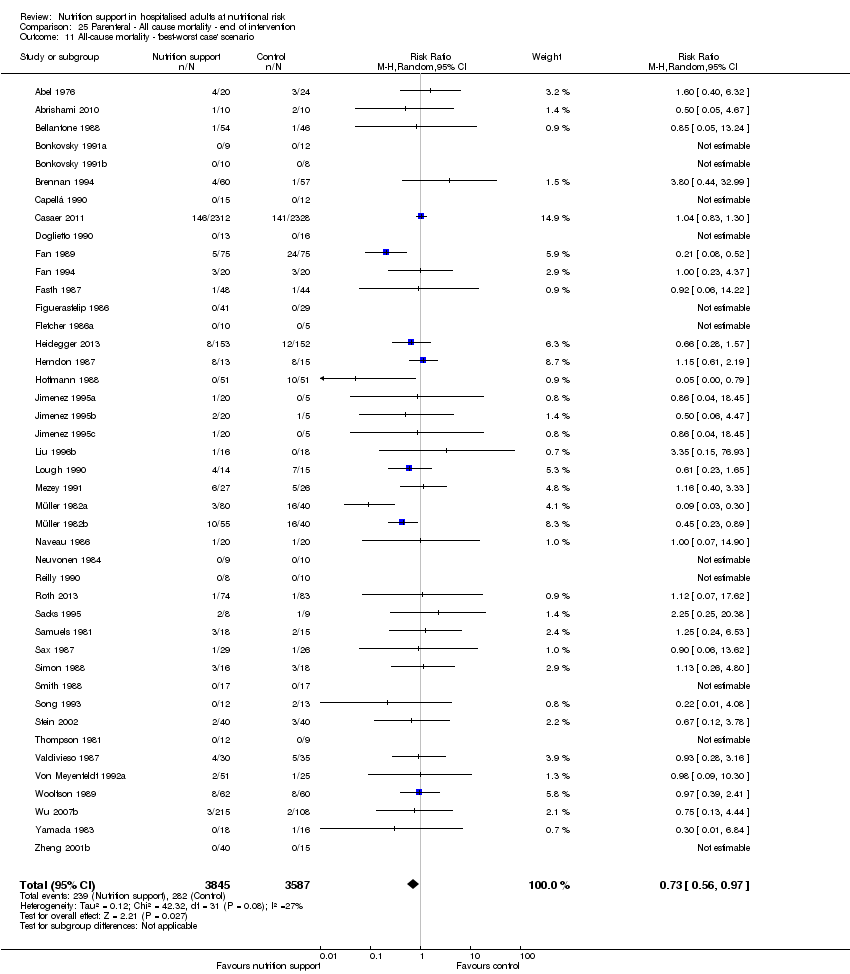 Comparison 25 Parenteral ‐ All cause mortality ‐ end of intervention, Outcome 11 All‐cause mortality ‐ 'best‐worst case' scenario. | ||||
| 12 All‐cause mortality ‐ 'worst‐best case' scenario Show forest plot | 43 | 7432 | Risk Ratio (M‐H, Random, 95% CI) | 1.20 [0.98, 1.47] |
| Analysis 25.12  Comparison 25 Parenteral ‐ All cause mortality ‐ end of intervention, Outcome 12 All‐cause mortality ‐ 'worst‐best case' scenario. | ||||
| 13 All‐cause mortality co‐interventions Show forest plot | 43 | 7313 | Risk Ratio (M‐H, Fixed, 95% CI) | 0.98 [0.82, 1.16] |
| Analysis 25.13  Comparison 25 Parenteral ‐ All cause mortality ‐ end of intervention, Outcome 13 All‐cause mortality co‐interventions. | ||||
| 13.1 received nutrition support as co‐intervention | 6 | 5066 | Risk Ratio (M‐H, Fixed, 95% CI) | 1.03 [0.83, 1.26] |
| 13.2 did not receive nutrition support as co‐intervention | 36 | 2167 | Risk Ratio (M‐H, Fixed, 95% CI) | 0.88 [0.66, 1.18] |
| 13.3 delayed versus early nutrition support | 1 | 80 | Risk Ratio (M‐H, Fixed, 95% CI) | 0.67 [0.12, 3.78] |
| Outcome or subgroup title | No. of studies | No. of participants | Statistical method | Effect size |
| 1 All‐cause mortality ‐ overall Show forest plot | 51 | 8121 | Risk Ratio (M‐H, Random, 95% CI) | 0.99 [0.90, 1.09] |
| Analysis 26.1  Comparison 26 Parenteral ‐ All cause mortality ‐ maximum follow‐up, Outcome 1 All‐cause mortality ‐ overall. | ||||
| 2 All‐cause mortality ‐ bias Show forest plot | 51 | 8121 | Risk Ratio (M‐H, Random, 95% CI) | 0.99 [0.90, 1.09] |
| Analysis 26.2  Comparison 26 Parenteral ‐ All cause mortality ‐ maximum follow‐up, Outcome 2 All‐cause mortality ‐ bias. | ||||
| 2.1 High risk of bias | 51 | 8121 | Risk Ratio (M‐H, Random, 95% CI) | 0.99 [0.90, 1.09] |
| 2.2 Low risk of bias | 0 | 0 | Risk Ratio (M‐H, Random, 95% CI) | 0.0 [0.0, 0.0] |
| 3 All‐cause mortality ‐ medical speciality Show forest plot | 51 | 8121 | Risk Ratio (M‐H, Random, 95% CI) | 0.99 [0.90, 1.09] |
| Analysis 26.3 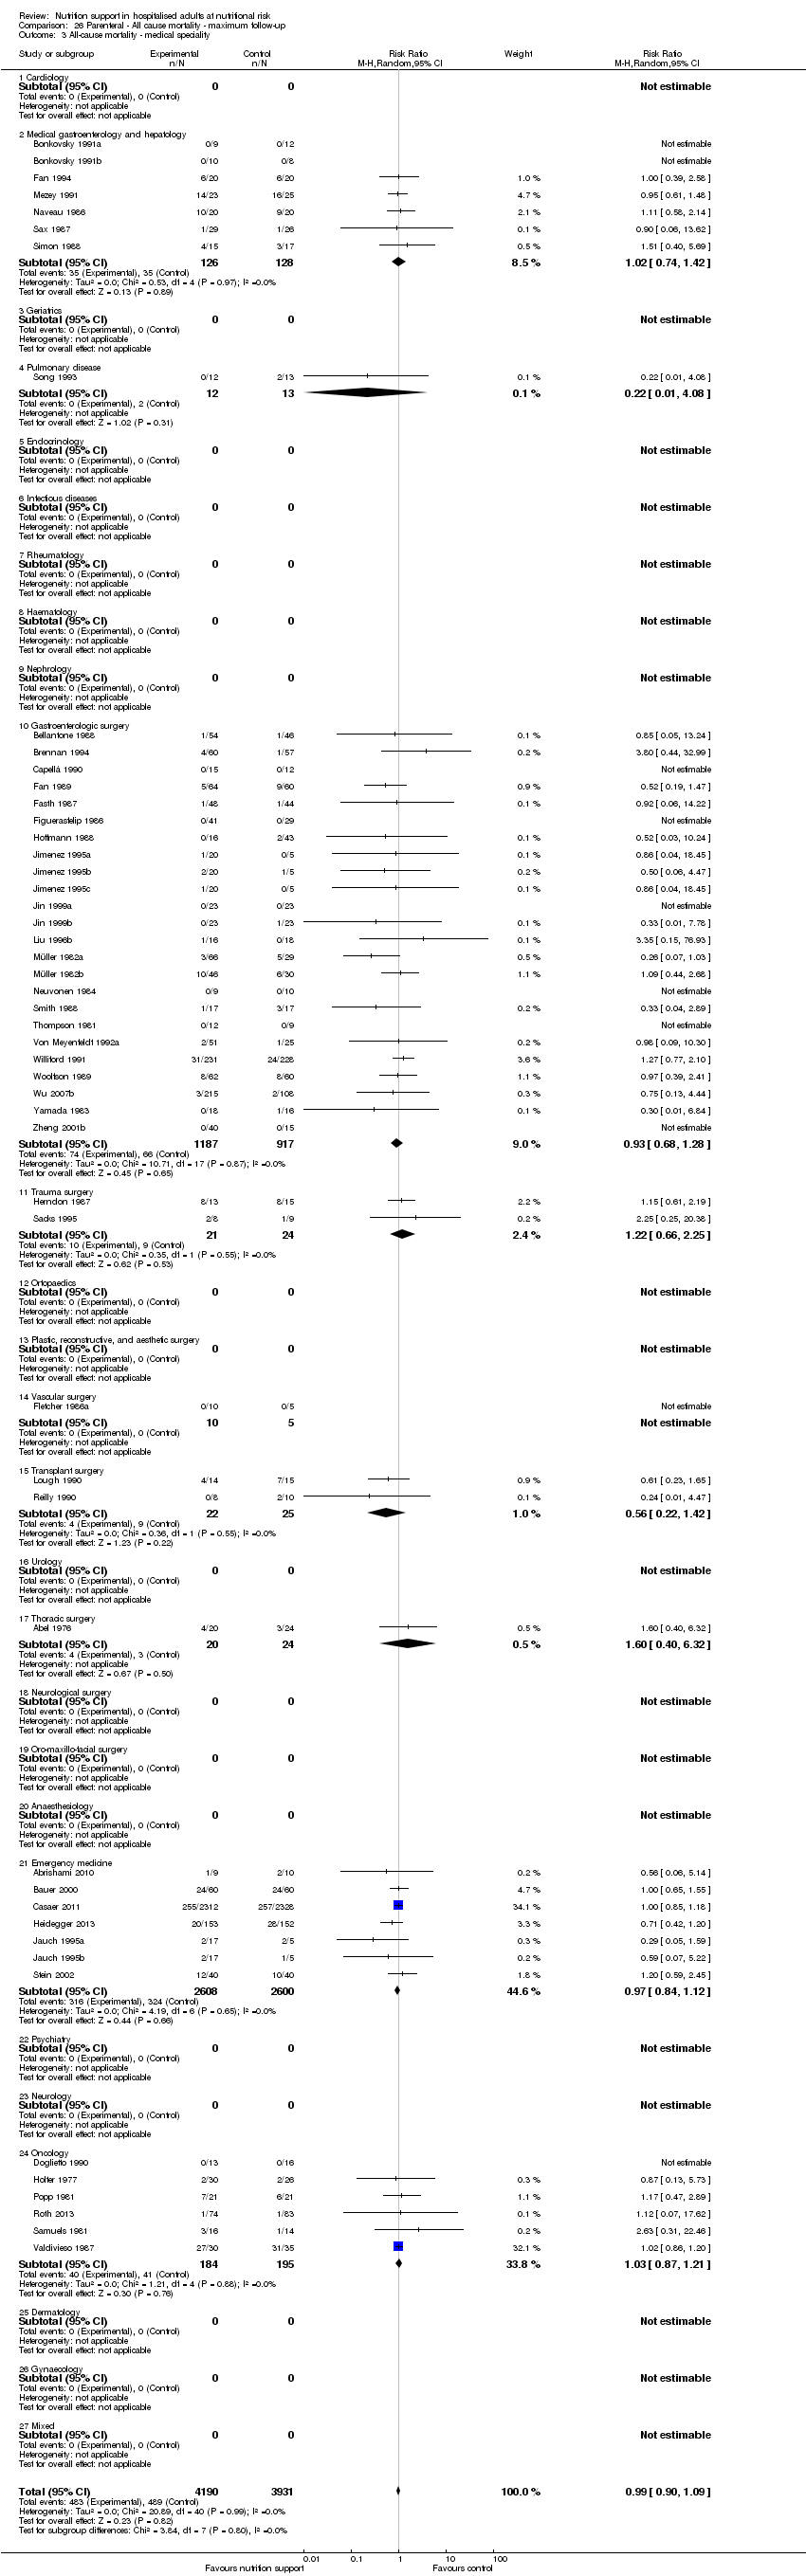 Comparison 26 Parenteral ‐ All cause mortality ‐ maximum follow‐up, Outcome 3 All‐cause mortality ‐ medical speciality. | ||||
| 3.1 Cardiology | 0 | 0 | Risk Ratio (M‐H, Random, 95% CI) | 0.0 [0.0, 0.0] |
| 3.2 Medical gastroenterology and hepatology | 7 | 254 | Risk Ratio (M‐H, Random, 95% CI) | 1.02 [0.74, 1.42] |
| 3.3 Geriatrics | 0 | 0 | Risk Ratio (M‐H, Random, 95% CI) | 0.0 [0.0, 0.0] |
| 3.4 Pulmonary disease | 1 | 25 | Risk Ratio (M‐H, Random, 95% CI) | 0.22 [0.01, 4.08] |
| 3.5 Endocrinology | 0 | 0 | Risk Ratio (M‐H, Random, 95% CI) | 0.0 [0.0, 0.0] |
| 3.6 Infectious diseases | 0 | 0 | Risk Ratio (M‐H, Random, 95% CI) | 0.0 [0.0, 0.0] |
| 3.7 Rheumatology | 0 | 0 | Risk Ratio (M‐H, Random, 95% CI) | 0.0 [0.0, 0.0] |
| 3.8 Haematology | 0 | 0 | Risk Ratio (M‐H, Random, 95% CI) | 0.0 [0.0, 0.0] |
| 3.9 Nephrology | 0 | 0 | Risk Ratio (M‐H, Random, 95% CI) | 0.0 [0.0, 0.0] |
| 3.10 Gastroenterologic surgery | 24 | 2104 | Risk Ratio (M‐H, Random, 95% CI) | 0.93 [0.68, 1.28] |
| 3.11 Trauma surgery | 2 | 45 | Risk Ratio (M‐H, Random, 95% CI) | 1.22 [0.66, 2.25] |
| 3.12 Ortopaedics | 0 | 0 | Risk Ratio (M‐H, Random, 95% CI) | 0.0 [0.0, 0.0] |
| 3.13 Plastic, reconstructive, and aesthetic surgery | 0 | 0 | Risk Ratio (M‐H, Random, 95% CI) | 0.0 [0.0, 0.0] |
| 3.14 Vascular surgery | 1 | 15 | Risk Ratio (M‐H, Random, 95% CI) | 0.0 [0.0, 0.0] |
| 3.15 Transplant surgery | 2 | 47 | Risk Ratio (M‐H, Random, 95% CI) | 0.56 [0.22, 1.42] |
| 3.16 Urology | 0 | 0 | Risk Ratio (M‐H, Random, 95% CI) | 0.0 [0.0, 0.0] |
| 3.17 Thoracic surgery | 1 | 44 | Risk Ratio (M‐H, Random, 95% CI) | 1.6 [0.40, 6.32] |
| 3.18 Neurological surgery | 0 | 0 | Risk Ratio (M‐H, Random, 95% CI) | 0.0 [0.0, 0.0] |
| 3.19 Oro‐maxillo‐facial surgery | 0 | 0 | Risk Ratio (M‐H, Random, 95% CI) | 0.0 [0.0, 0.0] |
| 3.20 Anaesthesiology | 0 | 0 | Risk Ratio (M‐H, Random, 95% CI) | 0.0 [0.0, 0.0] |
| 3.21 Emergency medicine | 7 | 5208 | Risk Ratio (M‐H, Random, 95% CI) | 0.97 [0.84, 1.12] |
| 3.22 Psychiatry | 0 | 0 | Risk Ratio (M‐H, Random, 95% CI) | 0.0 [0.0, 0.0] |
| 3.23 Neurology | 0 | 0 | Risk Ratio (M‐H, Random, 95% CI) | 0.0 [0.0, 0.0] |
| 3.24 Oncology | 6 | 379 | Risk Ratio (M‐H, Random, 95% CI) | 1.03 [0.87, 1.21] |
| 3.25 Dermatology | 0 | 0 | Risk Ratio (M‐H, Random, 95% CI) | 0.0 [0.0, 0.0] |
| 3.26 Gynaecology | 0 | 0 | Risk Ratio (M‐H, Random, 95% CI) | 0.0 [0.0, 0.0] |
| 3.27 Mixed | 0 | 0 | Risk Ratio (M‐H, Random, 95% CI) | 0.0 [0.0, 0.0] |
| 4 All‐cause mortality ‐ based on adequacy of the amount of calories Show forest plot | 51 | 8121 | Risk Ratio (M‐H, Random, 95% CI) | 0.99 [0.90, 1.09] |
| Analysis 26.4  Comparison 26 Parenteral ‐ All cause mortality ‐ maximum follow‐up, Outcome 4 All‐cause mortality ‐ based on adequacy of the amount of calories. | ||||
| 4.1 Clearly adequate in intervention and clearly inadequate in control | 7 | 5641 | Risk Ratio (M‐H, Random, 95% CI) | 0.98 [0.88, 1.10] |
| 4.2 Inadequate in the experimental or adequate in the control | 4 | 165 | Risk Ratio (M‐H, Random, 95% CI) | 1.17 [0.80, 1.72] |
| 4.3 Experimental group is overfed | 4 | 272 | Risk Ratio (M‐H, Random, 95% CI) | 0.56 [0.23, 1.34] |
| 4.4 Unclear intake in control or experimental | 36 | 2043 | Risk Ratio (M‐H, Random, 95% CI) | 0.99 [0.80, 1.22] |
| 5 All‐cause mortality ‐ different screening tools Show forest plot | 51 | 8121 | Risk Ratio (M‐H, Random, 95% CI) | 0.99 [0.90, 1.09] |
| Analysis 26.5 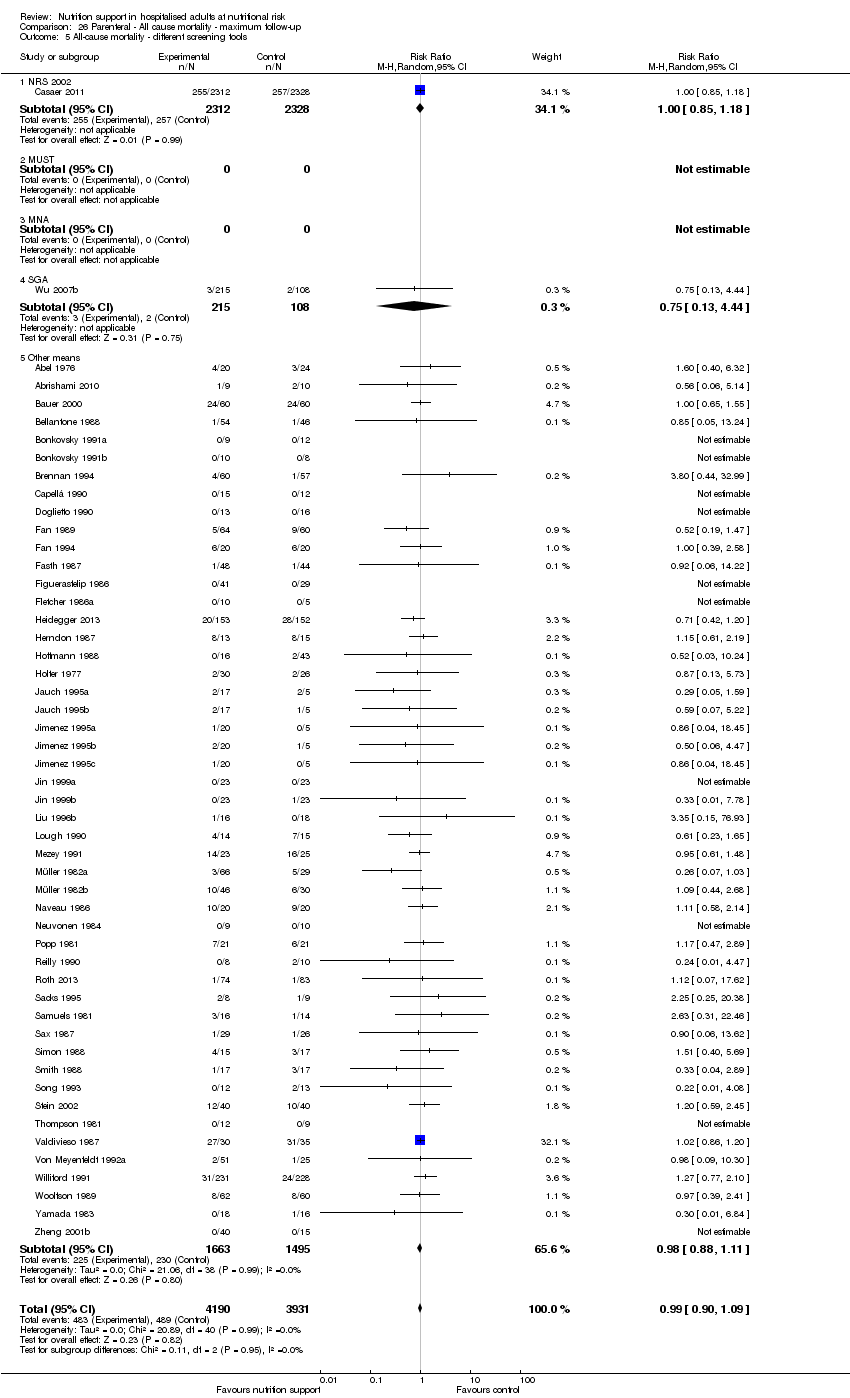 Comparison 26 Parenteral ‐ All cause mortality ‐ maximum follow‐up, Outcome 5 All‐cause mortality ‐ different screening tools. | ||||
| 5.1 NRS 2002 | 1 | 4640 | Risk Ratio (M‐H, Random, 95% CI) | 1.00 [0.85, 1.18] |
| 5.2 MUST | 0 | 0 | Risk Ratio (M‐H, Random, 95% CI) | 0.0 [0.0, 0.0] |
| 5.3 MNA | 0 | 0 | Risk Ratio (M‐H, Random, 95% CI) | 0.0 [0.0, 0.0] |
| 5.4 SGA | 1 | 323 | Risk Ratio (M‐H, Random, 95% CI) | 0.75 [0.13, 4.44] |
| 5.5 Other means | 49 | 3158 | Risk Ratio (M‐H, Random, 95% CI) | 0.98 [0.88, 1.11] |
| 6 All‐cause mortality ‐ participants characterised as 'at nutritional risk' due to one of the following conditions Show forest plot | 51 | 8121 | Risk Ratio (M‐H, Random, 95% CI) | 0.99 [0.90, 1.09] |
| Analysis 26.6  Comparison 26 Parenteral ‐ All cause mortality ‐ maximum follow‐up, Outcome 6 All‐cause mortality ‐ participants characterised as 'at nutritional risk' due to one of the following conditions. | ||||
| 6.1 Major surgery | 30 | 2381 | Risk Ratio (M‐H, Random, 95% CI) | 0.88 [0.67, 1.15] |
| 6.2 Stroke | 0 | 0 | Risk Ratio (M‐H, Random, 95% CI) | 0.0 [0.0, 0.0] |
| 6.3 ICU participants including trauma | 7 | 5209 | Risk Ratio (M‐H, Random, 95% CI) | 0.99 [0.86, 1.14] |
| 6.4 Frail elderly participants with less severe conditions known to increase protein requirements | 1 | 34 | Risk Ratio (M‐H, Random, 95% CI) | 3.35 [0.15, 76.93] |
| 6.5 Participants do not fall into one of the categories above | 13 | 497 | Risk Ratio (M‐H, Random, 95% CI) | 1.02 [0.88, 1.18] |
| 7 All‐cause mortality ‐ participants characterised as 'at nutritional risk' due to one of the following criteria Show forest plot | 51 | 8121 | Risk Ratio (M‐H, Random, 95% CI) | 0.99 [0.90, 1.09] |
| Analysis 26.7  Comparison 26 Parenteral ‐ All cause mortality ‐ maximum follow‐up, Outcome 7 All‐cause mortality ‐ participants characterised as 'at nutritional risk' due to one of the following criteria. | ||||
| 7.1 BMI less than 20.5 kg/m2 | 0 | 0 | Risk Ratio (M‐H, Random, 95% CI) | 0.0 [0.0, 0.0] |
| 7.2 Weight loss of at least 5% during the last three months | 0 | 0 | Risk Ratio (M‐H, Random, 95% CI) | 0.0 [0.0, 0.0] |
| 7.3 Weight loss of at least 10% during the last six months | 2 | 92 | Risk Ratio (M‐H, Random, 95% CI) | 0.33 [0.01, 7.78] |
| 7.4 Insufficient food intake during the last week (50% of requirements or less) | 0 | 0 | Risk Ratio (M‐H, Random, 95% CI) | 0.0 [0.0, 0.0] |
| 7.5 Participants characterised as 'at nutritional risk' by other means | 49 | 8029 | Risk Ratio (M‐H, Random, 95% CI) | 0.99 [0.90, 1.09] |
| 8 All‐cause mortality ‐ participants characterised as 'at nutritional risk' due to biomarkers or anthropometrics Show forest plot | 51 | 8121 | Risk Ratio (M‐H, Random, 95% CI) | 0.99 [0.90, 1.09] |
| Analysis 26.8  Comparison 26 Parenteral ‐ All cause mortality ‐ maximum follow‐up, Outcome 8 All‐cause mortality ‐ participants characterised as 'at nutritional risk' due to biomarkers or anthropometrics. | ||||
| 8.1 Biomarkers | 5 | 169 | Risk Ratio (M‐H, Random, 95% CI) | 0.47 [0.10, 2.12] |
| 8.2 Anthropometric measures | 3 | 137 | Risk Ratio (M‐H, Random, 95% CI) | 0.93 [0.32, 2.75] |
| 8.3 Both anthropometrics and biomarkers | 3 | 75 | Risk Ratio (M‐H, Random, 95% CI) | 0.66 [0.14, 3.07] |
| 8.4 Characterised by other means | 40 | 7740 | Risk Ratio (M‐H, Random, 95% CI) | 0.99 [0.90, 1.09] |
| 9 All‐cause mortality ‐ randomisation year Show forest plot | 51 | 8121 | Risk Ratio (M‐H, Random, 95% CI) | 0.99 [0.90, 1.09] |
| Analysis 26.9 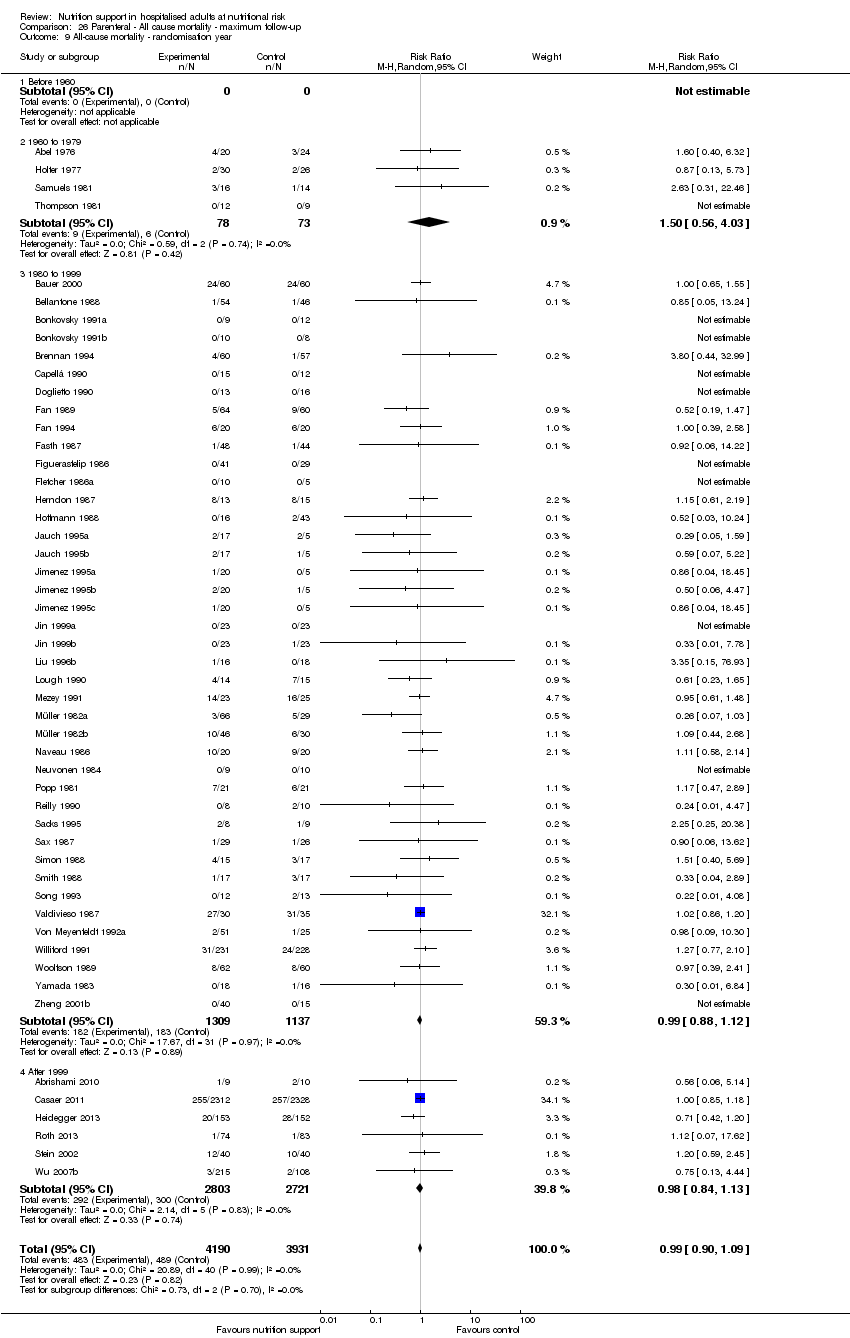 Comparison 26 Parenteral ‐ All cause mortality ‐ maximum follow‐up, Outcome 9 All‐cause mortality ‐ randomisation year. | ||||
| 9.1 Before 1960 | 0 | 0 | Risk Ratio (M‐H, Random, 95% CI) | 0.0 [0.0, 0.0] |
| 9.2 1960 to 1979 | 4 | 151 | Risk Ratio (M‐H, Random, 95% CI) | 1.50 [0.56, 4.03] |
| 9.3 1980 to 1999 | 41 | 2446 | Risk Ratio (M‐H, Random, 95% CI) | 0.99 [0.88, 1.12] |
| 9.4 After 1999 | 6 | 5524 | Risk Ratio (M‐H, Random, 95% CI) | 0.98 [0.84, 1.13] |
| 10 All‐cause mortality ‐ trials where the intervention lasts fewer than three days compared with trials where the intervention lasts three days or more Show forest plot | 51 | 8121 | Risk Ratio (M‐H, Random, 95% CI) | 0.99 [0.90, 1.09] |
| Analysis 26.10  Comparison 26 Parenteral ‐ All cause mortality ‐ maximum follow‐up, Outcome 10 All‐cause mortality ‐ trials where the intervention lasts fewer than three days compared with trials where the intervention lasts three days or more. | ||||
| 10.1 Three days or more | 49 | 8014 | Risk Ratio (M‐H, Random, 95% CI) | 0.99 [0.89, 1.08] |
| 10.2 Less than three days | 1 | 80 | Risk Ratio (M‐H, Random, 95% CI) | 1.2 [0.59, 2.45] |
| 10.3 Unknown | 1 | 27 | Risk Ratio (M‐H, Random, 95% CI) | 0.0 [0.0, 0.0] |
| 11 All‐cause mortality ‐ 'best‐worst case' scenario Show forest plot | 51 | 8240 | Risk Ratio (M‐H, Random, 95% CI) | 0.87 [0.74, 1.02] |
| Analysis 26.11  Comparison 26 Parenteral ‐ All cause mortality ‐ maximum follow‐up, Outcome 11 All‐cause mortality ‐ 'best‐worst case' scenario. | ||||
| 12 All‐cause mortality ‐ 'worst‐best case' scenario Show forest plot | 51 | 8240 | Risk Ratio (M‐H, Random, 95% CI) | 1.06 [0.95, 1.19] |
| Analysis 26.12  Comparison 26 Parenteral ‐ All cause mortality ‐ maximum follow‐up, Outcome 12 All‐cause mortality ‐ 'worst‐best case' scenario. | ||||
| 13 All‐cause mortality co‐interventions Show forest plot | 51 | 8121 | Risk Ratio (M‐H, Fixed, 95% CI) | 0.97 [0.87, 1.09] |
| Analysis 26.13  Comparison 26 Parenteral ‐ All cause mortality ‐ maximum follow‐up, Outcome 13 All‐cause mortality co‐interventions. | ||||
| 13.1 received nutrition support as co‐intervention | 5 | 5044 | Risk Ratio (M‐H, Fixed, 95% CI) | 0.97 [0.84, 1.13] |
| 13.2 did not receive nutrition support as co‐intervention | 45 | 2997 | Risk Ratio (M‐H, Fixed, 95% CI) | 0.96 [0.81, 1.14] |
| 13.3 delayed versus early nutrition support | 1 | 80 | Risk Ratio (M‐H, Fixed, 95% CI) | 1.2 [0.59, 2.45] |
| Outcome or subgroup title | No. of studies | No. of participants | Statistical method | Effect size |
| 1 Serious adverse events ‐ overall Show forest plot | 48 | 7519 | Risk Ratio (M‐H, Random, 95% CI) | 0.98 [0.85, 1.14] |
| Analysis 27.1  Comparison 27 Parenteral ‐ Serious adverse event end of intervention, Outcome 1 Serious adverse events ‐ overall. | ||||
| 2 Serious adverse events ‐ bias Show forest plot | 48 | 7519 | Risk Ratio (M‐H, Random, 95% CI) | 0.98 [0.85, 1.14] |
| Analysis 27.2 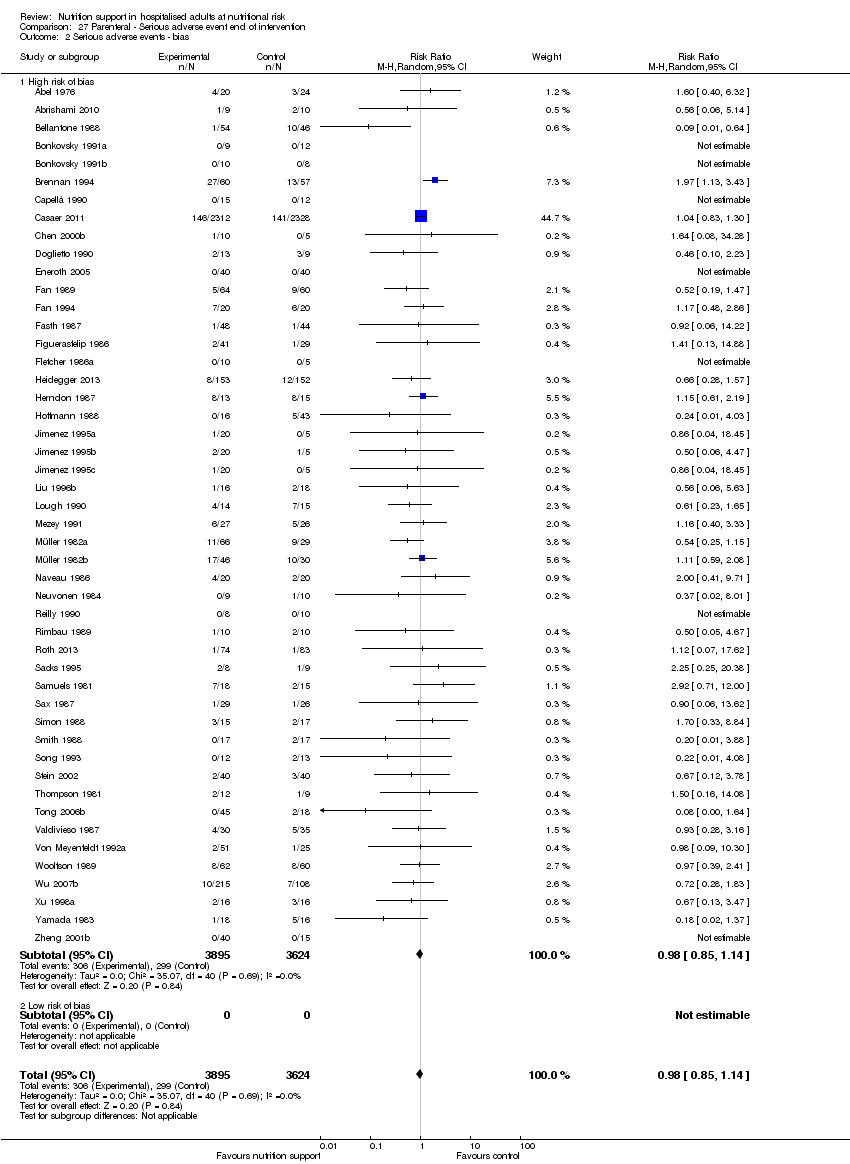 Comparison 27 Parenteral ‐ Serious adverse event end of intervention, Outcome 2 Serious adverse events ‐ bias. | ||||
| 2.1 High risk of bias | 48 | 7519 | Risk Ratio (M‐H, Random, 95% CI) | 0.98 [0.85, 1.14] |
| 2.2 Low risk of bias | 0 | 0 | Risk Ratio (M‐H, Random, 95% CI) | 0.0 [0.0, 0.0] |
| 3 Serious adverse events ‐ by medical specialty Show forest plot | 48 | 7519 | Risk Ratio (M‐H, Random, 95% CI) | 0.98 [0.85, 1.14] |
| Analysis 27.3 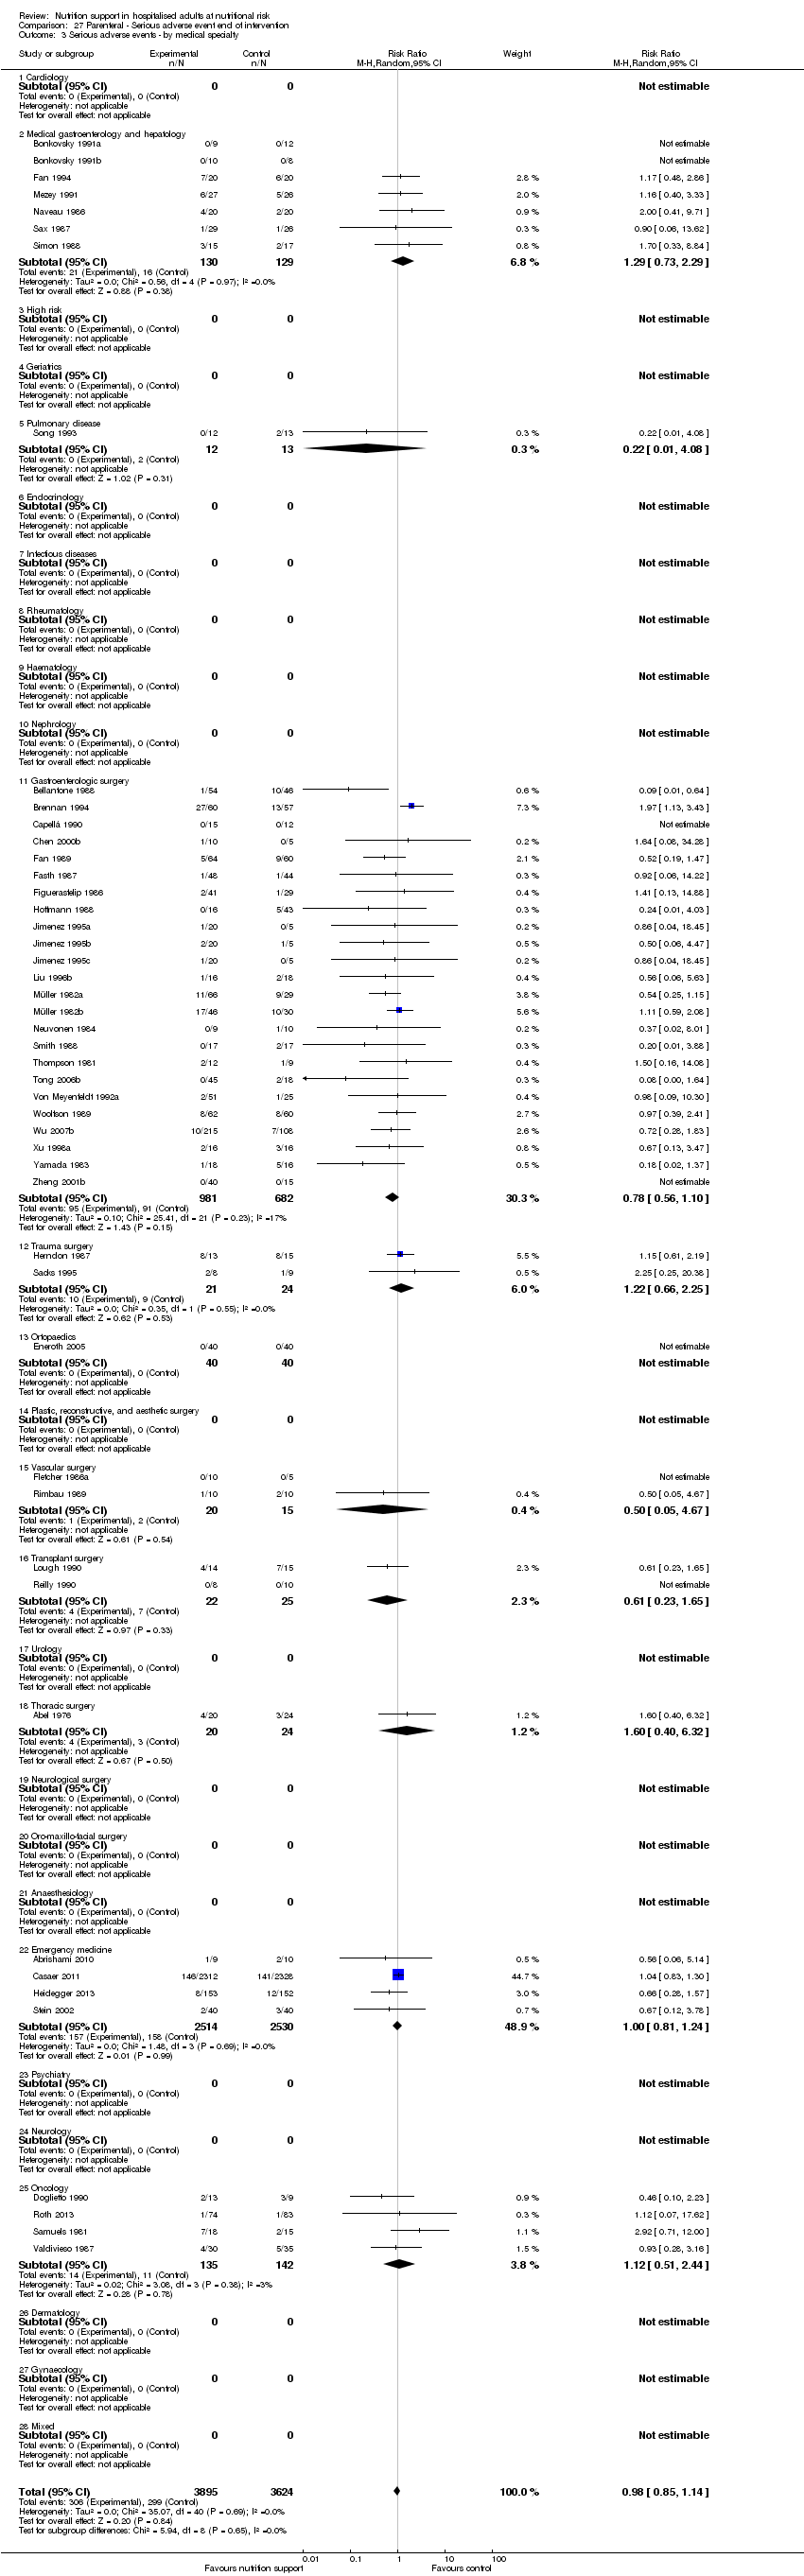 Comparison 27 Parenteral ‐ Serious adverse event end of intervention, Outcome 3 Serious adverse events ‐ by medical specialty. | ||||
| 3.1 Cardiology | 0 | 0 | Risk Ratio (M‐H, Random, 95% CI) | 0.0 [0.0, 0.0] |
| 3.2 Medical gastroenterology and hepatology | 7 | 259 | Risk Ratio (M‐H, Random, 95% CI) | 1.29 [0.73, 2.29] |
| 3.3 High risk | 0 | 0 | Risk Ratio (M‐H, Random, 95% CI) | 0.0 [0.0, 0.0] |
| 3.4 Geriatrics | 0 | 0 | Risk Ratio (M‐H, Random, 95% CI) | 0.0 [0.0, 0.0] |
| 3.5 Pulmonary disease | 1 | 25 | Risk Ratio (M‐H, Random, 95% CI) | 0.22 [0.01, 4.08] |
| 3.6 Endocrinology | 0 | 0 | Risk Ratio (M‐H, Random, 95% CI) | 0.0 [0.0, 0.0] |
| 3.7 Infectious diseases | 0 | 0 | Risk Ratio (M‐H, Random, 95% CI) | 0.0 [0.0, 0.0] |
| 3.8 Rheumatology | 0 | 0 | Risk Ratio (M‐H, Random, 95% CI) | 0.0 [0.0, 0.0] |
| 3.9 Haematology | 0 | 0 | Risk Ratio (M‐H, Random, 95% CI) | 0.0 [0.0, 0.0] |
| 3.10 Nephrology | 0 | 0 | Risk Ratio (M‐H, Random, 95% CI) | 0.0 [0.0, 0.0] |
| 3.11 Gastroenterologic surgery | 24 | 1663 | Risk Ratio (M‐H, Random, 95% CI) | 0.78 [0.56, 1.10] |
| 3.12 Trauma surgery | 2 | 45 | Risk Ratio (M‐H, Random, 95% CI) | 1.22 [0.66, 2.25] |
| 3.13 Ortopaedics | 1 | 80 | Risk Ratio (M‐H, Random, 95% CI) | 0.0 [0.0, 0.0] |
| 3.14 Plastic, reconstructive, and aesthetic surgery | 0 | 0 | Risk Ratio (M‐H, Random, 95% CI) | 0.0 [0.0, 0.0] |
| 3.15 Vascular surgery | 2 | 35 | Risk Ratio (M‐H, Random, 95% CI) | 0.5 [0.05, 4.67] |
| 3.16 Transplant surgery | 2 | 47 | Risk Ratio (M‐H, Random, 95% CI) | 0.61 [0.23, 1.65] |
| 3.17 Urology | 0 | 0 | Risk Ratio (M‐H, Random, 95% CI) | 0.0 [0.0, 0.0] |
| 3.18 Thoracic surgery | 1 | 44 | Risk Ratio (M‐H, Random, 95% CI) | 1.6 [0.40, 6.32] |
| 3.19 Neurological surgery | 0 | 0 | Risk Ratio (M‐H, Random, 95% CI) | 0.0 [0.0, 0.0] |
| 3.20 Oro‐maxillo‐facial surgery | 0 | 0 | Risk Ratio (M‐H, Random, 95% CI) | 0.0 [0.0, 0.0] |
| 3.21 Anaesthesiology | 0 | 0 | Risk Ratio (M‐H, Random, 95% CI) | 0.0 [0.0, 0.0] |
| 3.22 Emergency medicine | 4 | 5044 | Risk Ratio (M‐H, Random, 95% CI) | 1.00 [0.81, 1.24] |
| 3.23 Psychiatry | 0 | 0 | Risk Ratio (M‐H, Random, 95% CI) | 0.0 [0.0, 0.0] |
| 3.24 Neurology | 0 | 0 | Risk Ratio (M‐H, Random, 95% CI) | 0.0 [0.0, 0.0] |
| 3.25 Oncology | 4 | 277 | Risk Ratio (M‐H, Random, 95% CI) | 1.12 [0.51, 2.44] |
| 3.26 Dermatology | 0 | 0 | Risk Ratio (M‐H, Random, 95% CI) | 0.0 [0.0, 0.0] |
| 3.27 Gynaecology | 0 | 0 | Risk Ratio (M‐H, Random, 95% CI) | 0.0 [0.0, 0.0] |
| 3.28 Mixed | 0 | 0 | Risk Ratio (M‐H, Random, 95% CI) | 0.0 [0.0, 0.0] |
| 4 Serious adverse events ‐ based on adequacy of the amount of calories Show forest plot | 48 | 7519 | Risk Ratio (M‐H, Random, 95% CI) | 0.98 [0.85, 1.14] |
| Analysis 27.4  Comparison 27 Parenteral ‐ Serious adverse event end of intervention, Outcome 4 Serious adverse events ‐ based on adequacy of the amount of calories. | ||||
| 4.1 Clearly adequate in intervention and clearly inadequate in control | 9 | 5736 | Risk Ratio (M‐H, Random, 95% CI) | 0.98 [0.80, 1.19] |
| 4.2 Inadequate in the experimental or adequate in the control | 5 | 218 | Risk Ratio (M‐H, Random, 95% CI) | 1.20 [0.74, 1.95] |
| 4.3 Experimental group is overfed | 1 | 124 | Risk Ratio (M‐H, Random, 95% CI) | 0.52 [0.19, 1.47] |
| 4.4 Unclear intake in control or experimental | 33 | 1441 | Risk Ratio (M‐H, Random, 95% CI) | 0.89 [0.65, 1.23] |
| 5 Serious adverse events ‐ different screening tools Show forest plot | 48 | 7519 | Risk Ratio (M‐H, Random, 95% CI) | 0.98 [0.85, 1.14] |
| Analysis 27.5  Comparison 27 Parenteral ‐ Serious adverse event end of intervention, Outcome 5 Serious adverse events ‐ different screening tools. | ||||
| 5.1 NRS 2002 | 1 | 4640 | Risk Ratio (M‐H, Random, 95% CI) | 1.04 [0.83, 1.30] |
| 5.2 MUST | 0 | 0 | Risk Ratio (M‐H, Random, 95% CI) | 0.0 [0.0, 0.0] |
| 5.3 MNA | 0 | 0 | Risk Ratio (M‐H, Random, 95% CI) | 0.0 [0.0, 0.0] |
| 5.4 SGA | 1 | 323 | Risk Ratio (M‐H, Random, 95% CI) | 0.72 [0.28, 1.83] |
| 5.5 Other means | 46 | 2556 | Risk Ratio (M‐H, Random, 95% CI) | 0.95 [0.77, 1.17] |
| 6 Serious adverse events ‐ participants characterised as 'at nutritional risk' due to one of the following conditions Show forest plot | 48 | 7519 | Risk Ratio (M‐H, Random, 95% CI) | 0.98 [0.85, 1.14] |
| Analysis 27.6  Comparison 27 Parenteral ‐ Serious adverse event end of intervention, Outcome 6 Serious adverse events ‐ participants characterised as 'at nutritional risk' due to one of the following conditions. | ||||
| 6.1 Major surgery | 30 | 1952 | Risk Ratio (M‐H, Random, 95% CI) | 0.86 [0.66, 1.13] |
| 6.2 Stroke | 0 | 0 | Risk Ratio (M‐H, Random, 95% CI) | 0.0 [0.0, 0.0] |
| 6.3 ICU participants including trauma | 6 | 5089 | Risk Ratio (M‐H, Random, 95% CI) | 1.02 [0.84, 1.25] |
| 6.4 Frail elderly participants with less severe conditions known to increase protein requirements | 2 | 114 | Risk Ratio (M‐H, Random, 95% CI) | 0.56 [0.06, 5.63] |
| 6.5 Participants do not fall into one of the categories above | 10 | 364 | Risk Ratio (M‐H, Random, 95% CI) | 1.18 [0.69, 2.02] |
| 7 Serious adverse events ‐ participants characterised as 'at nutritional risk' due to one of the following criteria Show forest plot | 48 | 7519 | Risk Ratio (M‐H, Random, 95% CI) | 0.98 [0.85, 1.14] |
| Analysis 27.7  Comparison 27 Parenteral ‐ Serious adverse event end of intervention, Outcome 7 Serious adverse events ‐ participants characterised as 'at nutritional risk' due to one of the following criteria. | ||||
| 7.1 BMI less than 20.5 kg/m2 | 0 | 0 | Risk Ratio (M‐H, Random, 95% CI) | 0.0 [0.0, 0.0] |
| 7.2 Weight loss of at least 5% during the last three months | 0 | 0 | Risk Ratio (M‐H, Random, 95% CI) | 0.0 [0.0, 0.0] |
| 7.3 Weight loss of at least 10% during the last six months | 0 | 0 | Risk Ratio (M‐H, Random, 95% CI) | 0.0 [0.0, 0.0] |
| 7.4 Insufficient food intake during the last week (50% of requirements or less) | 0 | 0 | Risk Ratio (M‐H, Random, 95% CI) | 0.0 [0.0, 0.0] |
| 7.5 Participants characterised as 'at nutritional risk' by other means | 48 | 7519 | Risk Ratio (M‐H, Random, 95% CI) | 0.98 [0.85, 1.14] |
| 8 Serious adverse events ‐ participants characterised as 'at nutritional risk' due to biomarkers or anthropometrics Show forest plot | 48 | 7519 | Risk Ratio (M‐H, Random, 95% CI) | 0.98 [0.85, 1.14] |
| Analysis 27.8  Comparison 27 Parenteral ‐ Serious adverse event end of intervention, Outcome 8 Serious adverse events ‐ participants characterised as 'at nutritional risk' due to biomarkers or anthropometrics. | ||||
| 8.1 Biomarkers | 3 | 77 | Risk Ratio (M‐H, Random, 95% CI) | 0.39 [0.06, 2.39] |
| 8.2 Anthropometric measures | 3 | 137 | Risk Ratio (M‐H, Random, 95% CI) | 0.69 [0.16, 3.01] |
| 8.3 Mixed | 3 | 75 | Risk Ratio (M‐H, Random, 95% CI) | 0.66 [0.14, 3.07] |
| 8.4 Characterised by other means | 39 | 7230 | Risk Ratio (M‐H, Random, 95% CI) | 1.00 [0.86, 1.16] |
| 9 Serious adverse events ‐ randomisation year Show forest plot | 48 | 7519 | Risk Ratio (M‐H, Random, 95% CI) | 0.98 [0.85, 1.14] |
| Analysis 27.9 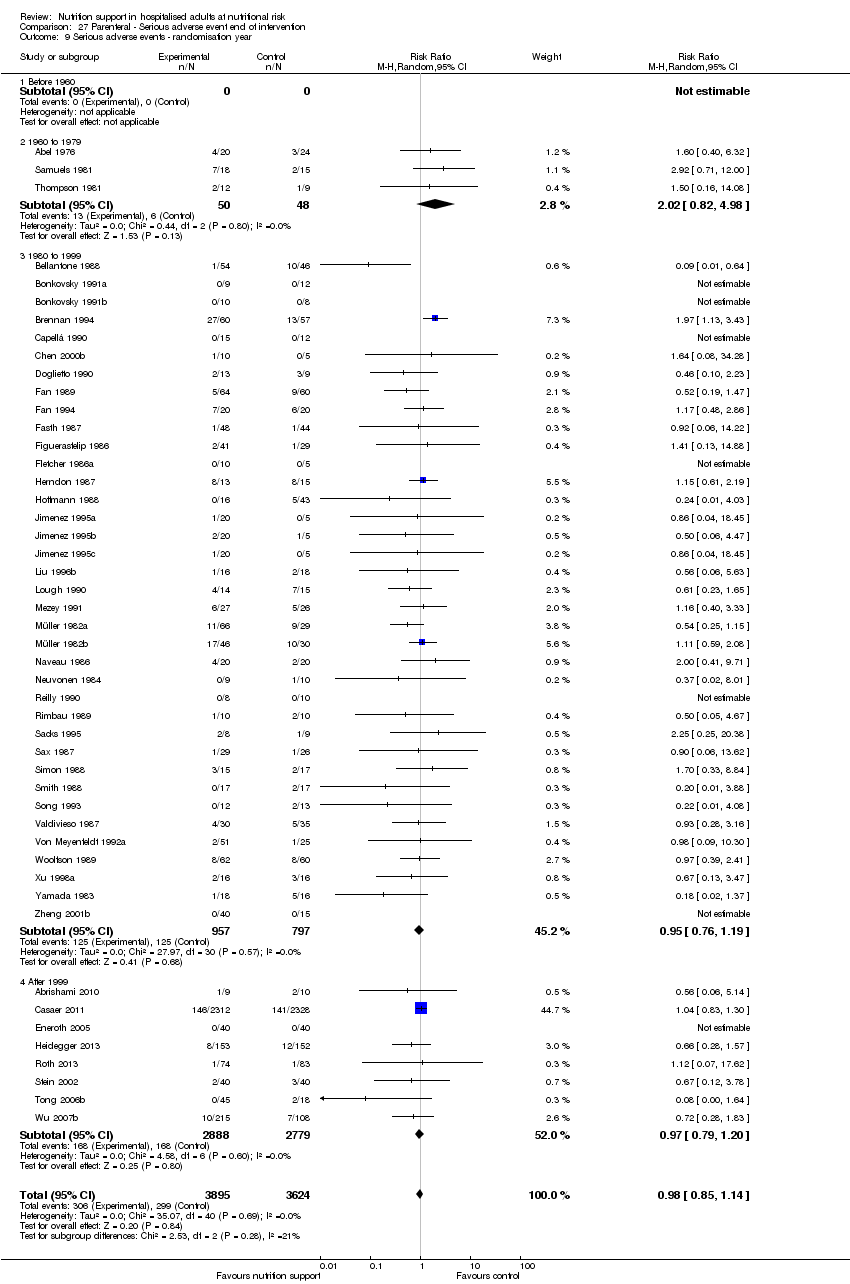 Comparison 27 Parenteral ‐ Serious adverse event end of intervention, Outcome 9 Serious adverse events ‐ randomisation year. | ||||
| 9.1 Before 1960 | 0 | 0 | Risk Ratio (M‐H, Random, 95% CI) | 0.0 [0.0, 0.0] |
| 9.2 1960 to 1979 | 3 | 98 | Risk Ratio (M‐H, Random, 95% CI) | 2.02 [0.82, 4.98] |
| 9.3 1980 to 1999 | 37 | 1754 | Risk Ratio (M‐H, Random, 95% CI) | 0.95 [0.76, 1.19] |
| 9.4 After 1999 | 8 | 5667 | Risk Ratio (M‐H, Random, 95% CI) | 0.97 [0.79, 1.20] |
| 10 Serious adverse events ‐ trials where the intervention lasts fewer than three days compared with trials where the intervention lasts three days or more Show forest plot | 48 | 7519 | Risk Ratio (M‐H, Random, 95% CI) | 0.98 [0.85, 1.14] |
| Analysis 27.10 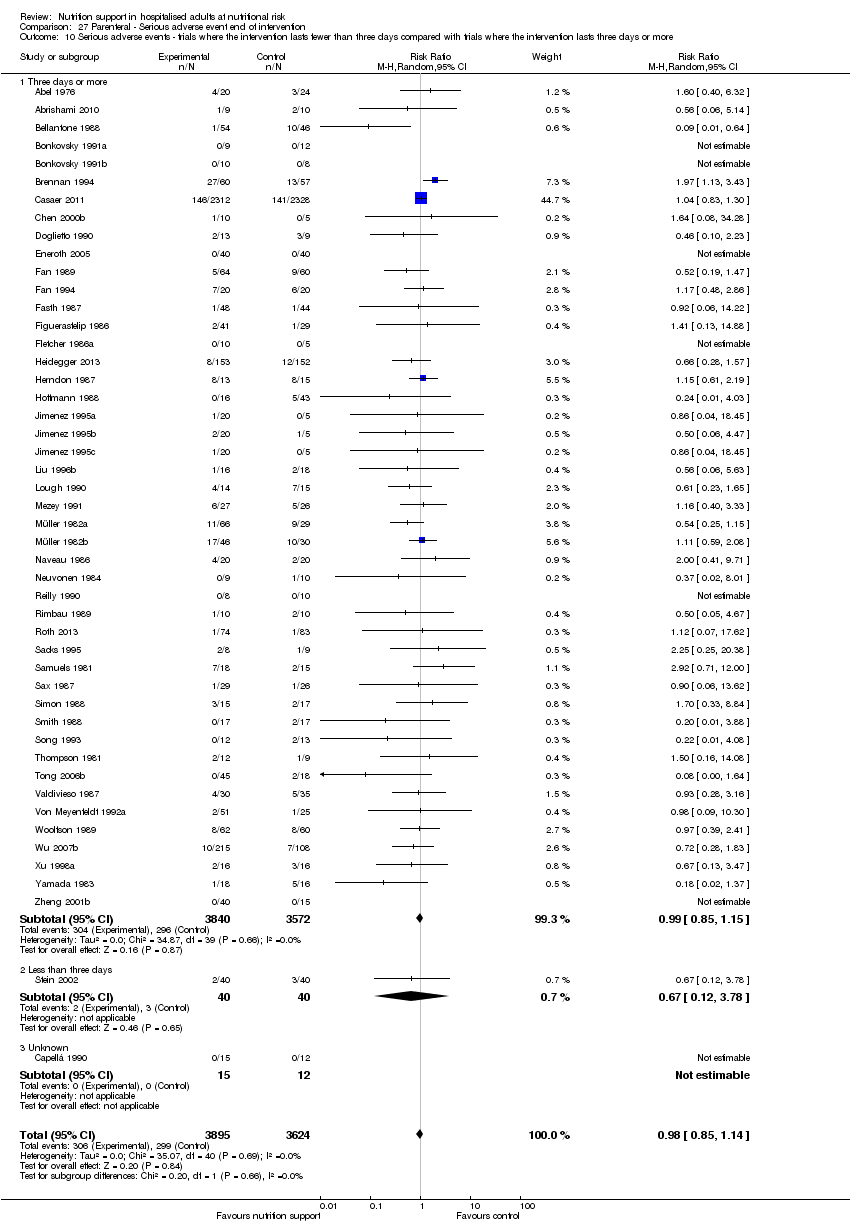 Comparison 27 Parenteral ‐ Serious adverse event end of intervention, Outcome 10 Serious adverse events ‐ trials where the intervention lasts fewer than three days compared with trials where the intervention lasts three days or more. | ||||
| 10.1 Three days or more | 46 | 7412 | Risk Ratio (M‐H, Random, 95% CI) | 0.99 [0.85, 1.15] |
| 10.2 Less than three days | 1 | 80 | Risk Ratio (M‐H, Random, 95% CI) | 0.67 [0.12, 3.78] |
| 10.3 Unknown | 1 | 27 | Risk Ratio (M‐H, Random, 95% CI) | 0.0 [0.0, 0.0] |
| 11 Serious adverse events ‐ 'best‐worst case' scenario Show forest plot | 48 | 8293 | Risk Ratio (M‐H, Random, 95% CI) | 0.78 [0.63, 0.98] |
| Analysis 27.11  Comparison 27 Parenteral ‐ Serious adverse event end of intervention, Outcome 11 Serious adverse events ‐ 'best‐worst case' scenario. | ||||
| 12 Serious adverse events ‐ 'worst‐best case' scenario Show forest plot | 48 | 8293 | Risk Ratio (M‐H, Random, 95% CI) | 1.16 [0.95, 1.42] |
| Analysis 27.12  Comparison 27 Parenteral ‐ Serious adverse event end of intervention, Outcome 12 Serious adverse events ‐ 'worst‐best case' scenario. | ||||
| 13 Serious adverse events co‐interventions Show forest plot | 48 | 7519 | Risk Ratio (M‐H, Fixed, 95% CI) | 0.94 [0.81, 1.09] |
| Analysis 27.13  Comparison 27 Parenteral ‐ Serious adverse event end of intervention, Outcome 13 Serious adverse events co‐interventions. | ||||
| 13.1 received nutrition support as co‐intervention | 5 | 5049 | Risk Ratio (M‐H, Fixed, 95% CI) | 1.02 [0.83, 1.26] |
| 13.2 did not receive nutrition support as co‐intervention | 42 | 2390 | Risk Ratio (M‐H, Fixed, 95% CI) | 0.87 [0.70, 1.07] |
| 13.3 delayed versus early nutrition support | 1 | 80 | Risk Ratio (M‐H, Fixed, 95% CI) | 0.67 [0.12, 3.78] |
| Outcome or subgroup title | No. of studies | No. of participants | Statistical method | Effect size |
| 1 Serious adverse events ‐ overall Show forest plot | 56 | 8263 | Risk Ratio (M‐H, Random, 95% CI) | 0.98 [0.90, 1.07] |
| Analysis 28.1 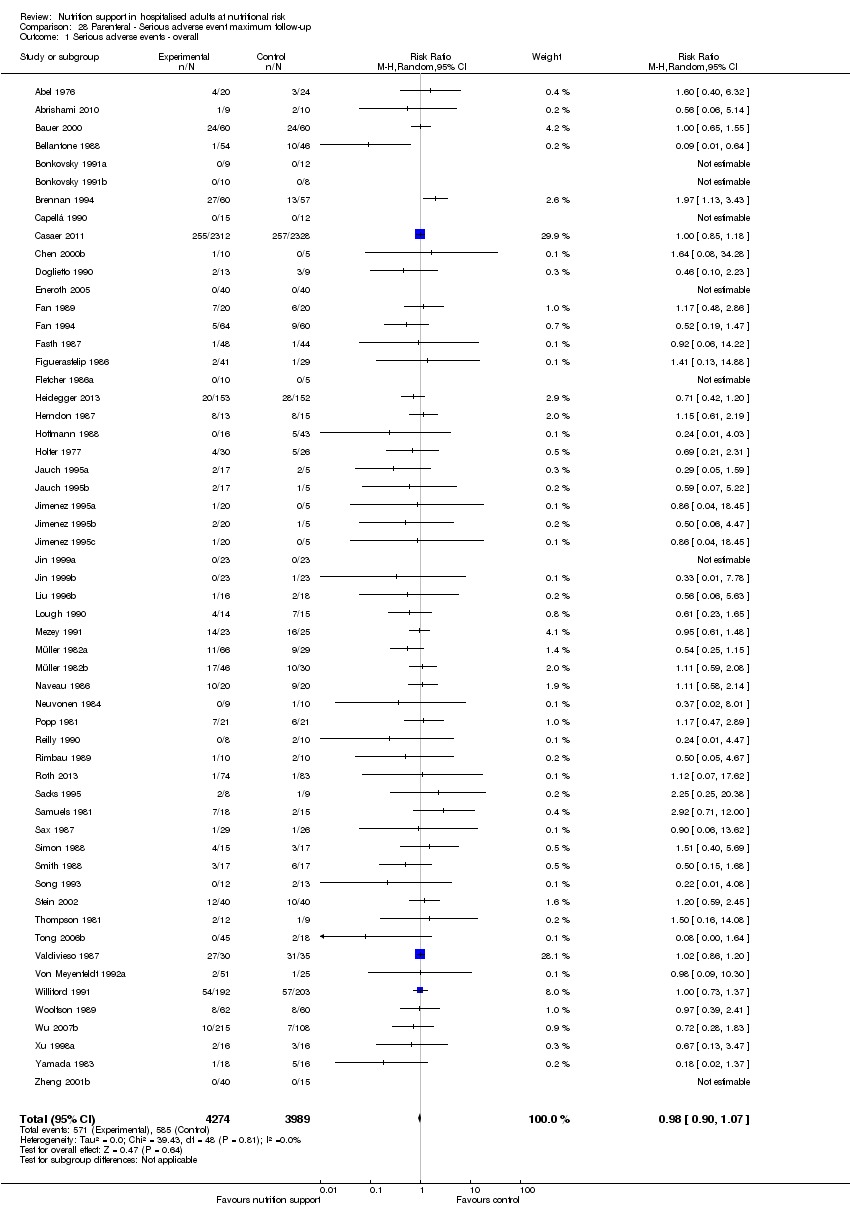 Comparison 28 Parenteral ‐ Serious adverse event maximum follow‐up, Outcome 1 Serious adverse events ‐ overall. | ||||
| 2 Serious adverse events ‐ bias Show forest plot | 56 | 8263 | Risk Ratio (M‐H, Random, 95% CI) | 0.98 [0.90, 1.07] |
| Analysis 28.2  Comparison 28 Parenteral ‐ Serious adverse event maximum follow‐up, Outcome 2 Serious adverse events ‐ bias. | ||||
| 2.1 High risk of bias | 56 | 8263 | Risk Ratio (M‐H, Random, 95% CI) | 0.98 [0.90, 1.07] |
| 2.2 Low risk of bias | 0 | 0 | Risk Ratio (M‐H, Random, 95% CI) | 0.0 [0.0, 0.0] |
| 3 Serious adverse events ‐ by medical speciality Show forest plot | 56 | 8263 | Risk Ratio (M‐H, Random, 95% CI) | 0.98 [0.90, 1.07] |
| Analysis 28.3  Comparison 28 Parenteral ‐ Serious adverse event maximum follow‐up, Outcome 3 Serious adverse events ‐ by medical speciality. | ||||
| 3.1 Cardiology | 0 | 0 | Risk Ratio (M‐H, Random, 95% CI) | 0.0 [0.0, 0.0] |
| 3.2 Medical gastroenterology and hepatology | 7 | 338 | Risk Ratio (M‐H, Random, 95% CI) | 0.96 [0.69, 1.33] |
| 3.3 Geriatrics | 0 | 0 | Risk Ratio (M‐H, Random, 95% CI) | 0.0 [0.0, 0.0] |
| 3.4 Pulmonary disease | 1 | 25 | Risk Ratio (M‐H, Random, 95% CI) | 0.22 [0.01, 4.08] |
| 3.5 Endocrinology | 0 | 0 | Risk Ratio (M‐H, Random, 95% CI) | 0.0 [0.0, 0.0] |
| 3.6 Infectious diseases | 0 | 0 | Risk Ratio (M‐H, Random, 95% CI) | 0.0 [0.0, 0.0] |
| 3.7 Rheumatology | 0 | 0 | Risk Ratio (M‐H, Random, 95% CI) | 0.0 [0.0, 0.0] |
| 3.8 Haematology | 0 | 0 | Risk Ratio (M‐H, Random, 95% CI) | 0.0 [0.0, 0.0] |
| 3.9 Nephrology | 0 | 0 | Risk Ratio (M‐H, Random, 95% CI) | 0.0 [0.0, 0.0] |
| 3.10 Gastroenterologic surgery | 27 | 2066 | Risk Ratio (M‐H, Random, 95% CI) | 0.91 [0.72, 1.16] |
| 3.11 Trauma surgery | 2 | 45 | Risk Ratio (M‐H, Random, 95% CI) | 1.22 [0.66, 2.25] |
| 3.12 Ortopaedics | 1 | 80 | Risk Ratio (M‐H, Random, 95% CI) | 0.0 [0.0, 0.0] |
| 3.13 Plastic, reconstructive, and aesthetic surgery | 0 | 0 | Risk Ratio (M‐H, Random, 95% CI) | 0.0 [0.0, 0.0] |
| 3.14 Vascular surgery | 2 | 35 | Risk Ratio (M‐H, Random, 95% CI) | 0.5 [0.05, 4.67] |
| 3.15 Transplant surgery | 2 | 47 | Risk Ratio (M‐H, Random, 95% CI) | 0.56 [0.22, 1.42] |
| 3.16 Urology | 0 | 0 | Risk Ratio (M‐H, Random, 95% CI) | 0.0 [0.0, 0.0] |
| 3.17 Thoracic surgery | 1 | 44 | Risk Ratio (M‐H, Random, 95% CI) | 1.6 [0.40, 6.32] |
| 3.18 Neurological surgery | 0 | 0 | Risk Ratio (M‐H, Random, 95% CI) | 0.0 [0.0, 0.0] |
| 3.19 Oro‐maxillo‐facial surgery | 0 | 0 | Risk Ratio (M‐H, Random, 95% CI) | 0.0 [0.0, 0.0] |
| 3.20 Anaesthesiology | 0 | 0 | Risk Ratio (M‐H, Random, 95% CI) | 0.0 [0.0, 0.0] |
| 3.21 Emergency medicine | 7 | 5208 | Risk Ratio (M‐H, Random, 95% CI) | 0.97 [0.84, 1.12] |
| 3.22 Psychiatry | 0 | 0 | Risk Ratio (M‐H, Random, 95% CI) | 0.0 [0.0, 0.0] |
| 3.23 Neurology | 0 | 0 | Risk Ratio (M‐H, Random, 95% CI) | 0.0 [0.0, 0.0] |
| 3.24 Oncology | 6 | 375 | Risk Ratio (M‐H, Random, 95% CI) | 1.02 [0.87, 1.20] |
| 3.25 Dermatology | 0 | 0 | Risk Ratio (M‐H, Random, 95% CI) | 0.0 [0.0, 0.0] |
| 3.26 Gynaecology | 0 | 0 | Risk Ratio (M‐H, Random, 95% CI) | 0.0 [0.0, 0.0] |
| 3.27 Mixed | 0 | 0 | Risk Ratio (M‐H, Random, 95% CI) | 0.0 [0.0, 0.0] |
| 4 Serious adverse events ‐ based on adequacy of the amount of calories Show forest plot | 56 | 8263 | Risk Ratio (M‐H, Random, 95% CI) | 0.98 [0.90, 1.07] |
| Analysis 28.4  Comparison 28 Parenteral ‐ Serious adverse event maximum follow‐up, Outcome 4 Serious adverse events ‐ based on adequacy of the amount of calories. | ||||
| 4.1 Clearly adequate in intervention and clearly inadequate in control | 9 | 5736 | Risk Ratio (M‐H, Random, 95% CI) | 0.98 [0.88, 1.10] |
| 4.2 Inadequate in the experimental or adequate in the control | 4 | 165 | Risk Ratio (M‐H, Random, 95% CI) | 1.17 [0.80, 1.72] |
| 4.3 Experimental group is overfed | 5 | 583 | Risk Ratio (M‐H, Random, 95% CI) | 0.99 [0.74, 1.32] |
| 4.4 Unclear intake in control or experimental | 38 | 1779 | Risk Ratio (M‐H, Random, 95% CI) | 0.90 [0.73, 1.11] |
| 5 Serious adverse events ‐ different screening tools Show forest plot | 56 | 8263 | Risk Ratio (M‐H, Random, 95% CI) | 0.98 [0.90, 1.07] |
| Analysis 28.5  Comparison 28 Parenteral ‐ Serious adverse event maximum follow‐up, Outcome 5 Serious adverse events ‐ different screening tools. | ||||
| 5.1 NRS 2002 | 1 | 4640 | Risk Ratio (M‐H, Random, 95% CI) | 1.00 [0.85, 1.18] |
| 5.2 MUST | 0 | 0 | Risk Ratio (M‐H, Random, 95% CI) | 0.0 [0.0, 0.0] |
| 5.3 MNA | 0 | 0 | Risk Ratio (M‐H, Random, 95% CI) | 0.0 [0.0, 0.0] |
| 5.4 SGA | 1 | 323 | Risk Ratio (M‐H, Random, 95% CI) | 0.72 [0.28, 1.83] |
| 5.5 Other means | 54 | 3300 | Risk Ratio (M‐H, Random, 95% CI) | 0.97 [0.88, 1.08] |
| 6 Serious adverse events ‐ participants characterised as 'at nutritional risk' due to one of the following conditions Show forest plot | 56 | 8263 | Risk Ratio (M‐H, Random, 95% CI) | 0.98 [0.90, 1.07] |
| Analysis 28.6  Comparison 28 Parenteral ‐ Serious adverse event maximum follow‐up, Outcome 6 Serious adverse events ‐ participants characterised as 'at nutritional risk' due to one of the following conditions. | ||||
| 6.1 Major surgery | 34 | 2447 | Risk Ratio (M‐H, Random, 95% CI) | 0.90 [0.75, 1.09] |
| 6.2 Stroke | 0 | 0 | Risk Ratio (M‐H, Random, 95% CI) | 0.0 [0.0, 0.0] |
| 6.3 ICU participants including trauma | 7 | 5209 | Risk Ratio (M‐H, Random, 95% CI) | 0.99 [0.86, 1.14] |
| 6.4 Frail elderly participants with less severe conditions known to increase protein requirements | 2 | 114 | Risk Ratio (M‐H, Random, 95% CI) | 0.56 [0.06, 5.63] |
| 6.5 Participants do not fall into one of the categories above | 13 | 493 | Risk Ratio (M‐H, Random, 95% CI) | 1.02 [0.88, 1.18] |
| 7 Serious adverse events ‐ participants characterised as 'at nutritional risk' due to one of the following criteria Show forest plot | 56 | 8263 | Risk Ratio (M‐H, Random, 95% CI) | 0.98 [0.90, 1.07] |
| Analysis 28.7  Comparison 28 Parenteral ‐ Serious adverse event maximum follow‐up, Outcome 7 Serious adverse events ‐ participants characterised as 'at nutritional risk' due to one of the following criteria. | ||||
| 7.1 BMI less than 20.5 kg/m2 | 0 | 0 | Risk Ratio (M‐H, Random, 95% CI) | 0.0 [0.0, 0.0] |
| 7.2 Weight loss of at least 5% during the last three months | 0 | 0 | Risk Ratio (M‐H, Random, 95% CI) | 0.0 [0.0, 0.0] |
| 7.3 Weight loss of at least 10% during the last six months | 2 | 92 | Risk Ratio (M‐H, Random, 95% CI) | 0.33 [0.01, 7.78] |
| 7.4 Insufficient food intake during the last week (50% of requirements or less) | 0 | 0 | Risk Ratio (M‐H, Random, 95% CI) | 0.0 [0.0, 0.0] |
| 7.5 Participants characterised as 'at nutritional risk' by other means | 54 | 8171 | Risk Ratio (M‐H, Random, 95% CI) | 0.98 [0.90, 1.07] |
| 8 Serious adverse events ‐ participants characterised as 'at nutritional risk' due to biomarkers or anthropometrics Show forest plot | 56 | 8263 | Risk Ratio (M‐H, Random, 95% CI) | 0.98 [0.90, 1.07] |
| Analysis 28.8  Comparison 28 Parenteral ‐ Serious adverse event maximum follow‐up, Outcome 8 Serious adverse events ‐ participants characterised as 'at nutritional risk' due to biomarkers or anthropometrics. | ||||
| 8.1 Biomarkers | 6 | 184 | Risk Ratio (M‐H, Random, 95% CI) | 0.45 [0.13, 1.57] |
| 8.2 Anthropometric measures | 3 | 137 | Risk Ratio (M‐H, Random, 95% CI) | 0.74 [0.29, 1.89] |
| 8.3 Both | 3 | 75 | Risk Ratio (M‐H, Random, 95% CI) | 0.66 [0.14, 3.07] |
| 8.4 Characterised by other means | 44 | 7867 | Risk Ratio (M‐H, Random, 95% CI) | 0.99 [0.90, 1.08] |
| 9 Serious adverse events ‐ randomisation year Show forest plot | 56 | 8263 | Risk Ratio (M‐H, Random, 95% CI) | 0.98 [0.90, 1.07] |
| Analysis 28.9  Comparison 28 Parenteral ‐ Serious adverse event maximum follow‐up, Outcome 9 Serious adverse events ‐ randomisation year. | ||||
| 9.1 Before 1960 | 0 | 0 | Risk Ratio (M‐H, Random, 95% CI) | 0.0 [0.0, 0.0] |
| 9.2 1960 to 1979 | 4 | 154 | Risk Ratio (M‐H, Random, 95% CI) | 1.38 [0.67, 2.83] |
| 9.3 1980 to 1999 | 44 | 2442 | Risk Ratio (M‐H, Random, 95% CI) | 0.98 [0.88, 1.10] |
| 9.4 After 1999 | 8 | 5667 | Risk Ratio (M‐H, Random, 95% CI) | 0.96 [0.83, 1.12] |
| 10 Serious adverse events ‐ trials where the intervention lasts fewer than three days compared with trials where the intervention lasts three days or more Show forest plot | 56 | 8263 | Risk Ratio (M‐H, Random, 95% CI) | 0.98 [0.90, 1.07] |
| Analysis 28.10  Comparison 28 Parenteral ‐ Serious adverse event maximum follow‐up, Outcome 10 Serious adverse events ‐ trials where the intervention lasts fewer than three days compared with trials where the intervention lasts three days or more. | ||||
| 10.1 Three days or more | 54 | 8156 | Risk Ratio (M‐H, Random, 95% CI) | 0.98 [0.89, 1.07] |
| 10.2 Less than three days | 1 | 80 | Risk Ratio (M‐H, Random, 95% CI) | 1.2 [0.59, 2.45] |
| 10.3 Unknown | 1 | 27 | Risk Ratio (M‐H, Random, 95% CI) | 0.0 [0.0, 0.0] |
| 11 Serious adverse events ‐ 'best‐worst case' scenario Show forest plot | 56 | 8452 | Risk Ratio (M‐H, Random, 95% CI) | 0.80 [0.68, 0.94] |
| Analysis 28.11 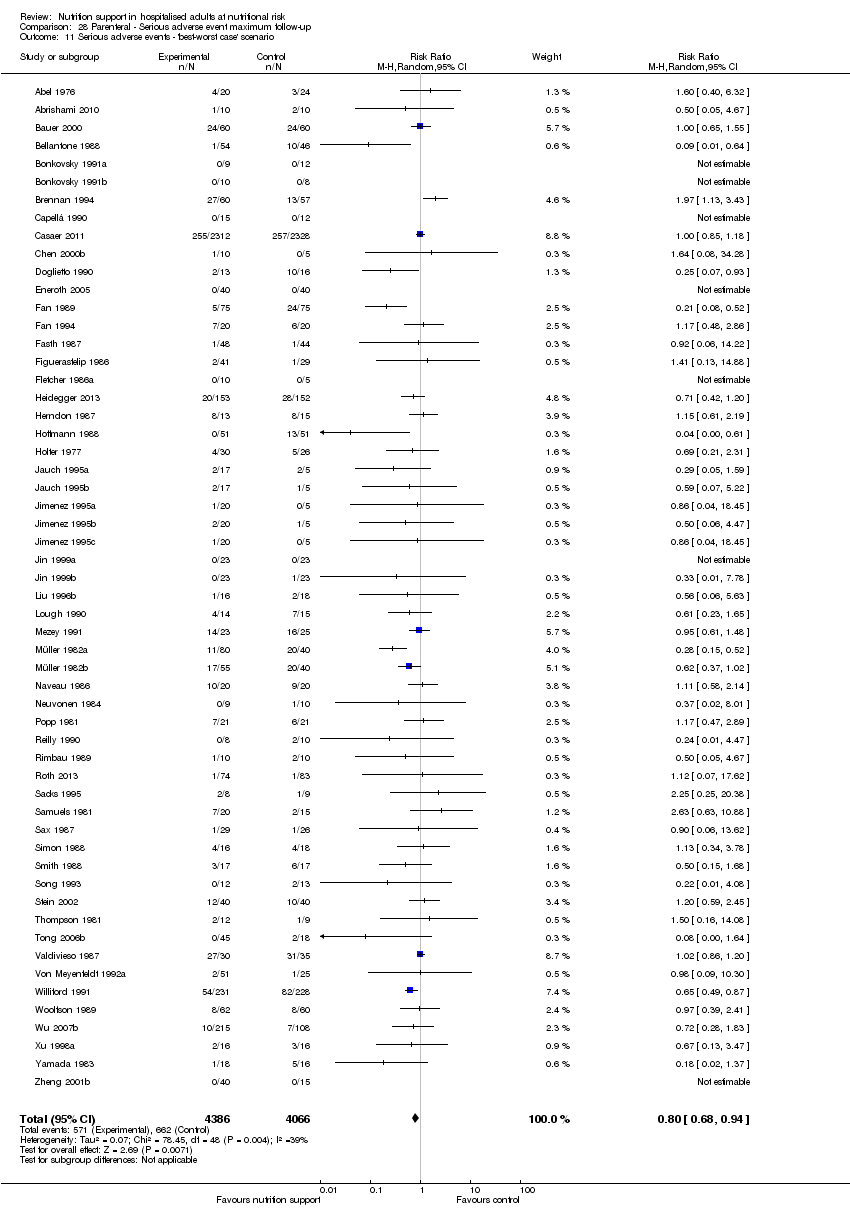 Comparison 28 Parenteral ‐ Serious adverse event maximum follow‐up, Outcome 11 Serious adverse events ‐ 'best‐worst case' scenario. | ||||
| 12 Serious adverse events ‐ 'worst‐best case' scenario Show forest plot | 56 | 8452 | Risk Ratio (M‐H, Random, 95% CI) | 1.12 [0.96, 1.30] |
| Analysis 28.12  Comparison 28 Parenteral ‐ Serious adverse event maximum follow‐up, Outcome 12 Serious adverse events ‐ 'worst‐best case' scenario. | ||||
| 13 Serious adverse events co‐interventions Show forest plot | 56 | 8263 | Risk Ratio (M‐H, Fixed, 95% CI) | 0.94 [0.85, 1.04] |
| Analysis 28.13  Comparison 28 Parenteral ‐ Serious adverse event maximum follow‐up, Outcome 13 Serious adverse events co‐interventions. | ||||
| 13.1 Received nutrition support as co‐intervention | 6 | 5164 | Risk Ratio (M‐H, Fixed, 95% CI) | 0.97 [0.85, 1.12] |
| 13.2 did not receive nutrition support as co‐intervention | 49 | 3019 | Risk Ratio (M‐H, Fixed, 95% CI) | 0.90 [0.77, 1.04] |
| 13.3 delayed versus early nutrition support | 1 | 80 | Risk Ratio (M‐H, Fixed, 95% CI) | 1.2 [0.59, 2.45] |
| Outcome or subgroup title | No. of studies | No. of participants | Statistical method | Effect size |
| 1 Morbidity ‐ overall Show forest plot | 1 | 124 | Risk Ratio (M‐H, Random, 95% CI) | 0.63 [0.42, 0.94] |
| Analysis 29.1 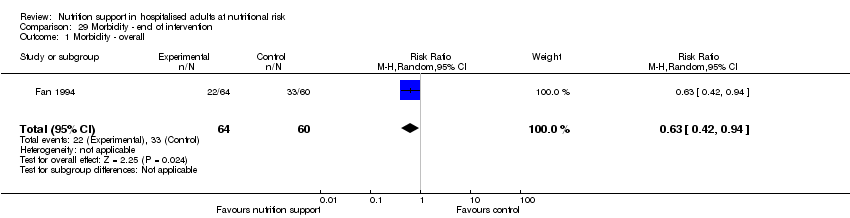 Comparison 29 Morbidity ‐ end of intervention, Outcome 1 Morbidity ‐ overall. | ||||
| Outcome or subgroup title | No. of studies | No. of participants | Statistical method | Effect size |
| 1 Morbidity ‐ overall Show forest plot | 2 | 245 | Risk Ratio (M‐H, Random, 95% CI) | 0.71 [0.53, 0.95] |
| Analysis 30.1  Comparison 30 Morbidity ‐ maximum follow‐up, Outcome 1 Morbidity ‐ overall. | ||||
| Outcome or subgroup title | No. of studies | No. of participants | Statistical method | Effect size |
| 1 BMI ‐ overall Show forest plot | 15 | 1008 | Mean Difference (IV, Random, 95% CI) | 0.57 [0.38, 0.77] |
| Analysis 31.1  Comparison 31 BMI ‐ end of intervention, Outcome 1 BMI ‐ overall. | ||||
| 2 BMI ‐ bias Show forest plot | 15 | 1008 | Mean Difference (IV, Random, 95% CI) | 0.57 [0.38, 0.77] |
| Analysis 31.2  Comparison 31 BMI ‐ end of intervention, Outcome 2 BMI ‐ bias. | ||||
| 2.1 High risk of bias | 15 | 1008 | Mean Difference (IV, Random, 95% CI) | 0.57 [0.38, 0.77] |
| 2.2 Low risk of bias | 0 | 0 | Mean Difference (IV, Random, 95% CI) | 0.0 [0.0, 0.0] |
| 3 BMI ‐ mode of administration Show forest plot | 15 | 1008 | Mean Difference (IV, Random, 95% CI) | 0.57 [0.38, 0.77] |
| Analysis 31.3  Comparison 31 BMI ‐ end of intervention, Outcome 3 BMI ‐ mode of administration. | ||||
| 3.1 General nutrition support | 1 | 132 | Mean Difference (IV, Random, 95% CI) | 1.0 [‐0.67, 2.67] |
| 3.2 Fortified nutrition | 1 | 146 | Mean Difference (IV, Random, 95% CI) | 1.10 [‐0.24, 2.44] |
| 3.3 Oral nutrition support | 7 | 363 | Mean Difference (IV, Random, 95% CI) | 0.63 [‐0.09, 1.35] |
| 3.4 Enteral nutrition | 5 | 288 | Mean Difference (IV, Random, 95% CI) | 0.53 [0.32, 0.75] |
| 3.5 Parenteral nutrition | 0 | 0 | Mean Difference (IV, Random, 95% CI) | 0.0 [0.0, 0.0] |
| 3.6 Mixed nutrition support | 1 | 79 | Mean Difference (IV, Random, 95% CI) | 1.12 [‐0.15, 2.39] |
| 4 BMI ‐ by medical delivery Show forest plot | 15 | 1008 | Mean Difference (IV, Random, 95% CI) | 0.57 [0.38, 0.77] |
| Analysis 31.4  Comparison 31 BMI ‐ end of intervention, Outcome 4 BMI ‐ by medical delivery. | ||||
| 4.1 Cardiology | 0 | 0 | Mean Difference (IV, Random, 95% CI) | 0.0 [0.0, 0.0] |
| 4.2 Medical gastroenterology and hepatology | 2 | 101 | Mean Difference (IV, Random, 95% CI) | 1.77 [‐0.19, 3.72] |
| 4.3 Geriatrics | 3 | 227 | Mean Difference (IV, Random, 95% CI) | 0.86 [‐0.10, 1.82] |
| 4.4 Pulmonary disease | 0 | 0 | Mean Difference (IV, Random, 95% CI) | 0.0 [0.0, 0.0] |
| 4.5 Endocrinology | 0 | 0 | Mean Difference (IV, Random, 95% CI) | 0.0 [0.0, 0.0] |
| 4.6 Infectious diseases | 0 | 0 | Mean Difference (IV, Random, 95% CI) | 0.0 [0.0, 0.0] |
| 4.7 Rheumatology | 0 | 0 | Mean Difference (IV, Random, 95% CI) | 0.0 [0.0, 0.0] |
| 4.8 Haematology | 0 | 0 | Mean Difference (IV, Random, 95% CI) | 0.0 [0.0, 0.0] |
| 4.9 Nephrology | 0 | 0 | Mean Difference (IV, Random, 95% CI) | 0.0 [0.0, 0.0] |
| 4.10 Gastroenterologic surgery | 5 | 279 | Mean Difference (IV, Random, 95% CI) | 0.48 [0.25, 0.70] |
| 4.11 Trauma surgery | 2 | 184 | Mean Difference (IV, Random, 95% CI) | 0.64 [0.10, 1.18] |
| 4.12 Ortopaedics | 0 | 0 | Mean Difference (IV, Random, 95% CI) | 0.0 [0.0, 0.0] |
| 4.13 Plastic, reconstructive, and aesthetic surgery | 1 | 37 | Mean Difference (IV, Random, 95% CI) | 1.30 [0.04, 2.56] |
| 4.14 Vascular surgery | 0 | 0 | Mean Difference (IV, Random, 95% CI) | 0.0 [0.0, 0.0] |
| 4.15 Transplant surgery | 0 | 0 | Mean Difference (IV, Random, 95% CI) | 0.0 [0.0, 0.0] |
| 4.16 Urology | 0 | 0 | Mean Difference (IV, Random, 95% CI) | 0.0 [0.0, 0.0] |
| 4.17 Thoracic surgery | 0 | 0 | Mean Difference (IV, Random, 95% CI) | 0.0 [0.0, 0.0] |
| 4.18 Neurological surgery | 0 | 0 | Mean Difference (IV, Random, 95% CI) | 0.0 [0.0, 0.0] |
| 4.19 Oro‐maxillo‐facial surgery | 0 | 0 | Mean Difference (IV, Random, 95% CI) | 0.0 [0.0, 0.0] |
| 4.20 Anaesthesiology | 0 | 0 | Mean Difference (IV, Random, 95% CI) | 0.0 [0.0, 0.0] |
| 4.21 Emergency medicine | 0 | 0 | Mean Difference (IV, Random, 95% CI) | 0.0 [0.0, 0.0] |
| 4.22 Psychiatry | 0 | 0 | Mean Difference (IV, Random, 95% CI) | 0.0 [0.0, 0.0] |
| 4.23 Neurology | 1 | 48 | Mean Difference (IV, Random, 95% CI) | 1.0 [‐1.11, 3.11] |
| 4.24 Oncology | 0 | 0 | Mean Difference (IV, Random, 95% CI) | 0.0 [0.0, 0.0] |
| 4.25 Dermatology | 0 | 0 | Mean Difference (IV, Random, 95% CI) | 0.0 [0.0, 0.0] |
| 4.26 Gynaecology | 0 | 0 | Mean Difference (IV, Random, 95% CI) | 0.0 [0.0, 0.0] |
| 4.27 Mixed | 1 | 132 | Mean Difference (IV, Random, 95% CI) | 1.0 [‐0.67, 2.67] |
| 5 BMI ‐ based on adequacy of the amount of calories Show forest plot | 15 | 1008 | Mean Difference (IV, Random, 95% CI) | 0.57 [0.38, 0.77] |
| Analysis 31.5  Comparison 31 BMI ‐ end of intervention, Outcome 5 BMI ‐ based on adequacy of the amount of calories. | ||||
| 5.1 Clearly adequate in intervention and clearly inadequate in control | 7 | 544 | Mean Difference (IV, Random, 95% CI) | 0.90 [0.23, 1.58] |
| 5.2 Inadequate in the experimental or adequate in the control | 1 | 37 | Mean Difference (IV, Random, 95% CI) | 1.30 [0.04, 2.56] |
| 5.3 Experimental group is overfed | 1 | 46 | Mean Difference (IV, Random, 95% CI) | 0.0 [0.0, 0.0] |
| 5.4 Unclear intake in control or experimental | 6 | 381 | Mean Difference (IV, Random, 95% CI) | 0.52 [0.31, 0.73] |
| 6 BMI ‐ different screening tools Show forest plot | 15 | 1008 | Mean Difference (IV, Random, 95% CI) | 0.57 [0.38, 0.77] |
| Analysis 31.6  Comparison 31 BMI ‐ end of intervention, Outcome 6 BMI ‐ different screening tools. | ||||
| 6.1 NRS 2002 | 2 | 211 | Mean Difference (IV, Random, 95% CI) | 1.08 [0.06, 2.09] |
| 6.2 MUST | 0 | 0 | Mean Difference (IV, Random, 95% CI) | 0.0 [0.0, 0.0] |
| 6.3 MNA | 1 | 35 | Mean Difference (IV, Random, 95% CI) | 0.60 [‐0.78, 1.98] |
| 6.4 SGA | 0 | 0 | Mean Difference (IV, Random, 95% CI) | 0.0 [0.0, 0.0] |
| 6.5 Other means | 12 | 762 | Mean Difference (IV, Random, 95% CI) | 0.55 [0.35, 0.76] |
| 7 BMI ‐ participants characterised as 'at nutritional risk' due to one of the following conditions Show forest plot | 15 | 1008 | Mean Difference (IV, Random, 95% CI) | 0.57 [0.38, 0.77] |
| Analysis 31.7  Comparison 31 BMI ‐ end of intervention, Outcome 7 BMI ‐ participants characterised as 'at nutritional risk' due to one of the following conditions. | ||||
| 7.1 Major surgery | 6 | 316 | Mean Difference (IV, Random, 95% CI) | 0.50 [0.28, 0.73] |
| 7.2 Stroke | 1 | 48 | Mean Difference (IV, Random, 95% CI) | 1.0 [‐1.11, 3.11] |
| 7.3 ICU participants including trauma | 1 | 64 | Mean Difference (IV, Random, 95% CI) | 0.40 [‐1.22, 2.02] |
| 7.4 Frail elderly participants with less severe conditions known to increase protein requirements | 2 | 199 | Mean Difference (IV, Random, 95% CI) | 0.75 [0.22, 1.27] |
| 7.5 Participants do not fall into one of the categories above | 5 | 381 | Mean Difference (IV, Random, 95% CI) | 1.06 [0.26, 1.87] |
| 8 BMI ‐ participants characterised as 'at nutritional risk' due to one of the following criteria Show forest plot | 15 | 1008 | Mean Difference (IV, Random, 95% CI) | 0.57 [0.38, 0.77] |
| Analysis 31.8  Comparison 31 BMI ‐ end of intervention, Outcome 8 BMI ‐ participants characterised as 'at nutritional risk' due to one of the following criteria. | ||||
| 8.1 BMI less than 20.5 kg/m2 | 3 | 229 | Mean Difference (IV, Random, 95% CI) | 1.21 [0.29, 2.12] |
| 8.2 Weight loss of at least 5% during the last three months | 0 | 0 | Mean Difference (IV, Random, 95% CI) | 0.0 [0.0, 0.0] |
| 8.3 Weight loss of at least 10% during the last six months | 0 | 0 | Mean Difference (IV, Random, 95% CI) | 0.0 [0.0, 0.0] |
| 8.4 Insufficient food intake during the last week (50% of requirements or less) | 0 | 0 | Mean Difference (IV, Random, 95% CI) | 0.0 [0.0, 0.0] |
| 8.5 Participants characterised as 'at nutritional risk' by other means | 12 | 779 | Mean Difference (IV, Random, 95% CI) | 0.54 [0.34, 0.75] |
| 9 BMI ‐ participants characterised as 'at nutritional risk' due to biomarkers of anthropometrics Show forest plot | 15 | 1008 | Mean Difference (IV, Random, 95% CI) | 0.57 [0.38, 0.77] |
| Analysis 31.9 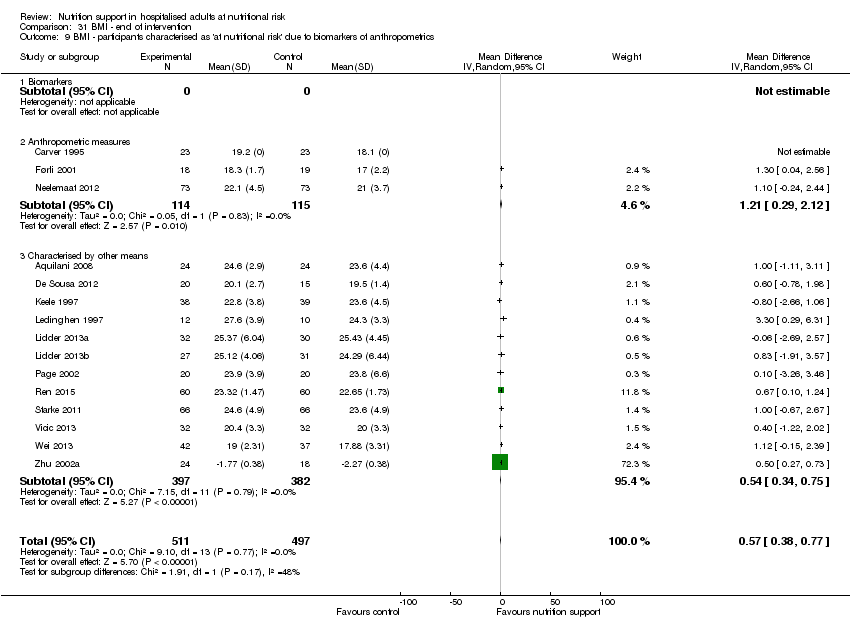 Comparison 31 BMI ‐ end of intervention, Outcome 9 BMI ‐ participants characterised as 'at nutritional risk' due to biomarkers of anthropometrics. | ||||
| 9.1 Biomarkers | 0 | 0 | Mean Difference (IV, Random, 95% CI) | 0.0 [0.0, 0.0] |
| 9.2 Anthropometric measures | 3 | 229 | Mean Difference (IV, Random, 95% CI) | 1.21 [0.29, 2.12] |
| 9.3 Characterised by other means | 12 | 779 | Mean Difference (IV, Random, 95% CI) | 0.54 [0.34, 0.75] |
| 10 BMI ‐ randomisation year Show forest plot | 15 | 1008 | Mean Difference (IV, Random, 95% CI) | 0.57 [0.38, 0.77] |
| Analysis 31.10  Comparison 31 BMI ‐ end of intervention, Outcome 10 BMI ‐ randomisation year. | ||||
| 10.1 Before 1960 | 0 | 0 | Mean Difference (IV, Random, 95% CI) | 0.0 [0.0, 0.0] |
| 10.2 1960 to 1979 | 0 | 0 | Mean Difference (IV, Random, 95% CI) | 0.0 [0.0, 0.0] |
| 10.3 1980 to 1999 | 4 | 182 | Mean Difference (IV, Random, 95% CI) | 1.03 [‐0.91, 2.97] |
| 10.4 After 1999 | 11 | 826 | Mean Difference (IV, Random, 95% CI) | 0.56 [0.36, 0.76] |
| 11 BMI ‐ trials where the intervention lasts fewer than three days compared with trials where the intervention lasts three days or more Show forest plot | 15 | 1008 | Mean Difference (IV, Random, 95% CI) | 0.57 [0.38, 0.77] |
| Analysis 31.11 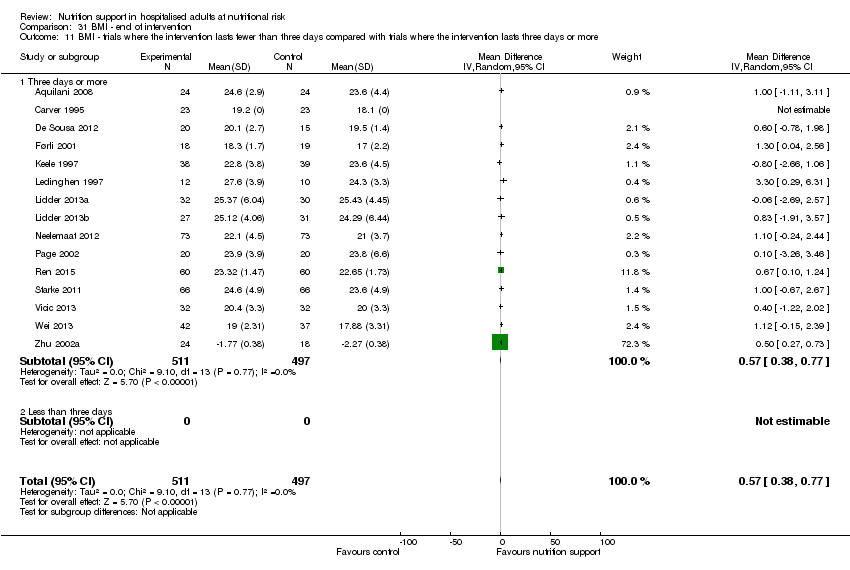 Comparison 31 BMI ‐ end of intervention, Outcome 11 BMI ‐ trials where the intervention lasts fewer than three days compared with trials where the intervention lasts three days or more. | ||||
| 11.1 Three days or more | 15 | 1008 | Mean Difference (IV, Random, 95% CI) | 0.57 [0.38, 0.77] |
| 11.2 Less than three days | 0 | 0 | Mean Difference (IV, Random, 95% CI) | 0.0 [0.0, 0.0] |
| Outcome or subgroup title | No. of studies | No. of participants | Statistical method | Effect size |
| 1 BMI ‐ overall Show forest plot | 20 | 1528 | Mean Difference (IV, Random, 95% CI) | 0.40 [‐0.02, 0.83] |
| Analysis 32.1  Comparison 32 BMI ‐ maximum follow‐up, Outcome 1 BMI ‐ overall. | ||||
| 2 BMI ‐ bias Show forest plot | 20 | 1528 | Mean Difference (IV, Random, 95% CI) | 0.44 [0.02, 0.87] |
| Analysis 32.2  Comparison 32 BMI ‐ maximum follow‐up, Outcome 2 BMI ‐ bias. | ||||
| 2.1 High risk of bias | 20 | 1528 | Mean Difference (IV, Random, 95% CI) | 0.44 [0.02, 0.87] |
| 2.2 Low risk of bias | 0 | 0 | Mean Difference (IV, Random, 95% CI) | 0.0 [0.0, 0.0] |
| 3 BMI ‐ mode of delivery Show forest plot | 20 | 1528 | Mean Difference (IV, Random, 95% CI) | 0.44 [0.02, 0.87] |
| Analysis 32.3  Comparison 32 BMI ‐ maximum follow‐up, Outcome 3 BMI ‐ mode of delivery. | ||||
| 3.1 General nutrition support | 2 | 196 | Mean Difference (IV, Random, 95% CI) | 0.92 [0.26, 1.57] |
| 3.2 Fortified nutrition | 1 | 146 | Mean Difference (IV, Random, 95% CI) | 1.10 [‐0.24, 2.44] |
| 3.3 Oral nutrition support | 8 | 588 | Mean Difference (IV, Random, 95% CI) | 0.43 [‐0.16, 1.02] |
| 3.4 Enteral nutrition | 8 | 519 | Mean Difference (IV, Random, 95% CI) | 0.17 [‐0.60, 0.93] |
| 3.5 Parenteral nutrition | 0 | 0 | Mean Difference (IV, Random, 95% CI) | 0.0 [0.0, 0.0] |
| 3.6 Mixed nutrition support | 1 | 79 | Mean Difference (IV, Random, 95% CI) | 1.12 [‐0.15, 2.39] |
| 4 BMI ‐ by medical speciality Show forest plot | 20 | 1528 | Mean Difference (IV, Random, 95% CI) | 0.44 [0.02, 0.87] |
| Analysis 32.4 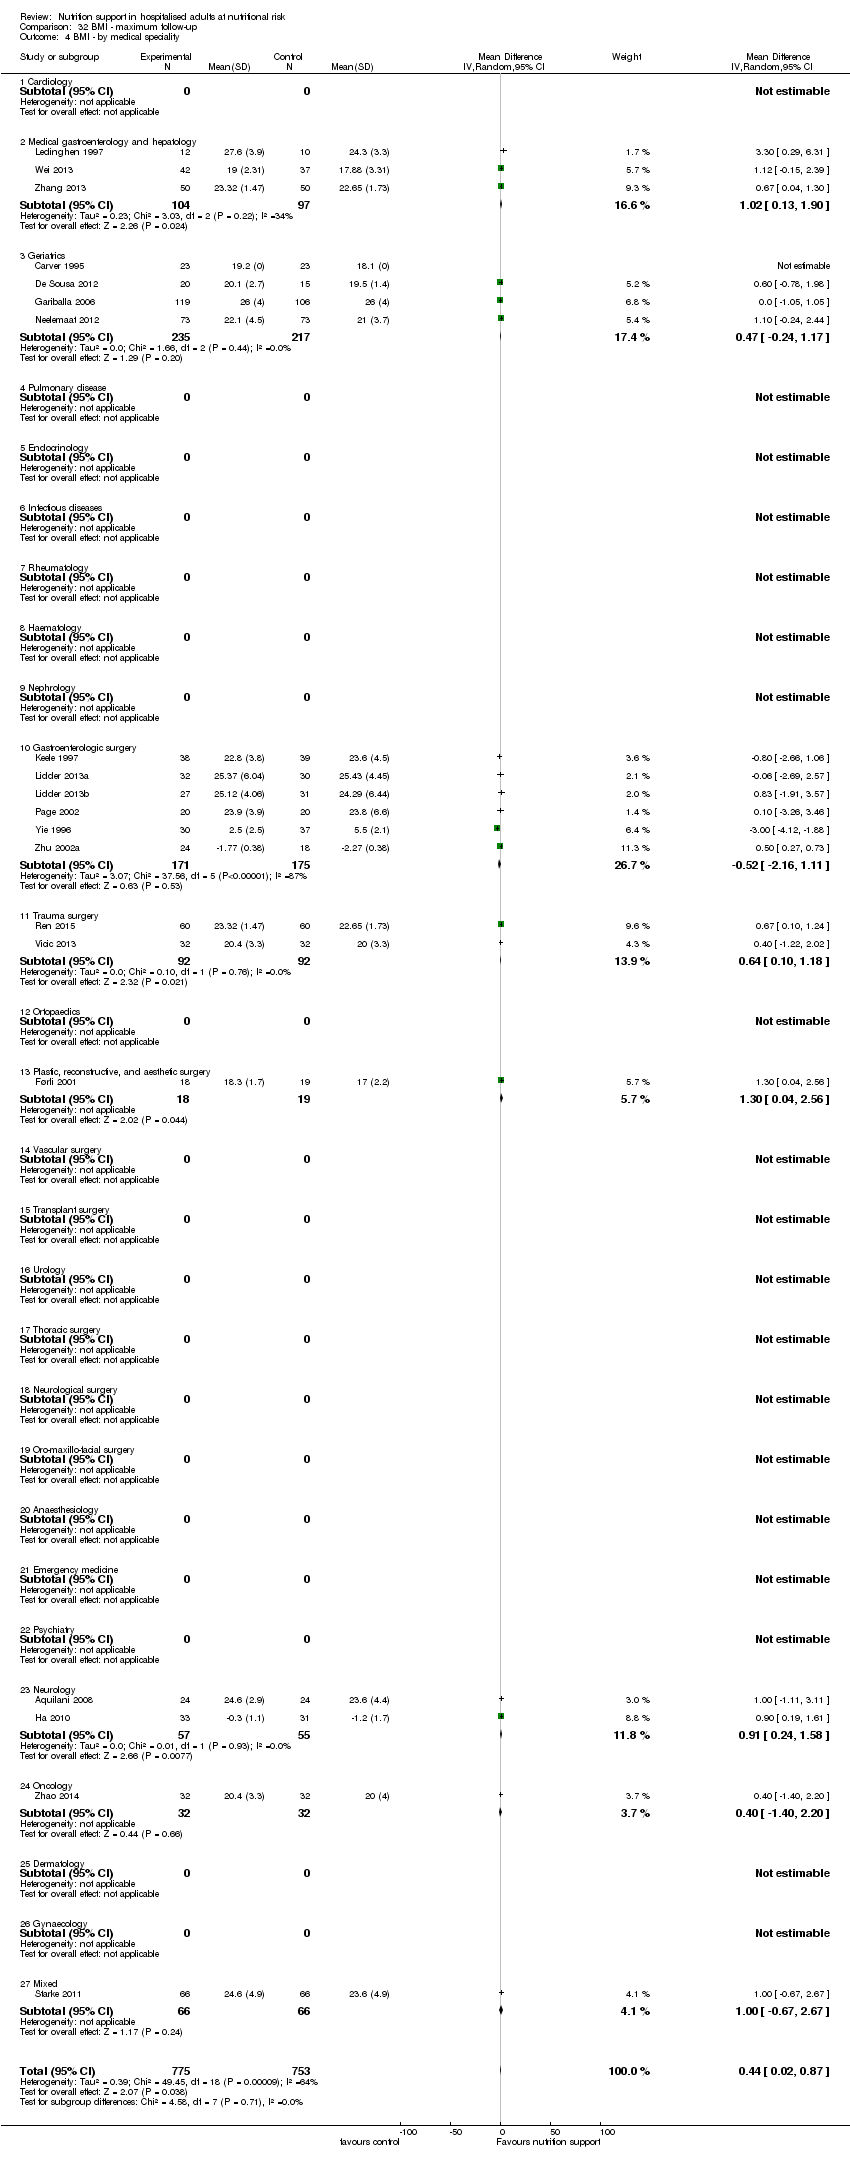 Comparison 32 BMI ‐ maximum follow‐up, Outcome 4 BMI ‐ by medical speciality. | ||||
| 4.1 Cardiology | 0 | 0 | Mean Difference (IV, Random, 95% CI) | 0.0 [0.0, 0.0] |
| 4.2 Medical gastroenterology and hepatology | 3 | 201 | Mean Difference (IV, Random, 95% CI) | 1.02 [0.13, 1.90] |
| 4.3 Geriatrics | 4 | 452 | Mean Difference (IV, Random, 95% CI) | 0.47 [‐0.24, 1.17] |
| 4.4 Pulmonary disease | 0 | 0 | Mean Difference (IV, Random, 95% CI) | 0.0 [0.0, 0.0] |
| 4.5 Endocrinology | 0 | 0 | Mean Difference (IV, Random, 95% CI) | 0.0 [0.0, 0.0] |
| 4.6 Infectious diseases | 0 | 0 | Mean Difference (IV, Random, 95% CI) | 0.0 [0.0, 0.0] |
| 4.7 Rheumatology | 0 | 0 | Mean Difference (IV, Random, 95% CI) | 0.0 [0.0, 0.0] |
| 4.8 Haematology | 0 | 0 | Mean Difference (IV, Random, 95% CI) | 0.0 [0.0, 0.0] |
| 4.9 Nephrology | 0 | 0 | Mean Difference (IV, Random, 95% CI) | 0.0 [0.0, 0.0] |
| 4.10 Gastroenterologic surgery | 6 | 346 | Mean Difference (IV, Random, 95% CI) | ‐0.52 [‐2.16, 1.11] |
| 4.11 Trauma surgery | 2 | 184 | Mean Difference (IV, Random, 95% CI) | 0.64 [0.10, 1.18] |
| 4.12 Ortopaedics | 0 | 0 | Mean Difference (IV, Random, 95% CI) | 0.0 [0.0, 0.0] |
| 4.13 Plastic, reconstructive, and aesthetic surgery | 1 | 37 | Mean Difference (IV, Random, 95% CI) | 1.30 [0.04, 2.56] |
| 4.14 Vascular surgery | 0 | 0 | Mean Difference (IV, Random, 95% CI) | 0.0 [0.0, 0.0] |
| 4.15 Transplant surgery | 0 | 0 | Mean Difference (IV, Random, 95% CI) | 0.0 [0.0, 0.0] |
| 4.16 Urology | 0 | 0 | Mean Difference (IV, Random, 95% CI) | 0.0 [0.0, 0.0] |
| 4.17 Thoracic surgery | 0 | 0 | Mean Difference (IV, Random, 95% CI) | 0.0 [0.0, 0.0] |
| 4.18 Neurological surgery | 0 | 0 | Mean Difference (IV, Random, 95% CI) | 0.0 [0.0, 0.0] |
| 4.19 Oro‐maxillo‐facial surgery | 0 | 0 | Mean Difference (IV, Random, 95% CI) | 0.0 [0.0, 0.0] |
| 4.20 Anaesthesiology | 0 | 0 | Mean Difference (IV, Random, 95% CI) | 0.0 [0.0, 0.0] |
| 4.21 Emergency medicine | 0 | 0 | Mean Difference (IV, Random, 95% CI) | 0.0 [0.0, 0.0] |
| 4.22 Psychiatry | 0 | 0 | Mean Difference (IV, Random, 95% CI) | 0.0 [0.0, 0.0] |
| 4.23 Neurology | 2 | 112 | Mean Difference (IV, Random, 95% CI) | 0.91 [0.24, 1.58] |
| 4.24 Oncology | 1 | 64 | Mean Difference (IV, Random, 95% CI) | 0.40 [‐1.40, 2.20] |
| 4.25 Dermatology | 0 | 0 | Mean Difference (IV, Random, 95% CI) | 0.0 [0.0, 0.0] |
| 4.26 Gynaecology | 0 | 0 | Mean Difference (IV, Random, 95% CI) | 0.0 [0.0, 0.0] |
| 4.27 Mixed | 1 | 132 | Mean Difference (IV, Random, 95% CI) | 1.0 [‐0.67, 2.67] |
| 5 BMI ‐ based on adequacy of the amount of calories Show forest plot | 20 | 1528 | Mean Difference (IV, Random, 95% CI) | 0.40 [‐0.02, 0.83] |
| Analysis 32.5 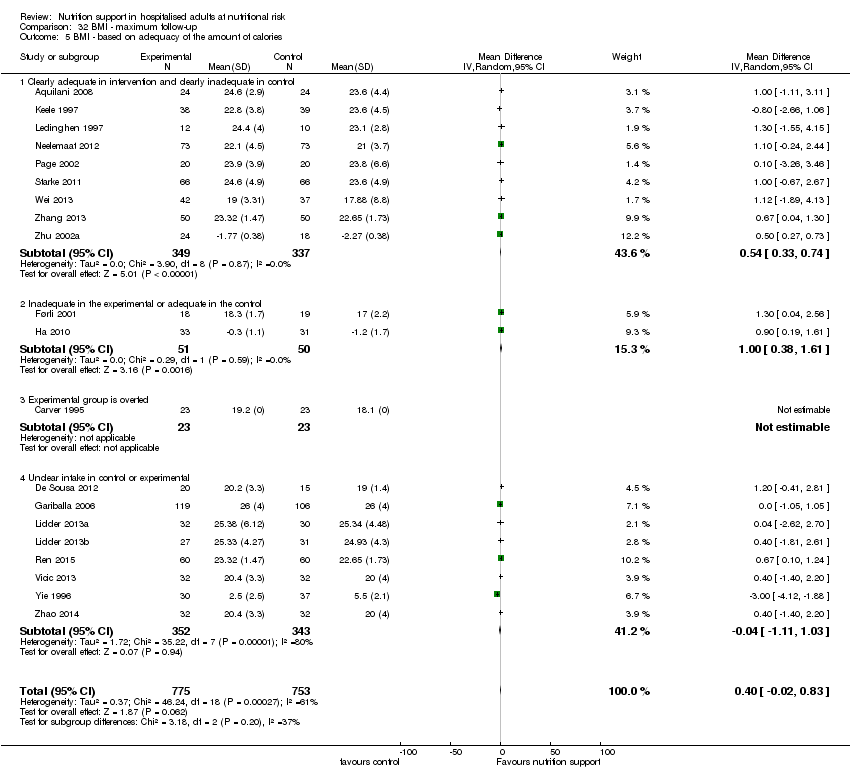 Comparison 32 BMI ‐ maximum follow‐up, Outcome 5 BMI ‐ based on adequacy of the amount of calories. | ||||
| 5.1 Clearly adequate in intervention and clearly inadequate in control | 9 | 686 | Mean Difference (IV, Random, 95% CI) | 0.54 [0.33, 0.74] |
| 5.2 Inadequate in the experimental or adequate in the control | 2 | 101 | Mean Difference (IV, Random, 95% CI) | 1.00 [0.38, 1.61] |
| 5.3 Experimental group is overfed | 1 | 46 | Mean Difference (IV, Random, 95% CI) | 0.0 [0.0, 0.0] |
| 5.4 Unclear intake in control or experimental | 8 | 695 | Mean Difference (IV, Random, 95% CI) | ‐0.04 [‐1.11, 1.03] |
| 6 BMI ‐ different screening tools Show forest plot | 20 | 1528 | Mean Difference (IV, Random, 95% CI) | 0.44 [0.02, 0.87] |
| Analysis 32.6  Comparison 32 BMI ‐ maximum follow‐up, Outcome 6 BMI ‐ different screening tools. | ||||
| 6.1 NRS 2002 | 2 | 211 | Mean Difference (IV, Random, 95% CI) | 1.08 [0.06, 2.09] |
| 6.2 MUST | 1 | 64 | Mean Difference (IV, Random, 95% CI) | 0.90 [0.19, 1.61] |
| 6.3 MNA | 1 | 35 | Mean Difference (IV, Random, 95% CI) | 0.60 [‐0.78, 1.98] |
| 6.4 SGA | 0 | 0 | Mean Difference (IV, Random, 95% CI) | 0.0 [0.0, 0.0] |
| 6.5 Other means | 16 | 1218 | Mean Difference (IV, Random, 95% CI) | 0.30 [‐0.22, 0.83] |
| 7 BMI ‐ participants characterised as 'at nutritional risk' due to one of the following conditions Show forest plot | 20 | 1528 | Mean Difference (IV, Random, 95% CI) | 0.44 [0.02, 0.87] |
| Analysis 32.7  Comparison 32 BMI ‐ maximum follow‐up, Outcome 7 BMI ‐ participants characterised as 'at nutritional risk' due to one of the following conditions. | ||||
| 7.1 Major surgery | 7 | 383 | Mean Difference (IV, Random, 95% CI) | ‐0.23 [‐1.55, 1.09] |
| 7.2 Stroke | 2 | 112 | Mean Difference (IV, Random, 95% CI) | 0.91 [0.24, 1.58] |
| 7.3 ICU participants including trauma | 1 | 64 | Mean Difference (IV, Random, 95% CI) | 0.40 [‐1.22, 2.02] |
| 7.4 Frail elderly participants with less severe conditions known to increase protein requirements | 2 | 199 | Mean Difference (IV, Random, 95% CI) | 0.75 [0.22, 1.27] |
| 7.5 Participants do not fall into one of the categories above | 8 | 770 | Mean Difference (IV, Random, 95% CI) | 0.65 [0.22, 1.09] |
| 8 BMI ‐ participants characterised as 'at nutritional risk' due to one of the following criteria Show forest plot | 20 | 1528 | Mean Difference (IV, Random, 95% CI) | 0.44 [0.02, 0.87] |
| Analysis 32.8 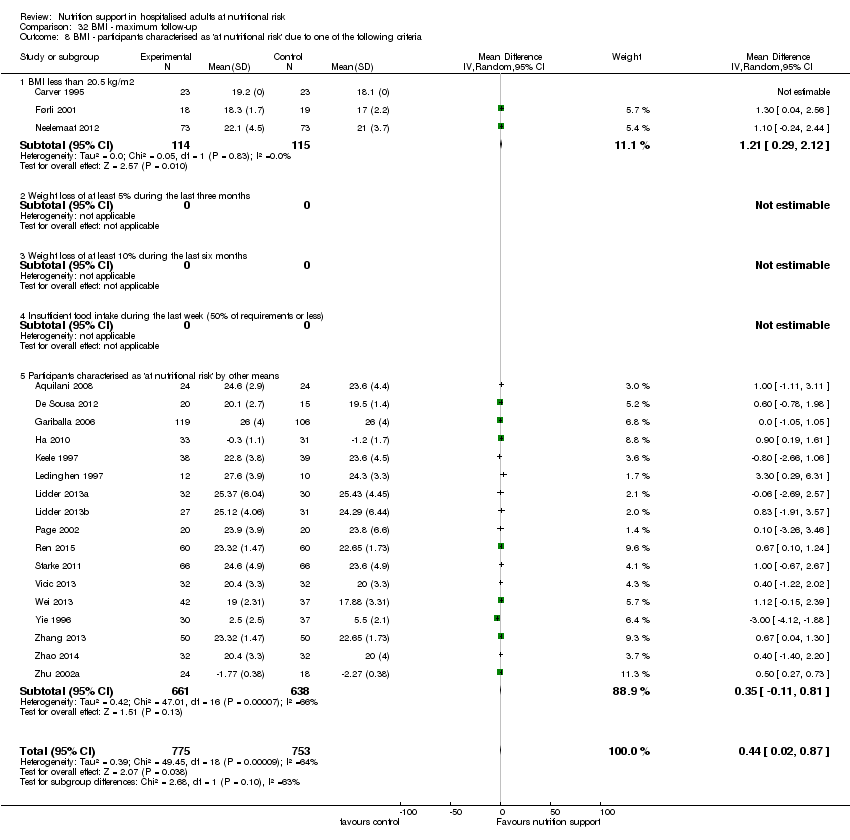 Comparison 32 BMI ‐ maximum follow‐up, Outcome 8 BMI ‐ participants characterised as 'at nutritional risk' due to one of the following criteria. | ||||
| 8.1 BMI less than 20.5 kg/m2 | 3 | 229 | Mean Difference (IV, Random, 95% CI) | 1.21 [0.29, 2.12] |
| 8.2 Weight loss of at least 5% during the last three months | 0 | 0 | Mean Difference (IV, Random, 95% CI) | 0.0 [0.0, 0.0] |
| 8.3 Weight loss of at least 10% during the last six months | 0 | 0 | Mean Difference (IV, Random, 95% CI) | 0.0 [0.0, 0.0] |
| 8.4 Insufficient food intake during the last week (50% of requirements or less) | 0 | 0 | Mean Difference (IV, Random, 95% CI) | 0.0 [0.0, 0.0] |
| 8.5 Participants characterised as 'at nutritional risk' by other means | 17 | 1299 | Mean Difference (IV, Random, 95% CI) | 0.35 [‐0.11, 0.81] |
| 9 BMI ‐ participants characterised as 'at nutritional risk' due to biomarkers or anthropometrics Show forest plot | 20 | 1528 | Mean Difference (IV, Random, 95% CI) | 0.44 [0.02, 0.87] |
| Analysis 32.9  Comparison 32 BMI ‐ maximum follow‐up, Outcome 9 BMI ‐ participants characterised as 'at nutritional risk' due to biomarkers or anthropometrics. | ||||
| 9.1 Biomarkers | 0 | 0 | Mean Difference (IV, Random, 95% CI) | 0.0 [0.0, 0.0] |
| 9.2 Anthropometric measures | 3 | 229 | Mean Difference (IV, Random, 95% CI) | 1.21 [0.29, 2.12] |
| 9.3 Characterised by other means | 17 | 1299 | Mean Difference (IV, Random, 95% CI) | 0.35 [‐0.11, 0.81] |
| 10 BMI ‐ randomisation year Show forest plot | 20 | 1528 | Mean Difference (IV, Random, 95% CI) | 0.44 [0.02, 0.87] |
| Analysis 32.10  Comparison 32 BMI ‐ maximum follow‐up, Outcome 10 BMI ‐ randomisation year. | ||||
| 10.1 Before 1960 | 0 | 0 | Mean Difference (IV, Random, 95% CI) | 0.0 [0.0, 0.0] |
| 10.2 1960 to 1979 | 0 | 0 | Mean Difference (IV, Random, 95% CI) | 0.0 [0.0, 0.0] |
| 10.3 1980 to 1999 | 5 | 249 | Mean Difference (IV, Random, 95% CI) | 0.02 [‐2.62, 2.67] |
| 10.4 After 1999 | 15 | 1279 | Mean Difference (IV, Random, 95% CI) | 0.57 [0.39, 0.75] |
| 11 BMI ‐ trials where the intervention lasts fewer than three days compared with trials where the intervention lasts three days or more Show forest plot | 20 | 1528 | Mean Difference (IV, Random, 95% CI) | 0.44 [0.02, 0.87] |
| Analysis 32.11  Comparison 32 BMI ‐ maximum follow‐up, Outcome 11 BMI ‐ trials where the intervention lasts fewer than three days compared with trials where the intervention lasts three days or more. | ||||
| 11.1 Three days or more | 20 | 1528 | Mean Difference (IV, Random, 95% CI) | 0.44 [0.02, 0.87] |
| 11.2 Less than three days | 0 | 0 | Mean Difference (IV, Random, 95% CI) | 0.0 [0.0, 0.0] |
| Outcome or subgroup title | No. of studies | No. of participants | Statistical method | Effect size |
| 1 Weight ‐ overall Show forest plot | 81 | 5445 | Mean Difference (IV, Random, 95% CI) | 1.32 [0.65, 2.00] |
| Analysis 33.1 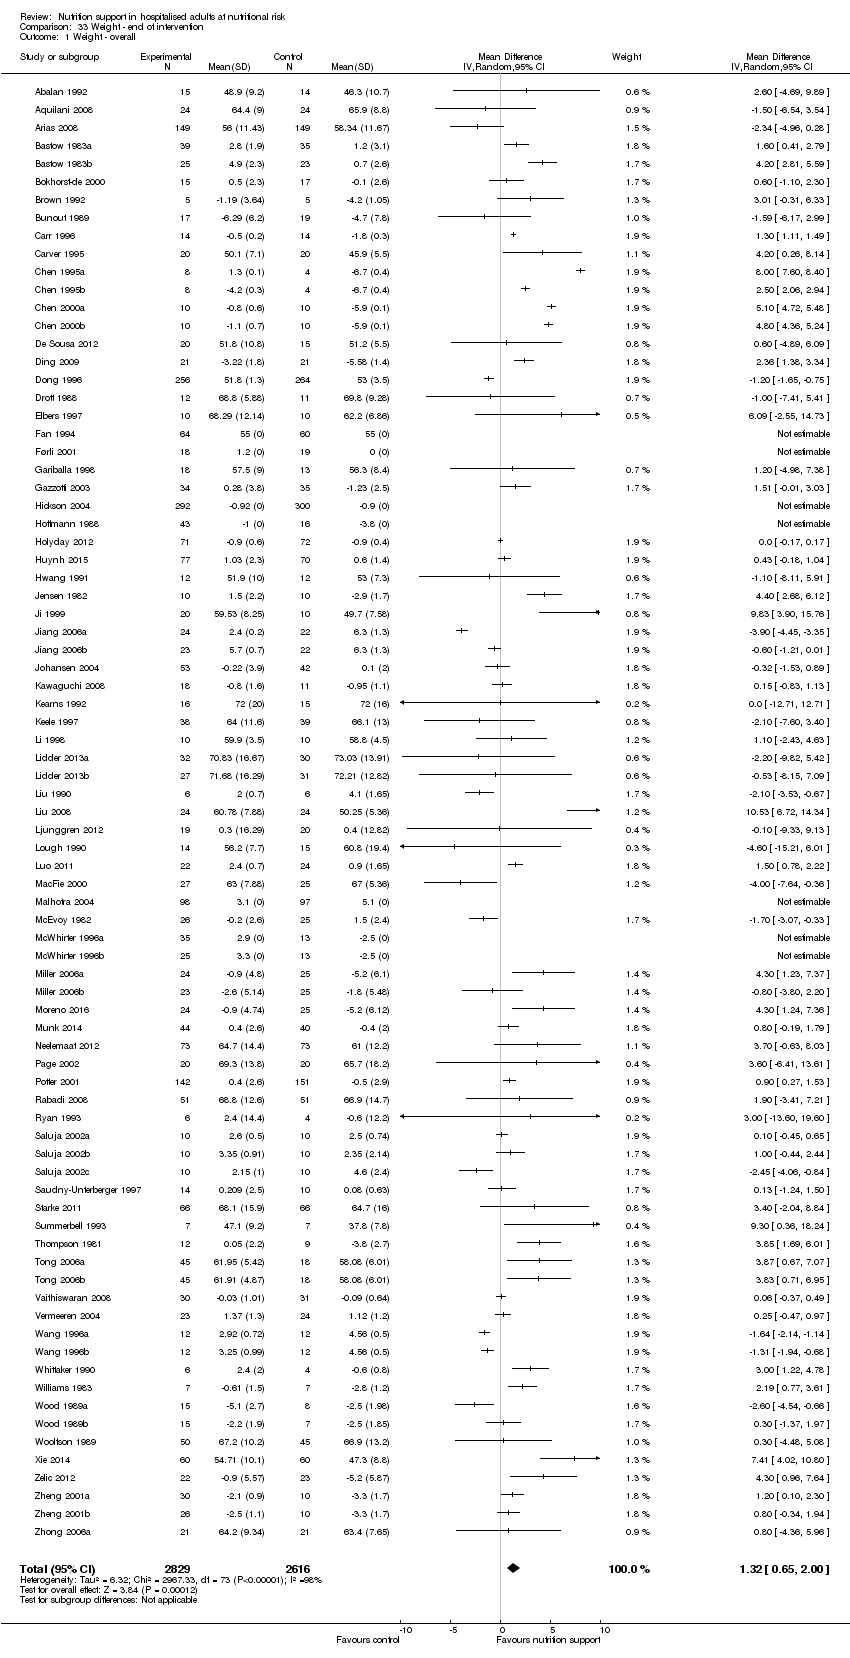 Comparison 33 Weight ‐ end of intervention, Outcome 1 Weight ‐ overall. | ||||
| 2 Weight ‐ bias Show forest plot | 81 | 5445 | Mean Difference (IV, Random, 95% CI) | 1.32 [0.65, 2.00] |
| Analysis 33.2  Comparison 33 Weight ‐ end of intervention, Outcome 2 Weight ‐ bias. | ||||
| 2.1 High risk of bias | 81 | 5445 | Mean Difference (IV, Random, 95% CI) | 1.32 [0.65, 2.00] |
| 2.2 Low risk of bias | 0 | 0 | Mean Difference (IV, Random, 95% CI) | 0.0 [0.0, 0.0] |
| 3 Weight ‐ mode of delivery Show forest plot | 81 | 5445 | Mean Difference (IV, Random, 95% CI) | 1.32 [0.65, 2.00] |
| Analysis 33.3  Comparison 33 Weight ‐ end of intervention, Outcome 3 Weight ‐ mode of delivery. | ||||
| 3.1 General nutrition support | 4 | 962 | Mean Difference (IV, Random, 95% CI) | ‐0.00 [‐0.17, 0.16] |
| 3.2 Fortified nutrition | 2 | 230 | Mean Difference (IV, Random, 95% CI) | 1.45 [‐0.92, 3.83] |
| 3.3 Oral nutrition support | 31 | 1924 | Mean Difference (IV, Random, 95% CI) | 0.33 [‐0.21, 0.87] |
| 3.4 Enteral nutrition | 26 | 1616 | Mean Difference (IV, Random, 95% CI) | 2.62 [1.23, 4.01] |
| 3.5 Parenteral nutrition | 17 | 667 | Mean Difference (IV, Random, 95% CI) | 1.48 [‐0.20, 3.15] |
| 3.6 Mixed nutrition support | 1 | 46 | Mean Difference (IV, Random, 95% CI) | ‐3.90 [‐4.45, ‐3.35] |
| 4 Weight ‐ by medical speciality Show forest plot | 81 | 5445 | Mean Difference (IV, Random, 95% CI) | 1.32 [0.65, 2.00] |
| Analysis 33.4  Comparison 33 Weight ‐ end of intervention, Outcome 4 Weight ‐ by medical speciality. | ||||
| 4.1 Cardiology | 0 | 0 | Mean Difference (IV, Random, 95% CI) | 0.0 [0.0, 0.0] |
| 4.2 Medical gastroenterology and hepatology | 7 | 345 | Mean Difference (IV, Random, 95% CI) | 0.88 [‐0.03, 1.79] |
| 4.3 Geriatrics | 10 | 1422 | Mean Difference (IV, Random, 95% CI) | 0.62 [‐0.30, 1.54] |
| 4.4 Pulmonary disease | 4 | 91 | Mean Difference (IV, Random, 95% CI) | 0.95 [‐0.43, 2.33] |
| 4.5 Endocrinology | 0 | 0 | Mean Difference (IV, Random, 95% CI) | 0.0 [0.0, 0.0] |
| 4.6 Infectious diseases | 0 | 0 | Mean Difference (IV, Random, 95% CI) | 0.0 [0.0, 0.0] |
| 4.7 Rheumatology | 0 | 0 | Mean Difference (IV, Random, 95% CI) | 0.0 [0.0, 0.0] |
| 4.8 Haematology | 0 | 0 | Mean Difference (IV, Random, 95% CI) | 0.0 [0.0, 0.0] |
| 4.9 Nephrology | 0 | 0 | Mean Difference (IV, Random, 95% CI) | 0.0 [0.0, 0.0] |
| 4.10 Gastroenterologic surgery | 35 | 1423 | Mean Difference (IV, Random, 95% CI) | 1.26 [‐0.12, 2.63] |
| 4.11 Trauma surgery | 0 | 0 | Mean Difference (IV, Random, 95% CI) | 0.0 [0.0, 0.0] |
| 4.12 Ortopaedics | 7 | 395 | Mean Difference (IV, Random, 95% CI) | 2.79 [1.36, 4.23] |
| 4.13 Plastic, reconstructive, and aesthetic surgery | 0 | 0 | Mean Difference (IV, Random, 95% CI) | 0.0 [0.0, 0.0] |
| 4.14 Vascular surgery | 0 | 0 | Mean Difference (IV, Random, 95% CI) | 0.0 [0.0, 0.0] |
| 4.15 Transplant surgery | 1 | 29 | Mean Difference (IV, Random, 95% CI) | ‐4.60 [‐15.21, 6.01] |
| 4.16 Urology | 0 | 0 | Mean Difference (IV, Random, 95% CI) | 0.0 [0.0, 0.0] |
| 4.17 Thoracic surgery | 2 | 548 | Mean Difference (IV, Random, 95% CI) | 0.06 [‐2.39, 2.51] |
| 4.18 Neurological surgery | 1 | 48 | Mean Difference (IV, Random, 95% CI) | 10.53 [6.72, 14.34] |
| 4.19 Oro‐maxillo‐facial surgery | 1 | 32 | Mean Difference (IV, Random, 95% CI) | 0.6 [‐1.10, 2.30] |
| 4.20 Anaesthesiology | 0 | 0 | Mean Difference (IV, Random, 95% CI) | 0.0 [0.0, 0.0] |
| 4.21 Emergency medicine | 0 | 0 | Mean Difference (IV, Random, 95% CI) | 0.0 [0.0, 0.0] |
| 4.22 Psychiatry | 0 | 0 | Mean Difference (IV, Random, 95% CI) | 0.0 [0.0, 0.0] |
| 4.23 Neurology | 5 | 247 | Mean Difference (IV, Random, 95% CI) | 0.74 [‐2.15, 3.63] |
| 4.24 Oncology | 1 | 23 | Mean Difference (IV, Random, 95% CI) | ‐1.0 [‐7.41, 5.41] |
| 4.25 Dermatology | 0 | 0 | Mean Difference (IV, Random, 95% CI) | 0.0 [0.0, 0.0] |
| 4.26 Gynaecology | 0 | 0 | Mean Difference (IV, Random, 95% CI) | 0.0 [0.0, 0.0] |
| 4.27 Mixed | 7 | 842 | Mean Difference (IV, Random, 95% CI) | 0.21 [‐0.58, 1.00] |
| 5 Weight ‐ based on adequacy of the amount of calories Show forest plot | 81 | 5445 | Mean Difference (IV, Random, 95% CI) | 1.32 [0.65, 2.00] |
| Analysis 33.5  Comparison 33 Weight ‐ end of intervention, Outcome 5 Weight ‐ based on adequacy of the amount of calories. | ||||
| 5.1 Clearly adequate in intervention and clearly inadequate in control | 20 | 1287 | Mean Difference (IV, Random, 95% CI) | 1.46 [‐0.19, 3.12] |
| 5.2 Inadequate in the experimental or adequate in the control | 19 | 1626 | Mean Difference (IV, Random, 95% CI) | 0.79 [0.06, 1.51] |
| 5.3 Experimental group is overfed | 5 | 151 | Mean Difference (IV, Random, 95% CI) | 0.64 [‐0.86, 2.13] |
| 5.4 Unclear intake in control or experimental | 37 | 2381 | Mean Difference (IV, Random, 95% CI) | 1.61 [0.50, 2.72] |
| 6 Weight ‐ different screening tools Show forest plot | 81 | 5445 | Mean Difference (IV, Random, 95% CI) | 1.32 [0.65, 2.00] |
| Analysis 33.6  Comparison 33 Weight ‐ end of intervention, Outcome 6 Weight ‐ different screening tools. | ||||
| 6.1 NRS 2002 | 4 | 353 | Mean Difference (IV, Random, 95% CI) | 1.12 [‐0.29, 2.53] |
| 6.2 MUST | 0 | 0 | Mean Difference (IV, Random, 95% CI) | 0.0 [0.0, 0.0] |
| 6.3 MNA | 2 | 104 | Mean Difference (IV, Random, 95% CI) | 1.45 [‐0.02, 2.91] |
| 6.4 SGA | 2 | 445 | Mean Difference (IV, Random, 95% CI) | ‐0.65 [‐3.30, 2.00] |
| 6.5 Other means | 73 | 4543 | Mean Difference (IV, Random, 95% CI) | 1.41 [0.68, 2.15] |
| 7 Weight ‐ participants characterised as 'at nutritional risk' due to one of the following conditions Show forest plot | 81 | 5445 | Mean Difference (IV, Random, 95% CI) | 1.32 [0.65, 2.00] |
| Analysis 33.7 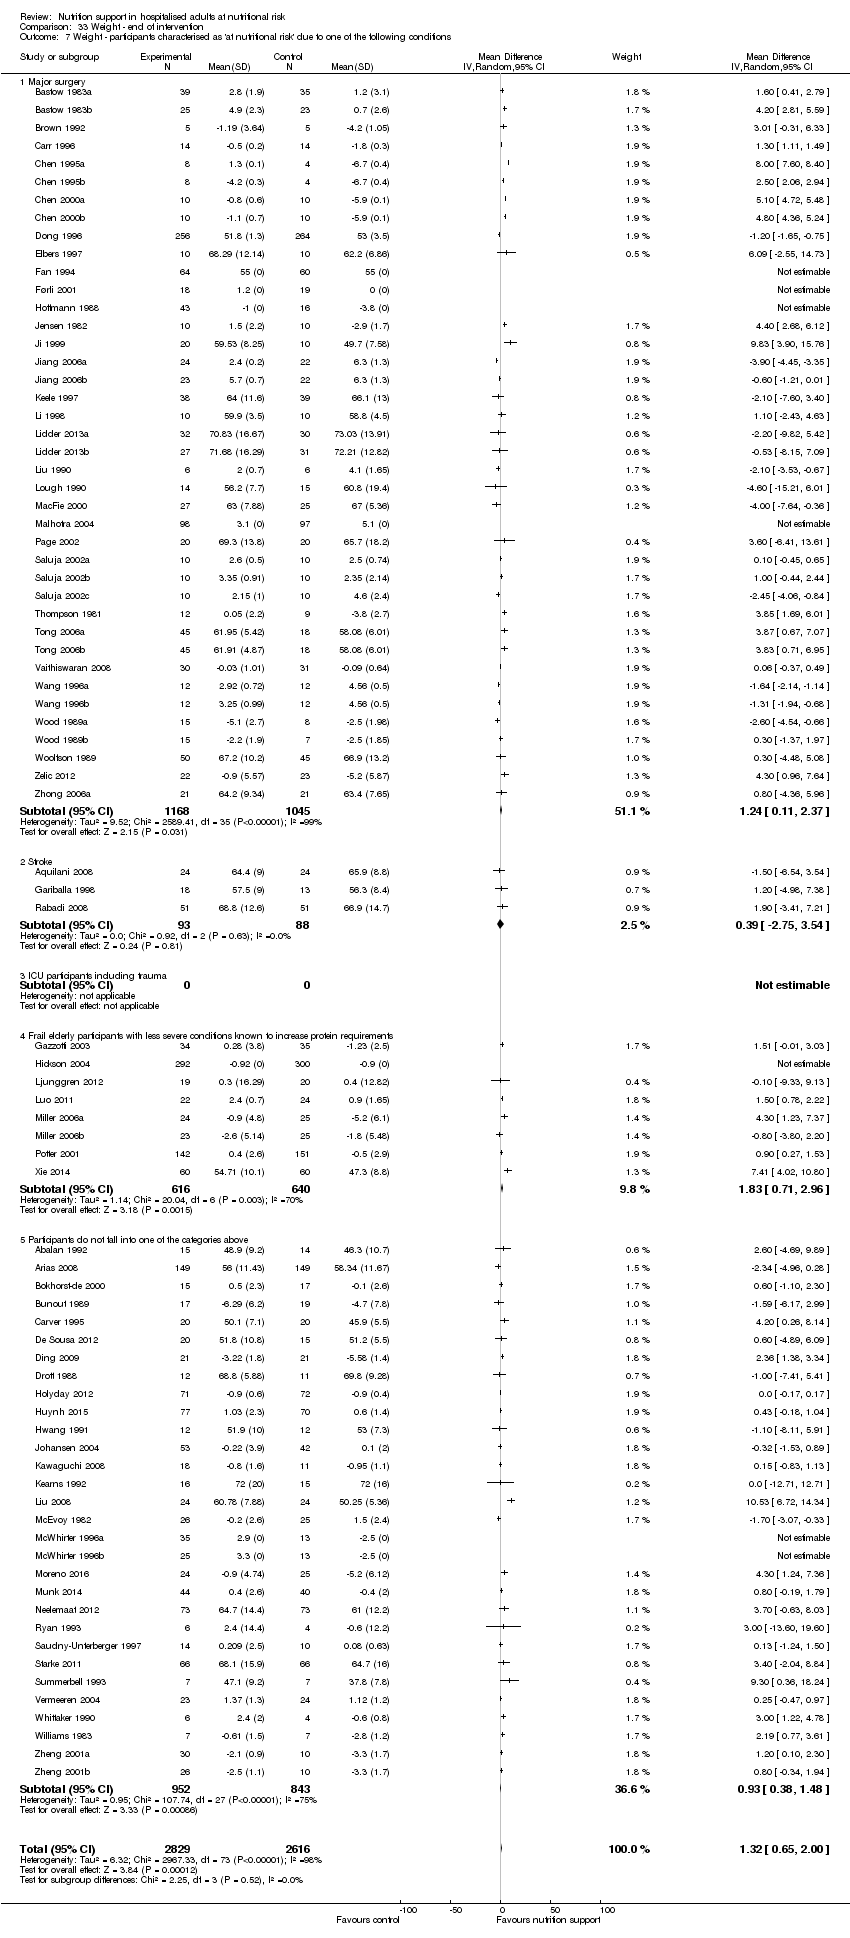 Comparison 33 Weight ‐ end of intervention, Outcome 7 Weight ‐ participants characterised as 'at nutritional risk' due to one of the following conditions. | ||||
| 7.1 Major surgery | 40 | 2213 | Mean Difference (IV, Random, 95% CI) | 1.24 [0.11, 2.37] |
| 7.2 Stroke | 3 | 181 | Mean Difference (IV, Random, 95% CI) | 0.39 [‐2.75, 3.54] |
| 7.3 ICU participants including trauma | 0 | 0 | Mean Difference (IV, Random, 95% CI) | 0.0 [0.0, 0.0] |
| 7.4 Frail elderly participants with less severe conditions known to increase protein requirements | 8 | 1256 | Mean Difference (IV, Random, 95% CI) | 1.83 [0.71, 2.96] |
| 7.5 Participants do not fall into one of the categories above | 30 | 1795 | Mean Difference (IV, Random, 95% CI) | 0.93 [0.38, 1.48] |
| 8 Weight ‐ participants characterised as 'at nutritional risk' due to one of the following criteria Show forest plot | 81 | 5445 | Mean Difference (IV, Random, 95% CI) | 1.32 [0.65, 2.00] |
| Analysis 33.8  Comparison 33 Weight ‐ end of intervention, Outcome 8 Weight ‐ participants characterised as 'at nutritional risk' due to one of the following criteria. | ||||
| 8.1 BMI less than 20.5 kg/m2 | 5 | 309 | Mean Difference (IV, Random, 95% CI) | 3.97 [1.06, 6.89] |
| 8.2 Weight loss of at least 5% during the last three months | 0 | 0 | Mean Difference (IV, Random, 95% CI) | 0.0 [0.0, 0.0] |
| 8.3 Weight loss of at least 10% during the last six months | 2 | 79 | Mean Difference (IV, Random, 95% CI) | 0.30 [‐0.36, 0.96] |
| 8.4 Insufficient food intake during the last week (50% of requirements or less) | 0 | 0 | Mean Difference (IV, Random, 95% CI) | 0.0 [0.0, 0.0] |
| 8.5 Participants characterised as 'at nutritional risk' by other means | 74 | 5057 | Mean Difference (IV, Random, 95% CI) | 1.30 [0.59, 2.00] |
| 9 Weight ‐ participants characterised as 'at nutritional risk' due to biomarkers or anthropometrics Show forest plot | 81 | 5445 | Mean Difference (IV, Random, 95% CI) | 1.32 [0.65, 2.00] |
| Analysis 33.9 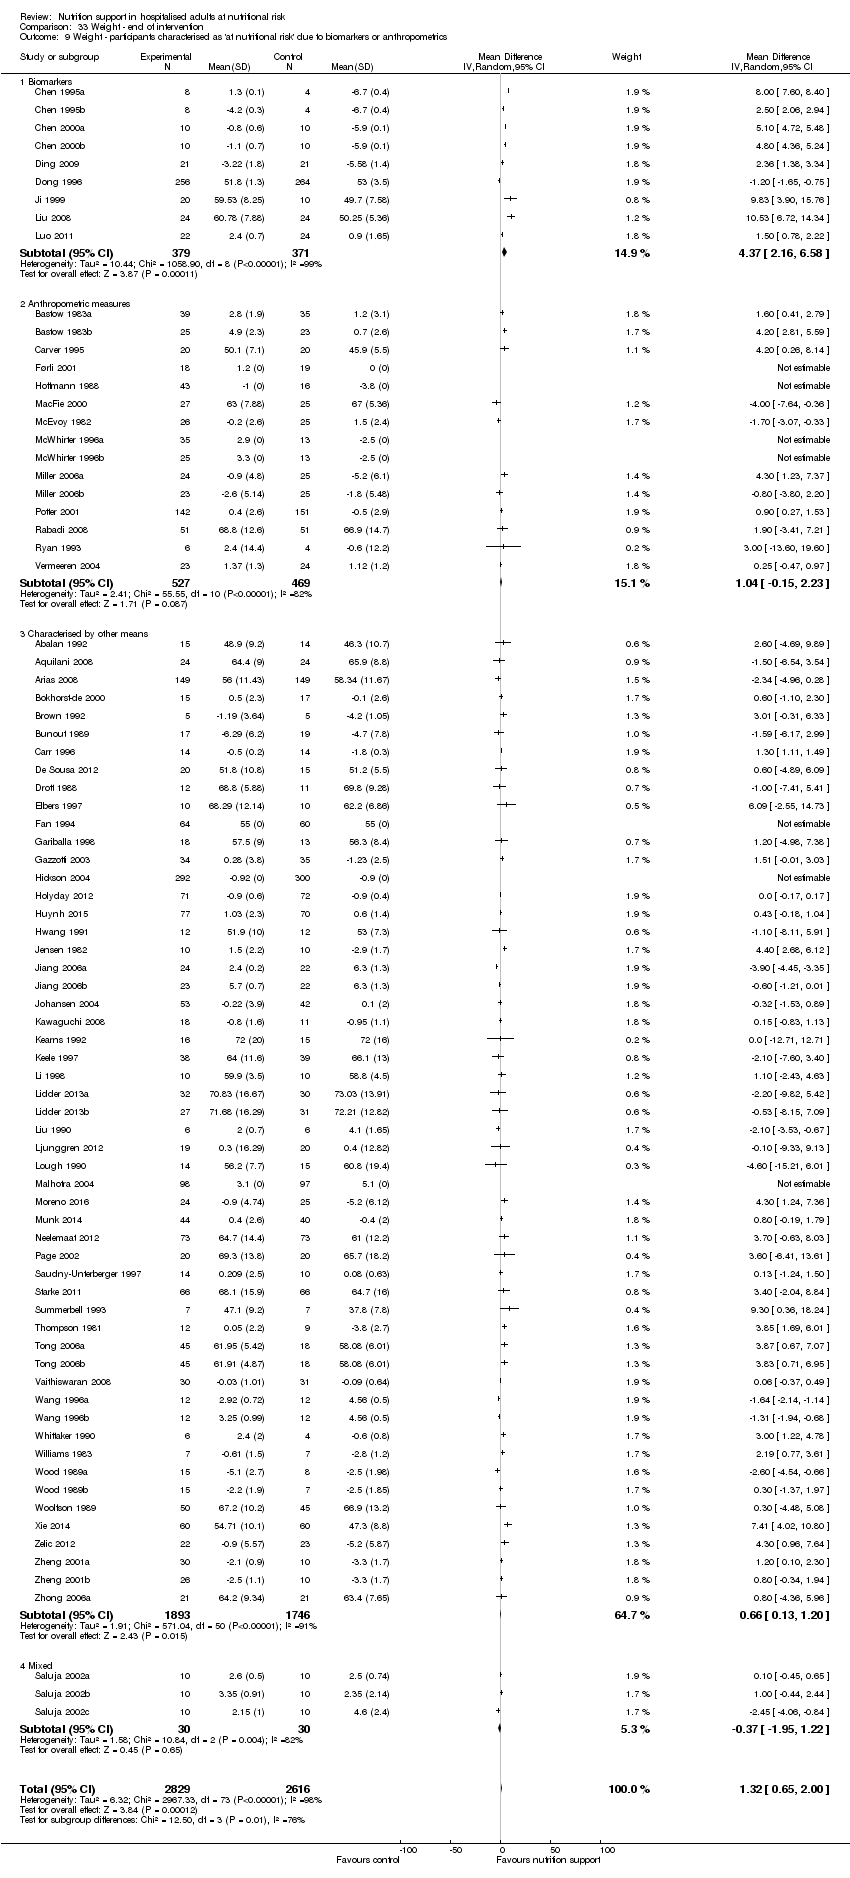 Comparison 33 Weight ‐ end of intervention, Outcome 9 Weight ‐ participants characterised as 'at nutritional risk' due to biomarkers or anthropometrics. | ||||
| 9.1 Biomarkers | 9 | 750 | Mean Difference (IV, Random, 95% CI) | 4.37 [2.16, 6.58] |
| 9.2 Anthropometric measures | 15 | 996 | Mean Difference (IV, Random, 95% CI) | 1.04 [‐0.15, 2.23] |
| 9.3 Characterised by other means | 54 | 3639 | Mean Difference (IV, Random, 95% CI) | 0.66 [0.13, 1.20] |
| 9.4 Mixed | 3 | 60 | Mean Difference (IV, Random, 95% CI) | ‐0.37 [‐1.95, 1.22] |
| 10 Weight ‐ randomisation year Show forest plot | 81 | 5445 | Mean Difference (IV, Random, 95% CI) | 1.32 [0.65, 2.00] |
| Analysis 33.10  Comparison 33 Weight ‐ end of intervention, Outcome 10 Weight ‐ randomisation year. | ||||
| 10.1 Before 1960 | 0 | 0 | Mean Difference (IV, Random, 95% CI) | 0.0 [0.0, 0.0] |
| 10.2 1960 to 1979 | 1 | 21 | Mean Difference (IV, Random, 95% CI) | 3.85 [1.69, 6.01] |
| 10.3 1980 to 1999 | 48 | 2365 | Mean Difference (IV, Random, 95% CI) | 1.23 [0.24, 2.22] |
| 10.4 After 1999 | 32 | 3059 | Mean Difference (IV, Random, 95% CI) | 1.07 [0.35, 1.79] |
| 11 Weight ‐ trials where the intervention lasts fewer than three days compared with trials where the intervention lasts three days or more Show forest plot | 81 | 5445 | Mean Difference (IV, Random, 95% CI) | 1.32 [0.65, 2.00] |
| Analysis 33.11  Comparison 33 Weight ‐ end of intervention, Outcome 11 Weight ‐ trials where the intervention lasts fewer than three days compared with trials where the intervention lasts three days or more. | ||||
| 11.1 Three days or more | 76 | 5287 | Mean Difference (IV, Random, 95% CI) | 1.40 [0.70, 2.10] |
| 11.2 Less than three days | 5 | 158 | Mean Difference (IV, Random, 95% CI) | 0.15 [‐1.62, 1.92] |
| 12 Weight ‐ Missing SDs Show forest plot | 81 | 5445 | Mean Difference (IV, Random, 95% CI) | 1.40 [0.76, 2.03] |
| Analysis 33.12  Comparison 33 Weight ‐ end of intervention, Outcome 12 Weight ‐ Missing SDs. | ||||
| 12.1 missing SDs imputed from all trials | 81 | 5445 | Mean Difference (IV, Random, 95% CI) | 1.40 [0.76, 2.03] |
| Outcome or subgroup title | No. of studies | No. of participants | Statistical method | Effect size |
| 1 Weight ‐ overall Show forest plot | 94 | 6916 | Mean Difference (IV, Random, 95% CI) | 1.13 [0.50, 1.75] |
| Analysis 34.1  Comparison 34 Weight ‐ maximum follow‐up, Outcome 1 Weight ‐ overall. | ||||
| 2 Weight ‐ bias Show forest plot | 94 | 6916 | Mean Difference (IV, Random, 95% CI) | 1.13 [0.50, 1.75] |
| Analysis 34.2 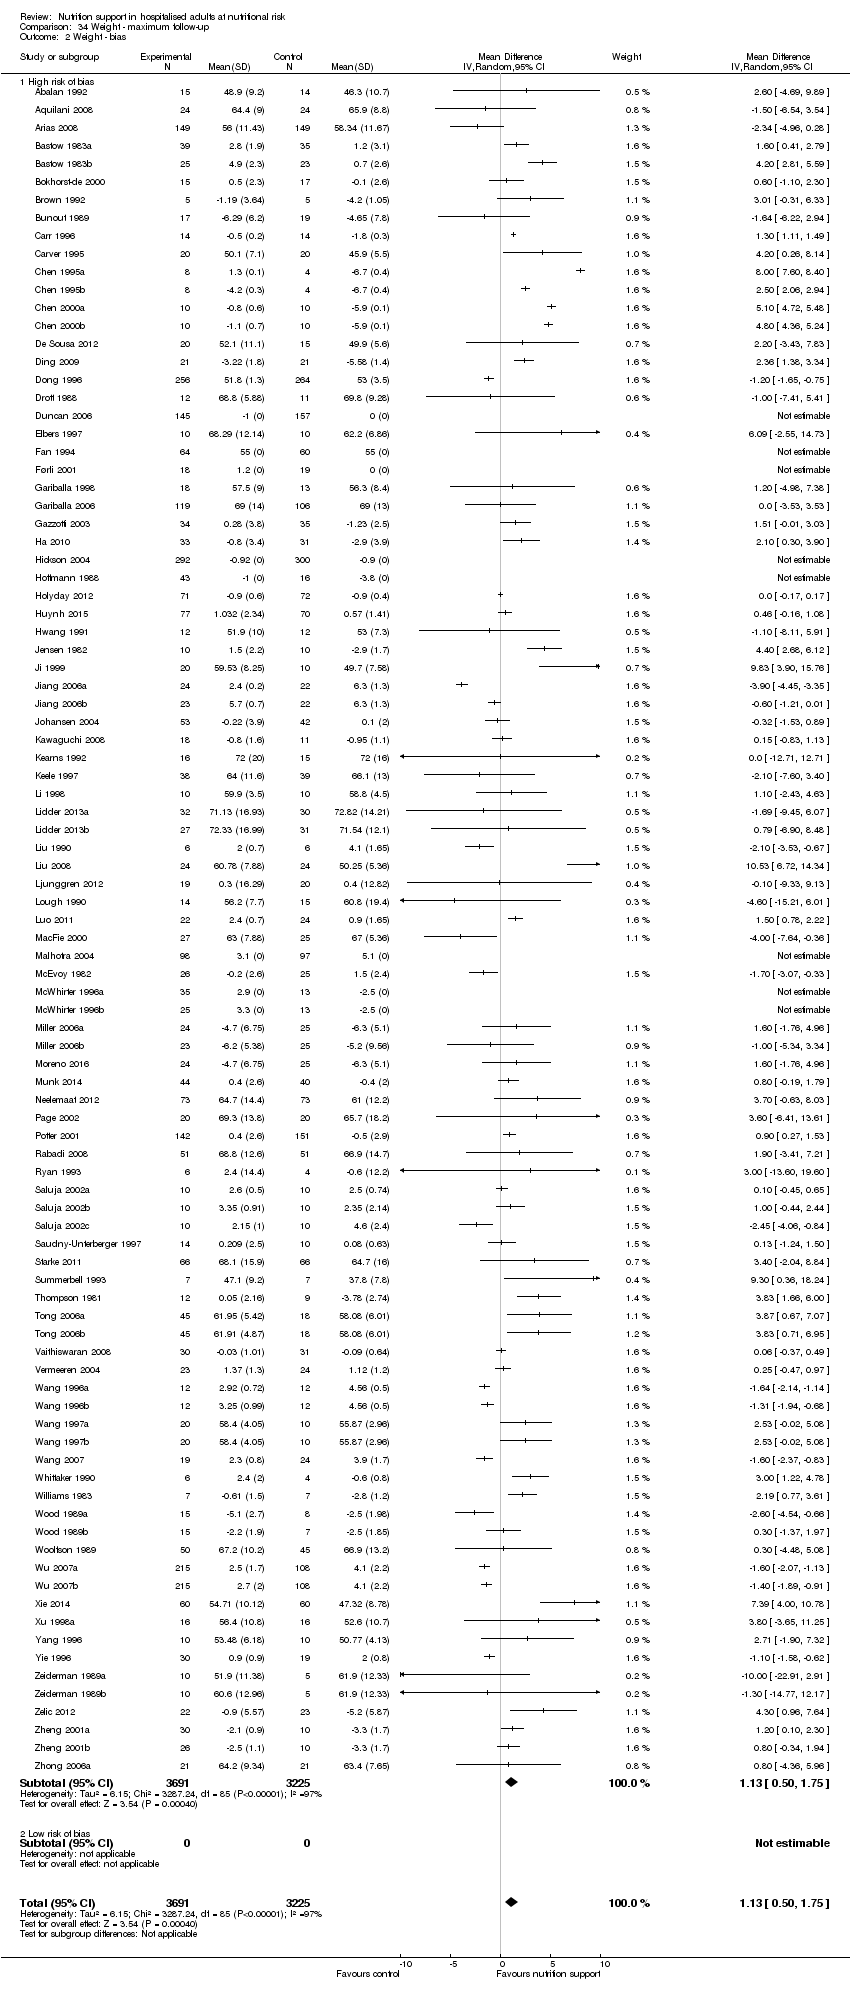 Comparison 34 Weight ‐ maximum follow‐up, Outcome 2 Weight ‐ bias. | ||||
| 2.1 High risk of bias | 94 | 6916 | Mean Difference (IV, Random, 95% CI) | 1.13 [0.50, 1.75] |
| 2.2 Low risk of bias | 0 | 0 | Mean Difference (IV, Random, 95% CI) | 0.0 [0.0, 0.0] |
| 3 Weight ‐ mode of delivery Show forest plot | 94 | 6916 | Mean Difference (IV, Random, 95% CI) | 1.13 [0.50, 1.75] |
| Analysis 34.3  Comparison 34 Weight ‐ maximum follow‐up, Outcome 3 Weight ‐ mode of delivery. | ||||
| 3.1 General nutrition support | 6 | 1328 | Mean Difference (IV, Random, 95% CI) | 0.41 [‐0.58, 1.41] |
| 3.2 Fortified nutrition | 2 | 230 | Mean Difference (IV, Random, 95% CI) | 1.45 [‐0.92, 3.83] |
| 3.3 Oral nutrition support | 32 | 2149 | Mean Difference (IV, Random, 95% CI) | 0.29 [‐0.22, 0.80] |
| 3.4 Enteral nutrition | 31 | 2081 | Mean Difference (IV, Random, 95% CI) | 1.98 [0.74, 3.22] |
| 3.5 Parenteral nutrition | 22 | 1082 | Mean Difference (IV, Random, 95% CI) | 1.25 [‐0.25, 2.75] |
| 3.6 Mixed | 1 | 46 | Mean Difference (IV, Random, 95% CI) | ‐3.90 [‐4.45, ‐3.35] |
| 4 Weight ‐ by medical speciality Show forest plot | 94 | 6916 | Mean Difference (IV, Random, 95% CI) | 1.13 [0.50, 1.75] |
| Analysis 34.4  Comparison 34 Weight ‐ maximum follow‐up, Outcome 4 Weight ‐ by medical speciality. | ||||
| 4.1 Cardiology | 0 | 0 | Mean Difference (IV, Random, 95% CI) | 0.0 [0.0, 0.0] |
| 4.2 Medical gastroenterology and hepatology | 8 | 388 | Mean Difference (IV, Random, 95% CI) | 0.13 [‐1.05, 1.30] |
| 4.3 Geriatrics | 11 | 1647 | Mean Difference (IV, Random, 95% CI) | 0.61 [‐0.27, 1.50] |
| 4.4 Pulmonary disease | 4 | 91 | Mean Difference (IV, Random, 95% CI) | 0.95 [‐0.43, 2.33] |
| 4.5 Endocrinology | 0 | 0 | Mean Difference (IV, Random, 95% CI) | 0.0 [0.0, 0.0] |
| 4.6 Infectious diseases | 0 | 0 | Mean Difference (IV, Random, 95% CI) | 0.0 [0.0, 0.0] |
| 4.7 Rheumatology | 0 | 0 | Mean Difference (IV, Random, 95% CI) | 0.0 [0.0, 0.0] |
| 4.8 Haematology | 0 | 0 | Mean Difference (IV, Random, 95% CI) | 0.0 [0.0, 0.0] |
| 4.9 Nephrology | 0 | 0 | Mean Difference (IV, Random, 95% CI) | 0.0 [0.0, 0.0] |
| 4.10 Gastroenterologic surgery | 44 | 2260 | Mean Difference (IV, Random, 95% CI) | 1.09 [‐0.11, 2.29] |
| 4.11 Trauma surgery | 0 | 0 | Mean Difference (IV, Random, 95% CI) | 0.0 [0.0, 0.0] |
| 4.12 Ortopaedics | 8 | 697 | Mean Difference (IV, Random, 95% CI) | 2.62 [1.21, 4.02] |
| 4.13 Plastic, reconstructive, and aesthetic surgery | 0 | 0 | Mean Difference (IV, Random, 95% CI) | 0.0 [0.0, 0.0] |
| 4.14 Vascular surgery | 0 | 0 | Mean Difference (IV, Random, 95% CI) | 0.0 [0.0, 0.0] |
| 4.15 Transplant surgery | 1 | 29 | Mean Difference (IV, Random, 95% CI) | ‐4.60 [‐15.21, 6.01] |
| 4.16 Urology | 0 | 0 | Mean Difference (IV, Random, 95% CI) | 0.0 [0.0, 0.0] |
| 4.17 Thoracic surgery | 2 | 548 | Mean Difference (IV, Random, 95% CI) | 0.06 [‐2.39, 2.51] |
| 4.18 Neurological surgery | 1 | 48 | Mean Difference (IV, Random, 95% CI) | 10.53 [6.72, 14.34] |
| 4.19 Oro‐maxillo‐facial surgery | 1 | 32 | Mean Difference (IV, Random, 95% CI) | 0.6 [‐1.10, 2.30] |
| 4.20 Anaesthesiology | 0 | 0 | Mean Difference (IV, Random, 95% CI) | 0.0 [0.0, 0.0] |
| 4.21 Emergency medicine | 0 | 0 | Mean Difference (IV, Random, 95% CI) | 0.0 [0.0, 0.0] |
| 4.22 Psychiatry | 0 | 0 | Mean Difference (IV, Random, 95% CI) | 0.0 [0.0, 0.0] |
| 4.23 Neurology | 6 | 311 | Mean Difference (IV, Random, 95% CI) | 1.72 [0.19, 3.25] |
| 4.24 Oncology | 1 | 23 | Mean Difference (IV, Random, 95% CI) | ‐1.0 [‐7.41, 5.41] |
| 4.25 Dermatology | 0 | 0 | Mean Difference (IV, Random, 95% CI) | 0.0 [0.0, 0.0] |
| 4.26 Gynaecology | 0 | 0 | Mean Difference (IV, Random, 95% CI) | 0.0 [0.0, 0.0] |
| 4.27 Mixed | 7 | 842 | Mean Difference (IV, Random, 95% CI) | 0.22 [‐0.58, 1.02] |
| 5 Weight ‐ based on adequacy of the amount of nutrition Show forest plot | 94 | 6916 | Mean Difference (IV, Random, 95% CI) | 1.13 [0.50, 1.75] |
| Analysis 34.5 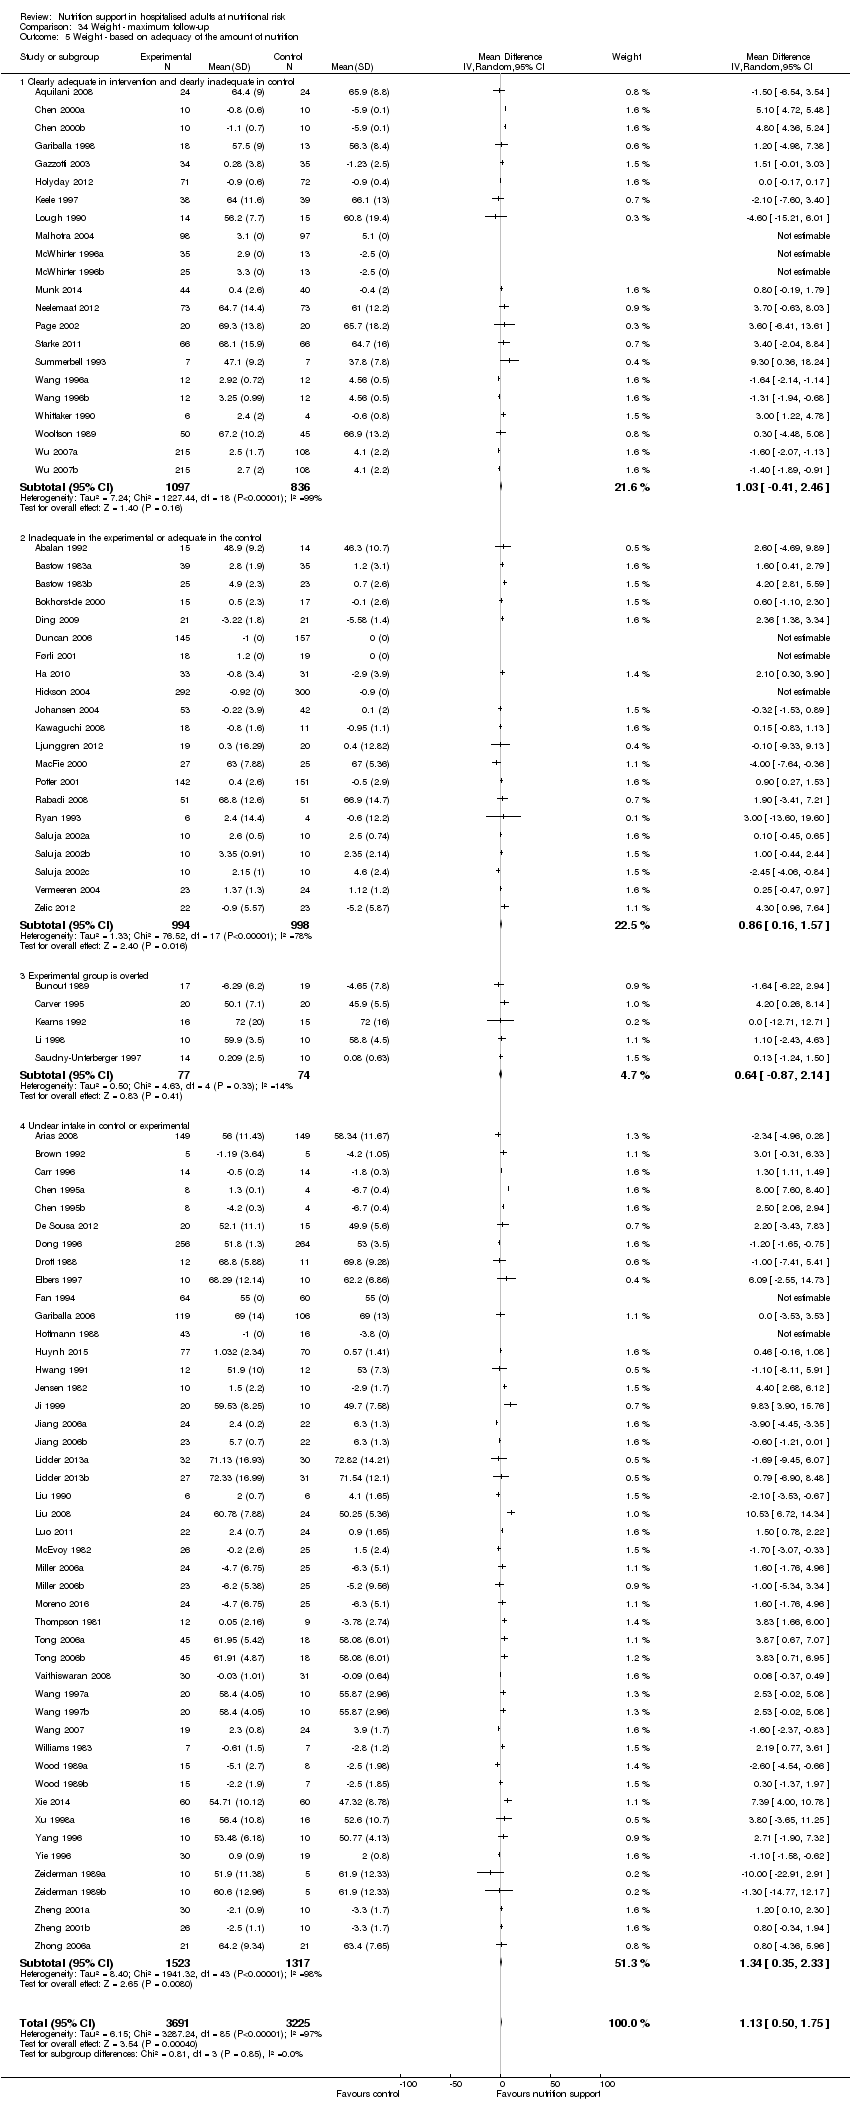 Comparison 34 Weight ‐ maximum follow‐up, Outcome 5 Weight ‐ based on adequacy of the amount of nutrition. | ||||
| 5.1 Clearly adequate in intervention and clearly inadequate in control | 22 | 1933 | Mean Difference (IV, Random, 95% CI) | 1.03 [‐0.41, 2.46] |
| 5.2 Inadequate in the experimental or adequate in the control | 21 | 1992 | Mean Difference (IV, Random, 95% CI) | 0.86 [0.16, 1.57] |
| 5.3 Experimental group is overfed | 5 | 151 | Mean Difference (IV, Random, 95% CI) | 0.64 [‐0.87, 2.14] |
| 5.4 Unclear intake in control or experimental | 46 | 2840 | Mean Difference (IV, Random, 95% CI) | 1.34 [0.35, 2.33] |
| 6 Weight ‐ different screening tools Show forest plot | 94 | 6916 | Mean Difference (IV, Random, 95% CI) | 1.13 [0.50, 1.75] |
| Analysis 34.6  Comparison 34 Weight ‐ maximum follow‐up, Outcome 6 Weight ‐ different screening tools. | ||||
| 6.1 NRS 2002 | 4 | 353 | Mean Difference (IV, Random, 95% CI) | 1.12 [‐0.29, 2.53] |
| 6.2 MUST | 1 | 64 | Mean Difference (IV, Random, 95% CI) | 2.10 [0.30, 3.90] |
| 6.3 MNA | 2 | 104 | Mean Difference (IV, Random, 95% CI) | 1.56 [0.09, 3.03] |
| 6.4 SGA | 4 | 1091 | Mean Difference (IV, Random, 95% CI) | ‐1.03 [‐2.12, 0.06] |
| 6.5 Other means | 83 | 5304 | Mean Difference (IV, Random, 95% CI) | 1.26 [0.56, 1.95] |
| 7 Weight ‐ participants characterised as 'at nutritional risk' due to one of the following conditions Show forest plot | 94 | 6916 | Mean Difference (IV, Random, 95% CI) | 1.13 [0.50, 1.75] |
| Analysis 34.7  Comparison 34 Weight ‐ maximum follow‐up, Outcome 7 Weight ‐ participants characterised as 'at nutritional risk' due to one of the following conditions. | ||||
| 7.1 Major surgery | 49 | 3050 | Mean Difference (IV, Random, 95% CI) | 1.08 [0.08, 2.09] |
| 7.2 Stroke | 4 | 245 | Mean Difference (IV, Random, 95% CI) | 1.68 [0.12, 3.24] |
| 7.3 ICU participants including trauma | 1 | 43 | Mean Difference (IV, Random, 95% CI) | ‐1.6 [‐2.37, ‐0.83] |
| 7.4 Frail elderly participants with less severe conditions known to increase protein requirements | 9 | 1558 | Mean Difference (IV, Random, 95% CI) | 1.61 [0.59, 2.64] |
| 7.5 Participants do not fall into one of the categories above | 31 | 2020 | Mean Difference (IV, Random, 95% CI) | 0.85 [0.33, 1.38] |
| 8 Weight ‐ participants characterised as 'at nutritional risk' due to one of the following criteria Show forest plot | 94 | 6916 | Mean Difference (IV, Random, 95% CI) | 1.13 [0.50, 1.75] |
| Analysis 34.8  Comparison 34 Weight ‐ maximum follow‐up, Outcome 8 Weight ‐ participants characterised as 'at nutritional risk' due to one of the following criteria. | ||||
| 8.1 BMI less than 20.5 kg/m2 | 5 | 309 | Mean Difference (IV, Random, 95% CI) | 3.97 [1.06, 6.89] |
| 8.2 Weight loss of at least 5% during the last three months | 2 | 30 | Mean Difference (IV, Random, 95% CI) | ‐5.83 [‐15.15, 3.48] |
| 8.3 Weight loss of at least 10% during the last six months | 2 | 79 | Mean Difference (IV, Random, 95% CI) | 0.30 [‐0.36, 0.96] |
| 8.4 Insufficient food intake during the last week (50% of requirements or less) | 0 | 0 | Mean Difference (IV, Random, 95% CI) | 0.0 [0.0, 0.0] |
| 8.5 Participants characterised as 'at nutritional risk' by other means | 85 | 6498 | Mean Difference (IV, Random, 95% CI) | 1.12 [0.48, 1.77] |
| 9 Weight ‐ participants characterised as 'at nutritional risk' due to biomarkers or anthropometrics Show forest plot | 94 | 6916 | Mean Difference (IV, Random, 95% CI) | 1.13 [0.50, 1.75] |
| Analysis 34.9 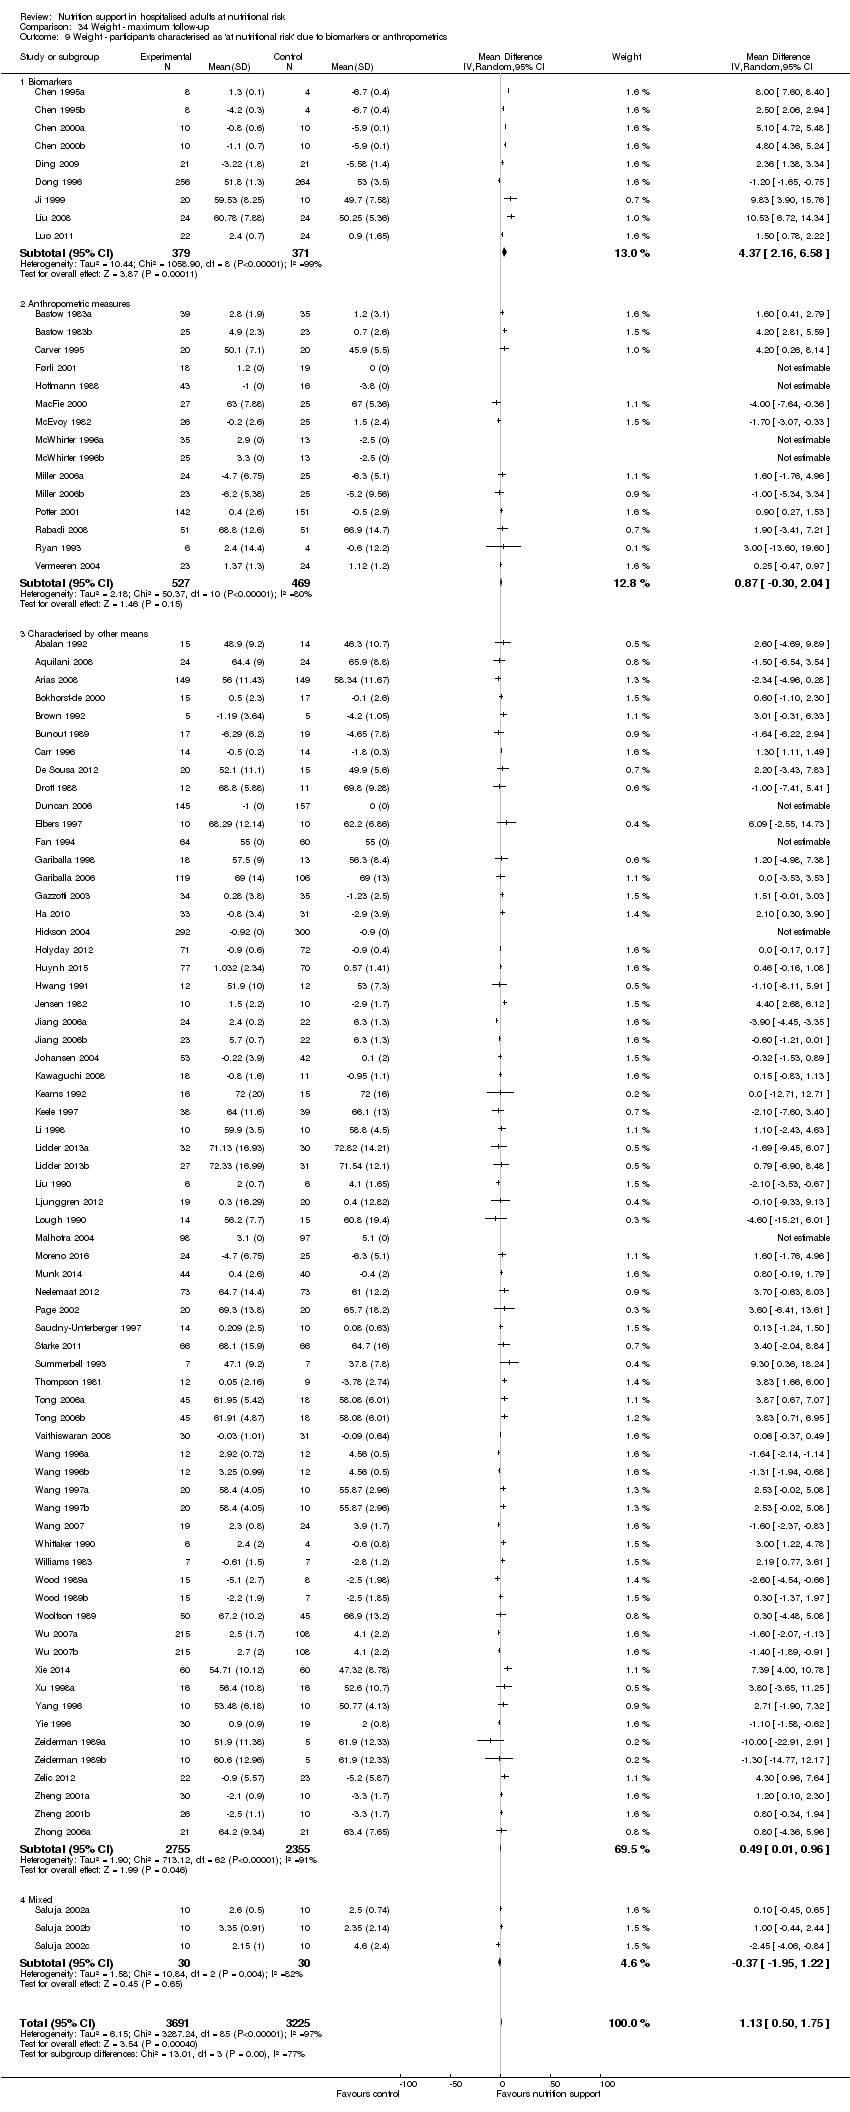 Comparison 34 Weight ‐ maximum follow‐up, Outcome 9 Weight ‐ participants characterised as 'at nutritional risk' due to biomarkers or anthropometrics. | ||||
| 9.1 Biomarkers | 9 | 750 | Mean Difference (IV, Random, 95% CI) | 4.37 [2.16, 6.58] |
| 9.2 Anthropometric measures | 15 | 996 | Mean Difference (IV, Random, 95% CI) | 0.87 [‐0.30, 2.04] |
| 9.3 Characterised by other means | 67 | 5110 | Mean Difference (IV, Random, 95% CI) | 0.49 [0.01, 0.96] |
| 9.4 Mixed | 3 | 60 | Mean Difference (IV, Random, 95% CI) | ‐0.37 [‐1.95, 1.22] |
| 10 Weight ‐ randomisation year Show forest plot | 23 | 1940 | Mean Difference (IV, Random, 95% CI) | 0.48 [‐0.44, 1.39] |
| Analysis 34.10 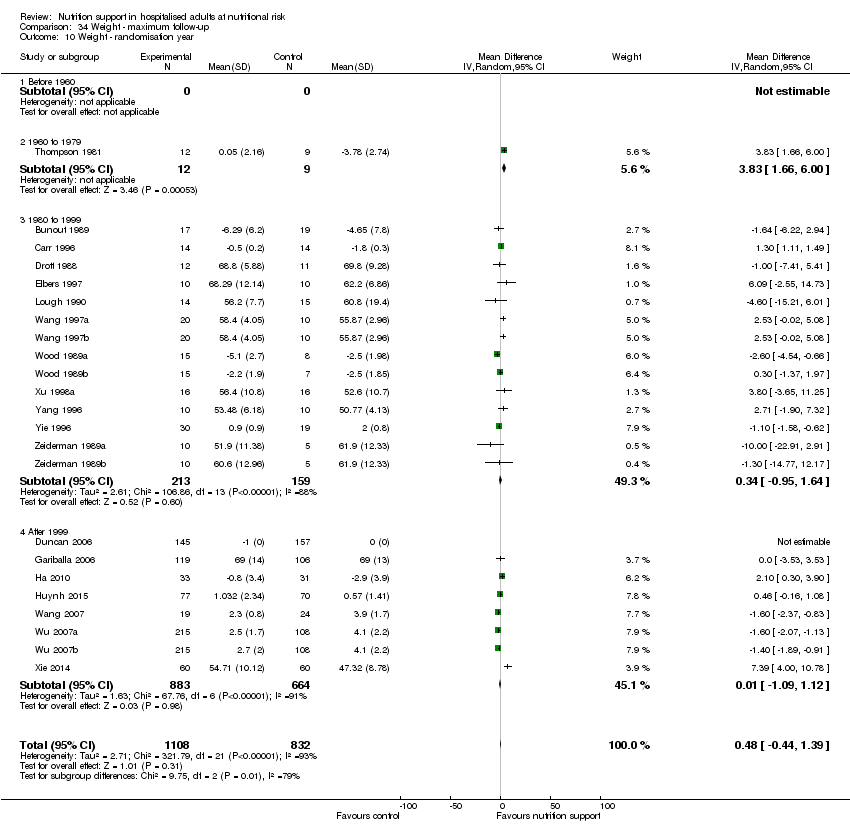 Comparison 34 Weight ‐ maximum follow‐up, Outcome 10 Weight ‐ randomisation year. | ||||
| 10.1 Before 1960 | 0 | 0 | Mean Difference (IV, Random, 95% CI) | 0.0 [0.0, 0.0] |
| 10.2 1960 to 1979 | 1 | 21 | Mean Difference (IV, Random, 95% CI) | 3.83 [1.66, 6.00] |
| 10.3 1980 to 1999 | 14 | 372 | Mean Difference (IV, Random, 95% CI) | 0.34 [‐0.95, 1.64] |
| 10.4 After 1999 | 8 | 1547 | Mean Difference (IV, Random, 95% CI) | 0.01 [‐1.09, 1.12] |
| 11 Weight ‐ trials where the intervention lasts fewer than three days compared with trials where the intervention lasts three days or more Show forest plot | 94 | 6916 | Mean Difference (IV, Random, 95% CI) | 1.13 [0.50, 1.75] |
| Analysis 34.11  Comparison 34 Weight ‐ maximum follow‐up, Outcome 11 Weight ‐ trials where the intervention lasts fewer than three days compared with trials where the intervention lasts three days or more. | ||||
| 11.1 Three days or more | 89 | 6758 | Mean Difference (IV, Random, 95% CI) | 1.18 [0.54, 1.83] |
| 11.2 Less than three days | 5 | 158 | Mean Difference (IV, Random, 95% CI) | 0.15 [‐1.62, 1.92] |
| Outcome or subgroup title | No. of studies | No. of participants | Statistical method | Effect size |
| 1 Hand‐grip strength ‐ overall Show forest plot | 14 | 783 | Mean Difference (IV, Random, 95% CI) | 1.47 [0.58, 2.37] |
| Analysis 35.1  Comparison 35 Hand‐grip strength ‐ end of intervention, Outcome 1 Hand‐grip strength ‐ overall. | ||||
| Outcome or subgroup title | No. of studies | No. of participants | Statistical method | Effect size |
| 1 Hand‐grip strength ‐ overall Show forest plot | 18 | 1240 | Mean Difference (IV, Random, 95% CI) | 0.96 [0.15, 1.76] |
| Analysis 36.1 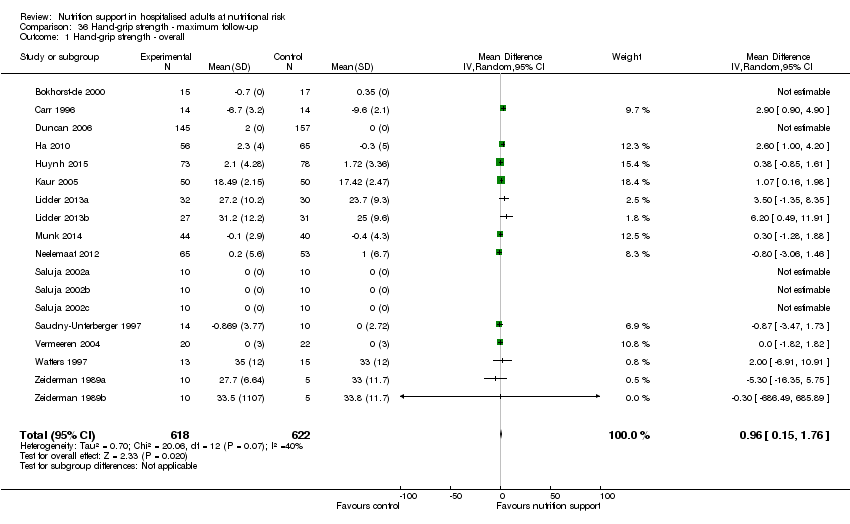 Comparison 36 Hand‐grip strength ‐ maximum follow‐up, Outcome 1 Hand‐grip strength ‐ overall. | ||||
| Outcome or subgroup title | No. of studies | No. of participants | Statistical method | Effect size |
| 1 Six‐minute walking distance ‐ overall Show forest plot | 1 | 102 | Mean Difference (IV, Random, 95% CI) | 133.27 [24.32, 242.22] |
| Analysis 37.1 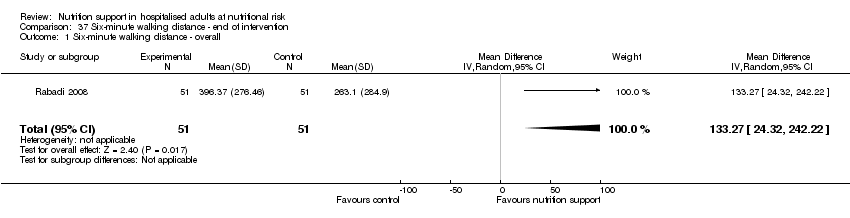 Comparison 37 Six‐minute walking distance ‐ end of intervention, Outcome 1 Six‐minute walking distance ‐ overall. | ||||

Study flow diagram.

Risk of bias summary: review authors' judgements about each risk of bias item for each included study.

Risk of bias graph: review authors' judgements about each risk of bias item presented as percentages across all included studies.

Trial Sequential Analysis on all‐cause mortality (end of intervention) in 114 high risk of bias trials. The diversity‐adjusted required information size (RIS) was calculated based on mortality in the control group of 8.29%; risk ratio reduction of 20% in the experimental group; type I error of 2.5%; and type II error of 20% (80% power). No diversity was noted. The required information size was 9526 participants. The cumulative Z‐curve (blue line) did not cross the trial sequential monitoring boundaries for benefit or harm (red inward sloping lines). The cumulative Z‐curve crossed the inner‐wedge futility line (red outward sloping lines). Additionally the cumulative Z‐score crossed the RIS. The green dotted line shows conventional boundaries (2.5%).

Trial Sequential Analysis on serious adverse events (maximum follow‐up) in 137 high risk of bias trials. The diversity‐adjusted required information size (RIS) was calculated based on an incidence rate of serious adverse event in the control group of 15.2%; risk ratio reduction of 10% in the experimental group; type I error of 2.5%; and type II error of 20% (80% power). No diversity was noted. The required information size was 19535 participants. The cumulative Z‐curve (blue line) did not cross the trial sequential monitoring boundaries for benefit or harm (red inward sloping lines). The cumulative Z‐curve crossed the inner‐wedge futility line (red outward sloping lines) indicating that sufficient information is provided. Additionally the cumulative Z‐score crossed the RIS. The green dotted line shows conventional boundaries (2.5%). The cumulative Z‐curve later crosses the green line, indicating a possible significant effect, but one that is smaller than a 10% risk ratio reduction.

Trial Sequential Analysis on serious adverse events (maximum follow‐up) with participants receiving enteral nutrition in 49 high risk of bias trials. The diversity‐adjusted required information size (RIS) was calculated based on an incidence rate of serious adverse event in the control group of 17.2%; risk ratio reduction of 20% in the experimental group; type I error of 2.5%; and type II error of 20% (80% power). No diversity was noted. The required information size was 4444 participants. The cumulative Z‐curve (blue line) did cross the trial sequential monitoring boundaries for benefit (red inward sloping lines) indicating that enteral nutrition may result in a 20% or greater risk ratio reduction of serious adverse events at maximum follow‐up. The cumulative Z‐curve did not cross the inner‐wedge futility line (red outward sloping lines). The green dotted line shows conventional boundaries (2.5%).

Comparison 1 All‐cause mortality ‐ end of intervention, Outcome 1 All‐cause mortality ‐ overall.

Comparison 1 All‐cause mortality ‐ end of intervention, Outcome 2 All‐cause mortality ‐ bias.
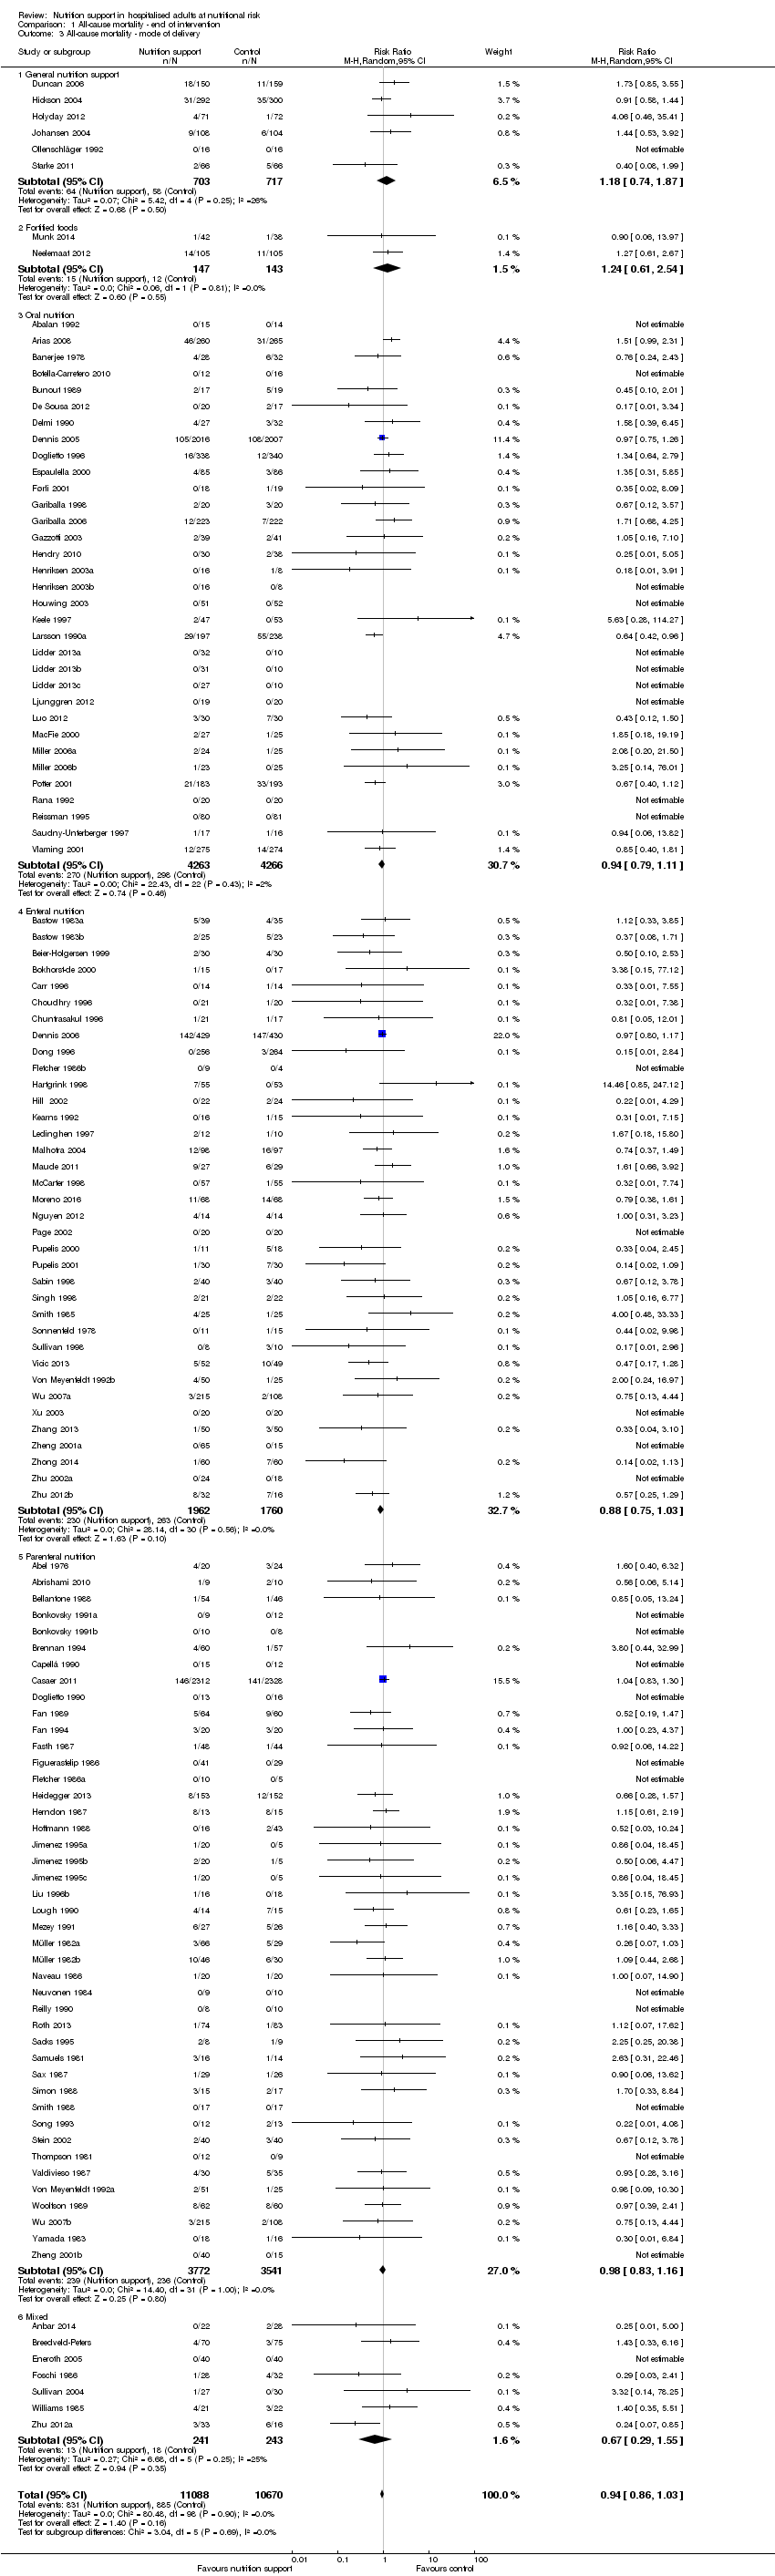
Comparison 1 All‐cause mortality ‐ end of intervention, Outcome 3 All‐cause mortality ‐ mode of delivery.

Comparison 1 All‐cause mortality ‐ end of intervention, Outcome 4 All‐cause mortality ‐ medical specialty.

Comparison 1 All‐cause mortality ‐ end of intervention, Outcome 5 All‐cause mortality ‐ based on adequacy of the amount of calories.

Comparison 1 All‐cause mortality ‐ end of intervention, Outcome 6 All‐cause mortality ‐ different screening tools.

Comparison 1 All‐cause mortality ‐ end of intervention, Outcome 7 All‐cause mortality ‐ participants characterised as 'at nutritional risk' due to one of the following conditions.
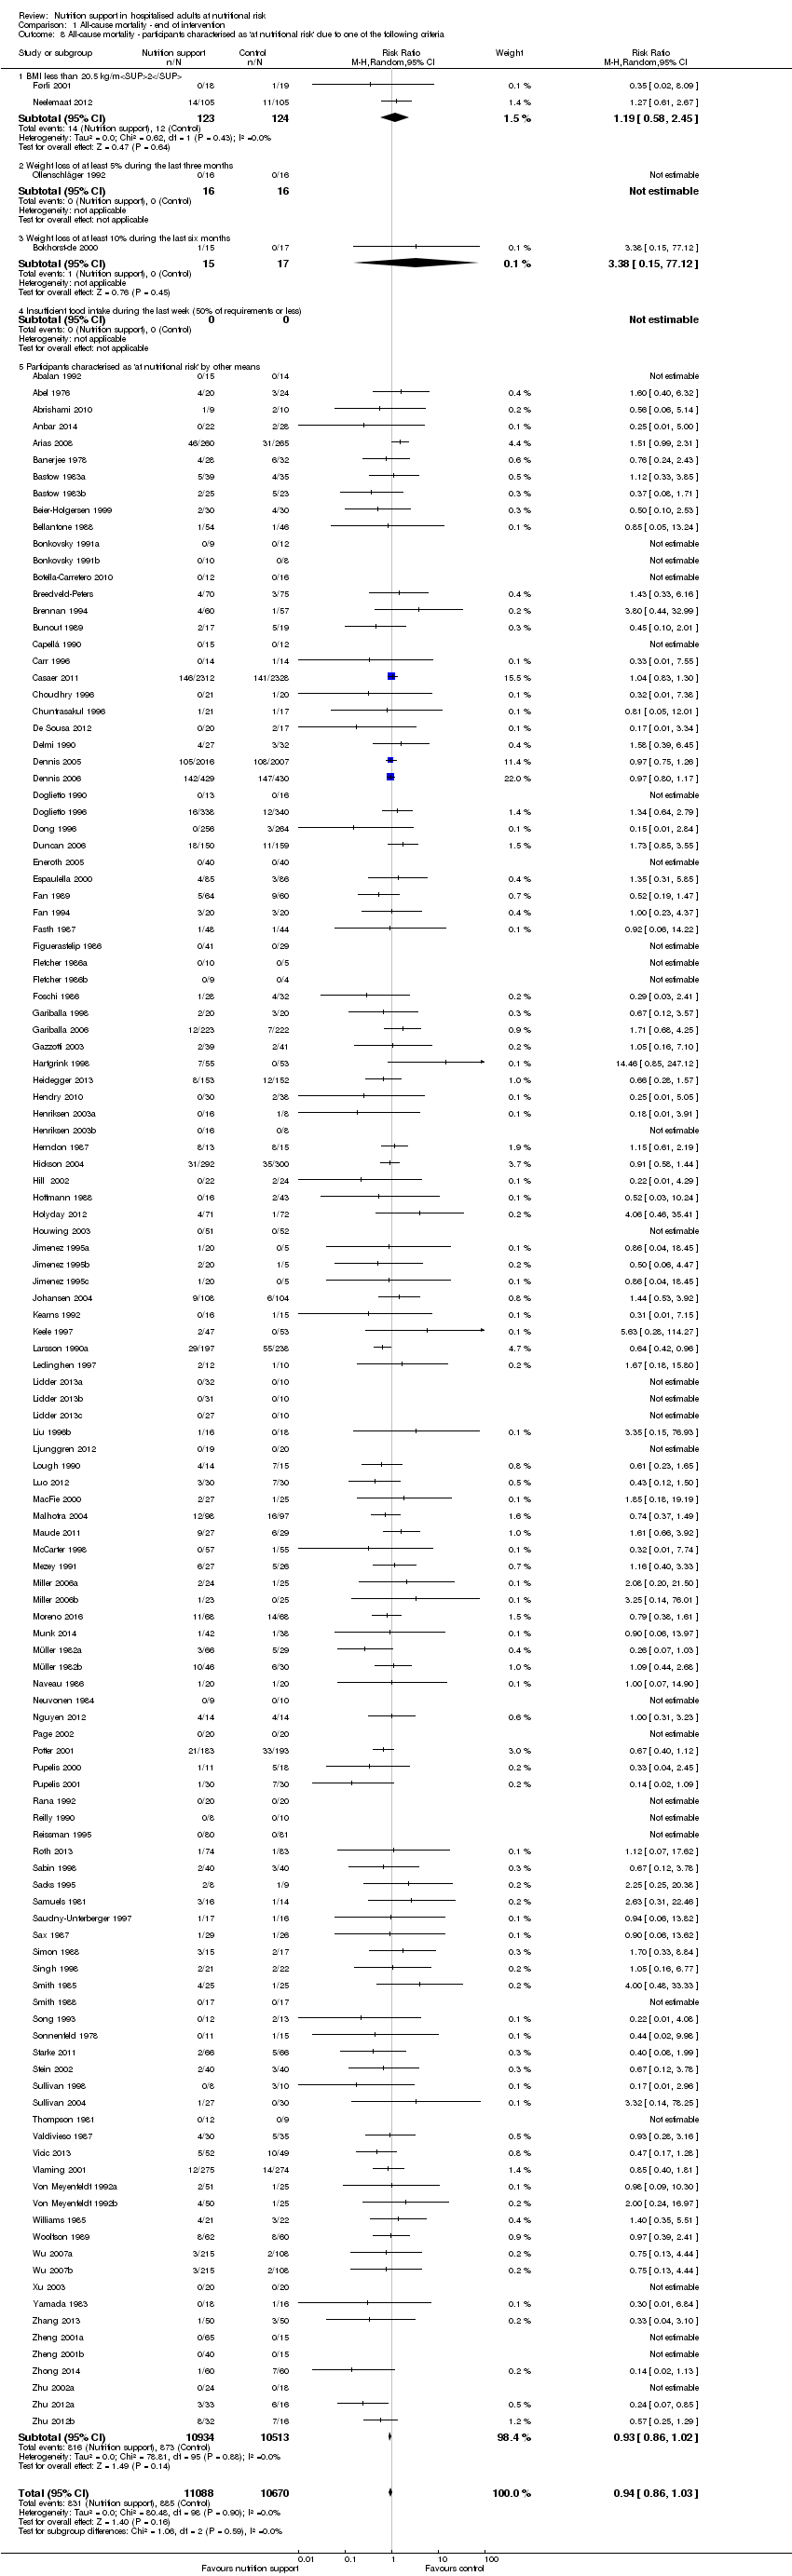
Comparison 1 All‐cause mortality ‐ end of intervention, Outcome 8 All‐cause mortality ‐ participants characterised as 'at nutritional risk' due to one of the following criteria.

Comparison 1 All‐cause mortality ‐ end of intervention, Outcome 9 All‐cause mortality ‐ participants characterised as 'at nutritional risk' due to biomarkers or anthropometrics.

Comparison 1 All‐cause mortality ‐ end of intervention, Outcome 10 All‐cause mortality ‐ randomisation year.
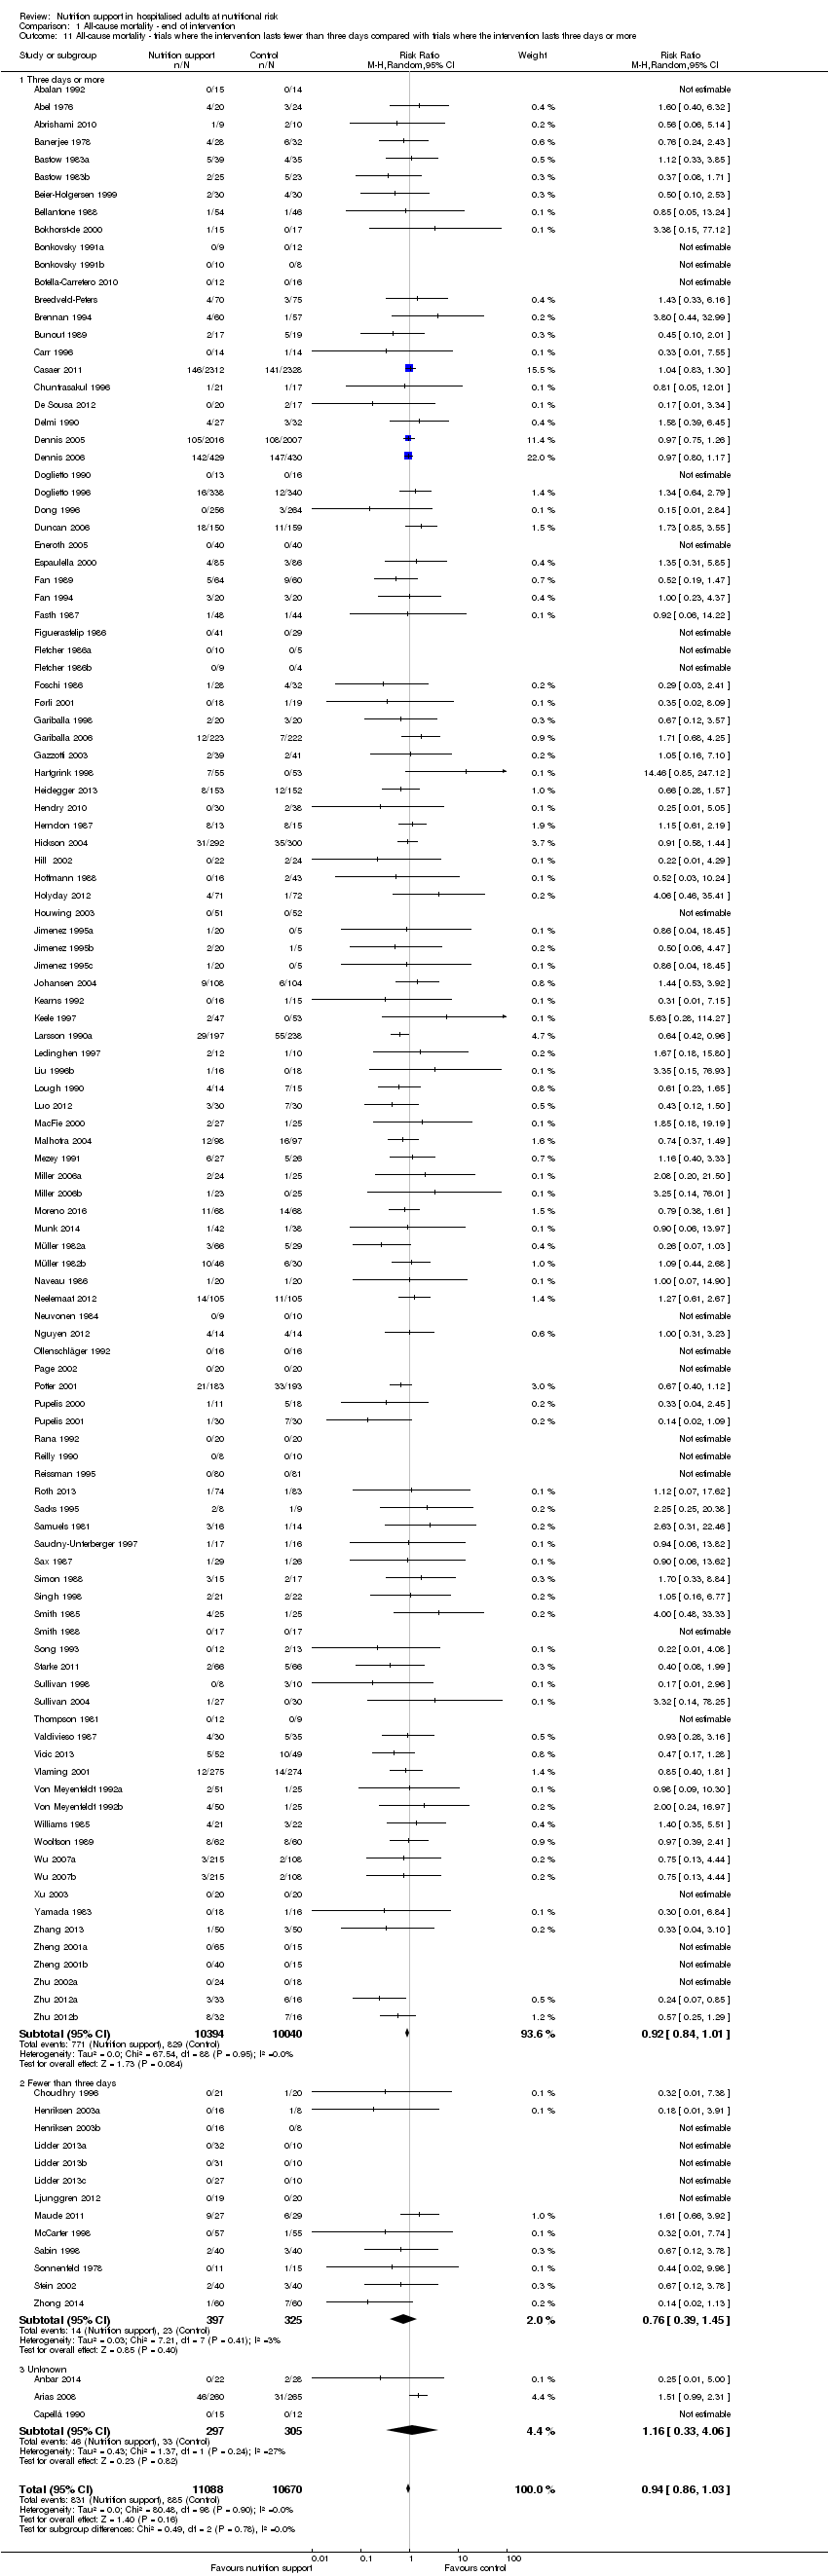
Comparison 1 All‐cause mortality ‐ end of intervention, Outcome 11 All‐cause mortality ‐ trials where the intervention lasts fewer than three days compared with trials where the intervention lasts three days or more.
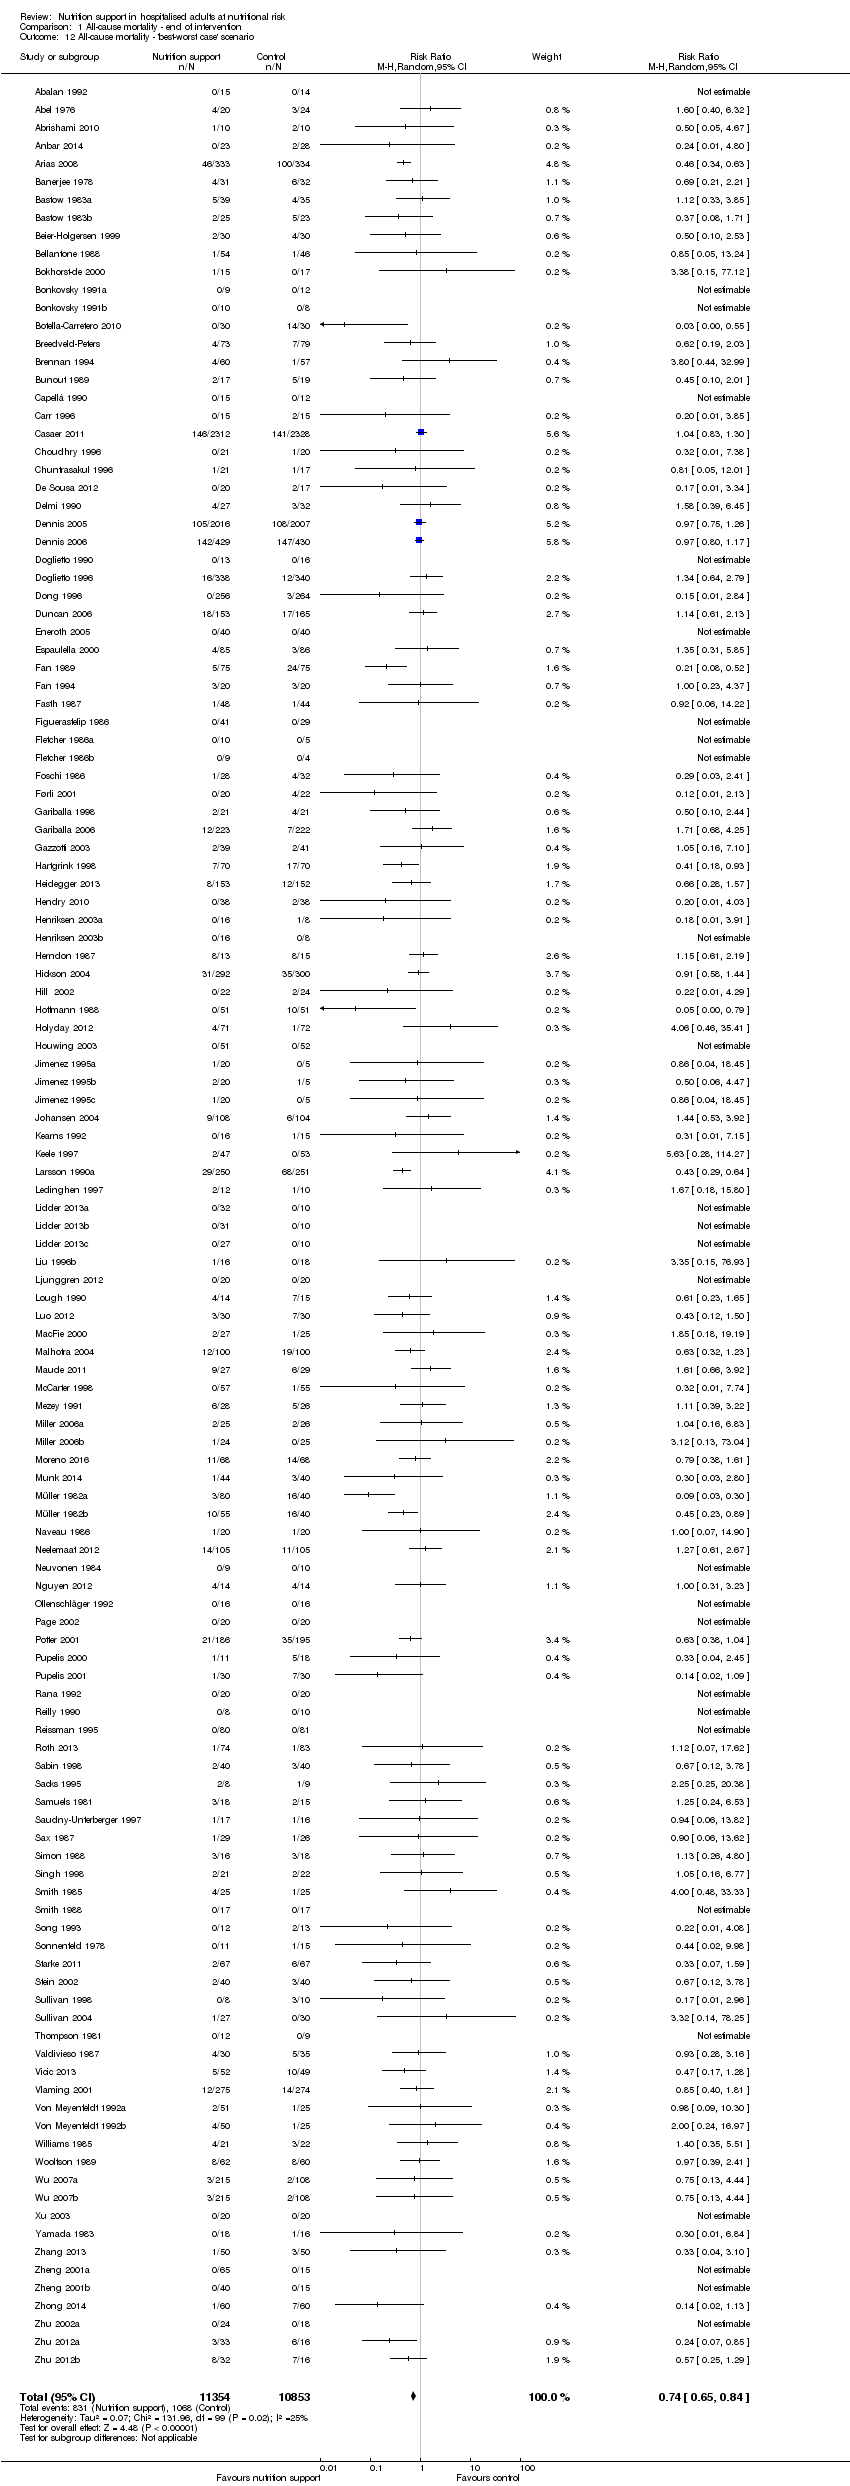
Comparison 1 All‐cause mortality ‐ end of intervention, Outcome 12 All‐cause mortality ‐ 'best‐worst case' scenario.

Comparison 1 All‐cause mortality ‐ end of intervention, Outcome 13 All‐cause mortality ‐ 'worst‐best case' scenario.

Comparison 1 All‐cause mortality ‐ end of intervention, Outcome 14 All‐cause mortality co‐interventions.

Comparison 2 All‐cause mortality ‐ maximum follow‐up, Outcome 1 All‐cause mortality ‐ overall.

Comparison 2 All‐cause mortality ‐ maximum follow‐up, Outcome 2 All‐cause mortality ‐ bias.

Comparison 2 All‐cause mortality ‐ maximum follow‐up, Outcome 3 All‐cause mortality ‐ mode of delivery.

Comparison 2 All‐cause mortality ‐ maximum follow‐up, Outcome 4 All‐cause mortality ‐ medical specialty.

Comparison 2 All‐cause mortality ‐ maximum follow‐up, Outcome 5 All‐cause mortality ‐ based on adequacy of the amount of calories.

Comparison 2 All‐cause mortality ‐ maximum follow‐up, Outcome 6 All‐cause mortality ‐ different screening tools.

Comparison 2 All‐cause mortality ‐ maximum follow‐up, Outcome 7 All‐cause mortality ‐ participants characterised as 'at nutritional risk' due to one of the following conditions.

Comparison 2 All‐cause mortality ‐ maximum follow‐up, Outcome 8 All‐cause mortality ‐ participants characterised as 'at nutritional risk' due to one of the following criteria.

Comparison 2 All‐cause mortality ‐ maximum follow‐up, Outcome 9 All‐cause mortality ‐ participants characterised as 'at nutritional risk' due to biomarkers or anthropometrics.

Comparison 2 All‐cause mortality ‐ maximum follow‐up, Outcome 10 All‐cause mortality ‐ randomisation year.

Comparison 2 All‐cause mortality ‐ maximum follow‐up, Outcome 11 All‐cause mortality ‐ trials where the intervention lasts fewer than three days compared with trials where the intervention lasts three days or more.

Comparison 2 All‐cause mortality ‐ maximum follow‐up, Outcome 12 All‐cause mortality ‐ 'best‐worst case' scenario.

Comparison 2 All‐cause mortality ‐ maximum follow‐up, Outcome 13 All‐cause mortality ‐ 'worst‐best case' scenario.

Comparison 2 All‐cause mortality ‐ maximum follow‐up, Outcome 14 All‐cause mortality co‐interventions.
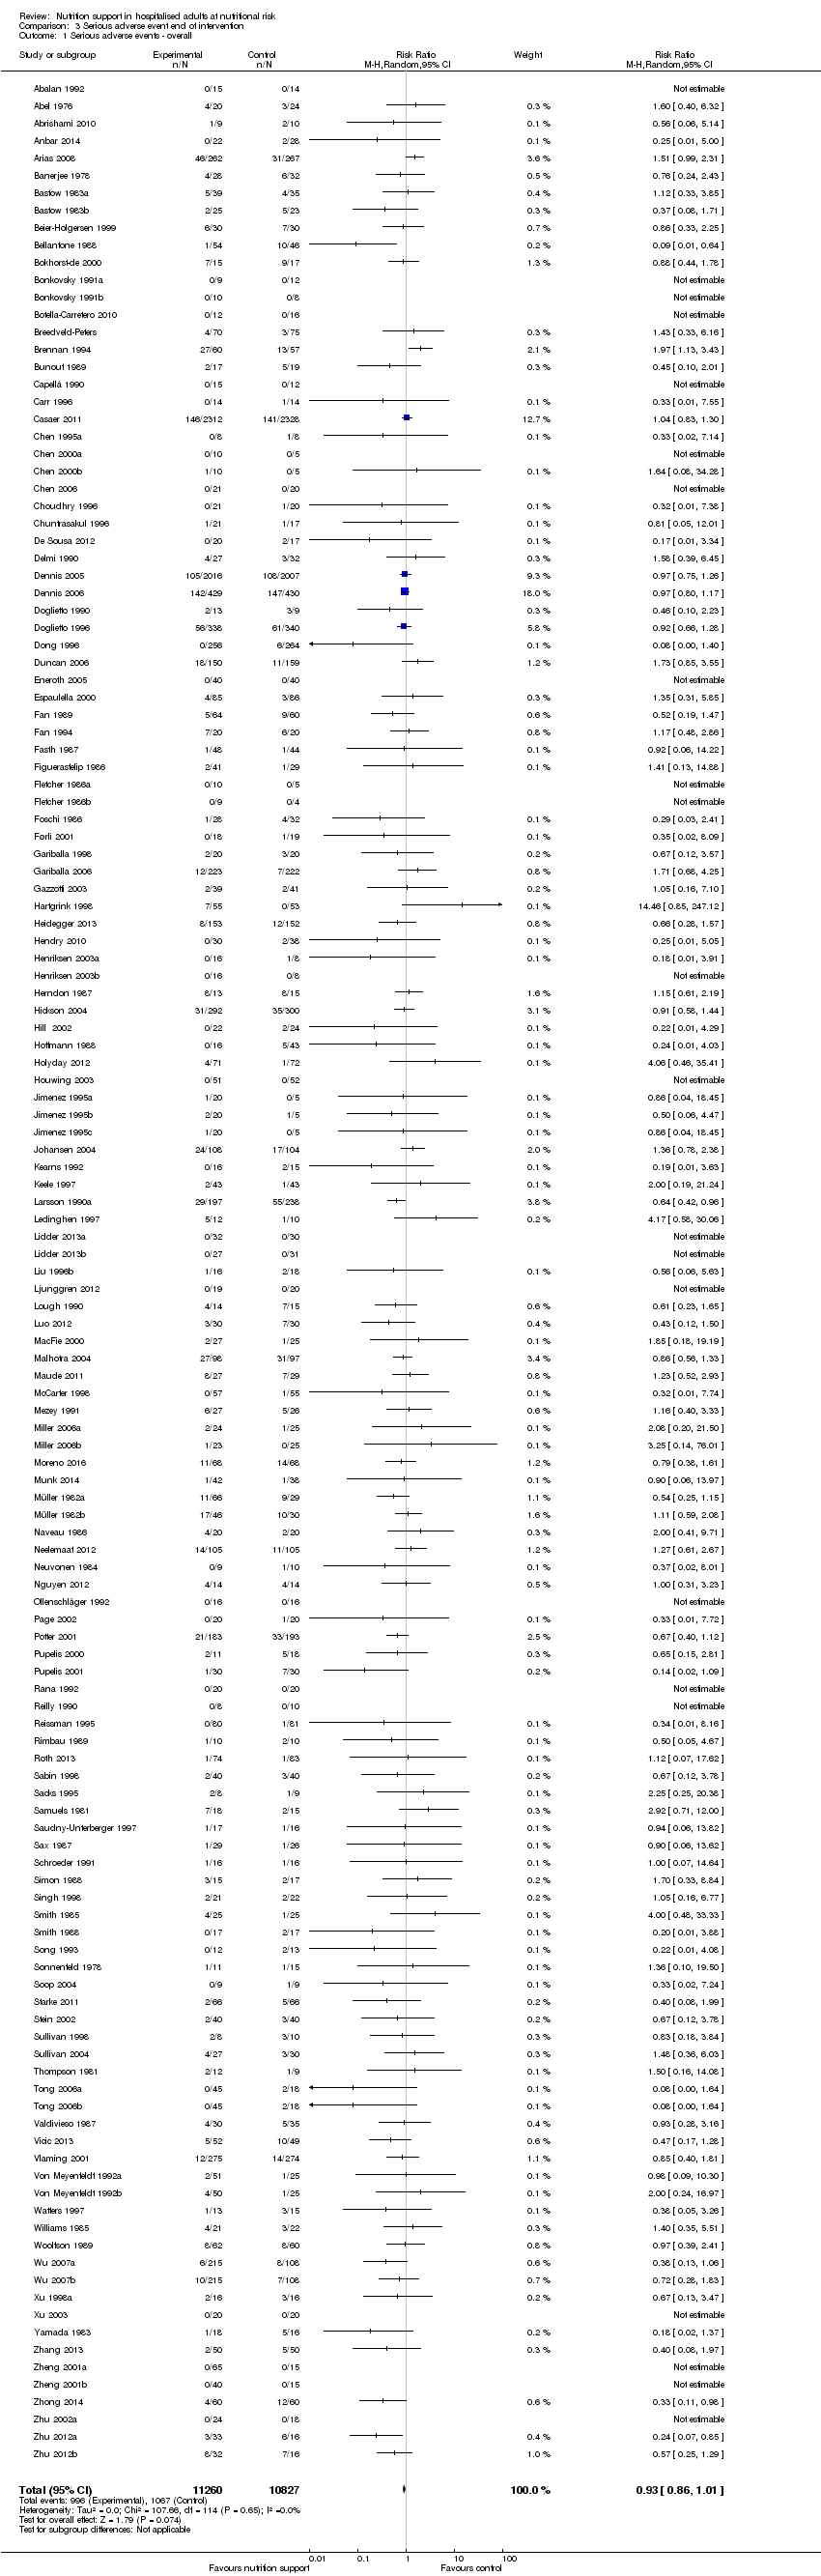
Comparison 3 Serious adverse event end of intervention, Outcome 1 Serious adverse events ‐ overall.

Comparison 3 Serious adverse event end of intervention, Outcome 2 Serious adverse events ‐ bias.

Comparison 3 Serious adverse event end of intervention, Outcome 3 Serious adverse events ‐ mode of delivery.

Comparison 3 Serious adverse event end of intervention, Outcome 4 Serious adverse events ‐ by medical specialty.

Comparison 3 Serious adverse event end of intervention, Outcome 5 Serious adverse events ‐ based on adequacy of the amount of calories.

Comparison 3 Serious adverse event end of intervention, Outcome 6 Serious adverse events ‐ different screening tools.

Comparison 3 Serious adverse event end of intervention, Outcome 7 Serious adverse events ‐ participants characterised as 'at nutritional risk' due to one of the following conditions.
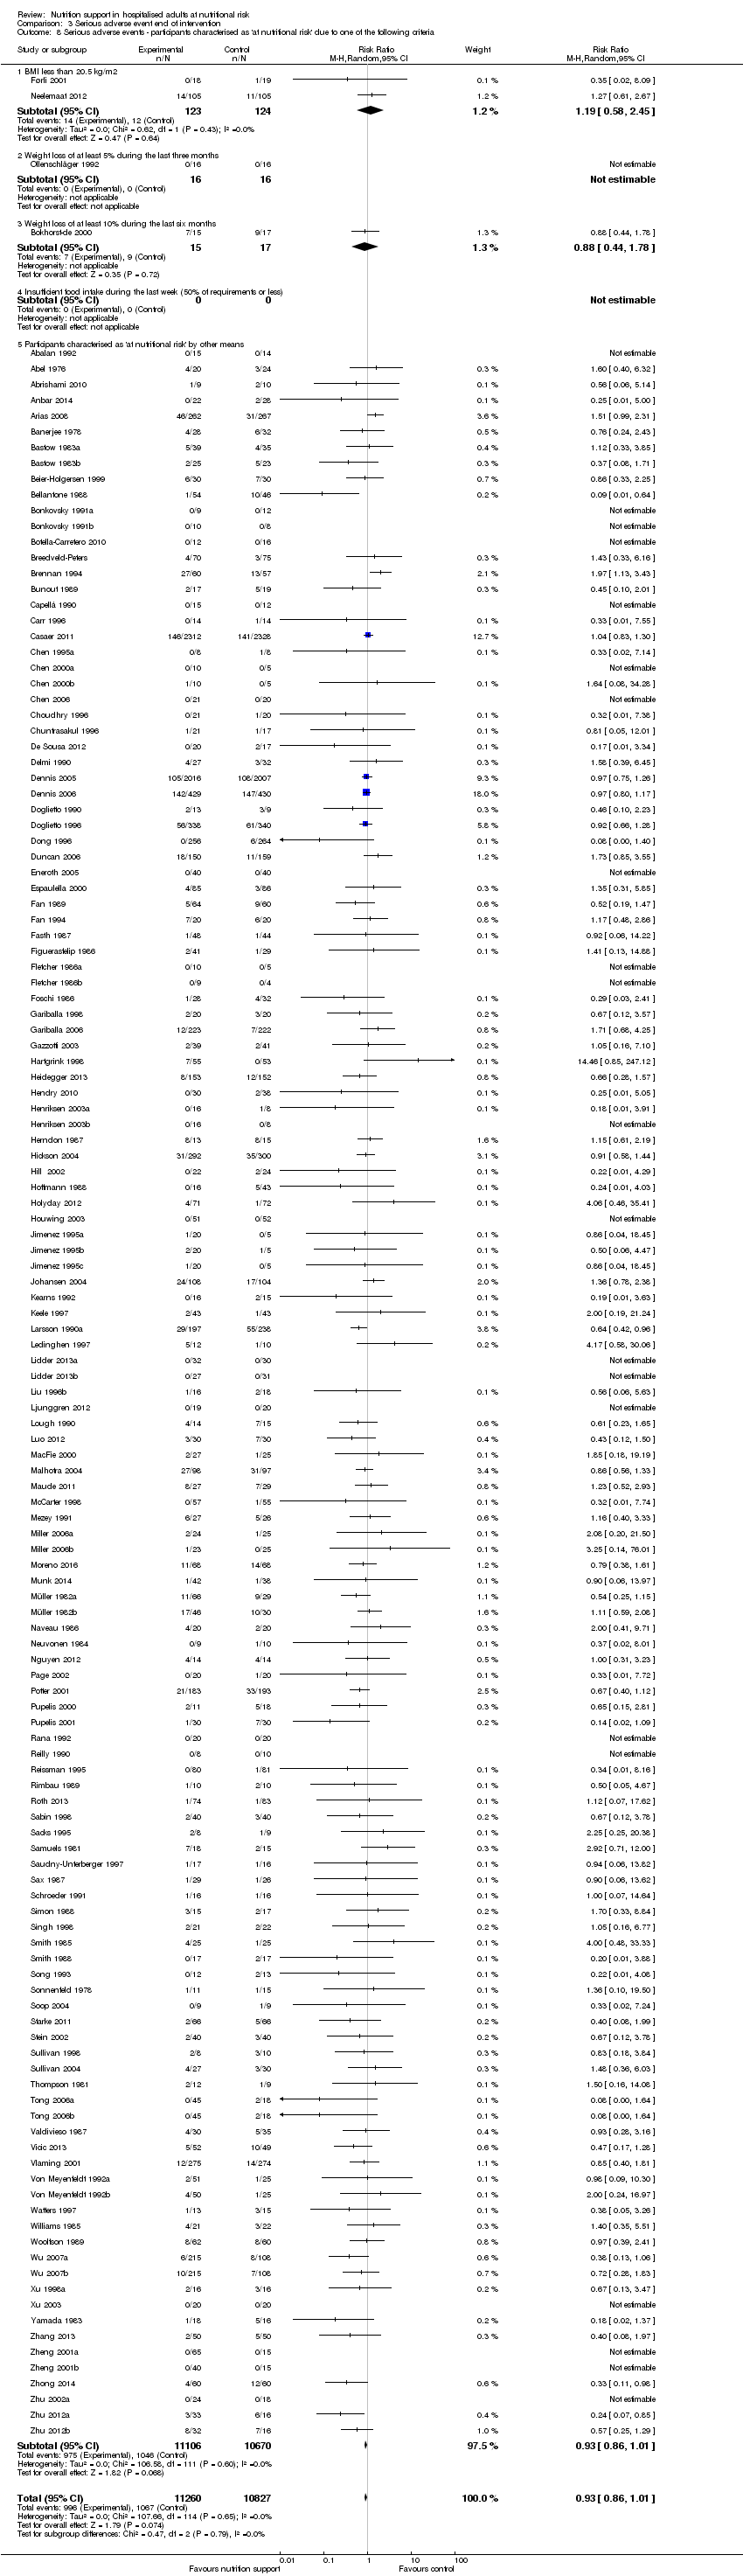
Comparison 3 Serious adverse event end of intervention, Outcome 8 Serious adverse events ‐ participants characterised as 'at nutritional risk' due to one of the following criteria.

Comparison 3 Serious adverse event end of intervention, Outcome 9 Serious adverse events ‐ participants characterised as 'at nutritional risk' due to biomarkers or anthropometrics.
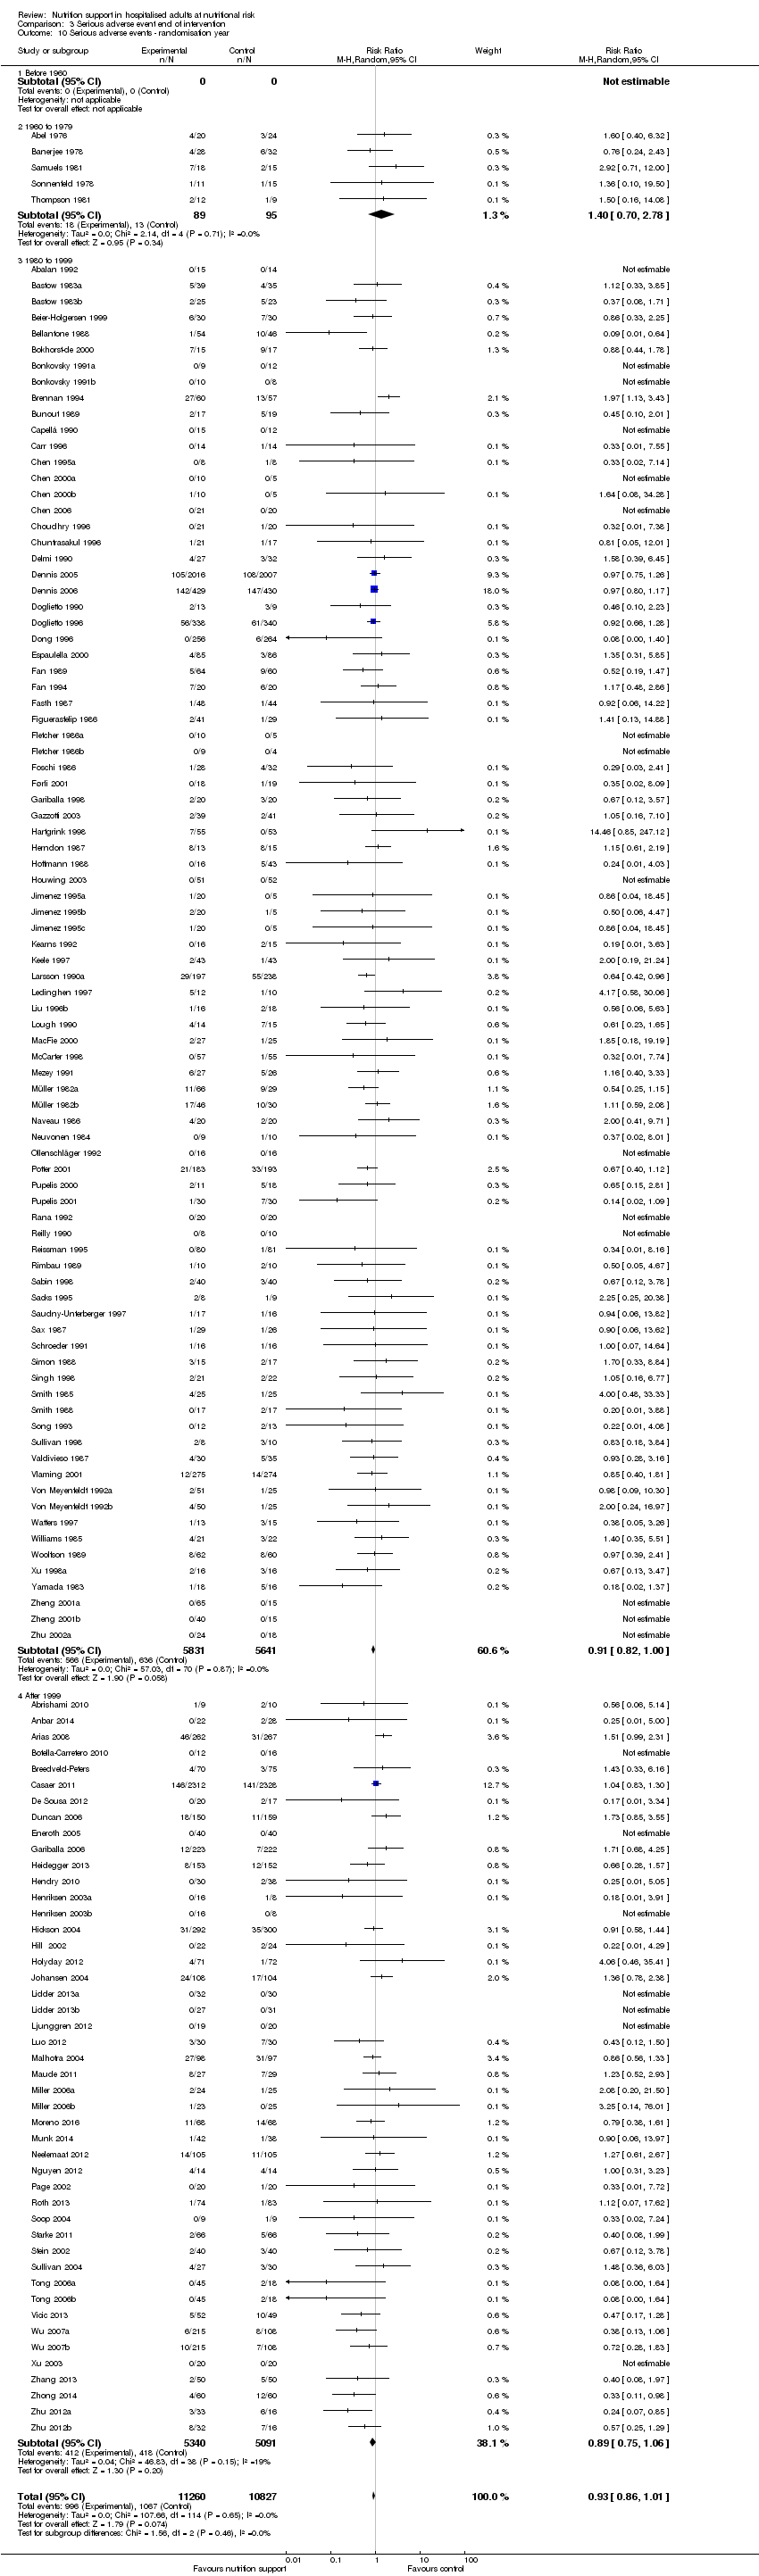
Comparison 3 Serious adverse event end of intervention, Outcome 10 Serious adverse events ‐ randomisation year.

Comparison 3 Serious adverse event end of intervention, Outcome 11 Serious adverse events ‐ trials where the intervention lasts fewer than three days compared with trials where the intervention lasts three days or more.

Comparison 3 Serious adverse event end of intervention, Outcome 12 Serious adverse events ‐ 'best‐worst case' scenario.

Comparison 3 Serious adverse event end of intervention, Outcome 13 Serious adverse events ‐ 'worst‐best case' scenario.

Comparison 3 Serious adverse event end of intervention, Outcome 14 Serious adverse events co‐interventions.
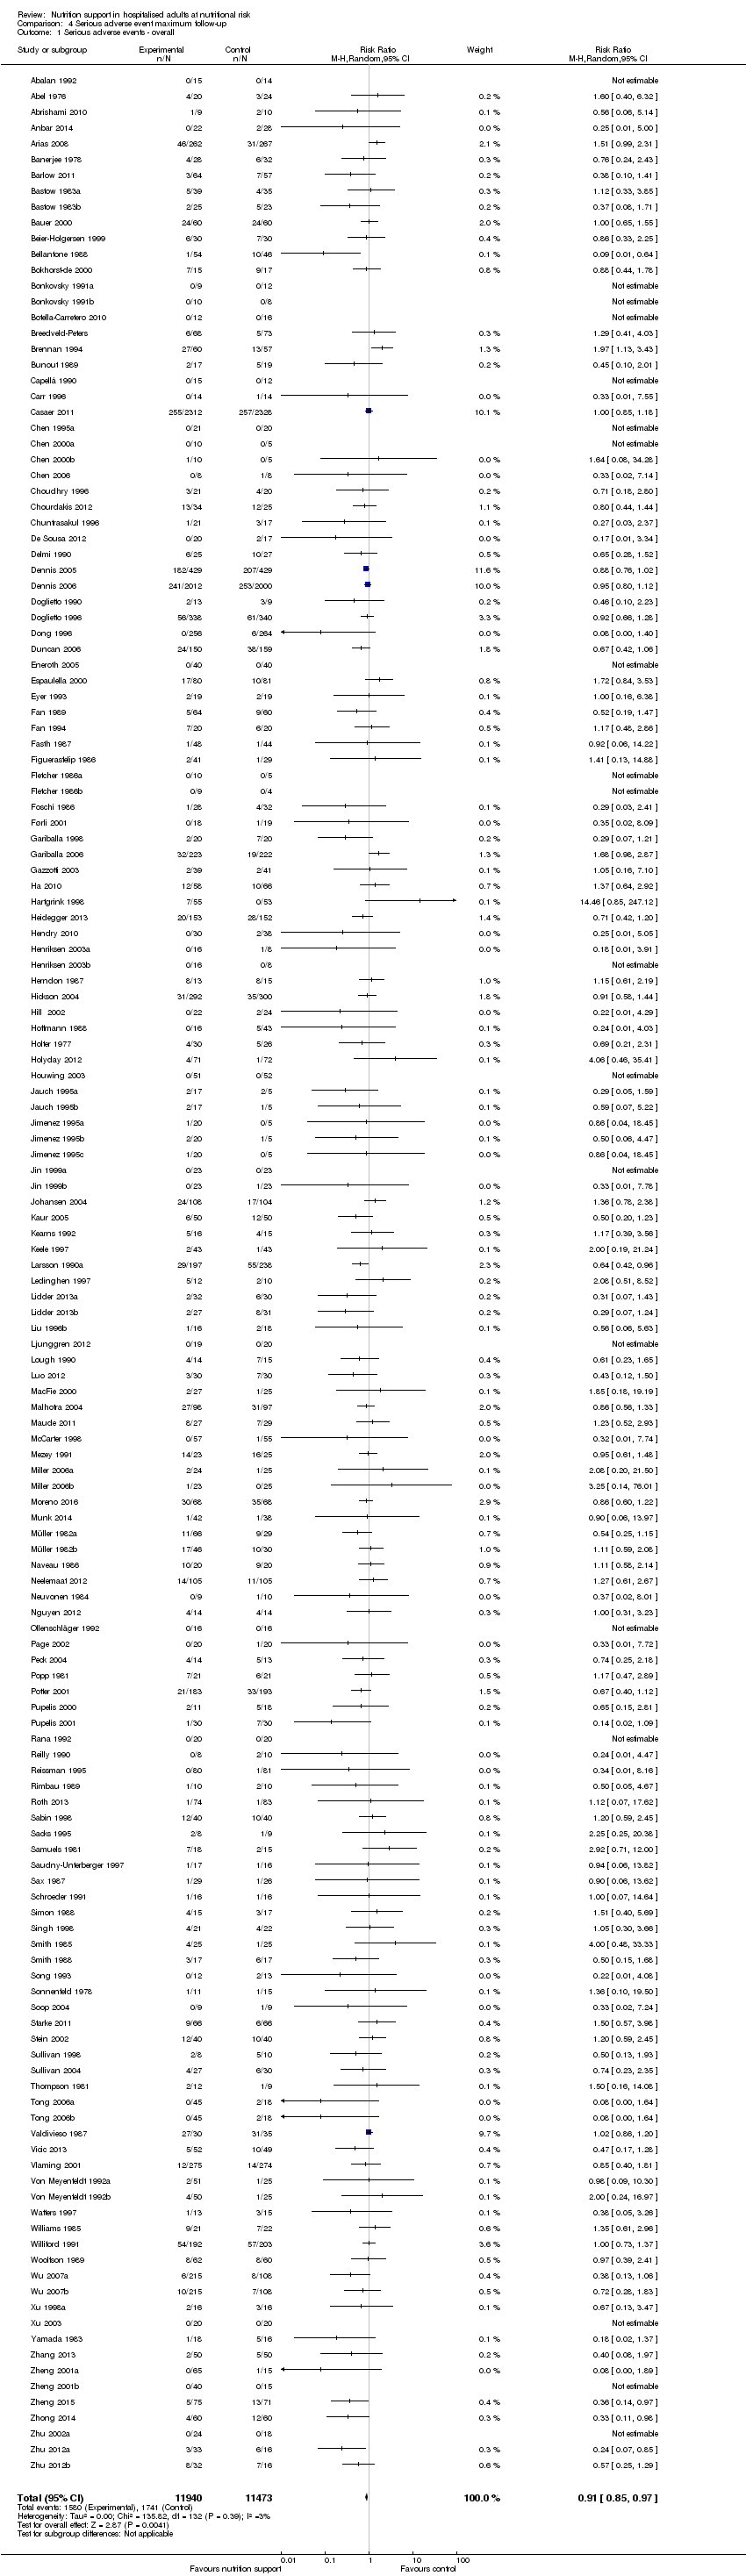
Comparison 4 Serious adverse event maximum follow‐up, Outcome 1 Serious adverse events ‐ overall.

Comparison 4 Serious adverse event maximum follow‐up, Outcome 2 Serious adverse events ‐ bias.

Comparison 4 Serious adverse event maximum follow‐up, Outcome 3 Serious adverse events ‐ mode of delivery.

Comparison 4 Serious adverse event maximum follow‐up, Outcome 4 Serious adverse events ‐ by medical specialty.

Comparison 4 Serious adverse event maximum follow‐up, Outcome 5 Serious adverse events ‐ based on adequacy of the amount of calories.

Comparison 4 Serious adverse event maximum follow‐up, Outcome 6 Serious adverse events ‐ different screening tools.
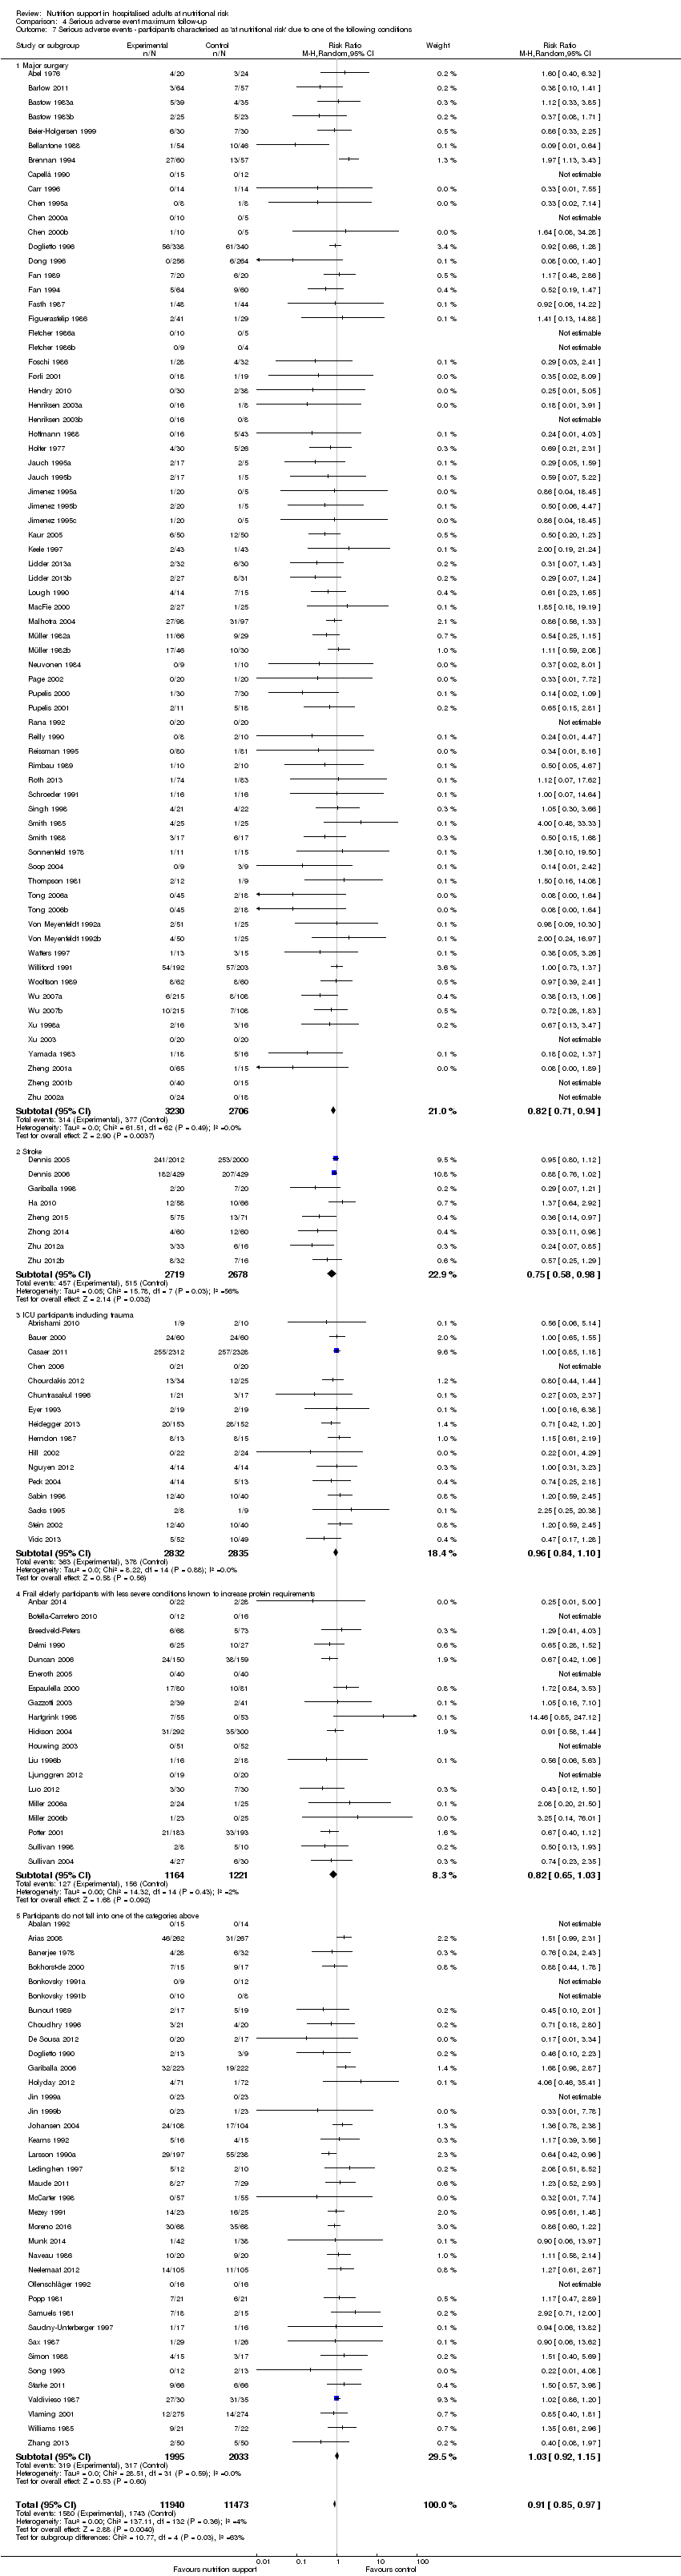
Comparison 4 Serious adverse event maximum follow‐up, Outcome 7 Serious adverse events ‐ participants characterised as 'at nutritional risk' due to one of the following conditions.
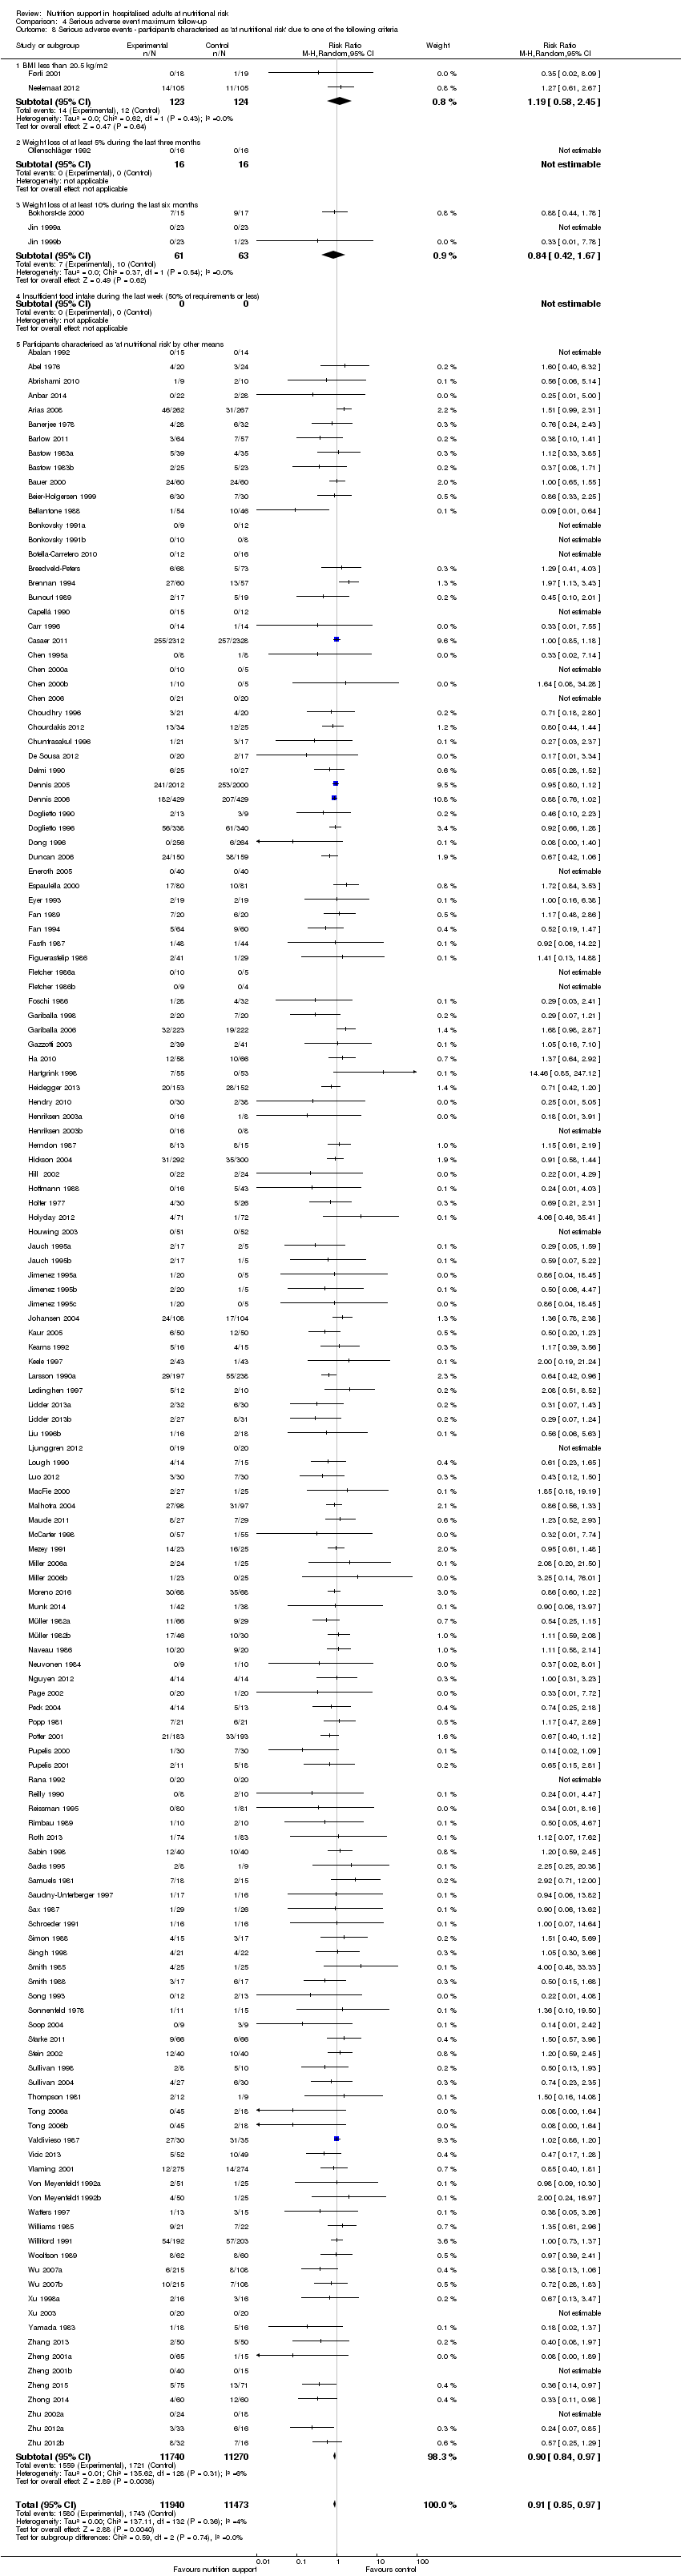
Comparison 4 Serious adverse event maximum follow‐up, Outcome 8 Serious adverse events ‐ participants characterised as 'at nutritional risk' due to one of the following criteria.

Comparison 4 Serious adverse event maximum follow‐up, Outcome 9 Serious adverse events ‐ participants characterised as 'at nutritional risk' due to biomarkers or anthropometrics.

Comparison 4 Serious adverse event maximum follow‐up, Outcome 10 Serious adverse events ‐ randomisation year.

Comparison 4 Serious adverse event maximum follow‐up, Outcome 11 Serious adverse events ‐ trials where the intervention lasts fewer than three days compared with trials where the intervention lasts three days or more.

Comparison 4 Serious adverse event maximum follow‐up, Outcome 12 Serious adverse events ‐ 'best‐worst case' scenario.

Comparison 4 Serious adverse event maximum follow‐up, Outcome 13 Serious adverse events ‐ 'worst‐best case' scenario.

Comparison 4 Serious adverse event maximum follow‐up, Outcome 14 Serious adverse events co‐interventions.

Comparison 4 Serious adverse event maximum follow‐up, Outcome 15 Serious adverse events ‐ 'best‐worse case' scenario (enteral nutrition).

Comparison 4 Serious adverse event maximum follow‐up, Outcome 16 Serious adverse events ‐ 'worst‐best case' scenario (enteral nutrition).

Comparison 5 Quality of life (SF36 ‐ Physical performance) ‐ end of intervention, Outcome 1 Quality of life ‐ overall.

Comparison 6 Quality of life (SF36 ‐ Physical performance) ‐ maximum follow‐up, Outcome 1 Quality of life ‐ overall.

Comparison 7 Quality of life (SF36 ‐ Mental performance ‐ end of intervention, Outcome 1 Quality of life ‐ overall.

Comparison 8 Quality of life (SF36 ‐ Mental performance) ‐ maximum follow‐up, Outcome 1 Quality of life ‐ overall.

Comparison 9 Quality of life (EuroQoL) ‐ maximum follow‐up, Outcome 1 Quality of life ‐ overall.

Comparison 10 Pneumonia, Outcome 1 Pneumonia.
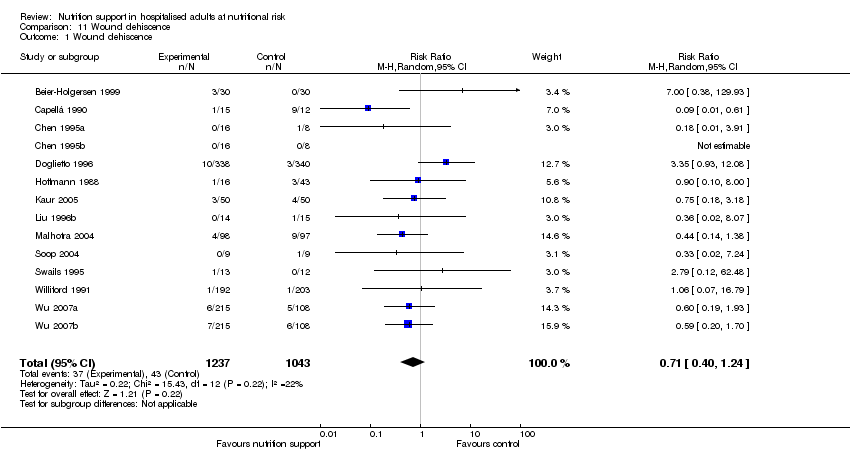
Comparison 11 Wound dehiscence, Outcome 1 Wound dehiscence.

Comparison 12 Renal failure, Outcome 1 Renal failure.
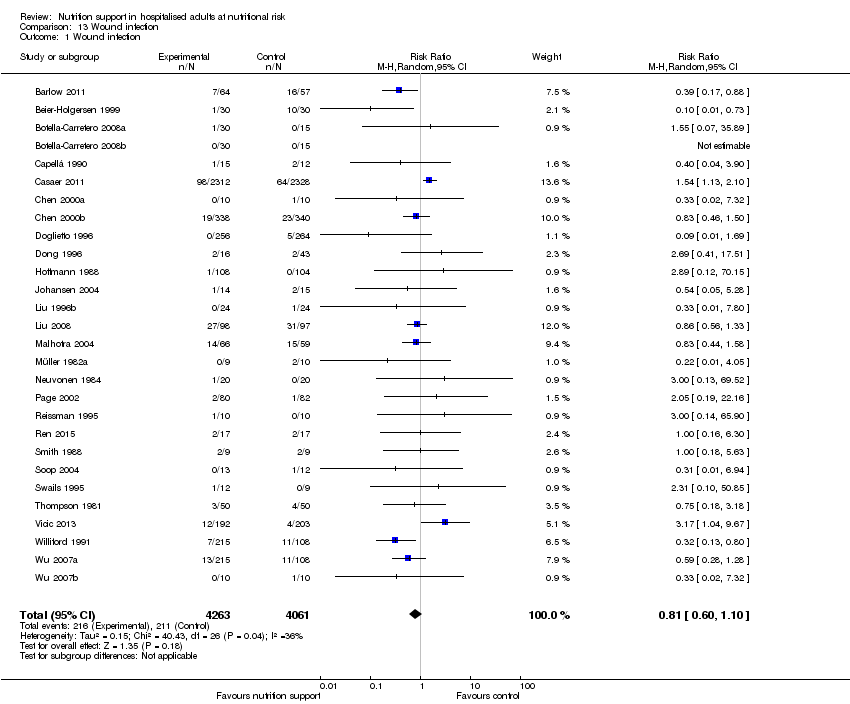
Comparison 13 Wound infection, Outcome 1 Wound infection.

Comparison 14 Heart failure, Outcome 1 Heart failure.

Comparison 15 Clearly adequate and screening tool, Outcome 1 AcM ‐ EoI.

Comparison 15 Clearly adequate and screening tool, Outcome 2 AcM ‐ MF.

Comparison 15 Clearly adequate and screening tool, Outcome 3 SaE ‐ EoI.

Comparison 15 Clearly adequate and screening tool, Outcome 4 SaE ‐ MF.

Comparison 16 Clearly adequate + (NRS component/at risk due to condition), Outcome 1 AcM ‐ EoI.

Comparison 16 Clearly adequate + (NRS component/at risk due to condition), Outcome 2 AcM ‐ MF.

Comparison 16 Clearly adequate + (NRS component/at risk due to condition), Outcome 3 SaE ‐ EoI.
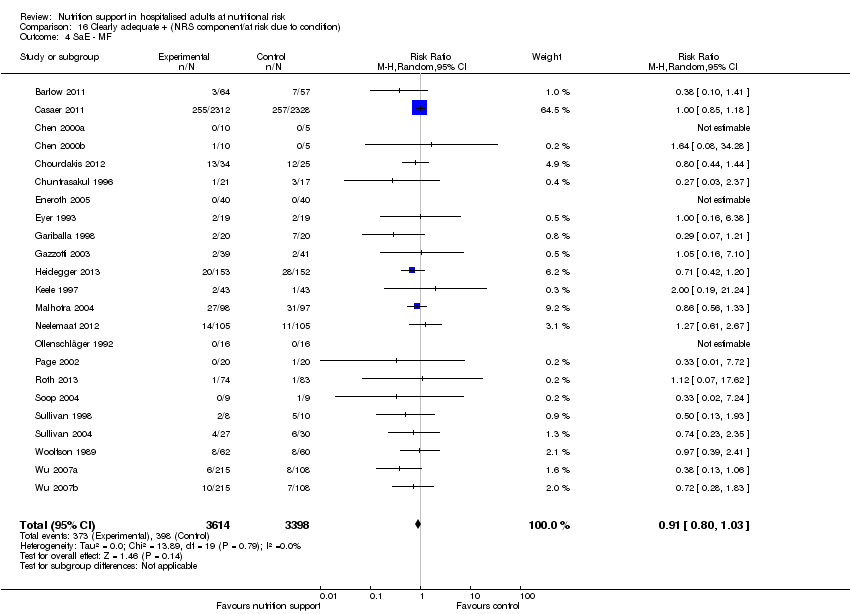
Comparison 16 Clearly adequate + (NRS component/at risk due to condition), Outcome 4 SaE ‐ MF.

Comparison 17 Oral ‐ All cause mortality ‐ end of intervention, Outcome 1 All‐cause mortality ‐ overall.

Comparison 17 Oral ‐ All cause mortality ‐ end of intervention, Outcome 2 All‐cause mortality ‐ bias.

Comparison 17 Oral ‐ All cause mortality ‐ end of intervention, Outcome 3 All‐cause mortality ‐ medical speciality.

Comparison 17 Oral ‐ All cause mortality ‐ end of intervention, Outcome 4 All‐cause mortality ‐ based on adequacy of the amount of calories.

Comparison 17 Oral ‐ All cause mortality ‐ end of intervention, Outcome 5 All‐cause mortality ‐ different screening tools.

Comparison 17 Oral ‐ All cause mortality ‐ end of intervention, Outcome 6 All‐cause mortality ‐ participants characterised as 'at nutritional risk' due to one of the following conditions.

Comparison 17 Oral ‐ All cause mortality ‐ end of intervention, Outcome 7 All‐cause mortality ‐ participants characterised as 'at nutritional risk' due to one of the following criteria.

Comparison 17 Oral ‐ All cause mortality ‐ end of intervention, Outcome 8 All‐cause mortality ‐ participants characterised as 'at nutritional risk' due to biomarkers or anthropometrics.

Comparison 17 Oral ‐ All cause mortality ‐ end of intervention, Outcome 9 All‐cause mortality ‐ randomisation year.
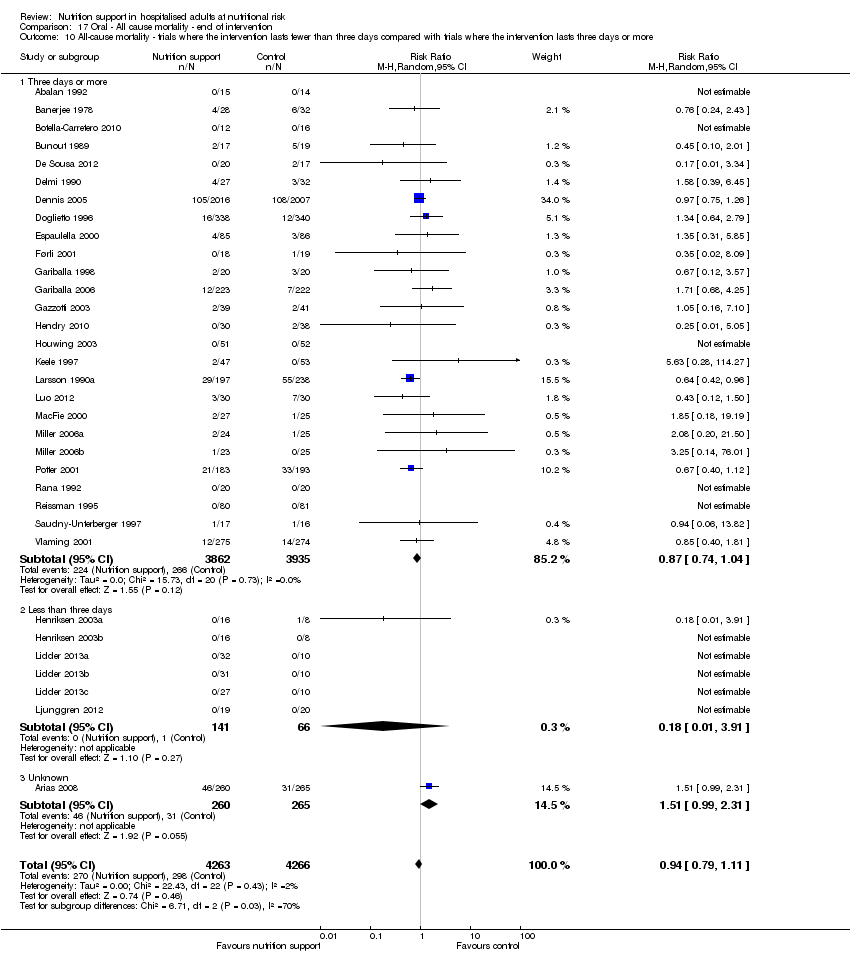
Comparison 17 Oral ‐ All cause mortality ‐ end of intervention, Outcome 10 All‐cause mortality ‐ trials where the intervention lasts fewer than three days compared with trials where the intervention lasts three days or more.

Comparison 17 Oral ‐ All cause mortality ‐ end of intervention, Outcome 11 All‐cause mortality ‐ 'best‐worst case' scenario.

Comparison 17 Oral ‐ All cause mortality ‐ end of intervention, Outcome 12 All‐cause mortality ‐ 'worst‐best case' scenario.
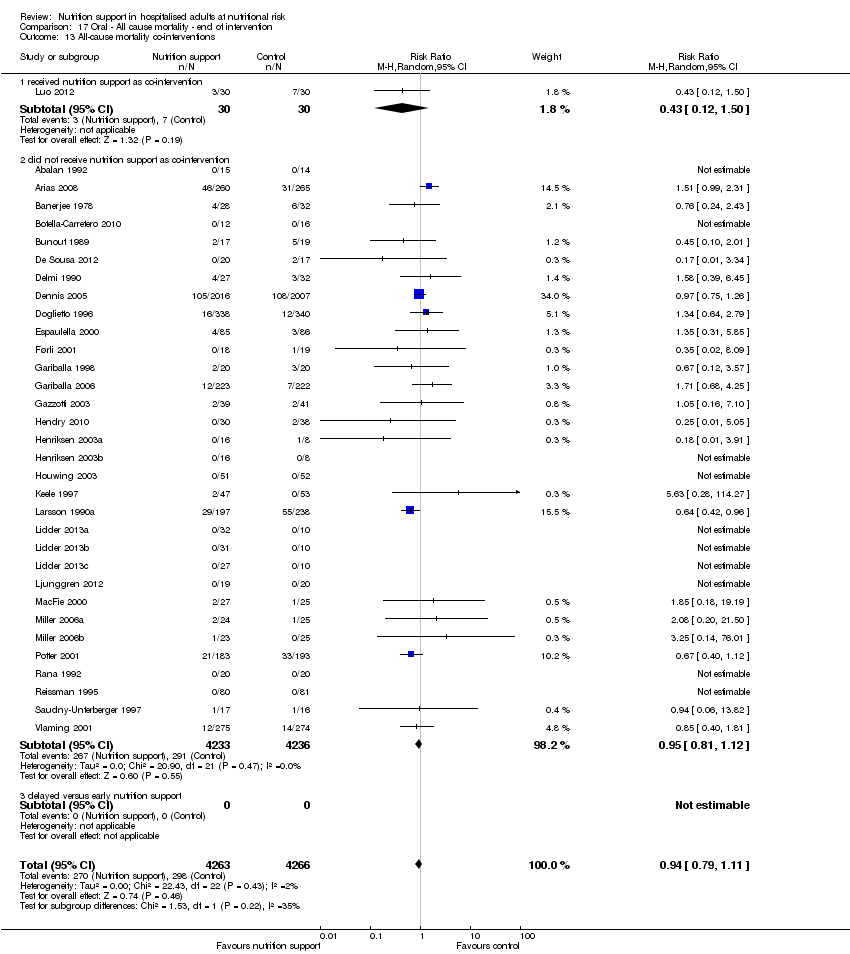
Comparison 17 Oral ‐ All cause mortality ‐ end of intervention, Outcome 13 All‐cause mortality co‐interventions.

Comparison 18 Oral ‐ All cause mortality ‐ maximum follow‐up, Outcome 1 All‐cause mortality ‐ overall.

Comparison 18 Oral ‐ All cause mortality ‐ maximum follow‐up, Outcome 2 All‐cause mortality ‐ bias.

Comparison 18 Oral ‐ All cause mortality ‐ maximum follow‐up, Outcome 3 All‐cause mortality ‐ medical speciality.
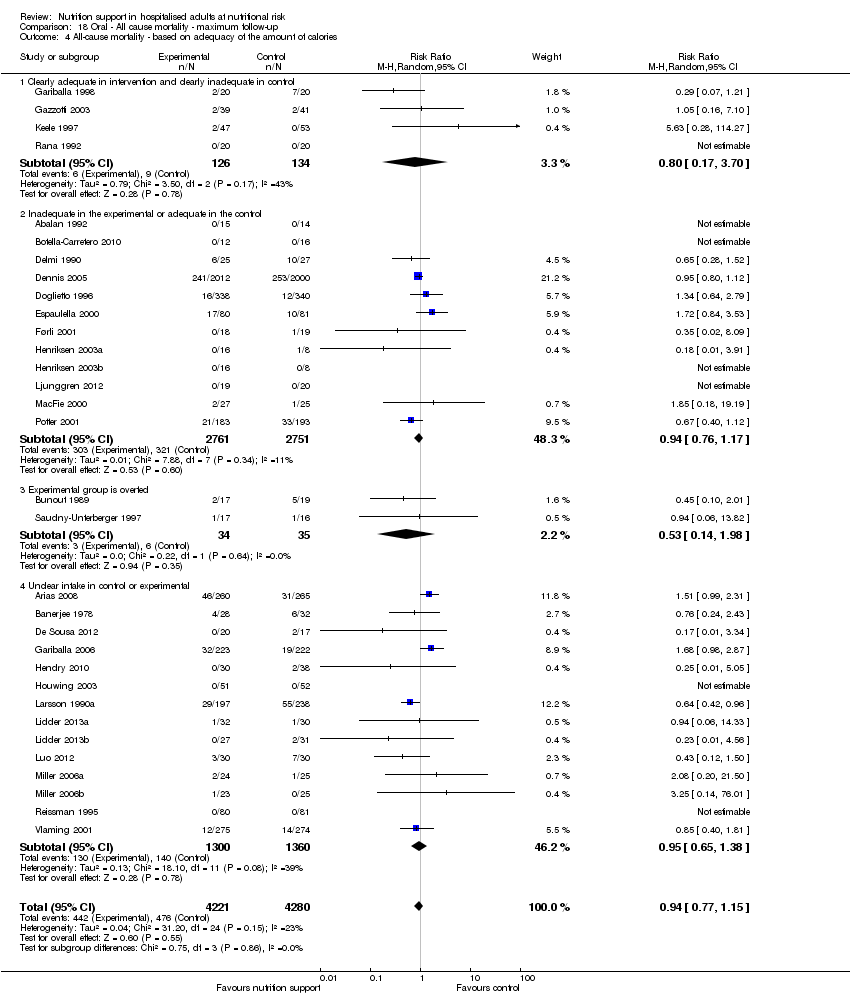
Comparison 18 Oral ‐ All cause mortality ‐ maximum follow‐up, Outcome 4 All‐cause mortality ‐ based on adequacy of the amount of calories.

Comparison 18 Oral ‐ All cause mortality ‐ maximum follow‐up, Outcome 5 All‐cause mortality ‐ different screening tools.
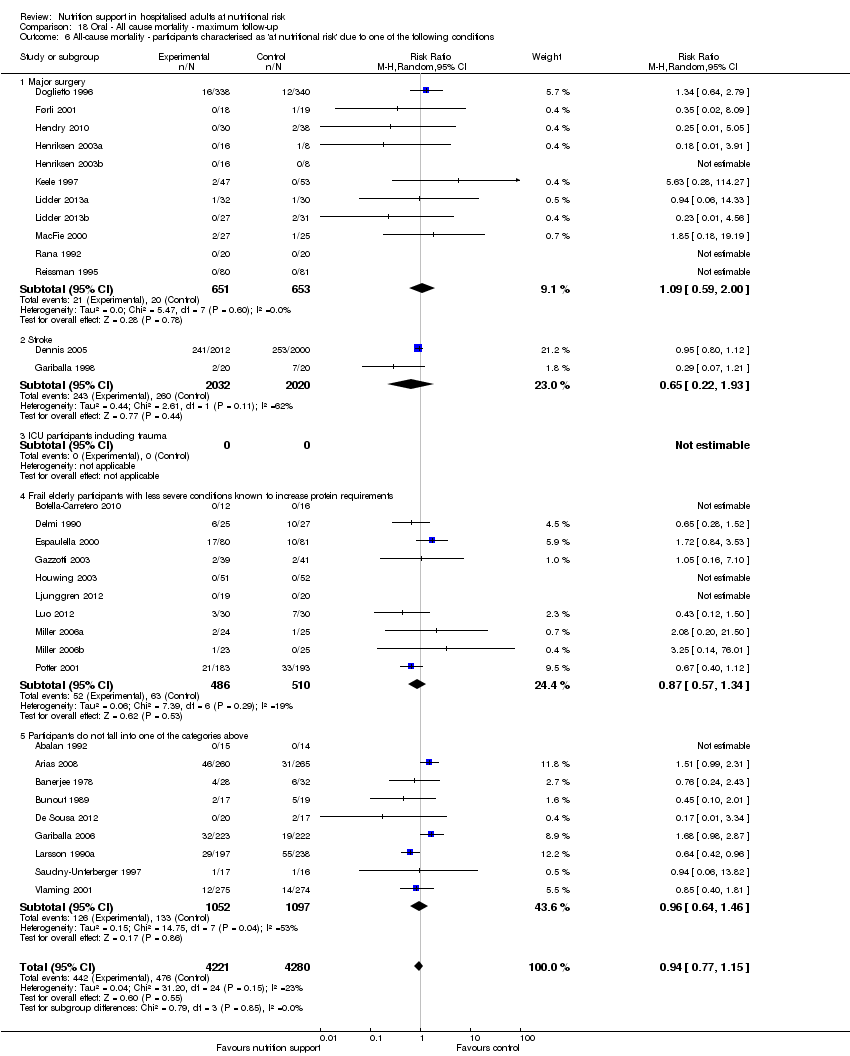
Comparison 18 Oral ‐ All cause mortality ‐ maximum follow‐up, Outcome 6 All‐cause mortality ‐ participants characterised as 'at nutritional risk' due to one of the following conditions.
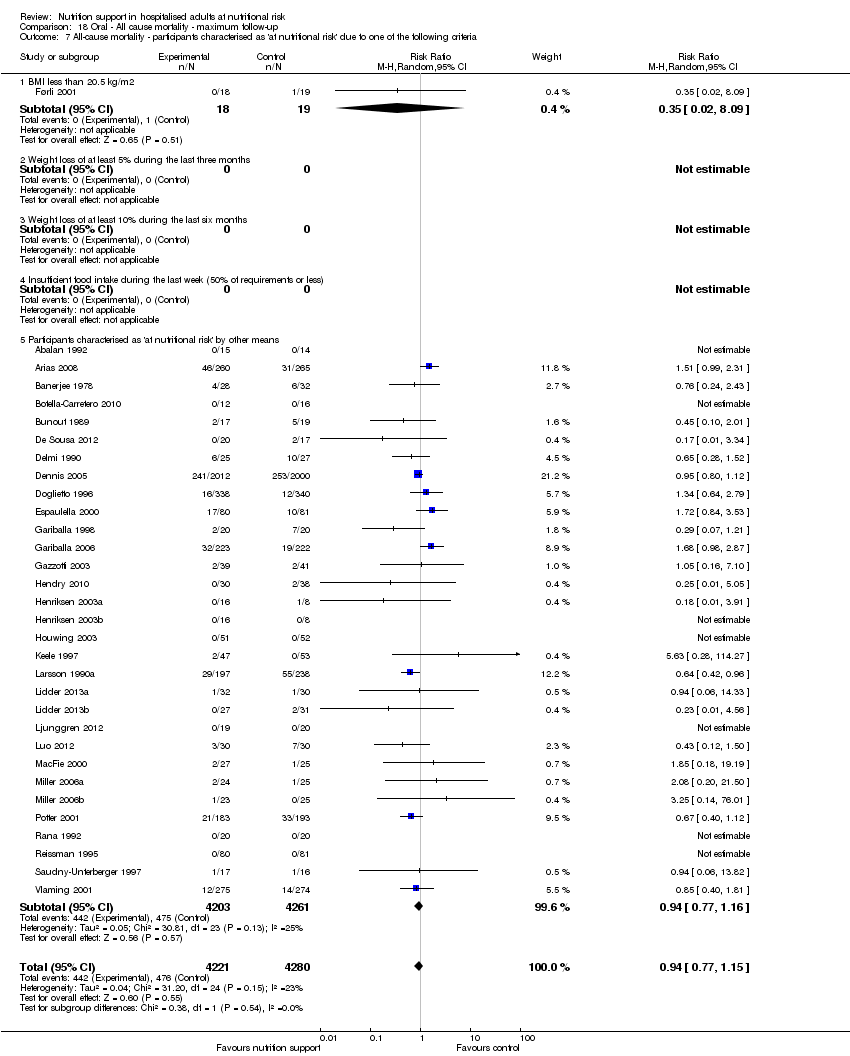
Comparison 18 Oral ‐ All cause mortality ‐ maximum follow‐up, Outcome 7 All‐cause mortality ‐ participants characterised as 'at nutritional risk' due to one of the following criteria.

Comparison 18 Oral ‐ All cause mortality ‐ maximum follow‐up, Outcome 8 All‐cause mortality ‐ participants characterised as 'at nutritional risk' due to biomarkers or anthropometrics.

Comparison 18 Oral ‐ All cause mortality ‐ maximum follow‐up, Outcome 9 All‐cause mortality ‐ randomisation year.

Comparison 18 Oral ‐ All cause mortality ‐ maximum follow‐up, Outcome 10 All‐cause mortality ‐ trials where the intervention lasts fewer than three days compared with trials where the intervention lasts three days or more.

Comparison 18 Oral ‐ All cause mortality ‐ maximum follow‐up, Outcome 11 All‐cause mortality ‐ 'best‐worst case' scenario.
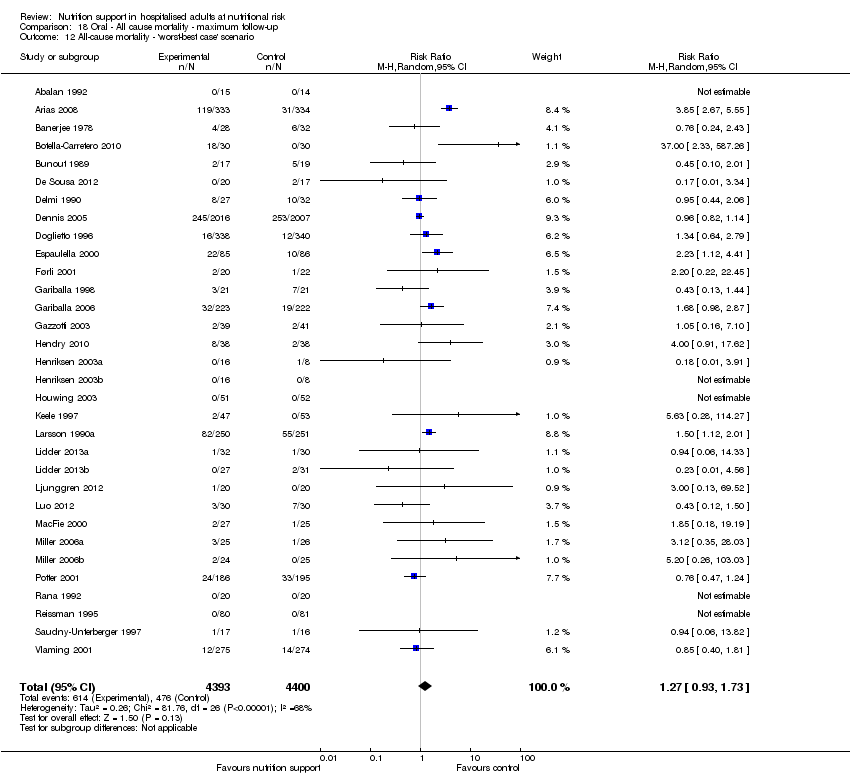
Comparison 18 Oral ‐ All cause mortality ‐ maximum follow‐up, Outcome 12 All‐cause mortality ‐ 'worst‐best case' scenario.

Comparison 18 Oral ‐ All cause mortality ‐ maximum follow‐up, Outcome 13 All‐cause mortality co‐interventions.

Comparison 19 Oral ‐ Serious adverse event end of intervention, Outcome 1 Serious adverse events ‐ overall.

Comparison 19 Oral ‐ Serious adverse event end of intervention, Outcome 2 Serious adverse events ‐ bias.
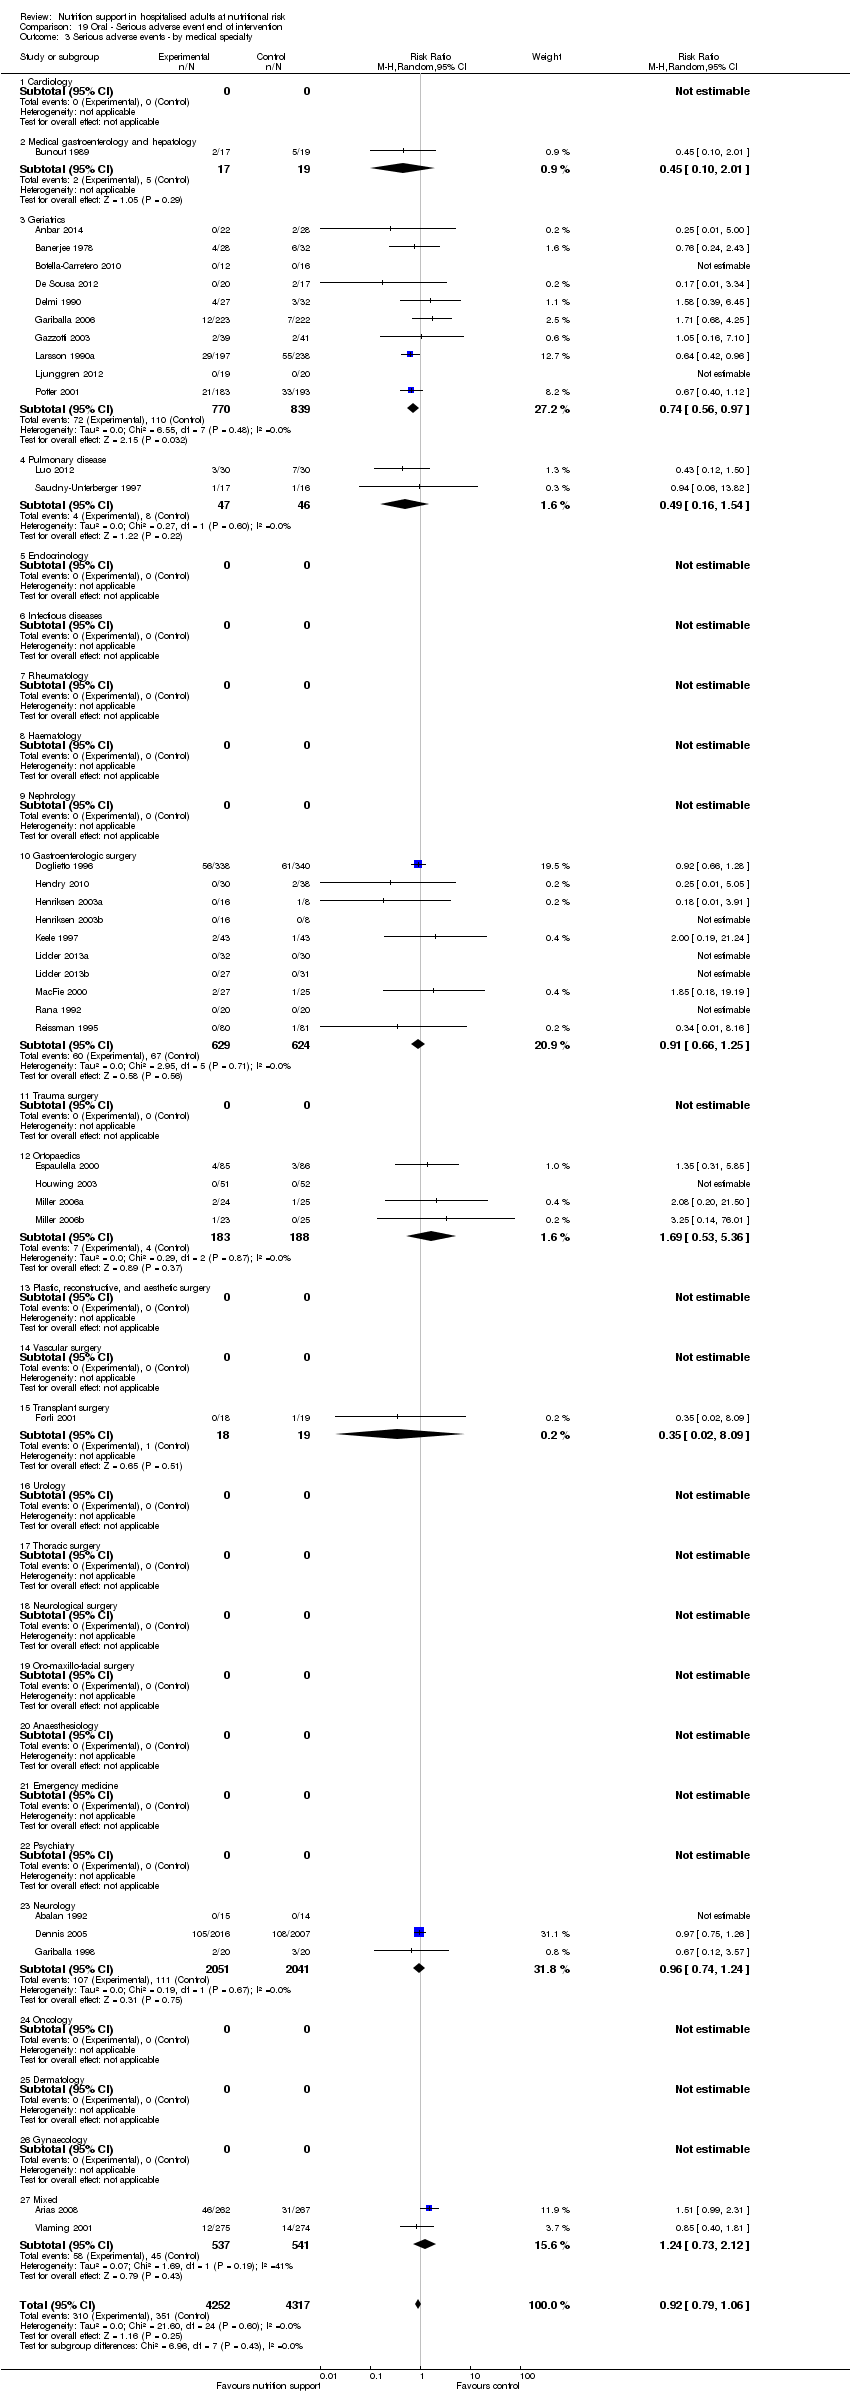
Comparison 19 Oral ‐ Serious adverse event end of intervention, Outcome 3 Serious adverse events ‐ by medical specialty.
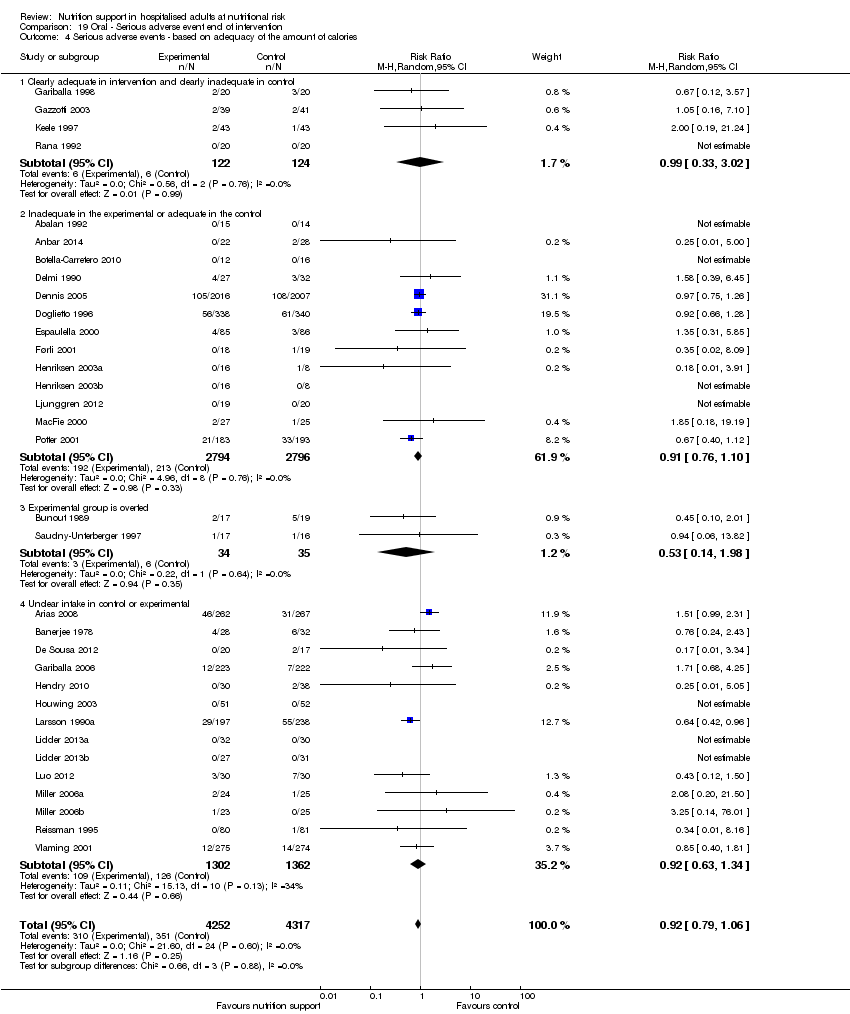
Comparison 19 Oral ‐ Serious adverse event end of intervention, Outcome 4 Serious adverse events ‐ based on adequacy of the amount of calories.
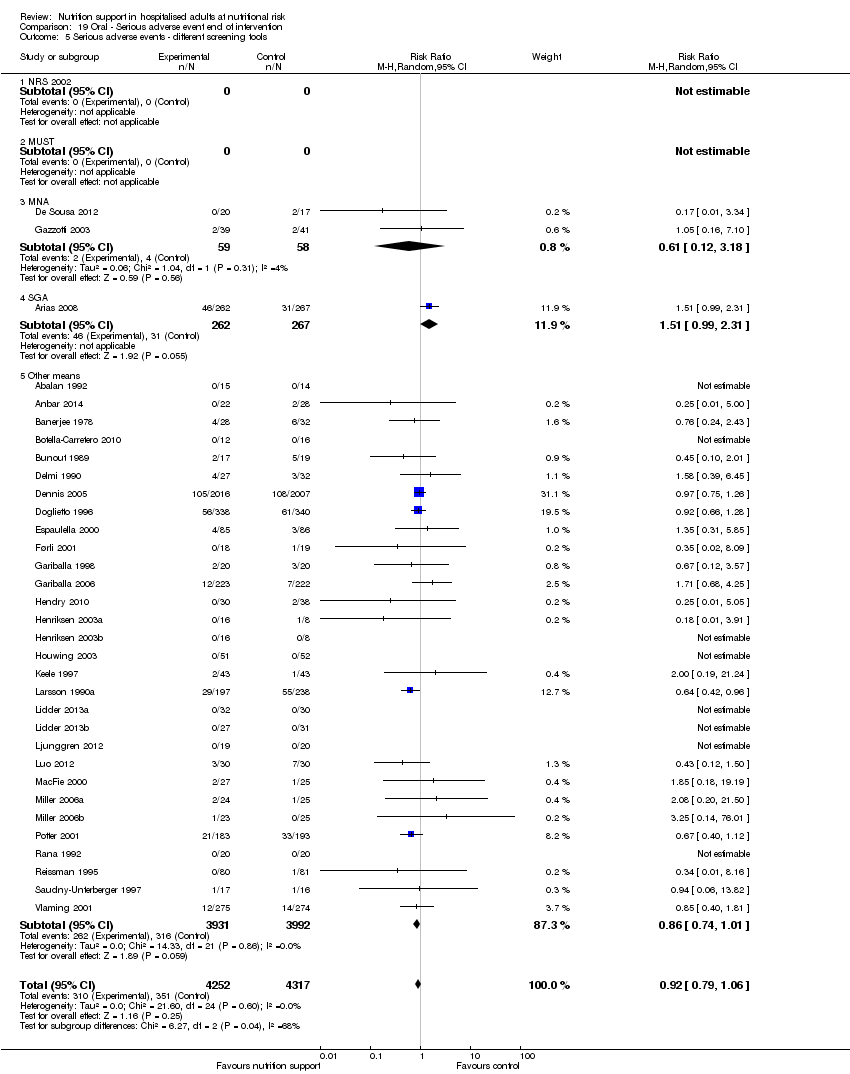
Comparison 19 Oral ‐ Serious adverse event end of intervention, Outcome 5 Serious adverse events ‐ different screening tools.

Comparison 19 Oral ‐ Serious adverse event end of intervention, Outcome 6 Serious adverse events ‐ participants characterised as 'at nutritional risk' due to one of the following conditions.
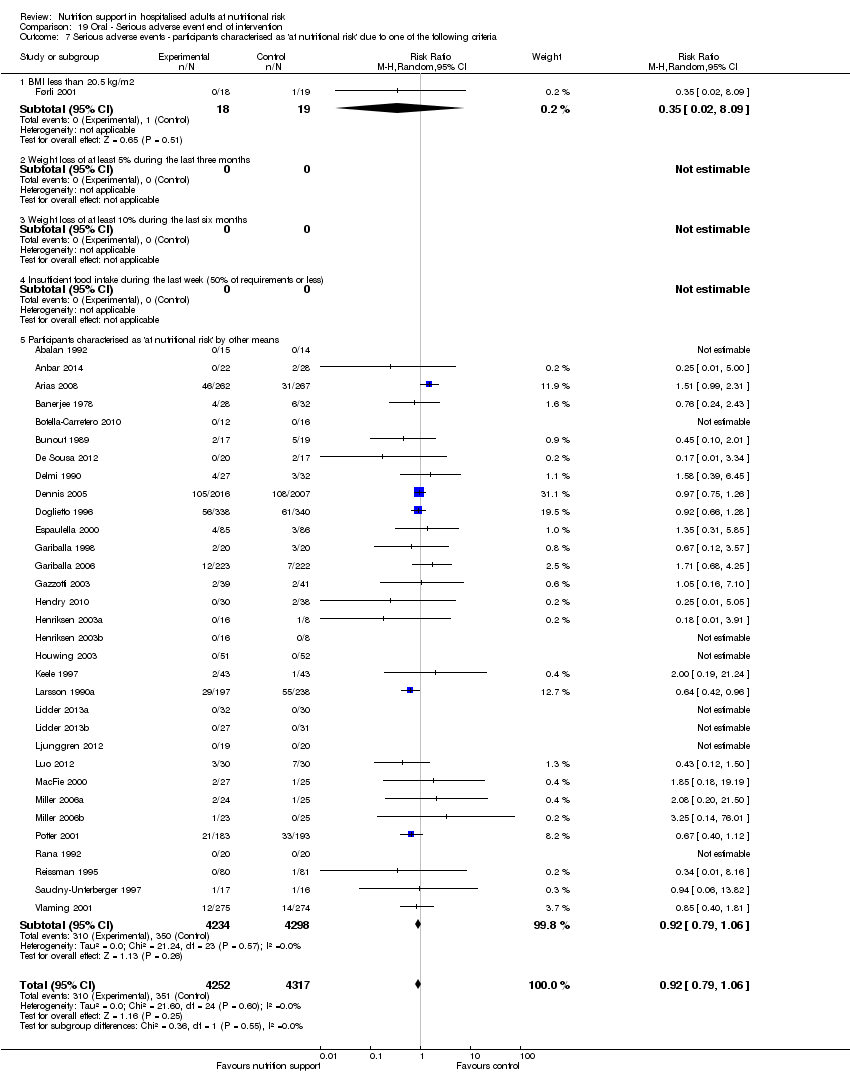
Comparison 19 Oral ‐ Serious adverse event end of intervention, Outcome 7 Serious adverse events ‐ participants characterised as 'at nutritional risk' due to one of the following criteria.
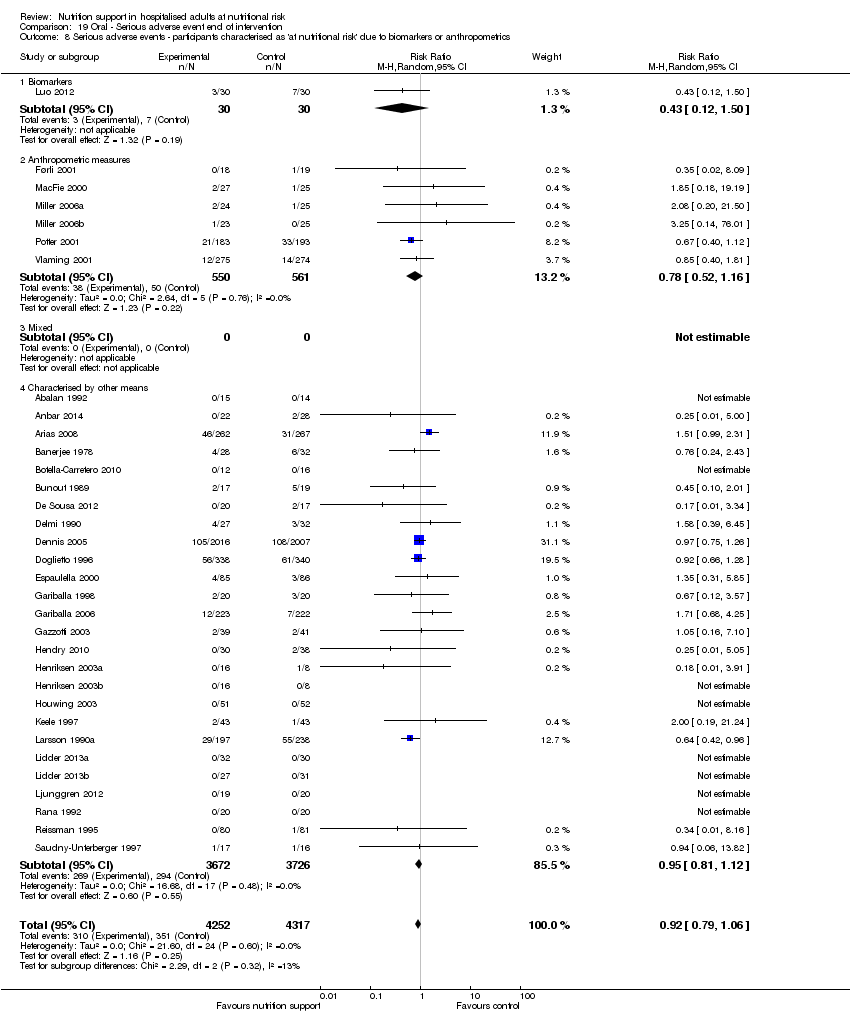
Comparison 19 Oral ‐ Serious adverse event end of intervention, Outcome 8 Serious adverse events ‐ participants characterised as 'at nutritional risk' due to biomarkers or anthropometrics.

Comparison 19 Oral ‐ Serious adverse event end of intervention, Outcome 9 Serious adverse events ‐ randomisation year.

Comparison 19 Oral ‐ Serious adverse event end of intervention, Outcome 10 Serious adverse events ‐ trials where the intervention lasts fewer than three days compared with trials where the intervention lasts three days or more.

Comparison 19 Oral ‐ Serious adverse event end of intervention, Outcome 11 Serious adverse events ‐ 'best‐worst case' scenario.

Comparison 19 Oral ‐ Serious adverse event end of intervention, Outcome 12 Serious adverse events ‐ 'worst‐best case' scenario.
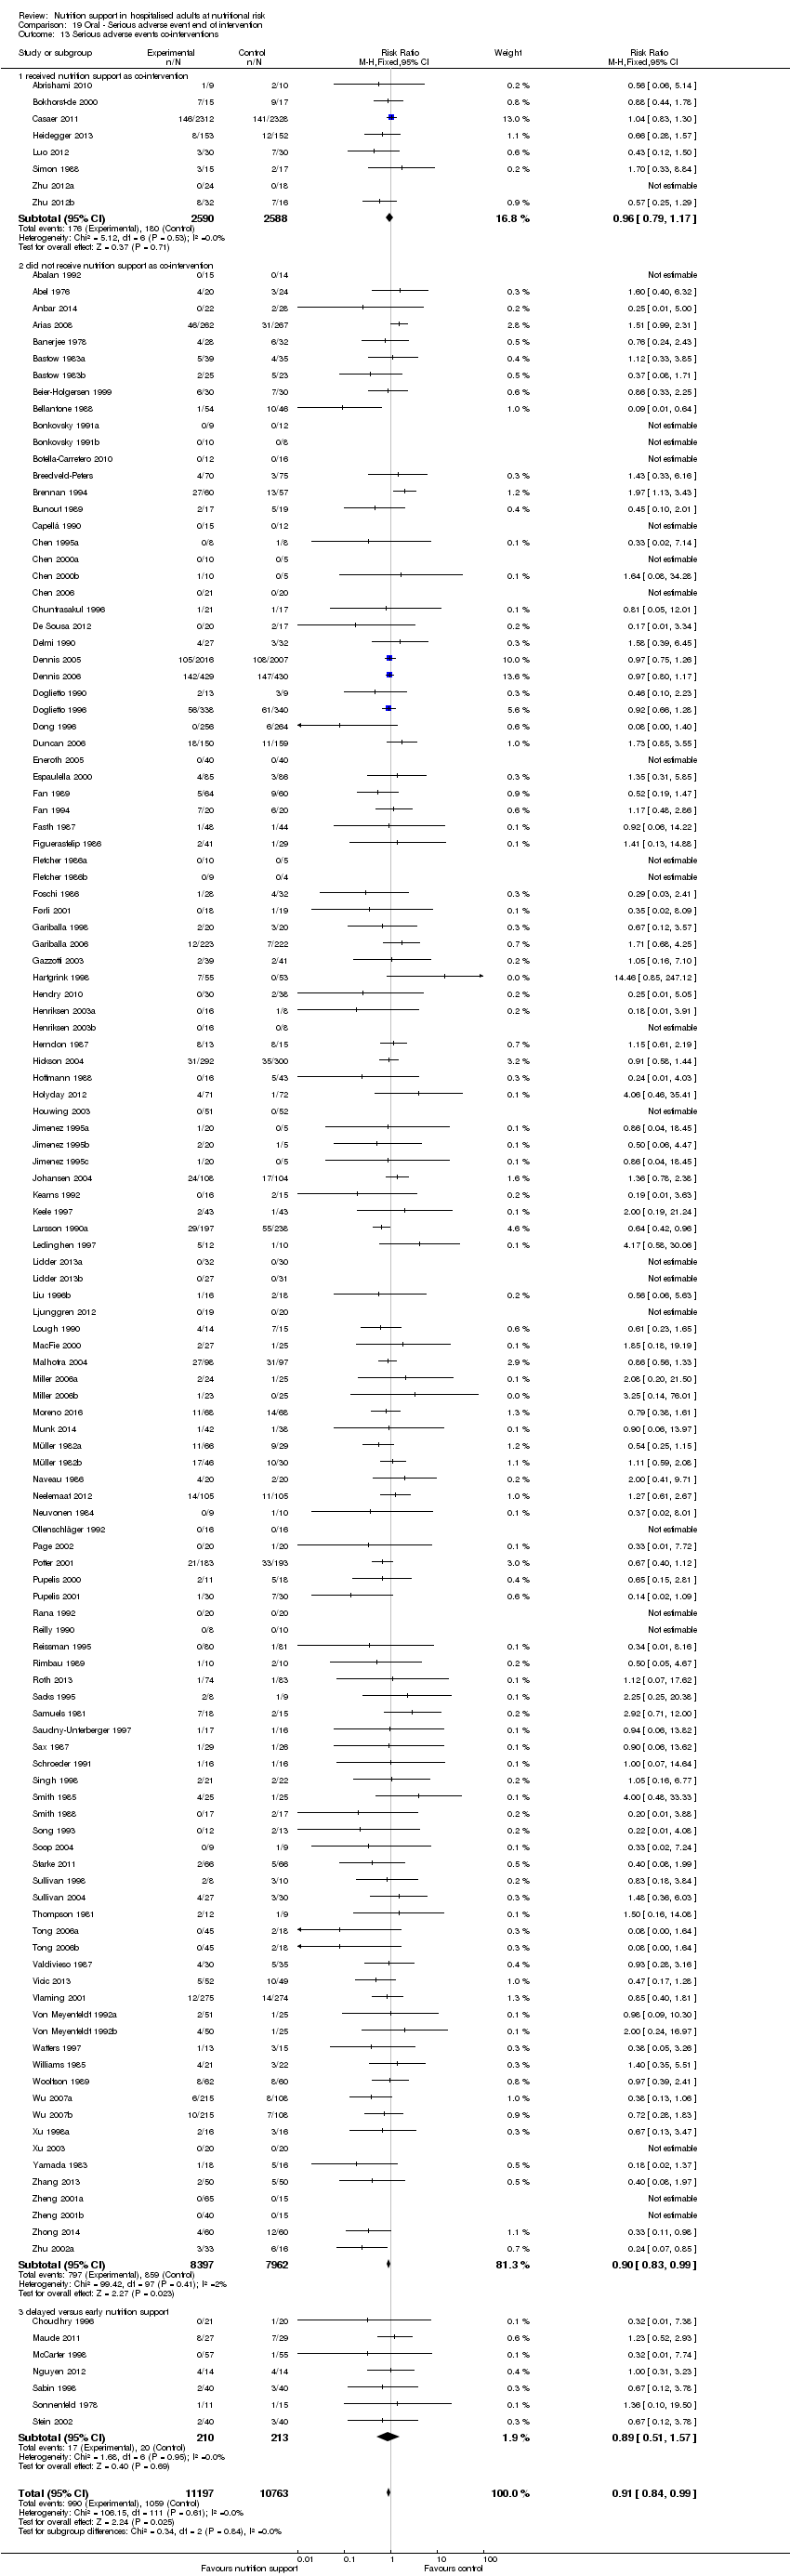
Comparison 19 Oral ‐ Serious adverse event end of intervention, Outcome 13 Serious adverse events co‐interventions.

Comparison 20 Oral ‐ Serious adverse event maximum follow‐up, Outcome 1 Serious adverse events ‐ overall.

Comparison 20 Oral ‐ Serious adverse event maximum follow‐up, Outcome 2 Serious adverse events ‐ bias.
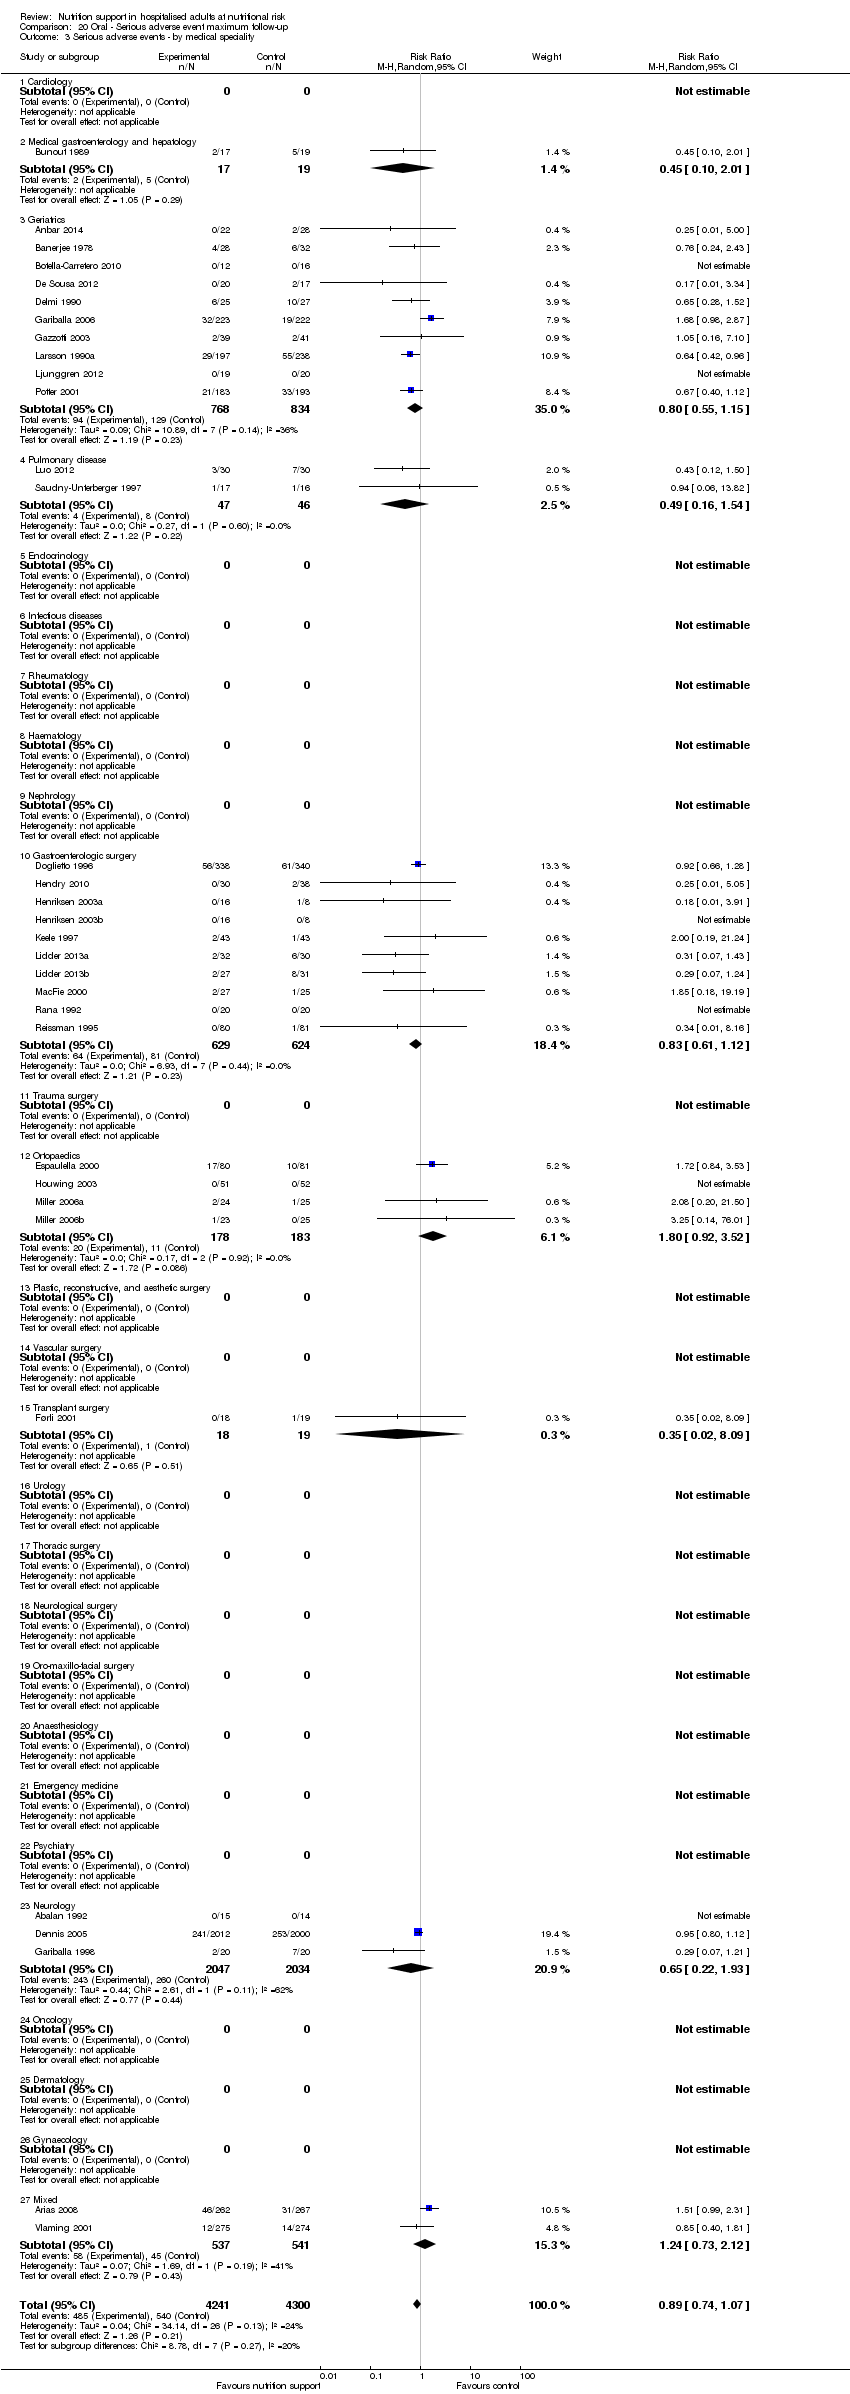
Comparison 20 Oral ‐ Serious adverse event maximum follow‐up, Outcome 3 Serious adverse events ‐ by medical speciality.
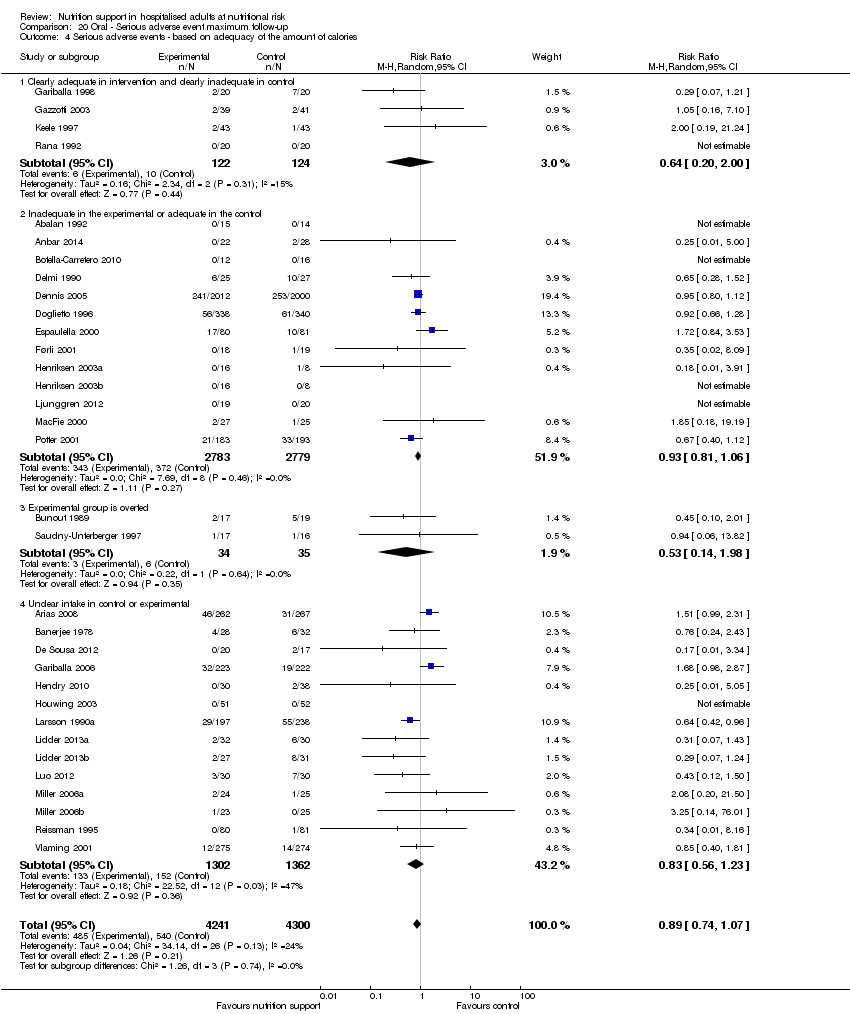
Comparison 20 Oral ‐ Serious adverse event maximum follow‐up, Outcome 4 Serious adverse events ‐ based on adequacy of the amount of calories.

Comparison 20 Oral ‐ Serious adverse event maximum follow‐up, Outcome 5 Serious adverse events ‐ different screening tools.
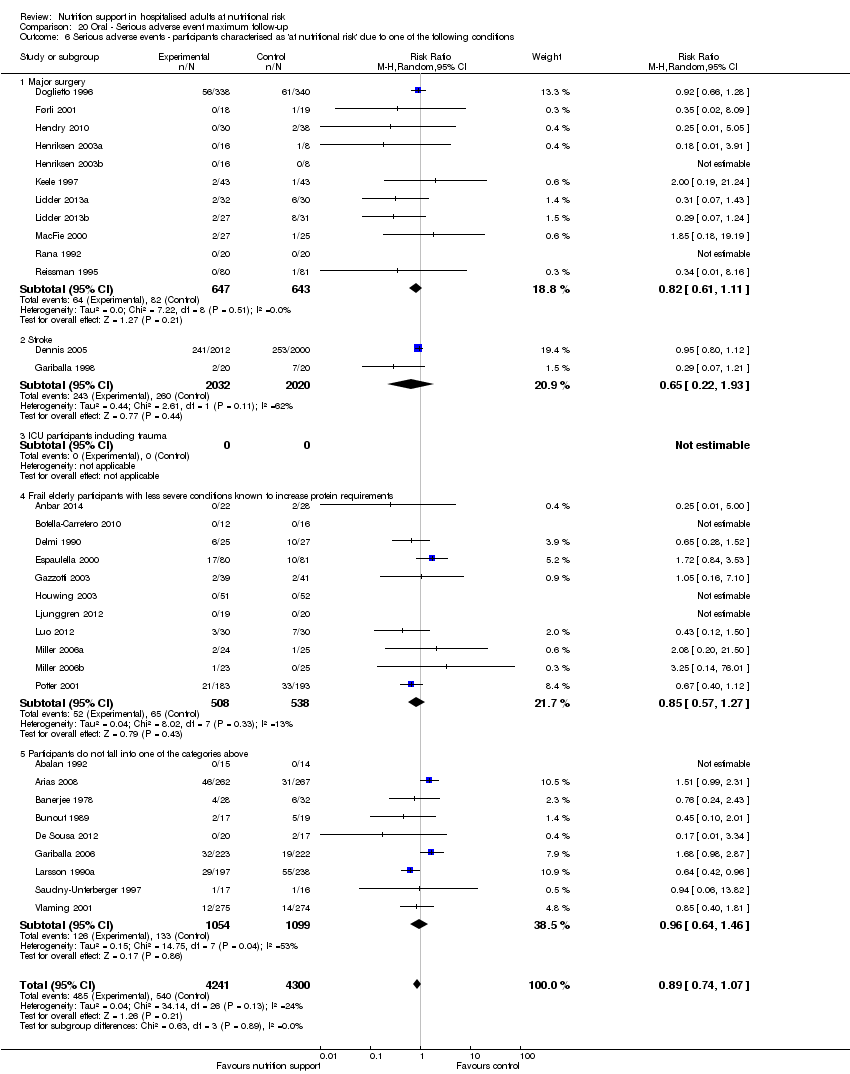
Comparison 20 Oral ‐ Serious adverse event maximum follow‐up, Outcome 6 Serious adverse events ‐ participants characterised as 'at nutritional risk' due to one of the following conditions.
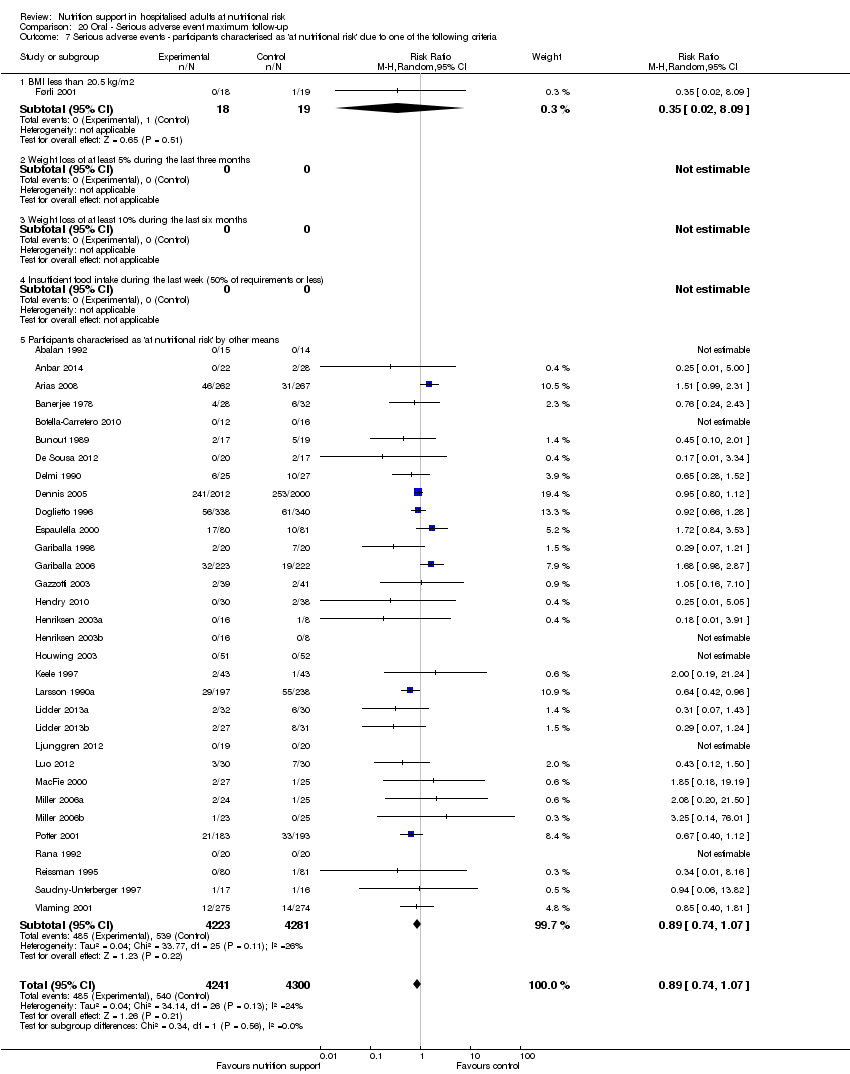
Comparison 20 Oral ‐ Serious adverse event maximum follow‐up, Outcome 7 Serious adverse events ‐ participants characterised as 'at nutritional risk' due to one of the following criteria.

Comparison 20 Oral ‐ Serious adverse event maximum follow‐up, Outcome 8 Serious adverse events ‐ participants characterised as 'at nutritional risk' due to biomarkers or anthropometrics.

Comparison 20 Oral ‐ Serious adverse event maximum follow‐up, Outcome 9 Serious adverse events ‐ randomisation year.
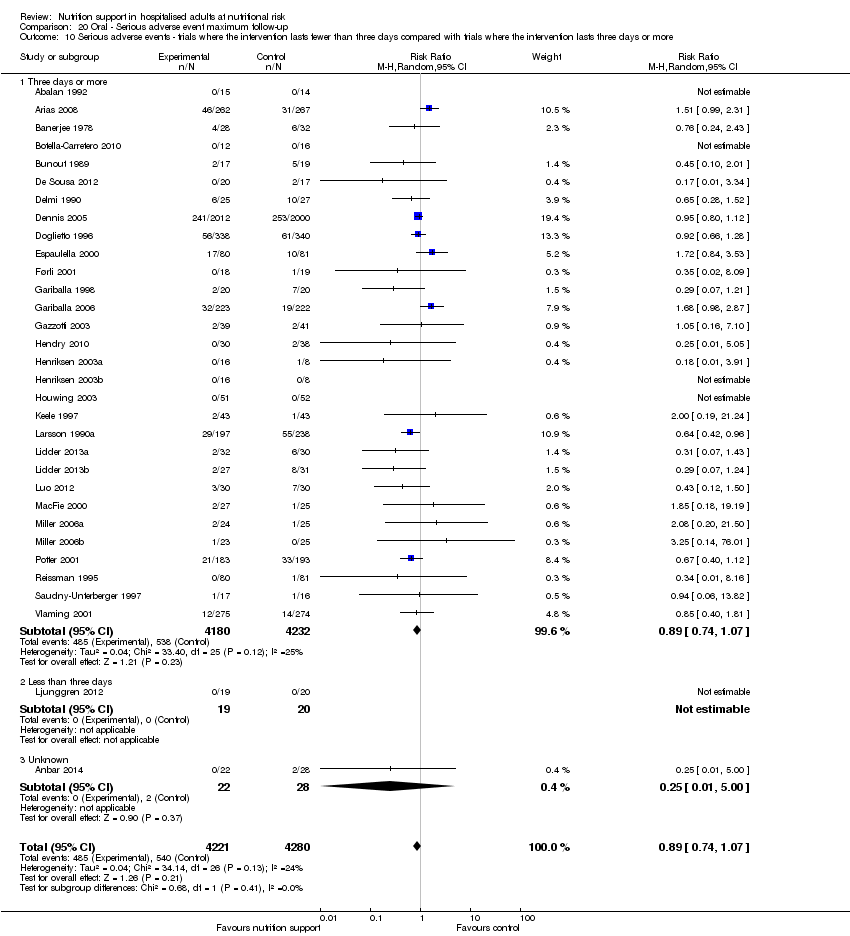
Comparison 20 Oral ‐ Serious adverse event maximum follow‐up, Outcome 10 Serious adverse events ‐ trials where the intervention lasts fewer than three days compared with trials where the intervention lasts three days or more.

Comparison 20 Oral ‐ Serious adverse event maximum follow‐up, Outcome 11 Serious adverse events ‐ 'best‐worst case' scenario.

Comparison 20 Oral ‐ Serious adverse event maximum follow‐up, Outcome 12 Serious adverse events ‐ 'worst‐best case' scenario.

Comparison 20 Oral ‐ Serious adverse event maximum follow‐up, Outcome 13 Serious adverse events co‐interventions.

Comparison 21 Enteral ‐ All cause mortality ‐ end of intervention, Outcome 1 All‐cause mortality ‐ overall.

Comparison 21 Enteral ‐ All cause mortality ‐ end of intervention, Outcome 2 All‐cause mortality ‐ bias.

Comparison 21 Enteral ‐ All cause mortality ‐ end of intervention, Outcome 3 All‐cause mortality ‐ medical speciality.
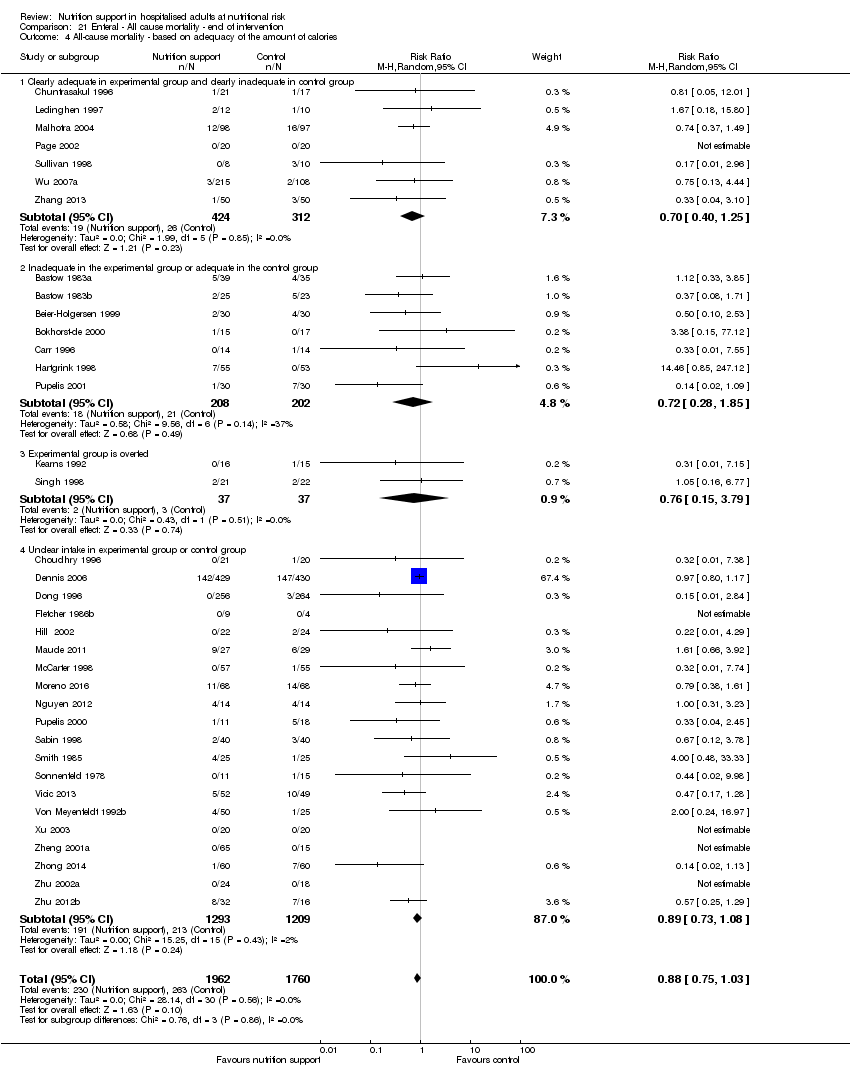
Comparison 21 Enteral ‐ All cause mortality ‐ end of intervention, Outcome 4 All‐cause mortality ‐ based on adequacy of the amount of calories.

Comparison 21 Enteral ‐ All cause mortality ‐ end of intervention, Outcome 5 All‐cause mortality ‐ different screening tools.
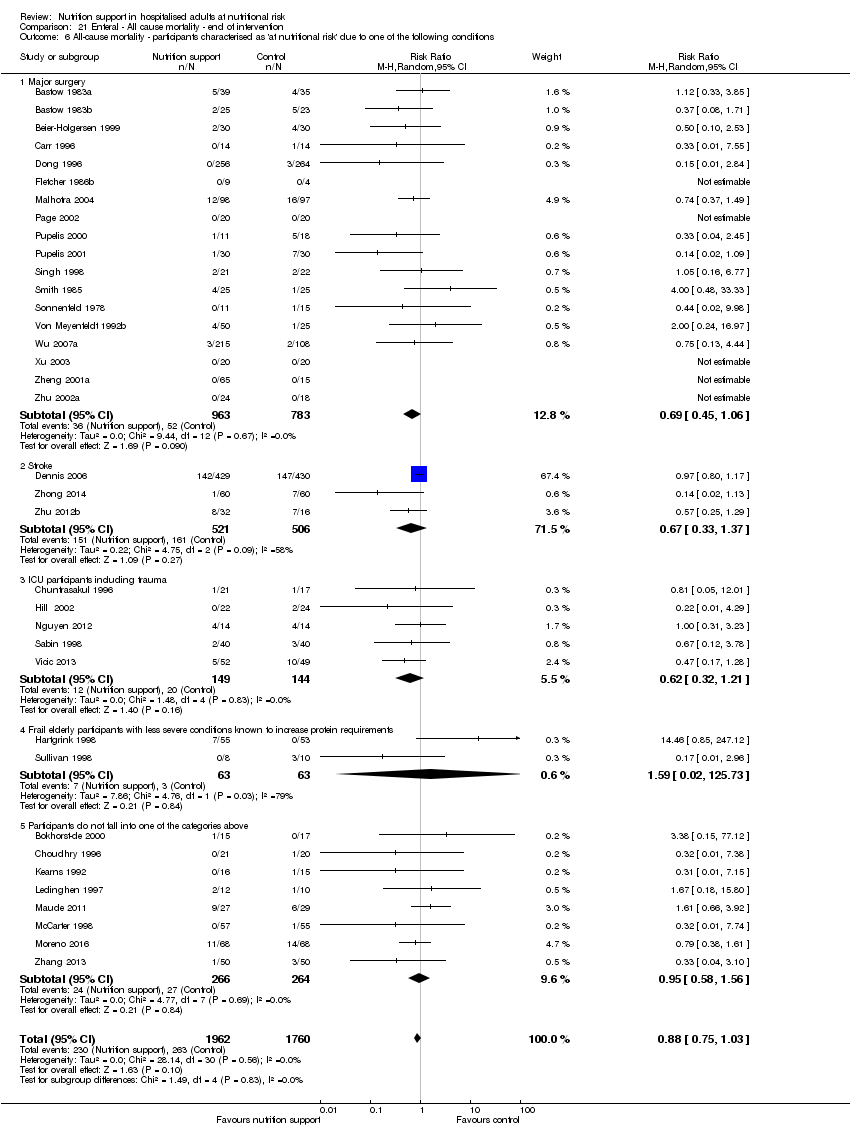
Comparison 21 Enteral ‐ All cause mortality ‐ end of intervention, Outcome 6 All‐cause mortality ‐ participants characterised as 'at nutritional risk' due to one of the following conditions.
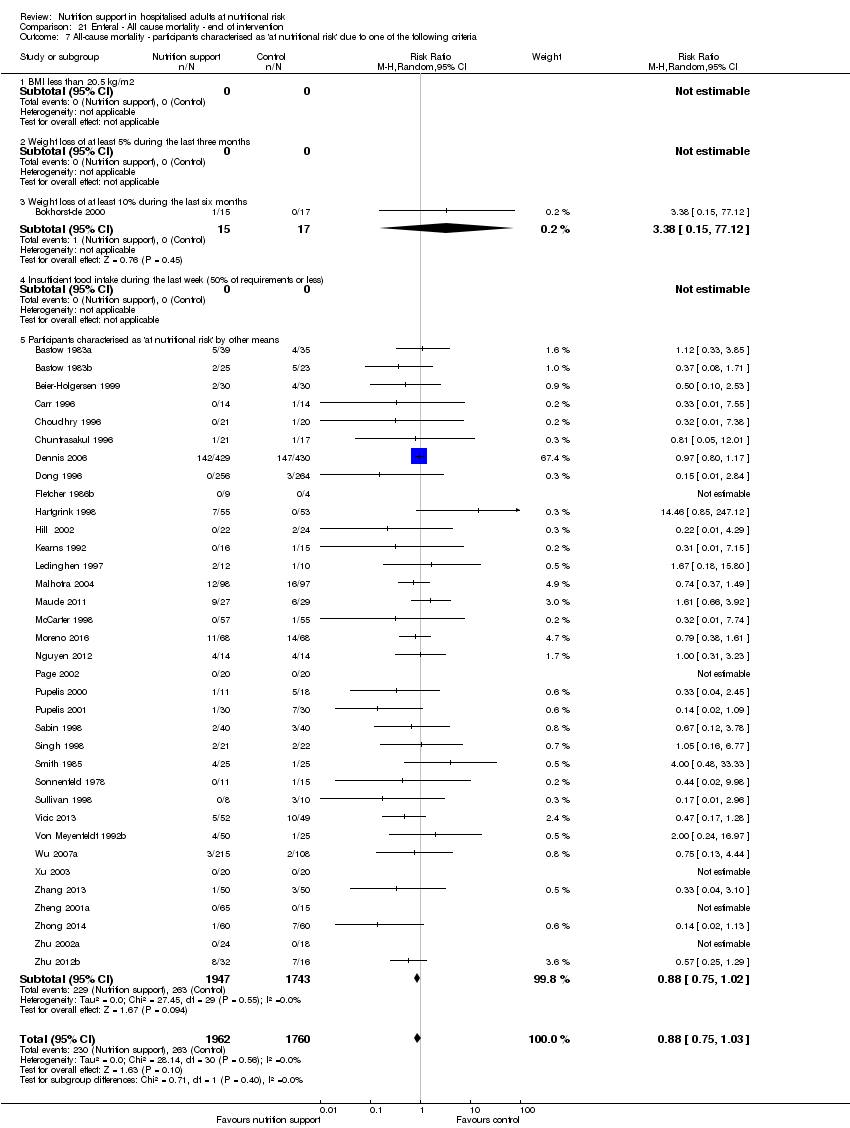
Comparison 21 Enteral ‐ All cause mortality ‐ end of intervention, Outcome 7 All‐cause mortality ‐ participants characterised as 'at nutritional risk' due to one of the following criteria.

Comparison 21 Enteral ‐ All cause mortality ‐ end of intervention, Outcome 8 All‐cause mortality ‐ participants characterised as 'at nutritional risk' due to biomarkers or anthropometrics.

Comparison 21 Enteral ‐ All cause mortality ‐ end of intervention, Outcome 9 All‐cause mortality ‐ randomisation year.
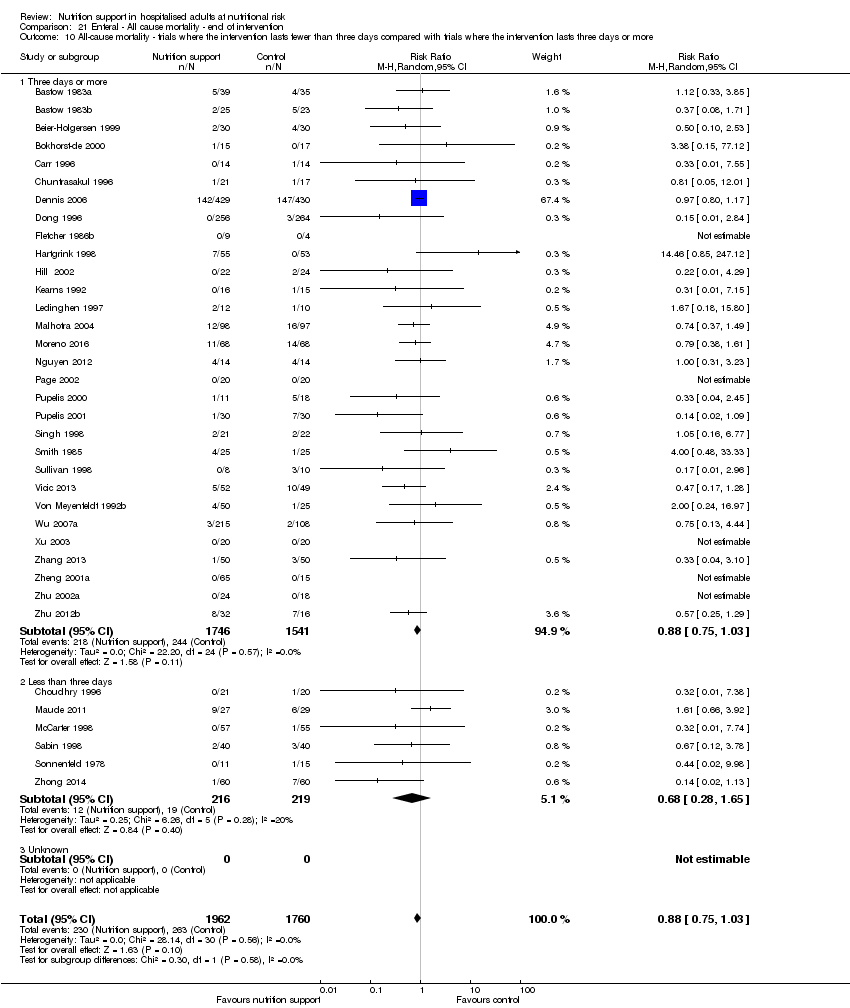
Comparison 21 Enteral ‐ All cause mortality ‐ end of intervention, Outcome 10 All‐cause mortality ‐ trials where the intervention lasts fewer than three days compared with trials where the intervention lasts three days or more.

Comparison 21 Enteral ‐ All cause mortality ‐ end of intervention, Outcome 11 All‐cause mortality ‐ 'best‐worst case' scenario.

Comparison 21 Enteral ‐ All cause mortality ‐ end of intervention, Outcome 12 All‐cause mortality ‐ 'worst‐best case' scenario.

Comparison 21 Enteral ‐ All cause mortality ‐ end of intervention, Outcome 13 All‐cause mortality co‐interventions.
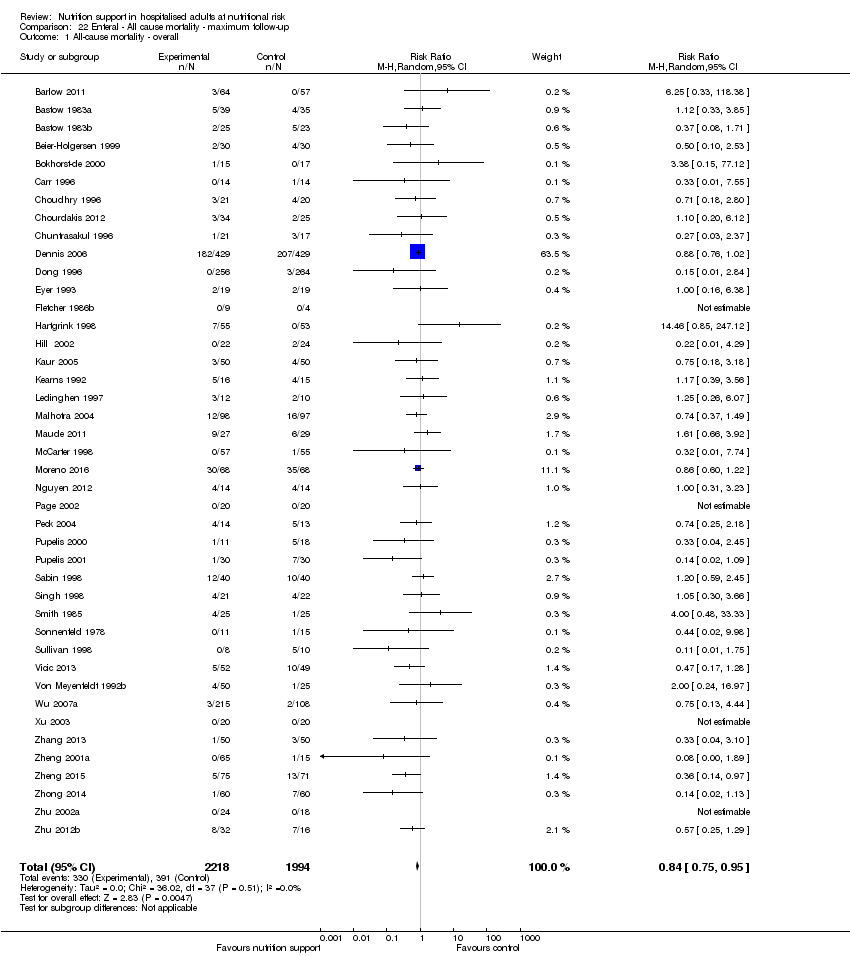
Comparison 22 Enteral ‐ All cause mortality ‐ maximum follow‐up, Outcome 1 All‐cause mortality ‐ overall.

Comparison 22 Enteral ‐ All cause mortality ‐ maximum follow‐up, Outcome 2 All‐cause mortality ‐ bias.

Comparison 22 Enteral ‐ All cause mortality ‐ maximum follow‐up, Outcome 3 All‐cause mortality ‐ medical speciality.

Comparison 22 Enteral ‐ All cause mortality ‐ maximum follow‐up, Outcome 4 All‐cause mortality ‐ based on adequacy of the amount of calories.

Comparison 22 Enteral ‐ All cause mortality ‐ maximum follow‐up, Outcome 5 All‐cause mortality ‐ different screening tools.

Comparison 22 Enteral ‐ All cause mortality ‐ maximum follow‐up, Outcome 6 All‐cause mortality ‐ participants characterised as 'at nutritional risk' due to one of the following conditions.

Comparison 22 Enteral ‐ All cause mortality ‐ maximum follow‐up, Outcome 7 All‐cause mortality ‐ participants characterised as 'at nutritional risk' due to one of the following criteria.
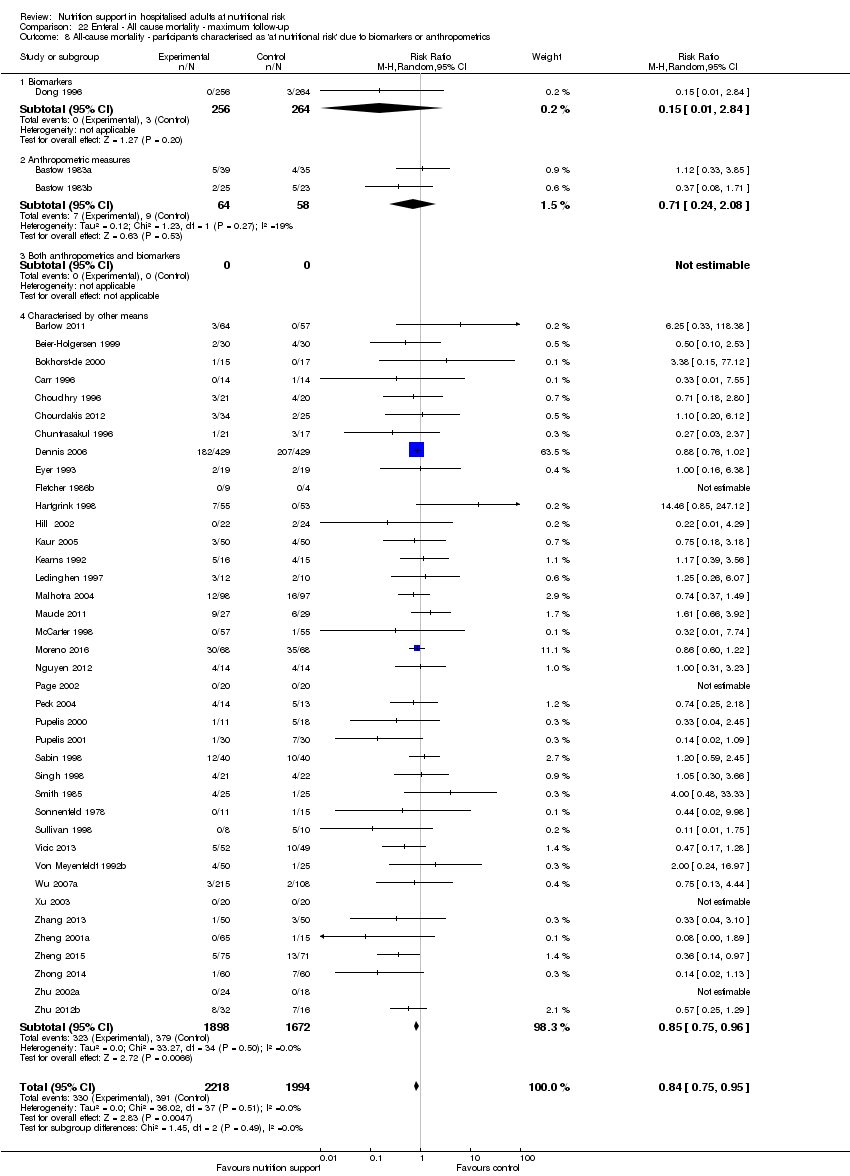
Comparison 22 Enteral ‐ All cause mortality ‐ maximum follow‐up, Outcome 8 All‐cause mortality ‐ participants characterised as 'at nutritional risk' due to biomarkers or anthropometrics.
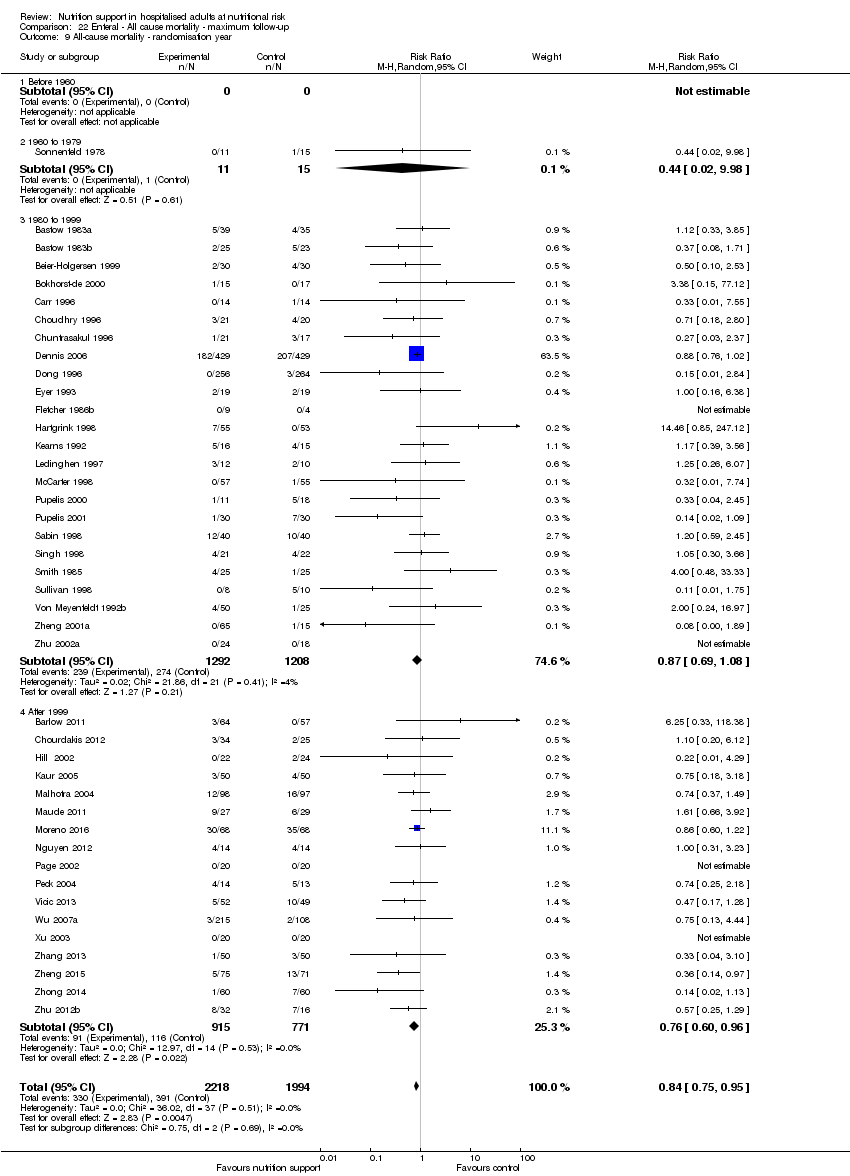
Comparison 22 Enteral ‐ All cause mortality ‐ maximum follow‐up, Outcome 9 All‐cause mortality ‐ randomisation year.
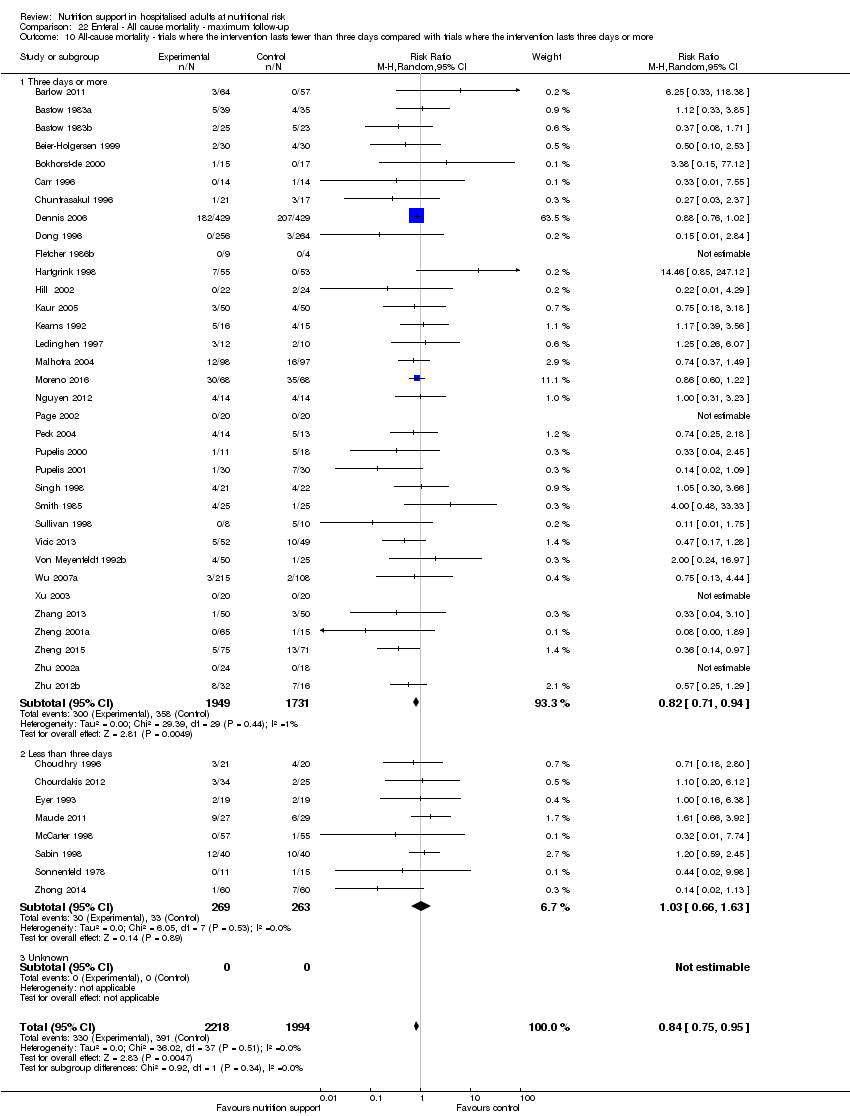
Comparison 22 Enteral ‐ All cause mortality ‐ maximum follow‐up, Outcome 10 All‐cause mortality ‐ trials where the intervention lasts fewer than three days compared with trials where the intervention lasts three days or more.

Comparison 22 Enteral ‐ All cause mortality ‐ maximum follow‐up, Outcome 11 All‐cause mortality ‐ 'best‐worst case' scenario.
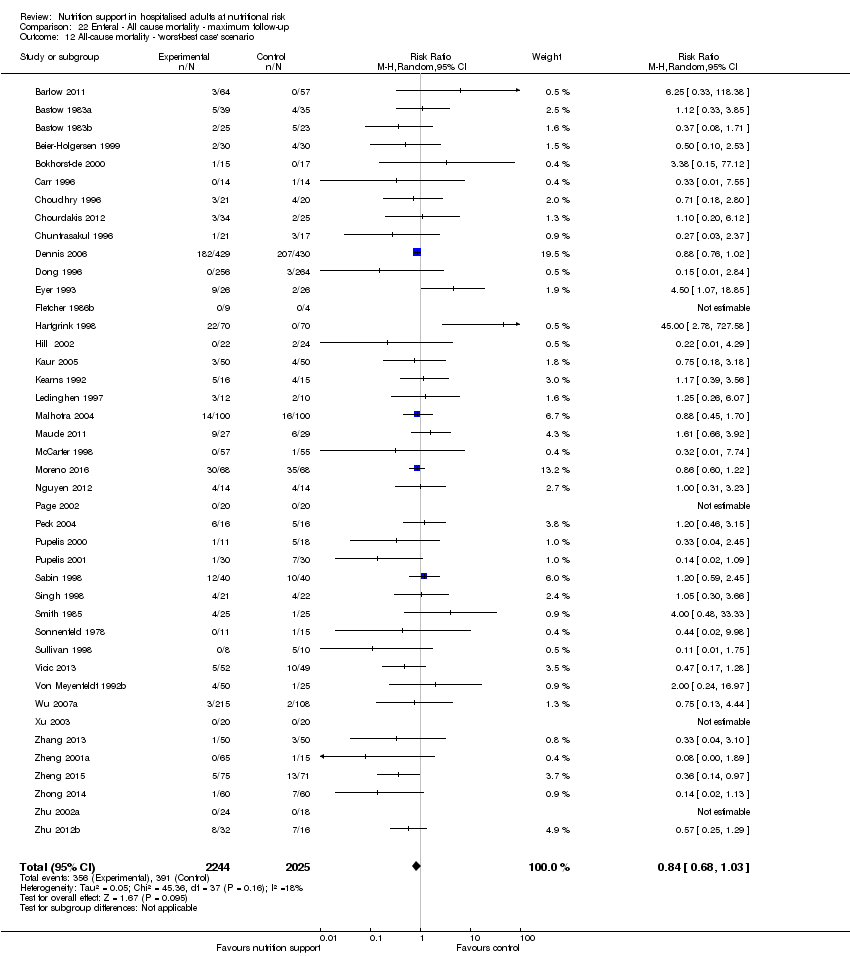
Comparison 22 Enteral ‐ All cause mortality ‐ maximum follow‐up, Outcome 12 All‐cause mortality ‐ 'worst‐best case' scenario.

Comparison 22 Enteral ‐ All cause mortality ‐ maximum follow‐up, Outcome 13 All‐cause mortality co‐interventions.

Comparison 23 Enteral ‐ Serious adverse event end of intervention, Outcome 1 Serious adverse events ‐ overall.

Comparison 23 Enteral ‐ Serious adverse event end of intervention, Outcome 2 Serious adverse events ‐ bias.

Comparison 23 Enteral ‐ Serious adverse event end of intervention, Outcome 3 Serious adverse events ‐ by medical specialty.

Comparison 23 Enteral ‐ Serious adverse event end of intervention, Outcome 4 Serious adverse events ‐ based on adequacy of the amount of calories.
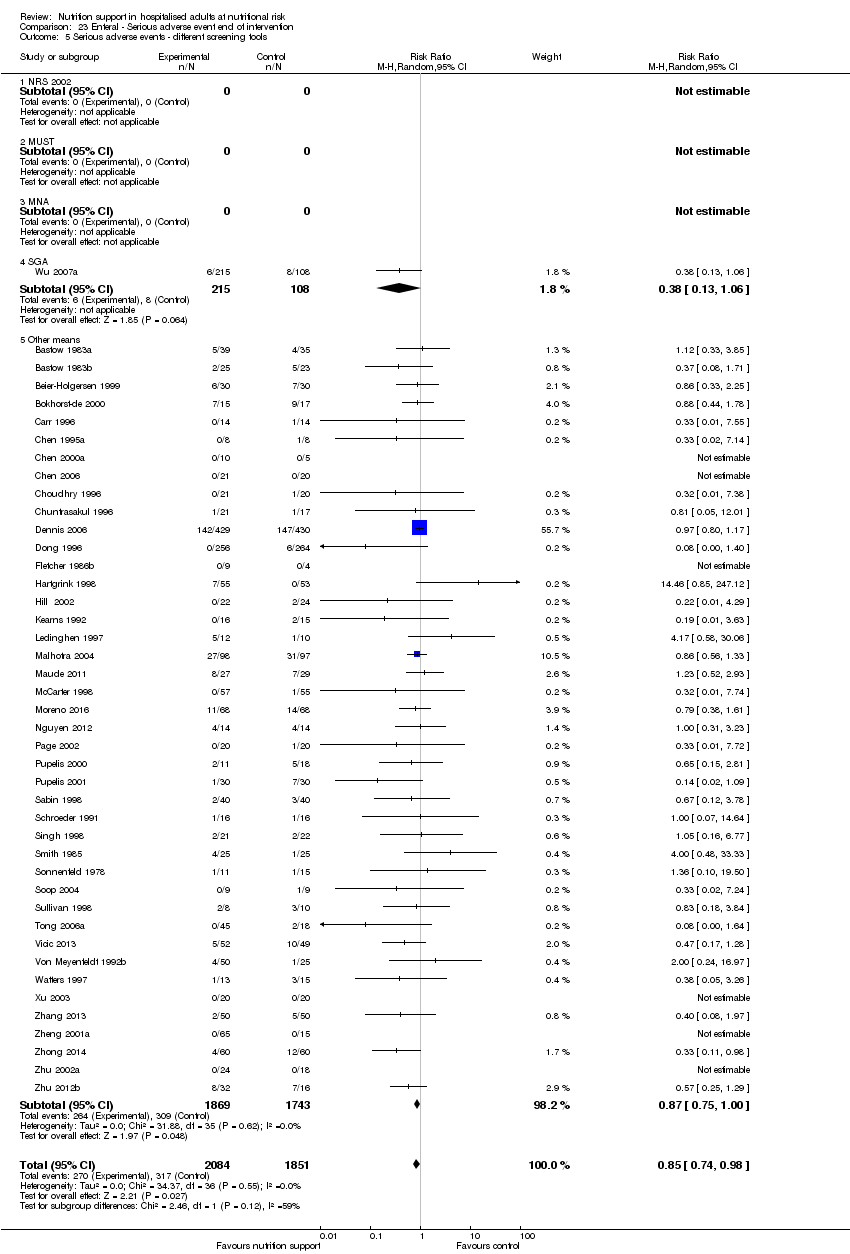
Comparison 23 Enteral ‐ Serious adverse event end of intervention, Outcome 5 Serious adverse events ‐ different screening tools.

Comparison 23 Enteral ‐ Serious adverse event end of intervention, Outcome 6 Serious adverse events ‐ participants characterised as 'at nutritional risk' due to one of the following conditions.

Comparison 23 Enteral ‐ Serious adverse event end of intervention, Outcome 7 Serious adverse events ‐ participants characterised as 'at nutritional risk' due to one of the following criteria.

Comparison 23 Enteral ‐ Serious adverse event end of intervention, Outcome 8 Serious adverse events ‐ participants characterised as 'at nutritional risk' due to biomarkers or anthropometrics.
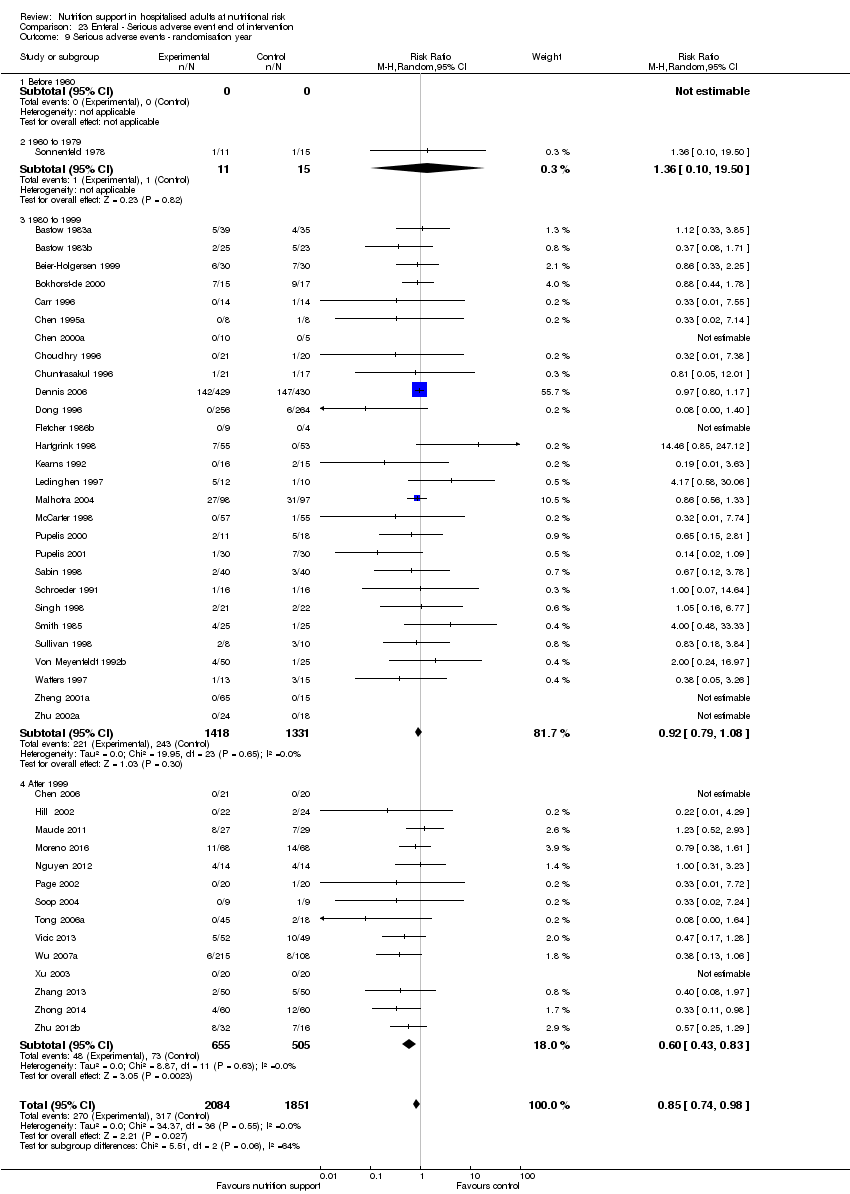
Comparison 23 Enteral ‐ Serious adverse event end of intervention, Outcome 9 Serious adverse events ‐ randomisation year.

Comparison 23 Enteral ‐ Serious adverse event end of intervention, Outcome 10 Serious adverse events ‐ trials where the intervention lasts fewer than three days compared with trials where the intervention lasts three days or more.
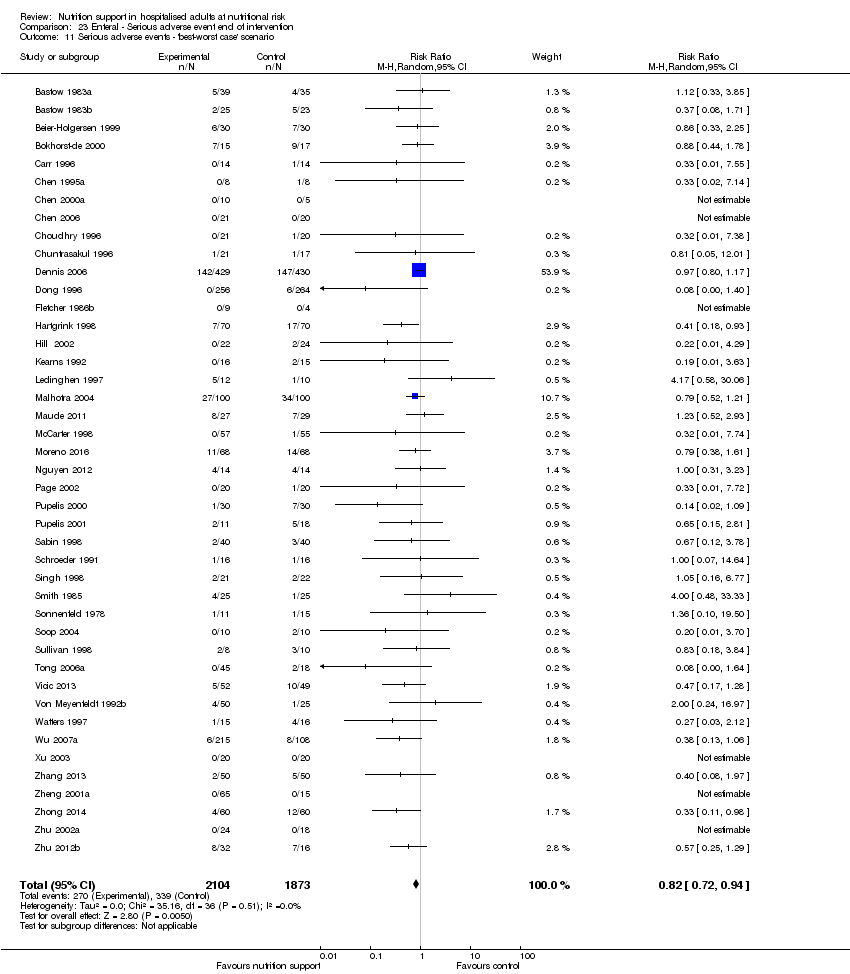
Comparison 23 Enteral ‐ Serious adverse event end of intervention, Outcome 11 Serious adverse events ‐ 'best‐worst case' scenario.

Comparison 23 Enteral ‐ Serious adverse event end of intervention, Outcome 12 Serious adverse events ‐ 'worst‐best case' scenario.

Comparison 23 Enteral ‐ Serious adverse event end of intervention, Outcome 13 Serious adverse events co‐interventions.
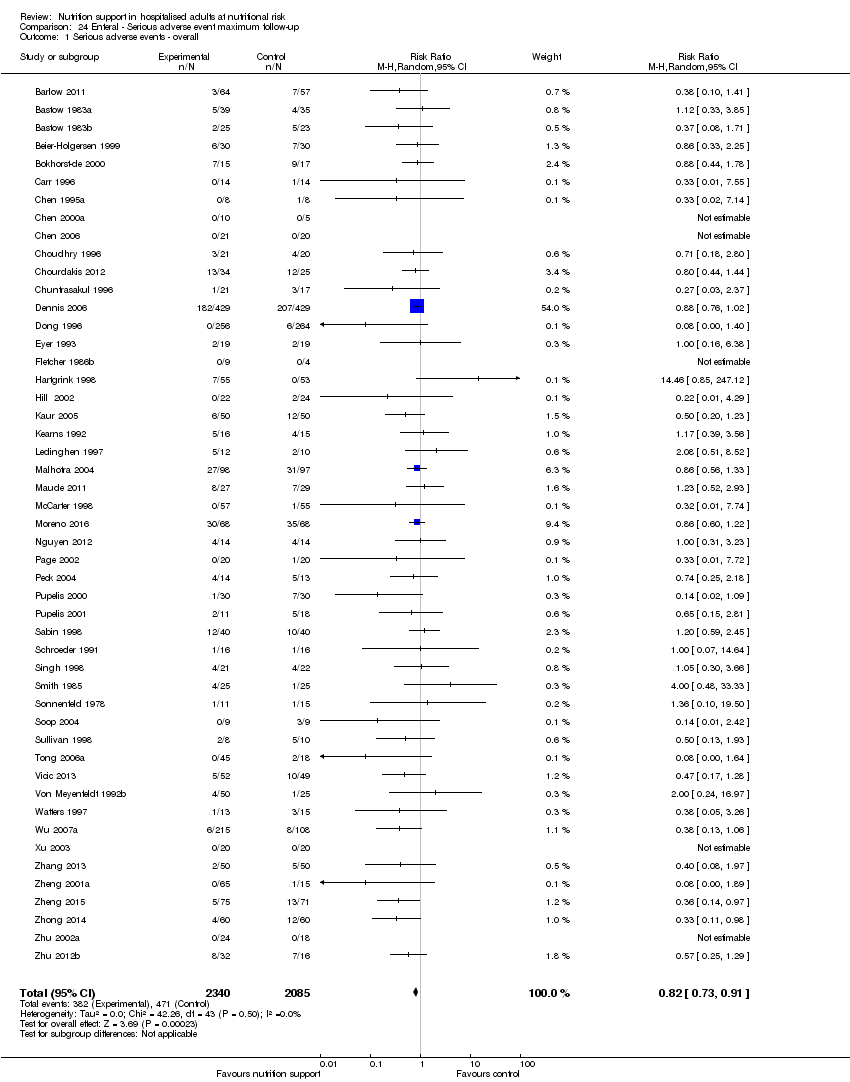
Comparison 24 Enteral ‐ Serious adverse event maximum follow‐up, Outcome 1 Serious adverse events ‐ overall.

Comparison 24 Enteral ‐ Serious adverse event maximum follow‐up, Outcome 2 Serious adverse events ‐ bias.
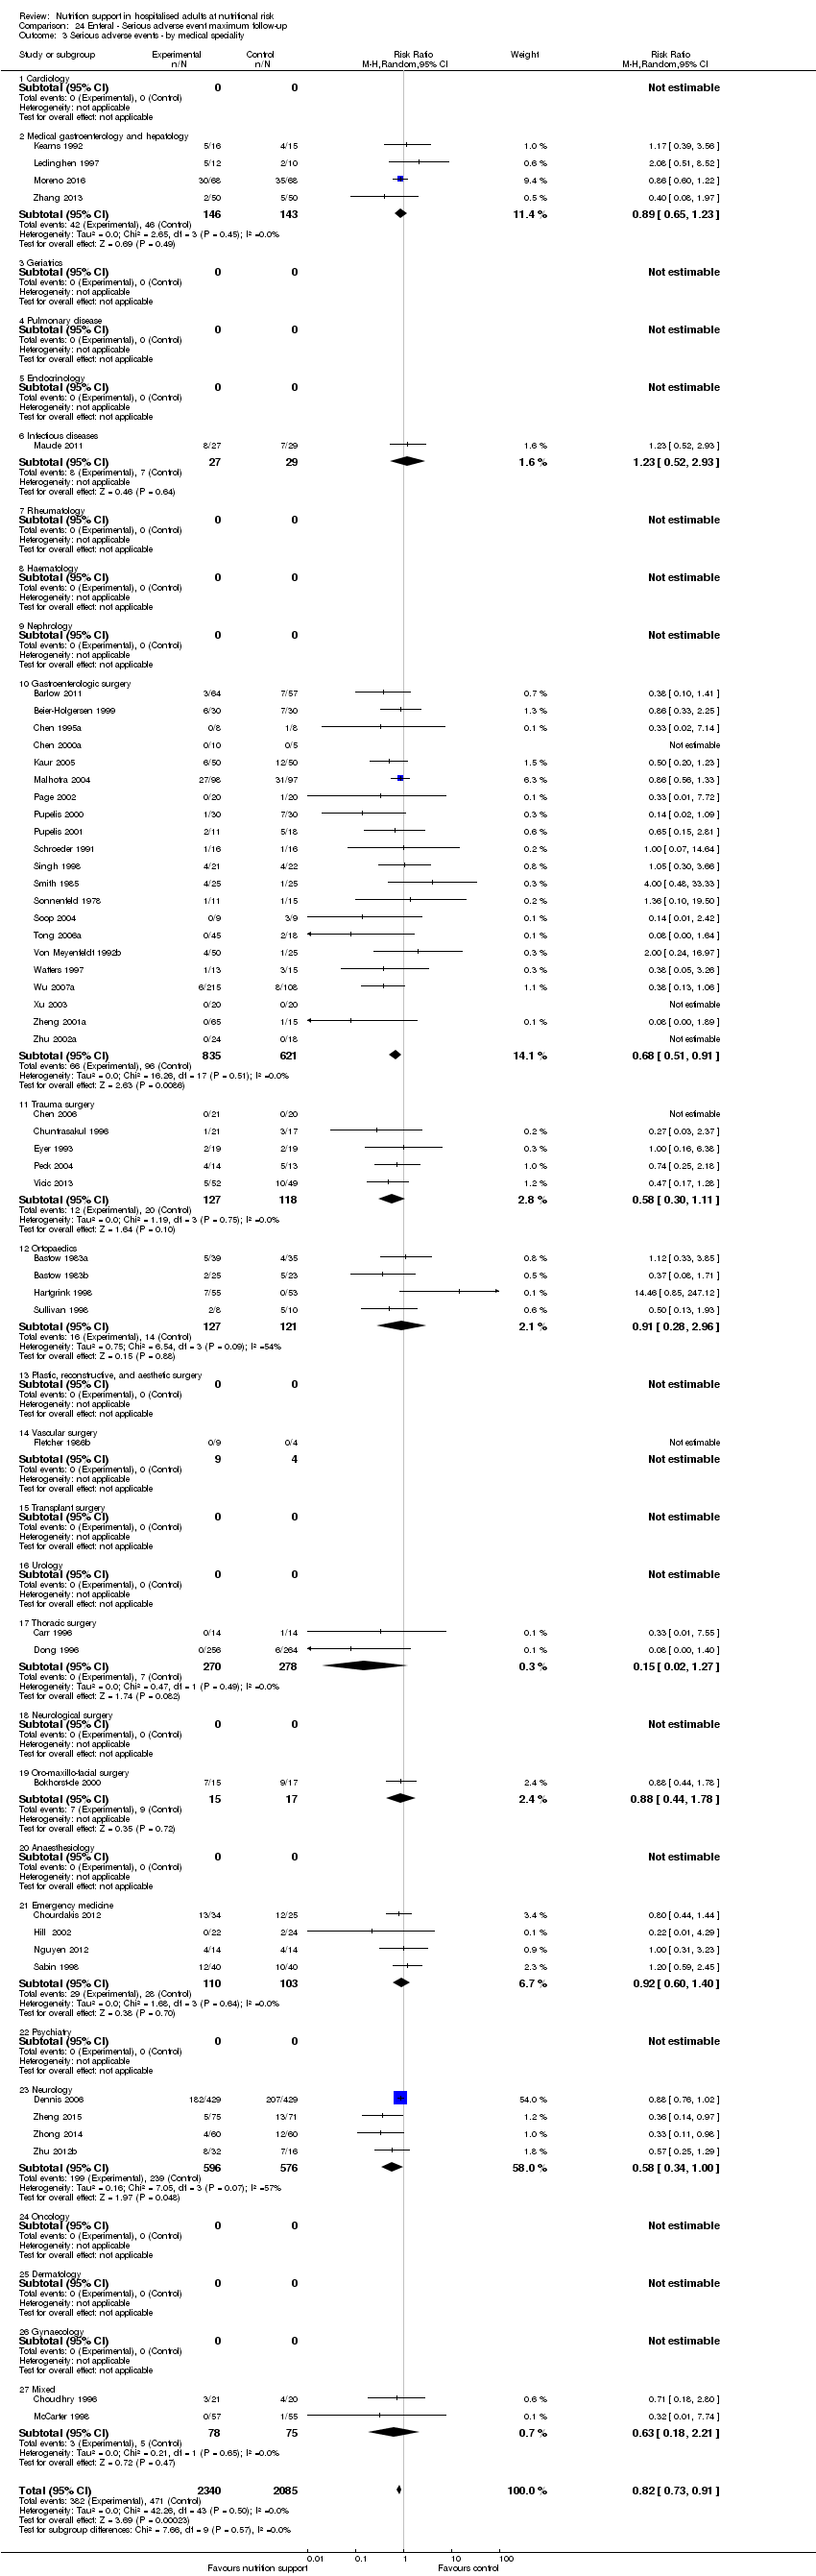
Comparison 24 Enteral ‐ Serious adverse event maximum follow‐up, Outcome 3 Serious adverse events ‐ by medical speciality.

Comparison 24 Enteral ‐ Serious adverse event maximum follow‐up, Outcome 4 Serious adverse events ‐ based on adequacy of the amount of calories.

Comparison 24 Enteral ‐ Serious adverse event maximum follow‐up, Outcome 5 Serious adverse events ‐ different screening tools.

Comparison 24 Enteral ‐ Serious adverse event maximum follow‐up, Outcome 6 Serious adverse events ‐ participants characterised as 'at nutritional risk' due to one of the following conditions.

Comparison 24 Enteral ‐ Serious adverse event maximum follow‐up, Outcome 7 Serious adverse events ‐ participants characterised as 'at nutritional risk' due to one of the following criteria.

Comparison 24 Enteral ‐ Serious adverse event maximum follow‐up, Outcome 8 Serious adverse events ‐ participants characterised as 'at nutritional risk' due to biomarkers or anthropometrics.

Comparison 24 Enteral ‐ Serious adverse event maximum follow‐up, Outcome 9 Serious adverse events ‐ randomisation year.

Comparison 24 Enteral ‐ Serious adverse event maximum follow‐up, Outcome 10 Serious adverse events ‐ trials where the intervention lasts fewer than three days compared with trials where the intervention lasts three days or more.

Comparison 24 Enteral ‐ Serious adverse event maximum follow‐up, Outcome 11 Serious adverse events co‐interventions.

Comparison 24 Enteral ‐ Serious adverse event maximum follow‐up, Outcome 12 Serious adverse events ‐ 'best‐worse case' scenario (enteral nutrition).

Comparison 24 Enteral ‐ Serious adverse event maximum follow‐up, Outcome 13 Serious adverse events ‐ 'worst‐best case' scenario (enteral nutrition).
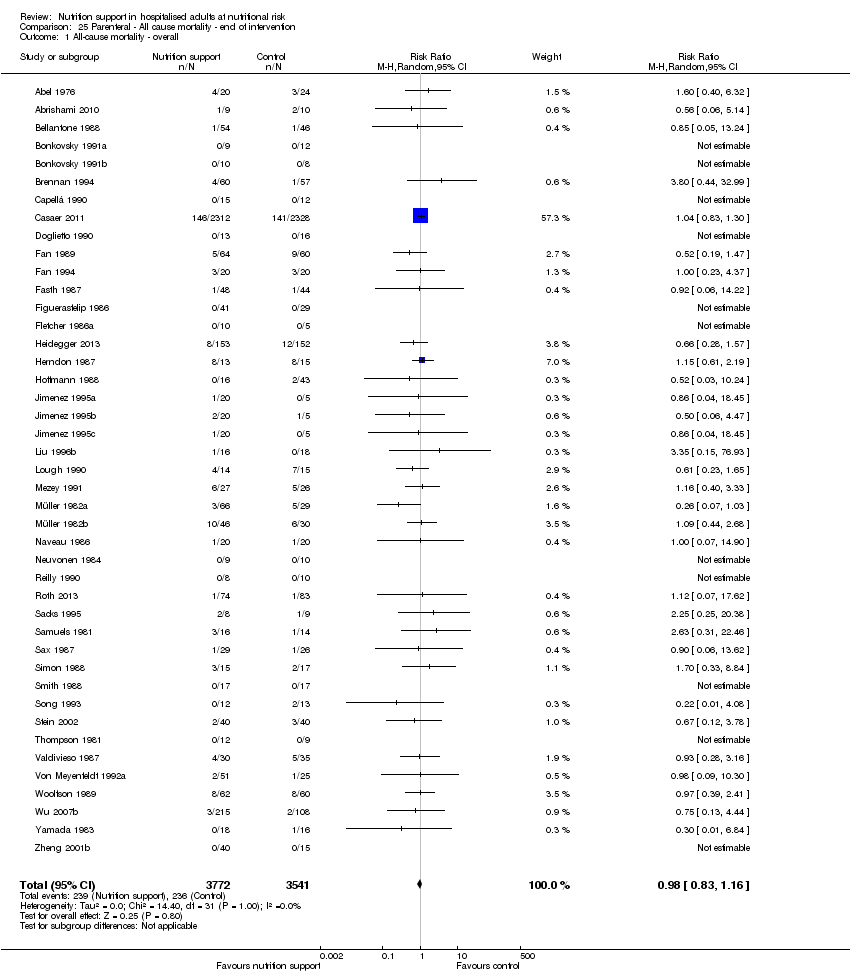
Comparison 25 Parenteral ‐ All cause mortality ‐ end of intervention, Outcome 1 All‐cause mortality ‐ overall.

Comparison 25 Parenteral ‐ All cause mortality ‐ end of intervention, Outcome 2 All‐cause mortality ‐ bias.
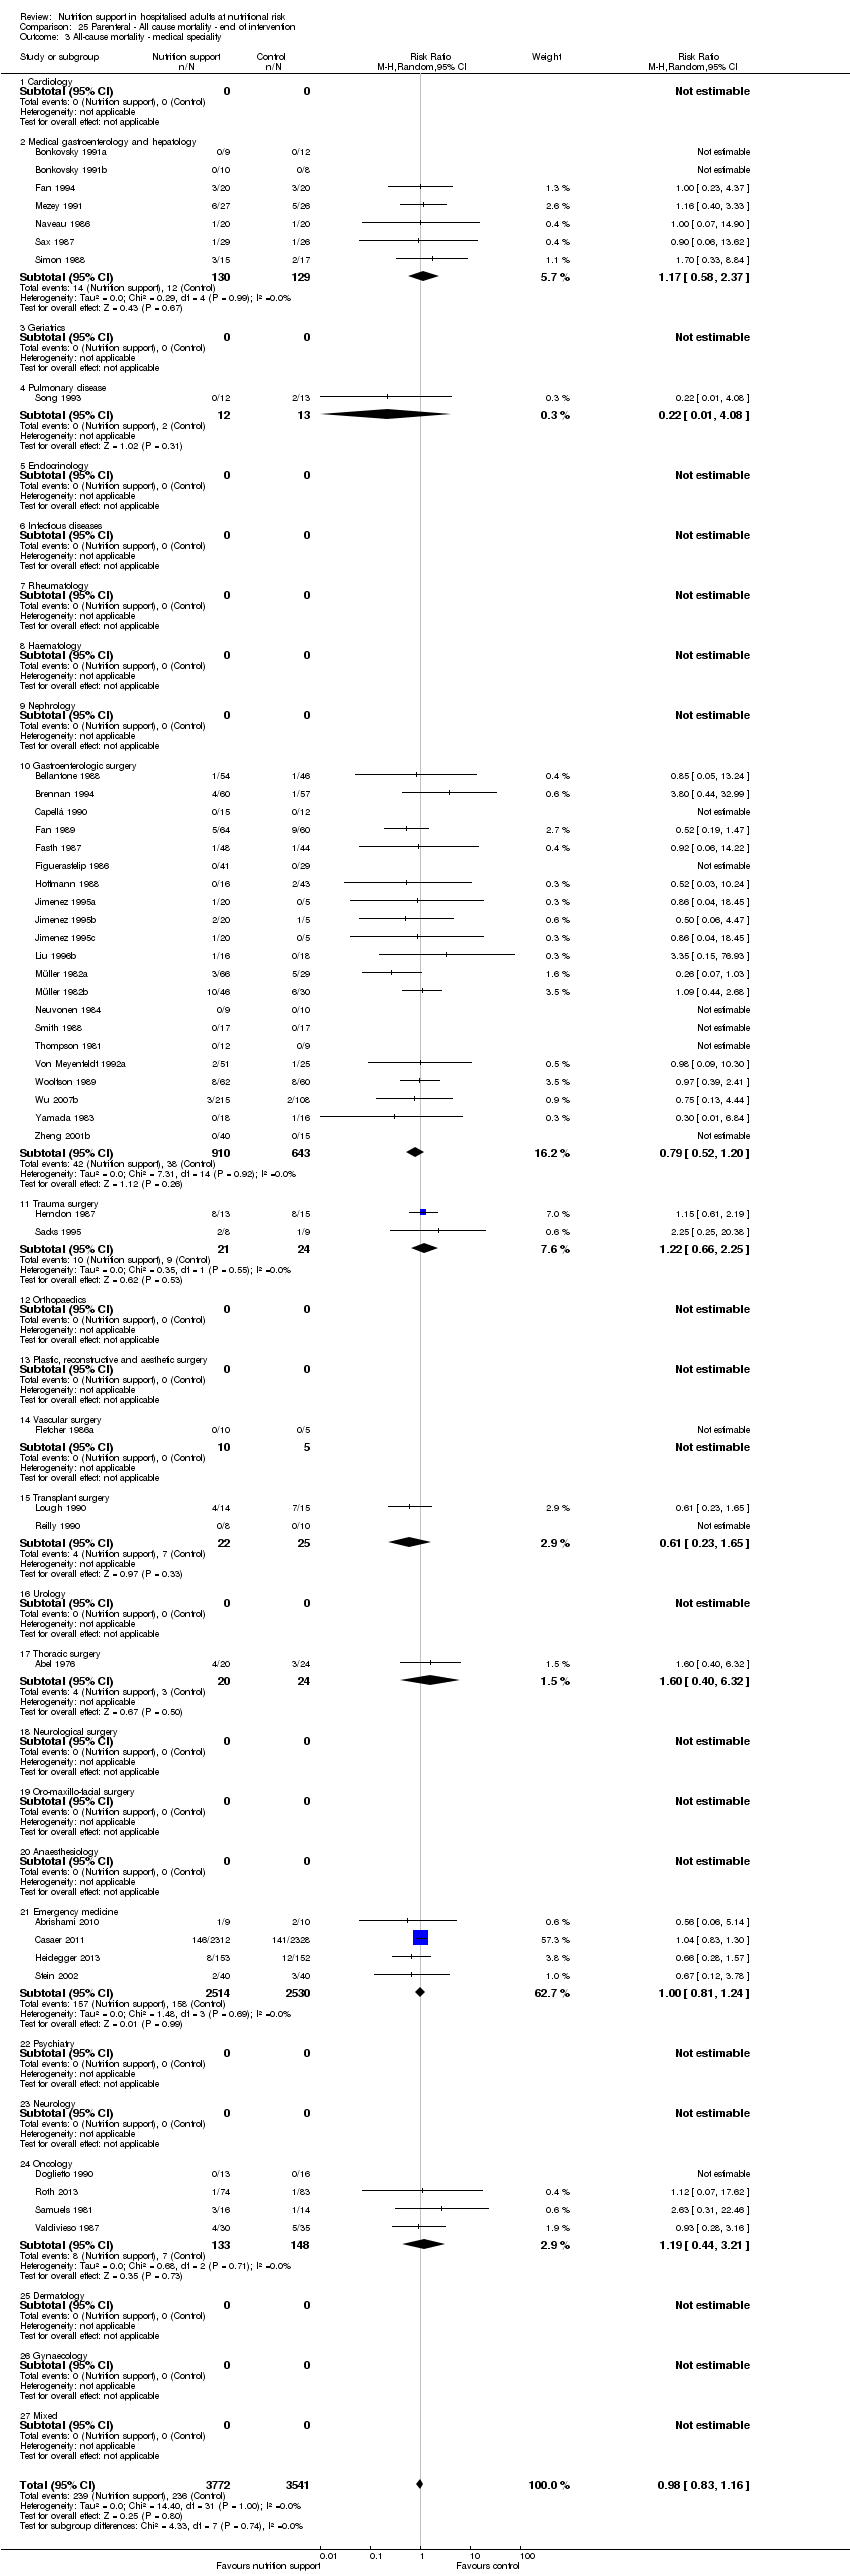
Comparison 25 Parenteral ‐ All cause mortality ‐ end of intervention, Outcome 3 All‐cause mortality ‐ medical speciality.

Comparison 25 Parenteral ‐ All cause mortality ‐ end of intervention, Outcome 4 All‐cause mortality ‐ based on adequacy of the amount of calories.

Comparison 25 Parenteral ‐ All cause mortality ‐ end of intervention, Outcome 5 All‐cause mortality ‐ different screening tools.

Comparison 25 Parenteral ‐ All cause mortality ‐ end of intervention, Outcome 6 All‐cause mortality ‐ participants characterised as 'at nutritional risk' due to one of the following conditions.

Comparison 25 Parenteral ‐ All cause mortality ‐ end of intervention, Outcome 7 All‐cause mortality ‐ participants characterised as 'at nutritional risk' due to one of the following criteria.
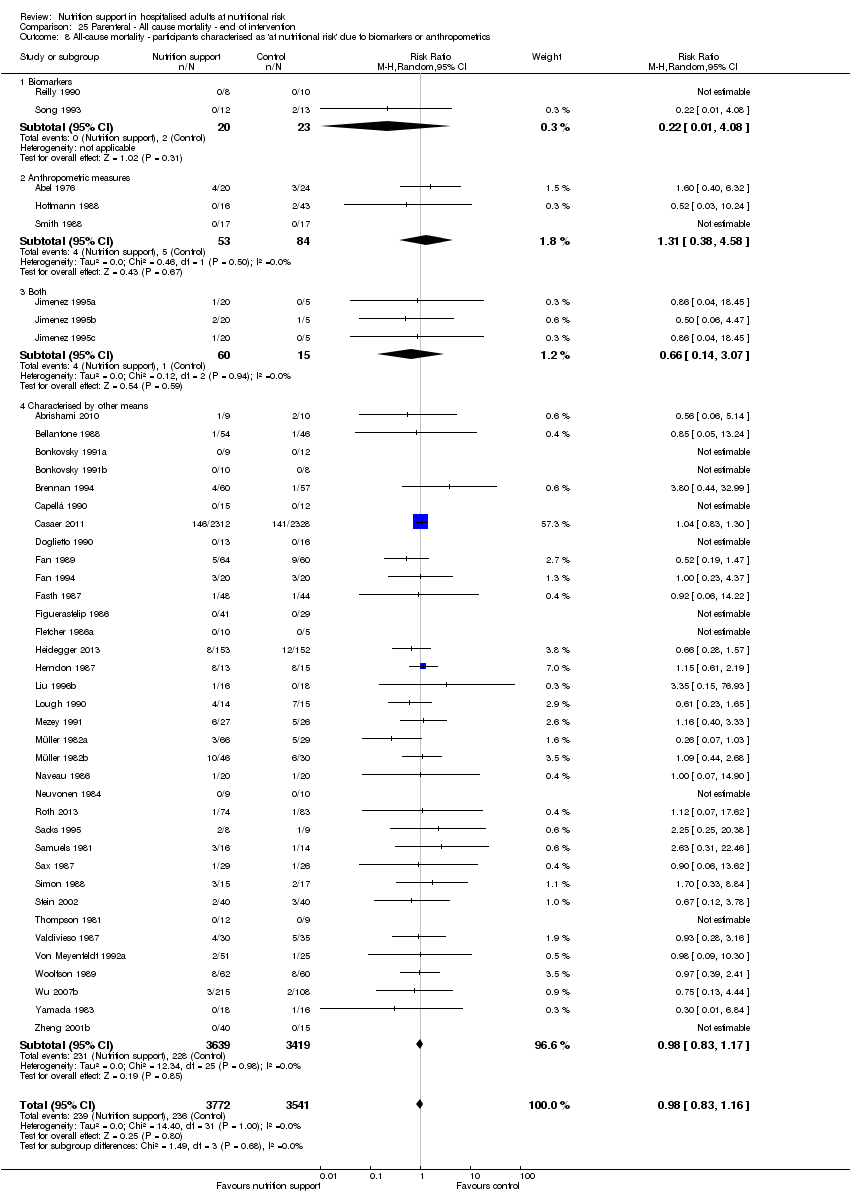
Comparison 25 Parenteral ‐ All cause mortality ‐ end of intervention, Outcome 8 All‐cause mortality ‐ participants characterised as 'at nutritional risk' due to biomarkers or anthropometrics.

Comparison 25 Parenteral ‐ All cause mortality ‐ end of intervention, Outcome 9 All‐cause mortality ‐ randomisation year.

Comparison 25 Parenteral ‐ All cause mortality ‐ end of intervention, Outcome 10 All‐cause mortality ‐ trials where the intervention lasts fewer than three days compared with trials where the intervention lasts three days or more.

Comparison 25 Parenteral ‐ All cause mortality ‐ end of intervention, Outcome 11 All‐cause mortality ‐ 'best‐worst case' scenario.

Comparison 25 Parenteral ‐ All cause mortality ‐ end of intervention, Outcome 12 All‐cause mortality ‐ 'worst‐best case' scenario.
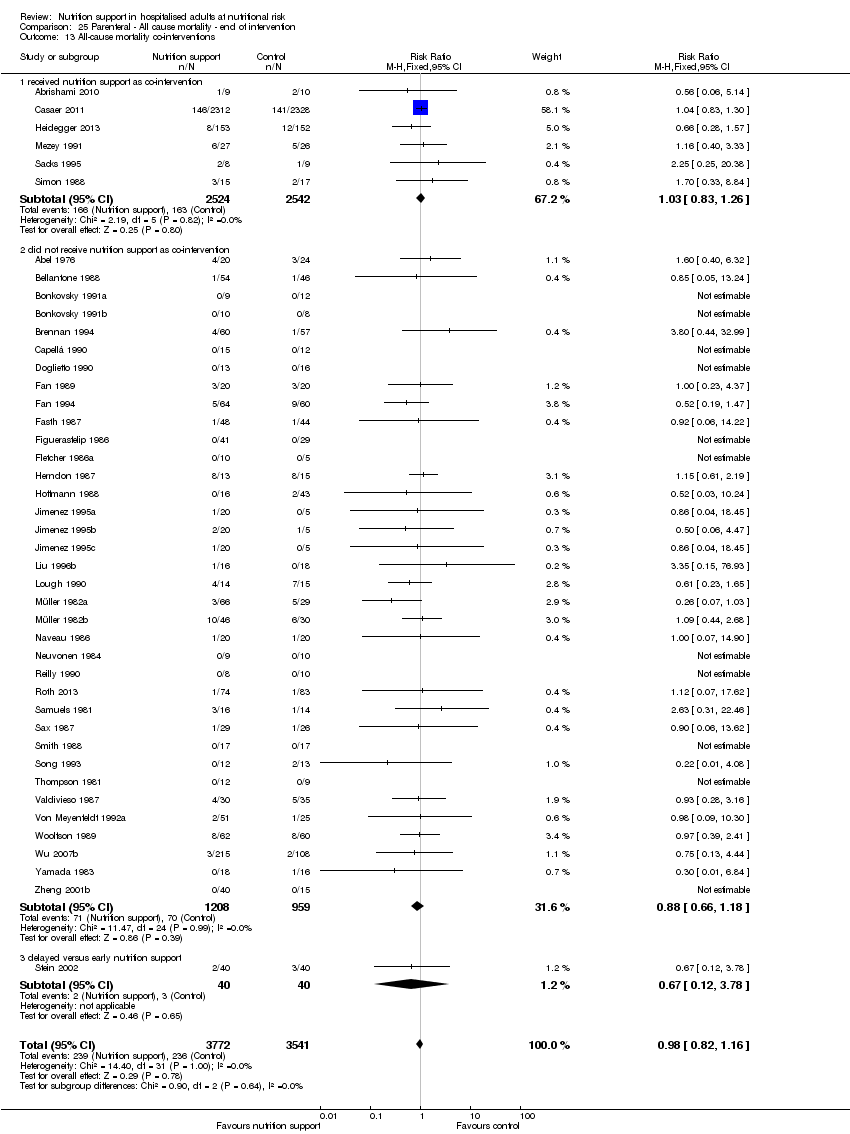
Comparison 25 Parenteral ‐ All cause mortality ‐ end of intervention, Outcome 13 All‐cause mortality co‐interventions.

Comparison 26 Parenteral ‐ All cause mortality ‐ maximum follow‐up, Outcome 1 All‐cause mortality ‐ overall.
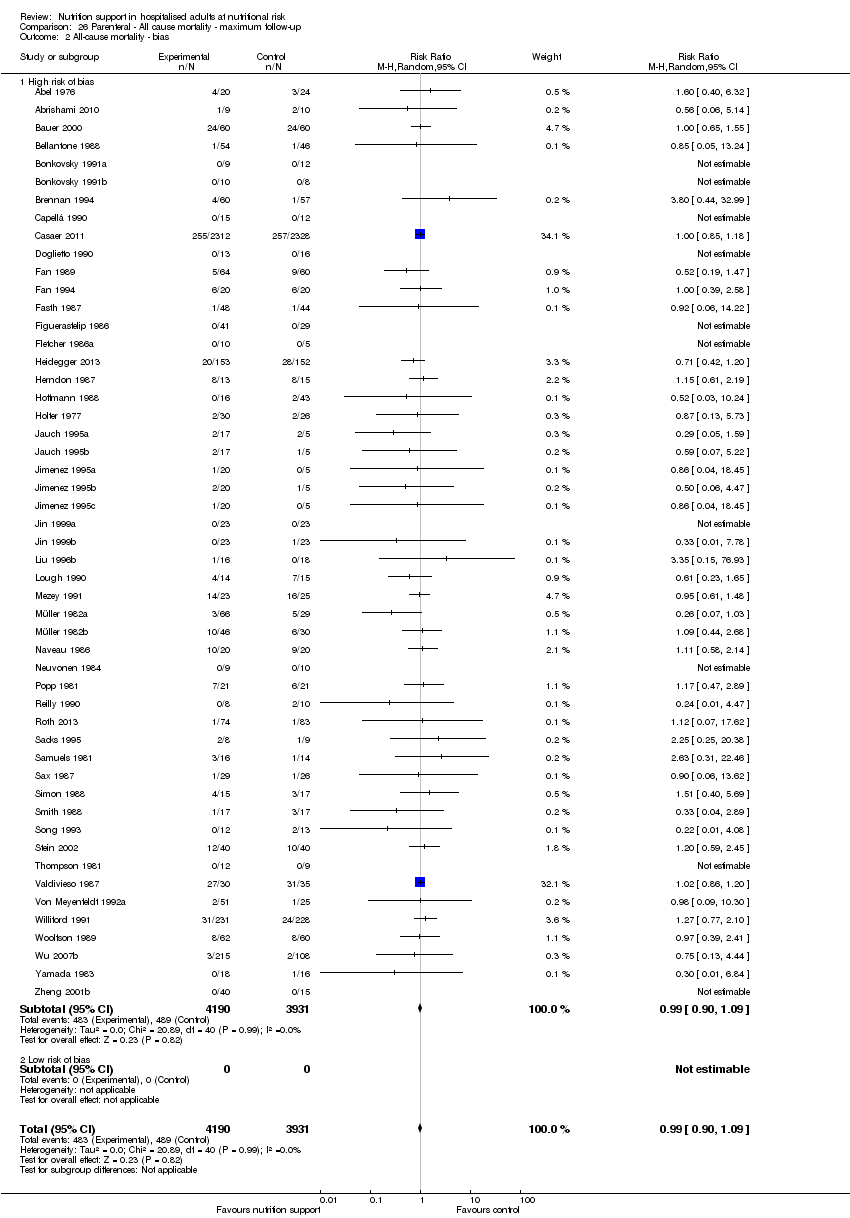
Comparison 26 Parenteral ‐ All cause mortality ‐ maximum follow‐up, Outcome 2 All‐cause mortality ‐ bias.

Comparison 26 Parenteral ‐ All cause mortality ‐ maximum follow‐up, Outcome 3 All‐cause mortality ‐ medical speciality.
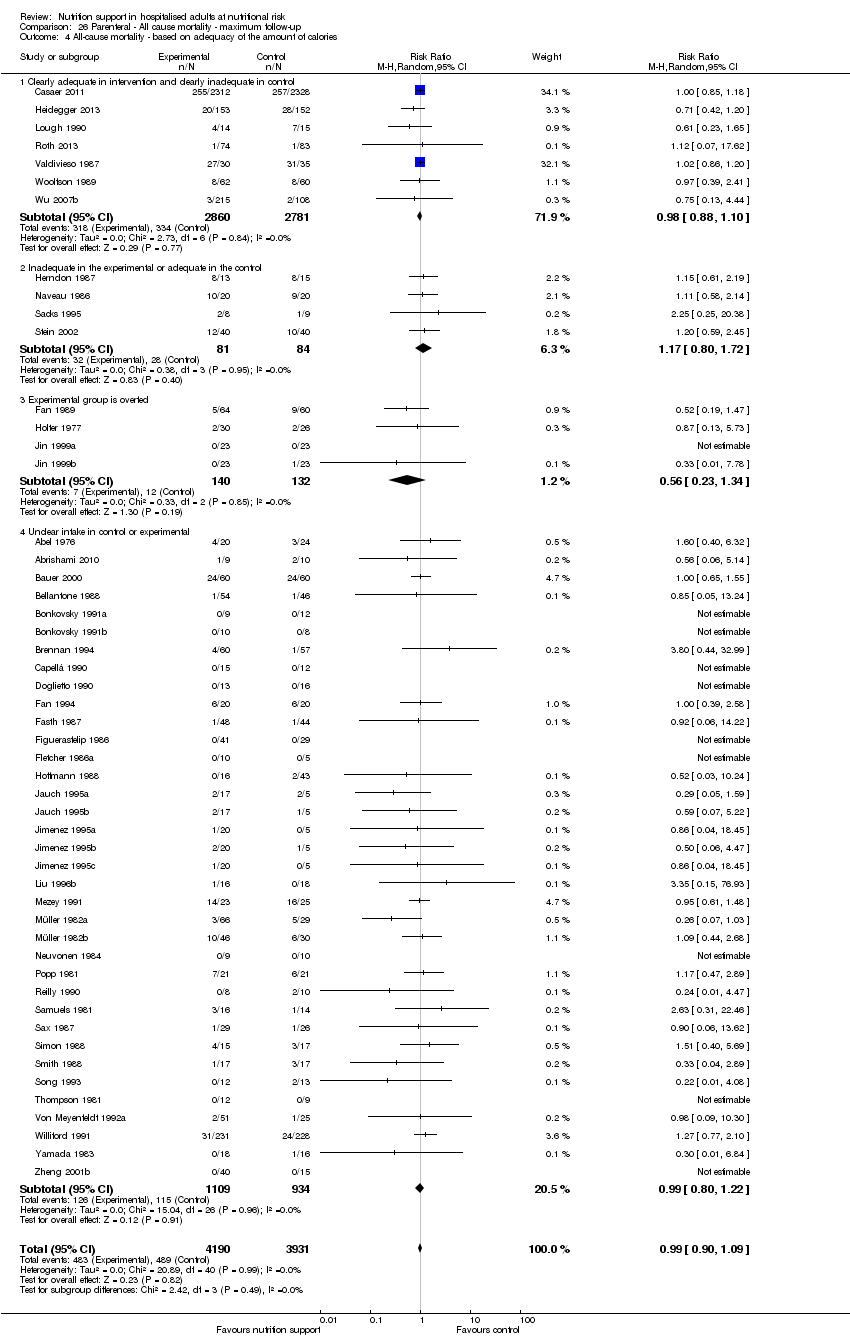
Comparison 26 Parenteral ‐ All cause mortality ‐ maximum follow‐up, Outcome 4 All‐cause mortality ‐ based on adequacy of the amount of calories.

Comparison 26 Parenteral ‐ All cause mortality ‐ maximum follow‐up, Outcome 5 All‐cause mortality ‐ different screening tools.

Comparison 26 Parenteral ‐ All cause mortality ‐ maximum follow‐up, Outcome 6 All‐cause mortality ‐ participants characterised as 'at nutritional risk' due to one of the following conditions.
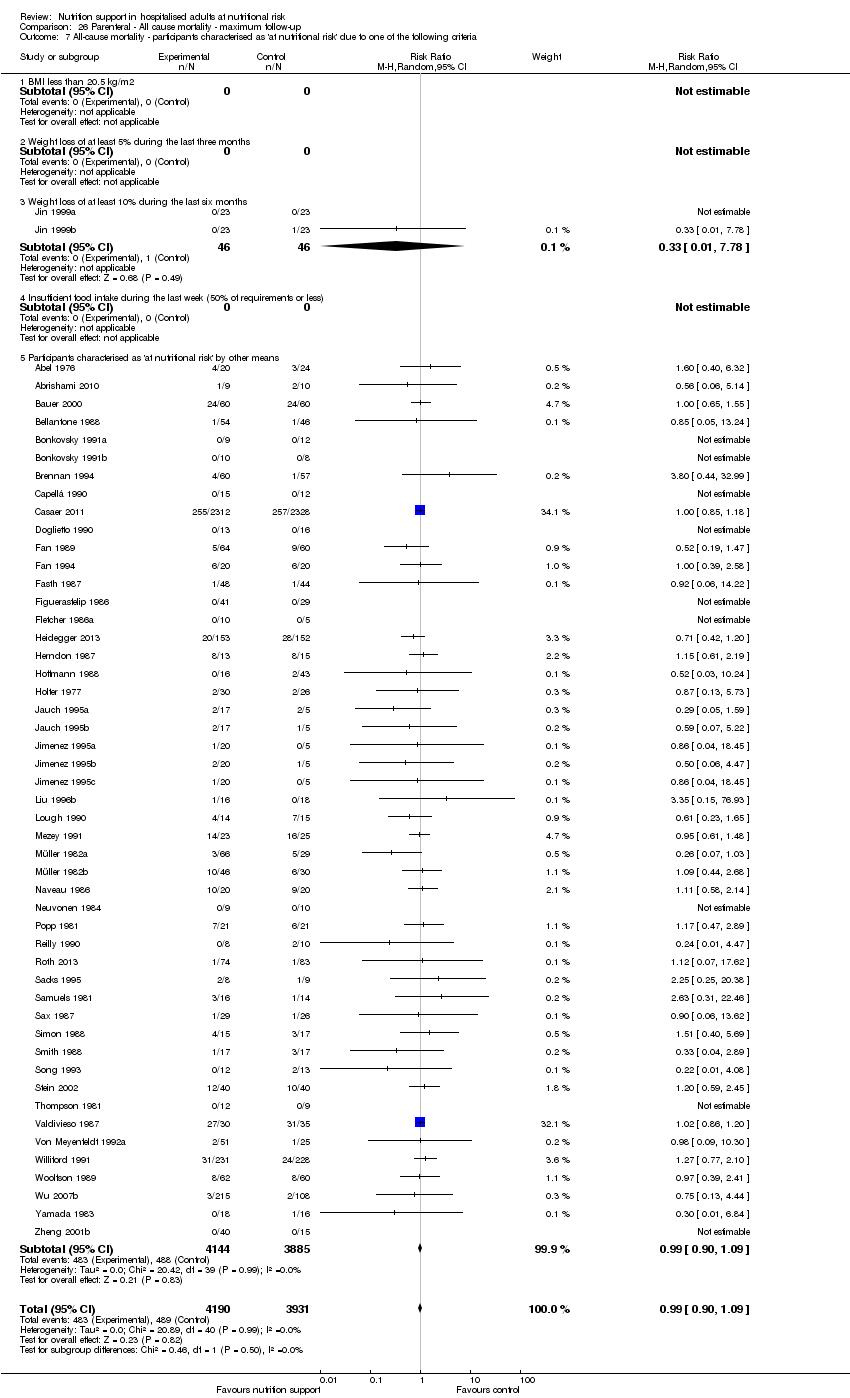
Comparison 26 Parenteral ‐ All cause mortality ‐ maximum follow‐up, Outcome 7 All‐cause mortality ‐ participants characterised as 'at nutritional risk' due to one of the following criteria.

Comparison 26 Parenteral ‐ All cause mortality ‐ maximum follow‐up, Outcome 8 All‐cause mortality ‐ participants characterised as 'at nutritional risk' due to biomarkers or anthropometrics.

Comparison 26 Parenteral ‐ All cause mortality ‐ maximum follow‐up, Outcome 9 All‐cause mortality ‐ randomisation year.
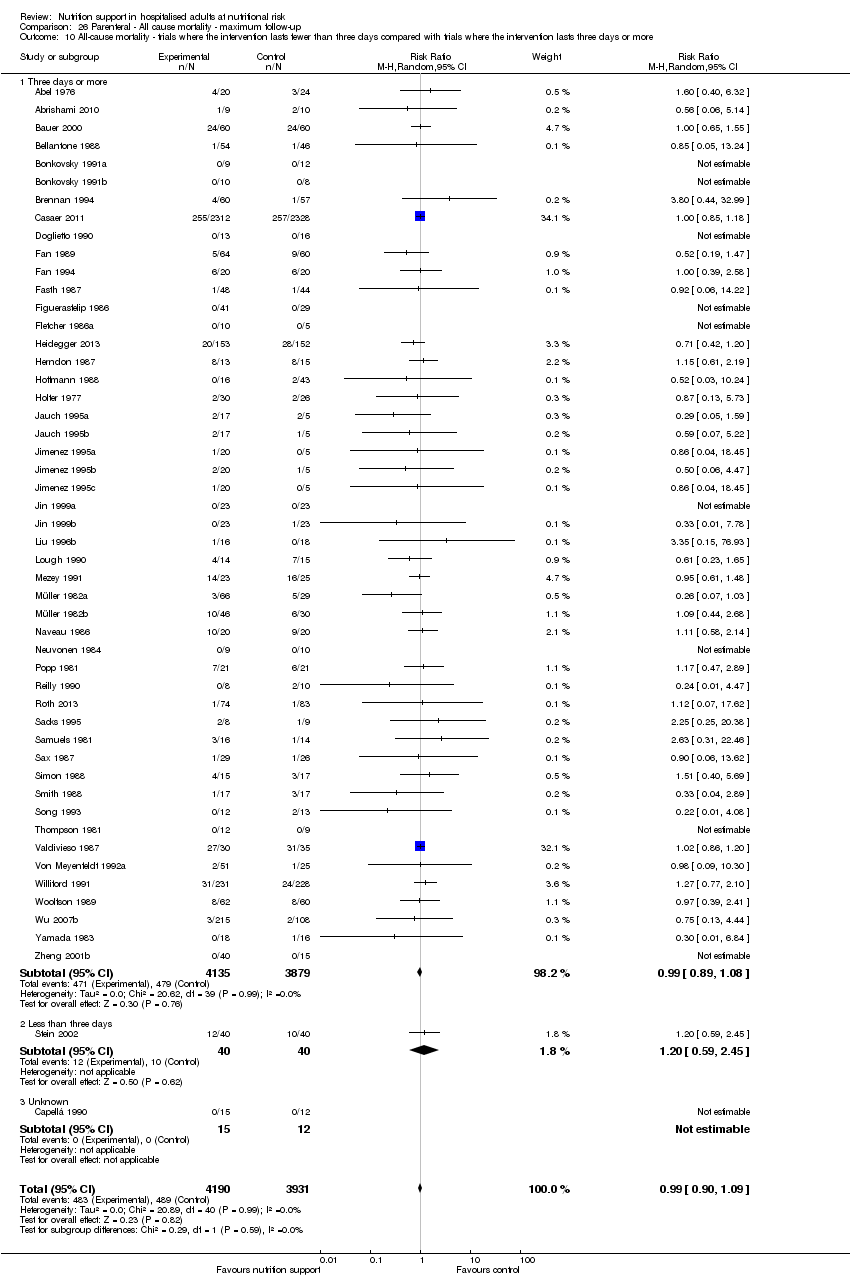
Comparison 26 Parenteral ‐ All cause mortality ‐ maximum follow‐up, Outcome 10 All‐cause mortality ‐ trials where the intervention lasts fewer than three days compared with trials where the intervention lasts three days or more.

Comparison 26 Parenteral ‐ All cause mortality ‐ maximum follow‐up, Outcome 11 All‐cause mortality ‐ 'best‐worst case' scenario.

Comparison 26 Parenteral ‐ All cause mortality ‐ maximum follow‐up, Outcome 12 All‐cause mortality ‐ 'worst‐best case' scenario.

Comparison 26 Parenteral ‐ All cause mortality ‐ maximum follow‐up, Outcome 13 All‐cause mortality co‐interventions.
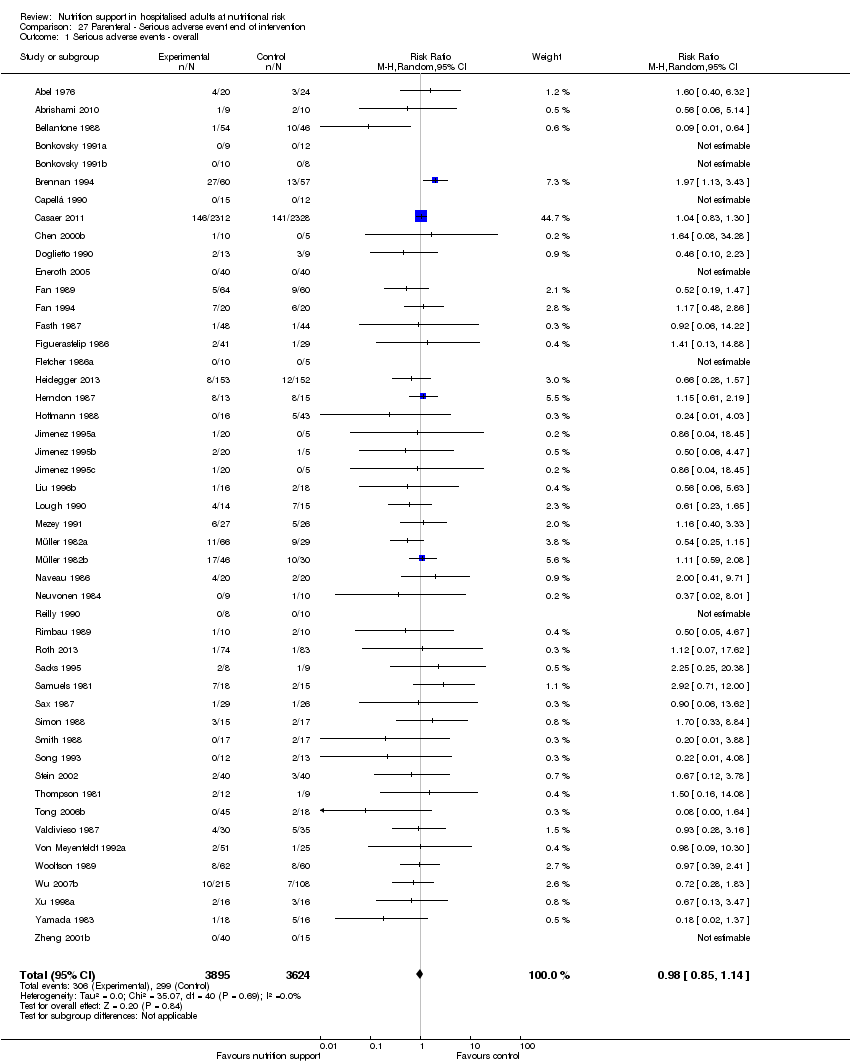
Comparison 27 Parenteral ‐ Serious adverse event end of intervention, Outcome 1 Serious adverse events ‐ overall.

Comparison 27 Parenteral ‐ Serious adverse event end of intervention, Outcome 2 Serious adverse events ‐ bias.

Comparison 27 Parenteral ‐ Serious adverse event end of intervention, Outcome 3 Serious adverse events ‐ by medical specialty.

Comparison 27 Parenteral ‐ Serious adverse event end of intervention, Outcome 4 Serious adverse events ‐ based on adequacy of the amount of calories.

Comparison 27 Parenteral ‐ Serious adverse event end of intervention, Outcome 5 Serious adverse events ‐ different screening tools.

Comparison 27 Parenteral ‐ Serious adverse event end of intervention, Outcome 6 Serious adverse events ‐ participants characterised as 'at nutritional risk' due to one of the following conditions.

Comparison 27 Parenteral ‐ Serious adverse event end of intervention, Outcome 7 Serious adverse events ‐ participants characterised as 'at nutritional risk' due to one of the following criteria.

Comparison 27 Parenteral ‐ Serious adverse event end of intervention, Outcome 8 Serious adverse events ‐ participants characterised as 'at nutritional risk' due to biomarkers or anthropometrics.

Comparison 27 Parenteral ‐ Serious adverse event end of intervention, Outcome 9 Serious adverse events ‐ randomisation year.

Comparison 27 Parenteral ‐ Serious adverse event end of intervention, Outcome 10 Serious adverse events ‐ trials where the intervention lasts fewer than three days compared with trials where the intervention lasts three days or more.

Comparison 27 Parenteral ‐ Serious adverse event end of intervention, Outcome 11 Serious adverse events ‐ 'best‐worst case' scenario.
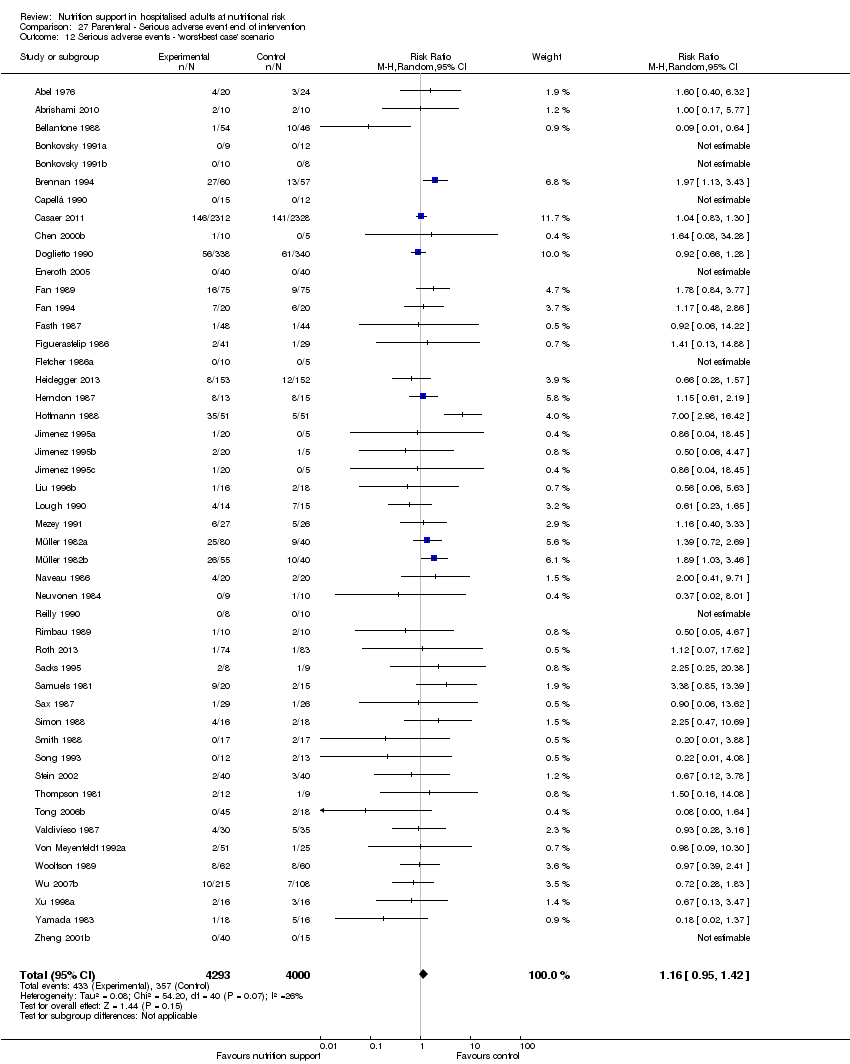
Comparison 27 Parenteral ‐ Serious adverse event end of intervention, Outcome 12 Serious adverse events ‐ 'worst‐best case' scenario.

Comparison 27 Parenteral ‐ Serious adverse event end of intervention, Outcome 13 Serious adverse events co‐interventions.

Comparison 28 Parenteral ‐ Serious adverse event maximum follow‐up, Outcome 1 Serious adverse events ‐ overall.
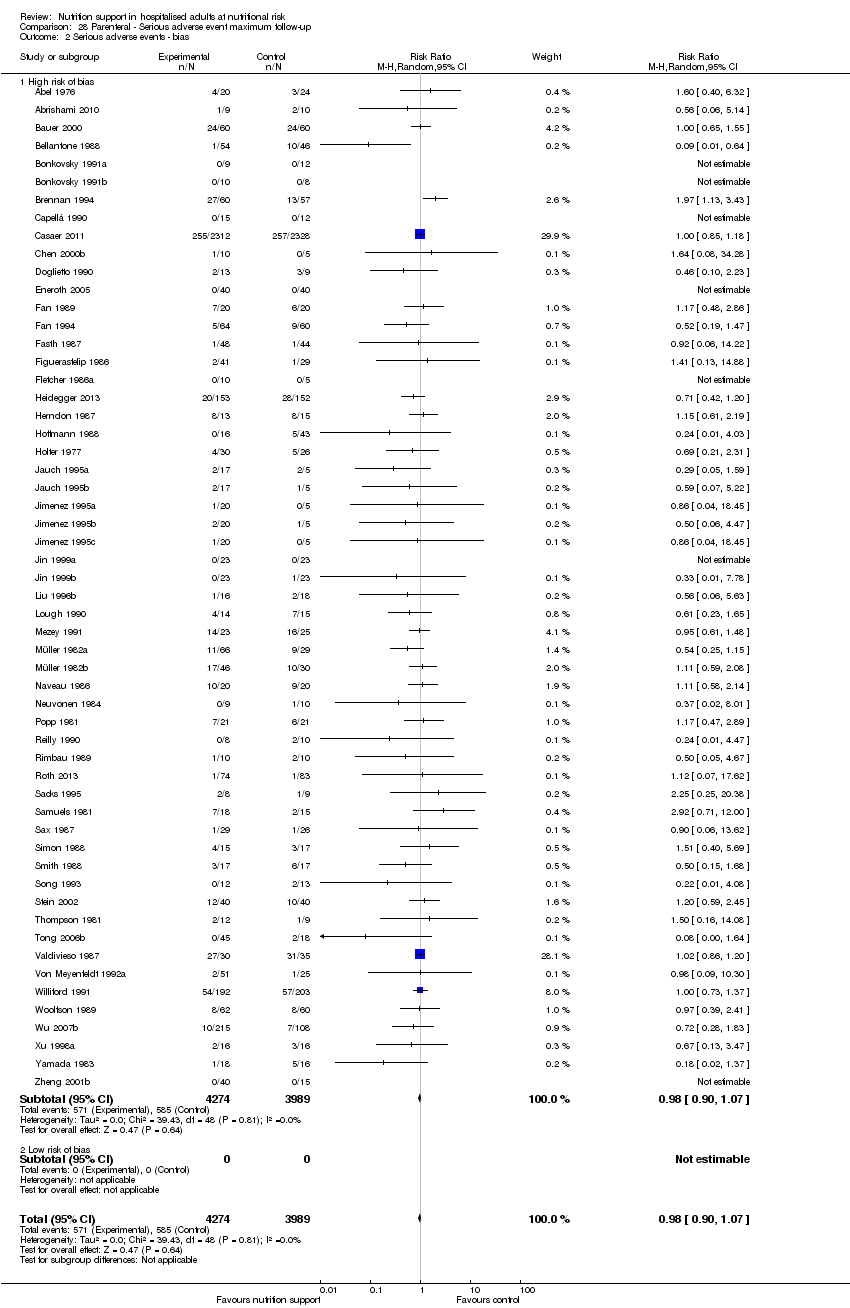
Comparison 28 Parenteral ‐ Serious adverse event maximum follow‐up, Outcome 2 Serious adverse events ‐ bias.

Comparison 28 Parenteral ‐ Serious adverse event maximum follow‐up, Outcome 3 Serious adverse events ‐ by medical speciality.

Comparison 28 Parenteral ‐ Serious adverse event maximum follow‐up, Outcome 4 Serious adverse events ‐ based on adequacy of the amount of calories.

Comparison 28 Parenteral ‐ Serious adverse event maximum follow‐up, Outcome 5 Serious adverse events ‐ different screening tools.
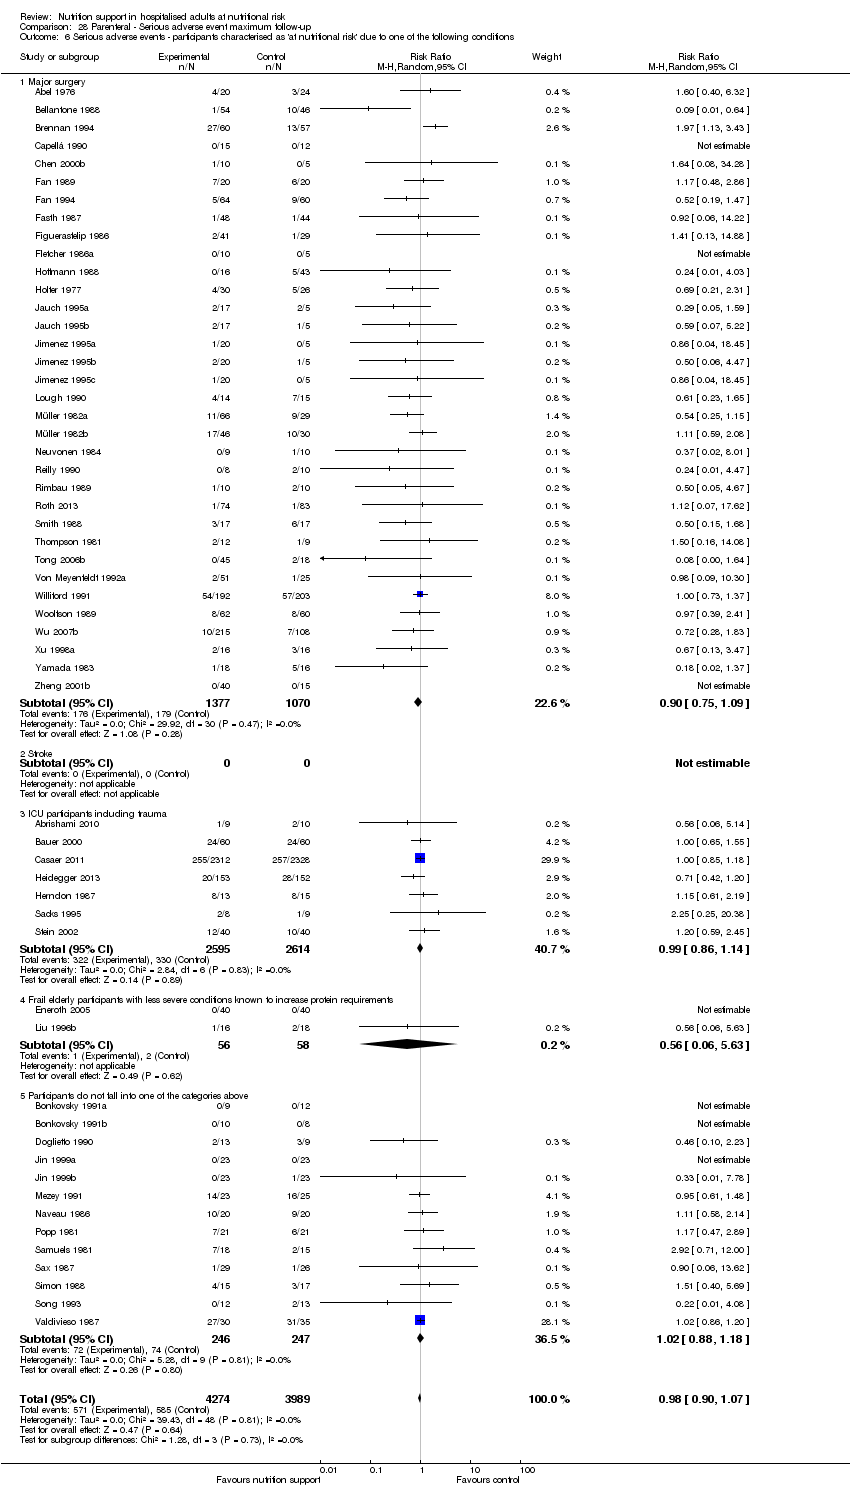
Comparison 28 Parenteral ‐ Serious adverse event maximum follow‐up, Outcome 6 Serious adverse events ‐ participants characterised as 'at nutritional risk' due to one of the following conditions.

Comparison 28 Parenteral ‐ Serious adverse event maximum follow‐up, Outcome 7 Serious adverse events ‐ participants characterised as 'at nutritional risk' due to one of the following criteria.
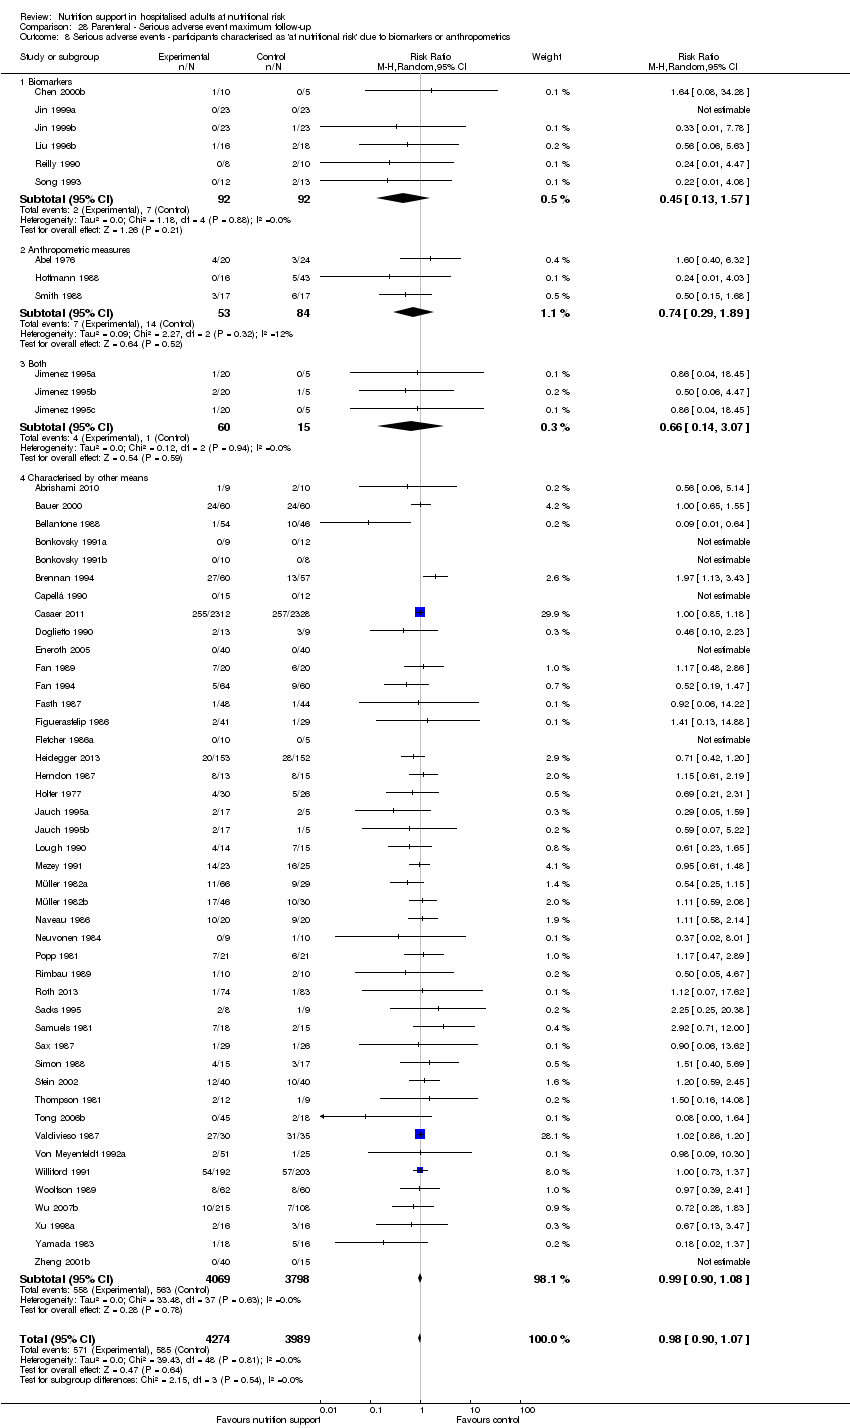
Comparison 28 Parenteral ‐ Serious adverse event maximum follow‐up, Outcome 8 Serious adverse events ‐ participants characterised as 'at nutritional risk' due to biomarkers or anthropometrics.
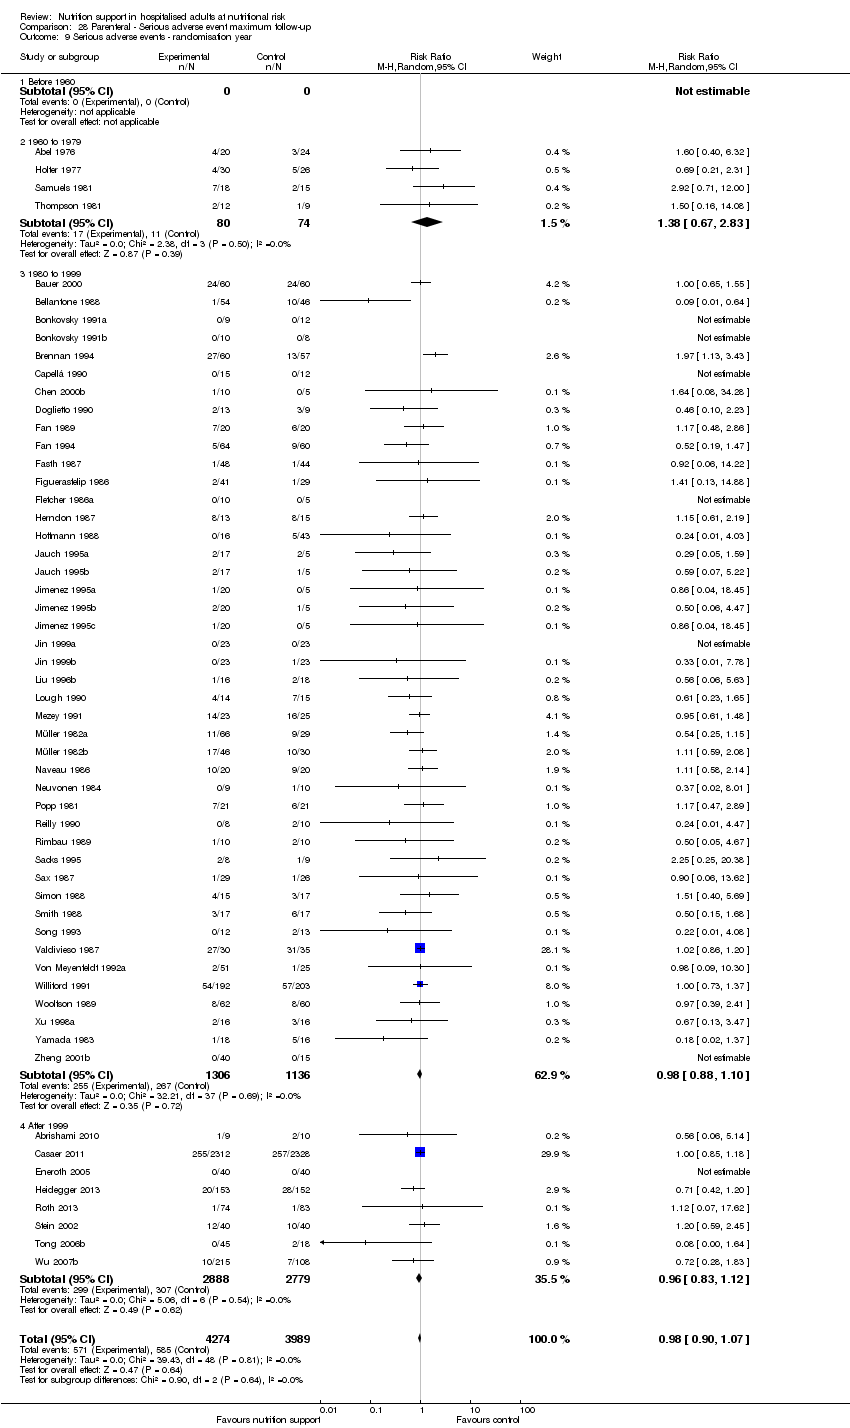
Comparison 28 Parenteral ‐ Serious adverse event maximum follow‐up, Outcome 9 Serious adverse events ‐ randomisation year.

Comparison 28 Parenteral ‐ Serious adverse event maximum follow‐up, Outcome 10 Serious adverse events ‐ trials where the intervention lasts fewer than three days compared with trials where the intervention lasts three days or more.

Comparison 28 Parenteral ‐ Serious adverse event maximum follow‐up, Outcome 11 Serious adverse events ‐ 'best‐worst case' scenario.

Comparison 28 Parenteral ‐ Serious adverse event maximum follow‐up, Outcome 12 Serious adverse events ‐ 'worst‐best case' scenario.
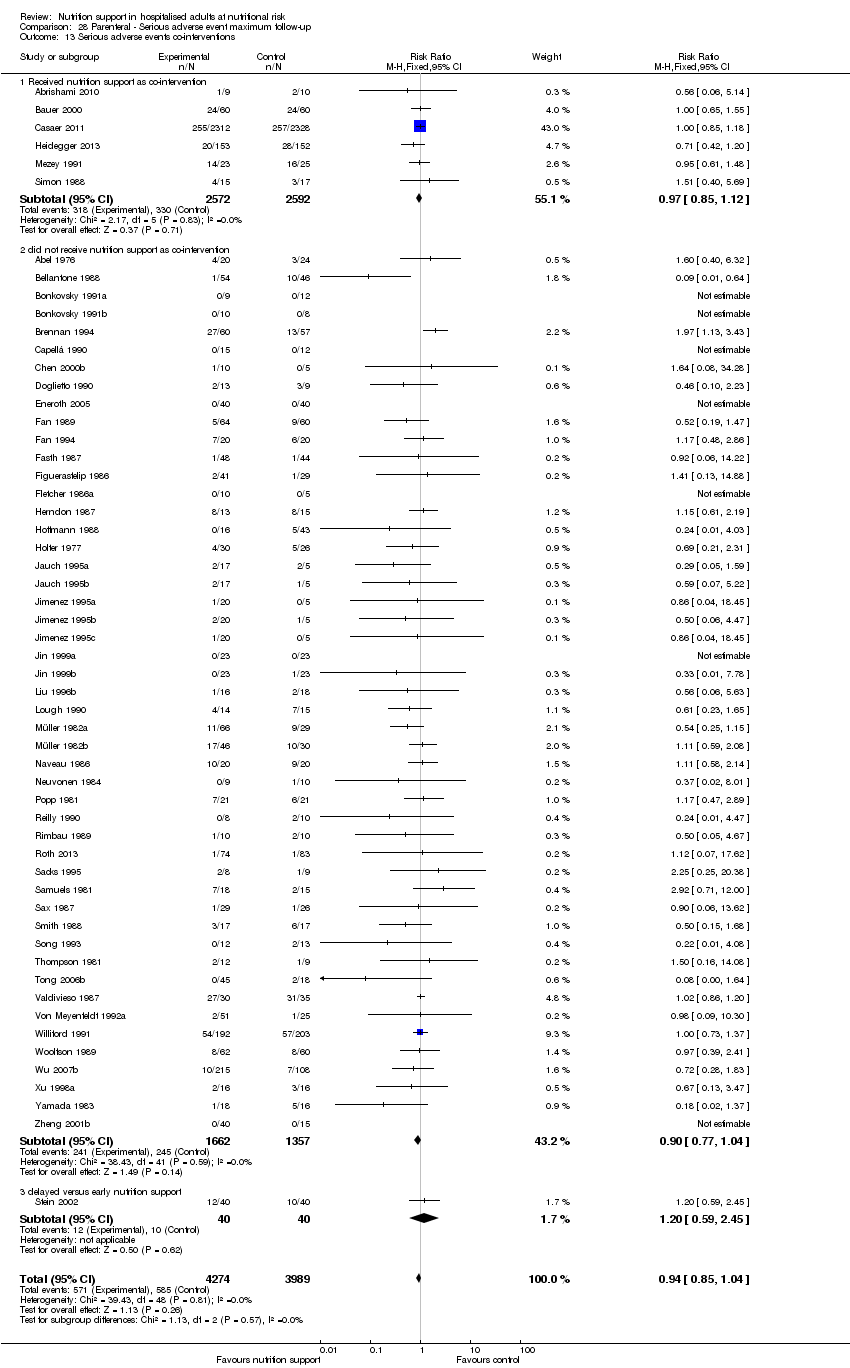
Comparison 28 Parenteral ‐ Serious adverse event maximum follow‐up, Outcome 13 Serious adverse events co‐interventions.

Comparison 29 Morbidity ‐ end of intervention, Outcome 1 Morbidity ‐ overall.

Comparison 30 Morbidity ‐ maximum follow‐up, Outcome 1 Morbidity ‐ overall.

Comparison 31 BMI ‐ end of intervention, Outcome 1 BMI ‐ overall.

Comparison 31 BMI ‐ end of intervention, Outcome 2 BMI ‐ bias.

Comparison 31 BMI ‐ end of intervention, Outcome 3 BMI ‐ mode of administration.

Comparison 31 BMI ‐ end of intervention, Outcome 4 BMI ‐ by medical delivery.
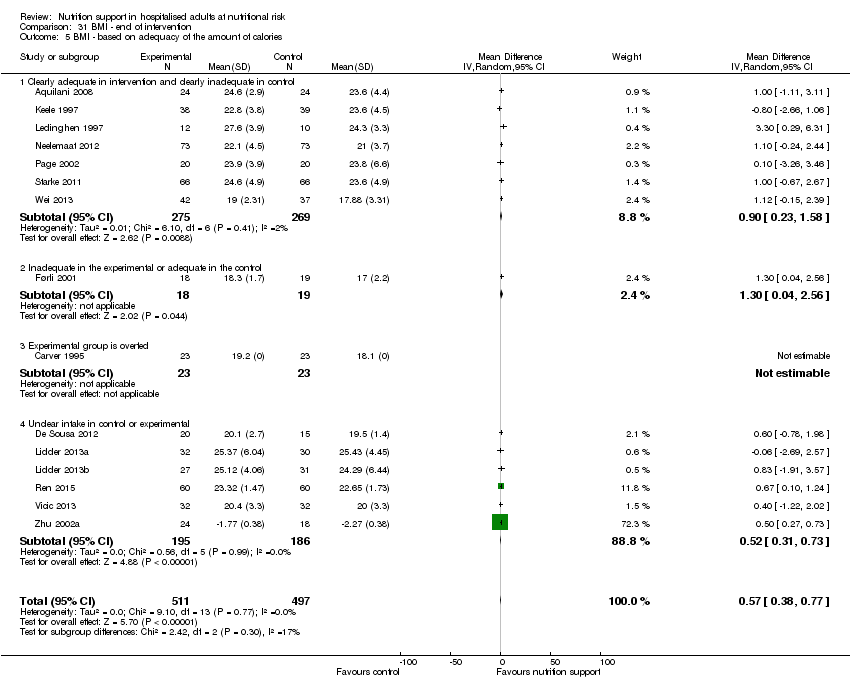
Comparison 31 BMI ‐ end of intervention, Outcome 5 BMI ‐ based on adequacy of the amount of calories.

Comparison 31 BMI ‐ end of intervention, Outcome 6 BMI ‐ different screening tools.
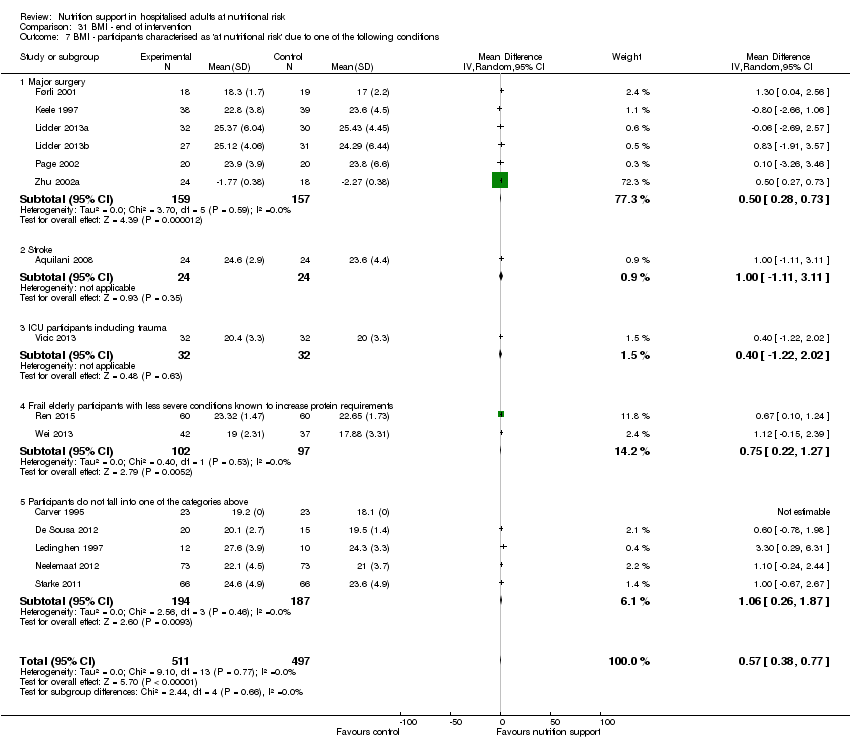
Comparison 31 BMI ‐ end of intervention, Outcome 7 BMI ‐ participants characterised as 'at nutritional risk' due to one of the following conditions.

Comparison 31 BMI ‐ end of intervention, Outcome 8 BMI ‐ participants characterised as 'at nutritional risk' due to one of the following criteria.

Comparison 31 BMI ‐ end of intervention, Outcome 9 BMI ‐ participants characterised as 'at nutritional risk' due to biomarkers of anthropometrics.

Comparison 31 BMI ‐ end of intervention, Outcome 10 BMI ‐ randomisation year.

Comparison 31 BMI ‐ end of intervention, Outcome 11 BMI ‐ trials where the intervention lasts fewer than three days compared with trials where the intervention lasts three days or more.

Comparison 32 BMI ‐ maximum follow‐up, Outcome 1 BMI ‐ overall.

Comparison 32 BMI ‐ maximum follow‐up, Outcome 2 BMI ‐ bias.

Comparison 32 BMI ‐ maximum follow‐up, Outcome 3 BMI ‐ mode of delivery.

Comparison 32 BMI ‐ maximum follow‐up, Outcome 4 BMI ‐ by medical speciality.

Comparison 32 BMI ‐ maximum follow‐up, Outcome 5 BMI ‐ based on adequacy of the amount of calories.

Comparison 32 BMI ‐ maximum follow‐up, Outcome 6 BMI ‐ different screening tools.

Comparison 32 BMI ‐ maximum follow‐up, Outcome 7 BMI ‐ participants characterised as 'at nutritional risk' due to one of the following conditions.

Comparison 32 BMI ‐ maximum follow‐up, Outcome 8 BMI ‐ participants characterised as 'at nutritional risk' due to one of the following criteria.
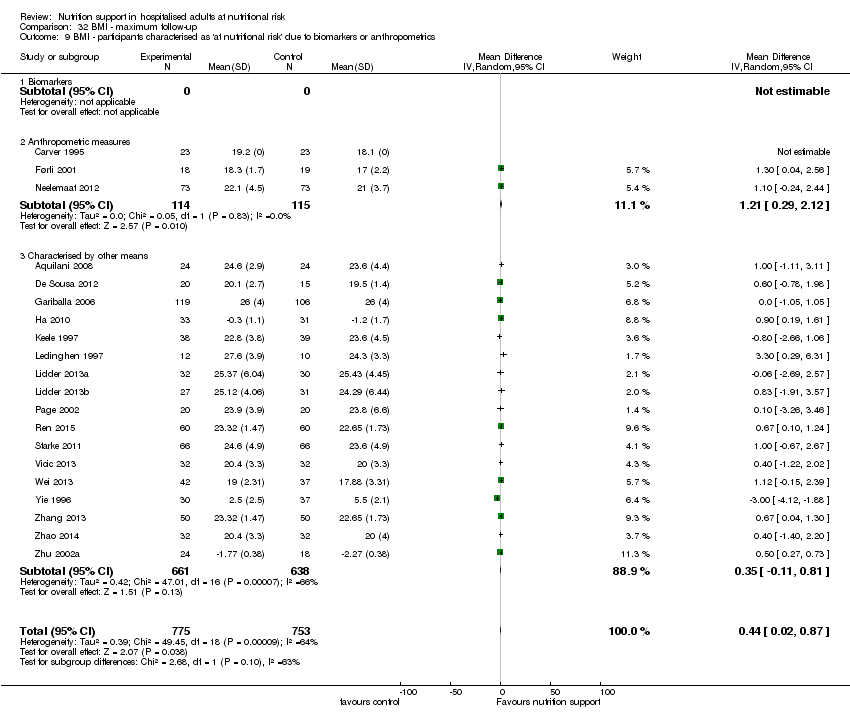
Comparison 32 BMI ‐ maximum follow‐up, Outcome 9 BMI ‐ participants characterised as 'at nutritional risk' due to biomarkers or anthropometrics.

Comparison 32 BMI ‐ maximum follow‐up, Outcome 10 BMI ‐ randomisation year.

Comparison 32 BMI ‐ maximum follow‐up, Outcome 11 BMI ‐ trials where the intervention lasts fewer than three days compared with trials where the intervention lasts three days or more.

Comparison 33 Weight ‐ end of intervention, Outcome 1 Weight ‐ overall.

Comparison 33 Weight ‐ end of intervention, Outcome 2 Weight ‐ bias.

Comparison 33 Weight ‐ end of intervention, Outcome 3 Weight ‐ mode of delivery.

Comparison 33 Weight ‐ end of intervention, Outcome 4 Weight ‐ by medical speciality.

Comparison 33 Weight ‐ end of intervention, Outcome 5 Weight ‐ based on adequacy of the amount of calories.

Comparison 33 Weight ‐ end of intervention, Outcome 6 Weight ‐ different screening tools.

Comparison 33 Weight ‐ end of intervention, Outcome 7 Weight ‐ participants characterised as 'at nutritional risk' due to one of the following conditions.
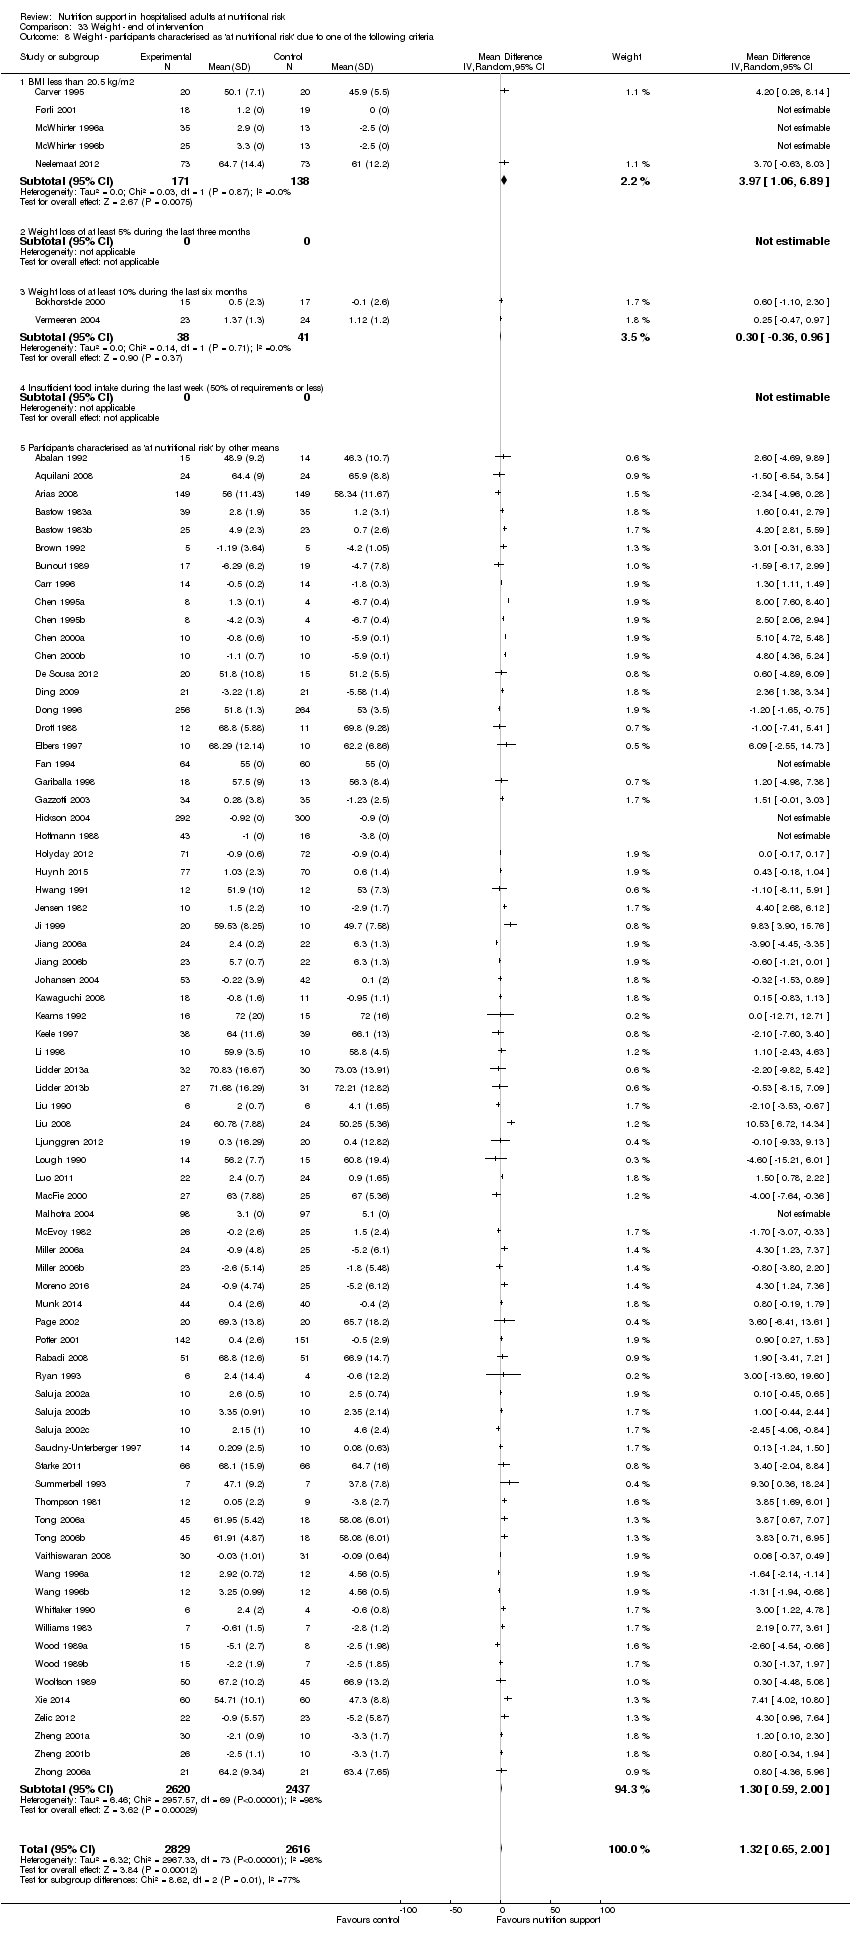
Comparison 33 Weight ‐ end of intervention, Outcome 8 Weight ‐ participants characterised as 'at nutritional risk' due to one of the following criteria.

Comparison 33 Weight ‐ end of intervention, Outcome 9 Weight ‐ participants characterised as 'at nutritional risk' due to biomarkers or anthropometrics.

Comparison 33 Weight ‐ end of intervention, Outcome 10 Weight ‐ randomisation year.
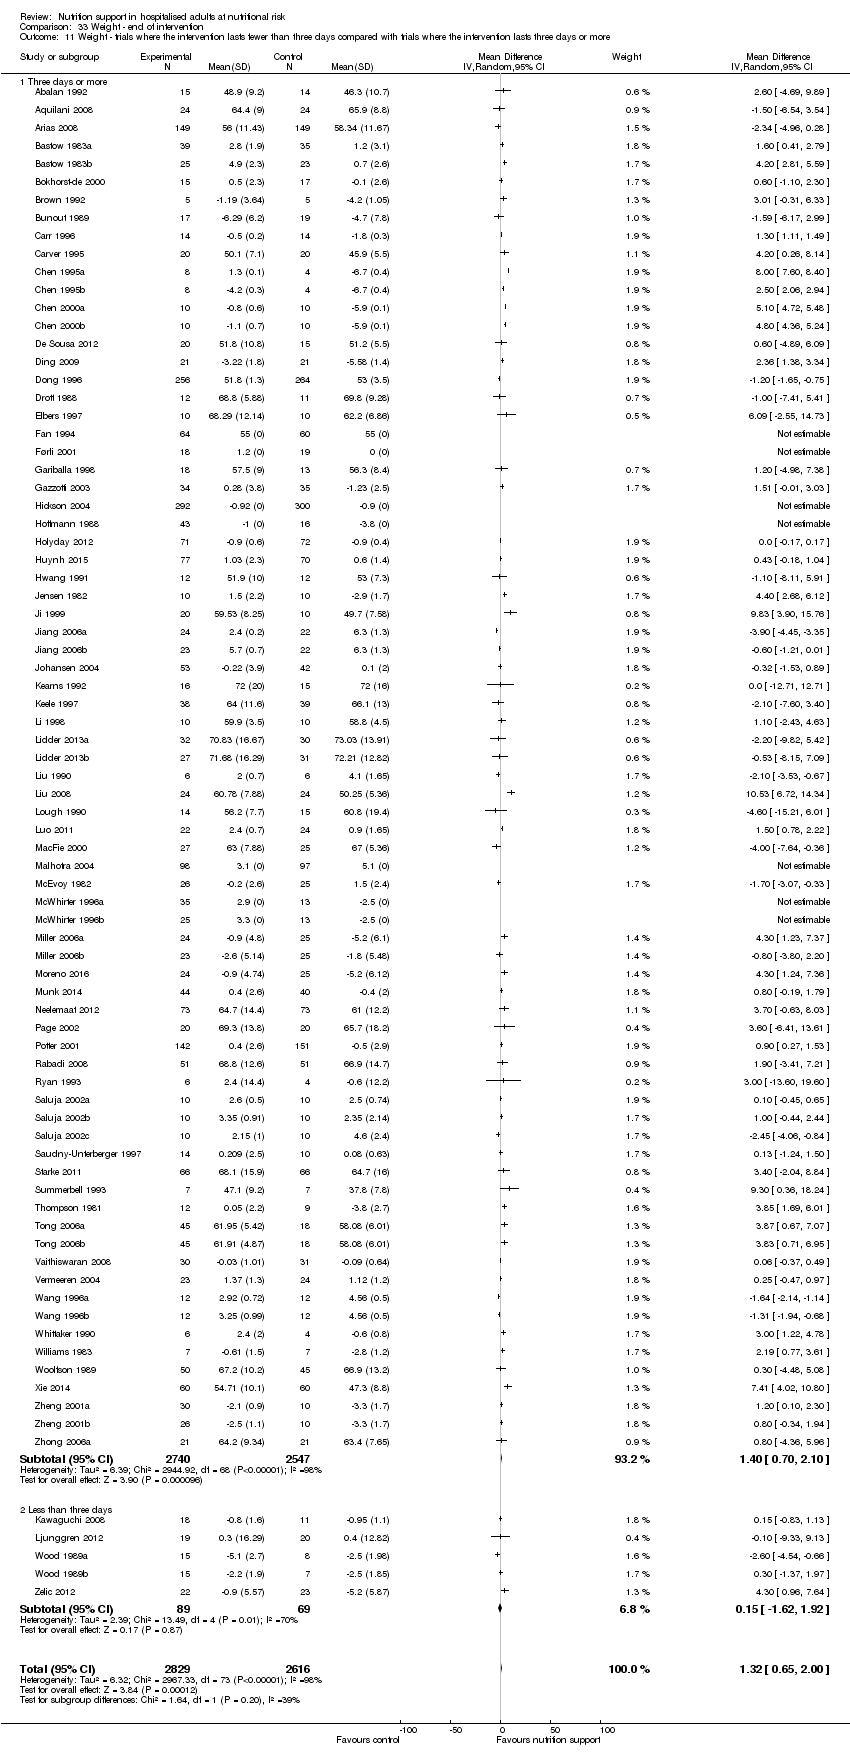
Comparison 33 Weight ‐ end of intervention, Outcome 11 Weight ‐ trials where the intervention lasts fewer than three days compared with trials where the intervention lasts three days or more.

Comparison 33 Weight ‐ end of intervention, Outcome 12 Weight ‐ Missing SDs.

Comparison 34 Weight ‐ maximum follow‐up, Outcome 1 Weight ‐ overall.

Comparison 34 Weight ‐ maximum follow‐up, Outcome 2 Weight ‐ bias.
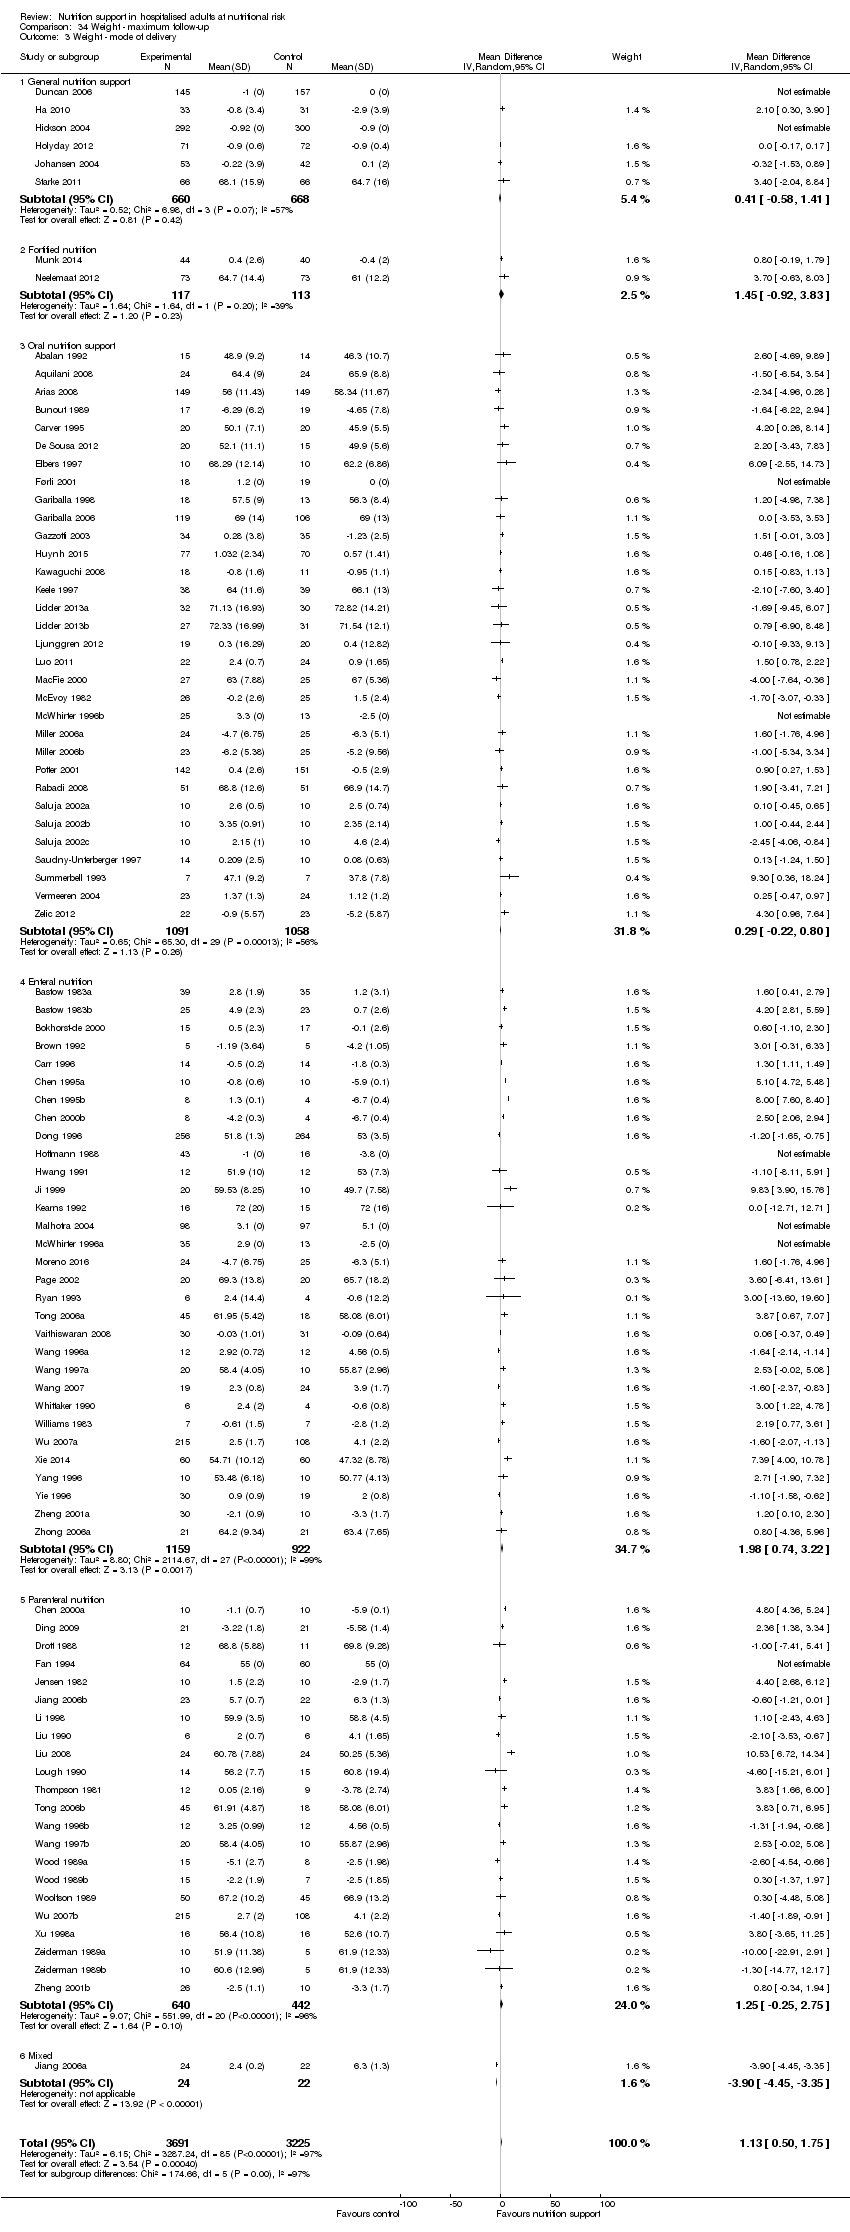
Comparison 34 Weight ‐ maximum follow‐up, Outcome 3 Weight ‐ mode of delivery.

Comparison 34 Weight ‐ maximum follow‐up, Outcome 4 Weight ‐ by medical speciality.

Comparison 34 Weight ‐ maximum follow‐up, Outcome 5 Weight ‐ based on adequacy of the amount of nutrition.

Comparison 34 Weight ‐ maximum follow‐up, Outcome 6 Weight ‐ different screening tools.

Comparison 34 Weight ‐ maximum follow‐up, Outcome 7 Weight ‐ participants characterised as 'at nutritional risk' due to one of the following conditions.

Comparison 34 Weight ‐ maximum follow‐up, Outcome 8 Weight ‐ participants characterised as 'at nutritional risk' due to one of the following criteria.

Comparison 34 Weight ‐ maximum follow‐up, Outcome 9 Weight ‐ participants characterised as 'at nutritional risk' due to biomarkers or anthropometrics.

Comparison 34 Weight ‐ maximum follow‐up, Outcome 10 Weight ‐ randomisation year.
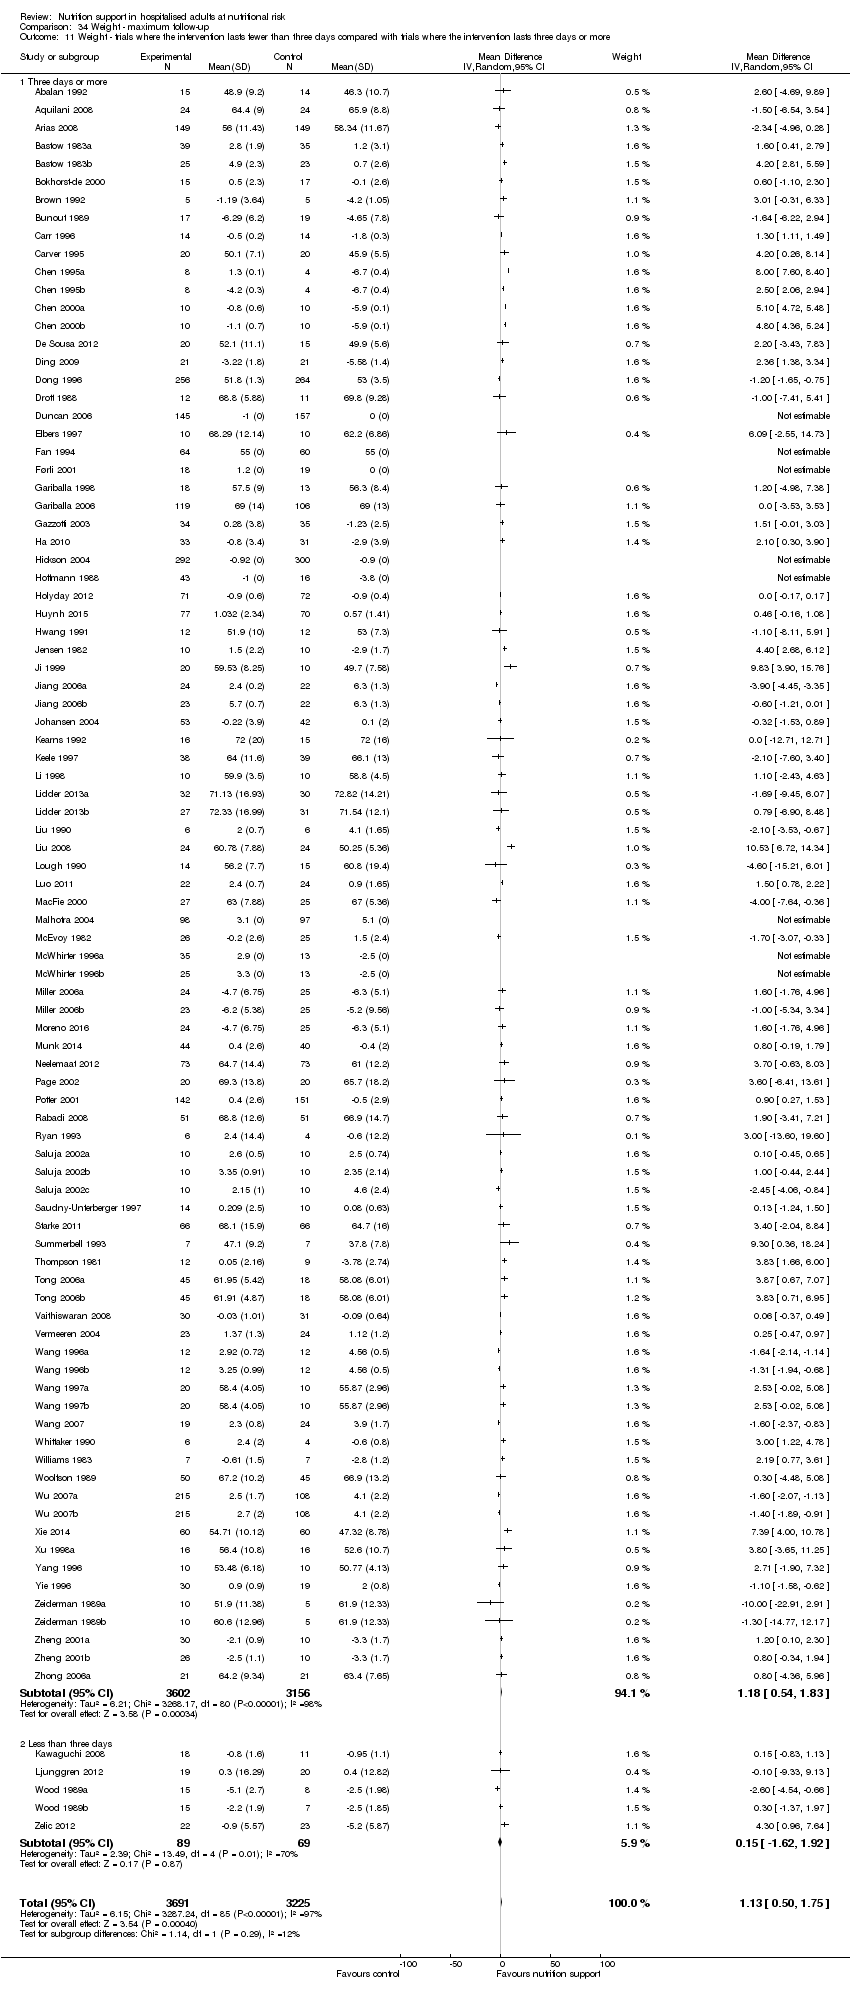
Comparison 34 Weight ‐ maximum follow‐up, Outcome 11 Weight ‐ trials where the intervention lasts fewer than three days compared with trials where the intervention lasts three days or more.

Comparison 35 Hand‐grip strength ‐ end of intervention, Outcome 1 Hand‐grip strength ‐ overall.

Comparison 36 Hand‐grip strength ‐ maximum follow‐up, Outcome 1 Hand‐grip strength ‐ overall.

Comparison 37 Six‐minute walking distance ‐ end of intervention, Outcome 1 Six‐minute walking distance ‐ overall.
| Nutrition support versus no intervention, placebo, or treatment as usual in hospitalised adults at nutritional risk | ||||||
| Patient or population: hospitalised adults at nutritional risk | ||||||
| Outcomes | Anticipated absolute effects* (95% CI) | Relative effect | № of participants | Quality of the evidence | Comments | |
| Risk with no intervention, placebo, or treatment‐as‐usual | Risk with nutrition support | |||||
| All‐cause mortality | ||||||
| ‐ at end of intervention | Study population | RR 0.94 | 21,758 | ⊕⊕⊝⊝ | Trial Sequential Analysis of all nutrition support trials shows that the futility area is reached. This leads us to conclude that the possible intervention effect, if any, is less than 11%. Multiple eligible treatments were used in 9 trials generating a further 13 comparisons (= 127 studies). | |
| 83 per 1.000 | 78 per 1.000 | |||||
| ‐ at maximum follow‐up | Study population | RR 0.93 | 23170 | ⊕⊕⊝⊝ | Trial Sequential Analysis of all nutrition support trials shows that the futility area is reached. This leads us to conclude that any possible intervention effect, if any, is less than 10%. Multiple eligible treatments were used in 10 trials generating a further 14 comparisons (= 141 studies). | |
| 132 per 1.000 | 122 per 1.000 | |||||
| Serious adverse events | ||||||
| ‐ at end of intervention | Study population | RR 0.93 | 22,087 | ⊕⊕⊝⊝ | Trial Sequential Analysis of all nutrition support trials shows that the futility area is reached. This leads us to conclude that any possible intervention effect, if any, is less than 11%. Multiple eligible treatments were used in 10 trials generating a further 14 comparisons (= 137 studies). | |
| 99 per 1.000 | 92 per 1.000 | |||||
| at maximum follow‐up | Study population | RR 0.91 | 23,413 | ⊕⊕⊝⊝ | Trial Sequential Analysis of all nutrition support trials shows that the futility area is reached. This leads us to conclude that any possible intervention effect, if any, is less than 10%. Multiple eligible treatments were used in 11 trials generating a further 15 comparisons (= 152 studies). | |
| 152 per 1.000 | 138 per 1.000 | |||||
| Health‐related quality of life | ||||||
| ‐at end of intervention | We found that nutrition support of any type for participants at nutritional risk (defined by our inclusion criteria, including as defined by the trial investigators) did not show any benefit or harm with regard to quality of life at end of intervention or at maximum follow‐up. Few trials used similar quality‐of‐life questionnaires, and only data from EuroQoL utility score and SF‐36 could be used in a meta‐analysis. Whichever score was used, we found no beneficial or harmful effects. While most trials found no beneficial or harmful effect of nutrition support, only a few trials found a beneficial effect on specific parameters. All included trials assessing health‐related quality of life were at high risk of bias. | ‐ | (16 RCTs) | ‐ | ||
| at maximum follow‐up ((EuroQol) ) | Control group mean quality of life scores were 0.486 and 0.175. | Quality of life was on average 0.01 units lower | ‐ | 3961 | ⊕⊝⊝⊝ | |
| Weight at the end of intervention | Control group weight ranged from 45.9 to 73.03 kg | MD 1.32 kg higher | ‐ | 5445 | ⊕⊝⊝⊝ | |
| *The risk in the intervention group (and its 95% confidence interval) is based on the assumed risk in the comparison group and the relative effect of the intervention (and its 95% CI). | ||||||
| GRADE Working Group grades of evidence | ||||||
| 1Downgraded by 2 levels because of a very serious risk of bias. | ||||||
| Medical speciality | Experimental group | Control group |
| Emergency medicine | 3 trials used enteral nutrition 8 trials used parenteral nutrition | 7 trials used no intervention 4 trials used treatment as usual |
| Endocrinology | 1 trial used parenteral nutrition | 1 trial used no intervention |
| Gastroenterological surgery | 36 trials used enteral nutrition 13 trials used oral nutrition 40 trials used parenteral nutrition 3 trials used mixed nutrition | 32 trials used no intervention 4 trials used placebo 56 trials used treatment as usual |
| General surgery | 2 trials used parenteral nutrition | 1 trial used no intervention 1 trial used treatment as usual |
| Geriatrics | 1 trial used fortified foods 2 trials used general nutrition support 13 trials used oral nutrition | 9 trials used no intervention 2 trials used placebo 5 trials used treatment as usual |
| Gynaecology | 1 trial used parenteral nutrition | 1 trial used treatment as usual |
| Haematology | 1 trial used parenteral nutrition | 1 trial used placebo |
| Infectious diseases | 2 trials used enteral nutrition | 2 trials used treatment as usual |
| Medical gastroenterology and hepatology | 9 trials used enteral nutrition 3 trials used oral nutrition 5 trials used parenteral nutrition 1 trial used mixed nutrition | 9 trials used no intervention 9 trials used treatment as usual |
| Mixed medical speciality | 2 trials used enteral nutrition 1 trial used fortified foods 1 trial used general nutrition 4 trials used oral nutrition 1 trial used mixed nutrition | 5 trials used no intervention 1 trial used placebo 3 trials used treatment as usual |
| Neprohology | 1 trial used general nutrition | 1 trial used treatment as usual |
| Neurological surgery | 1 trial used parenteral nutrition | 1 trial used treatment as usual |
| Neurology | 3 trials used enteral nutrition 1 trial used general nutrition 5 trials used oral nutrition 1 trial used mixed nutrition | 4 trials used no intervention 6 trials used treatment as usual |
| Oncology | 3 trials used enteral nutrition 1 trial used general nutrition 11 trials used parenteral nutrition 1 trial used mixed nutrition | 9 trials used no intervention 7 trials used treatment as usual |
| Oro‐maxillo‐facial surgery | 1 trial used enteral nutrition 1 trial used oral nutrition | 2 trials used no intervention |
| Orthopaedics | 5 trials used enteral nutrition 4 trials used oral nutrition 1 trial used general nutrition 1 trial used parenteral nutrition 3 trials used mixed nutrition | 7 trials used no intervention 2 trials used placebo 5 trials used treatment as usual |
| Pulmonary diseases | 2 trials used enteral nutrition 3 trials used oral nutrition 3 trials used parenteral nutrition | 1 trial used no intervention 3 trials used placebo 4 trials used treatment as usual |
| Thoracic surgery | 2 enteral nutrition 1 parenteral nutrition 1 mixed nutrition | 1 trial used placebo 3 trials used treatment as usual |
| Trauma surgery | 8 trials used enteral nutrition 3 trials used parenteral nutrition | 6 trial used no intervention 5 trial used treatment as usual |
| Transplant surgery | 1 trial used enteral nutrition 1 trial used oral nutrition 2 trials used parenteral nutrition | 4 trials used treatment as usual |
| Vascular surgery | 1 trial used enteral nutrition 3 trials used parenteral nutrition | 4 trials used treatment as usual |
| Trial | Experimental intervention | Type and number of participants with a serious adverse events (Experimental group) | Proportion of participants with a serious adverse event (Experimental group) | Type and number of participants with a serious adverse events (Control group) | Proportion of participants with a serious adverse event (Control group) |
| Parenteral nutrition | 1 sepsis | 1 out of 54 | 10 sepsis | 10 out of 46 | |
| Parenteral nutrition | 1 anastomotic leak, 3 respiratory infections, 2 respiratory insufficiency | 6 out of 43 | 2 anastomotic leaks, 1 renal failure, 2 abdominal abscesses, 4 respiratory infections, 3 respiratory insufficieny | 12 out of 47 | |
| Parenteral nutrition | 7 anastomotic leaks, 5 pneumonias, 1 GI haemorrhages, 8 GI fistula, 4 ileus, 2 myocardial infarction, 12 abscess, 4 deep infection, 7 peritonitis | 50 out of 60 | 3 anastomotic leaks, 6 pneumonias, 1 pulmonary embolism, 2 GI haemorrhages, 5 GI fistula, 1 myocardial infarction, 2 abscess, 4 deep infection, 2 peritonitis | 26 out of 57 | |
| Enteral nutrition | no serious adverse events reported | 0 out of 16 | 1 anastomotic leak | 1 out of 8 | |
| Enteral nutrition | 1 anastomotic leak | 1 out of 10 | no serious adverse events reported | 0 out of 10 | |
| Enteral nutrition | no serious adverse events reported | 0 out of 21 | 1 septic complication | 1 out of 20 | |
| Oral nutrition | 50 strokes, 23 pulmonary embolisms, 43 DVTs, 28 GI haemorrhages, 28 ACS' | 172 out of 2012 | 43 strokes, 18 pulmonary embolism, 29 DVTs, 18 GI haemorrhage, 22 ACS | 130 out of 2000 | |
| Enteral nutrition | 15 strokes, 6 pulmonary embolisms, 11 DVTs, 22 GI haemorrhages, 7 ACS' | 61 out of 429 | 23 strokes, 8 pulmonary embolisms, 13 DVTs, 11 GI haemorrhages, 13 ACS' | 68 out of 428 | |
| Parenteral nutrition | 3 sepsis | 3 out of 9 | 7 sepsis | 7 out of 12 | |
| Oral nutrition | 20 anastomotic leaks, 14 pneumonias, 2 pulmonary embolisms, 2 renal failure, 6 abdominal abscess, 3 unspecific infection, 10 wound dehiscences, 1 pulmonary failure, 11 gastrointestinal complications, 6 cardiovascular complications, 4 haemoperitoneum | 79 out of 338 | 18 anastomotic leaks, 9 pneumonias, 1 pulmonary embolisms, 3 renal failure, 1 abdominal abscess, 2 unspecific infection, 3 wound dehiscences, 2 pulmonary failure, 6 bacteraemia, 23 gastrointestinal complications, 6 cardiovascular complications, 5 haemoperitoneum | 79 out of 340 | |
| Parenteral nutrition | 1 respiratory infection | 1 out of 21 | 2 respiratory infection | 2 out of 21 | |
| Enteral nutrition | no serious adverse events reported | 0 out of 256 | 6 anastomotic leaks | 6 out of 264 | |
| Parenteral nutrition | 4 GI haemorrhages, 4 GI fistulas, 4 hepatic comas | 12 out of 64 | 1 GI haemorrhages, 5 GI fistulas, 4 hepatic comas | 10 out of 60 | |
| Enteral nutrition | 25 pressure sores | 25 out of 48 | 30 pressure sores | 30 out of 53 | |
| Enteral nutrition | no serious adverse events reported | 0 out of 43 | 3 anastomotic leaks, 2 myocardial infarction | 5 out of 16 | |
| Enteral nutrition | 2 abdominal abscess | 2 out of 20 | no serious adverse events reported | 0 out of 10 | |
| General nutrition | 4 pneumonia, 1 DVTs, 4 sepsis, 2 empyemas, 0 gastroenteritis, 1 GI complications, | 12 out of 108 | 4 pneumonia, 1 stroke, 2 sepsis, 1 gastroenteritis, 2 GI complications | 10 out of 104 | |
| Enteral nutrition | 2 renal failures | 2 out of 16 | 2 renal failures | 2 out of 15 | |
| Oral nutrition | no serious adverse events reported | 0 out of 43 | 1 GI perforation | 1 out of 43 | |
| Oral nutrition | 20 pressure sores | 20 out of 197 | 29 pressure sores | 29 out of 328 | |
| Enteral nutrition | 4 variceal bleedings, 1 peritonitis | 5 out of 12 | 1 peritonitis | 1 out of 10 | |
| Parenteral nutrition | no serious adverse events reported | 0 out of 14 | 1 anastomotic leak, 1 GI fistula | 2 out of 15 | |
| Enteral nutrition | 21 Pneumonia, Wound infection 27, Wound dehiscence 4, anastomotic Leak 7, Septicaemia 20 | 27 out of 98 | Pneumonia 30, Wound infection 31, Wound dehiscence 9, Leak 13, Septicaemia 30. | 31 out of 97 | |
| Enteral nutrition | 8 sepsis | 8 out of 27 | 7 sepsis | 7 out of 29 | |
| Parenteral nutrition | no serious adverse events reported | 0 out of 9 | 1 sepsis | 1 out of 12 | |
| Enteral nutrition | no serious adverse events reported | 0 out of 20 | 1 pulmonary embolism | 1 out of 20 | |
| Enteral nutrition | 2 peritonitis | 2 out of 11 | 5 peritonitis | 5 out of 18 | |
| Enteral nutrition | no serious adverse events reported | 0 out of 30 | 4 GI fistulas | 4 out of 30 | |
| Oral nutrition | no serious adverse events reported | 0 out of 80 | 1 anastomotic leak | 1 out of 81 | |
| Parenteral nutrition | 1 pneumonia | 1 out of 10 | 2 pneumonias | 2 out of 10 | |
| Parenteral nutrition | 2 pneumoperitoneum's | 2 out of 40 | 2 anastomotic leaks, 2 pneumoperitoneum's | 4 out of 40 | |
| Parenteral nutrition | 2 pneumonias, 5 sepsis | 7 out of 16 | 2 sepsis | 2 out of 14 | |
| Enteral nutrition | 1 myocardial infarction | 1 out of 16 | 1 myocardial infarction | 1 out of 16 | |
| Parenteral nutrition | no serious adverse events reported | 0 out of 15 | 2 hepatic encephalopathies | 2 out of 17 | |
| Parenteral nutrition | no serious adverse events reported | 0 out of 17 | 2 respiratory infection | 2 out of 17 | |
| General nutrition | no serious adverse events reported | 0 out of 66 | 1 stroke, 1 DVT, 1 septic arthritis, 2 myocardial infarction | 5 out of 66 | |
| Parenteral nutrition | 1 empyema, 1 pelvic abscess | 2 out of 12 | 1 intraabdominal abscess | 1 out of 9 | |
| Mixed nutrition | 1 hepatic encephalopathy | 1 out of 90 | 4 anastomotic leak, 5 hepatic encephalopathies | 9 out of 36 | |
| Enteral nutrition | 2 sepsis, 2 multi organ failure, | 4 out of 52 | 6 sepsis, 3 multi organ failure | 9 out of 49 | |
| Enteral nutrition | 1 anastomotic leak | 1 out of 13 | 3 anastomotic leaks | 3 out of 15 | |
| Mixed nutrition | 11 anastomotic leaks, 6 DVT, 15 sepsis | 32 out of 430 | 10 anastomotic leaks, 15 sepsis | 25 out of 216 | |
| Parenteral nutrition | 1 wound dehiscence | 1 out of 18 | 1 anastomotic leak, 2 pneumonias, 1 sepsis, 1 ileus | 5 out of 16 | |
| Enteral nutrition | 2 GI haemorrhage | 2 out of 50 | 4 GI haemorrhage | 4 out of 50 |
| Trial | Experimental intervention | Type and number of participants with a serious adverse events (Experimental group) | Proportion of participants with a serious adverse event (Experimental group) | Type and number of participants with a serious adverse events (Control group) | Proportion of participants with a serious adverse event (Control group) |
| Enteral nutrition | 2 anastomotic leaks | 2 out of 64 | 7 anastomotic leaks, 2 GI haemorrhage, 1 myocardial infarction | 10 out of 57 | |
| Enteral nutrition | 2 anastomotic leak, 3 wound dehiscence, 1 myocardial infarction, | 6 out of 30 | 4 anastomotic leak, 1 pulmonary failure | 5 out of 30 | |
| Parenteral nutrition | 1 sepsis | 1 out of 54 | 10 sepsis | 10 out of 46 | |
| Parenteral nutrition | 1 anastomotic leak, 3 respiratory infections, 2 respiratory insufficiencies | 6 out of 43 | 2 anastomotic leaks, 1 renal failure, 2 abdominal abscesses, 4 respiratory infections, 3 respiratory insufficiencies | 12 out of 47 | |
| Parenteral nutrition | 7 anastomotic leaks, 5 pneumonias, 1 GI haemorrhages, 8 GI fistula, 4 ileus, 2 myocardial infarction, 12 abscess, 4 deep infection, 7 peritonitis | 50 out of 60 | 3 anastomotic leaks, 6 pneumonias, 1 pulmonary embolism, 2 GI haemorrhages, 5 GI fistula, 1 myocardial infarction, 2 abscess, 4 deep infection, 2 peritonitis | 26 out of 57 | |
| Enteral nutrition | no serious adverse events reported | 0 out of 16 | 1 anastomotic leak | 1 out of 8 | |
| Enteral nutrition | 1 anastomotic leak | 1 out of 10 | no serious adverse events reported | 0 out of 10 | |
| Enteral nutrition | no serious adverse events reported | 0 out of 21 | 1 septic complication | 1 out of 20 | |
| Enteral nutrition | 2 CNS infections, 13 ventilator associated pneumonias | 15 out of 34 | 2 CNS infections, 12 ventilator associated pneumonias | 14 out of 25 | |
| Oral nutrition | 50 strokes, 23 pulmonary embolisms, 43 DVTs, 28 GI haemorrhages, 28 ACS' | 172 out of 2012 | 43 strokes, 18 pulmonary embolism, 29 DVTs, 18 GI haemorrhage, 22 ACS' | 130 out of 2000 | |
| Enteral nutrition | 15 strokes, 6 pulmonary embolisms, 11 DVTs, 22 GI haemorrhages, 7 ACS' | 61 out of 429 | 23 strokes, 8 pulmonary embolisms, 13 DVTs, 11 GI haemorrhages, 13 ACS' | 68 out of 428 | |
| Parenteral nutrition | 1 respiratory infection | 1 out of 21 | 2 respiratory infection | 2 out of 21 | |
| Parenteral nutrition | 3 sepsis | 3 out of 9 | 7 sepsis | 7 out of 12 | |
| Oral nutrition | 20 anastomotic leaks, 14 pneumonias, 2 pulmonary embolisms, 2 renal failure, 6 abdominal abscess, 3 unspecific infection, 10 wound dehiscences, 1 pulmonary failure, 11 gastrointestinal complications, 6 cardiovascular complications, 4 haemoperitoneum | 79 out of 338 | 18 anastomotic leaks, 9 pneumonias, 1 pulmonary embolisms, 3 renal failure, 1 abdominal abscess, 2 unspecific infection, 3 wound dehiscences, 2 pulmonary failure, 6 bacteraemia, 23 gastrointestinal complications, 6 cardiovascular complications, 5 haemoperitoneum | 79 out of 340 | |
| Enteral nutrition | no serious adverse events reported | 0 out of 256 | 6 anastomotic leaks | 6 out of 264 | |
| Parenteral nutrition | 4 GI haemorrhages, 4 GI fistulas, 4 hepatic comas | 12 out of 64 | 1 GI haemorrhages, 5 GI fistulas, 4 hepatic comas | 10 out of 60 | |
| Enteral nutrition | 25 pressure sores | 25 out of 48 | 30 pressure sores | 30 out of 53 | |
| Oral nutrition | 1 anastomotic leak, 2 wound infections, 1 pulmonary embolism | 4 out of 16 | 1 anastomotic leak, | 1 out of 8 | |
| Enteral nutrition | no serious adverse events reported | 0 out of 43 | 3 anastomotic leaks, 2 myocardial infarction | 5 out of 16 | |
| Enteral nutrition | 2 abdominal abscess | 2 out of 20 | no serious adverse events reported | 0 out of 10 | |
| General nutrition | 4 pneumonia, 1 DVTs, 4 sepsis, 2 empyemas, 0 gastroenteritis, 1 GI complications, | 12 out of 108 | 4 pneumonia, 1 stroke, 2 sepsis, 1 gastroenteritis, 2 GI complications | 10 out of 104 | |
| Enteral nutrition | 3 septic complications, 3 wound dehiscence | 6 out of 50 | 8 septic complications, 4 wound dehiscence | 12 out of 50 | |
| Enteral nutrition | 2 renal failures | 2 out of 16 | 2 renal failures | 2 out of 15 | |
| Oral nutrition | no serious adverse events reported | 0 out of 43 | 1 GI perforation | 1 out of 43 | |
| Oral nutrition | 20 pressure sores | 20 out of 197 | 29 pressure sores | 29 out of 328 | |
| Enteral nutrition | 4 variceal bleedings, 1 peritonitis | 5 out of 12 | 1 peritonitis | 1 out of 10 | |
| Oral nutrition | 2 anastomotic leaks, 2 sepsis | 4 out of 59 | 7 anastomotic leaks, 1 stroke, 1 DVT, 3 sepsis, 3 myocardial infarctions | 15 out of 61 | |
| Parenteral nutrition | no serious adverse events reported | 0 out of 14 | 1 anastomotic leak, 1 GI fistula | 2 out of 15 | |
| Enteral nutrition | 8 sepsis | 8 out of 27 | 7 sepsis | 7 out of 29 | |
| Parenteral nutrition | no serious adverse events reported | 0 out of 9 | 1 sepsis | 1 out of 12 | |
| Enteral nutrition | no serious adverse events reported | 0 out of 20 | 1 pulmonary embolism | 1 out of 20 | |
| Enteral nutrition | 2 peritonitis | 2 out of 11 | 5 peritonitis | 5 out of 18 | |
| Enteral nutrition | no serious adverse events reported | 0 out of 30 | 4 GI fistulas | 4 out of 30 | |
| Oral nutrition | no serious adverse events reported | 0 out of 80 | 1 anastomotic leak | 1 out of 81 | |
| Parenteral nutrition | 1 pneumonia | 1 out of 10 | 2 pneumonias | 2 out of 10 | |
| Parenteral nutrition | 2 pneumoperitoneums | 2 out of 40 | 2 anastomotic leaks, 2 pneumoperitoneums | 4 out of 40 | |
| Parenteral nutrition | 2 pneumonias, 5 sepsis | 7 out of 16 | 2 sepsis | 2 out of 14 | |
| Enteral nutrition | 1 myocardial infarction | 1 out of 16 | 1 myocardial infarction | 1 out of 16 | |
| Parenteral nutrition | no serious adverse events reported | 0 out of 15 | 2 hepatic encephalopathies | 2 out of 17 | |
| Parenteral nutrition | 1 anastomotic leak, 1 respiratory infection, 1 pancreatitis | 3 out of 17 | 2 pulmonary embolisms, 1 septic complication, 4 respiratory infections, | 7 out of 17 | |
| Enteral nutrition | 2 wound infections, 1 pneumonia | 3 out of 9 | 1 anastomotic leak, 2 wound infections, 1 pneumonia, 1 peptic ulcer, 1 wound dehiscence, | 6 out of 9 | |
| General nutrition | no serious adverse events reported | 0 out of 66 | 1 stroke, 1 DVT, 1 septic arthritis, 2 myocardial infarction | 5 out of 66 | |
| Parenteral nutrition | 1 empyema, 1 pelvic abscess | 2 out of 12 | 1 intraabdominal abscess | 1 out of 9 | |
| Mixed nutrition | 1 hepatic encephalopathy | 1 out of 90 | 4 anastomotic leak, 5 hepatic encephalopathies | 9 out of 36 | |
| Enteral nutrition | 2 sepsis, 2 multi organ failure, | 4 out of 52 | 6 sepsis, 3 multi organ failure | 9 out of 49 | |
| Enteral nutrition | 1 anastomotic leak | 1 out of 13 | 3 anastomotic leaks | 3 out of 15 | |
| Parenteral nutrition | 6 anastomotic leaks, 16 pneumonias, 1 pressure sore, 2 abdominal abscess, 1 wound dehiscence, 13 pulmonary failure, 7 bacteraemia, 10 GI complications, 15 cardiac complications, 3 bronchopleurocutaneous fistulas | 74 out of 231 | 6 anastomotic leaks, 9 pneumonias, 1 pulmonary embolism, 1 pressure sore, 3 renal failure, 2 abdominal abscess, 1 septic complication, 1 wound dehiscence, 11 pulmonary failure, 5 bacteraemia, 10 GI complications, 15 cardiac complications, 6 bronchopleurocutaneous fistulas | 80 out of 228 | |
| Mixed nutrition | 11 anastomotic leaks, 6 DVT, 15 sepsis | 32 out of 430 | 10 anastomotic leaks, 15 sepsis | 25 out of 216 | |
| Parenteral nutrition | 1 wound dehiscence | 1 out of 18 | 1 anastomotic leak, 2 pneumonias, 1 sepsis, 1 ileus | 5 out of 16 | |
| Enteral nutrition | 2 GI haemorrhage | 2 out of 50 | 4 GI haemorrhage | 4 out of 50 |
| Outcome or subgroup title | No. of studies | No. of participants | Statistical method | Effect size |
| 1 All‐cause mortality ‐ overall Show forest plot | 127 | 21758 | Risk Ratio (M‐H, Random, 95% CI) | 0.94 [0.86, 1.03] |
| 2 All‐cause mortality ‐ bias Show forest plot | 127 | 21758 | Risk Ratio (M‐H, Random, 95% CI) | 0.94 [0.86, 1.03] |
| 2.1 High risk of bias | 127 | 21758 | Risk Ratio (M‐H, Random, 95% CI) | 0.94 [0.86, 1.03] |
| 2.2 Low risk of bias | 0 | 0 | Risk Ratio (M‐H, Random, 95% CI) | 0.0 [0.0, 0.0] |
| 3 All‐cause mortality ‐ mode of delivery Show forest plot | 127 | 21758 | Risk Ratio (M‐H, Random, 95% CI) | 0.94 [0.86, 1.03] |
| 3.1 General nutrition support | 6 | 1420 | Risk Ratio (M‐H, Random, 95% CI) | 1.18 [0.74, 1.87] |
| 3.2 Fortified foods | 2 | 290 | Risk Ratio (M‐H, Random, 95% CI) | 1.24 [0.61, 2.54] |
| 3.3 Oral nutrition | 33 | 8529 | Risk Ratio (M‐H, Random, 95% CI) | 0.94 [0.79, 1.11] |
| 3.4 Enteral nutrition | 36 | 3722 | Risk Ratio (M‐H, Random, 95% CI) | 0.88 [0.75, 1.03] |
| 3.5 Parenteral nutrition | 43 | 7313 | Risk Ratio (M‐H, Random, 95% CI) | 0.98 [0.83, 1.16] |
| 3.6 Mixed | 7 | 484 | Risk Ratio (M‐H, Random, 95% CI) | 0.67 [0.29, 1.55] |
| 4 All‐cause mortality ‐ medical specialty Show forest plot | 127 | 21758 | Risk Ratio (M‐H, Random, 95% CI) | 0.94 [0.86, 1.03] |
| 4.1 Cardiology | 0 | 0 | Risk Ratio (M‐H, Random, 95% CI) | 0.0 [0.0, 0.0] |
| 4.2 Medical gastro‐enterology and hepatology | 13 | 627 | Risk Ratio (M‐H, Random, 95% CI) | 0.90 [0.58, 1.38] |
| 4.3 Geriatrics | 13 | 2554 | Risk Ratio (M‐H, Random, 95% CI) | 0.85 [0.66, 1.08] |
| 4.4 Pulmonary disease | 3 | 118 | Risk Ratio (M‐H, Random, 95% CI) | 0.44 [0.15, 1.28] |
| 4.5 Endocrinology | 0 | 0 | Risk Ratio (M‐H, Random, 95% CI) | 0.0 [0.0, 0.0] |
| 4.6 Infectious diseases | 1 | 56 | Risk Ratio (M‐H, Random, 95% CI) | 1.61 [0.66, 3.92] |
| 4.7 Rheumatology | 0 | 0 | Risk Ratio (M‐H, Random, 95% CI) | 0.0 [0.0, 0.0] |
| 4.8 Haematology | 0 | 0 | Risk Ratio (M‐H, Random, 95% CI) | 0.0 [0.0, 0.0] |
| 4.9 Nephrology | 0 | 0 | Risk Ratio (M‐H, Random, 95% CI) | 0.0 [0.0, 0.0] |
| 4.10 Gastro‐enterologic surgery | 46 | 3943 | Risk Ratio (M‐H, Random, 95% CI) | 0.82 [0.62, 1.09] |
| 4.11 Trauma surgery | 4 | 184 | Risk Ratio (M‐H, Random, 95% CI) | 0.93 [0.55, 1.57] |
| 4.12 Orthopaedics | 12 | 1210 | Risk Ratio (M‐H, Random, 95% CI) | 1.39 [0.87, 2.22] |
| 4.13 Plastic, reconstructive and aesthetic surgery | 0 | 0 | Risk Ratio (M‐H, Random, 95% CI) | 0.0 [0.0, 0.0] |
| 4.14 Vascular surgery | 2 | 28 | Risk Ratio (M‐H, Random, 95% CI) | 0.0 [0.0, 0.0] |
| 4.15 Transplant surgery | 3 | 84 | Risk Ratio (M‐H, Random, 95% CI) | 0.58 [0.23, 1.50] |
| 4.16 Urology | 0 | 0 | Risk Ratio (M‐H, Random, 95% CI) | 0.0 [0.0, 0.0] |
| 4.17 Thoracic surgery | 3 | 592 | Risk Ratio (M‐H, Random, 95% CI) | 0.71 [0.16, 3.22] |
| 4.18 Neurological surgery | 0 | 0 | Risk Ratio (M‐H, Random, 95% CI) | 0.0 [0.0, 0.0] |
| 4.19 Oro‐maxillo‐facial surgery | 1 | 32 | Risk Ratio (M‐H, Random, 95% CI) | 3.38 [0.15, 77.12] |
| 4.20 Anaesthesiology | 0 | 0 | Risk Ratio (M‐H, Random, 95% CI) | 0.0 [0.0, 0.0] |
| 4.21 Emergency medicine | 7 | 5198 | Risk Ratio (M‐H, Random, 95% CI) | 0.99 [0.80, 1.22] |
| 4.22 Psychiatry | 0 | 0 | Risk Ratio (M‐H, Random, 95% CI) | 0.0 [0.0, 0.0] |
| 4.23 Neurology | 7 | 5168 | Risk Ratio (M‐H, Random, 95% CI) | 0.81 [0.60, 1.11] |
| 4.24 Oncology | 5 | 313 | Risk Ratio (M‐H, Random, 95% CI) | 1.19 [0.44, 3.21] |
| 4.25 Dermatology | 0 | 0 | Risk Ratio (M‐H, Random, 95% CI) | 0.0 [0.0, 0.0] |
| 4.26 Gynaecology | 0 | 0 | Risk Ratio (M‐H, Random, 95% CI) | 0.0 [0.0, 0.0] |
| 4.27 Mixed | 7 | 1651 | Risk Ratio (M‐H, Random, 95% CI) | 1.22 [0.88, 1.70] |
| 5 All‐cause mortality ‐ based on adequacy of the amount of calories Show forest plot | 127 | 21758 | Risk Ratio (M‐H, Random, 95% CI) | 0.94 [0.86, 1.03] |
| 5.1 Clearly adequate in experimental group and clearly inadequate in control group | 25 | 7371 | Risk Ratio (M‐H, Random, 95% CI) | 0.97 [0.81, 1.16] |
| 5.2 Inadequate in the experimental group or adequate in the control group | 26 | 6711 | Risk Ratio (M‐H, Random, 95% CI) | 1.00 [0.83, 1.19] |
| 5.3 Experimental group is overfed | 5 | 267 | Risk Ratio (M‐H, Random, 95% CI) | 0.57 [0.27, 1.17] |
| 5.4 Unclear intake in experimental group or control group | 71 | 7409 | Risk Ratio (M‐H, Random, 95% CI) | 0.91 [0.81, 1.03] |
| 6 All‐cause mortality ‐ different screening tools Show forest plot | 127 | 21758 | Risk Ratio (M‐H, Random, 95% CI) | 0.94 [0.86, 1.03] |
| 6.1 NRS 2002 | 4 | 5064 | Risk Ratio (M‐H, Random, 95% CI) | 1.04 [0.84, 1.29] |
| 6.2 MUST | 0 | 0 | Risk Ratio (M‐H, Random, 95% CI) | 0.0 [0.0, 0.0] |
| 6.3 MNA | 2 | 117 | Risk Ratio (M‐H, Random, 95% CI) | 0.61 [0.12, 3.18] |
| 6.4 SGA | 3 | 1171 | Risk Ratio (M‐H, Random, 95% CI) | 1.41 [0.94, 2.10] |
| 6.5 Other means | 118 | 15406 | Risk Ratio (M‐H, Random, 95% CI) | 0.90 [0.81, 0.99] |
| 7 All‐cause mortality ‐ participants characterised as 'at nutritional risk' due to one of the following conditions Show forest plot | 127 | 21758 | Risk Ratio (M‐H, Random, 95% CI) | 0.94 [0.86, 1.03] |
| 7.1 Major surgery | 60 | 5618 | Risk Ratio (M‐H, Random, 95% CI) | 0.81 [0.65, 1.01] |
| 7.2 Stroke | 3 | 4922 | Risk Ratio (M‐H, Random, 95% CI) | 0.97 [0.83, 1.12] |
| 7.3 ICU participants including trauma | 11 | 5382 | Risk Ratio (M‐H, Random, 95% CI) | 0.98 [0.81, 1.19] |
| 7.4 Frail elderly participants with less severe conditions known to increase protein requirements | 19 | 1937 | Risk Ratio (M‐H, Random, 95% CI) | 0.88 [0.56, 1.40] |
| 7.5 Participants do not fall into one of the categories above | 34 | 3899 | Risk Ratio (M‐H, Random, 95% CI) | 1.01 [0.83, 1.22] |
| 8 All‐cause mortality ‐ participants characterised as 'at nutritional risk' due to one of the following criteria Show forest plot | 127 | 21758 | Risk Ratio (M‐H, Random, 95% CI) | 0.94 [0.86, 1.03] |
| 8.1 BMI less than 20.5 kg/m2 | 2 | 247 | Risk Ratio (M‐H, Random, 95% CI) | 1.19 [0.58, 2.45] |
| 8.2 Weight loss of at least 5% during the last three months | 1 | 32 | Risk Ratio (M‐H, Random, 95% CI) | 0.0 [0.0, 0.0] |
| 8.3 Weight loss of at least 10% during the last six months | 1 | 32 | Risk Ratio (M‐H, Random, 95% CI) | 3.38 [0.15, 77.12] |
| 8.4 Insufficient food intake during the last week (50% of requirements or less) | 0 | 0 | Risk Ratio (M‐H, Random, 95% CI) | 0.0 [0.0, 0.0] |
| 8.5 Participants characterised as 'at nutritional risk' by other means | 123 | 21447 | Risk Ratio (M‐H, Random, 95% CI) | 0.93 [0.86, 1.02] |
| 9 All‐cause mortality ‐ participants characterised as 'at nutritional risk' due to biomarkers or anthropometrics Show forest plot | 127 | 21758 | Risk Ratio (M‐H, Random, 95% CI) | 0.94 [0.86, 1.03] |
| 9.1 Biomarkers | 5 | 657 | Risk Ratio (M‐H, Random, 95% CI) | 0.43 [0.16, 1.19] |
| 9.2 Anthropometric measures | 12 | 1402 | Risk Ratio (M‐H, Random, 95% CI) | 0.80 [0.56, 1.15] |
| 9.3 Characterised by other means | 110 | 19699 | Risk Ratio (M‐H, Random, 95% CI) | 0.95 [0.87, 1.05] |
| 10 All‐cause mortality ‐ randomisation year Show forest plot | 127 | 21758 | Risk Ratio (M‐H, Random, 95% CI) | 0.94 [0.86, 1.03] |
| 10.1 Before 1960 | 0 | 0 | Risk Ratio (M‐H, Random, 95% CI) | 0.0 [0.0, 0.0] |
| 10.2 1960 to 1979 | 5 | 181 | Risk Ratio (M‐H, Random, 95% CI) | 1.11 [0.50, 2.46] |
| 10.3 1980 to 1999 | 79 | 11350 | Risk Ratio (M‐H, Random, 95% CI) | 0.91 [0.81, 1.02] |
| 10.4 After 1999 | 43 | 10227 | Risk Ratio (M‐H, Random, 95% CI) | 0.95 [0.80, 1.12] |
| 11 All‐cause mortality ‐ trials where the intervention lasts fewer than three days compared with trials where the intervention lasts three days or more Show forest plot | 127 | 21758 | Risk Ratio (M‐H, Random, 95% CI) | 0.94 [0.86, 1.03] |
| 11.1 Three days or more | 111 | 20434 | Risk Ratio (M‐H, Random, 95% CI) | 0.92 [0.84, 1.01] |
| 11.2 Fewer than three days | 13 | 722 | Risk Ratio (M‐H, Random, 95% CI) | 0.76 [0.39, 1.45] |
| 11.3 Unknown | 3 | 602 | Risk Ratio (M‐H, Random, 95% CI) | 1.16 [0.33, 4.06] |
| 12 All‐cause mortality ‐ 'best‐worst case' scenario Show forest plot | 127 | 22207 | Risk Ratio (M‐H, Random, 95% CI) | 0.74 [0.65, 0.84] |
| 13 All‐cause mortality ‐ 'worst‐best case' scenario Show forest plot | 127 | 22207 | Risk Ratio (M‐H, Random, 95% CI) | 1.13 [0.97, 1.31] |
| 14 All‐cause mortality co‐interventions Show forest plot | 127 | 21758 | Risk Ratio (M‐H, Fixed, 95% CI) | 0.93 [0.86, 1.02] |
| 14.1 received nutrition support as co‐intervention | 12 | 5361 | Risk Ratio (M‐H, Fixed, 95% CI) | 0.94 [0.78, 1.14] |
| 14.2 did not receive nutrition support as co‐intervention | 108 | 15974 | Risk Ratio (M‐H, Fixed, 95% CI) | 0.93 [0.84, 1.03] |
| 14.3 delayed versus early nutrition support | 7 | 423 | Risk Ratio (M‐H, Fixed, 95% CI) | 0.94 [0.53, 1.66] |
| Outcome or subgroup title | No. of studies | No. of participants | Statistical method | Effect size |
| 1 All‐cause mortality ‐ overall Show forest plot | 141 | 23170 | Risk Ratio (M‐H, Random, 95% CI) | 0.93 [0.88, 0.99] |
| 2 All‐cause mortality ‐ bias Show forest plot | 141 | 23170 | Risk Ratio (M‐H, Random, 95% CI) | 0.93 [0.88, 0.99] |
| 2.1 High risk of bias | 141 | 23170 | Risk Ratio (M‐H, Random, 95% CI) | 0.93 [0.88, 0.99] |
| 2.2 Low risk of bias | 0 | 0 | Risk Ratio (M‐H, Random, 95% CI) | 0.0 [0.0, 0.0] |
| 3 All‐cause mortality ‐ mode of delivery Show forest plot | 141 | 23170 | Risk Ratio (M‐H, Random, 95% CI) | 0.93 [0.88, 0.99] |
| 3.1 General nutrition support | 7 | 1566 | Risk Ratio (M‐H, Random, 95% CI) | 0.99 [0.71, 1.36] |
| 3.2 Fortified nutrition | 2 | 290 | Risk Ratio (M‐H, Random, 95% CI) | 1.24 [0.61, 2.54] |
| 3.3 Oral nutrition support | 32 | 8501 | Risk Ratio (M‐H, Random, 95% CI) | 0.94 [0.77, 1.15] |
| 3.4 Enteral nutrition | 42 | 4212 | Risk Ratio (M‐H, Random, 95% CI) | 0.84 [0.75, 0.95] |
| 3.5 Parenteral nutrition | 51 | 8121 | Risk Ratio (M‐H, Random, 95% CI) | 0.99 [0.90, 1.09] |
| 3.6 Mixed | 7 | 480 | Risk Ratio (M‐H, Random, 95% CI) | 0.72 [0.37, 1.37] |
| 4 All‐cause mortality ‐ medical specialty Show forest plot | 141 | 23170 | Risk Ratio (M‐H, Random, 95% CI) | 0.93 [0.88, 0.99] |
| 4.1 Cardiology | 0 | 0 | Risk Ratio (M‐H, Random, 95% CI) | 0.0 [0.0, 0.0] |
| 4.2 Medical gastro‐enterology and hepatology | 13 | 622 | Risk Ratio (M‐H, Random, 95% CI) | 0.96 [0.77, 1.19] |
| 4.3 Geriatrics | 13 | 2547 | Risk Ratio (M‐H, Random, 95% CI) | 0.88 [0.67, 1.17] |
| 4.4 Pulmonary disease | 3 | 118 | Risk Ratio (M‐H, Random, 95% CI) | 0.44 [0.15, 1.28] |
| 4.5 Endocrinology | 0 | 0 | Risk Ratio (M‐H, Random, 95% CI) | 0.0 [0.0, 0.0] |
| 4.6 Infectious diseases | 1 | 56 | Risk Ratio (M‐H, Random, 95% CI) | 1.61 [0.66, 3.92] |
| 4.7 Rheumatology | 0 | 0 | Risk Ratio (M‐H, Random, 95% CI) | 0.0 [0.0, 0.0] |
| 4.8 Haematology | 0 | 0 | Risk Ratio (M‐H, Random, 95% CI) | 0.0 [0.0, 0.0] |
| 4.9 Nephrology | 0 | 0 | Risk Ratio (M‐H, Random, 95% CI) | 0.0 [0.0, 0.0] |
| 4.10 Gastroenterologic surgery | 50 | 4715 | Risk Ratio (M‐H, Random, 95% CI) | 0.89 [0.70, 1.12] |
| 4.11 Trauma surgery | 6 | 249 | Risk Ratio (M‐H, Random, 95% CI) | 0.86 [0.55, 1.34] |
| 4.12 Ortopaedics | 12 | 1196 | Risk Ratio (M‐H, Random, 95% CI) | 1.00 [0.61, 1.62] |
| 4.13 Plastic, reconstructive, and aesthetic surgery | 0 | 0 | Risk Ratio (M‐H, Random, 95% CI) | 0.0 [0.0, 0.0] |
| 4.14 Vascular surgery | 2 | 28 | Risk Ratio (M‐H, Random, 95% CI) | 0.0 [0.0, 0.0] |
| 4.15 Transplant surgery | 3 | 84 | Risk Ratio (M‐H, Random, 95% CI) | 0.54 [0.22, 1.31] |
| 4.16 Urology | 0 | 0 | Risk Ratio (M‐H, Random, 95% CI) | 0.0 [0.0, 0.0] |
| 4.17 Thoracic surgery | 3 | 592 | Risk Ratio (M‐H, Random, 95% CI) | 0.71 [0.16, 3.22] |
| 4.18 Neurological surgery | 0 | 0 | Risk Ratio (M‐H, Random, 95% CI) | 0.0 [0.0, 0.0] |
| 4.19 Oro‐maxillo‐facial surgery | 1 | 32 | Risk Ratio (M‐H, Random, 95% CI) | 3.38 [0.15, 77.12] |
| 4.20 Anaesthesiology | 0 | 0 | Risk Ratio (M‐H, Random, 95% CI) | 0.0 [0.0, 0.0] |
| 4.21 Emergency medicine | 11 | 5421 | Risk Ratio (M‐H, Random, 95% CI) | 0.97 [0.85, 1.12] |
| 4.22 Psychiatry | 0 | 0 | Risk Ratio (M‐H, Random, 95% CI) | 0.0 [0.0, 0.0] |
| 4.23 Neurology | 9 | 5448 | Risk Ratio (M‐H, Random, 95% CI) | 0.77 [0.59, 0.99] |
| 4.24 Oncology | 7 | 411 | Risk Ratio (M‐H, Random, 95% CI) | 1.03 [0.87, 1.21] |
| 4.25 Dermatology | 0 | 0 | Risk Ratio (M‐H, Random, 95% CI) | 0.0 [0.0, 0.0] |
| 4.26 Gynaecology | 0 | 0 | Risk Ratio (M‐H, Random, 95% CI) | 0.0 [0.0, 0.0] |
| 4.27 Mixed | 7 | 1651 | Risk Ratio (M‐H, Random, 95% CI) | 1.28 [0.94, 1.75] |
| 5 All‐cause mortality ‐ based on adequacy of the amount of calories Show forest plot | 141 | 23170 | Risk Ratio (M‐H, Random, 95% CI) | 0.93 [0.88, 0.99] |
| 5.1 Clearly adequate in intervention and clearly inadequate in control | 28 | 7589 | Risk Ratio (M‐H, Random, 95% CI) | 0.98 [0.88, 1.09] |
| 5.2 Inadequate in the experimental or adequate in the control | 27 | 6824 | Risk Ratio (M‐H, Random, 95% CI) | 0.95 [0.82, 1.10] |
| 5.3 Experimental group is overfed | 10 | 974 | Risk Ratio (M‐H, Random, 95% CI) | 0.98 [0.69, 1.41] |
| 5.4 Unclear intake in control or experimental | 76 | 7783 | Risk Ratio (M‐H, Random, 95% CI) | 0.89 [0.81, 0.98] |
| 6 All‐cause mortality ‐ different screening tools Show forest plot | 141 | 23170 | Risk Ratio (M‐H, Random, 95% CI) | 0.93 [0.88, 0.99] |
| 6.1 NRS 2002 | 4 | 5064 | Risk Ratio (M‐H, Random, 95% CI) | 1.02 [0.87, 1.19] |
| 6.2 MUST | 1 | 146 | Risk Ratio (M‐H, Random, 95% CI) | 1.30 [0.60, 2.82] |
| 6.3 MNA | 2 | 117 | Risk Ratio (M‐H, Random, 95% CI) | 0.61 [0.12, 3.18] |
| 6.4 SGA | 3 | 1171 | Risk Ratio (M‐H, Random, 95% CI) | 1.41 [0.94, 2.10] |
| 6.5 Other means | 131 | 16672 | Risk Ratio (M‐H, Random, 95% CI) | 0.91 [0.85, 0.97] |
| 7 All‐cause mortality ‐ participants characterised as 'at nutritional risk' due to one of the following conditions Show forest plot | 141 | 23170 | Risk Ratio (M‐H, Random, 95% CI) | 0.93 [0.88, 0.99] |
| 7.1 Major surgery | 62 | 5712 | Risk Ratio (M‐H, Random, 95% CI) | 0.84 [0.68, 1.04] |
| 7.2 Stroke | 4 | 5056 | Risk Ratio (M‐H, Random, 95% CI) | 0.91 [0.79, 1.05] |
| 7.3 ICU participants including trauma | 15 | 5626 | Risk Ratio (M‐H, Random, 95% CI) | 0.97 [0.85, 1.11] |
| 7.4 Frail elderly participants with less severe conditions known to increase protein requirements | 19 | 2385 | Risk Ratio (M‐H, Random, 95% CI) | 0.85 [0.65, 1.11] |
| 7.5 Participants do not fall into one of the categories above | 41 | 4391 | Risk Ratio (M‐H, Random, 95% CI) | 0.98 [0.84, 1.14] |
| 8 All‐cause mortality ‐ participants characterised as 'at nutritional risk' due to one of the following criteria Show forest plot | 141 | 23170 | Risk Ratio (M‐H, Random, 95% CI) | 0.93 [0.88, 0.99] |
| 8.1 BMI less than 20.5 kg/m2 | 2 | 247 | Risk Ratio (M‐H, Random, 95% CI) | 1.19 [0.58, 2.45] |
| 8.2 Weight loss of at least 5% during the last three months | 1 | 32 | Risk Ratio (M‐H, Random, 95% CI) | 0.0 [0.0, 0.0] |
| 8.3 Weight loss of at least 10% during the last six months | 3 | 124 | Risk Ratio (M‐H, Random, 95% CI) | 1.07 [0.11, 10.33] |
| 8.4 Insufficient food intake during the last week (50% of requirements or less) | 0 | 0 | Risk Ratio (M‐H, Random, 95% CI) | 0.0 [0.0, 0.0] |
| 8.5 Participants characterised as 'at nutritional risk' by other means | 135 | 22767 | Risk Ratio (M‐H, Random, 95% CI) | 0.93 [0.88, 0.99] |
| 9 All‐cause mortality ‐ participants characterised as 'at nutritional risk' due to biomarkers or anthropometrics Show forest plot | 141 | 23170 | Risk Ratio (M‐H, Random, 95% CI) | 0.93 [0.88, 0.99] |
| 9.1 Biomarkers | 7 | 749 | Risk Ratio (M‐H, Random, 95% CI) | 0.40 [0.16, 1.00] |
| 9.2 Anthropometric measures | 12 | 1402 | Risk Ratio (M‐H, Random, 95% CI) | 0.79 [0.55, 1.11] |
| 9.3 Both anthropometrics and biomarkers | 3 | 75 | Risk Ratio (M‐H, Random, 95% CI) | 0.66 [0.14, 3.07] |
| 9.4 Characterised by other means | 119 | 20944 | Risk Ratio (M‐H, Random, 95% CI) | 0.94 [0.89, 1.00] |
| 10 All‐cause mortality ‐ randomisation year Show forest plot | 141 | 23170 | Risk Ratio (M‐H, Random, 95% CI) | 0.93 [0.88, 0.99] |
| 10.1 Before 1960 | 0 | 0 | Risk Ratio (M‐H, Random, 95% CI) | 0.0 [0.0, 0.0] |
| 10.2 1960 to 1979 | 6 | 237 | Risk Ratio (M‐H, Random, 95% CI) | 1.07 [0.52, 2.23] |
| 10.3 1980 to 1999 | 86 | 12055 | Risk Ratio (M‐H, Random, 95% CI) | 0.92 [0.86, 1.00] |
| 10.4 After 1999 | 49 | 10878 | Risk Ratio (M‐H, Random, 95% CI) | 0.93 [0.81, 1.06] |
| 11 All‐cause mortality ‐ trials where the intervention lasts fewer than three days compared with trials where the intervention lasts three days or more Show forest plot | 141 | 23170 | Risk Ratio (M‐H, Random, 95% CI) | 0.93 [0.88, 0.99] |
| 11.1 Three days or more | 127 | 22394 | Risk Ratio (M‐H, Random, 95% CI) | 0.93 [0.88, 0.99] |
| 11.2 Fewer than three days | 12 | 699 | Risk Ratio (M‐H, Random, 95% CI) | 1.05 [0.72, 1.54] |
| 11.3 Unknown | 2 | 77 | Risk Ratio (M‐H, Random, 95% CI) | 0.25 [0.01, 5.00] |
| 12 All‐cause mortality ‐ 'best‐worst case' scenario Show forest plot | 141 | 23700 | Risk Ratio (M‐H, Random, 95% CI) | 0.77 [0.69, 0.85] |
| 13 All‐cause mortality ‐ 'worst‐best case' scenario Show forest plot | 141 | 23700 | Risk Ratio (M‐H, Random, 95% CI) | 1.09 [0.98, 1.23] |
| 14 All‐cause mortality co‐interventions Show forest plot | 141 | 23170 | Risk Ratio (M‐H, Fixed, 95% CI) | 0.92 [0.86, 0.98] |
| 14.1 received nutrition support as co‐intervention | 13 | 5475 | Risk Ratio (M‐H, Fixed, 95% CI) | 0.95 [0.82, 1.08] |
| 14.2 did not receive nutrition support as co‐intervention | 125 | 17462 | Risk Ratio (M‐H, Fixed, 95% CI) | 0.91 [0.85, 0.98] |
| 14.3 delayed versus early nutrition support | 3 | 233 | Risk Ratio (M‐H, Fixed, 95% CI) | 0.99 [0.53, 1.83] |
| Outcome or subgroup title | No. of studies | No. of participants | Statistical method | Effect size |
| 1 Serious adverse events ‐ overall Show forest plot | 137 | 22087 | Risk Ratio (M‐H, Random, 95% CI) | 0.93 [0.86, 1.01] |
| 2 Serious adverse events ‐ bias Show forest plot | 137 | 22087 | Risk Ratio (M‐H, Random, 95% CI) | 0.93 [0.86, 1.01] |
| 2.1 High risk of bias | 137 | 22087 | Risk Ratio (M‐H, Random, 95% CI) | 0.93 [0.86, 1.01] |
| 2.2 Low risk of bias | 0 | 0 | Risk Ratio (M‐H, Random, 95% CI) | 0.0 [0.0, 0.0] |
| 3 Serious adverse events ‐ mode of delivery Show forest plot | 137 | 22087 | Risk Ratio (M‐H, Random, 95% CI) | 0.93 [0.86, 1.01] |
| 3.1 General nutrition support | 6 | 1420 | Risk Ratio (M‐H, Random, 95% CI) | 1.19 [0.79, 1.78] |
| 3.2 Fortified | 2 | 290 | Risk Ratio (M‐H, Random, 95% CI) | 1.24 [0.61, 2.54] |
| 3.3 Oral | 33 | 8569 | Risk Ratio (M‐H, Random, 95% CI) | 0.92 [0.79, 1.06] |
| 3.4 Enteral | 43 | 3935 | Risk Ratio (M‐H, Random, 95% CI) | 0.85 [0.74, 0.98] |
| 3.5 Parenteral | 48 | 7519 | Risk Ratio (M‐H, Random, 95% CI) | 0.98 [0.85, 1.14] |
| 3.6 Mixed | 5 | 354 | Risk Ratio (M‐H, Random, 95% CI) | 0.77 [0.33, 1.76] |
| 4 Serious adverse events ‐ by medical specialty Show forest plot | 137 | 22087 | Risk Ratio (M‐H, Random, 95% CI) | 0.93 [0.86, 1.01] |
| 4.1 Cardiology | 0 | 0 | Risk Ratio (M‐H, Random, 95% CI) | 0.0 [0.0, 0.0] |
| 4.2 Medical gastroenterology and hepatology | 10 | 518 | Risk Ratio (M‐H, Random, 95% CI) | 0.90 [0.60, 1.36] |
| 4.3 High risk | 0 | 0 | Risk Ratio (M‐H, Random, 95% CI) | 0.0 [0.0, 0.0] |
| 4.4 Geriatrics | 13 | 2554 | Risk Ratio (M‐H, Random, 95% CI) | 0.85 [0.66, 1.08] |
| 4.5 Pulmonary disease | 3 | 118 | Risk Ratio (M‐H, Random, 95% CI) | 0.44 [0.15, 1.28] |
| 4.6 Endocrinology | 0 | 0 | Risk Ratio (M‐H, Random, 95% CI) | 0.0 [0.0, 0.0] |
| 4.7 Infectious diseases | 1 | 56 | Risk Ratio (M‐H, Random, 95% CI) | 1.23 [0.52, 2.93] |
| 4.8 Rheumatology | 0 | 0 | Risk Ratio (M‐H, Random, 95% CI) | 0.0 [0.0, 0.0] |
| 4.9 Haematology | 0 | 0 | Risk Ratio (M‐H, Random, 95% CI) | 0.0 [0.0, 0.0] |
| 4.10 Nephrology | 0 | 0 | Risk Ratio (M‐H, Random, 95% CI) | 0.0 [0.0, 0.0] |
| 4.11 Gastroenterologic surgery | 57 | 4320 | Risk Ratio (M‐H, Random, 95% CI) | 0.86 [0.72, 1.02] |
| 4.12 Trauma surgery | 5 | 225 | Risk Ratio (M‐H, Random, 95% CI) | 0.93 [0.55, 1.57] |
| 4.13 Ortopaedics | 12 | 1210 | Risk Ratio (M‐H, Random, 95% CI) | 1.39 [0.90, 2.14] |
| 4.14 Plastic, reconstructive, and aesthetic surgery | 0 | 0 | Risk Ratio (M‐H, Random, 95% CI) | 0.0 [0.0, 0.0] |
| 4.15 Vascular surgery | 3 | 48 | Risk Ratio (M‐H, Random, 95% CI) | 0.5 [0.05, 4.67] |
| 4.16 Transplant surgery | 3 | 84 | Risk Ratio (M‐H, Random, 95% CI) | 0.58 [0.23, 1.50] |
| 4.17 Urology | 0 | 0 | Risk Ratio (M‐H, Random, 95% CI) | 0.0 [0.0, 0.0] |
| 4.18 Thoracic surgery | 3 | 592 | Risk Ratio (M‐H, Random, 95% CI) | 0.47 [0.06, 3.62] |
| 4.19 Neurological surgery | 0 | 0 | Risk Ratio (M‐H, Random, 95% CI) | 0.0 [0.0, 0.0] |
| 4.20 Oro‐maxillo‐facial surgery | 1 | 32 | Risk Ratio (M‐H, Random, 95% CI) | 0.88 [0.44, 1.78] |
| 4.21 Anaesthesiology | 0 | 0 | Risk Ratio (M‐H, Random, 95% CI) | 0.0 [0.0, 0.0] |
| 4.22 Emergency medicine | 7 | 5198 | Risk Ratio (M‐H, Random, 95% CI) | 0.99 [0.80, 1.22] |
| 4.23 Psychiatry | 0 | 0 | Risk Ratio (M‐H, Random, 95% CI) | 0.0 [0.0, 0.0] |
| 4.24 Neurology | 7 | 5168 | Risk Ratio (M‐H, Random, 95% CI) | 0.78 [0.58, 1.06] |
| 4.25 Oncology | 5 | 309 | Risk Ratio (M‐H, Random, 95% CI) | 1.12 [0.51, 2.44] |
| 4.26 Dermatology | 0 | 0 | Risk Ratio (M‐H, Random, 95% CI) | 0.0 [0.0, 0.0] |
| 4.27 Gynaecology | 0 | 0 | Risk Ratio (M‐H, Random, 95% CI) | 0.0 [0.0, 0.0] |
| 4.28 Mixed | 7 | 1655 | Risk Ratio (M‐H, Random, 95% CI) | 1.24 [0.92, 1.67] |
| 5 Serious adverse events ‐ based on adequacy of the amount of calories Show forest plot | 137 | 22087 | Risk Ratio (M‐H, Random, 95% CI) | 0.93 [0.86, 1.01] |
| 5.1 Clearly adequate in intervention and clearly inadequate in control | 28 | 7405 | Risk Ratio (M‐H, Random, 95% CI) | 0.95 [0.80, 1.11] |
| 5.2 Inadequate in the experimental or adequate in the control | 28 | 7335 | Risk Ratio (M‐H, Random, 95% CI) | 0.97 [0.84, 1.13] |
| 5.3 Experimental group is overfed | 6 | 224 | Risk Ratio (M‐H, Random, 95% CI) | 0.85 [0.44, 1.67] |
| 5.4 Unclear intake in control or experimental | 75 | 7123 | Risk Ratio (M‐H, Random, 95% CI) | 0.83 [0.70, 0.98] |
| 6 Serious adverse events ‐ different screening tools Show forest plot | 137 | 22087 | Risk Ratio (M‐H, Random, 95% CI) | 0.93 [0.86, 1.01] |
| 6.1 NRS 2002 | 4 | 5064 | Risk Ratio (M‐H, Random, 95% CI) | 1.06 [0.87, 1.31] |
| 6.2 MUST | 0 | 0 | Risk Ratio (M‐H, Random, 95% CI) | 0.0 [0.0, 0.0] |
| 6.3 MNA | 2 | 117 | Risk Ratio (M‐H, Random, 95% CI) | 0.61 [0.12, 3.18] |
| 6.4 SGA | 3 | 1175 | Risk Ratio (M‐H, Random, 95% CI) | 0.82 [0.35, 1.92] |
| 6.5 Other means | 128 | 15731 | Risk Ratio (M‐H, Random, 95% CI) | 0.90 [0.82, 0.98] |
| 7 Serious adverse events ‐ participants characterised as 'at nutritional risk' due to one of the following conditions Show forest plot | 137 | 22087 | Risk Ratio (M‐H, Random, 95% CI) | 0.93 [0.86, 1.01] |
| 7.1 Major surgery | 65 | 5180 | Risk Ratio (M‐H, Random, 95% CI) | 0.84 [0.71, 0.99] |
| 7.2 Stroke | 6 | 5139 | Risk Ratio (M‐H, Random, 95% CI) | 0.78 [0.58, 1.06] |
| 7.3 ICU participants including trauma | 12 | 5423 | Risk Ratio (M‐H, Random, 95% CI) | 0.98 [0.81, 1.19] |
| 7.4 Frail elderly participants with less severe conditions known to increase protein requirements | 19 | 2406 | Risk Ratio (M‐H, Random, 95% CI) | 0.97 [0.75, 1.26] |
| 7.5 Participants do not fall into one of the categories above | 35 | 3939 | Risk Ratio (M‐H, Random, 95% CI) | 1.01 [0.85, 1.21] |
| 8 Serious adverse events ‐ participants characterised as 'at nutritional risk' due to one of the following criteria Show forest plot | 137 | 22087 | Risk Ratio (M‐H, Random, 95% CI) | 0.93 [0.86, 1.01] |
| 8.1 BMI less than 20.5 kg/m2 | 2 | 247 | Risk Ratio (M‐H, Random, 95% CI) | 1.19 [0.58, 2.45] |
| 8.2 Weight loss of at least 5% during the last three months | 1 | 32 | Risk Ratio (M‐H, Random, 95% CI) | 0.0 [0.0, 0.0] |
| 8.3 Weight loss of at least 10% during the last six months | 1 | 32 | Risk Ratio (M‐H, Random, 95% CI) | 0.88 [0.44, 1.78] |
| 8.4 Insufficient food intake during the last week (50% of requirements or less) | 0 | 0 | Risk Ratio (M‐H, Random, 95% CI) | 0.0 [0.0, 0.0] |
| 8.5 Participants characterised as 'at nutritional risk' by other means | 133 | 21776 | Risk Ratio (M‐H, Random, 95% CI) | 0.93 [0.86, 1.01] |
| 9 Serious adverse events ‐ participants characterised as 'at nutritional risk' due to biomarkers or anthropometrics Show forest plot | 137 | 22087 | Risk Ratio (M‐H, Random, 95% CI) | 0.93 [0.86, 1.01] |
| 9.1 Biomarkers | 8 | 703 | Risk Ratio (M‐H, Random, 95% CI) | 0.39 [0.16, 0.95] |
| 9.2 Anthropometric measures | 15 | 1677 | Risk Ratio (M‐H, Random, 95% CI) | 0.90 [0.68, 1.20] |
| 9.3 Mixed | 0 | 0 | Risk Ratio (M‐H, Random, 95% CI) | 0.0 [0.0, 0.0] |
| 9.4 Characterised by other means | 114 | 19707 | Risk Ratio (M‐H, Random, 95% CI) | 0.94 [0.86, 1.02] |
| 10 Serious adverse events ‐ randomisation year Show forest plot | 137 | 22087 | Risk Ratio (M‐H, Random, 95% CI) | 0.93 [0.86, 1.01] |
| 10.1 Before 1960 | 0 | 0 | Risk Ratio (M‐H, Random, 95% CI) | 0.0 [0.0, 0.0] |
| 10.2 1960 to 1979 | 5 | 184 | Risk Ratio (M‐H, Random, 95% CI) | 1.40 [0.70, 2.78] |
| 10.3 1980 to 1999 | 86 | 11472 | Risk Ratio (M‐H, Random, 95% CI) | 0.91 [0.82, 1.00] |
| 10.4 After 1999 | 46 | 10431 | Risk Ratio (M‐H, Random, 95% CI) | 0.89 [0.75, 1.06] |
| 11 Serious adverse events ‐ trials where the intervention lasts fewer than three days compared with trials where the intervention lasts three days or more Show forest plot | 137 | 22087 | Risk Ratio (M‐H, Random, 95% CI) | 0.93 [0.86, 1.01] |
| 11.1 Three days or more | 125 | 21408 | Risk Ratio (M‐H, Random, 95% CI) | 0.94 [0.86, 1.02] |
| 11.2 Less than three days | 10 | 602 | Risk Ratio (M‐H, Random, 95% CI) | 0.67 [0.39, 1.16] |
| 11.3 Unknown | 2 | 77 | Risk Ratio (M‐H, Random, 95% CI) | 0.25 [0.01, 5.00] |
| 12 Serious adverse events ‐ 'best‐worst case' scenario Show forest plot | 137 | 22557 | Risk Ratio (M‐H, Random, 95% CI) | 0.74 [0.65, 0.83] |
| 13 Serious adverse events ‐ 'worst‐best case' scenario Show forest plot | 137 | 22557 | Risk Ratio (M‐H, Random, 95% CI) | 1.06 [0.92, 1.21] |
| 14 Serious adverse events co‐interventions Show forest plot | 137 | 22087 | Risk Ratio (M‐H, Fixed, 95% CI) | 0.91 [0.84, 0.99] |
| 14.1 received nutrition support as co‐intervention | 11 | 5337 | Risk Ratio (M‐H, Fixed, 95% CI) | 0.95 [0.79, 1.15] |
| 14.2 did not receive nutrition support as co‐intervention | 119 | 16327 | Risk Ratio (M‐H, Fixed, 95% CI) | 0.90 [0.83, 0.99] |
| 14.3 delayed versus early nutrition support | 7 | 423 | Risk Ratio (M‐H, Fixed, 95% CI) | 0.89 [0.51, 1.57] |
| Outcome or subgroup title | No. of studies | No. of participants | Statistical method | Effect size |
| 1 Serious adverse events ‐ overall Show forest plot | 152 | 23413 | Risk Ratio (M‐H, Random, 95% CI) | 0.91 [0.85, 0.97] |
| 2 Serious adverse events ‐ bias Show forest plot | 152 | 23413 | Risk Ratio (M‐H, Random, 95% CI) | 0.91 [0.85, 0.97] |
| 2.1 High risk of bias | 152 | 23413 | Risk Ratio (M‐H, Random, 95% CI) | 0.91 [0.85, 0.97] |
| 2.2 Low risk of bias | 0 | 0 | Risk Ratio (M‐H, Random, 95% CI) | 0.0 [0.0, 0.0] |
| 3 Serious adverse events ‐ mode of delivery Show forest plot | 152 | 23413 | Risk Ratio (M‐H, Random, 95% CI) | 0.91 [0.85, 0.97] |
| 3.1 General nutrition support | 7 | 1544 | Risk Ratio (M‐H, Random, 95% CI) | 1.04 [0.76, 1.44] |
| 3.2 Fortified nutrition | 2 | 290 | Risk Ratio (M‐H, Random, 95% CI) | 1.24 [0.61, 2.54] |
| 3.3 Oral nutrition support | 33 | 8541 | Risk Ratio (M‐H, Random, 95% CI) | 0.89 [0.74, 1.07] |
| 3.4 Enteral nutrition | 49 | 4425 | Risk Ratio (M‐H, Random, 95% CI) | 0.82 [0.73, 0.91] |
| 3.5 Parenteral nutrition | 56 | 8263 | Risk Ratio (M‐H, Random, 95% CI) | 0.98 [0.90, 1.07] |
| 3.6 Mixed | 5 | 350 | Risk Ratio (M‐H, Random, 95% CI) | 0.74 [0.37, 1.48] |
| 4 Serious adverse events ‐ by medical specialty Show forest plot | 152 | 23413 | Risk Ratio (M‐H, Random, 95% CI) | 0.91 [0.85, 0.97] |
| 4.1 Cardiology | 0 | 0 | Risk Ratio (M‐H, Random, 95% CI) | 0.0 [0.0, 0.0] |
| 4.2 Medical gastroenterology and hepatology | 13 | 706 | Risk Ratio (M‐H, Random, 95% CI) | 0.94 [0.75, 1.17] |
| 4.3 Geriatrics | 13 | 2547 | Risk Ratio (M‐H, Random, 95% CI) | 0.88 [0.67, 1.17] |
| 4.4 Pulmonary disease | 3 | 118 | Risk Ratio (M‐H, Random, 95% CI) | 0.44 [0.15, 1.28] |
| 4.5 Endocrinology | 0 | 0 | Risk Ratio (M‐H, Random, 95% CI) | 0.0 [0.0, 0.0] |
| 4.6 Infectious diseases | 1 | 56 | Risk Ratio (M‐H, Random, 95% CI) | 1.23 [0.52, 2.93] |
| 4.7 Rheumatology | 0 | 0 | Risk Ratio (M‐H, Random, 95% CI) | 0.0 [0.0, 0.0] |
| 4.8 Haematology | 0 | 0 | Risk Ratio (M‐H, Random, 95% CI) | 0.0 [0.0, 0.0] |
| 4.9 Nephrology | 0 | 0 | Risk Ratio (M‐H, Random, 95% CI) | 0.0 [0.0, 0.0] |
| 4.10 Gastroenterologic surgery | 59 | 4835 | Risk Ratio (M‐H, Random, 95% CI) | 0.83 [0.71, 0.97] |
| 4.11 Trauma surgery | 7 | 290 | Risk Ratio (M‐H, Random, 95% CI) | 0.86 [0.55, 1.34] |
| 4.12 Ortopaedics | 12 | 1196 | Risk Ratio (M‐H, Random, 95% CI) | 0.98 [0.63, 1.51] |
| 4.13 Plastic, reconstructive, and aesthetic surgery | 0 | 0 | Risk Ratio (M‐H, Random, 95% CI) | 0.0 [0.0, 0.0] |
| 4.14 Vascular surgery | 3 | 48 | Risk Ratio (M‐H, Random, 95% CI) | 0.5 [0.05, 4.67] |
| 4.15 Transplant surgery | 3 | 84 | Risk Ratio (M‐H, Random, 95% CI) | 0.54 [0.22, 1.31] |
| 4.16 Urology | 0 | 0 | Risk Ratio (M‐H, Random, 95% CI) | 0.0 [0.0, 0.0] |
| 4.17 Thoracic surgery | 3 | 592 | Risk Ratio (M‐H, Random, 95% CI) | 0.47 [0.06, 3.62] |
| 4.18 Neurological surgery | 0 | 0 | Risk Ratio (M‐H, Random, 95% CI) | 0.0 [0.0, 0.0] |
| 4.19 Oro‐maxillo‐facial surgery | 1 | 32 | Risk Ratio (M‐H, Random, 95% CI) | 0.88 [0.44, 1.78] |
| 4.20 Anaesthesiology | 0 | 0 | Risk Ratio (M‐H, Random, 95% CI) | 0.0 [0.0, 0.0] |
| 4.21 Emergency medicine | 11 | 5421 | Risk Ratio (M‐H, Random, 95% CI) | 0.96 [0.84, 1.10] |
| 4.22 Psychiatry | 0 | 0 | Risk Ratio (M‐H, Random, 95% CI) | 0.0 [0.0, 0.0] |
| 4.23 Neurology | 9 | 5426 | Risk Ratio (M‐H, Random, 95% CI) | 0.75 [0.58, 0.98] |
| 4.24 Oncology | 7 | 407 | Risk Ratio (M‐H, Random, 95% CI) | 1.02 [0.87, 1.20] |
| 4.25 Dermatology | 0 | 0 | Risk Ratio (M‐H, Random, 95% CI) | 0.0 [0.0, 0.0] |
| 4.26 Gynaecology | 0 | 0 | Risk Ratio (M‐H, Random, 95% CI) | 0.0 [0.0, 0.0] |
| 4.27 Mixed | 7 | 1655 | Risk Ratio (M‐H, Random, 95% CI) | 1.29 [0.97, 1.71] |
| 5 Serious adverse events ‐ based on adequacy of the amount of calories Show forest plot | 152 | 23413 | Risk Ratio (M‐H, Random, 95% CI) | 0.91 [0.85, 0.97] |
| 5.1 Clearly adequate in intervention and clearly inadequate in control | 31 | 7623 | Risk Ratio (M‐H, Random, 95% CI) | 0.95 [0.86, 1.05] |
| 5.2 Inadequate in the experimental or adequate in the control | 29 | 7395 | Risk Ratio (M‐H, Random, 95% CI) | 0.95 [0.85, 1.05] |
| 5.3 Experimental group is overfed | 11 | 867 | Risk Ratio (M‐H, Random, 95% CI) | 0.92 [0.72, 1.19] |
| 5.4 Unclear intake in control or experimental | 81 | 7528 | Risk Ratio (M‐H, Random, 95% CI) | 0.81 [0.70, 0.94] |
| 6 Serious adverse events ‐ different screening tools Show forest plot | 152 | 23413 | Risk Ratio (M‐H, Random, 95% CI) | 0.91 [0.85, 0.97] |
| 6.1 NRS 2002 | 4 | 5064 | Risk Ratio (M‐H, Random, 95% CI) | 1.03 [0.89, 1.21] |
| 6.2 MUST | 1 | 124 | Risk Ratio (M‐H, Random, 95% CI) | 1.37 [0.64, 2.92] |
| 6.3 MNA | 2 | 117 | Risk Ratio (M‐H, Random, 95% CI) | 0.61 [0.12, 3.18] |
| 6.4 SGA | 0 | 0 | Risk Ratio (M‐H, Random, 95% CI) | 0.0 [0.0, 0.0] |
| 6.5 Other means | 145 | 18108 | Risk Ratio (M‐H, Random, 95% CI) | 0.89 [0.82, 0.95] |
| 7 Serious adverse events ‐ participants characterised as 'at nutritional risk' due to one of the following conditions Show forest plot | 152 | 23413 | Risk Ratio (M‐H, Random, 95% CI) | 0.91 [0.85, 0.97] |
| 7.1 Major surgery | 72 | 5936 | Risk Ratio (M‐H, Random, 95% CI) | 0.82 [0.71, 0.94] |
| 7.2 Stroke | 8 | 5397 | Risk Ratio (M‐H, Random, 95% CI) | 0.75 [0.58, 0.98] |
| 7.3 ICU participants including trauma | 16 | 5667 | Risk Ratio (M‐H, Random, 95% CI) | 0.96 [0.84, 1.10] |
| 7.4 Frail elderly participants with less severe conditions known to increase protein requirements | 19 | 2385 | Risk Ratio (M‐H, Random, 95% CI) | 0.82 [0.65, 1.03] |
| 7.5 Participants do not fall into one of the categories above | 37 | 4028 | Risk Ratio (M‐H, Random, 95% CI) | 1.03 [0.92, 1.15] |
| 8 Serious adverse events ‐ participants characterised as 'at nutritional risk' due to one of the following criteria Show forest plot | 152 | 23413 | Risk Ratio (M‐H, Random, 95% CI) | 0.91 [0.85, 0.97] |
| 8.1 BMI less than 20.5 kg/m2 | 2 | 247 | Risk Ratio (M‐H, Random, 95% CI) | 1.19 [0.58, 2.45] |
| 8.2 Weight loss of at least 5% during the last three months | 1 | 32 | Risk Ratio (M‐H, Random, 95% CI) | 0.0 [0.0, 0.0] |
| 8.3 Weight loss of at least 10% during the last six months | 3 | 124 | Risk Ratio (M‐H, Random, 95% CI) | 0.84 [0.42, 1.67] |
| 8.4 Insufficient food intake during the last week (50% of requirements or less) | 0 | 0 | Risk Ratio (M‐H, Random, 95% CI) | 0.0 [0.0, 0.0] |
| 8.5 Participants characterised as 'at nutritional risk' by other means | 146 | 23010 | Risk Ratio (M‐H, Random, 95% CI) | 0.90 [0.84, 0.97] |
| 9 Serious adverse events ‐ participants characterised as 'at nutritional risk' due to biomarkers or anthropometrics Show forest plot | 152 | 23413 | Risk Ratio (M‐H, Random, 95% CI) | 0.91 [0.85, 0.97] |
| 9.1 Biomarkers | 10 | 795 | Risk Ratio (M‐H, Random, 95% CI) | 0.37 [0.16, 0.85] |
| 9.2 Anthropometric measures | 12 | 1402 | Risk Ratio (M‐H, Random, 95% CI) | 0.76 [0.54, 1.08] |
| 9.3 Both | 3 | 75 | Risk Ratio (M‐H, Random, 95% CI) | 0.66 [0.14, 3.07] |
| 9.4 Characterised by other means | 127 | 21141 | Risk Ratio (M‐H, Random, 95% CI) | 0.91 [0.85, 0.98] |
| 10 Serious adverse events ‐ randomisation year Show forest plot | 152 | 23413 | Risk Ratio (M‐H, Random, 95% CI) | 0.91 [0.85, 0.97] |
| 10.1 Before 1960 | 0 | 0 | Risk Ratio (M‐H, Random, 95% CI) | 0.0 [0.0, 0.0] |
| 10.2 1960 to 1979 | 6 | 240 | Risk Ratio (M‐H, Random, 95% CI) | 1.18 [0.65, 2.14] |
| 10.3 1980 to 1999 | 93 | 12128 | Risk Ratio (M‐H, Random, 95% CI) | 0.92 [0.86, 0.99] |
| 10.4 After 1999 | 53 | 11045 | Risk Ratio (M‐H, Random, 95% CI) | 0.83 [0.72, 0.97] |
| 11 Serious adverse events ‐ trials where the intervention lasts fewer than three days compared with trials where the intervention lasts three days or more Show forest plot | 152 | 23413 | Risk Ratio (M‐H, Random, 95% CI) | 0.91 [0.85, 0.97] |
| 11.1 Three days or more | 138 | 22637 | Risk Ratio (M‐H, Random, 95% CI) | 0.90 [0.84, 0.97] |
| 11.2 Less than three days | 12 | 699 | Risk Ratio (M‐H, Random, 95% CI) | 0.90 [0.66, 1.23] |
| 11.3 Unknown | 2 | 77 | Risk Ratio (M‐H, Random, 95% CI) | 0.25 [0.01, 5.00] |
| 12 Serious adverse events ‐ 'best‐worst case' scenario Show forest plot | 152 | 24315 | Risk Ratio (M‐H, Random, 95% CI) | 0.72 [0.65, 0.79] |
| 13 Serious adverse events ‐ 'worst‐best case' scenario Show forest plot | 152 | 24082 | Risk Ratio (M‐H, Random, 95% CI) | 1.05 [0.94, 1.17] |
| 14 Serious adverse events co‐interventions Show forest plot | 152 | 23413 | Risk Ratio (M‐H, Fixed, 95% CI) | 0.89 [0.84, 0.95] |
| 14.1 Received nutrition support as co‐intervention | 12 | 5459 | Risk Ratio (M‐H, Fixed, 95% CI) | 0.93 [0.81, 1.06] |
| 14.2 did not receive nutrition support as co‐intervention | 132 | 17493 | Risk Ratio (M‐H, Fixed, 95% CI) | 0.88 [0.82, 0.94] |
| 14.3 delayed versus early nutrition support | 8 | 461 | Risk Ratio (M‐H, Fixed, 95% CI) | 1.09 [0.75, 1.59] |
| 15 Serious adverse events ‐ 'best‐worse case' scenario (enteral nutrition) Show forest plot | 46 | 4415 | Risk Ratio (M‐H, Random, 95% CI) | 0.62 [0.51, 0.75] |
| 16 Serious adverse events ‐ 'worst‐best case' scenario (enteral nutrition) Show forest plot | 46 | 4415 | Risk Ratio (M‐H, Random, 95% CI) | 0.81 [0.69, 0.96] |
| Outcome or subgroup title | No. of studies | No. of participants | Statistical method | Effect size |
| 1 Quality of life ‐ overall Show forest plot | 2 | 242 | Mean Difference (IV, Random, 95% CI) | 2.35 [‐2.94, 7.65] |
| Outcome or subgroup title | No. of studies | No. of participants | Statistical method | Effect size |
| 1 Quality of life ‐ overall Show forest plot | 3 | 289 | Mean Difference (IV, Random, 95% CI) | 1.54 [‐2.47, 5.55] |
| Outcome or subgroup title | No. of studies | No. of participants | Statistical method | Effect size |
| 1 Quality of life ‐ overall Show forest plot | 2 | 242 | Mean Difference (IV, Random, 95% CI) | ‐0.90 [‐3.92, 2.13] |
| Outcome or subgroup title | No. of studies | No. of participants | Statistical method | Effect size |
| 1 Quality of life ‐ overall Show forest plot | 3 | 289 | Mean Difference (IV, Random, 95% CI) | ‐0.25 [‐3.02, 2.53] |
| Outcome or subgroup title | No. of studies | No. of participants | Statistical method | Effect size |
| 1 Quality of life ‐ overall Show forest plot | 2 | 3961 | Mean Difference (IV, Random, 95% CI) | ‐0.01 [‐0.03, 0.01] |
| Outcome or subgroup title | No. of studies | No. of participants | Statistical method | Effect size |
| 1 Pneumonia Show forest plot | 28 | 12443 | Risk Ratio (M‐H, Random, 95% CI) | 1.06 [0.96, 1.16] |
| Outcome or subgroup title | No. of studies | No. of participants | Statistical method | Effect size |
| 1 Wound dehiscence Show forest plot | 14 | 2280 | Risk Ratio (M‐H, Random, 95% CI) | 0.71 [0.40, 1.24] |
| Outcome or subgroup title | No. of studies | No. of participants | Statistical method | Effect size |
| 1 Renal failure Show forest plot | 5 | 6359 | Risk Ratio (M‐H, Random, 95% CI) | 1.00 [0.83, 1.20] |
| Outcome or subgroup title | No. of studies | No. of participants | Statistical method | Effect size |
| 1 Wound infection Show forest plot | 28 | 8324 | Risk Ratio (M‐H, Random, 95% CI) | 0.81 [0.60, 1.10] |
| Outcome or subgroup title | No. of studies | No. of participants | Statistical method | Effect size |
| 1 Heart failure Show forest plot | 3 | 1041 | Risk Ratio (M‐H, Random, 95% CI) | 1.11 [0.34, 3.61] |
| Outcome or subgroup title | No. of studies | No. of participants | Statistical method | Effect size |
| 1 AcM ‐ EoI Show forest plot | 6 | 5578 | Risk Ratio (M‐H, Fixed, 95% CI) | 1.01 [0.81, 1.25] |
| 2 AcM ‐ MF Show forest plot | 6 | 5578 | Risk Ratio (M‐H, Random, 95% CI) | 1.01 [0.86, 1.18] |
| 3 SaE ‐ EoI Show forest plot | 6 | 5578 | Risk Ratio (M‐H, Fixed, 95% CI) | 0.96 [0.78, 1.19] |
| 4 SaE ‐ MF Show forest plot | 6 | 5578 | Risk Ratio (M‐H, Random, 95% CI) | 0.98 [0.84, 1.14] |
| Outcome or subgroup title | No. of studies | No. of participants | Statistical method | Effect size |
| 1 AcM ‐ EoI Show forest plot | 17 | 6760 | Risk Ratio (M‐H, Random, 95% CI) | 0.99 [0.82, 1.20] |
| 2 AcM ‐ MF Show forest plot | 20 | 6978 | Risk Ratio (M‐H, Random, 95% CI) | 0.95 [0.82, 1.09] |
| 3 SaE ‐ EoI Show forest plot | 20 | 6794 | Risk Ratio (M‐H, Fixed, 95% CI) | 0.96 [0.81, 1.14] |
| 4 SaE ‐ MF Show forest plot | 23 | 7012 | Risk Ratio (M‐H, Random, 95% CI) | 0.91 [0.80, 1.03] |
| Outcome or subgroup title | No. of studies | No. of participants | Statistical method | Effect size |
| 1 All‐cause mortality ‐ overall Show forest plot | 33 | 8529 | Risk Ratio (M‐H, Random, 95% CI) | 0.94 [0.79, 1.11] |
| 2 All‐cause mortality ‐ bias Show forest plot | 33 | 8529 | Risk Ratio (M‐H, Random, 95% CI) | 0.94 [0.79, 1.11] |
| 2.1 High risk of bias | 33 | 8529 | Risk Ratio (M‐H, Random, 95% CI) | 0.94 [0.79, 1.11] |
| 2.2 Low risk of bias | 0 | 0 | Risk Ratio (M‐H, Random, 95% CI) | 0.0 [0.0, 0.0] |
| 3 All‐cause mortality ‐ medical speciality Show forest plot | 33 | 8529 | Risk Ratio (M‐H, Random, 95% CI) | 0.95 [0.80, 1.12] |
| 3.1 Cardiology | 0 | 0 | Risk Ratio (M‐H, Random, 95% CI) | 0.0 [0.0, 0.0] |
| 3.2 Medical gastroenterology and hepatology | 1 | 36 | Risk Ratio (M‐H, Random, 95% CI) | 0.45 [0.10, 2.01] |
| 3.3 Geriatrics | 9 | 1559 | Risk Ratio (M‐H, Random, 95% CI) | 0.75 [0.56, 0.99] |
| 3.4 Pulmonary disease | 2 | 93 | Risk Ratio (M‐H, Random, 95% CI) | 0.49 [0.16, 1.54] |
| 3.5 Endocrinology | 0 | 0 | Risk Ratio (M‐H, Random, 95% CI) | 0.0 [0.0, 0.0] |
| 3.6 Infectious diseases | 0 | 0 | Risk Ratio (M‐H, Random, 95% CI) | 0.0 [0.0, 0.0] |
| 3.7 Rheumatology | 0 | 0 | Risk Ratio (M‐H, Random, 95% CI) | 0.0 [0.0, 0.0] |
| 3.8 Haematology | 0 | 0 | Risk Ratio (M‐H, Random, 95% CI) | 0.0 [0.0, 0.0] |
| 3.9 Nephrology | 0 | 0 | Risk Ratio (M‐H, Random, 95% CI) | 0.0 [0.0, 0.0] |
| 3.10 Gastroenterologic surgery | 11 | 1267 | Risk Ratio (M‐H, Random, 95% CI) | 1.24 [0.65, 2.38] |
| 3.11 Trauma surgery | 0 | 0 | Risk Ratio (M‐H, Random, 95% CI) | 0.0 [0.0, 0.0] |
| 3.12 Orthopaedics | 4 | 371 | Risk Ratio (M‐H, Random, 95% CI) | 1.69 [0.53, 5.36] |
| 3.13 Plastic, reconstructive and aesthetic surgery | 0 | 0 | Risk Ratio (M‐H, Random, 95% CI) | 0.0 [0.0, 0.0] |
| 3.14 Vascular surgery | 0 | 0 | Risk Ratio (M‐H, Random, 95% CI) | 0.0 [0.0, 0.0] |
| 3.15 Transplant surgery | 1 | 37 | Risk Ratio (M‐H, Random, 95% CI) | 0.35 [0.02, 8.09] |
| 3.16 Urology | 0 | 0 | Risk Ratio (M‐H, Random, 95% CI) | 0.0 [0.0, 0.0] |
| 3.17 Thoracic surgery | 0 | 0 | Risk Ratio (M‐H, Random, 95% CI) | 0.0 [0.0, 0.0] |
| 3.18 Neurological surgery | 0 | 0 | Risk Ratio (M‐H, Random, 95% CI) | 0.0 [0.0, 0.0] |
| 3.19 Oro‐maxillo‐facial surgery | 0 | 0 | Risk Ratio (M‐H, Random, 95% CI) | 0.0 [0.0, 0.0] |
| 3.20 Anaesthesiology | 0 | 0 | Risk Ratio (M‐H, Random, 95% CI) | 0.0 [0.0, 0.0] |
| 3.21 Emergency medicine | 0 | 0 | Risk Ratio (M‐H, Random, 95% CI) | 0.0 [0.0, 0.0] |
| 3.22 Psychiatry | 0 | 0 | Risk Ratio (M‐H, Random, 95% CI) | 0.0 [0.0, 0.0] |
| 3.23 Neurology | 3 | 4092 | Risk Ratio (M‐H, Random, 95% CI) | 0.99 [0.76, 1.27] |
| 3.24 Oncology | 0 | 0 | Risk Ratio (M‐H, Random, 95% CI) | 0.0 [0.0, 0.0] |
| 3.25 Dermatology | 0 | 0 | Risk Ratio (M‐H, Random, 95% CI) | 0.0 [0.0, 0.0] |
| 3.26 Gynaecology | 0 | 0 | Risk Ratio (M‐H, Random, 95% CI) | 0.0 [0.0, 0.0] |
| 3.27 Mixed | 2 | 1074 | Risk Ratio (M‐H, Random, 95% CI) | 1.24 [0.73, 2.12] |
| 4 All‐cause mortality ‐ based on adequacy of the amount of calories Show forest plot | 33 | 8529 | Risk Ratio (M‐H, Random, 95% CI) | 0.94 [0.79, 1.11] |
| 4.1 Clearly adequate in experimental group and clearly inadequate in control group | 4 | 260 | Risk Ratio (M‐H, Random, 95% CI) | 1.08 [0.34, 3.47] |
| 4.2 Inadequate in the experimental group or adequate in the control group | 12 | 5540 | Risk Ratio (M‐H, Random, 95% CI) | 0.94 [0.76, 1.17] |
| 4.3 Experimental group is overfed | 2 | 69 | Risk Ratio (M‐H, Random, 95% CI) | 0.53 [0.14, 1.98] |
| 4.4 Unclear intake in experimental group or control group | 15 | 2660 | Risk Ratio (M‐H, Random, 95% CI) | 0.93 [0.62, 1.38] |
| 5 All‐cause mortality ‐ different screening tools Show forest plot | 33 | 8529 | Risk Ratio (M‐H, Random, 95% CI) | 0.94 [0.79, 1.11] |
| 5.1 NRS 2002 | 0 | 0 | Risk Ratio (M‐H, Random, 95% CI) | 0.0 [0.0, 0.0] |
| 5.2 MUST | 0 | 0 | Risk Ratio (M‐H, Random, 95% CI) | 0.0 [0.0, 0.0] |
| 5.3 MNA | 2 | 117 | Risk Ratio (M‐H, Random, 95% CI) | 0.61 [0.12, 3.18] |
| 5.4 SGA | 1 | 525 | Risk Ratio (M‐H, Random, 95% CI) | 1.51 [0.99, 2.31] |
| 5.5 Other means | 30 | 7887 | Risk Ratio (M‐H, Random, 95% CI) | 0.87 [0.73, 1.04] |
| 6 All‐cause mortality ‐ participants characterised as 'at nutritional risk' due to one of the following conditions Show forest plot | 33 | 8529 | Risk Ratio (M‐H, Random, 95% CI) | 0.94 [0.79, 1.11] |
| 6.1 Major surgery | 13 | 1364 | Risk Ratio (M‐H, Random, 95% CI) | 0.92 [0.49, 1.72] |
| 6.2 Stroke | 2 | 4063 | Risk Ratio (M‐H, Random, 95% CI) | 0.96 [0.74, 1.24] |
| 6.3 ICU participants including trauma | 0 | 0 | Risk Ratio (M‐H, Random, 95% CI) | 0.0 [0.0, 0.0] |
| 6.4 Frail elderly participants with less severe conditions known to increase protein requirements | 9 | 953 | Risk Ratio (M‐H, Random, 95% CI) | 0.85 [0.55, 1.30] |
| 6.5 Participants do not fall into one of the categories above | 9 | 2149 | Risk Ratio (M‐H, Random, 95% CI) | 0.93 [0.62, 1.39] |
| 7 All‐cause mortality ‐ participants characterised as 'at nutritional risk' due to one of the following criteria Show forest plot | 33 | 8529 | Risk Ratio (M‐H, Random, 95% CI) | 0.94 [0.79, 1.11] |
| 7.1 BMI less than 20.5 kg/m2 | 1 | 37 | Risk Ratio (M‐H, Random, 95% CI) | 0.35 [0.02, 8.09] |
| 7.2 Weight loss of at least 5% during the last three months | 0 | 0 | Risk Ratio (M‐H, Random, 95% CI) | 0.0 [0.0, 0.0] |
| 7.3 Weight loss of at least 10% during the last six months | 0 | 0 | Risk Ratio (M‐H, Random, 95% CI) | 0.0 [0.0, 0.0] |
| 7.4 Insufficient food intake during the last week (50% of requirements or less) | 0 | 0 | Risk Ratio (M‐H, Random, 95% CI) | 0.0 [0.0, 0.0] |
| 7.5 Participants characterised as 'at nutritional risk' by other means | 32 | 8492 | Risk Ratio (M‐H, Random, 95% CI) | 0.94 [0.79, 1.12] |
| 8 All‐cause mortality ‐ participants characterised as 'at nutritional risk' due to biomarkers or anthropometrics Show forest plot | 33 | 8529 | Risk Ratio (M‐H, Random, 95% CI) | 0.94 [0.79, 1.11] |
| 8.1 Biomarkers | 1 | 60 | Risk Ratio (M‐H, Random, 95% CI) | 0.43 [0.12, 1.50] |
| 8.2 Anthropometric measures | 6 | 1111 | Risk Ratio (M‐H, Random, 95% CI) | 0.78 [0.52, 1.16] |
| 8.3 Characterised by other means | 26 | 7358 | Risk Ratio (M‐H, Random, 95% CI) | 1.00 [0.80, 1.25] |
| 9 All‐cause mortality ‐ randomisation year Show forest plot | 33 | 8529 | Risk Ratio (M‐H, Random, 95% CI) | 0.94 [0.79, 1.11] |
| 9.1 Before 1960 | 0 | 0 | Risk Ratio (M‐H, Random, 95% CI) | 0.0 [0.0, 0.0] |
| 9.2 1960‐1979 | 1 | 60 | Risk Ratio (M‐H, Random, 95% CI) | 0.76 [0.24, 2.43] |
| 9.3 1980‐1999 | 18 | 7002 | Risk Ratio (M‐H, Random, 95% CI) | 0.87 [0.72, 1.04] |
| 9.4 After 1999 | 14 | 1467 | Risk Ratio (M‐H, Random, 95% CI) | 1.11 [0.64, 1.92] |
| 10 All‐cause mortality ‐ trials where the intervention lasts fewer than three days compared with trials where the intervention lasts three days or more Show forest plot | 33 | 8529 | Risk Ratio (M‐H, Random, 95% CI) | 0.94 [0.79, 1.11] |
| 10.1 Three days or more | 26 | 7797 | Risk Ratio (M‐H, Random, 95% CI) | 0.87 [0.74, 1.04] |
| 10.2 Less than three days | 6 | 207 | Risk Ratio (M‐H, Random, 95% CI) | 0.18 [0.01, 3.91] |
| 10.3 Unknown | 1 | 525 | Risk Ratio (M‐H, Random, 95% CI) | 1.51 [0.99, 2.31] |
| 11 All‐cause mortality ‐ 'best‐worst case' scenario Show forest plot | 33 | 8793 | Risk Ratio (M‐H, Random, 95% CI) | 0.72 [0.55, 0.95] |
| 12 All‐cause mortality ‐ 'worst‐best case' scenario Show forest plot | 33 | 8793 | Risk Ratio (M‐H, Random, 95% CI) | 1.33 [0.95, 1.86] |
| 13 All‐cause mortality co‐interventions Show forest plot | 33 | 8529 | Risk Ratio (M‐H, Random, 95% CI) | 0.94 [0.79, 1.11] |
| 13.1 received nutrition support as co‐intervention | 1 | 60 | Risk Ratio (M‐H, Random, 95% CI) | 0.43 [0.12, 1.50] |
| 13.2 did not receive nutrition support as co‐intervention | 32 | 8469 | Risk Ratio (M‐H, Random, 95% CI) | 0.95 [0.81, 1.12] |
| 13.3 delayed versus early nutrition support | 0 | 0 | Risk Ratio (M‐H, Random, 95% CI) | 0.0 [0.0, 0.0] |
| Outcome or subgroup title | No. of studies | No. of participants | Statistical method | Effect size |
| 1 All‐cause mortality ‐ overall Show forest plot | 32 | 8501 | Risk Ratio (M‐H, Random, 95% CI) | 0.94 [0.77, 1.15] |
| 2 All‐cause mortality ‐ bias Show forest plot | 32 | 8501 | Risk Ratio (M‐H, Random, 95% CI) | 0.94 [0.77, 1.15] |
| 2.1 High risk of bias | 32 | 8501 | Risk Ratio (M‐H, Random, 95% CI) | 0.94 [0.77, 1.15] |
| 2.2 Low risk of bias | 0 | 0 | Risk Ratio (M‐H, Random, 95% CI) | 0.0 [0.0, 0.0] |
| 3 All‐cause mortality ‐ medical speciality Show forest plot | 32 | 8501 | Risk Ratio (M‐H, Random, 95% CI) | 0.94 [0.77, 1.15] |
| 3.1 Cardiology | 0 | 0 | Risk Ratio (M‐H, Random, 95% CI) | 0.0 [0.0, 0.0] |
| 3.2 Medical gastroenterology and hepatology | 1 | 36 | Risk Ratio (M‐H, Random, 95% CI) | 0.45 [0.10, 2.01] |
| 3.3 Geriatrics | 9 | 1552 | Risk Ratio (M‐H, Random, 95% CI) | 0.81 [0.55, 1.19] |
| 3.4 Pulmonary disease | 2 | 93 | Risk Ratio (M‐H, Random, 95% CI) | 0.49 [0.16, 1.54] |
| 3.5 Endocrinology | 0 | 0 | Risk Ratio (M‐H, Random, 95% CI) | 0.0 [0.0, 0.0] |
| 3.6 Infectious diseases | 0 | 0 | Risk Ratio (M‐H, Random, 95% CI) | 0.0 [0.0, 0.0] |
| 3.7 Rheumatology | 0 | 0 | Risk Ratio (M‐H, Random, 95% CI) | 0.0 [0.0, 0.0] |
| 3.8 Haematology | 0 | 0 | Risk Ratio (M‐H, Random, 95% CI) | 0.0 [0.0, 0.0] |
| 3.9 Nephrology | 0 | 0 | Risk Ratio (M‐H, Random, 95% CI) | 0.0 [0.0, 0.0] |
| 3.10 Gastroenterologic surgery | 10 | 1267 | Risk Ratio (M‐H, Random, 95% CI) | 1.14 [0.61, 2.12] |
| 3.11 Trauma surgery | 0 | 0 | Risk Ratio (M‐H, Random, 95% CI) | 0.0 [0.0, 0.0] |
| 3.12 Ortopaedics | 4 | 361 | Risk Ratio (M‐H, Random, 95% CI) | 1.80 [0.92, 3.52] |
| 3.13 Plastic, reconstructive, and aesthetic surgery | 0 | 0 | Risk Ratio (M‐H, Random, 95% CI) | 0.0 [0.0, 0.0] |
| 3.14 Vascular surgery | 0 | 0 | Risk Ratio (M‐H, Random, 95% CI) | 0.0 [0.0, 0.0] |
| 3.15 Transplant surgery | 1 | 37 | Risk Ratio (M‐H, Random, 95% CI) | 0.35 [0.02, 8.09] |
| 3.16 Urology | 0 | 0 | Risk Ratio (M‐H, Random, 95% CI) | 0.0 [0.0, 0.0] |
| 3.17 Thoracic surgery | 0 | 0 | Risk Ratio (M‐H, Random, 95% CI) | 0.0 [0.0, 0.0] |
| 3.18 Neurological surgery | 0 | 0 | Risk Ratio (M‐H, Random, 95% CI) | 0.0 [0.0, 0.0] |
| 3.19 Oro‐maxillo‐facial surgery | 0 | 0 | Risk Ratio (M‐H, Random, 95% CI) | 0.0 [0.0, 0.0] |
| 3.20 Anaesthesiology | 0 | 0 | Risk Ratio (M‐H, Random, 95% CI) | 0.0 [0.0, 0.0] |
| 3.21 Emergency medicine | 0 | 0 | Risk Ratio (M‐H, Random, 95% CI) | 0.0 [0.0, 0.0] |
| 3.22 Psychiatry | 0 | 0 | Risk Ratio (M‐H, Random, 95% CI) | 0.0 [0.0, 0.0] |
| 3.23 Neurology | 3 | 4081 | Risk Ratio (M‐H, Random, 95% CI) | 0.65 [0.22, 1.93] |
| 3.24 Oncology | 0 | 0 | Risk Ratio (M‐H, Random, 95% CI) | 0.0 [0.0, 0.0] |
| 3.25 Dermatology | 0 | 0 | Risk Ratio (M‐H, Random, 95% CI) | 0.0 [0.0, 0.0] |
| 3.26 Gynaecology | 0 | 0 | Risk Ratio (M‐H, Random, 95% CI) | 0.0 [0.0, 0.0] |
| 3.27 Mixed | 2 | 1074 | Risk Ratio (M‐H, Random, 95% CI) | 1.24 [0.73, 2.12] |
| 4 All‐cause mortality ‐ based on adequacy of the amount of calories Show forest plot | 32 | 8501 | Risk Ratio (M‐H, Random, 95% CI) | 0.94 [0.77, 1.15] |
| 4.1 Clearly adequate in intervention and clearly inadequate in control | 4 | 260 | Risk Ratio (M‐H, Random, 95% CI) | 0.80 [0.17, 3.70] |
| 4.2 Inadequate in the experimental or adequate in the control | 12 | 5512 | Risk Ratio (M‐H, Random, 95% CI) | 0.94 [0.76, 1.17] |
| 4.3 Experimental group is overfed | 2 | 69 | Risk Ratio (M‐H, Random, 95% CI) | 0.53 [0.14, 1.98] |
| 4.4 Unclear intake in control or experimental | 14 | 2660 | Risk Ratio (M‐H, Random, 95% CI) | 0.95 [0.65, 1.38] |
| 5 All‐cause mortality ‐ different screening tools Show forest plot | 32 | 8501 | Risk Ratio (M‐H, Random, 95% CI) | 0.94 [0.77, 1.15] |
| 5.1 NRS 2002 | 0 | 0 | Risk Ratio (M‐H, Random, 95% CI) | 0.0 [0.0, 0.0] |
| 5.2 MUST | 0 | 0 | Risk Ratio (M‐H, Random, 95% CI) | 0.0 [0.0, 0.0] |
| 5.3 MNA | 2 | 117 | Risk Ratio (M‐H, Random, 95% CI) | 0.61 [0.12, 3.18] |
| 5.4 SGA | 1 | 525 | Risk Ratio (M‐H, Random, 95% CI) | 1.51 [0.99, 2.31] |
| 5.5 Other means | 29 | 7859 | Risk Ratio (M‐H, Random, 95% CI) | 0.89 [0.73, 1.09] |
| 6 All‐cause mortality ‐ participants characterised as 'at nutritional risk' due to one of the following conditions Show forest plot | 32 | 8501 | Risk Ratio (M‐H, Random, 95% CI) | 0.94 [0.77, 1.15] |
| 6.1 Major surgery | 11 | 1304 | Risk Ratio (M‐H, Random, 95% CI) | 1.09 [0.59, 2.00] |
| 6.2 Stroke | 2 | 4052 | Risk Ratio (M‐H, Random, 95% CI) | 0.65 [0.22, 1.93] |
| 6.3 ICU participants including trauma | 0 | 0 | Risk Ratio (M‐H, Random, 95% CI) | 0.0 [0.0, 0.0] |
| 6.4 Frail elderly participants with less severe conditions known to increase protein requirements | 10 | 996 | Risk Ratio (M‐H, Random, 95% CI) | 0.87 [0.57, 1.34] |
| 6.5 Participants do not fall into one of the categories above | 9 | 2149 | Risk Ratio (M‐H, Random, 95% CI) | 0.96 [0.64, 1.46] |
| 7 All‐cause mortality ‐ participants characterised as 'at nutritional risk' due to one of the following criteria Show forest plot | 32 | 8501 | Risk Ratio (M‐H, Random, 95% CI) | 0.94 [0.77, 1.15] |
| 7.1 BMI less than 20.5 kg/m2 | 1 | 37 | Risk Ratio (M‐H, Random, 95% CI) | 0.35 [0.02, 8.09] |
| 7.2 Weight loss of at least 5% during the last three months | 0 | 0 | Risk Ratio (M‐H, Random, 95% CI) | 0.0 [0.0, 0.0] |
| 7.3 Weight loss of at least 10% during the last six months | 0 | 0 | Risk Ratio (M‐H, Random, 95% CI) | 0.0 [0.0, 0.0] |
| 7.4 Insufficient food intake during the last week (50% of requirements or less) | 0 | 0 | Risk Ratio (M‐H, Random, 95% CI) | 0.0 [0.0, 0.0] |
| 7.5 Participants characterised as 'at nutritional risk' by other means | 31 | 8464 | Risk Ratio (M‐H, Random, 95% CI) | 0.94 [0.77, 1.16] |
| 8 All‐cause mortality ‐ participants characterised as 'at nutritional risk' due to biomarkers or anthropometrics Show forest plot | 32 | 8501 | Risk Ratio (M‐H, Random, 95% CI) | 0.94 [0.77, 1.15] |
| 8.1 Biomarkers | 1 | 60 | Risk Ratio (M‐H, Random, 95% CI) | 0.43 [0.12, 1.50] |
| 8.2 Anthropometric measures | 6 | 1111 | Risk Ratio (M‐H, Random, 95% CI) | 0.78 [0.52, 1.16] |
| 8.3 Both anthropometrics and biomarkers | 0 | 0 | Risk Ratio (M‐H, Random, 95% CI) | 0.0 [0.0, 0.0] |
| 8.4 Characterised by other means | 25 | 7330 | Risk Ratio (M‐H, Random, 95% CI) | 0.99 [0.77, 1.26] |
| 9 All‐cause mortality ‐ randomisation year Show forest plot | 32 | 8501 | Risk Ratio (M‐H, Random, 95% CI) | 0.94 [0.77, 1.15] |
| 9.1 Before 1960 | 0 | 0 | Risk Ratio (M‐H, Random, 95% CI) | 0.0 [0.0, 0.0] |
| 9.2 1960 to 1979 | 1 | 60 | Risk Ratio (M‐H, Random, 95% CI) | 0.76 [0.24, 2.43] |
| 9.3 1980 to 1999 | 18 | 6974 | Risk Ratio (M‐H, Random, 95% CI) | 0.86 [0.71, 1.05] |
| 9.4 After 1999 | 13 | 1467 | Risk Ratio (M‐H, Random, 95% CI) | 1.19 [0.77, 1.83] |
| 10 All‐cause mortality ‐ trials where the intervention lasts fewer than three days compared with trials where the intervention lasts three days or more Show forest plot | 32 | 8501 | Risk Ratio (M‐H, Random, 95% CI) | 0.94 [0.77, 1.15] |
| 10.1 Three days or more | 31 | 8462 | Risk Ratio (M‐H, Random, 95% CI) | 0.94 [0.77, 1.15] |
| 10.2 Less than three days | 1 | 39 | Risk Ratio (M‐H, Random, 95% CI) | 0.0 [0.0, 0.0] |
| 10.3 Unknown | 0 | 0 | Risk Ratio (M‐H, Random, 95% CI) | 0.0 [0.0, 0.0] |
| 11 All‐cause mortality ‐ 'best‐worst case' scenario Show forest plot | 32 | 8793 | Risk Ratio (M‐H, Random, 95% CI) | 0.70 [0.54, 0.91] |
| 12 All‐cause mortality ‐ 'worst‐best case' scenario Show forest plot | 32 | 8793 | Risk Ratio (M‐H, Random, 95% CI) | 1.27 [0.93, 1.73] |
| 13 All‐cause mortality co‐interventions Show forest plot | 131 | 22435 | Risk Ratio (M‐H, Fixed, 95% CI) | 0.91 [0.86, 0.98] |
| 13.1 received nutrition support as co‐intervention | 8 | 5185 | Risk Ratio (M‐H, Fixed, 95% CI) | 0.93 [0.80, 1.08] |
| 13.2 did not receive nutrition support as co‐intervention | 120 | 17017 | Risk Ratio (M‐H, Fixed, 95% CI) | 0.91 [0.84, 0.98] |
| 13.3 delayed versus early nutrition support | 3 | 233 | Risk Ratio (M‐H, Fixed, 95% CI) | 0.99 [0.53, 1.83] |
| Outcome or subgroup title | No. of studies | No. of participants | Statistical method | Effect size |
| 1 Serious adverse events ‐ overall Show forest plot | 33 | 8569 | Risk Ratio (M‐H, Random, 95% CI) | 0.92 [0.79, 1.06] |
| 2 Serious adverse events ‐ bias Show forest plot | 33 | 8569 | Risk Ratio (M‐H, Random, 95% CI) | 0.92 [0.79, 1.06] |
| 2.1 High risk of bias | 33 | 8569 | Risk Ratio (M‐H, Random, 95% CI) | 0.92 [0.79, 1.06] |
| 2.2 Low risk of bias | 0 | 0 | Risk Ratio (M‐H, Random, 95% CI) | 0.0 [0.0, 0.0] |
| 3 Serious adverse events ‐ by medical specialty Show forest plot | 33 | 8569 | Risk Ratio (M‐H, Random, 95% CI) | 0.92 [0.79, 1.06] |
| 3.1 Cardiology | 0 | 0 | Risk Ratio (M‐H, Random, 95% CI) | 0.0 [0.0, 0.0] |
| 3.2 Medical gastroenterology and hepatology | 1 | 36 | Risk Ratio (M‐H, Random, 95% CI) | 0.45 [0.10, 2.01] |
| 3.3 Geriatrics | 10 | 1609 | Risk Ratio (M‐H, Random, 95% CI) | 0.74 [0.56, 0.97] |
| 3.4 Pulmonary disease | 2 | 93 | Risk Ratio (M‐H, Random, 95% CI) | 0.49 [0.16, 1.54] |
| 3.5 Endocrinology | 0 | 0 | Risk Ratio (M‐H, Random, 95% CI) | 0.0 [0.0, 0.0] |
| 3.6 Infectious diseases | 0 | 0 | Risk Ratio (M‐H, Random, 95% CI) | 0.0 [0.0, 0.0] |
| 3.7 Rheumatology | 0 | 0 | Risk Ratio (M‐H, Random, 95% CI) | 0.0 [0.0, 0.0] |
| 3.8 Haematology | 0 | 0 | Risk Ratio (M‐H, Random, 95% CI) | 0.0 [0.0, 0.0] |
| 3.9 Nephrology | 0 | 0 | Risk Ratio (M‐H, Random, 95% CI) | 0.0 [0.0, 0.0] |
| 3.10 Gastroenterologic surgery | 10 | 1253 | Risk Ratio (M‐H, Random, 95% CI) | 0.91 [0.66, 1.25] |
| 3.11 Trauma surgery | 0 | 0 | Risk Ratio (M‐H, Random, 95% CI) | 0.0 [0.0, 0.0] |
| 3.12 Ortopaedics | 4 | 371 | Risk Ratio (M‐H, Random, 95% CI) | 1.69 [0.53, 5.36] |
| 3.13 Plastic, reconstructive, and aesthetic surgery | 0 | 0 | Risk Ratio (M‐H, Random, 95% CI) | 0.0 [0.0, 0.0] |
| 3.14 Vascular surgery | 0 | 0 | Risk Ratio (M‐H, Random, 95% CI) | 0.0 [0.0, 0.0] |
| 3.15 Transplant surgery | 1 | 37 | Risk Ratio (M‐H, Random, 95% CI) | 0.35 [0.02, 8.09] |
| 3.16 Urology | 0 | 0 | Risk Ratio (M‐H, Random, 95% CI) | 0.0 [0.0, 0.0] |
| 3.17 Thoracic surgery | 0 | 0 | Risk Ratio (M‐H, Random, 95% CI) | 0.0 [0.0, 0.0] |
| 3.18 Neurological surgery | 0 | 0 | Risk Ratio (M‐H, Random, 95% CI) | 0.0 [0.0, 0.0] |
| 3.19 Oro‐maxillo‐facial surgery | 0 | 0 | Risk Ratio (M‐H, Random, 95% CI) | 0.0 [0.0, 0.0] |
| 3.20 Anaesthesiology | 0 | 0 | Risk Ratio (M‐H, Random, 95% CI) | 0.0 [0.0, 0.0] |
| 3.21 Emergency medicine | 0 | 0 | Risk Ratio (M‐H, Random, 95% CI) | 0.0 [0.0, 0.0] |
| 3.22 Psychiatry | 0 | 0 | Risk Ratio (M‐H, Random, 95% CI) | 0.0 [0.0, 0.0] |
| 3.23 Neurology | 3 | 4092 | Risk Ratio (M‐H, Random, 95% CI) | 0.96 [0.74, 1.24] |
| 3.24 Oncology | 0 | 0 | Risk Ratio (M‐H, Random, 95% CI) | 0.0 [0.0, 0.0] |
| 3.25 Dermatology | 0 | 0 | Risk Ratio (M‐H, Random, 95% CI) | 0.0 [0.0, 0.0] |
| 3.26 Gynaecology | 0 | 0 | Risk Ratio (M‐H, Random, 95% CI) | 0.0 [0.0, 0.0] |
| 3.27 Mixed | 2 | 1078 | Risk Ratio (M‐H, Random, 95% CI) | 1.24 [0.73, 2.12] |
| 4 Serious adverse events ‐ based on adequacy of the amount of calories Show forest plot | 33 | 8569 | Risk Ratio (M‐H, Random, 95% CI) | 0.92 [0.79, 1.06] |
| 4.1 Clearly adequate in intervention and clearly inadequate in control | 4 | 246 | Risk Ratio (M‐H, Random, 95% CI) | 0.99 [0.33, 3.02] |
| 4.2 Inadequate in the experimental or adequate in the control | 13 | 5590 | Risk Ratio (M‐H, Random, 95% CI) | 0.91 [0.76, 1.10] |
| 4.3 Experimental group is overfed | 2 | 69 | Risk Ratio (M‐H, Random, 95% CI) | 0.53 [0.14, 1.98] |
| 4.4 Unclear intake in control or experimental | 14 | 2664 | Risk Ratio (M‐H, Random, 95% CI) | 0.92 [0.63, 1.34] |
| 5 Serious adverse events ‐ different screening tools Show forest plot | 33 | 8569 | Risk Ratio (M‐H, Random, 95% CI) | 0.92 [0.79, 1.06] |
| 5.1 NRS 2002 | 0 | 0 | Risk Ratio (M‐H, Random, 95% CI) | 0.0 [0.0, 0.0] |
| 5.2 MUST | 0 | 0 | Risk Ratio (M‐H, Random, 95% CI) | 0.0 [0.0, 0.0] |
| 5.3 MNA | 2 | 117 | Risk Ratio (M‐H, Random, 95% CI) | 0.61 [0.12, 3.18] |
| 5.4 SGA | 1 | 529 | Risk Ratio (M‐H, Random, 95% CI) | 1.51 [0.99, 2.31] |
| 5.5 Other means | 30 | 7923 | Risk Ratio (M‐H, Random, 95% CI) | 0.86 [0.74, 1.01] |
| 6 Serious adverse events ‐ participants characterised as 'at nutritional risk' due to one of the following conditions Show forest plot | 33 | 8569 | Risk Ratio (M‐H, Random, 95% CI) | 0.92 [0.79, 1.06] |
| 6.1 Major surgery | 10 | 612 | Risk Ratio (M‐H, Random, 95% CI) | 0.67 [0.22, 2.08] |
| 6.2 Stroke | 2 | 4063 | Risk Ratio (M‐H, Random, 95% CI) | 0.96 [0.74, 1.24] |
| 6.3 ICU participants including trauma | 0 | 0 | Risk Ratio (M‐H, Random, 95% CI) | 0.0 [0.0, 0.0] |
| 6.4 Frail elderly participants with less severe conditions known to increase protein requirements | 11 | 1063 | Risk Ratio (M‐H, Random, 95% CI) | 0.77 [0.52, 1.15] |
| 6.5 Participants do not fall into one of the categories above | 10 | 2831 | Risk Ratio (M‐H, Random, 95% CI) | 0.94 [0.70, 1.26] |
| 7 Serious adverse events ‐ participants characterised as 'at nutritional risk' due to one of the following criteria Show forest plot | 33 | 8569 | Risk Ratio (M‐H, Random, 95% CI) | 0.92 [0.79, 1.06] |
| 7.1 BMI less than 20.5 kg/m2 | 1 | 37 | Risk Ratio (M‐H, Random, 95% CI) | 0.35 [0.02, 8.09] |
| 7.2 Weight loss of at least 5% during the last three months | 0 | 0 | Risk Ratio (M‐H, Random, 95% CI) | 0.0 [0.0, 0.0] |
| 7.3 Weight loss of at least 10% during the last six months | 0 | 0 | Risk Ratio (M‐H, Random, 95% CI) | 0.0 [0.0, 0.0] |
| 7.4 Insufficient food intake during the last week (50% of requirements or less) | 0 | 0 | Risk Ratio (M‐H, Random, 95% CI) | 0.0 [0.0, 0.0] |
| 7.5 Participants characterised as 'at nutritional risk' by other means | 32 | 8532 | Risk Ratio (M‐H, Random, 95% CI) | 0.92 [0.79, 1.06] |
| 8 Serious adverse events ‐ participants characterised as 'at nutritional risk' due to biomarkers or anthropometrics Show forest plot | 33 | 8569 | Risk Ratio (M‐H, Random, 95% CI) | 0.92 [0.79, 1.06] |
| 8.1 Biomarkers | 1 | 60 | Risk Ratio (M‐H, Random, 95% CI) | 0.43 [0.12, 1.50] |
| 8.2 Anthropometric measures | 6 | 1111 | Risk Ratio (M‐H, Random, 95% CI) | 0.78 [0.52, 1.16] |
| 8.3 Mixed | 0 | 0 | Risk Ratio (M‐H, Random, 95% CI) | 0.0 [0.0, 0.0] |
| 8.4 Characterised by other means | 26 | 7398 | Risk Ratio (M‐H, Random, 95% CI) | 0.95 [0.81, 1.12] |
| 9 Serious adverse events ‐ randomisation year Show forest plot | 33 | 8569 | Risk Ratio (M‐H, Random, 95% CI) | 0.92 [0.79, 1.06] |
| 9.1 Before 1960 | 0 | 0 | Risk Ratio (M‐H, Random, 95% CI) | 0.0 [0.0, 0.0] |
| 9.2 1960 to 1979 | 1 | 60 | Risk Ratio (M‐H, Random, 95% CI) | 0.76 [0.24, 2.43] |
| 9.3 1980 to 1999 | 18 | 6988 | Risk Ratio (M‐H, Random, 95% CI) | 0.86 [0.73, 1.01] |
| 9.4 After 1999 | 14 | 1521 | Risk Ratio (M‐H, Random, 95% CI) | 1.05 [0.61, 1.82] |
| 10 Serious adverse events ‐ trials where the intervention lasts fewer than three days compared with trials where the intervention lasts three days or more Show forest plot | 33 | 8569 | Risk Ratio (M‐H, Random, 95% CI) | 0.92 [0.79, 1.06] |
| 10.1 Three days or more | 31 | 8480 | Risk Ratio (M‐H, Random, 95% CI) | 0.92 [0.80, 1.06] |
| 10.2 Less than three days | 1 | 39 | Risk Ratio (M‐H, Random, 95% CI) | 0.0 [0.0, 0.0] |
| 10.3 Unknown | 1 | 50 | Risk Ratio (M‐H, Random, 95% CI) | 0.25 [0.01, 5.00] |
| 11 Serious adverse events ‐ 'best‐worst case' scenario Show forest plot | 33 | 8844 | Risk Ratio (M‐H, Random, 95% CI) | 0.67 [0.52, 0.86] |
| 12 Serious adverse events ‐ 'worst‐best case' scenario Show forest plot | 33 | 8844 | Risk Ratio (M‐H, Random, 95% CI) | 1.27 [0.92, 1.75] |
| 13 Serious adverse events co‐interventions Show forest plot | 134 | 21960 | Risk Ratio (M‐H, Fixed, 95% CI) | 0.91 [0.84, 0.99] |
| 13.1 received nutrition support as co‐intervention | 8 | 5178 | Risk Ratio (M‐H, Fixed, 95% CI) | 0.96 [0.79, 1.17] |
| 13.2 did not receive nutrition support as co‐intervention | 119 | 16359 | Risk Ratio (M‐H, Fixed, 95% CI) | 0.90 [0.83, 0.99] |
| 13.3 delayed versus early nutrition support | 7 | 423 | Risk Ratio (M‐H, Fixed, 95% CI) | 0.89 [0.51, 1.57] |
| Outcome or subgroup title | No. of studies | No. of participants | Statistical method | Effect size |
| 1 Serious adverse events ‐ overall Show forest plot | 33 | 8541 | Risk Ratio (M‐H, Random, 95% CI) | 0.89 [0.74, 1.07] |
| 2 Serious adverse events ‐ bias Show forest plot | 33 | 8541 | Risk Ratio (M‐H, Random, 95% CI) | 0.89 [0.74, 1.07] |
| 2.1 High risk of bias | 33 | 8541 | Risk Ratio (M‐H, Random, 95% CI) | 0.89 [0.74, 1.07] |
| 2.2 Low risk of bias | 0 | 0 | Risk Ratio (M‐H, Random, 95% CI) | 0.0 [0.0, 0.0] |
| 3 Serious adverse events ‐ by medical speciality Show forest plot | 33 | 8541 | Risk Ratio (M‐H, Random, 95% CI) | 0.89 [0.74, 1.07] |
| 3.1 Cardiology | 0 | 0 | Risk Ratio (M‐H, Random, 95% CI) | 0.0 [0.0, 0.0] |
| 3.2 Medical gastroenterology and hepatology | 1 | 36 | Risk Ratio (M‐H, Random, 95% CI) | 0.45 [0.10, 2.01] |
| 3.3 Geriatrics | 10 | 1602 | Risk Ratio (M‐H, Random, 95% CI) | 0.80 [0.55, 1.15] |
| 3.4 Pulmonary disease | 2 | 93 | Risk Ratio (M‐H, Random, 95% CI) | 0.49 [0.16, 1.54] |
| 3.5 Endocrinology | 0 | 0 | Risk Ratio (M‐H, Random, 95% CI) | 0.0 [0.0, 0.0] |
| 3.6 Infectious diseases | 0 | 0 | Risk Ratio (M‐H, Random, 95% CI) | 0.0 [0.0, 0.0] |
| 3.7 Rheumatology | 0 | 0 | Risk Ratio (M‐H, Random, 95% CI) | 0.0 [0.0, 0.0] |
| 3.8 Haematology | 0 | 0 | Risk Ratio (M‐H, Random, 95% CI) | 0.0 [0.0, 0.0] |
| 3.9 Nephrology | 0 | 0 | Risk Ratio (M‐H, Random, 95% CI) | 0.0 [0.0, 0.0] |
| 3.10 Gastroenterologic surgery | 10 | 1253 | Risk Ratio (M‐H, Random, 95% CI) | 0.83 [0.61, 1.12] |
| 3.11 Trauma surgery | 0 | 0 | Risk Ratio (M‐H, Random, 95% CI) | 0.0 [0.0, 0.0] |
| 3.12 Ortopaedics | 4 | 361 | Risk Ratio (M‐H, Random, 95% CI) | 1.80 [0.92, 3.52] |
| 3.13 Plastic, reconstructive, and aesthetic surgery | 0 | 0 | Risk Ratio (M‐H, Random, 95% CI) | 0.0 [0.0, 0.0] |
| 3.14 Vascular surgery | 0 | 0 | Risk Ratio (M‐H, Random, 95% CI) | 0.0 [0.0, 0.0] |
| 3.15 Transplant surgery | 1 | 37 | Risk Ratio (M‐H, Random, 95% CI) | 0.35 [0.02, 8.09] |
| 3.16 Urology | 0 | 0 | Risk Ratio (M‐H, Random, 95% CI) | 0.0 [0.0, 0.0] |
| 3.17 Thoracic surgery | 0 | 0 | Risk Ratio (M‐H, Random, 95% CI) | 0.0 [0.0, 0.0] |
| 3.18 Neurological surgery | 0 | 0 | Risk Ratio (M‐H, Random, 95% CI) | 0.0 [0.0, 0.0] |
| 3.19 Oro‐maxillo‐facial surgery | 0 | 0 | Risk Ratio (M‐H, Random, 95% CI) | 0.0 [0.0, 0.0] |
| 3.20 Anaesthesiology | 0 | 0 | Risk Ratio (M‐H, Random, 95% CI) | 0.0 [0.0, 0.0] |
| 3.21 Emergency medicine | 0 | 0 | Risk Ratio (M‐H, Random, 95% CI) | 0.0 [0.0, 0.0] |
| 3.22 Psychiatry | 0 | 0 | Risk Ratio (M‐H, Random, 95% CI) | 0.0 [0.0, 0.0] |
| 3.23 Neurology | 3 | 4081 | Risk Ratio (M‐H, Random, 95% CI) | 0.65 [0.22, 1.93] |
| 3.24 Oncology | 0 | 0 | Risk Ratio (M‐H, Random, 95% CI) | 0.0 [0.0, 0.0] |
| 3.25 Dermatology | 0 | 0 | Risk Ratio (M‐H, Random, 95% CI) | 0.0 [0.0, 0.0] |
| 3.26 Gynaecology | 0 | 0 | Risk Ratio (M‐H, Random, 95% CI) | 0.0 [0.0, 0.0] |
| 3.27 Mixed | 2 | 1078 | Risk Ratio (M‐H, Random, 95% CI) | 1.24 [0.73, 2.12] |
| 4 Serious adverse events ‐ based on adequacy of the amount of calories Show forest plot | 33 | 8541 | Risk Ratio (M‐H, Random, 95% CI) | 0.89 [0.74, 1.07] |
| 4.1 Clearly adequate in intervention and clearly inadequate in control | 4 | 246 | Risk Ratio (M‐H, Random, 95% CI) | 0.64 [0.20, 2.00] |
| 4.2 Inadequate in the experimental or adequate in the control | 13 | 5562 | Risk Ratio (M‐H, Random, 95% CI) | 0.93 [0.81, 1.06] |
| 4.3 Experimental group is overfed | 2 | 69 | Risk Ratio (M‐H, Random, 95% CI) | 0.53 [0.14, 1.98] |
| 4.4 Unclear intake in control or experimental | 14 | 2664 | Risk Ratio (M‐H, Random, 95% CI) | 0.83 [0.56, 1.23] |
| 5 Serious adverse events ‐ different screening tools Show forest plot | 33 | 8541 | Risk Ratio (M‐H, Random, 95% CI) | 0.89 [0.74, 1.07] |
| 5.1 NRS 2002 | 0 | 0 | Risk Ratio (M‐H, Random, 95% CI) | 0.0 [0.0, 0.0] |
| 5.2 MUST | 0 | 0 | Risk Ratio (M‐H, Random, 95% CI) | 0.0 [0.0, 0.0] |
| 5.3 MNA | 2 | 117 | Risk Ratio (M‐H, Random, 95% CI) | 0.61 [0.12, 3.18] |
| 5.4 SGA | 0 | 0 | Risk Ratio (M‐H, Random, 95% CI) | 0.0 [0.0, 0.0] |
| 5.5 Other means | 31 | 8424 | Risk Ratio (M‐H, Random, 95% CI) | 0.89 [0.74, 1.08] |
| 6 Serious adverse events ‐ participants characterised as 'at nutritional risk' due to one of the following conditions Show forest plot | 33 | 8541 | Risk Ratio (M‐H, Random, 95% CI) | 0.89 [0.74, 1.07] |
| 6.1 Major surgery | 11 | 1290 | Risk Ratio (M‐H, Random, 95% CI) | 0.82 [0.61, 1.11] |
| 6.2 Stroke | 2 | 4052 | Risk Ratio (M‐H, Random, 95% CI) | 0.65 [0.22, 1.93] |
| 6.3 ICU participants including trauma | 0 | 0 | Risk Ratio (M‐H, Random, 95% CI) | 0.0 [0.0, 0.0] |
| 6.4 Frail elderly participants with less severe conditions known to increase protein requirements | 11 | 1046 | Risk Ratio (M‐H, Random, 95% CI) | 0.85 [0.57, 1.27] |
| 6.5 Participants do not fall into one of the categories above | 9 | 2153 | Risk Ratio (M‐H, Random, 95% CI) | 0.96 [0.64, 1.46] |
| 7 Serious adverse events ‐ participants characterised as 'at nutritional risk' due to one of the following criteria Show forest plot | 33 | 8541 | Risk Ratio (M‐H, Random, 95% CI) | 0.89 [0.74, 1.07] |
| 7.1 BMI less than 20.5 kg/m2 | 1 | 37 | Risk Ratio (M‐H, Random, 95% CI) | 0.35 [0.02, 8.09] |
| 7.2 Weight loss of at least 5% during the last three months | 0 | 0 | Risk Ratio (M‐H, Random, 95% CI) | 0.0 [0.0, 0.0] |
| 7.3 Weight loss of at least 10% during the last six months | 0 | 0 | Risk Ratio (M‐H, Random, 95% CI) | 0.0 [0.0, 0.0] |
| 7.4 Insufficient food intake during the last week (50% of requirements or less) | 0 | 0 | Risk Ratio (M‐H, Random, 95% CI) | 0.0 [0.0, 0.0] |
| 7.5 Participants characterised as 'at nutritional risk' by other means | 32 | 8504 | Risk Ratio (M‐H, Random, 95% CI) | 0.89 [0.74, 1.07] |
| 8 Serious adverse events ‐ participants characterised as 'at nutritional risk' due to biomarkers or anthropometrics Show forest plot | 33 | 8541 | Risk Ratio (M‐H, Random, 95% CI) | 0.89 [0.74, 1.07] |
| 8.1 Biomarkers | 1 | 60 | Risk Ratio (M‐H, Random, 95% CI) | 0.43 [0.12, 1.50] |
| 8.2 Anthropometric measures | 6 | 1111 | Risk Ratio (M‐H, Random, 95% CI) | 0.78 [0.52, 1.16] |
| 8.3 Both | 0 | 0 | Risk Ratio (M‐H, Random, 95% CI) | 0.0 [0.0, 0.0] |
| 8.4 Characterised by other means | 26 | 7370 | Risk Ratio (M‐H, Random, 95% CI) | 0.91 [0.72, 1.13] |
| 9 Serious adverse events ‐ randomisation year Show forest plot | 33 | 8541 | Risk Ratio (M‐H, Random, 95% CI) | 0.89 [0.74, 1.07] |
| 9.1 Before 1960 | 0 | 0 | Risk Ratio (M‐H, Random, 95% CI) | 0.0 [0.0, 0.0] |
| 9.2 1960 to 1979 | 1 | 60 | Risk Ratio (M‐H, Random, 95% CI) | 0.76 [0.24, 2.43] |
| 9.3 1980 to 1999 | 18 | 6960 | Risk Ratio (M‐H, Random, 95% CI) | 0.88 [0.78, 1.00] |
| 9.4 After 1999 | 14 | 1521 | Risk Ratio (M‐H, Random, 95% CI) | 0.79 [0.45, 1.39] |
| 10 Serious adverse events ‐ trials where the intervention lasts fewer than three days compared with trials where the intervention lasts three days or more Show forest plot | 32 | 8501 | Risk Ratio (M‐H, Random, 95% CI) | 0.89 [0.74, 1.07] |
| 10.1 Three days or more | 30 | 8412 | Risk Ratio (M‐H, Random, 95% CI) | 0.89 [0.74, 1.07] |
| 10.2 Less than three days | 1 | 39 | Risk Ratio (M‐H, Random, 95% CI) | 0.0 [0.0, 0.0] |
| 10.3 Unknown | 1 | 50 | Risk Ratio (M‐H, Random, 95% CI) | 0.25 [0.01, 5.00] |
| 11 Serious adverse events ‐ 'best‐worst case' scenario Show forest plot | 33 | 8844 | Risk Ratio (M‐H, Random, 95% CI) | 0.64 [0.50, 0.81] |
| 12 Serious adverse events ‐ 'worst‐best case' scenario Show forest plot | 33 | 8844 | Risk Ratio (M‐H, Random, 95% CI) | 1.15 [0.86, 1.55] |
| 13 Serious adverse events co‐interventions Show forest plot | 33 | 8541 | Risk Ratio (M‐H, Fixed, 95% CI) | 0.92 [0.82, 1.03] |
| 13.1 Received nutrition support as co‐intervention | 1 | 60 | Risk Ratio (M‐H, Fixed, 95% CI) | 0.43 [0.12, 1.50] |
| 13.2 did not receive nutrition support as co‐intervention | 32 | 8481 | Risk Ratio (M‐H, Fixed, 95% CI) | 0.92 [0.82, 1.04] |
| 13.3 delayed versus early nutrition support | 0 | 0 | Risk Ratio (M‐H, Fixed, 95% CI) | 0.0 [0.0, 0.0] |
| Outcome or subgroup title | No. of studies | No. of participants | Statistical method | Effect size |
| 1 All‐cause mortality ‐ overall Show forest plot | 36 | 3722 | Risk Ratio (M‐H, Random, 95% CI) | 0.88 [0.75, 1.03] |
| 2 All‐cause mortality ‐ bias Show forest plot | 36 | 3722 | Risk Ratio (M‐H, Random, 95% CI) | 0.88 [0.75, 1.03] |
| 2.1 High risk of bias | 36 | 3722 | Risk Ratio (M‐H, Random, 95% CI) | 0.88 [0.75, 1.03] |
| 2.2 Low risk of bias | 0 | 0 | Risk Ratio (M‐H, Random, 95% CI) | 0.0 [0.0, 0.0] |
| 3 All‐cause mortality ‐ medical speciality Show forest plot | 36 | 3722 | Risk Ratio (M‐H, Random, 95% CI) | 0.88 [0.75, 1.03] |
| 3.1 Cardiology | 0 | 0 | Risk Ratio (M‐H, Random, 95% CI) | 0.0 [0.0, 0.0] |
| 3.2 Medical gastroenterology and hepatology | 4 | 289 | Risk Ratio (M‐H, Random, 95% CI) | 0.75 [0.40, 1.42] |
| 3.3 Geriatrics | 0 | 0 | Risk Ratio (M‐H, Random, 95% CI) | 0.0 [0.0, 0.0] |
| 3.4 Pulmonary disease | 0 | 0 | Risk Ratio (M‐H, Random, 95% CI) | 0.0 [0.0, 0.0] |
| 3.5 Endocrinology | 0 | 0 | Risk Ratio (M‐H, Random, 95% CI) | 0.0 [0.0, 0.0] |
| 3.6 Infectious diseases | 1 | 56 | Risk Ratio (M‐H, Random, 95% CI) | 1.61 [0.66, 3.92] |
| 3.7 Rheumatology | 0 | 0 | Risk Ratio (M‐H, Random, 95% CI) | 0.0 [0.0, 0.0] |
| 3.8 Haematology | 0 | 0 | Risk Ratio (M‐H, Random, 95% CI) | 0.0 [0.0, 0.0] |
| 3.9 Nephrology | 0 | 0 | Risk Ratio (M‐H, Random, 95% CI) | 0.0 [0.0, 0.0] |
| 3.10 Gastroenterologic surgery | 13 | 1063 | Risk Ratio (M‐H, Random, 95% CI) | 0.72 [0.44, 1.18] |
| 3.11 Trauma surgery | 2 | 139 | Risk Ratio (M‐H, Random, 95% CI) | 0.50 [0.20, 1.28] |
| 3.12 Orthopaedics | 4 | 248 | Risk Ratio (M‐H, Random, 95% CI) | 0.89 [0.21, 3.81] |
| 3.13 Plastic, reconstructive and aesthetic surgery | 0 | 0 | Risk Ratio (M‐H, Random, 95% CI) | 0.0 [0.0, 0.0] |
| 3.14 Vascular surgery | 1 | 13 | Risk Ratio (M‐H, Random, 95% CI) | 0.0 [0.0, 0.0] |
| 3.15 Transplant surgery | 0 | 0 | Risk Ratio (M‐H, Random, 95% CI) | 0.0 [0.0, 0.0] |
| 3.16 Urology | 0 | 0 | Risk Ratio (M‐H, Random, 95% CI) | 0.0 [0.0, 0.0] |
| 3.17 Thoracic surgery | 2 | 548 | Risk Ratio (M‐H, Random, 95% CI) | 0.22 [0.03, 1.86] |
| 3.18 Neurological surgery | 0 | 0 | Risk Ratio (M‐H, Random, 95% CI) | 0.0 [0.0, 0.0] |
| 3.19 Oro‐maxillo‐facial surgery | 1 | 32 | Risk Ratio (M‐H, Random, 95% CI) | 3.38 [0.15, 77.12] |
| 3.20 Anaesthesiology | 0 | 0 | Risk Ratio (M‐H, Random, 95% CI) | 0.0 [0.0, 0.0] |
| 3.21 Emergency medicine | 3 | 154 | Risk Ratio (M‐H, Random, 95% CI) | 0.77 [0.31, 1.94] |
| 3.22 Psychiatry | 0 | 0 | Risk Ratio (M‐H, Random, 95% CI) | 0.0 [0.0, 0.0] |
| 3.23 Neurology | 3 | 1027 | Risk Ratio (M‐H, Random, 95% CI) | 0.67 [0.33, 1.37] |
| 3.24 Oncology | 0 | 0 | Risk Ratio (M‐H, Random, 95% CI) | 0.0 [0.0, 0.0] |
| 3.25 Dermatology | 0 | 0 | Risk Ratio (M‐H, Random, 95% CI) | 0.0 [0.0, 0.0] |
| 3.26 Gynaecology | 0 | 0 | Risk Ratio (M‐H, Random, 95% CI) | 0.0 [0.0, 0.0] |
| 3.27 Mixed | 2 | 153 | Risk Ratio (M‐H, Random, 95% CI) | 0.32 [0.03, 2.99] |
| 4 All‐cause mortality ‐ based on adequacy of the amount of calories Show forest plot | 36 | 3722 | Risk Ratio (M‐H, Random, 95% CI) | 0.88 [0.75, 1.03] |
| 4.1 Clearly adequate in experimental group and clearly inadequate in control group | 7 | 736 | Risk Ratio (M‐H, Random, 95% CI) | 0.70 [0.40, 1.25] |
| 4.2 Inadequate in the experimental group or adequate in the control group | 7 | 410 | Risk Ratio (M‐H, Random, 95% CI) | 0.72 [0.28, 1.85] |
| 4.3 Experimental group is overfed | 2 | 74 | Risk Ratio (M‐H, Random, 95% CI) | 0.76 [0.15, 3.79] |
| 4.4 Unclear intake in experimental group or control group | 20 | 2502 | Risk Ratio (M‐H, Random, 95% CI) | 0.89 [0.73, 1.08] |
| 5 All‐cause mortality ‐ different screening tools Show forest plot | 36 | 3722 | Risk Ratio (M‐H, Random, 95% CI) | 0.88 [0.75, 1.03] |
| 5.1 NRS 2002 | 0 | 0 | Risk Ratio (M‐H, Random, 95% CI) | 0.0 [0.0, 0.0] |
| 5.2 MUST | 0 | 0 | Risk Ratio (M‐H, Random, 95% CI) | 0.0 [0.0, 0.0] |
| 5.3 MNA | 0 | 0 | Risk Ratio (M‐H, Random, 95% CI) | 0.0 [0.0, 0.0] |
| 5.4 SGA | 1 | 323 | Risk Ratio (M‐H, Random, 95% CI) | 0.75 [0.13, 4.44] |
| 5.5 Other means | 35 | 3399 | Risk Ratio (M‐H, Random, 95% CI) | 0.88 [0.75, 1.03] |
| 6 All‐cause mortality ‐ participants characterised as 'at nutritional risk' due to one of the following conditions Show forest plot | 36 | 3722 | Risk Ratio (M‐H, Random, 95% CI) | 0.88 [0.75, 1.03] |
| 6.1 Major surgery | 18 | 1746 | Risk Ratio (M‐H, Random, 95% CI) | 0.69 [0.45, 1.06] |
| 6.2 Stroke | 3 | 1027 | Risk Ratio (M‐H, Random, 95% CI) | 0.67 [0.33, 1.37] |
| 6.3 ICU participants including trauma | 5 | 293 | Risk Ratio (M‐H, Random, 95% CI) | 0.62 [0.32, 1.21] |
| 6.4 Frail elderly participants with less severe conditions known to increase protein requirements | 2 | 126 | Risk Ratio (M‐H, Random, 95% CI) | 1.59 [0.02, 125.73] |
| 6.5 Participants do not fall into one of the categories above | 8 | 530 | Risk Ratio (M‐H, Random, 95% CI) | 0.95 [0.58, 1.56] |
| 7 All‐cause mortality ‐ participants characterised as 'at nutritional risk' due to one of the following criteria Show forest plot | 36 | 3722 | Risk Ratio (M‐H, Random, 95% CI) | 0.88 [0.75, 1.03] |
| 7.1 BMI less than 20.5 kg/m2 | 0 | 0 | Risk Ratio (M‐H, Random, 95% CI) | 0.0 [0.0, 0.0] |
| 7.2 Weight loss of at least 5% during the last three months | 0 | 0 | Risk Ratio (M‐H, Random, 95% CI) | 0.0 [0.0, 0.0] |
| 7.3 Weight loss of at least 10% during the last six months | 1 | 32 | Risk Ratio (M‐H, Random, 95% CI) | 3.38 [0.15, 77.12] |
| 7.4 Insufficient food intake during the last week (50% of requirements or less) | 0 | 0 | Risk Ratio (M‐H, Random, 95% CI) | 0.0 [0.0, 0.0] |
| 7.5 Participants characterised as 'at nutritional risk' by other means | 35 | 3690 | Risk Ratio (M‐H, Random, 95% CI) | 0.88 [0.75, 1.02] |
| 8 All‐cause mortality ‐ participants characterised as 'at nutritional risk' due to biomarkers or anthropometrics Show forest plot | 36 | 3722 | Risk Ratio (M‐H, Random, 95% CI) | 0.88 [0.75, 1.03] |
| 8.1 Biomarkers | 1 | 520 | Risk Ratio (M‐H, Random, 95% CI) | 0.15 [0.01, 2.84] |
| 8.2 Anthropometric measures | 2 | 122 | Risk Ratio (M‐H, Random, 95% CI) | 0.71 [0.24, 2.08] |
| 8.3 Characterised by other means | 33 | 3080 | Risk Ratio (M‐H, Random, 95% CI) | 0.89 [0.76, 1.04] |
| 9 All‐cause mortality ‐ randomisation year Show forest plot | 36 | 3722 | Risk Ratio (M‐H, Random, 95% CI) | 0.88 [0.75, 1.03] |
| 9.1 Before 1960 | 0 | 0 | Risk Ratio (M‐H, Random, 95% CI) | 0.0 [0.0, 0.0] |
| 9.2 1960‐1979 | 1 | 26 | Risk Ratio (M‐H, Random, 95% CI) | 0.44 [0.02, 9.98] |
| 9.3 1980‐1999 | 23 | 2463 | Risk Ratio (M‐H, Random, 95% CI) | 0.93 [0.78, 1.11] |
| 9.4 After 1999 | 12 | 1233 | Risk Ratio (M‐H, Random, 95% CI) | 0.73 [0.52, 1.00] |
| 10 All‐cause mortality ‐ trials where the intervention lasts fewer than three days compared with trials where the intervention lasts three days or more Show forest plot | 36 | 3722 | Risk Ratio (M‐H, Random, 95% CI) | 0.88 [0.75, 1.03] |
| 10.1 Three days or more | 30 | 3287 | Risk Ratio (M‐H, Random, 95% CI) | 0.88 [0.75, 1.03] |
| 10.2 Less than three days | 6 | 435 | Risk Ratio (M‐H, Random, 95% CI) | 0.68 [0.28, 1.65] |
| 10.3 Unknown | 0 | 0 | Risk Ratio (M‐H, Random, 95% CI) | 0.0 [0.0, 0.0] |
| 11 All‐cause mortality ‐ 'best‐worst case' scenario Show forest plot | 36 | 3759 | Risk Ratio (M‐H, Random, 95% CI) | 0.84 [0.72, 0.98] |
| 12 All‐cause mortality ‐ 'worst‐best case' scenario Show forest plot | 36 | 3759 | Risk Ratio (M‐H, Fixed, 95% CI) | 0.92 [0.79, 1.06] |
| 13 All‐cause mortality co‐interventions Show forest plot | 36 | 3722 | Risk Ratio (M‐H, Random, 95% CI) | 0.88 [0.75, 1.03] |
| 13.1 received nutrition support as co‐intervention | 3 | 126 | Risk Ratio (M‐H, Random, 95% CI) | 0.60 [0.28, 1.28] |
| 13.2 did not receive nutrition support as co‐intervention | 27 | 3253 | Risk Ratio (M‐H, Random, 95% CI) | 0.79 [0.62, 1.02] |
| 13.3 delayed versus early nutrition support | 6 | 343 | Risk Ratio (M‐H, Random, 95% CI) | 1.06 [0.57, 1.97] |
| Outcome or subgroup title | No. of studies | No. of participants | Statistical method | Effect size |
| 1 All‐cause mortality ‐ overall Show forest plot | 42 | 4212 | Risk Ratio (M‐H, Random, 95% CI) | 0.84 [0.75, 0.95] |
| 2 All‐cause mortality ‐ bias Show forest plot | 42 | 4212 | Risk Ratio (M‐H, Random, 95% CI) | 0.84 [0.75, 0.95] |
| 2.1 High risk of bias | 42 | 4212 | Risk Ratio (M‐H, Random, 95% CI) | 0.84 [0.75, 0.95] |
| 2.2 Low risk of bias | 0 | 0 | Risk Ratio (M‐H, Random, 95% CI) | 0.0 [0.0, 0.0] |
| 3 All‐cause mortality ‐ medical speciality Show forest plot | 42 | 4212 | Risk Ratio (M‐H, Random, 95% CI) | 0.84 [0.75, 0.95] |
| 3.1 Cardiology | 0 | 0 | Risk Ratio (M‐H, Random, 95% CI) | 0.0 [0.0, 0.0] |
| 3.2 Medical gastroenterology and hepatology | 4 | 289 | Risk Ratio (M‐H, Random, 95% CI) | 0.88 [0.63, 1.21] |
| 3.3 Geriatrics | 0 | 0 | Risk Ratio (M‐H, Random, 95% CI) | 0.0 [0.0, 0.0] |
| 3.4 Pulmonary disease | 0 | 0 | Risk Ratio (M‐H, Random, 95% CI) | 0.0 [0.0, 0.0] |
| 3.5 Endocrinology | 0 | 0 | Risk Ratio (M‐H, Random, 95% CI) | 0.0 [0.0, 0.0] |
| 3.6 Infectious diseases | 1 | 56 | Risk Ratio (M‐H, Random, 95% CI) | 1.61 [0.66, 3.92] |
| 3.7 Rheumatology | 0 | 0 | Risk Ratio (M‐H, Random, 95% CI) | 0.0 [0.0, 0.0] |
| 3.8 Haematology | 0 | 0 | Risk Ratio (M‐H, Random, 95% CI) | 0.0 [0.0, 0.0] |
| 3.9 Nephrology | 0 | 0 | Risk Ratio (M‐H, Random, 95% CI) | 0.0 [0.0, 0.0] |
| 3.10 Gastroenterologic surgery | 15 | 1284 | Risk Ratio (M‐H, Random, 95% CI) | 0.75 [0.48, 1.16] |
| 3.11 Trauma surgery | 4 | 204 | Risk Ratio (M‐H, Random, 95% CI) | 0.58 [0.30, 1.11] |
| 3.12 Ortopaedics | 4 | 248 | Risk Ratio (M‐H, Random, 95% CI) | 0.82 [0.18, 3.75] |
| 3.13 Plastic, reconstructive, and aesthetic surgery | 0 | 0 | Risk Ratio (M‐H, Random, 95% CI) | 0.0 [0.0, 0.0] |
| 3.14 Vascular surgery | 1 | 13 | Risk Ratio (M‐H, Random, 95% CI) | 0.0 [0.0, 0.0] |
| 3.15 Transplant surgery | 0 | 0 | Risk Ratio (M‐H, Random, 95% CI) | 0.0 [0.0, 0.0] |
| 3.16 Urology | 0 | 0 | Risk Ratio (M‐H, Random, 95% CI) | 0.0 [0.0, 0.0] |
| 3.17 Thoracic surgery | 2 | 548 | Risk Ratio (M‐H, Random, 95% CI) | 0.22 [0.03, 1.86] |
| 3.18 Neurological surgery | 0 | 0 | Risk Ratio (M‐H, Random, 95% CI) | 0.0 [0.0, 0.0] |
| 3.19 Oro‐maxillo‐facial surgery | 1 | 32 | Risk Ratio (M‐H, Random, 95% CI) | 3.38 [0.15, 77.12] |
| 3.20 Anaesthesiology | 0 | 0 | Risk Ratio (M‐H, Random, 95% CI) | 0.0 [0.0, 0.0] |
| 3.21 Emergency medicine | 4 | 213 | Risk Ratio (M‐H, Random, 95% CI) | 1.07 [0.61, 1.89] |
| 3.22 Psychiatry | 0 | 0 | Risk Ratio (M‐H, Random, 95% CI) | 0.0 [0.0, 0.0] |
| 3.23 Neurology | 4 | 1172 | Risk Ratio (M‐H, Random, 95% CI) | 0.57 [0.31, 1.05] |
| 3.24 Oncology | 0 | 0 | Risk Ratio (M‐H, Random, 95% CI) | 0.0 [0.0, 0.0] |
| 3.25 Dermatology | 0 | 0 | Risk Ratio (M‐H, Random, 95% CI) | 0.0 [0.0, 0.0] |
| 3.26 Gynaecology | 0 | 0 | Risk Ratio (M‐H, Random, 95% CI) | 0.0 [0.0, 0.0] |
| 3.27 Mixed | 2 | 153 | Risk Ratio (M‐H, Random, 95% CI) | 0.63 [0.18, 2.21] |
| 4 All‐cause mortality ‐ based on adequacy of the amount of calories Show forest plot | 42 | 4212 | Risk Ratio (M‐H, Random, 95% CI) | 0.84 [0.75, 0.95] |
| 4.1 Clearly adequate in intervention and clearly inadequate in control | 10 | 954 | Risk Ratio (M‐H, Random, 95% CI) | 0.75 [0.46, 1.23] |
| 4.2 Inadequate in the experimental or adequate in the control | 7 | 410 | Risk Ratio (M‐H, Random, 95% CI) | 0.72 [0.28, 1.85] |
| 4.3 Experimental group is overfed | 3 | 174 | Risk Ratio (M‐H, Random, 95% CI) | 1.01 [0.49, 2.08] |
| 4.4 Unclear intake in control or experimental | 22 | 2674 | Risk Ratio (M‐H, Random, 95% CI) | 0.82 [0.67, 0.99] |
| 5 All‐cause mortality ‐ different screening tools Show forest plot | 42 | 4212 | Risk Ratio (M‐H, Random, 95% CI) | 0.84 [0.75, 0.95] |
| 5.1 NRS 2002 | 0 | 0 | Risk Ratio (M‐H, Random, 95% CI) | 0.0 [0.0, 0.0] |
| 5.2 MUST | 0 | 0 | Risk Ratio (M‐H, Random, 95% CI) | 0.0 [0.0, 0.0] |
| 5.3 MNA | 0 | 0 | Risk Ratio (M‐H, Random, 95% CI) | 0.0 [0.0, 0.0] |
| 5.4 SGA | 1 | 323 | Risk Ratio (M‐H, Random, 95% CI) | 0.75 [0.13, 4.44] |
| 5.5 Other means | 41 | 3889 | Risk Ratio (M‐H, Random, 95% CI) | 0.84 [0.75, 0.95] |
| 6 All‐cause mortality ‐ participants characterised as 'at nutritional risk' due to one of the following conditions Show forest plot | 42 | 4212 | Risk Ratio (M‐H, Random, 95% CI) | 0.84 [0.75, 0.95] |
| 6.1 Major surgery | 20 | 1967 | Risk Ratio (M‐H, Random, 95% CI) | 0.71 [0.48, 1.06] |
| 6.2 Stroke | 4 | 1172 | Risk Ratio (M‐H, Random, 95% CI) | 0.57 [0.31, 1.05] |
| 6.3 ICU participants including trauma | 8 | 417 | Risk Ratio (M‐H, Random, 95% CI) | 0.82 [0.54, 1.26] |
| 6.4 Frail elderly participants with less severe conditions known to increase protein requirements | 2 | 126 | Risk Ratio (M‐H, Random, 95% CI) | 1.25 [0.01, 150.42] |
| 6.5 Participants do not fall into one of the categories above | 8 | 530 | Risk Ratio (M‐H, Random, 95% CI) | 0.93 [0.69, 1.25] |
| 7 All‐cause mortality ‐ participants characterised as 'at nutritional risk' due to one of the following criteria Show forest plot | 42 | 4212 | Risk Ratio (M‐H, Random, 95% CI) | 0.84 [0.75, 0.95] |
| 7.1 BMI less than 20.5 kg/m2 | 0 | 0 | Risk Ratio (M‐H, Random, 95% CI) | 0.0 [0.0, 0.0] |
| 7.2 Weight loss of at least 5% during the last three months | 0 | 0 | Risk Ratio (M‐H, Random, 95% CI) | 0.0 [0.0, 0.0] |
| 7.3 Weight loss of at least 10% during the last six months | 1 | 32 | Risk Ratio (M‐H, Random, 95% CI) | 3.38 [0.15, 77.12] |
| 7.4 Insufficient food intake during the last week (50% of requirements or less) | 0 | 0 | Risk Ratio (M‐H, Random, 95% CI) | 0.0 [0.0, 0.0] |
| 7.5 Participants characterised as 'at nutritional risk' by other means | 41 | 4180 | Risk Ratio (M‐H, Random, 95% CI) | 0.84 [0.75, 0.95] |
| 8 All‐cause mortality ‐ participants characterised as 'at nutritional risk' due to biomarkers or anthropometrics Show forest plot | 42 | 4212 | Risk Ratio (M‐H, Random, 95% CI) | 0.84 [0.75, 0.95] |
| 8.1 Biomarkers | 1 | 520 | Risk Ratio (M‐H, Random, 95% CI) | 0.15 [0.01, 2.84] |
| 8.2 Anthropometric measures | 2 | 122 | Risk Ratio (M‐H, Random, 95% CI) | 0.71 [0.24, 2.08] |
| 8.3 Both anthropometrics and biomarkers | 0 | 0 | Risk Ratio (M‐H, Random, 95% CI) | 0.0 [0.0, 0.0] |
| 8.4 Characterised by other means | 39 | 3570 | Risk Ratio (M‐H, Random, 95% CI) | 0.85 [0.75, 0.96] |
| 9 All‐cause mortality ‐ randomisation year Show forest plot | 42 | 4212 | Risk Ratio (M‐H, Random, 95% CI) | 0.84 [0.75, 0.95] |
| 9.1 Before 1960 | 0 | 0 | Risk Ratio (M‐H, Random, 95% CI) | 0.0 [0.0, 0.0] |
| 9.2 1960 to 1979 | 1 | 26 | Risk Ratio (M‐H, Random, 95% CI) | 0.44 [0.02, 9.98] |
| 9.3 1980 to 1999 | 24 | 2500 | Risk Ratio (M‐H, Random, 95% CI) | 0.87 [0.69, 1.08] |
| 9.4 After 1999 | 17 | 1686 | Risk Ratio (M‐H, Random, 95% CI) | 0.76 [0.60, 0.96] |
| 10 All‐cause mortality ‐ trials where the intervention lasts fewer than three days compared with trials where the intervention lasts three days or more Show forest plot | 42 | 4212 | Risk Ratio (M‐H, Random, 95% CI) | 0.84 [0.75, 0.95] |
| 10.1 Three days or more | 34 | 3680 | Risk Ratio (M‐H, Random, 95% CI) | 0.82 [0.71, 0.94] |
| 10.2 Less than three days | 8 | 532 | Risk Ratio (M‐H, Random, 95% CI) | 1.03 [0.66, 1.63] |
| 10.3 Unknown | 0 | 0 | Risk Ratio (M‐H, Random, 95% CI) | 0.0 [0.0, 0.0] |
| 11 All‐cause mortality ‐ 'best‐worst case' scenario Show forest plot | 42 | 4269 | Risk Ratio (M‐H, Random, 95% CI) | 0.75 [0.63, 0.89] |
| 12 All‐cause mortality ‐ 'worst‐best case' scenario Show forest plot | 42 | 4269 | Risk Ratio (M‐H, Random, 95% CI) | 0.84 [0.68, 1.03] |
| 13 All‐cause mortality co‐interventions Show forest plot | 42 | 4212 | Risk Ratio (M‐H, Fixed, 95% CI) | 0.82 [0.73, 0.92] |
| 13.1 received nutrition support as co‐intervention | 5 | 262 | Risk Ratio (M‐H, Fixed, 95% CI) | 1.03 [0.66, 1.60] |
| 13.2 did not receive nutrition support as co‐intervention | 35 | 3797 | Risk Ratio (M‐H, Fixed, 95% CI) | 0.81 [0.71, 0.91] |
| 13.3 delayed versus early nutrition support | 2 | 153 | Risk Ratio (M‐H, Fixed, 95% CI) | 0.61 [0.17, 2.12] |
| Outcome or subgroup title | No. of studies | No. of participants | Statistical method | Effect size |
| 1 Serious adverse events ‐ overall Show forest plot | 43 | 3935 | Risk Ratio (M‐H, Random, 95% CI) | 0.85 [0.74, 0.98] |
| 2 Serious adverse events ‐ bias Show forest plot | 43 | 3935 | Risk Ratio (M‐H, Random, 95% CI) | 0.85 [0.74, 0.98] |
| 2.1 High risk of bias | 43 | 3935 | Risk Ratio (M‐H, Random, 95% CI) | 0.85 [0.74, 0.98] |
| 2.2 Low risk of bias | 0 | 0 | Risk Ratio (M‐H, Random, 95% CI) | 0.0 [0.0, 0.0] |
| 3 Serious adverse events ‐ by medical specialty Show forest plot | 43 | 3935 | Risk Ratio (M‐H, Random, 95% CI) | 0.85 [0.74, 0.98] |
| 3.1 Cardiology | 0 | 0 | Risk Ratio (M‐H, Random, 95% CI) | 0.0 [0.0, 0.0] |
| 3.2 Medical gastroenterology and hepatology | 4 | 289 | Risk Ratio (M‐H, Random, 95% CI) | 0.79 [0.32, 1.96] |
| 3.3 High risk | 0 | 0 | Risk Ratio (M‐H, Random, 95% CI) | 0.0 [0.0, 0.0] |
| 3.4 Geriatrics | 0 | 0 | Risk Ratio (M‐H, Random, 95% CI) | 0.0 [0.0, 0.0] |
| 3.5 Pulmonary disease | 0 | 0 | Risk Ratio (M‐H, Random, 95% CI) | 0.0 [0.0, 0.0] |
| 3.6 Endocrinology | 0 | 0 | Risk Ratio (M‐H, Random, 95% CI) | 0.0 [0.0, 0.0] |
| 3.7 Infectious diseases | 1 | 56 | Risk Ratio (M‐H, Random, 95% CI) | 1.23 [0.52, 2.93] |
| 3.8 Rheumatology | 0 | 0 | Risk Ratio (M‐H, Random, 95% CI) | 0.0 [0.0, 0.0] |
| 3.9 Haematology | 0 | 0 | Risk Ratio (M‐H, Random, 95% CI) | 0.0 [0.0, 0.0] |
| 3.10 Nephrology | 0 | 0 | Risk Ratio (M‐H, Random, 95% CI) | 0.0 [0.0, 0.0] |
| 3.11 Gastroenterologic surgery | 19 | 1235 | Risk Ratio (M‐H, Random, 95% CI) | 0.75 [0.54, 1.03] |
| 3.12 Trauma surgery | 3 | 180 | Risk Ratio (M‐H, Random, 95% CI) | 0.50 [0.20, 1.28] |
| 3.13 Ortopaedics | 4 | 248 | Risk Ratio (M‐H, Random, 95% CI) | 1.05 [0.34, 3.26] |
| 3.14 Plastic, reconstructive, and aesthetic surgery | 0 | 0 | Risk Ratio (M‐H, Random, 95% CI) | 0.0 [0.0, 0.0] |
| 3.15 Vascular surgery | 1 | 13 | Risk Ratio (M‐H, Random, 95% CI) | 0.0 [0.0, 0.0] |
| 3.16 Transplant surgery | 0 | 0 | Risk Ratio (M‐H, Random, 95% CI) | 0.0 [0.0, 0.0] |
| 3.17 Urology | 0 | 0 | Risk Ratio (M‐H, Random, 95% CI) | 0.0 [0.0, 0.0] |
| 3.18 Thoracic surgery | 2 | 548 | Risk Ratio (M‐H, Random, 95% CI) | 0.15 [0.02, 1.27] |
| 3.19 Neurological surgery | 0 | 0 | Risk Ratio (M‐H, Random, 95% CI) | 0.0 [0.0, 0.0] |
| 3.20 Oro‐maxillo‐facial surgery | 1 | 32 | Risk Ratio (M‐H, Random, 95% CI) | 0.88 [0.44, 1.78] |
| 3.21 Anaesthesiology | 0 | 0 | Risk Ratio (M‐H, Random, 95% CI) | 0.0 [0.0, 0.0] |
| 3.22 Emergency medicine | 3 | 154 | Risk Ratio (M‐H, Random, 95% CI) | 0.77 [0.31, 1.94] |
| 3.23 Psychiatry | 0 | 0 | Risk Ratio (M‐H, Random, 95% CI) | 0.0 [0.0, 0.0] |
| 3.24 Neurology | 3 | 1027 | Risk Ratio (M‐H, Random, 95% CI) | 0.67 [0.37, 1.24] |
| 3.25 Oncology | 0 | 0 | Risk Ratio (M‐H, Random, 95% CI) | 0.0 [0.0, 0.0] |
| 3.26 Dermatology | 0 | 0 | Risk Ratio (M‐H, Random, 95% CI) | 0.0 [0.0, 0.0] |
| 3.27 Gynaecology | 0 | 0 | Risk Ratio (M‐H, Random, 95% CI) | 0.0 [0.0, 0.0] |
| 3.28 Mixed | 2 | 153 | Risk Ratio (M‐H, Random, 95% CI) | 0.32 [0.03, 2.99] |
| 4 Serious adverse events ‐ based on adequacy of the amount of calories Show forest plot | 43 | 3935 | Risk Ratio (M‐H, Random, 95% CI) | 0.85 [0.74, 0.98] |
| 4.1 Clearly adequate in intervention and clearly inadequate in control | 9 | 769 | Risk Ratio (M‐H, Random, 95% CI) | 0.77 [0.54, 1.10] |
| 4.2 Inadequate in the experimental or adequate in the control | 8 | 411 | Risk Ratio (M‐H, Random, 95% CI) | 0.86 [0.55, 1.35] |
| 4.3 Experimental group is overfed | 3 | 115 | Risk Ratio (M‐H, Random, 95% CI) | 0.64 [0.13, 3.12] |
| 4.4 Unclear intake in control or experimental | 23 | 2640 | Risk Ratio (M‐H, Random, 95% CI) | 0.73 [0.55, 0.98] |
| 5 Serious adverse events ‐ different screening tools Show forest plot | 43 | 3935 | Risk Ratio (M‐H, Random, 95% CI) | 0.85 [0.74, 0.98] |
| 5.1 NRS 2002 | 0 | 0 | Risk Ratio (M‐H, Random, 95% CI) | 0.0 [0.0, 0.0] |
| 5.2 MUST | 0 | 0 | Risk Ratio (M‐H, Random, 95% CI) | 0.0 [0.0, 0.0] |
| 5.3 MNA | 0 | 0 | Risk Ratio (M‐H, Random, 95% CI) | 0.0 [0.0, 0.0] |
| 5.4 SGA | 1 | 323 | Risk Ratio (M‐H, Random, 95% CI) | 0.38 [0.13, 1.06] |
| 5.5 Other means | 42 | 3612 | Risk Ratio (M‐H, Random, 95% CI) | 0.87 [0.75, 1.00] |
| 6 Serious adverse events ‐ participants characterised as 'at nutritional risk' due to one of the following conditions Show forest plot | 43 | 3935 | Risk Ratio (M‐H, Random, 95% CI) | 0.85 [0.74, 0.98] |
| 6.1 Major surgery | 24 | 1918 | Risk Ratio (M‐H, Random, 95% CI) | 0.72 [0.53, 0.97] |
| 6.2 Stroke | 3 | 1027 | Risk Ratio (M‐H, Random, 95% CI) | 0.67 [0.37, 1.24] |
| 6.3 ICU participants including trauma | 6 | 334 | Risk Ratio (M‐H, Random, 95% CI) | 0.62 [0.32, 1.21] |
| 6.4 Frail elderly participants with less severe conditions known to increase protein requirements | 2 | 126 | Risk Ratio (M‐H, Random, 95% CI) | 2.84 [0.12, 66.14] |
| 6.5 Participants do not fall into one of the categories above | 8 | 530 | Risk Ratio (M‐H, Random, 95% CI) | 0.87 [0.58, 1.30] |
| 7 Serious adverse events ‐ participants characterised as 'at nutritional risk' due to one of the following criteria Show forest plot | 43 | 3935 | Risk Ratio (M‐H, Random, 95% CI) | 0.85 [0.74, 0.98] |
| 7.1 BMI less than 20.5 kg/m2 | 0 | 0 | Risk Ratio (M‐H, Random, 95% CI) | 0.0 [0.0, 0.0] |
| 7.2 Weight loss of at least 5% during the last three months | 0 | 0 | Risk Ratio (M‐H, Random, 95% CI) | 0.0 [0.0, 0.0] |
| 7.3 Weight loss of at least 10% during the last six months | 1 | 32 | Risk Ratio (M‐H, Random, 95% CI) | 0.88 [0.44, 1.78] |
| 7.4 Insufficient food intake during the last week (50% of requirements or less) | 0 | 0 | Risk Ratio (M‐H, Random, 95% CI) | 0.0 [0.0, 0.0] |
| 7.5 Participants characterised as 'at nutritional risk' by other means | 42 | 3903 | Risk Ratio (M‐H, Random, 95% CI) | 0.85 [0.74, 0.98] |
| 8 Serious adverse events ‐ participants characterised as 'at nutritional risk' due to biomarkers or anthropometrics Show forest plot | 43 | 3935 | Risk Ratio (M‐H, Random, 95% CI) | 0.85 [0.74, 0.98] |
| 8.1 Biomarkers | 3 | 551 | Risk Ratio (M‐H, Random, 95% CI) | 0.16 [0.02, 1.26] |
| 8.2 Anthropometric measures | 2 | 122 | Risk Ratio (M‐H, Random, 95% CI) | 0.71 [0.24, 2.08] |
| 8.3 Mixed | 0 | 0 | Risk Ratio (M‐H, Random, 95% CI) | 0.0 [0.0, 0.0] |
| 8.4 Characterised by other means | 38 | 3262 | Risk Ratio (M‐H, Random, 95% CI) | 0.86 [0.75, 1.00] |
| 9 Serious adverse events ‐ randomisation year Show forest plot | 43 | 3935 | Risk Ratio (M‐H, Random, 95% CI) | 0.85 [0.74, 0.98] |
| 9.1 Before 1960 | 0 | 0 | Risk Ratio (M‐H, Random, 95% CI) | 0.0 [0.0, 0.0] |
| 9.2 1960 to 1979 | 1 | 26 | Risk Ratio (M‐H, Random, 95% CI) | 1.36 [0.10, 19.50] |
| 9.3 1980 to 1999 | 28 | 2749 | Risk Ratio (M‐H, Random, 95% CI) | 0.92 [0.79, 1.08] |
| 9.4 After 1999 | 14 | 1160 | Risk Ratio (M‐H, Random, 95% CI) | 0.60 [0.43, 0.83] |
| 10 Serious adverse events ‐ trials where the intervention lasts fewer than three days compared with trials where the intervention lasts three days or more Show forest plot | 43 | 3935 | Risk Ratio (M‐H, Random, 95% CI) | 0.85 [0.74, 0.98] |
| 10.1 Three days or more | 37 | 3500 | Risk Ratio (M‐H, Random, 95% CI) | 0.86 [0.75, 1.00] |
| 10.2 Less than three days | 6 | 435 | Risk Ratio (M‐H, Random, 95% CI) | 0.71 [0.39, 1.27] |
| 10.3 Unknown | 0 | 0 | Risk Ratio (M‐H, Random, 95% CI) | 0.0 [0.0, 0.0] |
| 11 Serious adverse events ‐ 'best‐worst case' scenario Show forest plot | 43 | 3977 | Risk Ratio (M‐H, Random, 95% CI) | 0.82 [0.72, 0.94] |
| 12 Serious adverse events ‐ 'worst‐best case' scenario Show forest plot | 43 | 3977 | Risk Ratio (M‐H, Random, 95% CI) | 0.83 [0.70, 0.99] |
| 13 Serious adverse events co‐interventions Show forest plot | 43 | 3935 | Risk Ratio (M‐H, Fixed, 95% CI) | 0.83 [0.72, 0.95] |
| 13.1 received nutrition support as co‐intervention | 3 | 126 | Risk Ratio (M‐H, Fixed, 95% CI) | 0.66 [0.39, 1.12] |
| 13.2 did not receive nutrition support as co‐intervention | 34 | 3466 | Risk Ratio (M‐H, Fixed, 95% CI) | 0.83 [0.72, 0.96] |
| 13.3 delayed versus early nutrition support | 6 | 343 | Risk Ratio (M‐H, Fixed, 95% CI) | 0.93 [0.51, 1.69] |
| Outcome or subgroup title | No. of studies | No. of participants | Statistical method | Effect size |
| 1 Serious adverse events ‐ overall Show forest plot | 49 | 4425 | Risk Ratio (M‐H, Random, 95% CI) | 0.82 [0.73, 0.91] |
| 2 Serious adverse events ‐ bias Show forest plot | 49 | 4425 | Risk Ratio (M‐H, Random, 95% CI) | 0.82 [0.73, 0.91] |
| 2.1 High risk of bias | 49 | 4425 | Risk Ratio (M‐H, Random, 95% CI) | 0.82 [0.73, 0.91] |
| 2.2 Low risk of bias | 0 | 0 | Risk Ratio (M‐H, Random, 95% CI) | 0.0 [0.0, 0.0] |
| 3 Serious adverse events ‐ by medical speciality Show forest plot | 49 | 4425 | Risk Ratio (M‐H, Random, 95% CI) | 0.82 [0.73, 0.91] |
| 3.1 Cardiology | 0 | 0 | Risk Ratio (M‐H, Random, 95% CI) | 0.0 [0.0, 0.0] |
| 3.2 Medical gastroenterology and hepatology | 4 | 289 | Risk Ratio (M‐H, Random, 95% CI) | 0.89 [0.65, 1.23] |
| 3.3 Geriatrics | 0 | 0 | Risk Ratio (M‐H, Random, 95% CI) | 0.0 [0.0, 0.0] |
| 3.4 Pulmonary disease | 0 | 0 | Risk Ratio (M‐H, Random, 95% CI) | 0.0 [0.0, 0.0] |
| 3.5 Endocrinology | 0 | 0 | Risk Ratio (M‐H, Random, 95% CI) | 0.0 [0.0, 0.0] |
| 3.6 Infectious diseases | 1 | 56 | Risk Ratio (M‐H, Random, 95% CI) | 1.23 [0.52, 2.93] |
| 3.7 Rheumatology | 0 | 0 | Risk Ratio (M‐H, Random, 95% CI) | 0.0 [0.0, 0.0] |
| 3.8 Haematology | 0 | 0 | Risk Ratio (M‐H, Random, 95% CI) | 0.0 [0.0, 0.0] |
| 3.9 Nephrology | 0 | 0 | Risk Ratio (M‐H, Random, 95% CI) | 0.0 [0.0, 0.0] |
| 3.10 Gastroenterologic surgery | 21 | 1456 | Risk Ratio (M‐H, Random, 95% CI) | 0.68 [0.51, 0.91] |
| 3.11 Trauma surgery | 5 | 245 | Risk Ratio (M‐H, Random, 95% CI) | 0.58 [0.30, 1.11] |
| 3.12 Ortopaedics | 4 | 248 | Risk Ratio (M‐H, Random, 95% CI) | 0.91 [0.28, 2.96] |
| 3.13 Plastic, reconstructive, and aesthetic surgery | 0 | 0 | Risk Ratio (M‐H, Random, 95% CI) | 0.0 [0.0, 0.0] |
| 3.14 Vascular surgery | 1 | 13 | Risk Ratio (M‐H, Random, 95% CI) | 0.0 [0.0, 0.0] |
| 3.15 Transplant surgery | 0 | 0 | Risk Ratio (M‐H, Random, 95% CI) | 0.0 [0.0, 0.0] |
| 3.16 Urology | 0 | 0 | Risk Ratio (M‐H, Random, 95% CI) | 0.0 [0.0, 0.0] |
| 3.17 Thoracic surgery | 2 | 548 | Risk Ratio (M‐H, Random, 95% CI) | 0.15 [0.02, 1.27] |
| 3.18 Neurological surgery | 0 | 0 | Risk Ratio (M‐H, Random, 95% CI) | 0.0 [0.0, 0.0] |
| 3.19 Oro‐maxillo‐facial surgery | 1 | 32 | Risk Ratio (M‐H, Random, 95% CI) | 0.88 [0.44, 1.78] |
| 3.20 Anaesthesiology | 0 | 0 | Risk Ratio (M‐H, Random, 95% CI) | 0.0 [0.0, 0.0] |
| 3.21 Emergency medicine | 4 | 213 | Risk Ratio (M‐H, Random, 95% CI) | 0.92 [0.60, 1.40] |
| 3.22 Psychiatry | 0 | 0 | Risk Ratio (M‐H, Random, 95% CI) | 0.0 [0.0, 0.0] |
| 3.23 Neurology | 4 | 1172 | Risk Ratio (M‐H, Random, 95% CI) | 0.58 [0.34, 1.00] |
| 3.24 Oncology | 0 | 0 | Risk Ratio (M‐H, Random, 95% CI) | 0.0 [0.0, 0.0] |
| 3.25 Dermatology | 0 | 0 | Risk Ratio (M‐H, Random, 95% CI) | 0.0 [0.0, 0.0] |
| 3.26 Gynaecology | 0 | 0 | Risk Ratio (M‐H, Random, 95% CI) | 0.0 [0.0, 0.0] |
| 3.27 Mixed | 2 | 153 | Risk Ratio (M‐H, Random, 95% CI) | 0.63 [0.18, 2.21] |
| 4 Serious adverse events ‐ based on adequacy of the amount of calories Show forest plot | 49 | 4425 | Risk Ratio (M‐H, Random, 95% CI) | 0.82 [0.73, 0.91] |
| 4.1 Clearly adequate in intervention and clearly inadequate in control | 12 | 987 | Risk Ratio (M‐H, Random, 95% CI) | 0.72 [0.54, 0.96] |
| 4.2 Inadequate in the experimental or adequate in the control | 8 | 411 | Risk Ratio (M‐H, Random, 95% CI) | 0.86 [0.55, 1.35] |
| 4.3 Experimental group is overfed | 4 | 215 | Risk Ratio (M‐H, Random, 95% CI) | 0.77 [0.42, 1.42] |
| 4.4 Unclear intake in control or experimental | 25 | 2812 | Risk Ratio (M‐H, Random, 95% CI) | 0.75 [0.60, 0.94] |
| 5 Serious adverse events ‐ different screening tools Show forest plot | 49 | 4425 | Risk Ratio (M‐H, Random, 95% CI) | 0.82 [0.73, 0.91] |
| 5.1 NRS 2002 | 0 | 0 | Risk Ratio (M‐H, Random, 95% CI) | 0.0 [0.0, 0.0] |
| 5.2 MUST | 0 | 0 | Risk Ratio (M‐H, Random, 95% CI) | 0.0 [0.0, 0.0] |
| 5.3 MNA | 0 | 0 | Risk Ratio (M‐H, Random, 95% CI) | 0.0 [0.0, 0.0] |
| 5.4 SGA | 1 | 323 | Risk Ratio (M‐H, Random, 95% CI) | 0.38 [0.13, 1.06] |
| 5.5 Other means | 48 | 4102 | Risk Ratio (M‐H, Random, 95% CI) | 0.82 [0.74, 0.92] |
| 6 Serious adverse events ‐ participants characterised as 'at nutritional risk' due to one of the following conditions Show forest plot | 49 | 4425 | Risk Ratio (M‐H, Random, 95% CI) | 0.82 [0.73, 0.91] |
| 6.1 Major surgery | 26 | 2139 | Risk Ratio (M‐H, Random, 95% CI) | 0.67 [0.51, 0.88] |
| 6.2 Stroke | 4 | 1172 | Risk Ratio (M‐H, Random, 95% CI) | 0.58 [0.34, 1.00] |
| 6.3 ICU participants including trauma | 9 | 458 | Risk Ratio (M‐H, Random, 95% CI) | 0.80 [0.56, 1.14] |
| 6.4 Frail elderly participants with less severe conditions known to increase protein requirements | 2 | 126 | Risk Ratio (M‐H, Random, 95% CI) | 2.24 [0.05, 95.92] |
| 6.5 Participants do not fall into one of the categories above | 8 | 530 | Risk Ratio (M‐H, Random, 95% CI) | 0.90 [0.69, 1.19] |
| 7 Serious adverse events ‐ participants characterised as 'at nutritional risk' due to one of the following criteria Show forest plot | 49 | 4425 | Risk Ratio (M‐H, Random, 95% CI) | 0.82 [0.73, 0.91] |
| 7.1 BMI less than 20.5 kg/m2 | 0 | 0 | Risk Ratio (M‐H, Random, 95% CI) | 0.0 [0.0, 0.0] |
| 7.2 Weight loss of at least 5% during the last three months | 0 | 0 | Risk Ratio (M‐H, Random, 95% CI) | 0.0 [0.0, 0.0] |
| 7.3 Weight loss of at least 10% during the last six months | 1 | 32 | Risk Ratio (M‐H, Random, 95% CI) | 0.88 [0.44, 1.78] |
| 7.4 Insufficient food intake during the last week (50% of requirements or less) | 0 | 0 | Risk Ratio (M‐H, Random, 95% CI) | 0.0 [0.0, 0.0] |
| 7.5 Participants characterised as 'at nutritional risk' by other means | 48 | 4393 | Risk Ratio (M‐H, Random, 95% CI) | 0.81 [0.72, 0.91] |
| 8 Serious adverse events ‐ participants characterised as 'at nutritional risk' due to biomarkers or anthropometrics Show forest plot | 49 | 4425 | Risk Ratio (M‐H, Random, 95% CI) | 0.82 [0.73, 0.91] |
| 8.1 Biomarkers | 3 | 551 | Risk Ratio (M‐H, Random, 95% CI) | 0.16 [0.02, 1.26] |
| 8.2 Anthropometric measures | 2 | 122 | Risk Ratio (M‐H, Random, 95% CI) | 0.71 [0.24, 2.08] |
| 8.3 Both | 0 | 0 | Risk Ratio (M‐H, Random, 95% CI) | 0.0 [0.0, 0.0] |
| 8.4 Characterised by other means | 44 | 3752 | Risk Ratio (M‐H, Random, 95% CI) | 0.82 [0.74, 0.92] |
| 9 Serious adverse events ‐ randomisation year Show forest plot | 49 | 4425 | Risk Ratio (M‐H, Random, 95% CI) | 0.82 [0.73, 0.91] |
| 9.1 Before 1960 | 0 | 0 | Risk Ratio (M‐H, Random, 95% CI) | 0.0 [0.0, 0.0] |
| 9.2 1960 to 1979 | 1 | 26 | Risk Ratio (M‐H, Random, 95% CI) | 1.36 [0.10, 19.50] |
| 9.3 1980 to 1999 | 28 | 2591 | Risk Ratio (M‐H, Random, 95% CI) | 0.88 [0.77, 1.00] |
| 9.4 After 1999 | 20 | 1808 | Risk Ratio (M‐H, Random, 95% CI) | 0.70 [0.58, 0.85] |
| 10 Serious adverse events ‐ trials where the intervention lasts fewer than three days compared with trials where the intervention lasts three days or more Show forest plot | 49 | 4425 | Risk Ratio (M‐H, Random, 95% CI) | 0.82 [0.73, 0.91] |
| 10.1 Three days or more | 41 | 3893 | Risk Ratio (M‐H, Random, 95% CI) | 0.77 [0.66, 0.89] |
| 10.2 Less than three days | 8 | 532 | Risk Ratio (M‐H, Random, 95% CI) | 0.86 [0.60, 1.22] |
| 10.3 Unknown | 0 | 0 | Risk Ratio (M‐H, Random, 95% CI) | 0.0 [0.0, 0.0] |
| 11 Serious adverse events co‐interventions Show forest plot | 49 | 4425 | Risk Ratio (M‐H, Fixed, 95% CI) | 0.78 [0.70, 0.87] |
| 11.1 Received nutrition support as co‐intervention | 3 | 126 | Risk Ratio (M‐H, Fixed, 95% CI) | 0.66 [0.39, 1.12] |
| 11.2 did not receive nutrition support as co‐intervention | 39 | 3918 | Risk Ratio (M‐H, Fixed, 95% CI) | 0.77 [0.68, 0.86] |
| 11.3 delayed versus early nutrition support | 7 | 381 | Risk Ratio (M‐H, Fixed, 95% CI) | 1.06 [0.68, 1.64] |
| 12 Serious adverse events ‐ 'best‐worse case' scenario (enteral nutrition) Show forest plot | 48 | 4489 | Risk Ratio (M‐H, Random, 95% CI) | 0.62 [0.51, 0.75] |
| 13 Serious adverse events ‐ 'worst‐best case' scenario (enteral nutrition) Show forest plot | 48 | 4489 | Risk Ratio (M‐H, Random, 95% CI) | 0.81 [0.69, 0.95] |
| Outcome or subgroup title | No. of studies | No. of participants | Statistical method | Effect size |
| 1 All‐cause mortality ‐ overall Show forest plot | 43 | 7313 | Risk Ratio (M‐H, Random, 95% CI) | 0.98 [0.83, 1.16] |
| 2 All‐cause mortality ‐ bias Show forest plot | 43 | 7313 | Risk Ratio (M‐H, Random, 95% CI) | 0.98 [0.83, 1.16] |
| 2.1 High risk of bias | 43 | 7313 | Risk Ratio (M‐H, Random, 95% CI) | 0.98 [0.83, 1.16] |
| 2.2 Low risk of bias | 0 | 0 | Risk Ratio (M‐H, Random, 95% CI) | 0.0 [0.0, 0.0] |
| 3 All‐cause mortality ‐ medical speciality Show forest plot | 43 | 7313 | Risk Ratio (M‐H, Random, 95% CI) | 0.98 [0.83, 1.16] |
| 3.1 Cardiology | 0 | 0 | Risk Ratio (M‐H, Random, 95% CI) | 0.0 [0.0, 0.0] |
| 3.2 Medical gastroenterology and hepatology | 7 | 259 | Risk Ratio (M‐H, Random, 95% CI) | 1.17 [0.58, 2.37] |
| 3.3 Geriatrics | 0 | 0 | Risk Ratio (M‐H, Random, 95% CI) | 0.0 [0.0, 0.0] |
| 3.4 Pulmonary disease | 1 | 25 | Risk Ratio (M‐H, Random, 95% CI) | 0.22 [0.01, 4.08] |
| 3.5 Endocrinology | 0 | 0 | Risk Ratio (M‐H, Random, 95% CI) | 0.0 [0.0, 0.0] |
| 3.6 Infectious diseases | 0 | 0 | Risk Ratio (M‐H, Random, 95% CI) | 0.0 [0.0, 0.0] |
| 3.7 Rheumatology | 0 | 0 | Risk Ratio (M‐H, Random, 95% CI) | 0.0 [0.0, 0.0] |
| 3.8 Haematology | 0 | 0 | Risk Ratio (M‐H, Random, 95% CI) | 0.0 [0.0, 0.0] |
| 3.9 Nephrology | 0 | 0 | Risk Ratio (M‐H, Random, 95% CI) | 0.0 [0.0, 0.0] |
| 3.10 Gastroenterologic surgery | 21 | 1553 | Risk Ratio (M‐H, Random, 95% CI) | 0.79 [0.52, 1.20] |
| 3.11 Trauma surgery | 2 | 45 | Risk Ratio (M‐H, Random, 95% CI) | 1.22 [0.66, 2.25] |
| 3.12 Orthopaedics | 0 | 0 | Risk Ratio (M‐H, Random, 95% CI) | 0.0 [0.0, 0.0] |
| 3.13 Plastic, reconstructive and aesthetic surgery | 0 | 0 | Risk Ratio (M‐H, Random, 95% CI) | 0.0 [0.0, 0.0] |
| 3.14 Vascular surgery | 1 | 15 | Risk Ratio (M‐H, Random, 95% CI) | 0.0 [0.0, 0.0] |
| 3.15 Transplant surgery | 2 | 47 | Risk Ratio (M‐H, Random, 95% CI) | 0.61 [0.23, 1.65] |
| 3.16 Urology | 0 | 0 | Risk Ratio (M‐H, Random, 95% CI) | 0.0 [0.0, 0.0] |
| 3.17 Thoracic surgery | 1 | 44 | Risk Ratio (M‐H, Random, 95% CI) | 1.6 [0.40, 6.32] |
| 3.18 Neurological surgery | 0 | 0 | Risk Ratio (M‐H, Random, 95% CI) | 0.0 [0.0, 0.0] |
| 3.19 Oro‐maxillo‐facial surgery | 0 | 0 | Risk Ratio (M‐H, Random, 95% CI) | 0.0 [0.0, 0.0] |
| 3.20 Anaesthesiology | 0 | 0 | Risk Ratio (M‐H, Random, 95% CI) | 0.0 [0.0, 0.0] |
| 3.21 Emergency medicine | 4 | 5044 | Risk Ratio (M‐H, Random, 95% CI) | 1.00 [0.81, 1.24] |
| 3.22 Psychiatry | 0 | 0 | Risk Ratio (M‐H, Random, 95% CI) | 0.0 [0.0, 0.0] |
| 3.23 Neurology | 0 | 0 | Risk Ratio (M‐H, Random, 95% CI) | 0.0 [0.0, 0.0] |
| 3.24 Oncology | 4 | 281 | Risk Ratio (M‐H, Random, 95% CI) | 1.19 [0.44, 3.21] |
| 3.25 Dermatology | 0 | 0 | Risk Ratio (M‐H, Random, 95% CI) | 0.0 [0.0, 0.0] |
| 3.26 Gynaecology | 0 | 0 | Risk Ratio (M‐H, Random, 95% CI) | 0.0 [0.0, 0.0] |
| 3.27 Mixed | 0 | 0 | Risk Ratio (M‐H, Random, 95% CI) | 0.0 [0.0, 0.0] |
| 4 All‐cause mortality ‐ based on adequacy of the amount of calories Show forest plot | 43 | 7313 | Risk Ratio (M‐H, Random, 95% CI) | 0.98 [0.83, 1.16] |
| 4.1 Clearly adequate in experimental group and clearly inadequate in control group | 7 | 5641 | Risk Ratio (M‐H, Random, 95% CI) | 0.98 [0.80, 1.20] |
| 4.2 Inadequate in the experimental group or adequate in the control group | 1 | 53 | Risk Ratio (M‐H, Random, 95% CI) | 1.16 [0.40, 3.33] |
| 4.3 Experimental group is overfed | 0 | 0 | Risk Ratio (M‐H, Random, 95% CI) | 0.0 [0.0, 0.0] |
| 4.4 Unclear intake in experimental group or control group | 35 | 1619 | Risk Ratio (M‐H, Random, 95% CI) | 0.95 [0.68, 1.32] |
| 5 All‐cause mortality ‐ different screening tools Show forest plot | 43 | 7313 | Risk Ratio (M‐H, Random, 95% CI) | 0.98 [0.83, 1.16] |
| 5.1 NRS 2002 | 1 | 4640 | Risk Ratio (M‐H, Random, 95% CI) | 1.04 [0.83, 1.30] |
| 5.2 MUST | 0 | 0 | Risk Ratio (M‐H, Random, 95% CI) | 0.0 [0.0, 0.0] |
| 5.3 MNA | 0 | 0 | Risk Ratio (M‐H, Random, 95% CI) | 0.0 [0.0, 0.0] |
| 5.4 SGA | 1 | 323 | Risk Ratio (M‐H, Random, 95% CI) | 0.75 [0.13, 4.44] |
| 5.5 Other means | 41 | 2350 | Risk Ratio (M‐H, Random, 95% CI) | 0.90 [0.69, 1.17] |
| 6 All‐cause mortality ‐ participants characterised as 'at nutritional risk' due to one of the following conditions Show forest plot | 43 | 7313 | Risk Ratio (M‐H, Random, 95% CI) | 0.98 [0.83, 1.16] |
| 6.1 Major surgery | 26 | 1822 | Risk Ratio (M‐H, Random, 95% CI) | 0.80 [0.56, 1.15] |
| 6.2 Stroke | 0 | 0 | Risk Ratio (M‐H, Random, 95% CI) | 0.0 [0.0, 0.0] |
| 6.3 ICU participants including trauma | 6 | 5089 | Risk Ratio (M‐H, Random, 95% CI) | 1.02 [0.84, 1.25] |
| 6.4 Frail elderly participants with less severe conditions known to increase protein requirements | 1 | 34 | Risk Ratio (M‐H, Random, 95% CI) | 3.35 [0.15, 76.93] |
| 6.5 Participants do not fall into one of the categories above | 10 | 368 | Risk Ratio (M‐H, Random, 95% CI) | 1.12 [0.60, 2.10] |
| 7 All‐cause mortality ‐ participants characterised as 'at nutritional risk' due to one of the following criteria Show forest plot | 43 | 7313 | Risk Ratio (M‐H, Random, 95% CI) | 0.98 [0.83, 1.16] |
| 7.1 BMI less than 20.5 kg/m2 | 0 | 0 | Risk Ratio (M‐H, Random, 95% CI) | 0.0 [0.0, 0.0] |
| 7.2 Weight loss of at least 5% during the last three months | 0 | 0 | Risk Ratio (M‐H, Random, 95% CI) | 0.0 [0.0, 0.0] |
| 7.3 Weight loss of at least 10% during the last six months | 0 | 0 | Risk Ratio (M‐H, Random, 95% CI) | 0.0 [0.0, 0.0] |
| 7.4 Insufficient food intake during the last week (50% of requirements or less) | 0 | 0 | Risk Ratio (M‐H, Random, 95% CI) | 0.0 [0.0, 0.0] |
| 7.5 Participants characterised as 'at nutritional risk' by other means | 43 | 7313 | Risk Ratio (M‐H, Random, 95% CI) | 0.98 [0.83, 1.16] |
| 8 All‐cause mortality ‐ participants characterised as 'at nutritional risk' due to biomarkers or anthropometrics Show forest plot | 43 | 7313 | Risk Ratio (M‐H, Random, 95% CI) | 0.98 [0.83, 1.16] |
| 8.1 Biomarkers | 2 | 43 | Risk Ratio (M‐H, Random, 95% CI) | 0.22 [0.01, 4.08] |
| 8.2 Anthropometric measures | 3 | 137 | Risk Ratio (M‐H, Random, 95% CI) | 1.31 [0.38, 4.58] |
| 8.3 Both | 3 | 75 | Risk Ratio (M‐H, Random, 95% CI) | 0.66 [0.14, 3.07] |
| 8.4 Characterised by other means | 35 | 7058 | Risk Ratio (M‐H, Random, 95% CI) | 0.98 [0.83, 1.17] |
| 9 All‐cause mortality ‐ randomisation year Show forest plot | 43 | 7313 | Risk Ratio (M‐H, Random, 95% CI) | 0.98 [0.83, 1.16] |
| 9.1 Before 1960 | 0 | 0 | Risk Ratio (M‐H, Random, 95% CI) | 0.0 [0.0, 0.0] |
| 9.2 1960‐1979 | 3 | 95 | Risk Ratio (M‐H, Random, 95% CI) | 1.85 [0.58, 5.88] |
| 9.3 1980‐1999 | 34 | 1694 | Risk Ratio (M‐H, Random, 95% CI) | 0.91 [0.68, 1.21] |
| 9.4 After 1999 | 6 | 5524 | Risk Ratio (M‐H, Random, 95% CI) | 1.00 [0.81, 1.23] |
| 10 All‐cause mortality ‐ trials where the intervention lasts fewer than three days compared with trials where the intervention lasts three days or more Show forest plot | 43 | 7313 | Risk Ratio (M‐H, Random, 95% CI) | 0.98 [0.83, 1.16] |
| 10.1 Three days or more | 41 | 7206 | Risk Ratio (M‐H, Random, 95% CI) | 0.98 [0.83, 1.16] |
| 10.2 Less than three days | 1 | 80 | Risk Ratio (M‐H, Random, 95% CI) | 0.67 [0.12, 3.78] |
| 10.3 Unknown | 1 | 27 | Risk Ratio (M‐H, Random, 95% CI) | 0.0 [0.0, 0.0] |
| 11 All‐cause mortality ‐ 'best‐worst case' scenario Show forest plot | 43 | 7432 | Risk Ratio (M‐H, Random, 95% CI) | 0.73 [0.56, 0.97] |
| 12 All‐cause mortality ‐ 'worst‐best case' scenario Show forest plot | 43 | 7432 | Risk Ratio (M‐H, Random, 95% CI) | 1.20 [0.98, 1.47] |
| 13 All‐cause mortality co‐interventions Show forest plot | 43 | 7313 | Risk Ratio (M‐H, Fixed, 95% CI) | 0.98 [0.82, 1.16] |
| 13.1 received nutrition support as co‐intervention | 6 | 5066 | Risk Ratio (M‐H, Fixed, 95% CI) | 1.03 [0.83, 1.26] |
| 13.2 did not receive nutrition support as co‐intervention | 36 | 2167 | Risk Ratio (M‐H, Fixed, 95% CI) | 0.88 [0.66, 1.18] |
| 13.3 delayed versus early nutrition support | 1 | 80 | Risk Ratio (M‐H, Fixed, 95% CI) | 0.67 [0.12, 3.78] |
| Outcome or subgroup title | No. of studies | No. of participants | Statistical method | Effect size |
| 1 All‐cause mortality ‐ overall Show forest plot | 51 | 8121 | Risk Ratio (M‐H, Random, 95% CI) | 0.99 [0.90, 1.09] |
| 2 All‐cause mortality ‐ bias Show forest plot | 51 | 8121 | Risk Ratio (M‐H, Random, 95% CI) | 0.99 [0.90, 1.09] |
| 2.1 High risk of bias | 51 | 8121 | Risk Ratio (M‐H, Random, 95% CI) | 0.99 [0.90, 1.09] |
| 2.2 Low risk of bias | 0 | 0 | Risk Ratio (M‐H, Random, 95% CI) | 0.0 [0.0, 0.0] |
| 3 All‐cause mortality ‐ medical speciality Show forest plot | 51 | 8121 | Risk Ratio (M‐H, Random, 95% CI) | 0.99 [0.90, 1.09] |
| 3.1 Cardiology | 0 | 0 | Risk Ratio (M‐H, Random, 95% CI) | 0.0 [0.0, 0.0] |
| 3.2 Medical gastroenterology and hepatology | 7 | 254 | Risk Ratio (M‐H, Random, 95% CI) | 1.02 [0.74, 1.42] |
| 3.3 Geriatrics | 0 | 0 | Risk Ratio (M‐H, Random, 95% CI) | 0.0 [0.0, 0.0] |
| 3.4 Pulmonary disease | 1 | 25 | Risk Ratio (M‐H, Random, 95% CI) | 0.22 [0.01, 4.08] |
| 3.5 Endocrinology | 0 | 0 | Risk Ratio (M‐H, Random, 95% CI) | 0.0 [0.0, 0.0] |
| 3.6 Infectious diseases | 0 | 0 | Risk Ratio (M‐H, Random, 95% CI) | 0.0 [0.0, 0.0] |
| 3.7 Rheumatology | 0 | 0 | Risk Ratio (M‐H, Random, 95% CI) | 0.0 [0.0, 0.0] |
| 3.8 Haematology | 0 | 0 | Risk Ratio (M‐H, Random, 95% CI) | 0.0 [0.0, 0.0] |
| 3.9 Nephrology | 0 | 0 | Risk Ratio (M‐H, Random, 95% CI) | 0.0 [0.0, 0.0] |
| 3.10 Gastroenterologic surgery | 24 | 2104 | Risk Ratio (M‐H, Random, 95% CI) | 0.93 [0.68, 1.28] |
| 3.11 Trauma surgery | 2 | 45 | Risk Ratio (M‐H, Random, 95% CI) | 1.22 [0.66, 2.25] |
| 3.12 Ortopaedics | 0 | 0 | Risk Ratio (M‐H, Random, 95% CI) | 0.0 [0.0, 0.0] |
| 3.13 Plastic, reconstructive, and aesthetic surgery | 0 | 0 | Risk Ratio (M‐H, Random, 95% CI) | 0.0 [0.0, 0.0] |
| 3.14 Vascular surgery | 1 | 15 | Risk Ratio (M‐H, Random, 95% CI) | 0.0 [0.0, 0.0] |
| 3.15 Transplant surgery | 2 | 47 | Risk Ratio (M‐H, Random, 95% CI) | 0.56 [0.22, 1.42] |
| 3.16 Urology | 0 | 0 | Risk Ratio (M‐H, Random, 95% CI) | 0.0 [0.0, 0.0] |
| 3.17 Thoracic surgery | 1 | 44 | Risk Ratio (M‐H, Random, 95% CI) | 1.6 [0.40, 6.32] |
| 3.18 Neurological surgery | 0 | 0 | Risk Ratio (M‐H, Random, 95% CI) | 0.0 [0.0, 0.0] |
| 3.19 Oro‐maxillo‐facial surgery | 0 | 0 | Risk Ratio (M‐H, Random, 95% CI) | 0.0 [0.0, 0.0] |
| 3.20 Anaesthesiology | 0 | 0 | Risk Ratio (M‐H, Random, 95% CI) | 0.0 [0.0, 0.0] |
| 3.21 Emergency medicine | 7 | 5208 | Risk Ratio (M‐H, Random, 95% CI) | 0.97 [0.84, 1.12] |
| 3.22 Psychiatry | 0 | 0 | Risk Ratio (M‐H, Random, 95% CI) | 0.0 [0.0, 0.0] |
| 3.23 Neurology | 0 | 0 | Risk Ratio (M‐H, Random, 95% CI) | 0.0 [0.0, 0.0] |
| 3.24 Oncology | 6 | 379 | Risk Ratio (M‐H, Random, 95% CI) | 1.03 [0.87, 1.21] |
| 3.25 Dermatology | 0 | 0 | Risk Ratio (M‐H, Random, 95% CI) | 0.0 [0.0, 0.0] |
| 3.26 Gynaecology | 0 | 0 | Risk Ratio (M‐H, Random, 95% CI) | 0.0 [0.0, 0.0] |
| 3.27 Mixed | 0 | 0 | Risk Ratio (M‐H, Random, 95% CI) | 0.0 [0.0, 0.0] |
| 4 All‐cause mortality ‐ based on adequacy of the amount of calories Show forest plot | 51 | 8121 | Risk Ratio (M‐H, Random, 95% CI) | 0.99 [0.90, 1.09] |
| 4.1 Clearly adequate in intervention and clearly inadequate in control | 7 | 5641 | Risk Ratio (M‐H, Random, 95% CI) | 0.98 [0.88, 1.10] |
| 4.2 Inadequate in the experimental or adequate in the control | 4 | 165 | Risk Ratio (M‐H, Random, 95% CI) | 1.17 [0.80, 1.72] |
| 4.3 Experimental group is overfed | 4 | 272 | Risk Ratio (M‐H, Random, 95% CI) | 0.56 [0.23, 1.34] |
| 4.4 Unclear intake in control or experimental | 36 | 2043 | Risk Ratio (M‐H, Random, 95% CI) | 0.99 [0.80, 1.22] |
| 5 All‐cause mortality ‐ different screening tools Show forest plot | 51 | 8121 | Risk Ratio (M‐H, Random, 95% CI) | 0.99 [0.90, 1.09] |
| 5.1 NRS 2002 | 1 | 4640 | Risk Ratio (M‐H, Random, 95% CI) | 1.00 [0.85, 1.18] |
| 5.2 MUST | 0 | 0 | Risk Ratio (M‐H, Random, 95% CI) | 0.0 [0.0, 0.0] |
| 5.3 MNA | 0 | 0 | Risk Ratio (M‐H, Random, 95% CI) | 0.0 [0.0, 0.0] |
| 5.4 SGA | 1 | 323 | Risk Ratio (M‐H, Random, 95% CI) | 0.75 [0.13, 4.44] |
| 5.5 Other means | 49 | 3158 | Risk Ratio (M‐H, Random, 95% CI) | 0.98 [0.88, 1.11] |
| 6 All‐cause mortality ‐ participants characterised as 'at nutritional risk' due to one of the following conditions Show forest plot | 51 | 8121 | Risk Ratio (M‐H, Random, 95% CI) | 0.99 [0.90, 1.09] |
| 6.1 Major surgery | 30 | 2381 | Risk Ratio (M‐H, Random, 95% CI) | 0.88 [0.67, 1.15] |
| 6.2 Stroke | 0 | 0 | Risk Ratio (M‐H, Random, 95% CI) | 0.0 [0.0, 0.0] |
| 6.3 ICU participants including trauma | 7 | 5209 | Risk Ratio (M‐H, Random, 95% CI) | 0.99 [0.86, 1.14] |
| 6.4 Frail elderly participants with less severe conditions known to increase protein requirements | 1 | 34 | Risk Ratio (M‐H, Random, 95% CI) | 3.35 [0.15, 76.93] |
| 6.5 Participants do not fall into one of the categories above | 13 | 497 | Risk Ratio (M‐H, Random, 95% CI) | 1.02 [0.88, 1.18] |
| 7 All‐cause mortality ‐ participants characterised as 'at nutritional risk' due to one of the following criteria Show forest plot | 51 | 8121 | Risk Ratio (M‐H, Random, 95% CI) | 0.99 [0.90, 1.09] |
| 7.1 BMI less than 20.5 kg/m2 | 0 | 0 | Risk Ratio (M‐H, Random, 95% CI) | 0.0 [0.0, 0.0] |
| 7.2 Weight loss of at least 5% during the last three months | 0 | 0 | Risk Ratio (M‐H, Random, 95% CI) | 0.0 [0.0, 0.0] |
| 7.3 Weight loss of at least 10% during the last six months | 2 | 92 | Risk Ratio (M‐H, Random, 95% CI) | 0.33 [0.01, 7.78] |
| 7.4 Insufficient food intake during the last week (50% of requirements or less) | 0 | 0 | Risk Ratio (M‐H, Random, 95% CI) | 0.0 [0.0, 0.0] |
| 7.5 Participants characterised as 'at nutritional risk' by other means | 49 | 8029 | Risk Ratio (M‐H, Random, 95% CI) | 0.99 [0.90, 1.09] |
| 8 All‐cause mortality ‐ participants characterised as 'at nutritional risk' due to biomarkers or anthropometrics Show forest plot | 51 | 8121 | Risk Ratio (M‐H, Random, 95% CI) | 0.99 [0.90, 1.09] |
| 8.1 Biomarkers | 5 | 169 | Risk Ratio (M‐H, Random, 95% CI) | 0.47 [0.10, 2.12] |
| 8.2 Anthropometric measures | 3 | 137 | Risk Ratio (M‐H, Random, 95% CI) | 0.93 [0.32, 2.75] |
| 8.3 Both anthropometrics and biomarkers | 3 | 75 | Risk Ratio (M‐H, Random, 95% CI) | 0.66 [0.14, 3.07] |
| 8.4 Characterised by other means | 40 | 7740 | Risk Ratio (M‐H, Random, 95% CI) | 0.99 [0.90, 1.09] |
| 9 All‐cause mortality ‐ randomisation year Show forest plot | 51 | 8121 | Risk Ratio (M‐H, Random, 95% CI) | 0.99 [0.90, 1.09] |
| 9.1 Before 1960 | 0 | 0 | Risk Ratio (M‐H, Random, 95% CI) | 0.0 [0.0, 0.0] |
| 9.2 1960 to 1979 | 4 | 151 | Risk Ratio (M‐H, Random, 95% CI) | 1.50 [0.56, 4.03] |
| 9.3 1980 to 1999 | 41 | 2446 | Risk Ratio (M‐H, Random, 95% CI) | 0.99 [0.88, 1.12] |
| 9.4 After 1999 | 6 | 5524 | Risk Ratio (M‐H, Random, 95% CI) | 0.98 [0.84, 1.13] |
| 10 All‐cause mortality ‐ trials where the intervention lasts fewer than three days compared with trials where the intervention lasts three days or more Show forest plot | 51 | 8121 | Risk Ratio (M‐H, Random, 95% CI) | 0.99 [0.90, 1.09] |
| 10.1 Three days or more | 49 | 8014 | Risk Ratio (M‐H, Random, 95% CI) | 0.99 [0.89, 1.08] |
| 10.2 Less than three days | 1 | 80 | Risk Ratio (M‐H, Random, 95% CI) | 1.2 [0.59, 2.45] |
| 10.3 Unknown | 1 | 27 | Risk Ratio (M‐H, Random, 95% CI) | 0.0 [0.0, 0.0] |
| 11 All‐cause mortality ‐ 'best‐worst case' scenario Show forest plot | 51 | 8240 | Risk Ratio (M‐H, Random, 95% CI) | 0.87 [0.74, 1.02] |
| 12 All‐cause mortality ‐ 'worst‐best case' scenario Show forest plot | 51 | 8240 | Risk Ratio (M‐H, Random, 95% CI) | 1.06 [0.95, 1.19] |
| 13 All‐cause mortality co‐interventions Show forest plot | 51 | 8121 | Risk Ratio (M‐H, Fixed, 95% CI) | 0.97 [0.87, 1.09] |
| 13.1 received nutrition support as co‐intervention | 5 | 5044 | Risk Ratio (M‐H, Fixed, 95% CI) | 0.97 [0.84, 1.13] |
| 13.2 did not receive nutrition support as co‐intervention | 45 | 2997 | Risk Ratio (M‐H, Fixed, 95% CI) | 0.96 [0.81, 1.14] |
| 13.3 delayed versus early nutrition support | 1 | 80 | Risk Ratio (M‐H, Fixed, 95% CI) | 1.2 [0.59, 2.45] |
| Outcome or subgroup title | No. of studies | No. of participants | Statistical method | Effect size |
| 1 Serious adverse events ‐ overall Show forest plot | 48 | 7519 | Risk Ratio (M‐H, Random, 95% CI) | 0.98 [0.85, 1.14] |
| 2 Serious adverse events ‐ bias Show forest plot | 48 | 7519 | Risk Ratio (M‐H, Random, 95% CI) | 0.98 [0.85, 1.14] |
| 2.1 High risk of bias | 48 | 7519 | Risk Ratio (M‐H, Random, 95% CI) | 0.98 [0.85, 1.14] |
| 2.2 Low risk of bias | 0 | 0 | Risk Ratio (M‐H, Random, 95% CI) | 0.0 [0.0, 0.0] |
| 3 Serious adverse events ‐ by medical specialty Show forest plot | 48 | 7519 | Risk Ratio (M‐H, Random, 95% CI) | 0.98 [0.85, 1.14] |
| 3.1 Cardiology | 0 | 0 | Risk Ratio (M‐H, Random, 95% CI) | 0.0 [0.0, 0.0] |
| 3.2 Medical gastroenterology and hepatology | 7 | 259 | Risk Ratio (M‐H, Random, 95% CI) | 1.29 [0.73, 2.29] |
| 3.3 High risk | 0 | 0 | Risk Ratio (M‐H, Random, 95% CI) | 0.0 [0.0, 0.0] |
| 3.4 Geriatrics | 0 | 0 | Risk Ratio (M‐H, Random, 95% CI) | 0.0 [0.0, 0.0] |
| 3.5 Pulmonary disease | 1 | 25 | Risk Ratio (M‐H, Random, 95% CI) | 0.22 [0.01, 4.08] |
| 3.6 Endocrinology | 0 | 0 | Risk Ratio (M‐H, Random, 95% CI) | 0.0 [0.0, 0.0] |
| 3.7 Infectious diseases | 0 | 0 | Risk Ratio (M‐H, Random, 95% CI) | 0.0 [0.0, 0.0] |
| 3.8 Rheumatology | 0 | 0 | Risk Ratio (M‐H, Random, 95% CI) | 0.0 [0.0, 0.0] |
| 3.9 Haematology | 0 | 0 | Risk Ratio (M‐H, Random, 95% CI) | 0.0 [0.0, 0.0] |
| 3.10 Nephrology | 0 | 0 | Risk Ratio (M‐H, Random, 95% CI) | 0.0 [0.0, 0.0] |
| 3.11 Gastroenterologic surgery | 24 | 1663 | Risk Ratio (M‐H, Random, 95% CI) | 0.78 [0.56, 1.10] |
| 3.12 Trauma surgery | 2 | 45 | Risk Ratio (M‐H, Random, 95% CI) | 1.22 [0.66, 2.25] |
| 3.13 Ortopaedics | 1 | 80 | Risk Ratio (M‐H, Random, 95% CI) | 0.0 [0.0, 0.0] |
| 3.14 Plastic, reconstructive, and aesthetic surgery | 0 | 0 | Risk Ratio (M‐H, Random, 95% CI) | 0.0 [0.0, 0.0] |
| 3.15 Vascular surgery | 2 | 35 | Risk Ratio (M‐H, Random, 95% CI) | 0.5 [0.05, 4.67] |
| 3.16 Transplant surgery | 2 | 47 | Risk Ratio (M‐H, Random, 95% CI) | 0.61 [0.23, 1.65] |
| 3.17 Urology | 0 | 0 | Risk Ratio (M‐H, Random, 95% CI) | 0.0 [0.0, 0.0] |
| 3.18 Thoracic surgery | 1 | 44 | Risk Ratio (M‐H, Random, 95% CI) | 1.6 [0.40, 6.32] |
| 3.19 Neurological surgery | 0 | 0 | Risk Ratio (M‐H, Random, 95% CI) | 0.0 [0.0, 0.0] |
| 3.20 Oro‐maxillo‐facial surgery | 0 | 0 | Risk Ratio (M‐H, Random, 95% CI) | 0.0 [0.0, 0.0] |
| 3.21 Anaesthesiology | 0 | 0 | Risk Ratio (M‐H, Random, 95% CI) | 0.0 [0.0, 0.0] |
| 3.22 Emergency medicine | 4 | 5044 | Risk Ratio (M‐H, Random, 95% CI) | 1.00 [0.81, 1.24] |
| 3.23 Psychiatry | 0 | 0 | Risk Ratio (M‐H, Random, 95% CI) | 0.0 [0.0, 0.0] |
| 3.24 Neurology | 0 | 0 | Risk Ratio (M‐H, Random, 95% CI) | 0.0 [0.0, 0.0] |
| 3.25 Oncology | 4 | 277 | Risk Ratio (M‐H, Random, 95% CI) | 1.12 [0.51, 2.44] |
| 3.26 Dermatology | 0 | 0 | Risk Ratio (M‐H, Random, 95% CI) | 0.0 [0.0, 0.0] |
| 3.27 Gynaecology | 0 | 0 | Risk Ratio (M‐H, Random, 95% CI) | 0.0 [0.0, 0.0] |
| 3.28 Mixed | 0 | 0 | Risk Ratio (M‐H, Random, 95% CI) | 0.0 [0.0, 0.0] |
| 4 Serious adverse events ‐ based on adequacy of the amount of calories Show forest plot | 48 | 7519 | Risk Ratio (M‐H, Random, 95% CI) | 0.98 [0.85, 1.14] |
| 4.1 Clearly adequate in intervention and clearly inadequate in control | 9 | 5736 | Risk Ratio (M‐H, Random, 95% CI) | 0.98 [0.80, 1.19] |
| 4.2 Inadequate in the experimental or adequate in the control | 5 | 218 | Risk Ratio (M‐H, Random, 95% CI) | 1.20 [0.74, 1.95] |
| 4.3 Experimental group is overfed | 1 | 124 | Risk Ratio (M‐H, Random, 95% CI) | 0.52 [0.19, 1.47] |
| 4.4 Unclear intake in control or experimental | 33 | 1441 | Risk Ratio (M‐H, Random, 95% CI) | 0.89 [0.65, 1.23] |
| 5 Serious adverse events ‐ different screening tools Show forest plot | 48 | 7519 | Risk Ratio (M‐H, Random, 95% CI) | 0.98 [0.85, 1.14] |
| 5.1 NRS 2002 | 1 | 4640 | Risk Ratio (M‐H, Random, 95% CI) | 1.04 [0.83, 1.30] |
| 5.2 MUST | 0 | 0 | Risk Ratio (M‐H, Random, 95% CI) | 0.0 [0.0, 0.0] |
| 5.3 MNA | 0 | 0 | Risk Ratio (M‐H, Random, 95% CI) | 0.0 [0.0, 0.0] |
| 5.4 SGA | 1 | 323 | Risk Ratio (M‐H, Random, 95% CI) | 0.72 [0.28, 1.83] |
| 5.5 Other means | 46 | 2556 | Risk Ratio (M‐H, Random, 95% CI) | 0.95 [0.77, 1.17] |
| 6 Serious adverse events ‐ participants characterised as 'at nutritional risk' due to one of the following conditions Show forest plot | 48 | 7519 | Risk Ratio (M‐H, Random, 95% CI) | 0.98 [0.85, 1.14] |
| 6.1 Major surgery | 30 | 1952 | Risk Ratio (M‐H, Random, 95% CI) | 0.86 [0.66, 1.13] |
| 6.2 Stroke | 0 | 0 | Risk Ratio (M‐H, Random, 95% CI) | 0.0 [0.0, 0.0] |
| 6.3 ICU participants including trauma | 6 | 5089 | Risk Ratio (M‐H, Random, 95% CI) | 1.02 [0.84, 1.25] |
| 6.4 Frail elderly participants with less severe conditions known to increase protein requirements | 2 | 114 | Risk Ratio (M‐H, Random, 95% CI) | 0.56 [0.06, 5.63] |
| 6.5 Participants do not fall into one of the categories above | 10 | 364 | Risk Ratio (M‐H, Random, 95% CI) | 1.18 [0.69, 2.02] |
| 7 Serious adverse events ‐ participants characterised as 'at nutritional risk' due to one of the following criteria Show forest plot | 48 | 7519 | Risk Ratio (M‐H, Random, 95% CI) | 0.98 [0.85, 1.14] |
| 7.1 BMI less than 20.5 kg/m2 | 0 | 0 | Risk Ratio (M‐H, Random, 95% CI) | 0.0 [0.0, 0.0] |
| 7.2 Weight loss of at least 5% during the last three months | 0 | 0 | Risk Ratio (M‐H, Random, 95% CI) | 0.0 [0.0, 0.0] |
| 7.3 Weight loss of at least 10% during the last six months | 0 | 0 | Risk Ratio (M‐H, Random, 95% CI) | 0.0 [0.0, 0.0] |
| 7.4 Insufficient food intake during the last week (50% of requirements or less) | 0 | 0 | Risk Ratio (M‐H, Random, 95% CI) | 0.0 [0.0, 0.0] |
| 7.5 Participants characterised as 'at nutritional risk' by other means | 48 | 7519 | Risk Ratio (M‐H, Random, 95% CI) | 0.98 [0.85, 1.14] |
| 8 Serious adverse events ‐ participants characterised as 'at nutritional risk' due to biomarkers or anthropometrics Show forest plot | 48 | 7519 | Risk Ratio (M‐H, Random, 95% CI) | 0.98 [0.85, 1.14] |
| 8.1 Biomarkers | 3 | 77 | Risk Ratio (M‐H, Random, 95% CI) | 0.39 [0.06, 2.39] |
| 8.2 Anthropometric measures | 3 | 137 | Risk Ratio (M‐H, Random, 95% CI) | 0.69 [0.16, 3.01] |
| 8.3 Mixed | 3 | 75 | Risk Ratio (M‐H, Random, 95% CI) | 0.66 [0.14, 3.07] |
| 8.4 Characterised by other means | 39 | 7230 | Risk Ratio (M‐H, Random, 95% CI) | 1.00 [0.86, 1.16] |
| 9 Serious adverse events ‐ randomisation year Show forest plot | 48 | 7519 | Risk Ratio (M‐H, Random, 95% CI) | 0.98 [0.85, 1.14] |
| 9.1 Before 1960 | 0 | 0 | Risk Ratio (M‐H, Random, 95% CI) | 0.0 [0.0, 0.0] |
| 9.2 1960 to 1979 | 3 | 98 | Risk Ratio (M‐H, Random, 95% CI) | 2.02 [0.82, 4.98] |
| 9.3 1980 to 1999 | 37 | 1754 | Risk Ratio (M‐H, Random, 95% CI) | 0.95 [0.76, 1.19] |
| 9.4 After 1999 | 8 | 5667 | Risk Ratio (M‐H, Random, 95% CI) | 0.97 [0.79, 1.20] |
| 10 Serious adverse events ‐ trials where the intervention lasts fewer than three days compared with trials where the intervention lasts three days or more Show forest plot | 48 | 7519 | Risk Ratio (M‐H, Random, 95% CI) | 0.98 [0.85, 1.14] |
| 10.1 Three days or more | 46 | 7412 | Risk Ratio (M‐H, Random, 95% CI) | 0.99 [0.85, 1.15] |
| 10.2 Less than three days | 1 | 80 | Risk Ratio (M‐H, Random, 95% CI) | 0.67 [0.12, 3.78] |
| 10.3 Unknown | 1 | 27 | Risk Ratio (M‐H, Random, 95% CI) | 0.0 [0.0, 0.0] |
| 11 Serious adverse events ‐ 'best‐worst case' scenario Show forest plot | 48 | 8293 | Risk Ratio (M‐H, Random, 95% CI) | 0.78 [0.63, 0.98] |
| 12 Serious adverse events ‐ 'worst‐best case' scenario Show forest plot | 48 | 8293 | Risk Ratio (M‐H, Random, 95% CI) | 1.16 [0.95, 1.42] |
| 13 Serious adverse events co‐interventions Show forest plot | 48 | 7519 | Risk Ratio (M‐H, Fixed, 95% CI) | 0.94 [0.81, 1.09] |
| 13.1 received nutrition support as co‐intervention | 5 | 5049 | Risk Ratio (M‐H, Fixed, 95% CI) | 1.02 [0.83, 1.26] |
| 13.2 did not receive nutrition support as co‐intervention | 42 | 2390 | Risk Ratio (M‐H, Fixed, 95% CI) | 0.87 [0.70, 1.07] |
| 13.3 delayed versus early nutrition support | 1 | 80 | Risk Ratio (M‐H, Fixed, 95% CI) | 0.67 [0.12, 3.78] |
| Outcome or subgroup title | No. of studies | No. of participants | Statistical method | Effect size |
| 1 Serious adverse events ‐ overall Show forest plot | 56 | 8263 | Risk Ratio (M‐H, Random, 95% CI) | 0.98 [0.90, 1.07] |
| 2 Serious adverse events ‐ bias Show forest plot | 56 | 8263 | Risk Ratio (M‐H, Random, 95% CI) | 0.98 [0.90, 1.07] |
| 2.1 High risk of bias | 56 | 8263 | Risk Ratio (M‐H, Random, 95% CI) | 0.98 [0.90, 1.07] |
| 2.2 Low risk of bias | 0 | 0 | Risk Ratio (M‐H, Random, 95% CI) | 0.0 [0.0, 0.0] |
| 3 Serious adverse events ‐ by medical speciality Show forest plot | 56 | 8263 | Risk Ratio (M‐H, Random, 95% CI) | 0.98 [0.90, 1.07] |
| 3.1 Cardiology | 0 | 0 | Risk Ratio (M‐H, Random, 95% CI) | 0.0 [0.0, 0.0] |
| 3.2 Medical gastroenterology and hepatology | 7 | 338 | Risk Ratio (M‐H, Random, 95% CI) | 0.96 [0.69, 1.33] |
| 3.3 Geriatrics | 0 | 0 | Risk Ratio (M‐H, Random, 95% CI) | 0.0 [0.0, 0.0] |
| 3.4 Pulmonary disease | 1 | 25 | Risk Ratio (M‐H, Random, 95% CI) | 0.22 [0.01, 4.08] |
| 3.5 Endocrinology | 0 | 0 | Risk Ratio (M‐H, Random, 95% CI) | 0.0 [0.0, 0.0] |
| 3.6 Infectious diseases | 0 | 0 | Risk Ratio (M‐H, Random, 95% CI) | 0.0 [0.0, 0.0] |
| 3.7 Rheumatology | 0 | 0 | Risk Ratio (M‐H, Random, 95% CI) | 0.0 [0.0, 0.0] |
| 3.8 Haematology | 0 | 0 | Risk Ratio (M‐H, Random, 95% CI) | 0.0 [0.0, 0.0] |
| 3.9 Nephrology | 0 | 0 | Risk Ratio (M‐H, Random, 95% CI) | 0.0 [0.0, 0.0] |
| 3.10 Gastroenterologic surgery | 27 | 2066 | Risk Ratio (M‐H, Random, 95% CI) | 0.91 [0.72, 1.16] |
| 3.11 Trauma surgery | 2 | 45 | Risk Ratio (M‐H, Random, 95% CI) | 1.22 [0.66, 2.25] |
| 3.12 Ortopaedics | 1 | 80 | Risk Ratio (M‐H, Random, 95% CI) | 0.0 [0.0, 0.0] |
| 3.13 Plastic, reconstructive, and aesthetic surgery | 0 | 0 | Risk Ratio (M‐H, Random, 95% CI) | 0.0 [0.0, 0.0] |
| 3.14 Vascular surgery | 2 | 35 | Risk Ratio (M‐H, Random, 95% CI) | 0.5 [0.05, 4.67] |
| 3.15 Transplant surgery | 2 | 47 | Risk Ratio (M‐H, Random, 95% CI) | 0.56 [0.22, 1.42] |
| 3.16 Urology | 0 | 0 | Risk Ratio (M‐H, Random, 95% CI) | 0.0 [0.0, 0.0] |
| 3.17 Thoracic surgery | 1 | 44 | Risk Ratio (M‐H, Random, 95% CI) | 1.6 [0.40, 6.32] |
| 3.18 Neurological surgery | 0 | 0 | Risk Ratio (M‐H, Random, 95% CI) | 0.0 [0.0, 0.0] |
| 3.19 Oro‐maxillo‐facial surgery | 0 | 0 | Risk Ratio (M‐H, Random, 95% CI) | 0.0 [0.0, 0.0] |
| 3.20 Anaesthesiology | 0 | 0 | Risk Ratio (M‐H, Random, 95% CI) | 0.0 [0.0, 0.0] |
| 3.21 Emergency medicine | 7 | 5208 | Risk Ratio (M‐H, Random, 95% CI) | 0.97 [0.84, 1.12] |
| 3.22 Psychiatry | 0 | 0 | Risk Ratio (M‐H, Random, 95% CI) | 0.0 [0.0, 0.0] |
| 3.23 Neurology | 0 | 0 | Risk Ratio (M‐H, Random, 95% CI) | 0.0 [0.0, 0.0] |
| 3.24 Oncology | 6 | 375 | Risk Ratio (M‐H, Random, 95% CI) | 1.02 [0.87, 1.20] |
| 3.25 Dermatology | 0 | 0 | Risk Ratio (M‐H, Random, 95% CI) | 0.0 [0.0, 0.0] |
| 3.26 Gynaecology | 0 | 0 | Risk Ratio (M‐H, Random, 95% CI) | 0.0 [0.0, 0.0] |
| 3.27 Mixed | 0 | 0 | Risk Ratio (M‐H, Random, 95% CI) | 0.0 [0.0, 0.0] |
| 4 Serious adverse events ‐ based on adequacy of the amount of calories Show forest plot | 56 | 8263 | Risk Ratio (M‐H, Random, 95% CI) | 0.98 [0.90, 1.07] |
| 4.1 Clearly adequate in intervention and clearly inadequate in control | 9 | 5736 | Risk Ratio (M‐H, Random, 95% CI) | 0.98 [0.88, 1.10] |
| 4.2 Inadequate in the experimental or adequate in the control | 4 | 165 | Risk Ratio (M‐H, Random, 95% CI) | 1.17 [0.80, 1.72] |
| 4.3 Experimental group is overfed | 5 | 583 | Risk Ratio (M‐H, Random, 95% CI) | 0.99 [0.74, 1.32] |
| 4.4 Unclear intake in control or experimental | 38 | 1779 | Risk Ratio (M‐H, Random, 95% CI) | 0.90 [0.73, 1.11] |
| 5 Serious adverse events ‐ different screening tools Show forest plot | 56 | 8263 | Risk Ratio (M‐H, Random, 95% CI) | 0.98 [0.90, 1.07] |
| 5.1 NRS 2002 | 1 | 4640 | Risk Ratio (M‐H, Random, 95% CI) | 1.00 [0.85, 1.18] |
| 5.2 MUST | 0 | 0 | Risk Ratio (M‐H, Random, 95% CI) | 0.0 [0.0, 0.0] |
| 5.3 MNA | 0 | 0 | Risk Ratio (M‐H, Random, 95% CI) | 0.0 [0.0, 0.0] |
| 5.4 SGA | 1 | 323 | Risk Ratio (M‐H, Random, 95% CI) | 0.72 [0.28, 1.83] |
| 5.5 Other means | 54 | 3300 | Risk Ratio (M‐H, Random, 95% CI) | 0.97 [0.88, 1.08] |
| 6 Serious adverse events ‐ participants characterised as 'at nutritional risk' due to one of the following conditions Show forest plot | 56 | 8263 | Risk Ratio (M‐H, Random, 95% CI) | 0.98 [0.90, 1.07] |
| 6.1 Major surgery | 34 | 2447 | Risk Ratio (M‐H, Random, 95% CI) | 0.90 [0.75, 1.09] |
| 6.2 Stroke | 0 | 0 | Risk Ratio (M‐H, Random, 95% CI) | 0.0 [0.0, 0.0] |
| 6.3 ICU participants including trauma | 7 | 5209 | Risk Ratio (M‐H, Random, 95% CI) | 0.99 [0.86, 1.14] |
| 6.4 Frail elderly participants with less severe conditions known to increase protein requirements | 2 | 114 | Risk Ratio (M‐H, Random, 95% CI) | 0.56 [0.06, 5.63] |
| 6.5 Participants do not fall into one of the categories above | 13 | 493 | Risk Ratio (M‐H, Random, 95% CI) | 1.02 [0.88, 1.18] |
| 7 Serious adverse events ‐ participants characterised as 'at nutritional risk' due to one of the following criteria Show forest plot | 56 | 8263 | Risk Ratio (M‐H, Random, 95% CI) | 0.98 [0.90, 1.07] |
| 7.1 BMI less than 20.5 kg/m2 | 0 | 0 | Risk Ratio (M‐H, Random, 95% CI) | 0.0 [0.0, 0.0] |
| 7.2 Weight loss of at least 5% during the last three months | 0 | 0 | Risk Ratio (M‐H, Random, 95% CI) | 0.0 [0.0, 0.0] |
| 7.3 Weight loss of at least 10% during the last six months | 2 | 92 | Risk Ratio (M‐H, Random, 95% CI) | 0.33 [0.01, 7.78] |
| 7.4 Insufficient food intake during the last week (50% of requirements or less) | 0 | 0 | Risk Ratio (M‐H, Random, 95% CI) | 0.0 [0.0, 0.0] |
| 7.5 Participants characterised as 'at nutritional risk' by other means | 54 | 8171 | Risk Ratio (M‐H, Random, 95% CI) | 0.98 [0.90, 1.07] |
| 8 Serious adverse events ‐ participants characterised as 'at nutritional risk' due to biomarkers or anthropometrics Show forest plot | 56 | 8263 | Risk Ratio (M‐H, Random, 95% CI) | 0.98 [0.90, 1.07] |
| 8.1 Biomarkers | 6 | 184 | Risk Ratio (M‐H, Random, 95% CI) | 0.45 [0.13, 1.57] |
| 8.2 Anthropometric measures | 3 | 137 | Risk Ratio (M‐H, Random, 95% CI) | 0.74 [0.29, 1.89] |
| 8.3 Both | 3 | 75 | Risk Ratio (M‐H, Random, 95% CI) | 0.66 [0.14, 3.07] |
| 8.4 Characterised by other means | 44 | 7867 | Risk Ratio (M‐H, Random, 95% CI) | 0.99 [0.90, 1.08] |
| 9 Serious adverse events ‐ randomisation year Show forest plot | 56 | 8263 | Risk Ratio (M‐H, Random, 95% CI) | 0.98 [0.90, 1.07] |
| 9.1 Before 1960 | 0 | 0 | Risk Ratio (M‐H, Random, 95% CI) | 0.0 [0.0, 0.0] |
| 9.2 1960 to 1979 | 4 | 154 | Risk Ratio (M‐H, Random, 95% CI) | 1.38 [0.67, 2.83] |
| 9.3 1980 to 1999 | 44 | 2442 | Risk Ratio (M‐H, Random, 95% CI) | 0.98 [0.88, 1.10] |
| 9.4 After 1999 | 8 | 5667 | Risk Ratio (M‐H, Random, 95% CI) | 0.96 [0.83, 1.12] |
| 10 Serious adverse events ‐ trials where the intervention lasts fewer than three days compared with trials where the intervention lasts three days or more Show forest plot | 56 | 8263 | Risk Ratio (M‐H, Random, 95% CI) | 0.98 [0.90, 1.07] |
| 10.1 Three days or more | 54 | 8156 | Risk Ratio (M‐H, Random, 95% CI) | 0.98 [0.89, 1.07] |
| 10.2 Less than three days | 1 | 80 | Risk Ratio (M‐H, Random, 95% CI) | 1.2 [0.59, 2.45] |
| 10.3 Unknown | 1 | 27 | Risk Ratio (M‐H, Random, 95% CI) | 0.0 [0.0, 0.0] |
| 11 Serious adverse events ‐ 'best‐worst case' scenario Show forest plot | 56 | 8452 | Risk Ratio (M‐H, Random, 95% CI) | 0.80 [0.68, 0.94] |
| 12 Serious adverse events ‐ 'worst‐best case' scenario Show forest plot | 56 | 8452 | Risk Ratio (M‐H, Random, 95% CI) | 1.12 [0.96, 1.30] |
| 13 Serious adverse events co‐interventions Show forest plot | 56 | 8263 | Risk Ratio (M‐H, Fixed, 95% CI) | 0.94 [0.85, 1.04] |
| 13.1 Received nutrition support as co‐intervention | 6 | 5164 | Risk Ratio (M‐H, Fixed, 95% CI) | 0.97 [0.85, 1.12] |
| 13.2 did not receive nutrition support as co‐intervention | 49 | 3019 | Risk Ratio (M‐H, Fixed, 95% CI) | 0.90 [0.77, 1.04] |
| 13.3 delayed versus early nutrition support | 1 | 80 | Risk Ratio (M‐H, Fixed, 95% CI) | 1.2 [0.59, 2.45] |
| Outcome or subgroup title | No. of studies | No. of participants | Statistical method | Effect size |
| 1 Morbidity ‐ overall Show forest plot | 1 | 124 | Risk Ratio (M‐H, Random, 95% CI) | 0.63 [0.42, 0.94] |
| Outcome or subgroup title | No. of studies | No. of participants | Statistical method | Effect size |
| 1 Morbidity ‐ overall Show forest plot | 2 | 245 | Risk Ratio (M‐H, Random, 95% CI) | 0.71 [0.53, 0.95] |
| Outcome or subgroup title | No. of studies | No. of participants | Statistical method | Effect size |
| 1 BMI ‐ overall Show forest plot | 15 | 1008 | Mean Difference (IV, Random, 95% CI) | 0.57 [0.38, 0.77] |
| 2 BMI ‐ bias Show forest plot | 15 | 1008 | Mean Difference (IV, Random, 95% CI) | 0.57 [0.38, 0.77] |
| 2.1 High risk of bias | 15 | 1008 | Mean Difference (IV, Random, 95% CI) | 0.57 [0.38, 0.77] |
| 2.2 Low risk of bias | 0 | 0 | Mean Difference (IV, Random, 95% CI) | 0.0 [0.0, 0.0] |
| 3 BMI ‐ mode of administration Show forest plot | 15 | 1008 | Mean Difference (IV, Random, 95% CI) | 0.57 [0.38, 0.77] |
| 3.1 General nutrition support | 1 | 132 | Mean Difference (IV, Random, 95% CI) | 1.0 [‐0.67, 2.67] |
| 3.2 Fortified nutrition | 1 | 146 | Mean Difference (IV, Random, 95% CI) | 1.10 [‐0.24, 2.44] |
| 3.3 Oral nutrition support | 7 | 363 | Mean Difference (IV, Random, 95% CI) | 0.63 [‐0.09, 1.35] |
| 3.4 Enteral nutrition | 5 | 288 | Mean Difference (IV, Random, 95% CI) | 0.53 [0.32, 0.75] |
| 3.5 Parenteral nutrition | 0 | 0 | Mean Difference (IV, Random, 95% CI) | 0.0 [0.0, 0.0] |
| 3.6 Mixed nutrition support | 1 | 79 | Mean Difference (IV, Random, 95% CI) | 1.12 [‐0.15, 2.39] |
| 4 BMI ‐ by medical delivery Show forest plot | 15 | 1008 | Mean Difference (IV, Random, 95% CI) | 0.57 [0.38, 0.77] |
| 4.1 Cardiology | 0 | 0 | Mean Difference (IV, Random, 95% CI) | 0.0 [0.0, 0.0] |
| 4.2 Medical gastroenterology and hepatology | 2 | 101 | Mean Difference (IV, Random, 95% CI) | 1.77 [‐0.19, 3.72] |
| 4.3 Geriatrics | 3 | 227 | Mean Difference (IV, Random, 95% CI) | 0.86 [‐0.10, 1.82] |
| 4.4 Pulmonary disease | 0 | 0 | Mean Difference (IV, Random, 95% CI) | 0.0 [0.0, 0.0] |
| 4.5 Endocrinology | 0 | 0 | Mean Difference (IV, Random, 95% CI) | 0.0 [0.0, 0.0] |
| 4.6 Infectious diseases | 0 | 0 | Mean Difference (IV, Random, 95% CI) | 0.0 [0.0, 0.0] |
| 4.7 Rheumatology | 0 | 0 | Mean Difference (IV, Random, 95% CI) | 0.0 [0.0, 0.0] |
| 4.8 Haematology | 0 | 0 | Mean Difference (IV, Random, 95% CI) | 0.0 [0.0, 0.0] |
| 4.9 Nephrology | 0 | 0 | Mean Difference (IV, Random, 95% CI) | 0.0 [0.0, 0.0] |
| 4.10 Gastroenterologic surgery | 5 | 279 | Mean Difference (IV, Random, 95% CI) | 0.48 [0.25, 0.70] |
| 4.11 Trauma surgery | 2 | 184 | Mean Difference (IV, Random, 95% CI) | 0.64 [0.10, 1.18] |
| 4.12 Ortopaedics | 0 | 0 | Mean Difference (IV, Random, 95% CI) | 0.0 [0.0, 0.0] |
| 4.13 Plastic, reconstructive, and aesthetic surgery | 1 | 37 | Mean Difference (IV, Random, 95% CI) | 1.30 [0.04, 2.56] |
| 4.14 Vascular surgery | 0 | 0 | Mean Difference (IV, Random, 95% CI) | 0.0 [0.0, 0.0] |
| 4.15 Transplant surgery | 0 | 0 | Mean Difference (IV, Random, 95% CI) | 0.0 [0.0, 0.0] |
| 4.16 Urology | 0 | 0 | Mean Difference (IV, Random, 95% CI) | 0.0 [0.0, 0.0] |
| 4.17 Thoracic surgery | 0 | 0 | Mean Difference (IV, Random, 95% CI) | 0.0 [0.0, 0.0] |
| 4.18 Neurological surgery | 0 | 0 | Mean Difference (IV, Random, 95% CI) | 0.0 [0.0, 0.0] |
| 4.19 Oro‐maxillo‐facial surgery | 0 | 0 | Mean Difference (IV, Random, 95% CI) | 0.0 [0.0, 0.0] |
| 4.20 Anaesthesiology | 0 | 0 | Mean Difference (IV, Random, 95% CI) | 0.0 [0.0, 0.0] |
| 4.21 Emergency medicine | 0 | 0 | Mean Difference (IV, Random, 95% CI) | 0.0 [0.0, 0.0] |
| 4.22 Psychiatry | 0 | 0 | Mean Difference (IV, Random, 95% CI) | 0.0 [0.0, 0.0] |
| 4.23 Neurology | 1 | 48 | Mean Difference (IV, Random, 95% CI) | 1.0 [‐1.11, 3.11] |
| 4.24 Oncology | 0 | 0 | Mean Difference (IV, Random, 95% CI) | 0.0 [0.0, 0.0] |
| 4.25 Dermatology | 0 | 0 | Mean Difference (IV, Random, 95% CI) | 0.0 [0.0, 0.0] |
| 4.26 Gynaecology | 0 | 0 | Mean Difference (IV, Random, 95% CI) | 0.0 [0.0, 0.0] |
| 4.27 Mixed | 1 | 132 | Mean Difference (IV, Random, 95% CI) | 1.0 [‐0.67, 2.67] |
| 5 BMI ‐ based on adequacy of the amount of calories Show forest plot | 15 | 1008 | Mean Difference (IV, Random, 95% CI) | 0.57 [0.38, 0.77] |
| 5.1 Clearly adequate in intervention and clearly inadequate in control | 7 | 544 | Mean Difference (IV, Random, 95% CI) | 0.90 [0.23, 1.58] |
| 5.2 Inadequate in the experimental or adequate in the control | 1 | 37 | Mean Difference (IV, Random, 95% CI) | 1.30 [0.04, 2.56] |
| 5.3 Experimental group is overfed | 1 | 46 | Mean Difference (IV, Random, 95% CI) | 0.0 [0.0, 0.0] |
| 5.4 Unclear intake in control or experimental | 6 | 381 | Mean Difference (IV, Random, 95% CI) | 0.52 [0.31, 0.73] |
| 6 BMI ‐ different screening tools Show forest plot | 15 | 1008 | Mean Difference (IV, Random, 95% CI) | 0.57 [0.38, 0.77] |
| 6.1 NRS 2002 | 2 | 211 | Mean Difference (IV, Random, 95% CI) | 1.08 [0.06, 2.09] |
| 6.2 MUST | 0 | 0 | Mean Difference (IV, Random, 95% CI) | 0.0 [0.0, 0.0] |
| 6.3 MNA | 1 | 35 | Mean Difference (IV, Random, 95% CI) | 0.60 [‐0.78, 1.98] |
| 6.4 SGA | 0 | 0 | Mean Difference (IV, Random, 95% CI) | 0.0 [0.0, 0.0] |
| 6.5 Other means | 12 | 762 | Mean Difference (IV, Random, 95% CI) | 0.55 [0.35, 0.76] |
| 7 BMI ‐ participants characterised as 'at nutritional risk' due to one of the following conditions Show forest plot | 15 | 1008 | Mean Difference (IV, Random, 95% CI) | 0.57 [0.38, 0.77] |
| 7.1 Major surgery | 6 | 316 | Mean Difference (IV, Random, 95% CI) | 0.50 [0.28, 0.73] |
| 7.2 Stroke | 1 | 48 | Mean Difference (IV, Random, 95% CI) | 1.0 [‐1.11, 3.11] |
| 7.3 ICU participants including trauma | 1 | 64 | Mean Difference (IV, Random, 95% CI) | 0.40 [‐1.22, 2.02] |
| 7.4 Frail elderly participants with less severe conditions known to increase protein requirements | 2 | 199 | Mean Difference (IV, Random, 95% CI) | 0.75 [0.22, 1.27] |
| 7.5 Participants do not fall into one of the categories above | 5 | 381 | Mean Difference (IV, Random, 95% CI) | 1.06 [0.26, 1.87] |
| 8 BMI ‐ participants characterised as 'at nutritional risk' due to one of the following criteria Show forest plot | 15 | 1008 | Mean Difference (IV, Random, 95% CI) | 0.57 [0.38, 0.77] |
| 8.1 BMI less than 20.5 kg/m2 | 3 | 229 | Mean Difference (IV, Random, 95% CI) | 1.21 [0.29, 2.12] |
| 8.2 Weight loss of at least 5% during the last three months | 0 | 0 | Mean Difference (IV, Random, 95% CI) | 0.0 [0.0, 0.0] |
| 8.3 Weight loss of at least 10% during the last six months | 0 | 0 | Mean Difference (IV, Random, 95% CI) | 0.0 [0.0, 0.0] |
| 8.4 Insufficient food intake during the last week (50% of requirements or less) | 0 | 0 | Mean Difference (IV, Random, 95% CI) | 0.0 [0.0, 0.0] |
| 8.5 Participants characterised as 'at nutritional risk' by other means | 12 | 779 | Mean Difference (IV, Random, 95% CI) | 0.54 [0.34, 0.75] |
| 9 BMI ‐ participants characterised as 'at nutritional risk' due to biomarkers of anthropometrics Show forest plot | 15 | 1008 | Mean Difference (IV, Random, 95% CI) | 0.57 [0.38, 0.77] |
| 9.1 Biomarkers | 0 | 0 | Mean Difference (IV, Random, 95% CI) | 0.0 [0.0, 0.0] |
| 9.2 Anthropometric measures | 3 | 229 | Mean Difference (IV, Random, 95% CI) | 1.21 [0.29, 2.12] |
| 9.3 Characterised by other means | 12 | 779 | Mean Difference (IV, Random, 95% CI) | 0.54 [0.34, 0.75] |
| 10 BMI ‐ randomisation year Show forest plot | 15 | 1008 | Mean Difference (IV, Random, 95% CI) | 0.57 [0.38, 0.77] |
| 10.1 Before 1960 | 0 | 0 | Mean Difference (IV, Random, 95% CI) | 0.0 [0.0, 0.0] |
| 10.2 1960 to 1979 | 0 | 0 | Mean Difference (IV, Random, 95% CI) | 0.0 [0.0, 0.0] |
| 10.3 1980 to 1999 | 4 | 182 | Mean Difference (IV, Random, 95% CI) | 1.03 [‐0.91, 2.97] |
| 10.4 After 1999 | 11 | 826 | Mean Difference (IV, Random, 95% CI) | 0.56 [0.36, 0.76] |
| 11 BMI ‐ trials where the intervention lasts fewer than three days compared with trials where the intervention lasts three days or more Show forest plot | 15 | 1008 | Mean Difference (IV, Random, 95% CI) | 0.57 [0.38, 0.77] |
| 11.1 Three days or more | 15 | 1008 | Mean Difference (IV, Random, 95% CI) | 0.57 [0.38, 0.77] |
| 11.2 Less than three days | 0 | 0 | Mean Difference (IV, Random, 95% CI) | 0.0 [0.0, 0.0] |
| Outcome or subgroup title | No. of studies | No. of participants | Statistical method | Effect size |
| 1 BMI ‐ overall Show forest plot | 20 | 1528 | Mean Difference (IV, Random, 95% CI) | 0.40 [‐0.02, 0.83] |
| 2 BMI ‐ bias Show forest plot | 20 | 1528 | Mean Difference (IV, Random, 95% CI) | 0.44 [0.02, 0.87] |
| 2.1 High risk of bias | 20 | 1528 | Mean Difference (IV, Random, 95% CI) | 0.44 [0.02, 0.87] |
| 2.2 Low risk of bias | 0 | 0 | Mean Difference (IV, Random, 95% CI) | 0.0 [0.0, 0.0] |
| 3 BMI ‐ mode of delivery Show forest plot | 20 | 1528 | Mean Difference (IV, Random, 95% CI) | 0.44 [0.02, 0.87] |
| 3.1 General nutrition support | 2 | 196 | Mean Difference (IV, Random, 95% CI) | 0.92 [0.26, 1.57] |
| 3.2 Fortified nutrition | 1 | 146 | Mean Difference (IV, Random, 95% CI) | 1.10 [‐0.24, 2.44] |
| 3.3 Oral nutrition support | 8 | 588 | Mean Difference (IV, Random, 95% CI) | 0.43 [‐0.16, 1.02] |
| 3.4 Enteral nutrition | 8 | 519 | Mean Difference (IV, Random, 95% CI) | 0.17 [‐0.60, 0.93] |
| 3.5 Parenteral nutrition | 0 | 0 | Mean Difference (IV, Random, 95% CI) | 0.0 [0.0, 0.0] |
| 3.6 Mixed nutrition support | 1 | 79 | Mean Difference (IV, Random, 95% CI) | 1.12 [‐0.15, 2.39] |
| 4 BMI ‐ by medical speciality Show forest plot | 20 | 1528 | Mean Difference (IV, Random, 95% CI) | 0.44 [0.02, 0.87] |
| 4.1 Cardiology | 0 | 0 | Mean Difference (IV, Random, 95% CI) | 0.0 [0.0, 0.0] |
| 4.2 Medical gastroenterology and hepatology | 3 | 201 | Mean Difference (IV, Random, 95% CI) | 1.02 [0.13, 1.90] |
| 4.3 Geriatrics | 4 | 452 | Mean Difference (IV, Random, 95% CI) | 0.47 [‐0.24, 1.17] |
| 4.4 Pulmonary disease | 0 | 0 | Mean Difference (IV, Random, 95% CI) | 0.0 [0.0, 0.0] |
| 4.5 Endocrinology | 0 | 0 | Mean Difference (IV, Random, 95% CI) | 0.0 [0.0, 0.0] |
| 4.6 Infectious diseases | 0 | 0 | Mean Difference (IV, Random, 95% CI) | 0.0 [0.0, 0.0] |
| 4.7 Rheumatology | 0 | 0 | Mean Difference (IV, Random, 95% CI) | 0.0 [0.0, 0.0] |
| 4.8 Haematology | 0 | 0 | Mean Difference (IV, Random, 95% CI) | 0.0 [0.0, 0.0] |
| 4.9 Nephrology | 0 | 0 | Mean Difference (IV, Random, 95% CI) | 0.0 [0.0, 0.0] |
| 4.10 Gastroenterologic surgery | 6 | 346 | Mean Difference (IV, Random, 95% CI) | ‐0.52 [‐2.16, 1.11] |
| 4.11 Trauma surgery | 2 | 184 | Mean Difference (IV, Random, 95% CI) | 0.64 [0.10, 1.18] |
| 4.12 Ortopaedics | 0 | 0 | Mean Difference (IV, Random, 95% CI) | 0.0 [0.0, 0.0] |
| 4.13 Plastic, reconstructive, and aesthetic surgery | 1 | 37 | Mean Difference (IV, Random, 95% CI) | 1.30 [0.04, 2.56] |
| 4.14 Vascular surgery | 0 | 0 | Mean Difference (IV, Random, 95% CI) | 0.0 [0.0, 0.0] |
| 4.15 Transplant surgery | 0 | 0 | Mean Difference (IV, Random, 95% CI) | 0.0 [0.0, 0.0] |
| 4.16 Urology | 0 | 0 | Mean Difference (IV, Random, 95% CI) | 0.0 [0.0, 0.0] |
| 4.17 Thoracic surgery | 0 | 0 | Mean Difference (IV, Random, 95% CI) | 0.0 [0.0, 0.0] |
| 4.18 Neurological surgery | 0 | 0 | Mean Difference (IV, Random, 95% CI) | 0.0 [0.0, 0.0] |
| 4.19 Oro‐maxillo‐facial surgery | 0 | 0 | Mean Difference (IV, Random, 95% CI) | 0.0 [0.0, 0.0] |
| 4.20 Anaesthesiology | 0 | 0 | Mean Difference (IV, Random, 95% CI) | 0.0 [0.0, 0.0] |
| 4.21 Emergency medicine | 0 | 0 | Mean Difference (IV, Random, 95% CI) | 0.0 [0.0, 0.0] |
| 4.22 Psychiatry | 0 | 0 | Mean Difference (IV, Random, 95% CI) | 0.0 [0.0, 0.0] |
| 4.23 Neurology | 2 | 112 | Mean Difference (IV, Random, 95% CI) | 0.91 [0.24, 1.58] |
| 4.24 Oncology | 1 | 64 | Mean Difference (IV, Random, 95% CI) | 0.40 [‐1.40, 2.20] |
| 4.25 Dermatology | 0 | 0 | Mean Difference (IV, Random, 95% CI) | 0.0 [0.0, 0.0] |
| 4.26 Gynaecology | 0 | 0 | Mean Difference (IV, Random, 95% CI) | 0.0 [0.0, 0.0] |
| 4.27 Mixed | 1 | 132 | Mean Difference (IV, Random, 95% CI) | 1.0 [‐0.67, 2.67] |
| 5 BMI ‐ based on adequacy of the amount of calories Show forest plot | 20 | 1528 | Mean Difference (IV, Random, 95% CI) | 0.40 [‐0.02, 0.83] |
| 5.1 Clearly adequate in intervention and clearly inadequate in control | 9 | 686 | Mean Difference (IV, Random, 95% CI) | 0.54 [0.33, 0.74] |
| 5.2 Inadequate in the experimental or adequate in the control | 2 | 101 | Mean Difference (IV, Random, 95% CI) | 1.00 [0.38, 1.61] |
| 5.3 Experimental group is overfed | 1 | 46 | Mean Difference (IV, Random, 95% CI) | 0.0 [0.0, 0.0] |
| 5.4 Unclear intake in control or experimental | 8 | 695 | Mean Difference (IV, Random, 95% CI) | ‐0.04 [‐1.11, 1.03] |
| 6 BMI ‐ different screening tools Show forest plot | 20 | 1528 | Mean Difference (IV, Random, 95% CI) | 0.44 [0.02, 0.87] |
| 6.1 NRS 2002 | 2 | 211 | Mean Difference (IV, Random, 95% CI) | 1.08 [0.06, 2.09] |
| 6.2 MUST | 1 | 64 | Mean Difference (IV, Random, 95% CI) | 0.90 [0.19, 1.61] |
| 6.3 MNA | 1 | 35 | Mean Difference (IV, Random, 95% CI) | 0.60 [‐0.78, 1.98] |
| 6.4 SGA | 0 | 0 | Mean Difference (IV, Random, 95% CI) | 0.0 [0.0, 0.0] |
| 6.5 Other means | 16 | 1218 | Mean Difference (IV, Random, 95% CI) | 0.30 [‐0.22, 0.83] |
| 7 BMI ‐ participants characterised as 'at nutritional risk' due to one of the following conditions Show forest plot | 20 | 1528 | Mean Difference (IV, Random, 95% CI) | 0.44 [0.02, 0.87] |
| 7.1 Major surgery | 7 | 383 | Mean Difference (IV, Random, 95% CI) | ‐0.23 [‐1.55, 1.09] |
| 7.2 Stroke | 2 | 112 | Mean Difference (IV, Random, 95% CI) | 0.91 [0.24, 1.58] |
| 7.3 ICU participants including trauma | 1 | 64 | Mean Difference (IV, Random, 95% CI) | 0.40 [‐1.22, 2.02] |
| 7.4 Frail elderly participants with less severe conditions known to increase protein requirements | 2 | 199 | Mean Difference (IV, Random, 95% CI) | 0.75 [0.22, 1.27] |
| 7.5 Participants do not fall into one of the categories above | 8 | 770 | Mean Difference (IV, Random, 95% CI) | 0.65 [0.22, 1.09] |
| 8 BMI ‐ participants characterised as 'at nutritional risk' due to one of the following criteria Show forest plot | 20 | 1528 | Mean Difference (IV, Random, 95% CI) | 0.44 [0.02, 0.87] |
| 8.1 BMI less than 20.5 kg/m2 | 3 | 229 | Mean Difference (IV, Random, 95% CI) | 1.21 [0.29, 2.12] |
| 8.2 Weight loss of at least 5% during the last three months | 0 | 0 | Mean Difference (IV, Random, 95% CI) | 0.0 [0.0, 0.0] |
| 8.3 Weight loss of at least 10% during the last six months | 0 | 0 | Mean Difference (IV, Random, 95% CI) | 0.0 [0.0, 0.0] |
| 8.4 Insufficient food intake during the last week (50% of requirements or less) | 0 | 0 | Mean Difference (IV, Random, 95% CI) | 0.0 [0.0, 0.0] |
| 8.5 Participants characterised as 'at nutritional risk' by other means | 17 | 1299 | Mean Difference (IV, Random, 95% CI) | 0.35 [‐0.11, 0.81] |
| 9 BMI ‐ participants characterised as 'at nutritional risk' due to biomarkers or anthropometrics Show forest plot | 20 | 1528 | Mean Difference (IV, Random, 95% CI) | 0.44 [0.02, 0.87] |
| 9.1 Biomarkers | 0 | 0 | Mean Difference (IV, Random, 95% CI) | 0.0 [0.0, 0.0] |
| 9.2 Anthropometric measures | 3 | 229 | Mean Difference (IV, Random, 95% CI) | 1.21 [0.29, 2.12] |
| 9.3 Characterised by other means | 17 | 1299 | Mean Difference (IV, Random, 95% CI) | 0.35 [‐0.11, 0.81] |
| 10 BMI ‐ randomisation year Show forest plot | 20 | 1528 | Mean Difference (IV, Random, 95% CI) | 0.44 [0.02, 0.87] |
| 10.1 Before 1960 | 0 | 0 | Mean Difference (IV, Random, 95% CI) | 0.0 [0.0, 0.0] |
| 10.2 1960 to 1979 | 0 | 0 | Mean Difference (IV, Random, 95% CI) | 0.0 [0.0, 0.0] |
| 10.3 1980 to 1999 | 5 | 249 | Mean Difference (IV, Random, 95% CI) | 0.02 [‐2.62, 2.67] |
| 10.4 After 1999 | 15 | 1279 | Mean Difference (IV, Random, 95% CI) | 0.57 [0.39, 0.75] |
| 11 BMI ‐ trials where the intervention lasts fewer than three days compared with trials where the intervention lasts three days or more Show forest plot | 20 | 1528 | Mean Difference (IV, Random, 95% CI) | 0.44 [0.02, 0.87] |
| 11.1 Three days or more | 20 | 1528 | Mean Difference (IV, Random, 95% CI) | 0.44 [0.02, 0.87] |
| 11.2 Less than three days | 0 | 0 | Mean Difference (IV, Random, 95% CI) | 0.0 [0.0, 0.0] |
| Outcome or subgroup title | No. of studies | No. of participants | Statistical method | Effect size |
| 1 Weight ‐ overall Show forest plot | 81 | 5445 | Mean Difference (IV, Random, 95% CI) | 1.32 [0.65, 2.00] |
| 2 Weight ‐ bias Show forest plot | 81 | 5445 | Mean Difference (IV, Random, 95% CI) | 1.32 [0.65, 2.00] |
| 2.1 High risk of bias | 81 | 5445 | Mean Difference (IV, Random, 95% CI) | 1.32 [0.65, 2.00] |
| 2.2 Low risk of bias | 0 | 0 | Mean Difference (IV, Random, 95% CI) | 0.0 [0.0, 0.0] |
| 3 Weight ‐ mode of delivery Show forest plot | 81 | 5445 | Mean Difference (IV, Random, 95% CI) | 1.32 [0.65, 2.00] |
| 3.1 General nutrition support | 4 | 962 | Mean Difference (IV, Random, 95% CI) | ‐0.00 [‐0.17, 0.16] |
| 3.2 Fortified nutrition | 2 | 230 | Mean Difference (IV, Random, 95% CI) | 1.45 [‐0.92, 3.83] |
| 3.3 Oral nutrition support | 31 | 1924 | Mean Difference (IV, Random, 95% CI) | 0.33 [‐0.21, 0.87] |
| 3.4 Enteral nutrition | 26 | 1616 | Mean Difference (IV, Random, 95% CI) | 2.62 [1.23, 4.01] |
| 3.5 Parenteral nutrition | 17 | 667 | Mean Difference (IV, Random, 95% CI) | 1.48 [‐0.20, 3.15] |
| 3.6 Mixed nutrition support | 1 | 46 | Mean Difference (IV, Random, 95% CI) | ‐3.90 [‐4.45, ‐3.35] |
| 4 Weight ‐ by medical speciality Show forest plot | 81 | 5445 | Mean Difference (IV, Random, 95% CI) | 1.32 [0.65, 2.00] |
| 4.1 Cardiology | 0 | 0 | Mean Difference (IV, Random, 95% CI) | 0.0 [0.0, 0.0] |
| 4.2 Medical gastroenterology and hepatology | 7 | 345 | Mean Difference (IV, Random, 95% CI) | 0.88 [‐0.03, 1.79] |
| 4.3 Geriatrics | 10 | 1422 | Mean Difference (IV, Random, 95% CI) | 0.62 [‐0.30, 1.54] |
| 4.4 Pulmonary disease | 4 | 91 | Mean Difference (IV, Random, 95% CI) | 0.95 [‐0.43, 2.33] |
| 4.5 Endocrinology | 0 | 0 | Mean Difference (IV, Random, 95% CI) | 0.0 [0.0, 0.0] |
| 4.6 Infectious diseases | 0 | 0 | Mean Difference (IV, Random, 95% CI) | 0.0 [0.0, 0.0] |
| 4.7 Rheumatology | 0 | 0 | Mean Difference (IV, Random, 95% CI) | 0.0 [0.0, 0.0] |
| 4.8 Haematology | 0 | 0 | Mean Difference (IV, Random, 95% CI) | 0.0 [0.0, 0.0] |
| 4.9 Nephrology | 0 | 0 | Mean Difference (IV, Random, 95% CI) | 0.0 [0.0, 0.0] |
| 4.10 Gastroenterologic surgery | 35 | 1423 | Mean Difference (IV, Random, 95% CI) | 1.26 [‐0.12, 2.63] |
| 4.11 Trauma surgery | 0 | 0 | Mean Difference (IV, Random, 95% CI) | 0.0 [0.0, 0.0] |
| 4.12 Ortopaedics | 7 | 395 | Mean Difference (IV, Random, 95% CI) | 2.79 [1.36, 4.23] |
| 4.13 Plastic, reconstructive, and aesthetic surgery | 0 | 0 | Mean Difference (IV, Random, 95% CI) | 0.0 [0.0, 0.0] |
| 4.14 Vascular surgery | 0 | 0 | Mean Difference (IV, Random, 95% CI) | 0.0 [0.0, 0.0] |
| 4.15 Transplant surgery | 1 | 29 | Mean Difference (IV, Random, 95% CI) | ‐4.60 [‐15.21, 6.01] |
| 4.16 Urology | 0 | 0 | Mean Difference (IV, Random, 95% CI) | 0.0 [0.0, 0.0] |
| 4.17 Thoracic surgery | 2 | 548 | Mean Difference (IV, Random, 95% CI) | 0.06 [‐2.39, 2.51] |
| 4.18 Neurological surgery | 1 | 48 | Mean Difference (IV, Random, 95% CI) | 10.53 [6.72, 14.34] |
| 4.19 Oro‐maxillo‐facial surgery | 1 | 32 | Mean Difference (IV, Random, 95% CI) | 0.6 [‐1.10, 2.30] |
| 4.20 Anaesthesiology | 0 | 0 | Mean Difference (IV, Random, 95% CI) | 0.0 [0.0, 0.0] |
| 4.21 Emergency medicine | 0 | 0 | Mean Difference (IV, Random, 95% CI) | 0.0 [0.0, 0.0] |
| 4.22 Psychiatry | 0 | 0 | Mean Difference (IV, Random, 95% CI) | 0.0 [0.0, 0.0] |
| 4.23 Neurology | 5 | 247 | Mean Difference (IV, Random, 95% CI) | 0.74 [‐2.15, 3.63] |
| 4.24 Oncology | 1 | 23 | Mean Difference (IV, Random, 95% CI) | ‐1.0 [‐7.41, 5.41] |
| 4.25 Dermatology | 0 | 0 | Mean Difference (IV, Random, 95% CI) | 0.0 [0.0, 0.0] |
| 4.26 Gynaecology | 0 | 0 | Mean Difference (IV, Random, 95% CI) | 0.0 [0.0, 0.0] |
| 4.27 Mixed | 7 | 842 | Mean Difference (IV, Random, 95% CI) | 0.21 [‐0.58, 1.00] |
| 5 Weight ‐ based on adequacy of the amount of calories Show forest plot | 81 | 5445 | Mean Difference (IV, Random, 95% CI) | 1.32 [0.65, 2.00] |
| 5.1 Clearly adequate in intervention and clearly inadequate in control | 20 | 1287 | Mean Difference (IV, Random, 95% CI) | 1.46 [‐0.19, 3.12] |
| 5.2 Inadequate in the experimental or adequate in the control | 19 | 1626 | Mean Difference (IV, Random, 95% CI) | 0.79 [0.06, 1.51] |
| 5.3 Experimental group is overfed | 5 | 151 | Mean Difference (IV, Random, 95% CI) | 0.64 [‐0.86, 2.13] |
| 5.4 Unclear intake in control or experimental | 37 | 2381 | Mean Difference (IV, Random, 95% CI) | 1.61 [0.50, 2.72] |
| 6 Weight ‐ different screening tools Show forest plot | 81 | 5445 | Mean Difference (IV, Random, 95% CI) | 1.32 [0.65, 2.00] |
| 6.1 NRS 2002 | 4 | 353 | Mean Difference (IV, Random, 95% CI) | 1.12 [‐0.29, 2.53] |
| 6.2 MUST | 0 | 0 | Mean Difference (IV, Random, 95% CI) | 0.0 [0.0, 0.0] |
| 6.3 MNA | 2 | 104 | Mean Difference (IV, Random, 95% CI) | 1.45 [‐0.02, 2.91] |
| 6.4 SGA | 2 | 445 | Mean Difference (IV, Random, 95% CI) | ‐0.65 [‐3.30, 2.00] |
| 6.5 Other means | 73 | 4543 | Mean Difference (IV, Random, 95% CI) | 1.41 [0.68, 2.15] |
| 7 Weight ‐ participants characterised as 'at nutritional risk' due to one of the following conditions Show forest plot | 81 | 5445 | Mean Difference (IV, Random, 95% CI) | 1.32 [0.65, 2.00] |
| 7.1 Major surgery | 40 | 2213 | Mean Difference (IV, Random, 95% CI) | 1.24 [0.11, 2.37] |
| 7.2 Stroke | 3 | 181 | Mean Difference (IV, Random, 95% CI) | 0.39 [‐2.75, 3.54] |
| 7.3 ICU participants including trauma | 0 | 0 | Mean Difference (IV, Random, 95% CI) | 0.0 [0.0, 0.0] |
| 7.4 Frail elderly participants with less severe conditions known to increase protein requirements | 8 | 1256 | Mean Difference (IV, Random, 95% CI) | 1.83 [0.71, 2.96] |
| 7.5 Participants do not fall into one of the categories above | 30 | 1795 | Mean Difference (IV, Random, 95% CI) | 0.93 [0.38, 1.48] |
| 8 Weight ‐ participants characterised as 'at nutritional risk' due to one of the following criteria Show forest plot | 81 | 5445 | Mean Difference (IV, Random, 95% CI) | 1.32 [0.65, 2.00] |
| 8.1 BMI less than 20.5 kg/m2 | 5 | 309 | Mean Difference (IV, Random, 95% CI) | 3.97 [1.06, 6.89] |
| 8.2 Weight loss of at least 5% during the last three months | 0 | 0 | Mean Difference (IV, Random, 95% CI) | 0.0 [0.0, 0.0] |
| 8.3 Weight loss of at least 10% during the last six months | 2 | 79 | Mean Difference (IV, Random, 95% CI) | 0.30 [‐0.36, 0.96] |
| 8.4 Insufficient food intake during the last week (50% of requirements or less) | 0 | 0 | Mean Difference (IV, Random, 95% CI) | 0.0 [0.0, 0.0] |
| 8.5 Participants characterised as 'at nutritional risk' by other means | 74 | 5057 | Mean Difference (IV, Random, 95% CI) | 1.30 [0.59, 2.00] |
| 9 Weight ‐ participants characterised as 'at nutritional risk' due to biomarkers or anthropometrics Show forest plot | 81 | 5445 | Mean Difference (IV, Random, 95% CI) | 1.32 [0.65, 2.00] |
| 9.1 Biomarkers | 9 | 750 | Mean Difference (IV, Random, 95% CI) | 4.37 [2.16, 6.58] |
| 9.2 Anthropometric measures | 15 | 996 | Mean Difference (IV, Random, 95% CI) | 1.04 [‐0.15, 2.23] |
| 9.3 Characterised by other means | 54 | 3639 | Mean Difference (IV, Random, 95% CI) | 0.66 [0.13, 1.20] |
| 9.4 Mixed | 3 | 60 | Mean Difference (IV, Random, 95% CI) | ‐0.37 [‐1.95, 1.22] |
| 10 Weight ‐ randomisation year Show forest plot | 81 | 5445 | Mean Difference (IV, Random, 95% CI) | 1.32 [0.65, 2.00] |
| 10.1 Before 1960 | 0 | 0 | Mean Difference (IV, Random, 95% CI) | 0.0 [0.0, 0.0] |
| 10.2 1960 to 1979 | 1 | 21 | Mean Difference (IV, Random, 95% CI) | 3.85 [1.69, 6.01] |
| 10.3 1980 to 1999 | 48 | 2365 | Mean Difference (IV, Random, 95% CI) | 1.23 [0.24, 2.22] |
| 10.4 After 1999 | 32 | 3059 | Mean Difference (IV, Random, 95% CI) | 1.07 [0.35, 1.79] |
| 11 Weight ‐ trials where the intervention lasts fewer than three days compared with trials where the intervention lasts three days or more Show forest plot | 81 | 5445 | Mean Difference (IV, Random, 95% CI) | 1.32 [0.65, 2.00] |
| 11.1 Three days or more | 76 | 5287 | Mean Difference (IV, Random, 95% CI) | 1.40 [0.70, 2.10] |
| 11.2 Less than three days | 5 | 158 | Mean Difference (IV, Random, 95% CI) | 0.15 [‐1.62, 1.92] |
| 12 Weight ‐ Missing SDs Show forest plot | 81 | 5445 | Mean Difference (IV, Random, 95% CI) | 1.40 [0.76, 2.03] |
| 12.1 missing SDs imputed from all trials | 81 | 5445 | Mean Difference (IV, Random, 95% CI) | 1.40 [0.76, 2.03] |
| Outcome or subgroup title | No. of studies | No. of participants | Statistical method | Effect size |
| 1 Weight ‐ overall Show forest plot | 94 | 6916 | Mean Difference (IV, Random, 95% CI) | 1.13 [0.50, 1.75] |
| 2 Weight ‐ bias Show forest plot | 94 | 6916 | Mean Difference (IV, Random, 95% CI) | 1.13 [0.50, 1.75] |
| 2.1 High risk of bias | 94 | 6916 | Mean Difference (IV, Random, 95% CI) | 1.13 [0.50, 1.75] |
| 2.2 Low risk of bias | 0 | 0 | Mean Difference (IV, Random, 95% CI) | 0.0 [0.0, 0.0] |
| 3 Weight ‐ mode of delivery Show forest plot | 94 | 6916 | Mean Difference (IV, Random, 95% CI) | 1.13 [0.50, 1.75] |
| 3.1 General nutrition support | 6 | 1328 | Mean Difference (IV, Random, 95% CI) | 0.41 [‐0.58, 1.41] |
| 3.2 Fortified nutrition | 2 | 230 | Mean Difference (IV, Random, 95% CI) | 1.45 [‐0.92, 3.83] |
| 3.3 Oral nutrition support | 32 | 2149 | Mean Difference (IV, Random, 95% CI) | 0.29 [‐0.22, 0.80] |
| 3.4 Enteral nutrition | 31 | 2081 | Mean Difference (IV, Random, 95% CI) | 1.98 [0.74, 3.22] |
| 3.5 Parenteral nutrition | 22 | 1082 | Mean Difference (IV, Random, 95% CI) | 1.25 [‐0.25, 2.75] |
| 3.6 Mixed | 1 | 46 | Mean Difference (IV, Random, 95% CI) | ‐3.90 [‐4.45, ‐3.35] |
| 4 Weight ‐ by medical speciality Show forest plot | 94 | 6916 | Mean Difference (IV, Random, 95% CI) | 1.13 [0.50, 1.75] |
| 4.1 Cardiology | 0 | 0 | Mean Difference (IV, Random, 95% CI) | 0.0 [0.0, 0.0] |
| 4.2 Medical gastroenterology and hepatology | 8 | 388 | Mean Difference (IV, Random, 95% CI) | 0.13 [‐1.05, 1.30] |
| 4.3 Geriatrics | 11 | 1647 | Mean Difference (IV, Random, 95% CI) | 0.61 [‐0.27, 1.50] |
| 4.4 Pulmonary disease | 4 | 91 | Mean Difference (IV, Random, 95% CI) | 0.95 [‐0.43, 2.33] |
| 4.5 Endocrinology | 0 | 0 | Mean Difference (IV, Random, 95% CI) | 0.0 [0.0, 0.0] |
| 4.6 Infectious diseases | 0 | 0 | Mean Difference (IV, Random, 95% CI) | 0.0 [0.0, 0.0] |
| 4.7 Rheumatology | 0 | 0 | Mean Difference (IV, Random, 95% CI) | 0.0 [0.0, 0.0] |
| 4.8 Haematology | 0 | 0 | Mean Difference (IV, Random, 95% CI) | 0.0 [0.0, 0.0] |
| 4.9 Nephrology | 0 | 0 | Mean Difference (IV, Random, 95% CI) | 0.0 [0.0, 0.0] |
| 4.10 Gastroenterologic surgery | 44 | 2260 | Mean Difference (IV, Random, 95% CI) | 1.09 [‐0.11, 2.29] |
| 4.11 Trauma surgery | 0 | 0 | Mean Difference (IV, Random, 95% CI) | 0.0 [0.0, 0.0] |
| 4.12 Ortopaedics | 8 | 697 | Mean Difference (IV, Random, 95% CI) | 2.62 [1.21, 4.02] |
| 4.13 Plastic, reconstructive, and aesthetic surgery | 0 | 0 | Mean Difference (IV, Random, 95% CI) | 0.0 [0.0, 0.0] |
| 4.14 Vascular surgery | 0 | 0 | Mean Difference (IV, Random, 95% CI) | 0.0 [0.0, 0.0] |
| 4.15 Transplant surgery | 1 | 29 | Mean Difference (IV, Random, 95% CI) | ‐4.60 [‐15.21, 6.01] |
| 4.16 Urology | 0 | 0 | Mean Difference (IV, Random, 95% CI) | 0.0 [0.0, 0.0] |
| 4.17 Thoracic surgery | 2 | 548 | Mean Difference (IV, Random, 95% CI) | 0.06 [‐2.39, 2.51] |
| 4.18 Neurological surgery | 1 | 48 | Mean Difference (IV, Random, 95% CI) | 10.53 [6.72, 14.34] |
| 4.19 Oro‐maxillo‐facial surgery | 1 | 32 | Mean Difference (IV, Random, 95% CI) | 0.6 [‐1.10, 2.30] |
| 4.20 Anaesthesiology | 0 | 0 | Mean Difference (IV, Random, 95% CI) | 0.0 [0.0, 0.0] |
| 4.21 Emergency medicine | 0 | 0 | Mean Difference (IV, Random, 95% CI) | 0.0 [0.0, 0.0] |
| 4.22 Psychiatry | 0 | 0 | Mean Difference (IV, Random, 95% CI) | 0.0 [0.0, 0.0] |
| 4.23 Neurology | 6 | 311 | Mean Difference (IV, Random, 95% CI) | 1.72 [0.19, 3.25] |
| 4.24 Oncology | 1 | 23 | Mean Difference (IV, Random, 95% CI) | ‐1.0 [‐7.41, 5.41] |
| 4.25 Dermatology | 0 | 0 | Mean Difference (IV, Random, 95% CI) | 0.0 [0.0, 0.0] |
| 4.26 Gynaecology | 0 | 0 | Mean Difference (IV, Random, 95% CI) | 0.0 [0.0, 0.0] |
| 4.27 Mixed | 7 | 842 | Mean Difference (IV, Random, 95% CI) | 0.22 [‐0.58, 1.02] |
| 5 Weight ‐ based on adequacy of the amount of nutrition Show forest plot | 94 | 6916 | Mean Difference (IV, Random, 95% CI) | 1.13 [0.50, 1.75] |
| 5.1 Clearly adequate in intervention and clearly inadequate in control | 22 | 1933 | Mean Difference (IV, Random, 95% CI) | 1.03 [‐0.41, 2.46] |
| 5.2 Inadequate in the experimental or adequate in the control | 21 | 1992 | Mean Difference (IV, Random, 95% CI) | 0.86 [0.16, 1.57] |
| 5.3 Experimental group is overfed | 5 | 151 | Mean Difference (IV, Random, 95% CI) | 0.64 [‐0.87, 2.14] |
| 5.4 Unclear intake in control or experimental | 46 | 2840 | Mean Difference (IV, Random, 95% CI) | 1.34 [0.35, 2.33] |
| 6 Weight ‐ different screening tools Show forest plot | 94 | 6916 | Mean Difference (IV, Random, 95% CI) | 1.13 [0.50, 1.75] |
| 6.1 NRS 2002 | 4 | 353 | Mean Difference (IV, Random, 95% CI) | 1.12 [‐0.29, 2.53] |
| 6.2 MUST | 1 | 64 | Mean Difference (IV, Random, 95% CI) | 2.10 [0.30, 3.90] |
| 6.3 MNA | 2 | 104 | Mean Difference (IV, Random, 95% CI) | 1.56 [0.09, 3.03] |
| 6.4 SGA | 4 | 1091 | Mean Difference (IV, Random, 95% CI) | ‐1.03 [‐2.12, 0.06] |
| 6.5 Other means | 83 | 5304 | Mean Difference (IV, Random, 95% CI) | 1.26 [0.56, 1.95] |
| 7 Weight ‐ participants characterised as 'at nutritional risk' due to one of the following conditions Show forest plot | 94 | 6916 | Mean Difference (IV, Random, 95% CI) | 1.13 [0.50, 1.75] |
| 7.1 Major surgery | 49 | 3050 | Mean Difference (IV, Random, 95% CI) | 1.08 [0.08, 2.09] |
| 7.2 Stroke | 4 | 245 | Mean Difference (IV, Random, 95% CI) | 1.68 [0.12, 3.24] |
| 7.3 ICU participants including trauma | 1 | 43 | Mean Difference (IV, Random, 95% CI) | ‐1.6 [‐2.37, ‐0.83] |
| 7.4 Frail elderly participants with less severe conditions known to increase protein requirements | 9 | 1558 | Mean Difference (IV, Random, 95% CI) | 1.61 [0.59, 2.64] |
| 7.5 Participants do not fall into one of the categories above | 31 | 2020 | Mean Difference (IV, Random, 95% CI) | 0.85 [0.33, 1.38] |
| 8 Weight ‐ participants characterised as 'at nutritional risk' due to one of the following criteria Show forest plot | 94 | 6916 | Mean Difference (IV, Random, 95% CI) | 1.13 [0.50, 1.75] |
| 8.1 BMI less than 20.5 kg/m2 | 5 | 309 | Mean Difference (IV, Random, 95% CI) | 3.97 [1.06, 6.89] |
| 8.2 Weight loss of at least 5% during the last three months | 2 | 30 | Mean Difference (IV, Random, 95% CI) | ‐5.83 [‐15.15, 3.48] |
| 8.3 Weight loss of at least 10% during the last six months | 2 | 79 | Mean Difference (IV, Random, 95% CI) | 0.30 [‐0.36, 0.96] |
| 8.4 Insufficient food intake during the last week (50% of requirements or less) | 0 | 0 | Mean Difference (IV, Random, 95% CI) | 0.0 [0.0, 0.0] |
| 8.5 Participants characterised as 'at nutritional risk' by other means | 85 | 6498 | Mean Difference (IV, Random, 95% CI) | 1.12 [0.48, 1.77] |
| 9 Weight ‐ participants characterised as 'at nutritional risk' due to biomarkers or anthropometrics Show forest plot | 94 | 6916 | Mean Difference (IV, Random, 95% CI) | 1.13 [0.50, 1.75] |
| 9.1 Biomarkers | 9 | 750 | Mean Difference (IV, Random, 95% CI) | 4.37 [2.16, 6.58] |
| 9.2 Anthropometric measures | 15 | 996 | Mean Difference (IV, Random, 95% CI) | 0.87 [‐0.30, 2.04] |
| 9.3 Characterised by other means | 67 | 5110 | Mean Difference (IV, Random, 95% CI) | 0.49 [0.01, 0.96] |
| 9.4 Mixed | 3 | 60 | Mean Difference (IV, Random, 95% CI) | ‐0.37 [‐1.95, 1.22] |
| 10 Weight ‐ randomisation year Show forest plot | 23 | 1940 | Mean Difference (IV, Random, 95% CI) | 0.48 [‐0.44, 1.39] |
| 10.1 Before 1960 | 0 | 0 | Mean Difference (IV, Random, 95% CI) | 0.0 [0.0, 0.0] |
| 10.2 1960 to 1979 | 1 | 21 | Mean Difference (IV, Random, 95% CI) | 3.83 [1.66, 6.00] |
| 10.3 1980 to 1999 | 14 | 372 | Mean Difference (IV, Random, 95% CI) | 0.34 [‐0.95, 1.64] |
| 10.4 After 1999 | 8 | 1547 | Mean Difference (IV, Random, 95% CI) | 0.01 [‐1.09, 1.12] |
| 11 Weight ‐ trials where the intervention lasts fewer than three days compared with trials where the intervention lasts three days or more Show forest plot | 94 | 6916 | Mean Difference (IV, Random, 95% CI) | 1.13 [0.50, 1.75] |
| 11.1 Three days or more | 89 | 6758 | Mean Difference (IV, Random, 95% CI) | 1.18 [0.54, 1.83] |
| 11.2 Less than three days | 5 | 158 | Mean Difference (IV, Random, 95% CI) | 0.15 [‐1.62, 1.92] |
| Outcome or subgroup title | No. of studies | No. of participants | Statistical method | Effect size |
| 1 Hand‐grip strength ‐ overall Show forest plot | 14 | 783 | Mean Difference (IV, Random, 95% CI) | 1.47 [0.58, 2.37] |
| Outcome or subgroup title | No. of studies | No. of participants | Statistical method | Effect size |
| 1 Hand‐grip strength ‐ overall Show forest plot | 18 | 1240 | Mean Difference (IV, Random, 95% CI) | 0.96 [0.15, 1.76] |
| Outcome or subgroup title | No. of studies | No. of participants | Statistical method | Effect size |
| 1 Six‐minute walking distance ‐ overall Show forest plot | 1 | 102 | Mean Difference (IV, Random, 95% CI) | 133.27 [24.32, 242.22] |