Mosquito repellents for malaria prevention
Abstract
Background
Malaria is an important cause of illness and death across endemic regions. Considerable success against malaria has been achieved within the past decade mainly through long‐lasting insecticide‐treated nets (LLINs). However, elimination of the disease is proving difficult as current control methods do not protect against mosquitoes biting outdoors and when people are active. Repellents may provide a personal protection solution during these times.
Objectives
To assess the impact of topical repellents, insecticide‐treated clothing, and spatial repellents on malaria transmission.
Search methods
We searched the following databases up to 26 June 2017: the Cochrane Infectious Diseases Group Specialized Register; the Central Register of Controlled Trials (CENTRAL), published in the Cochrane Library; MEDLINE; Embase; US AFPMB; CAB Abstracts; and LILACS. We also searched trial registration platforms and conference proceedings; and contacted organizations and companies for ongoing and unpublished trials.
Selection criteria
We included randomized controlled trials (RCTs) and cluster‐randomized controlled trials of topical repellents proven to repel mosquitoes; permethrin‐treated clothing; and spatial repellents such as mosquito coils. We included trials that investigated the use of repellents with or without LLINs, referred to as insecticide‐treated nets.
Data collection and analysis
Two review authors independently reviewed trials for inclusion, extracted the data, and assessed the risk of bias. A third review author resolved any discrepancies. We analysed data by conducting meta‐analysis and stratified by whether the trials had included LLINs. We combined results from cRCTs with individually RCTs by adjusting for clustering and presented results using forest plots. We used GRADE to assess the certainty of the evidence.
Main results
Eight cRCTs and two RCTs met the inclusion criteria. Six trials investigated topical repellents, two trials investigated insecticide‐treated clothing, and two trials investigated spatial repellents.
Topical repellents
Six RCTS, five of them cluster‐randomized, investigated topical repellents involving residents of malaria‐endemic regions. Four trials used topical repellents in combination with nets, but two trials undertaken in displaced populations used topical repellents alone. It is unclear if topical repellents can prevent clinical malaria (RR 0.65, 95% CI 0.4 to 1.07, very low certainty evidence) or malaria infection (RR 0.84, 95% CI 0.64 to 1.12, low‐certainty evidence) caused by P. falciparum. It is also unclear if there is any protection against clinical cases of P. vivax (RR 1.32, 95% CI 0.99 to 1.76, low‐certainty evidence) or incidence of infections (RR 1.07, 95% CI 0.80 to 1.41, low‐certainty evidence). Subgroup analysis of trials including insecticide‐treated nets did not show a protective effect of topical repellents against malaria. Only two studies did not include insecticide‐treated nets, and they measured different outcomes; one reported a protective effect against clinical cases of P. falciparum (RR 0.40, 95% CI 0.23 to 0.71); but the other study measured no protective effect against malaria infection incidence caused by either P. falciparum or P. vivax.
Insecticide‐treated clothing
Insecticide‐treated clothing were investigated in trials conducted in refugee camps in Pakistan and amongst military based in the Colombian Amazon. Neither study provided participants with insecticide‐treated nets. In the absence of nets, treated clothing may reduce the incidence of clinical malaria caused by P. falciparum by approximately 50% (RR 0.49, 95% CI 0.29 to 0.83, low‐certainty evidence) and P. vivax (RR 0.64, 95% CI 0.40 to 1.01, low‐certainty evidence).
Spatial repellents
Two cluster‐randomized RCTs investigated mosquito coils for malaria prevention. We do not know the effect of spatial repellents on malaria prevention (RR 0.24, 95% CI 0.03 to 1.72, very low certainty evidence). There was large heterogeneity between studies and one study had high risk of bias.
Authors' conclusions
There is insufficient evidence to conclude topical or spatial repellents can prevent malaria. There is a need for better designed trials to generate higher certainty of evidence before well‐informed recommendations can be made. Adherence to daily compliance remains a major limitation. Insecticide‐treated clothing may reduce risk of malaria infection in the absence of insecticide‐treated nets; further studies on insecticide‐treated clothing in the general population should be done to broaden the applicability of the results.
PICO
Plain language summary
Mosquito repellents for malaria prevention
What was the aim of this review?
The aim of this Cochrane Review was to find out if mosquito repellents — topical repellents (applied to the skin); insecticide‐treated clothing; or spatial repellents such as mosquito coils — can prevent malaria. We collected and analysed the results of all relevant studies to answer this question and found data from ten trials: six on topical repellents, two on insecticide‐treated clothing, and two on spatial repellents.
Key messages
We do not know if the use of repellent lotions or burning of mosquito coils can provide protection from malaria to communities living in endemic regions. In situations where long‐lasting insecticide‐treated bed nets (LLINs) cannot be rolled out, such as after a natural disaster or amongst displaced populations, the use of insecticide‐treated clothing may reduce the risk of malaria infection by 50%. Most studies included in our analysis were poorly designed and had high risk of bias. In order to draw well‐informed conclusions, further high‐quality studies must be conducted to improve the certainty of the evidence. However, it is questionable if topical repellents can be used for malaria prevention in the general population as daily compliance and poor standardization (amount of repellent used, surface area applied, time of application, and period between repeated applications) are major limitations of this intervention.
What was studied in this review
Mosquito repellents provide protection from mosquito bites. There are three different types of repellents: topical repellents, which can be applied on the skin; insecticide‐treated clothing, through impregnation of clothing with repellent compounds; and spatial repellents, such as mosquito coils. Malaria has decreased in many countries because people have been given highly effective LLINs. However people are still being bitten before they go to bed. There is a need to find a way to offer protection from malaria during these hours. Mosquito repellents may address this gap.
What are the main results of the review?
A total of six trials investigated the use of topical repellents for malaria prevention. The trials took place in different malaria‐endemic regions across South America, Asia, and sub‐Saharan Africa. The topical repellents tested included lotions, treated soap, and local cosmetics. We analysed the studies in groups according to LLIN inclusion. Most studies rolled out LLINs to the population and investigated topical repellents as a complementary intervention to the treated bed‐nets. The poor design of the included studies provided low to very low certainty evidence, consequently we do not know if there is a benefit of using topical repellents in addition to LLINs to prevent malaria. The compliance of participants to adhere to the daily application of repellents remains a challenge to further research.
Insecticide‐treated clothing was investigated in two trials conducted with refugees in Pakistan and military deployed in the Amazon; neither study rolled out or reported the use of bed‐nets. In the absence of LLINs, there is some evidence that insecticide‐treated clothing may reduce the risk of malaria infection by 50%. Given that the findings relate to special populations living in particularly harsh conditions it is unclear if the results are applicable to the general population. Further studies involving civilian populations should be done to improve the certainty of these findings.
Two studies investigated the practice of burning mosquito coils to reduce malaria infections. One study was conducted in China and the other in Indonesia. The study designs were substantially different and one study had high risk of bias leading to very low certainty evidence. We do not know if mosquito coils offer protection against malaria. The findings underline the need for further research.
How up to date is this review?
The review authors searched for studies that had been published up to 26 June 2017.
Authors' conclusions
Summary of findings
| Topical repellents compared to placebo or no treatment for malaria prevention | ||||||
| Patient or population: malaria prevention | ||||||
| Outcomes | Anticipated absolute effects* (95% CI) | Relative effect | Number of participants | Certainty of the evidence | Comments | |
| Risk with Placebo or no treatment | Risk with Topical repellents | |||||
| Clinical malaria: P. falciparum | 39 per 1000 | 25 per 1000 | RR 0.65 | 4450 | ⊕⊝⊝⊝ Due to risk of bias, inconsistency and imprecision | We do not know if topical repellents have an effect on malaria cases caused by P. falciparum. We have very little confidence in the effect estimate. The true effect is likely to be substantially different from the estimate of effect. |
| Parasitaemia: P. falciparum | 15 per 1000 | 12 per 1000 | RR 0.84 | 13,310 | ⊕⊕⊝⊝ Due to risk of bias and imprecision | Topical repellents may or may not have a protective effect against P. falciparum parasitaemia. Our confidence in the effect estimate is limited. The true effect may be substantially different from the estimation of the effect. |
| Clinical malaria: P. vivax | 36 per 1000 | 48 per 1000 | RR 1.32 | 3996 | ⊕⊕⊝⊝ Due to risk of bias and imprecision | Topical repellents may increase the number of clinical cases caused by P. vivax. Our confidence in the effect estimate is limited. The true effect may be substantially different from the estimation of the effect. |
| Parasitaemia: P. vivax | 18 per 1000 | 19 per 1000 | RR 1.07 | 9434 | ⊕⊕⊝⊝ Due to risk of bias and imprecision | Topical repellents may or may not have a protective effect against P. vivax parasitaemia Our confidence in the effect estimation is limited. The true effect may be substantially different from the estimation of the effect. |
| *The risk in the intervention group (and its 95% CI) is based on the assumed risk in the comparison group and the relative effect of the intervention (and its 95% CI). | ||||||
| GRADE Working Group grades of evidence | ||||||
| 1Downgraded by 1 for risk of bias: Sangoro 2014a used alternate allocation and reported a baseline imbalance; random sequence generation and allocation concealment were not described by Rowland 2004; and Sluydts 2016 did not have a placebo so the intervention was not blinded. | ||||||
| ITC compared to placebo or no treatment for malaria prevention | ||||||
| Patient or population: malaria prevention | ||||||
| Outcomes | Anticipated absolute effects* (95% CI) | Relative effect | Number of participants | Certainty of the evidence | Comments | |
| Risk with placebo or no treatment | Risk with ITC | |||||
| Clinical malaria: P. falciparum | 35 per 1000 | 17 per 1000 | RR 0.49 | 997 | ⊕⊕⊝⊝ Due to risk of bias and imprecision | Insecticide‐treating clothing may have a protective effect against malaria caused by P. falciparum. Our confidence in the effect estimate is limited. The true effect may be substantially different from the estimate of the effect. |
| Clinical malaria: P. vivax | 116 per 1000 | 74 per 1000 | RR 0.64 | 997 | ⊕⊕⊝⊝ Due to risk of bias and imprecision | Insecticide‐treated clothing may have a protective effect against malaria caused by P. vivax. Our confidence in the effect estimate is limited. The true effect may be substantially different from the estimate of the effect. |
| *The risk in the intervention group (and its 95% CI) is based on the assumed risk in the comparison group and the relative effect of the intervention (and its 95% CI). | ||||||
| GRADE Working Group grades of evidence | ||||||
| 1Downgraded by 1 for risk of bias: Soto 1995 did not describe how randomization and allocation concealment was assured; and had unclear risk of baseline bias because did not report how long soldiers in each arm were deployed to malaria endemic areas. Rowland 1999 did not describe the method used for allocation concealment. | ||||||
| Spatial repellents compared to placebo or no treatment for malaria prevention | ||||||
| Patient or population: malaria prevention | ||||||
| Outcomes | Anticipated absolute effects* (95% CI) | Relative effect | Number of participants | Certainty of the evidence | Comments | |
| Risk with placebo or no treatment | Risk with Spatial repellents | |||||
| Parasitaemia Plasmodium spp. | 10 per 1000 | 2 per 1000 (0 to 18) | RR 0.24 (0.03 to 1.72) | 6683 (2 studies) | ⊕⊝⊝⊝ Due to risk of bias, imprecision and inconsistency | We do not know if spatial repellents protect against malaria. We have very little confidence in the effect estimate. The true effect is likely to be substantially different from the estimate of effect. |
| *The risk in the intervention group (and its 95% CI) is based on the assumed risk in the comparison group and the relative effect of the intervention (and its 95% CI). | ||||||
| GRADE Working Group grades of evidence | ||||||
| 1Downgraded by 1 for risk of bias: Hill 2014 was not blinded. | ||||||
Background
Description of the condition
Malaria is caused by protozoan parasites of the genus Plasmodium. The most severe form of the disease is caused by Plasmodium falciparum. Other Plasmodium species known to cause milder cases of malaria include Plasmodium vivax, Plasmodium ovale, and Plasmodium malariae. The parasites are transmitted to people through the bite of an infected Anopheles mosquito. Malaria is widespread in tropical and subtropical regions and is considered endemic in 91 countries worldwide (WHO 2017). Symptoms of malaria include fever, chills, headache, and vomiting, and usually appear between 10 to 15 days after the bite of an infected mosquito. If left untreated, the person may develop severe complications and malaria can quickly become life‐threatening by disrupting the blood supply to vital organs. Diagnosis is done through identification of the Plasmodium parasite in the patient's bloodstream, usually by microscopic examination of a blood slide or malaria rapid diagnostic tests (mRDTs).
In the past decade, great advances have been made in the fight against malaria. From 2000 to 2016 global incidence of malaria fell by 40% and related mortality by 62% (WHO 2017). This is due to massive scale‐up of vector control interventions using long‐lasting insecticide‐treated bed nets (LLINs) and indoor residual spraying (IRS), as well as the introduction of mRDTs for better malaria diagnosis and use of highly effective artemisinin‐based combination therapies (ACTs). Despite these developments, an estimated three billion people living in 91 countries are still at risk of contracting malaria and 1200 children under five years old die every day in malaria‐endemic regions (WHO 2017). The World Health Organization's (WHO) Global Technical Strategy (GTS) aims to reduce global malaria incidence and mortality rates by 90% by 2030, with a milestone of at least 40% reduction by 2020. The GTS also set targets to eliminate the disease in at least 10 countries by 2020 and 35 countries by 2030. While the vector control component of most national malaria control programmes concentrates on distribution of LLINs and IRS, there is substantial malaria transmission within and outside Africa at times when people are outdoors (Durnez 2013). Recent estimates are that 10% of global malaria burden occurs outside Africa, with approximately 58% of P. vivax cases occurring in the WHO South‐East Asia Region (WHO 2017), where vectors are primarily early evening feeders (Sinka 2010; Sinka 2011). In order to achieve sustained malaria control and move towards malaria elimination, new tools will be required to interrupt transmission in environments where existing tools are not completely effective (malERA 2011). Residual malaria transmission is maintained by the presence of asymptomatic carriers, the significant number of non‐compliant LLIN users, early evening outdoor‐feeding Anopheles mosquitoes, and the spread of drug and insecticide resistance (White 2014). As well as preventing early evening bites, mosquito repellents may be suitable for people who have a high occupational risk of contracting malaria, such as: those working at night particularly in mining; soldiers; people in close contact with forest ecosystems; and migrants (Sangoro 2014b). It is well known that these high‐risk individuals 're‐seed' malaria in areas where vector control activities are carried out (Tatem 2010). With the impetus for malaria eradication of the past decade and the realization that the existing control tools alone cannot achieve this, mosquito repellents are increasingly being considered as supplementary tools in some malaria‐endemic settings (Sturrock 2013).
Description of the intervention
Personal protection has been used for centuries to prevent mosquito bites (Herodotus 1996). Historically, people burned repellent plants and applied essential oils directly to their skin or clothing. In recent times, manufacturers have developed more effective products that have largely replaced traditional methods. These products include mosquito coils, long‐lasting formulated repellent lotions, and insecticide treatments for clothing. Mosquito repellents are currently recommended by the WHO as the first‐line malaria‐prevention tool for travellers (WHO 2012), and they are commonly used by expatriates in tropical developing countries.
There are three main interventions that help prevent mosquito bites:
-
applying topical repellents directly to the skin;
-
wearing insecticide‐treated clothing (ITC);
-
using spatial repellents.
The mode of action of these three interventions on the mosquito is not the same; however they all result in preventing mosquito bites outside sleeping hours and so potentially reduce transmission of Plasmodium parasites from infected mosquitoes to humans.
Topical repellents
Topical repellents may contain a wide range of active ingredients and are available in various formulations in lotions, gels, roll‐ons, and on wipes. Repellents interfere with mosquitoes' olfactory reception, affecting their ability to locate and feed on a human host. Approved active ingredients for mosquito‐borne disease prevention are DEET (chemical name: N,N‐diethyl‐m‐toluamide or N,N‐diethyl‐3‐methyl‐benzamide); icaridin (KBR 3023 [Bayrepel] and picaridin inside the USA; chemical name: 2‐2‐hydroxyethyl‐1‐piperidinecarboxylic acid 1‐methylpropyl ester); PMD (para‐methane‐3,8‐diol); and IR3535 (chemical name: 3‐[N‐butyl‐N‐acetyl]‐aminopropionic acid, ethyl ester) (CDC 2014; WHO 2012). The Environmental Protection Agency (EPA) estimates that approximately 200 million people use DEET worldwide every year (WHOPES 1998).
ITC
ITC is widely used by military personnel to protect against vector‐borne diseases and biting nuisance (Kitchen 2009). The synthetic pyrethroid permethrin (2 g/m²) is used most commonly for treatment of clothing. Permethrin is approved by the WHO for this purpose because of its low dermal absorption, low mammalian toxicity, lack of odour and minimal irritation (WHOPES 2006). The mode of action of ITC is through contact irritancy, whereby mosquitoes make oriented movement away from the person after physical contact with the treated clothing surface; it also affects mosquitoes' feeding response. Both of these modes of action result in a reduction in mosquito bites to the person using the treated material.
Spatial repellents
Spatial repellents disperse active ingredients into the surrounding air that interfere with the mosquito's ability to find a host, thus preventing mosquitoes from taking a blood meal. They may interfere with host detection; or cause insects to fly in an undirected manner until they eventually move away from the source of repellent vapour (excito‐repellency). Spatial repellents create a protective area within a given radius and can be used to protect more than one person at the same time. Dispersal of the active ingredient can be done in two ways:
-
through heat, for example mosquito coils and electric emanators; or
-
through evaporation, for example passive emanators made of paper or agarose gel.
The most popular format is the mosquito coil and an estimated 45 to 50 billion mosquito coils are used annually by approximately two billion people worldwide, mainly in Southeast Asia (Zhang 2010). Mosquito coils are made from a mixture of inert ingredients, such as sawdust or coconut husks, and pigment. The coils burn at a low temperature dispersing the active ingredient, usually a volatile pyrethroid with a quick knock‐down action (for example, pyrethrin, D‐allethrin, transfluthrin, or metofluthrin). The smoke produced by the burning of mosquito coils can cause indoor air pollution.
Electric emanators consist of an electrical heating agent that vaporizes insecticide that has been impregnated into a pad or wick. These produce no smoke but require a source of electricity, which is not available in a large proportion of homes in malaria‐endemic countries.
Passive emanators do not require a source of heat or combustion. They have a large surface area which allows the passive dispersal of the volatile active ingredient into the air by evaporation. The chosen active ingredients are predominantly less polar compounds that are easily volatilized: examples include volatile pyrethroids such as metofluthrin and transfluthrin.
How the intervention might work
During the first Global Malaria Eradication Campaign the concept of vectorial capacity was developed and validated to mathematically evaluate the impact of mosquito‐control interventions on malaria transmission using several measurable field parameters (Garrett‐Jones 1964). Vectorial capacity is defined as: "the daily rate at which future inoculations of a parasite arise from a currently infective case, provided that all female vectors biting that case become infected" (Garrett‐Jones 1964). The original validation demonstrated that by reducing man‒vector contact (mosquito bites) by 50% there was a consequent 75% reduction in vectorial capacity. Man‒vector contact can be reduced by using repellents. Mosquitoes will be repelled or disabled from feeding on a person while being exposed to the repellent. These personal protective measures can be used at any time or location, and so are suitable for controlling mosquitoes biting outdoors and during early evening hours before people go to bed. Repellents might also protect individuals from other mosquito‐borne diseases such as dengue, Zika, and chikungunya.
Why it is important to do this review
The wide distribution of LLINs in malaria‐endemic countries has resulted in a considerable reduction of malaria incidence and prevalence throughout affected areas (WHO 2017). However residual malaria transmission, defined as the malaria transmission occurring despite universal coverage with effective IRS or LLINs, requires other vector control interventions, particularly outdoors and outside sleeping hours. It is estimated that in South America and Southeast Asia 80% of malaria transmission occurs before sleeping hours. Even in Africa, where Anopheles mosquitoes are traditionally late feeders, up to 20% of malaria transmission takes place during early evening and early morning hours (Sangoro 2014b). During this time the only available means of protection are repellents or ITC, thus these interventions might have the potential to reduce residual transmission. This Cochrane Review aimed to measure the effectiveness of these interventions — either alone or when combined with LLINs — in reducing the incidence of malaria, to facilitate decision makers considering the inclusion of repellents in national malaria control programmes. In addition, we believe that this review may be helpful in the pursuit of Goal 3 of the United Nations Sustainable Development Goals (SDGs), to ensure healthy lives and promote well‐being for all at all ages. The specific SDG 3 targets that this review addresses include:
-
by 2030, reduce the global maternal mortality ratio to less than 70 per 100,000 live births: pregnant women are more attractive to mosquitoes and therefore at a higher risk of infection than when the same women are not pregnant. In addition, pregnant women are particularly susceptible to complications of malaria. Modern repellents are safe to use among pregnant women and therefore have the potential to confer protection to a high‐risk group;
-
by 2030, end preventable deaths of newborns and children under five years of age, with all countries aiming to reduce neonatal mortality to at least as low as 12 per 1000 live births and under‐five mortality to at least as low as 25 per 1000 live births. Reducing the number of mosquito bites a child receives has been shown to lower the morbidity from malaria (Snow 1998). Repellents may also reduce other vector‐borne diseases as the most widely used repellents are broad spectrum and prevent bites from a range of disease vectors;
-
by 2030, end the epidemics of AIDS, tuberculosis, malaria, and neglected tropical diseases, and combat hepatitis, water‐borne diseases, and other communicable diseases: by directly reducing the human‐vector biting rate and reducing malaria transmission.
Objectives
To assess the impact of topical repellents, insecticide‐treated clothing (ITC), and spatial repellents on malaria transmission.
Methods
Criteria for considering studies for this review
Types of studies
We included only randomized controlled trials (RCTs) or cluster randomized controlled trials (cRCTs) with more than two units of randomization.
Types of participants
We included all adults and children living in malaria‐endemic areas.
Types of interventions
We included trials with or without LLINs in both trial arms.
Intervention
-
ITC impregnated with permethrin; or
-
topical repellents including DEET, icaridin, picardin, IR3535, and PMD; or
-
spatial repellents including transfluthrin coils, metofluthrin coils, D‐allethrin coils, pyrethrin coils, metofluthrin emanators, and transfluthrin emanators.
Control
Individuals given a placebo or no treatment.
Types of outcome measures
Primary outcomes
-
Clinical malaria: confirmed through blood smears or rapid diagnostic tests (P. falciparum or P. vivax);
-
malaria parasitaemia (malaria infection incidence): confirmed through thick or thin blood smears, mRDTs, or polymerase chain reaction (PCR) (P. falciparum or P. vivax).
Secondary outcomes
-
Anaemia (haemoglobin < 10 g/dL);
-
time to first infection (days);
-
all‐cause fever;
-
adherence to regular usage of the intervention measured through spot‐checking per period of time;
-
reduction in mosquitoes attempting to feed on humans;
-
recorded adverse events such as skin irritation, irritation of upper airways, nausea, and headache.
Search methods for identification of studies
We identified all relevant trials regardless of language or publication status (published, unpublished, in press, and in progress) (Lefebvre 2011).
Electronic searches
We searched the following databases using the search terms and strategy described in Appendix 1: the Cochrane Infectious Diseases Group Specialized Register (up to 23 June 2017); MEDLINE (PubMed, 1966 to 26 June 2017); Embase (OVID, 1974 to 26 June 2017); CAB Abstracts (Web of Science, 1910 to 26 June 2017), and LILACS (1982 to 26 June 2017). We also searched the United States Armed Forces Pesticide Management Board website (US AFPMB; www.acq.osd.mil/eie/afpmb) on 12 August 2016; the WHO International Clinical Trials Registry Platform (ICTRP; www.who.int/trialsearch); and ClinicalTrials.gov on 26 June 2017, using 'randomised controlled Trial', 'controlled clinical trial', 'mosquito*', 'Anopheles', 'malaria', 'DEET', 'PMD', 'IR3535', 'Icaridin', 'Metofluthrin', 'Transfluthrin', 'vaporizer mat*', 'electric emanator', insecticide treated clothing', 'ITC', 'personal protection', and 'repellen*' as search terms.
Searching other resources
Conference proceedings
We searched the following conference proceedings of the relevant abstracts:
-
MIM conference abstract booklets (2008 to present);
-
Annual ASTMH conference (2008 to present);
-
Entomological Society of America (2008 to present);
-
Society of Vector Ecology of America (2008 to present).
Organizations and pharmaceutical companies
We contacted organizations (including the WHO, Centers for Disease Control and Prevention (CDC), United States Department of Agriculture (USDA), United States Agency for International Development (USAID), US AFPMB, and Deployed War Fighter Protection Program (DWFP)) and chemical companies (including Bayer, Sumitomo, Vestergaard‐Frandsen, BASF, SC Johnson, Insect Shield, Mosiguard, Sara Lee, and Syngenta) for ongoing and unpublished trials.
Reference lists
We also checked the reference lists of all included trials for further relevant studies.
Data collection and analysis
Selection of studies
Two review authors (MM and MK) independently assessed the titles and abstracts of trials identified by the searches. The same two review authors assessed full‐text copies of potentially relevant trials for inclusion using an eligibility form based on inclusion criteria. They compared included trials, and resolved any disagreements by discussion and consensus, with arbitration when necessary by one or two more review authors (SJM and CL). We ensured that multiple publications of the same trial were only included once. We listed excluded studies, together with their reasons for exclusion, in table format.
Data extraction and management
Two review authors (MM and MV) independently extracted information from the trials using pre‐piloted, electronic data extraction forms. Differences in extracted data were discussed between both authors until a consensus was reached. In cases where a consensus could not be reached, further discussions were held involving one or two more authors (SJM and CL). In cases where missing data were identified, we contacted the original trial author(s) for clarification.
We extracted data on the following:
-
trial design: type of trial; method of participant selection; unit of randomization (for RCTs); adjustment for clustering for cRCTs; sample size; method of blinding of participants and personnel; diagnostic method; primary vector; vector biting time; malaria endemicity; Plasmodium species;
-
participants: trial settings and population characteristics; recruitment rates; withdrawal and loss to follow‐up;
-
intervention: description of intervention; co‐interventions; description of controls; time of follow‐up; passive or active case detection; compliance;
-
outcomes: definition of outcome; number of events; number of participants; power; unit of analysis; incomplete outcomes/missing data.
For dichotomous outcomes, we extracted the number of patients experiencing each outcome and the number of patients in each treatment group. For continuous outcomes, we extracted the mean and a measure of variance (standard error) for each treatment group.
For cRCTs we recorded the number of clusters randomized; number of clusters analysed; measure of effect (such as risk ratio, odds ratio, or mean difference) with confidence intervals (CIs) or standard deviations; number of participants; and the intra‐cluster correlation coefficient (ICC) value.
Assessment of risk of bias in included studies
Two review authors (MM and MK) independently assessed risk of bias for each included trial using the Cochrane's 'Risk of bias' tool (Higgins 2011). Any discrepancies were resolved through discussion or by consulting one or two more review authors (SJM and CL). We classified judgements of risk of bias as either 'low', 'high' or 'unclear', using summary graphs ('Risk of bias' summary and 'Risk of bias' graph) to display results.
We assessed each of the following components for each included RCT randomized by the individual and by cluster.
Sequence generation
We described the methods used to generate the allocation sequence in sufficient detail to allow an assessment of whether it produced comparable groups. We regarded a trial as having a low risk of selection bias if the sequence generation was truly random (for example computer‐generated table of random numbers, tossing a coin); a high risk of bias if sequence generation was non‐random (for example alternate randomization, randomization by birth date); or an unclear risk of bias if the randomization process was not clearly described.
Balance
We assessed if both arms of the trial were equally balanced at baseline using criteria including age, gender, malaria indicators, socioeconomic status, housing, use of other interventions, knowledge about malaria transmission, and occupation.
Allocation concealment
We described the method used to conceal allocation to treatment groups before assignment. We regarded trials as having a low risk of selection bias if allocation was truly concealed (for example central allocation of participants; use of sequentially numbered, opaque, sealed envelopes; lottery system); a high risk of bias if the allocation process was not concealed (for example open randomization, unsealed or non‐opaque envelopes); or an unclear risk of bias if the process of concealing allocation was not described sufficiently to make a judgement.
Blinding of participants and personnel
We described whether blinding was present, who was blinded, and the methods used to blind trial participants and personnel. We regarded a trial as having a low risk of performance bias if blinding was present, or if the absence of blinding was unlikely to affect the outcomes; a high risk of bias if blinding was absent and likely to affect the results; or an unclear risk of bias if blinding was not clearly described.
Blinding of outcome assessors
Regarding blinding of outcome assessors: we described whether blinding of outcome assessors was present, and how they were blinded. We regarded a trial as having a low risk of detection bias if they were blinded to knowledge about which intervention the participants received; a high risk of bias if blinding was absent; or an unclear risk if blinding was not clearly described.
Incomplete outcome data
We described the percentage and proportion of patients who were lost to follow‐up; reasons for attrition; and whether attrition was balanced across groups or related to outcomes. We regarded trials as having a low risk of attrition bias if there were no missing data or if missing data were balanced across groups or clusters; high risk of bias if there were missing data or if missing data were more prevalent in one of the groups; or unclear risk of bias if it is unclear whether outcome data are missing.
Selective outcome reporting
We recorded any discrepancies between the pre‐specified outcomes in the Methods section and the outcomes reported, and identified outcomes that were measured but not reported on. We regarded a trial as having low risk of reporting bias if it was evident that all pre‐specified outcomes were reported on; high risk of bias if it was evident that not all pre‐specified outcomes were reported on; and unclear risk of bias if it was unclear whether all outcomes were reported on.
Incorrect analysis
We described whether the analysis was appropriate; whether an analysis plan was followed; and if it was adjusted for clustering.
Other bias
We described any important feature of included trials that could have affected the result.
In addition to the above, we assessed the following for each included cRCT.
Recruitment bias
Regarding recruitment bias, we described whether participants were recruited before or after randomization of clusters. We regarded trials as having low risk of recruitment bias if participants were recruited before randomization of clusters; high risk of bias if they were recruited after randomization; and unclear risk of bias if information about the timing of recruitment was unclear.
Loss of clusters
We described the number of clusters lost, as well as the reasons for attrition.
Compatibility with RCTs randomized by individuals
We noted whether the intervention effects may be systematically different from individually RCTs — that is, whether it was likely that the effect size was over‐ or underestimated.
Measures of treatment effect
We compared intervention and control data using risk ratios. All results were presented with their associated 95% confidence intervals (95% CIs). Data regarding reduction in mosquito bites was compared using mean difference and standard deviation.
Unit of analysis issues
We combined results from cRCTs with individually RCTs if they had adjusted for clustering in their analysis and presented results using forest plots. If there was no adjustment for clustering in RCTs, we adjusted data before combining it with data from individually RCTs. We adjusted the data by multiplying standard errors by the square root of the design effect (Higgins 2011). If the trial did not report the ICC value, we estimated the ICC from a similar trial, or by searching external sources for example ICCs. Regarding studies which measured malaria transmission through active case detection and reported results from multiple cross‐sectional studies, only data from the last cross‐sectional study was included in the meta‐analysis.
Dealing with missing data
In case of missing data, we applied available‐case analysis, only including data on the known results. The denominator used was the total number of participants who had data recorded for the specific outcome. For outcomes with no missing data, we carried out analyses on an intention‐to‐treat (ITT) basis. We included all participants randomized to each group in the analyses and analysed participants in the group to which they were randomized.
Assessment of heterogeneity
We inspected forest plots for overlapping CIs and assessed statistical heterogeneity in each meta‐analysis using the I² and Chi² statistics. We regarded heterogeneity as moderate if I² values are between 30% to 60%; substantial if they are between 59% to 90%; and considerable if they are between 75% to 100%. We regarded a Chi² test statistic with a P value less than or equal to 0.10 as indicative of statistically significant heterogeneity. We explored clinical and methodological heterogeneity through consideration of the trial populations, methods and interventions, and by visualization of trial results.
Assessment of reporting biases
In cases where 10 or more trials were included in each meta‐analysis, we investigated reporting biases (such as publication bias) using funnel plots. We assessed funnel plot asymmetry visually, and used formal tests for funnel plot asymmetry (Harbord 2006). We explored reasons for asymmetry.
Data synthesis
We grouped trials and analysed by these interventions:
-
topical repellents;
-
ITC;
-
spatial repellents.
Within each group, we stratified by whether LLINs were included in both intervention and control groups.
We analysed data using Review Manager 5 (RevMan 5) software (Review Manager 2014). We used fixed‐effect meta‐analysis to combine data when heterogeneity was absent. If considerable heterogeneity was present, we combined data using random‐effects meta‐analysis and reported an average treatment effect. We decided whether to use fixed‐effect or random‐effects meta‐analysis based on the consideration of clinical and methodological heterogeneity between trials, as described previously.
Certainty of the evidence
We rated the certainty of the evidence using the GRADE approach (Guyatt 2011). Each important outcome was rated as follows, as described by Balshem 2011:
-
high: we are very confident that the true effect lies close to that of the estimate of the effect;
-
moderate: we are moderately confident in the effect estimate. The true effect is likely to be close to the estimate of the effect;
-
low: our confidence in the effect estimate is limited. The true effect may be substantially different from the estimate of the effect;
-
very low: we have very little confidence in the effect estimate. The true effect is likely to be substantially different from the estimate of effect.
RCTs start as high certainty evidence but can be downgraded if there are valid reasons within the following five categories: risk of bias, imprecision, inconsistency, indirectness, and publication bias. Studies can also be upgraded if there is a large effect; a dose‐response effect; and if all plausible residual confounding would reduce a demonstrated effect or would suggest a spurious effect if no effect was observed (Balshem 2011). We summarized our findings in a 'Summary of findings' table.
Subgroup analysis and investigation of heterogeneity
We explored reasons for substantial heterogeneity using subgroup analysis. We subgrouped trial data on clinical malaria and malaria parasitaemia based on whether the study had investigated the repellent intervention in combination with insecticide‐treated bed nets. We assessed differences between subgroups using the Chi² test, with a P value less than or equal to 0.05 indicating statistically significant differences between subgroups.
Sensitivity analysis
We performed sensitivity analysis on the primary outcome to see the effect of exclusion of trials at high risk of bias (for improper randomization methods and allocation concealment) on overall results. The same analysis was done to investigate whether the exclusion of being placebo‐controlled had an effect. If the ICC value was estimated, we carried out sensitivity analyses to investigate the impact of varying the ICC on results from the meta‐analysis.
We conducted three sensitivity analyses to test the robustness of our results:
-
sensitivity analysis 1: excluded trials at high risk of bias for improper randomization and allocation concealment;
-
sensitivity analysis 2: excluded non‐placebo controlled trials;
-
sensitivity analysis 3: varied the estimated ICC for trials that did not report ICC.
Results
Description of studies
Results of the search
We searched the available literature up to 26 June 2017 and identified 440 citations from the electronic database searches and three from other sources. We identified two duplicates. We screened 441 articles by title and abstract. We selected abstracts that potentially matched our inclusion criteria, and also articles where it was unclear whether or not they fulfilled the inclusion criteria, for full‐text assessment. We excluded 425 articles and identified 16 full‐text articles for further assessment. After full‐text assessment of these articles, we excluded and listed six articles; and we gave reasons for exclusion in the Characteristics of excluded studies table. Ten articles met the inclusion criteria and were included in the qualitative and quantitative synthesis. We have illustrated the study selection process in Figure 1.
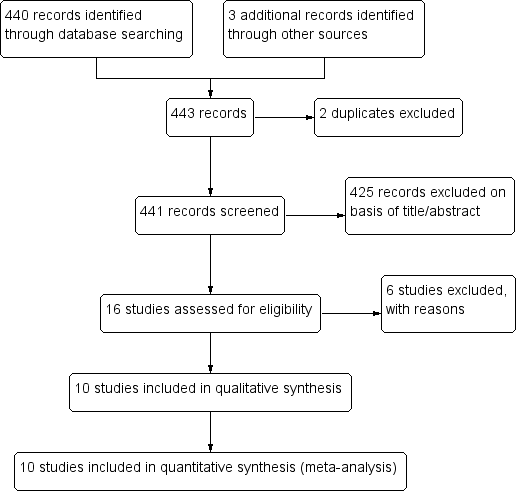
Study flow diagram.
Included studies
Two RCTs, McGready 2001 and Soto 1995, and eight cRCTs — Chen‐Hussey 2013, Hill 2007, Hill 2014, Rowland 1999, Rowland 2004, Sangoro 2014a, Sluydts 2016, and Syafruddin 2014 — met the inclusion criteria of this Cochrane Review. Data from McGready 2001 was obtained after we contacted the study author: the author provided the number of events (malaria cases) per treatment arm including the number of individuals who had more than one episode of P. falciparum or P. vivax. Only the first episode of P. vivax per participant was included in the analysis as individuals with multiple episodes of vivax malaria might suffer recurrent episodes of the same infection. We also contacted the authors of all the cRCTs that did not report ICC (Chen‐Hussey 2013; Hill 2007; Sangoro 2014a; Sluydts 2016): only one author provided the ICC used on their study (Sluydts 2016). The remaining studies, for which ICC was not available, were adjusted for clustering using an estimated ICC of 0.04 — obtained from Rowland 2004, a cRCT on topical repellents — as per protocol. Sensitivity analysis was done to evaluate if variation of the estimated ICC resulted in significant change to the main results and conclusions.
Six studies investigated the impact of topical repellent compared to placebo or no treatment (Chen‐Hussey 2013; Hill 2007; McGready 2001; Rowland 2004; Sangoro 2014a; Sluydts 2016). In total, 34,281 participants were included in the treatment arms and 33,016 in the control arms. The studies were conducted in a variety of countries: Laos (Chen‐Hussey 2013), Bolivia (Hill 2007), Thailand (McGready 2001), Pakistan (Rowland 2004), Tanzania (Sangoro 2014a), and Cambodia (Sluydts 2016). A variety of repellents and concentrations were used: 15% DEET (Chen‐Hussey 2013; Sangoro 2014a); 20% DEET (McGready 2001); 30% PMD (Hill 2007); 20% DEET and 0.5% permethrin (Rowland 2004); and picaridin (20% picaridin for adults and 10% picaridin for children) (Sluydts 2016). Three studies used LLINs as co‐interventions (Chen‐Hussey 2013; Hill 2007; Sangoro 2014a). Most studies included both children and adults in the population; however one study only included pregnant women (McGready 2001).
Two studies investigated the impact of ITC compared to placebo or no treatment (Rowland 2004; Soto 1995). In total, 524 individuals were in the treatment arms, and 473 individuals were in the control arms. One study was conducted with Afghan refugees in Pakistan (Rowland 1999); and the other with soldiers based in Colombia (Soto 1995). We extracted data from Rowland 1999 using inverse variance from adjusted odds ratio and confidence intervals reported in the article. The study follow‐up ranged from three to 16 weeks. Data from Soto 1995 on recorded adverse events included data from soldiers who were enrolled in the study and deployed in leishmania‐endemic regions (143 per arm). These individuals were not part of the component of the study investigating the effect of ITC on malaria incidence but because they also received the same treatments the results were included in the review regarding the outcome "recorded adverse events". No co‐interventions were used in either study.
Two studies investigated the impact of spatial repellents compared to placebo or no treatment (Hill 2014; Syafruddin 2014). One study was conducted in China with 1026 households in both the intervention and control arms. We extracted data from Syafruddin 2014 and Hill 2014 by using inverse variance from adjusted odds ratio and confidence intervals reported in the articles. The study conducted in China had a trial duration of six months and investigated 0.03% transfluthrin coils in combination with or without LLINs (Hill 2014). The other study, in Indonesia, was conducted for a period of 6 months and investigated 0.00975% metofluthrin coils. Both studies screened at start all participants enrolled for follow‐up and cleared pre‐existent malaria infections. Syafruddin 2014 was conducted in two villages with a total population of 2120 but only an active cohort of 170 participants was enrolled for follow‐up (87 in the control arm and 83 in the intervention arm). These individuals were screened and cleared at start but other villagers were not. The mosquito coils were rolled out to all village households according to treatment allocation (metofluthrin‐treated or placebo coils).
Excluded studies
Six studies were excluded: three studies only had two units of randomization (Abdulsalam 2014; Hamza 2016; Kimani 2006); one study did not specify in the published article the repellent compound that was used — we contacted the corresponding author but did not receive a response (Deressa 2014); and two were not RCTs or cRCTs (Dadzie 2013; Eamsila 1994).
Risk of bias in included studies
Overall the risk of bias in the included studies was high (see Figure 2).
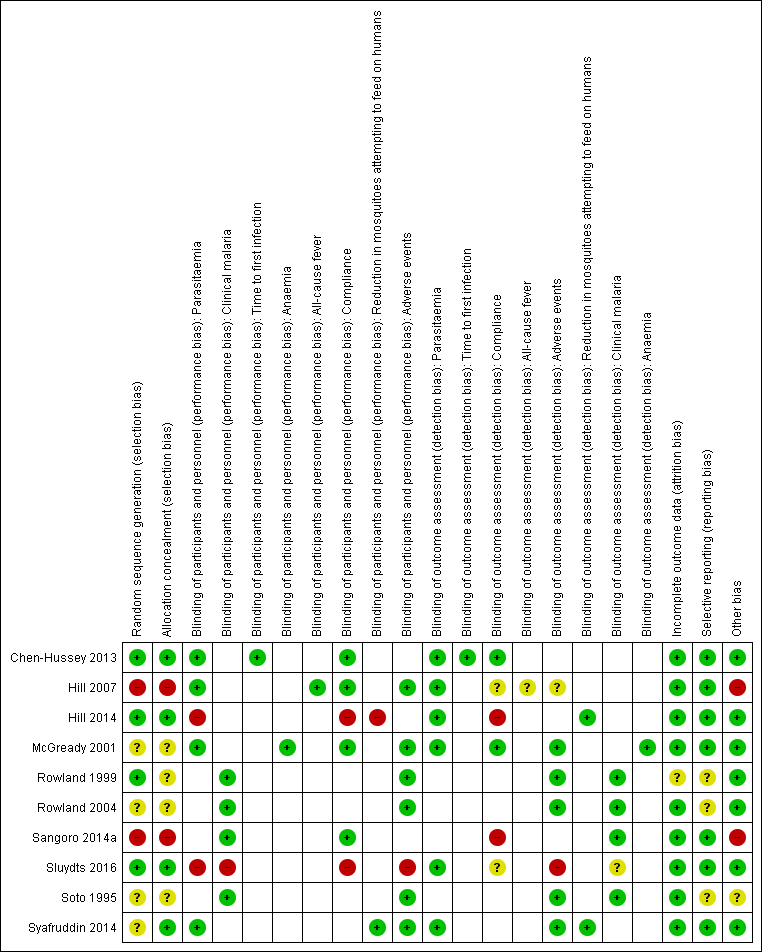
'Risk of bias' summary: review authors' judgements about each 'Risk of bias' item for each included study.
Allocation
Only three studies, Chen‐Hussey 2013, Hill 2014, and Sluydts 2016, described proper randomization and allocation concealment methods, and we therefore graded them as having low risk of selection bias. Rowland 1999 also used an adequate randomization method but did not clearly describe how allocation was performed. We considered two studies, Hill 2007 and Sangoro 2014a, to have high risk of selection bias because they used alternate allocation methods. All other studies — McGready 2001, Rowland 2004, Soto 1995, and Syafruddin 2014 — did not provide sufficient information to make a judgement about risk of bias and we judged them as having unclear risk of bias.
Blinding
Most trials were at low risk of bias and adequately blinded participants and personnel. We judged two trials, Hill 2014 and Sluydts 2016, to have high risk of performance bias as they were not placebo‐controlled. Sluydts 2016 did not provide sufficient information on how the clinical data regarding malaria cases were collected and was thus graded as having an unclear risk of bias.
Incomplete outcome data
All studies but one were graded as having low risk of attrition bias with comparable rates of loss to follow‐up between treatment arms. Rowland 1999 did not report on how many participants were lost to follow‐up from both intervention and control arm and was thus graded as having unclear risk of bias.
Selective reporting
Selective reporting bias was low for most studies. Three studies, Rowland 1999, Rowland 2004 and Soto 1995, did not have an available protocol and were therefore graded as having unclear risk of bias.
Other potential sources of bias
Two studies, Hill 2007 and Sangoro 2014a, described baseline imbalances which is considered as a potential source of bias. These two studies were assessed as having high risk of bias. One study, Soto 1995, described that soldiers were deployed to endemic areas for 3‐8 weeks but did not report deployment time per arm and so it was judged as having an unclear risk of baseline bias.
Effects of interventions
See: Summary of findings for the main comparison Topical repellents compared to placebo or no treatment for malaria prevention; Summary of findings 2 ITC compared to placebo or no treatment for malaria prevention; Summary of findings 3 Spatial repellents compared to placebo or no treatment for malaria prevention
The findings are presented by intervention type (topical repellents, ITC, and spatial repellents).
Comparison 1: topical repellents compared to placebo or no treatment for malaria prevention (see 'Summary of findings' table 1)
Clinical malaria caused by P. falciparum
Three studies investigated the impact on clinical malaria caused by P. falciparum (Rowland 2004; Sangoro 2014a; Sluydts 2016). Overall, topical repellents had no impact on clinical malaria (risk ratio (RR) 0.65, 95% confidence interval (CI) 0.40 to 1.07, 3 studies, 4447 participants, very low certainty evidence; Analysis 1.1) Figure 3. When sub‐grouped by inclusion of LLINs we found one study that, in the absence of LLINs, reported a significant reduction in clinical malaria (RR 0.40, 95% CI 0.23 to 0.71, 1 study, 869 participants). There was no significant impact on prevention of clinical malaria when LLINs were in place (RR 0.84, 95% CI 0.55 to 1.27, 2 studies, 3578 participants). Sensitivity analysis was done by excluding Sluydts 2016 which was not placebo controlled and Sangoro 2014a which had high risk of bias because of using an alternate allocation method. We also performed sensitivity analysis in regard to the estimated ICC of 0.04 (Sangoro 2014a), by varying this value between 0.03 and 0.05. The main results did not change and point estimates remained within the same values.
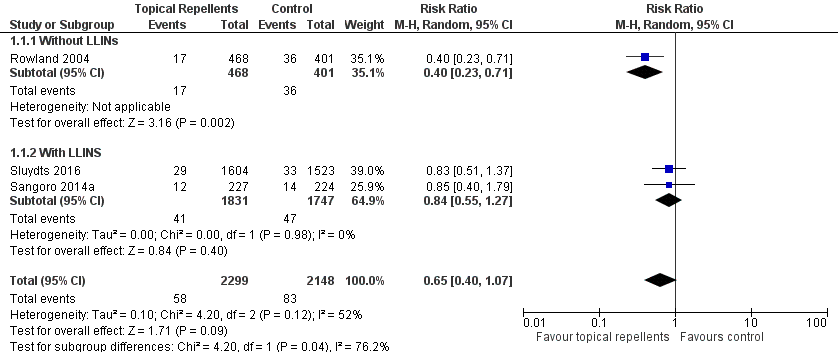
Forest plot of comparison: 1 Topical repellent compared to placebo or no treatment, outcome: 1.1 Clinical malaria caused by P. falciparum.
P. falciparum parasitaemia
Four studies investigated the impact on P. falciparum parasitaemia (Chen‐Hussey 2013; Hill 2007; McGready 2001; Sluydts 2016). Overall, topical repellents had no impact onP. falciparum parasitaemia (RR = 0.84, 95% CI 0.64 to 1.12, 4 studies, 13,310 participants, low‐certainty evidence; Analysis 1.2) Figure 4. There continued to be no impact on P. falciparum parasitaemia when used in conjunction with LLINs (RR 0.91, 95% CI 0.60 to 1.38, 3 studies, 12,413 participants) or without LLINs (RR 0.78, 95% CI 0.53 to 1.16, 1 study, 897 participants). We conducted a sensitivity analysis by excluding Sluydts 2016 as it was not placebo‐controlled: the point estimate remained the same. Point estimates were also narrowly affected by removing Hill 2007 from the analysis due to risk of bias for using alternate allocation. We also performed a sensitivity analysis by varying the ICC that was estimated for Chen‐Hussey 2013 and Hill 2007 of 0.04 between 0.03 and 0.05 and point estimates remained within the same values.

Forest plot of comparison: 1 Topical repellent compared to placebo or no treatment, outcome: 1.2 P. falciparum parasitaemia.
Clinical malaria caused by P. vivax
Two studies investigated the impact on clinical malaria for P. vivax (Rowland 2004; Sluydts 2016). Overall topical repellents had no impact on clinical malaria caused by P. vivax (RR 1.32, 95% CI 0.99 to 1.76, 2 studies, 3996 participants, low‐certainty evidence;Analysis 1.3) Figure 5. We conducted a sensitivity analysis by excluding Sluydts 2016, which was not placebo controlled. The point estimate remained close to 1 but shifted from favouring the control to favouring the intervention.

Forest plot of comparison: 1 Topical repellent compared to placebo or no treatment, outcome: 1.3 Clinical malaria caused by P. vivax.
P. vivax parasitaemia
Three studies investigated the impact on P. vivax parasitaemia (Chen‐Hussey 2013; McGready 2001; Sluydts 2016). Overall, topical repellents had no impact on P. vivax parasitaemia (RR 1.08, 95% CI 0.81 to 1.43, 3 studies, 9589 participants, low‐certainty evidence;Analysis 1.4) Figure 6. There continued to be no impact onP. vivax parasitaemia when used in conjunction with LLINs (RR 1.24, 95% CI 0.78 to 1.97, 2 studies, 8692 participants) or without LLINs (RR 0.98, 95% CI 0.68 to 1.40, 1 study, 897 participants). We conducted a sensitivity analysis by excluding Sluydts 2016, which was not placebo controlled. The main results did not change although point estimates shifted slightly in favour of the control. We also performed a sensitivity analysis by varying the ICC, estimated for Chen‐Hussey 2013 at 0.04, between 0.03 and 0.05: point estimates remained within the same values.
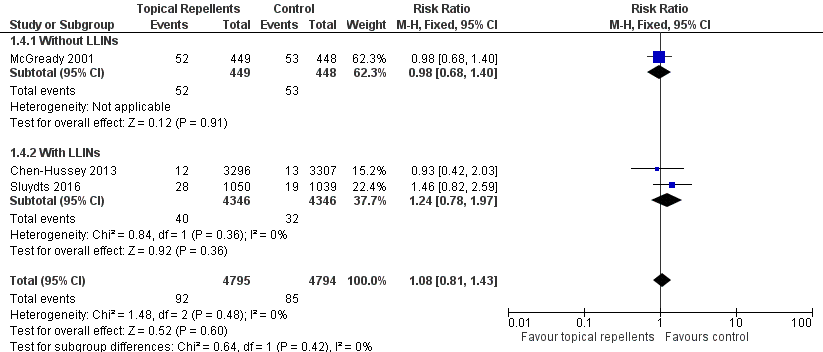
Forest plot of comparison: 1 Topical repellent compared to placebo or no treatment, outcome: 1.4 P. vivax parasitaemia.
Anaemia
One study investigated the impact on anaemia (McGready 2001). Topical repellents had no impact on anaemia (RR 1.06, 95% CI 0.91 to 1.23, 1 study, 587 participants; Analysis 1.5).
All‐cause fever
One study investigated the impact on all‐cause fever (Hill 2007). Participants that used topical repellents were half as likely to develop a fever when compared to participant in the control arm (RR 0.44, 95% CI 0.35 to 0.55, 1 study, 3496 participants; Analysis 1.6).
Adherence to the intervention
Five studies reported adherence to the intervention (Chen‐Hussey 2013; Hill 2007; McGready 2001; Sangoro 2014a; Sluydts 2016). All five report self‐reported adherence, measured monthly or weekly or non‐periodically. Four studies report a variety of methods of objective monitoring of adherence: estimating weight of repellent bottles (Chen‐Hussey 2013; Hill 2007); random sniff checks or spot checks (Hill 2007; McGready 2001); number of bottles issued to households (Sangoro 2014a). Two studies reported the proportion of participants that have been adherent to the intervention. Chen‐Hussey 2013 reported 61.3% adherence in the intervention arm and 62.2% in the control arm. Hill 2007 reported 98.5% compliance in both arms (Analysis 1.7).
Adverse events
Four studies reported adverse events (Hill 2007; McGready 2001; Rowland 2004; Sluydts 2016). Three studies used interviews to assess the occurrence of adverse events (Hill 2007; McGready 2001; Rowland 2004), of which one study also provided a questionnaire to a small sample of the study population (Rowland 2004). Sluydts 2016 did not describe the methods of measuring and recording adverse events. Very few adverse events were reported, and all related to skin irritation or warming sensation (Analysis 1.8). McGready 2001 reported the occurrence of adverse events to 6% of the participants but did not specify the nature of the adverse events or in which treatment arm they had occurred. We contacted the authors, and they informed us that all adverse events had been described as skin warming sensation and had been restricted to the study arm that had been allocated thanaka with 20% DEET. No serious adverse events were reported requiring intervention discontinuation.
Other outcomes
No data were available for the comparisons of reduction in mosquito bites and time to first infection.
Comparison 2: ITC compared to placebo or no treatment for malaria prevention (see 'Summary of findings' table 2)
Clinical malaria caused by P. falciparum
Two studies investigated the impact on clinical malaria caused byP. falciparum (Rowland 1999; Soto 1995). Overall, ITC halved the incidence of clinical malaria (RR 0.49, 95% CI 0.29 to 0.83, 2 studies, 997 participants, low‐certainty evidence;Analysis 2.1; Figure 7). Results remained the same after we conducted a sensitivity analysis by excluding Rowland 1999 (cRCT).

Forest plot of comparison: 2 ITC compared to placebo or no treatment, outcome: 2.1 Clinical malaria caused by P. falciparum.
Clinical malaria caused byP. vivax
Two studies investigated the impact on clinical malaria for P. vivax (Rowland 1999; Soto 1995). Overall, ITC reduced by 64% the risk of clinical malaria caused by P. vivax (RR 0.64, 95% CI 0.40 to 1.01, 2 studies, 997 participants, low‐certainty evidence;Analysis 2.2) Figure 8. After we carried out a sensitivity analysis by excluding Rowland 1999 (cRCT) results shifted in favour of the intervention but had wider confidence intervals, crossing the point estimate of no effect.

Forest plot of comparison: 2 ITC compared to placebo or no treatment, outcome: 2.2 Clinical malaria caused by P. vivax.
Adverse events
Two studies reported adverse events from interviews with participants (Rowland 1999; Soto 1995). Only two events of skin irritation were reported in the 997 participants across the two studies (Analysis 2.3). No serious adverse events requiring trial discontinuation were reported.
Other outcomes
No data were available for the comparison of the following outcomes: P. falciparum parasitaemia, P. vivax parasitaemia, time to first infection, anaemia, all‐cause fever, adherence to the intervention, and reduction in mosquito bites.
Comparison 3: spatial repellents compared to placebo or no treatment for malaria prevention (see 'Summary of findings' table 3)
Plasmodium species' parasitaemia
Hill 2014 investigated the impact of spatial repellents on bothP. falciparum and P. vivax infections. Syafruddin 2014 did not differentiate between Plasmodium species and presented incidence numbers of malaria irrespective of causing agent. Both studies cleared P. vivax infections at start. In order to allow a meta‐analysis and compare data from both studies, we combined the data from Hill 2014 into total number of infections caused by Plasmodium species (13 cases in total: repellent arm reported 1 case of P. falciparum and the control arm reported 2 cases of P. falciparum and 10 of P. vivax). The papers reported results adjusted for clustering and we extracted these data and entered them in the analysis. Results from the meta‐analysis show that spatial repellents had no impact onPlasmodium species' parasitaemia (RR 0.24, 95% CI 0.03 to 1.72, 2 studies, 6683 participants, very low certainty evidence; Analysis 3.1) Figure 9.
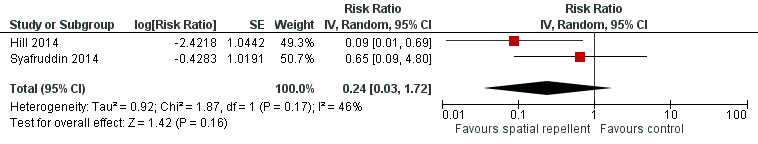
Forest plot of comparison: 3 Spatial repellents compared to placebo or no treatment, outcome: 3.1 Plasmodium spp. parasitaemia.
Adherence to the intervention
One study — Hill 2014 — reported adherence to the intervention through self‐reporting and counting of empty coil boxes using a monthly survey. Hill 2014 reported compliance between 89.3% and 97.8% in the control arm and between 98.5% and 98.6% in the treatment arm (Analysis 3.2).
Reduction in mosquito bites
One study reported reduction in mosquito bites (Hill 2014). The mean number of bites was 2.1 in the spatial repellent arm (standard deviation (SD) 1.9) and 12.9 (SD 7.6) in the control arm (Analysis 3.3). Syafruddin 2014 also measured the reduction in mosquito bites caused by use of metofluthrin coils. Syafruddin 2014 reported a 32.9% reduction in mosquito landings in households using the metofluthrin coils, however the data presented in the article could not be extracted and added to the meta‐analysis.
Adverse events
One study investigated adverse events related to the use of mosquito coils (Syafruddin 2014). Participants were interviewed during random spot‐checks and asked if any adverse event had occurred. No adverse events were reported.
Other outcomes
No data were available for the comparison of the following outcomes: clinical malaria caused by P. falciparum or P. vivax; time to first infection; anaemia; and all‐cause fever.
Discussion
We have discussed the findings of the main outcomes by intervention type (topical repellents, ITC, and spatial repellents).
Summary of main results
Topical repellents
Results from the overall meta‐analysis indicate that the included trials did not demonstrate that topical repellents have a protective effect against clinical malaria caused by either P. falciparum or P. vivax (very low certainty evidence and low‐certainty evidence respectively). The same was observed in trials that used active case detection and measured the effect of topical repellents on malaria parasitaemia caused by P. falciparum or P. vivax (low‐certainty evidence). Regarding P. vivax infections, topical repellents may in fact increase the risk of infection. However, it is unclear if this result has a plausible biological explanation or if the finding was due to confounding factors. The most likely possible confounding factor is the recrudescent infections that may have been unbalanced between study arms because none of the studies investigating topical repellents cleared parasites at start. Subgroup analysis was undertaken to assess trials conducted with and without LLINs as co‐interventions. Only two studies, which were both conducted with displaced populations, did not include LLINs. Rowland 2004 reported fewer P. falciparum malaria cases in the intervention group given repellent soap (RR 0.40, 95% CI 0.23 to 0.71); however McGready 2001 measured no reduction in malaria infection incidence by either P. falciparum or P. vivax. Trials where LLINs were distributed to the participants and repellents were used as an additional protective generally reported no additional protection against malaria.
Compliance was an issue in the included studies (see Table 1). Most studies reported poor compliance or difficulty in reliably measuring compliance. Most studies used self‐reporting methods such as interviews and questionnaires or indirect methods such as weighing bottles or counting bottles of repellents. These methods are not reliable as participants may lie to please the investigating team (response bias), dispose of the repellent or share the repellent bottles with others. Sluydts 2016 conducted an observational study where compliance was evaluated in a pool of households from different clusters and observed compliance between 6% and 15%, as opposed to self‐reported compliance of 70%. Other studies — Chen‐Hussey 2013 and Sangoro 2014a — also reported difficulties measuring compliance. Self‐reported compliance was generally found to be high (> 80%); however the unreliable nature of the data might overestimate compliance. The issue of compliance may relate to product acceptability. Social studies showed that participants liked using topical repellents (Rowland 2004), but often forgot to use them or did not use them appropriately (Chen‐Hussey 2013). It is questionable if topical repellents can be used for malaria prevention in the general population as daily compliance and poor standardization (amount of repellent used, surface area applied, time of application, and period between repeated applications) are major limitations of this intervention. In addition, poor compliance leads to a decrease in study power and requires studies with very large numbers of participants which are also increasingly unfeasible as malaria prevalence drops across regions.
| Study | Intervention group | Design | Method of assessing compliance | Unit | Follow‐up time | Compliance level1 | |
| Intervention arm | Placebo arm | ||||||
| Topical repellent | cRCT | Self‐reported compliance. Self‐reported combined with an estimation of the proportion of lotion used by the participant by weighing the returned bottles. | Percentage of self‐reported participants/night that adhered to the assigned treatment in a given month. Participants who reported to have used the repellent and confirmed by the weight of returned bottles. | Monthly surveys | Moderate: 61.3% | Moderate: 62.2% | |
| Topical repellent | cRCT | Self‐reported compliance through questionnaires combined with an estimation of the amount used by weighing the returned bottles, and verified by unannounced “sniff checks”. | Cumulative percentage of compliant households per month. A household was considered non‐compliant if they had reported to have not used the repellent 3 or more nights in a month or had more than 30 ml left in the bottle. | Monthly surveys | High: 98.5% (119/8164) | High: 98.5% (110/7876) | |
| Spatial repellent | cRCT | Daily recordings of compliance per household were reported by village leaders. Compliance was further confirmed by counting the number of empty mosquito coil boxes in each house. | Cumulative percentage of compliant households per month. A household was considered non‐compliant if it did not use the coils for 3 days or longer in one month. | Monthly surveys | High No treatment arm: 89.3% LLIN arm: 97.8% | High Repellent coils arm: 98.6% Repellent coils + LLINs: 98.5% | |
| Topical repellent | RCT | Weekly self‐reporting and random spot checks. | Cumulative percentage of compliant participants per week. | Weekly surveys | Unclear Compliance was reported to be similar across treatment arms (P = 0.24) but was not reported for each arm. Self‐reported compliance: 90.5% (87,715/96,955) Compliance measured by spot checks: 84.6% (1918/2267) | ||
| Topical repellent | cRCT | Self‐reported compliance through questionnaires combined with an estimation of the amount used by counting the empty returned bottles. | Mean number of bottles of repellent issued to each household per month. | Monthly surveys | Unclear Authors stated that self‐reported data was unreliable so they used the data from the empty bottles to estimate compliance. Compliance was poorly reported. The authors reported mean number of bottles issued per household per month rather than estimating the compliance level for each treatment arm: Repellent arm: 6.73 bottles (95% CI 6.51 to 6.95) Placebo arm: 6.92 bottles (95% CI 6.68 to 7.16) | ||
| Topical repellent | cRCT | Self‐reported compliance was assessed using questionnaires during 3 surveys in October 2012, March 2013 and October 2013. The repellent consumption rate was measured per family every 2 weeks during the repellent distribution by visual inspection of the leftover repellent divided into categories (for example, empty, half full, full). A social science study was done to assess the acceptability and use of repellents in 10 selected clusters. | Unit of measurement was not clearly defined. Self‐reported compliance is likely the percentage of compliant households during the survey period but was not defined in the article. The repellent consumption rate was not reported. Social study reported percentage of participants observed to comply with the application of the repellent from a small selection of 10 clusters in the intervention group. | Non‐periodic surveys (in October 2012, March 2013 and October 2013) along the duration of the trial. | Self‐reported compliance was reported around 70%. However, observational studies reported compliance between 6% and 15% . | No placebo | |
1Levels of compliance: high: > 80%; moderate: 50% to 79%; low: < 50%.
The included studies were performed in diverse ecological and epidemiological settings (see Table 2), across hypo‐endemic regions (malaria prevalence < 5%) (Chen‐Hussey 2013; Hill 2007; Sluydts 2016), and meso‐endemic regions (malaria prevalence 5% to 15%) (McGready 2001; Rowland 2004; Sangoro 2014a), using both active and passive case detection and different diagnostic methods (see Table 3). We used malaria prevalence data from each study's control to calculate the necessary sample size and noted that except for Rowland 2004, which was only slightly underpowered, all other studies were severely underpowered. Even the very large trial that was conducted in Cambodia with over 48,000 participants was severely underpowered, effectively needing over half a million participants to reach its objectives (Sluydts 2016). Reasons included the very low prevalence of malaria in the study area (< 2%) as well as the large size of the clusters which reduced the effective sample size after adjusting for clustering. The sample size estimation that we calculated assumed 100% compliance, which is unrealistic, meaning that the sample sizes would need to be even larger. The sample size for a cRCT aiming to investigate the effect of topical repellents on malaria needs to be so large that its feasibility is questionable, making it arguable if RCTs and cRCTs are the best methodology. There is undeniable evidence from entomological studies that topical repellents can provide bite protection from mosquitoes and reduce vector‒human contact, making them a very efficient personal protection tool, but our review results conclude that, despite their high efficiency, topical repellents as an intervention might have very poor effectiveness with regard to malaria prevention.
| Study | Intervention | Design | Transmission intensity1,2 | Region | Main malaria vectors | Biting times | Efficacy of the intervention at repelling Anophelines tested at baseline? (V/N) |
| Topical repellent | cRCT | Hypoendemic 0.83% P. falciparum 0.4% P. vivax Measured through active case detection | South East Asia ‐ Laos | Anopheles dirus An. minimus An. maculatus | From 18:00 to 2:00 with peak biting time from 21.00 to 02.00. | No | |
| Topical repellent | cRCT | Hypoendemic 0.31% P. falciparum Measured through active case detection | South America: Bolivian Amazon Region | An. darlingi | Peak biting activity between 8 p.m. and 10 p.m. | Yes | |
| Spatial repellent | cRCT | Hypoendemic 0.06% P. falciparum 0.28% P. vivax Measured through active case detection | South East Asia: Yunnan Province of China | An. sinensis An. minimus An. kochi An. splendidus An barbirostris An. vagus An. jeyporiensis An. annularis An. philippinsis An. tessallatus An. maculatus An. barbumbrosus An. dirus An culicifacies | Given the diversity of vectors in the area the biting activity occurs from early evening extending to later in the night. | Yes | |
| Topical repellent | RCT | Mesoendemic 11.4% P. falciparum 11.8% P. vivax Measured through active case detection | South East Asia: Thailand | Not reported | Not reported | No | |
| Insecticide treated clothing | cRCT | Holoendemic 20.7% P. falciparum 17.6% P. vivax Measured through passive case detection | North Western Pakistan | An. nigerrimus An. subpictus An. stephensi | Not reported | Yes | |
| Topical repellent | cRCT | Mesoendemic 8.9% P. falciparum 11.7% P. vivax Measured through passive case detection | Asia: Pakistan | An. culicifacies An. stephensi An. nigerrimus An. pulcherrimus | Mosquito biting starts after dusk, peaks around 9 p.m. to 11 p.m. then declines gradually through the night. | Yes | |
| Topical repellent | cRCT | Mesoendemic 6.22% P. falciparum Measured through passive case detection | East Africa: Tanzania | An gambiae s.s. An arabiensis | Biting activity starts early evening and continues into the later hours of the night. | Yes | |
| Topical repellent | cRCT | Hypoendemic 1.33% P. falciparum 1.85% P. vivax Measured through active case detection | Southeast Asia: Cambodia | An. dirus s.s. An. maculatus An barbirostris An. minimus s.s. An. sawadwongporni An aconitus | Early evening biting was common. | Yes | |
| Insecticide‐treated clothing | RCT | Mesoendemic for P.vivax and Hypoenemic for P. falciparum 3.4% P. falciparum 10.4% P. vivax Measured through passive case detection | South America: Colombia | Unclear | Not reported | No | |
| Spatial repellent | cRCT | Holoendemic for Plasmodium spp. 70.1% Plasmodium spp. Measured through passive case detection | Asia: Indonesia | An. sundaicus An. subpictus s.l. An. indefinitus An. vagus An. barbirostris An. annularis An. maculatus An. aconitus An. kochi An. tessellatus | Early evening biting was common with peaks between 18:00 and 20:00 continuing throughout the night. The high diversity of vectors also reflected diverse biting patterns. | Yes |
1Transmission intensity: holo‐endemic: malaria prevalence > 15%; meso‐endemic: malaria prevalence 5% to 15%; and hypo‐endemic: malaria prevalence < 5%.
2Calculated from prevalence in the control group.
| Study | Intervention | Design | Diagnostic method | Validated | Plasmodium species in the region | Participants screened and cleared for vivax (Y/N) |
| Topical repellent | cRCT | mRDT | Yes, by PCR | 80% P. falciparum 20% P. vivax | No | |
| Topical repellent | cRCT | mRDT | No | P. falciparum P. vivax | No1 | |
| Spatial repellent | cRCT | mRDTs | Yes, positive RDTs were validated through thick blood slide. | 32% P. falciparum 58% P. vivax | Yes | |
| Topical repellent | RCT | Blood smear | No | P. falciparum P. vivax | No | |
| Insecticide‐treated clothing | cRCT | Blood smear | No | P. falciparum P. vivax | No | |
| Topical repellent | cRCT | Blood smear | No | P. falciparum P. vivax | No | |
| Topical repellent | cRCT | mRDT | Unclear if microscopy was used for validation of positive mRDTs | Mainly P. falciparum | No1 | |
| Topical repellent | cRCT | PCR | No | P. falciparum P. vivax | No | |
| Insecticide‐treated clothing | RCT | Blood smear | No | P. falciparum P. vivax | No | |
| Spatial repellent | cRCT | Blood smear | No | P. falciparum P. vivax | Yes |
1mRDT was only specific for P. falciparum.
ITC
Results from the meta‐analysis trials indicate that ITC may protect against clinical malaria caused by either P. falciparum or P. vivax (low‐certainty evidence). The studies were conducted with soldiers and refugees who did not have access to LLINs or other personal protection tools. Compliance with the intervention was not measured in either trial but it is highly likely to have been high, given the limited options of soldiers and refugees with regard to clothing. Also, studies reported that participants perceived additional protection from other insects, such as fleas and bedbugs, suggesting a high product acceptability.
Spatial repellents
A meta‐analysis of the outcome Plasmodium species' parasitaemia was performed. Both studies cleared P.vivax infections at start (Hill 2014; Syafruddin 2014). Results from the meta‐analysis did not demonstrate a protective effect of spatial repellents against acquiring Plasmodium species' parasitaemia (very low certainty evidence). There was a considerable heterogeneity between the studies and very large confidence intervals around the point estimates. The studies used two different volatile pyrethroids: Hill 2014 used transfluthrin 0.03% and Syafruddin 2014 used metofluthrin 0.00925%. However this difference between the studies is an unlikely explanation for the observed heterogeneity because both compounds were tested before trial start and reported to reduce vector biting rates (Barbara 2011; Hill 2014). Hill 2014 was severely underpowered and reported very few events — the study took place in an area with very low malaria transmission (see Table 2). Syafruddin 2014 was done in an area with higher malaria prevalence (see Table 2); however it only followed up 170 individuals (83 in the intervention arm and 87 in the control arm) and was also underpowered.
Overall completeness and applicability of evidence
Studies on topical repellents were undertaken in various malaria‐endemic countries (Bolivia, Cambodia, Laos, Pakistan, Tanzania, and Thailand) with malaria prevalence ranging between 0.31% and 11.4% forP. falciparum and 0.4% and 11.8% for P. vivax (see Table 2). Most studies were conducted with entire resident communities, involving adults and children of all ages. One study focused strictly on displaced pregnant women of Karen ethnicity in Thailand;and one study was conducted amongst Afghan refugees in a refugee camp in Pakistan. Some of the studies investigated topical repellents as complementary tool to LLINs. Given that LLINs are highly effective against malaria and are the backbone of all national malaria control programs, studies that did not include them may not be providing useful information to policy makers. However the included studies that did not use LLINs were conducted with vulnerable displaced populations and therefore the results may still be applicable to disaster situations or other situations where LLIN use may be compromised. Compliance may have affected the results of some of the included studies; however low compliance reflects what is likely to happen in the 'real world' and suggests that topical repellents may not be an option for malaria control programmes.
With regard to ITC, no study has been done in the general population. Both studies involved vulnerable populations: soldiers deployed in malaria‐endemic regions (Soto 1995); and refugees (Rowland 1999). These populations are exposed to a higher risk of malaria, potentially have lower immunity than resident populations of that endemic area, live in harsher conditions and potentially wash their clothing less frequently and differently compared to the general population. This might have implications on the efficacy and effectiveness of the intervention. It is arguable if the results from our meta‐analysis are applicable to the general population; further studies on civilian and undisplaced populations would be of interest to policy makers as ITC may to some extent reduce the risk of malaria. It is also important to evaluate the benefit of using ITC in combination with LLINs, as studies available so far did not include LLINs in their design and may not provide adequate information on the additional protection it may provide to populations who already use LLINs.
Two studies investigating spatial repellents met the inclusion criteria for this review. The studies were both conducted in Asia (China and Indonesia) amongst the general population. It is unclear if the studies could be representative of other regions.
This review focused on malaria; however, mosquito repellents may have a broader applicability in regard to protection from other vector‐borne diseases particularly transmitted by Aedes mosquitoes, such as dengue, chikungunya, and Zika viruses. An additional systematic review addressing this limitation would summarize the available evidence of the effect of this intervention on Aedes‐borne diseases.
Quality of the evidence
The results of the main outcomes were graded as either very low or low‐certainty evidence. We downgraded mainly due to risk of bias generated by improper methodologies for random sequence generation and allocation concealment; and by imprecision, as most studies were severely underpowered, estimates had wide confidence intervals, there were very few events, and the point estimate included the point of no effect (RR = 1). In the case of spatial repellents we also downgraded for inconsistency, as trials reported very different results, leading to a high degree of unexplainable heterogeneity.
Potential biases in the review process
We attempted to minimize bias in the review process by conducting a comprehensive search of published and unpublished literature, without language restrictions. Two review authors, who had no involvement in the included study, independently screened abstracts, extracted data and assessed risk of bias. We resolved any discrepancies by involving a third review author. We were unable to create funnel plots to assess reporting biases, since fewer than 10 RCTs/cRCT per intervention (topical repellents, ITC and spatial repellents) met the inclusion criteria.
Agreements and disagreements with other studies or reviews
A systematic review done by Wilson 2014 which included randomized and non‐RCTs on topical repellents concluded that these are unlikely to provide effective protection against malaria and called for further well‐designed trials. Our findings are in accordance with Wilson 2014, as we also conclude that there is insufficient evidence to make recommendations regarding topical repellents for malaria prevention. We did not find any other systematic review which aimed to investigate the effect of spatial repellents or ITC on malaria prevention.

Study flow diagram.

'Risk of bias' summary: review authors' judgements about each 'Risk of bias' item for each included study.

Forest plot of comparison: 1 Topical repellent compared to placebo or no treatment, outcome: 1.1 Clinical malaria caused by P. falciparum.

Forest plot of comparison: 1 Topical repellent compared to placebo or no treatment, outcome: 1.2 P. falciparum parasitaemia.

Forest plot of comparison: 1 Topical repellent compared to placebo or no treatment, outcome: 1.3 Clinical malaria caused by P. vivax.

Forest plot of comparison: 1 Topical repellent compared to placebo or no treatment, outcome: 1.4 P. vivax parasitaemia.
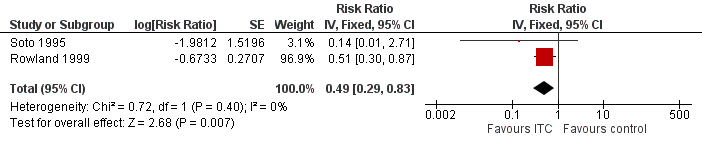
Forest plot of comparison: 2 ITC compared to placebo or no treatment, outcome: 2.1 Clinical malaria caused by P. falciparum.

Forest plot of comparison: 2 ITC compared to placebo or no treatment, outcome: 2.2 Clinical malaria caused by P. vivax.

Forest plot of comparison: 3 Spatial repellents compared to placebo or no treatment, outcome: 3.1 Plasmodium spp. parasitaemia.
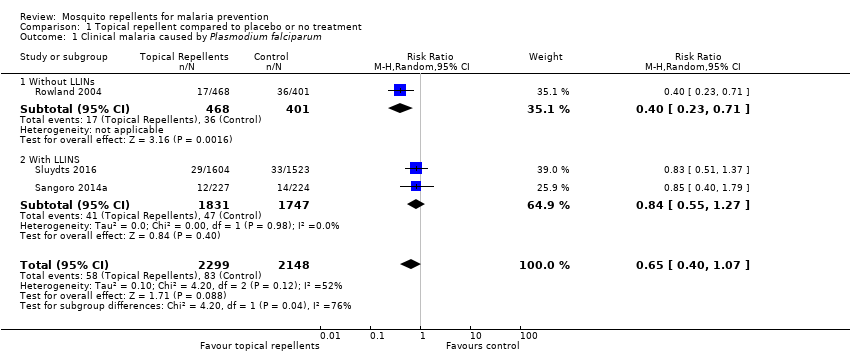
Comparison 1 Topical repellent compared to placebo or no treatment, Outcome 1 Clinical malaria caused by Plasmodium falciparum.

Comparison 1 Topical repellent compared to placebo or no treatment, Outcome 2 Plasmodium falciparum parasitaemia.
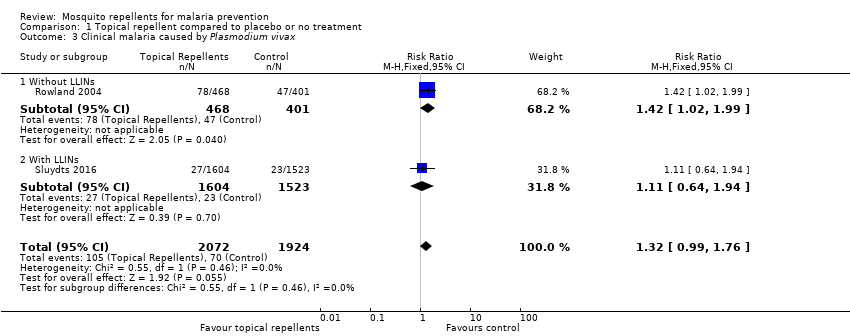
Comparison 1 Topical repellent compared to placebo or no treatment, Outcome 3 Clinical malaria caused by Plasmodium vivax.

Comparison 1 Topical repellent compared to placebo or no treatment, Outcome 4 Plasmodium vivax parasitaemia.

Comparison 1 Topical repellent compared to placebo or no treatment, Outcome 5 Anaemia.
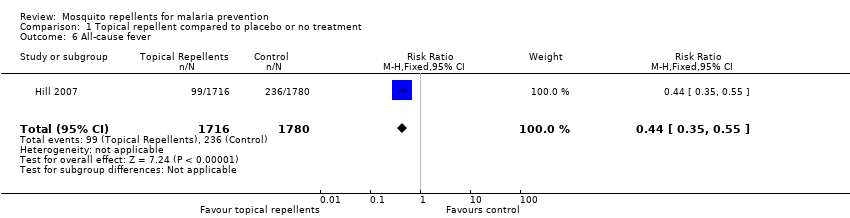
Comparison 1 Topical repellent compared to placebo or no treatment, Outcome 6 All‐cause fever.
| Study | Follow up length | Method | Compliance repellent arm | Compliance treatment arm |
| Chen‐Hussey 2013 | Monthly | Self reporting Estimating weight of repellent bottles. | 61.3% | 62.2% |
| Hill 2007 | Monthly | Self reporting Random unanounced "sniff check" Estimating weight of repellent bottles. | 98.5% | 98.5% |
| McGready 2001 | Weekly | Self reporting Random spot checks | Unclear | Unclear |
| Sangoro 2014a | Monthly | Self reporting Mean number of bottles issued to each household | Unclear | Unclear |
| Sluydts 2016 | Non‐periodic | Self reporting Observational studies | Unclear | Unclear |
Comparison 1 Topical repellent compared to placebo or no treatment, Outcome 7 Adherence to the intervention.
| Study | Follow up length | Method | Unit | Description of adverse events | Intervention arm | Control arm |
| Hill 2007 | Monthly surveys | Interview | Even per household | None reported | 0/424 | 0/436 |
| McGready 2001 | Weekly surveys | Interview | Unclear | 6% of the participants reported skin warming sensation. | Unclear | Unclear |
| Rowland 2004 | End of trial | Interviews and questionnaires to 20 households from each treatment arm | Event per household | Skin irritation | 1/20 | 0/20 |
| Sluydts 2016 | Unclear | Unclear | Unclear | Not described | 41/unclear | |
Comparison 1 Topical repellent compared to placebo or no treatment, Outcome 8 Adverse events.
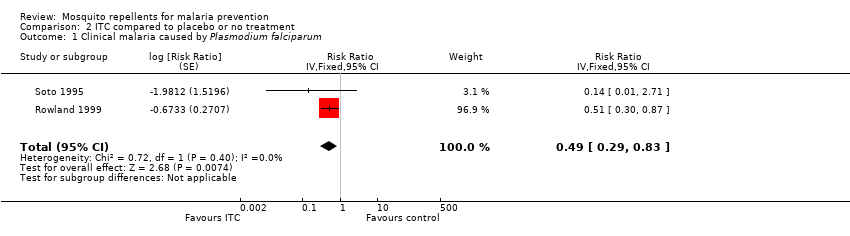
Comparison 2 ITC compared to placebo or no treatment, Outcome 1 Clinical malaria caused by Plasmodium falciparum.
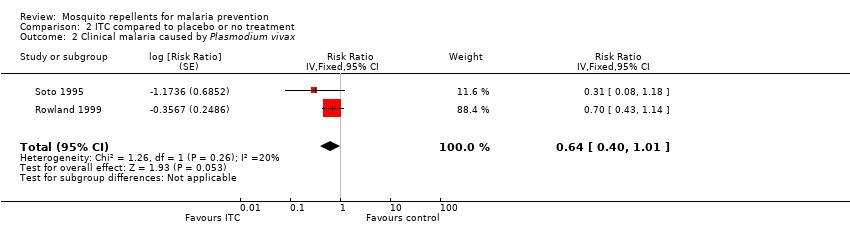
Comparison 2 ITC compared to placebo or no treatment, Outcome 2 Clinical malaria caused by Plasmodium vivax.
| Study | Follow up length | Method | Unit | Description of adverse events | Intervention arm | Control arm |
| Rowland 1999 | 16 weeks | Interview | Event per household | None reported | 0/438 | 0/387 |
| Soto 1995 | End of trial | Interview | Event per participant | Skin irritation | 2/229 | 0/229 |
Comparison 2 ITC compared to placebo or no treatment, Outcome 3 Adverse events.

Comparison 3 Spatial repellents compared to placebo or no treatment, Outcome 1 Plasmodium spp. parasitaemia.
| Study | Follow up length | Method | Compliance control arms | Compliance treatment arms |
| Hill 2014 | monthly survey | Self reporting Counting of empty coil boxes | No treatment arm: 89.3% LLINs only arm: 97.8% | Repellent coils arm: 98.6% Repellent coils + LLINs arm: 98.5% |
Comparison 3 Spatial repellents compared to placebo or no treatment, Outcome 2 Adherence to the intervention.
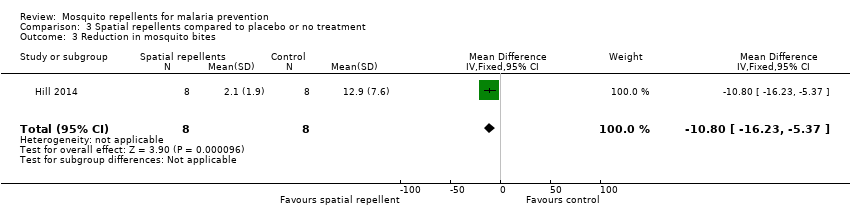
Comparison 3 Spatial repellents compared to placebo or no treatment, Outcome 3 Reduction in mosquito bites.
| Study | Follow‐up length | Method | Unit | Description of adverse events | Intervention arm | Control arm |
| Syafruddin 2014 | 6 months | Interviews | Random spot‐checks | None described | None reported | None reported |
Comparison 3 Spatial repellents compared to placebo or no treatment, Outcome 4 Adverse events.
| Topical repellents compared to placebo or no treatment for malaria prevention | ||||||
| Patient or population: malaria prevention | ||||||
| Outcomes | Anticipated absolute effects* (95% CI) | Relative effect | Number of participants | Certainty of the evidence | Comments | |
| Risk with Placebo or no treatment | Risk with Topical repellents | |||||
| Clinical malaria: P. falciparum | 39 per 1000 | 25 per 1000 | RR 0.65 | 4450 | ⊕⊝⊝⊝ Due to risk of bias, inconsistency and imprecision | We do not know if topical repellents have an effect on malaria cases caused by P. falciparum. We have very little confidence in the effect estimate. The true effect is likely to be substantially different from the estimate of effect. |
| Parasitaemia: P. falciparum | 15 per 1000 | 12 per 1000 | RR 0.84 | 13,310 | ⊕⊕⊝⊝ Due to risk of bias and imprecision | Topical repellents may or may not have a protective effect against P. falciparum parasitaemia. Our confidence in the effect estimate is limited. The true effect may be substantially different from the estimation of the effect. |
| Clinical malaria: P. vivax | 36 per 1000 | 48 per 1000 | RR 1.32 | 3996 | ⊕⊕⊝⊝ Due to risk of bias and imprecision | Topical repellents may increase the number of clinical cases caused by P. vivax. Our confidence in the effect estimate is limited. The true effect may be substantially different from the estimation of the effect. |
| Parasitaemia: P. vivax | 18 per 1000 | 19 per 1000 | RR 1.07 | 9434 | ⊕⊕⊝⊝ Due to risk of bias and imprecision | Topical repellents may or may not have a protective effect against P. vivax parasitaemia Our confidence in the effect estimation is limited. The true effect may be substantially different from the estimation of the effect. |
| *The risk in the intervention group (and its 95% CI) is based on the assumed risk in the comparison group and the relative effect of the intervention (and its 95% CI). | ||||||
| GRADE Working Group grades of evidence | ||||||
| 1Downgraded by 1 for risk of bias: Sangoro 2014a used alternate allocation and reported a baseline imbalance; random sequence generation and allocation concealment were not described by Rowland 2004; and Sluydts 2016 did not have a placebo so the intervention was not blinded. | ||||||
| ITC compared to placebo or no treatment for malaria prevention | ||||||
| Patient or population: malaria prevention | ||||||
| Outcomes | Anticipated absolute effects* (95% CI) | Relative effect | Number of participants | Certainty of the evidence | Comments | |
| Risk with placebo or no treatment | Risk with ITC | |||||
| Clinical malaria: P. falciparum | 35 per 1000 | 17 per 1000 | RR 0.49 | 997 | ⊕⊕⊝⊝ Due to risk of bias and imprecision | Insecticide‐treating clothing may have a protective effect against malaria caused by P. falciparum. Our confidence in the effect estimate is limited. The true effect may be substantially different from the estimate of the effect. |
| Clinical malaria: P. vivax | 116 per 1000 | 74 per 1000 | RR 0.64 | 997 | ⊕⊕⊝⊝ Due to risk of bias and imprecision | Insecticide‐treated clothing may have a protective effect against malaria caused by P. vivax. Our confidence in the effect estimate is limited. The true effect may be substantially different from the estimate of the effect. |
| *The risk in the intervention group (and its 95% CI) is based on the assumed risk in the comparison group and the relative effect of the intervention (and its 95% CI). | ||||||
| GRADE Working Group grades of evidence | ||||||
| 1Downgraded by 1 for risk of bias: Soto 1995 did not describe how randomization and allocation concealment was assured; and had unclear risk of baseline bias because did not report how long soldiers in each arm were deployed to malaria endemic areas. Rowland 1999 did not describe the method used for allocation concealment. | ||||||
| Spatial repellents compared to placebo or no treatment for malaria prevention | ||||||
| Patient or population: malaria prevention | ||||||
| Outcomes | Anticipated absolute effects* (95% CI) | Relative effect | Number of participants | Certainty of the evidence | Comments | |
| Risk with placebo or no treatment | Risk with Spatial repellents | |||||
| Parasitaemia Plasmodium spp. | 10 per 1000 | 2 per 1000 (0 to 18) | RR 0.24 (0.03 to 1.72) | 6683 (2 studies) | ⊕⊝⊝⊝ Due to risk of bias, imprecision and inconsistency | We do not know if spatial repellents protect against malaria. We have very little confidence in the effect estimate. The true effect is likely to be substantially different from the estimate of effect. |
| *The risk in the intervention group (and its 95% CI) is based on the assumed risk in the comparison group and the relative effect of the intervention (and its 95% CI). | ||||||
| GRADE Working Group grades of evidence | ||||||
| 1Downgraded by 1 for risk of bias: Hill 2014 was not blinded. | ||||||
| Study | Intervention group | Design | Method of assessing compliance | Unit | Follow‐up time | Compliance level1 | |
| Intervention arm | Placebo arm | ||||||
| Topical repellent | cRCT | Self‐reported compliance. Self‐reported combined with an estimation of the proportion of lotion used by the participant by weighing the returned bottles. | Percentage of self‐reported participants/night that adhered to the assigned treatment in a given month. Participants who reported to have used the repellent and confirmed by the weight of returned bottles. | Monthly surveys | Moderate: 61.3% | Moderate: 62.2% | |
| Topical repellent | cRCT | Self‐reported compliance through questionnaires combined with an estimation of the amount used by weighing the returned bottles, and verified by unannounced “sniff checks”. | Cumulative percentage of compliant households per month. A household was considered non‐compliant if they had reported to have not used the repellent 3 or more nights in a month or had more than 30 ml left in the bottle. | Monthly surveys | High: 98.5% (119/8164) | High: 98.5% (110/7876) | |
| Spatial repellent | cRCT | Daily recordings of compliance per household were reported by village leaders. Compliance was further confirmed by counting the number of empty mosquito coil boxes in each house. | Cumulative percentage of compliant households per month. A household was considered non‐compliant if it did not use the coils for 3 days or longer in one month. | Monthly surveys | High No treatment arm: 89.3% LLIN arm: 97.8% | High Repellent coils arm: 98.6% Repellent coils + LLINs: 98.5% | |
| Topical repellent | RCT | Weekly self‐reporting and random spot checks. | Cumulative percentage of compliant participants per week. | Weekly surveys | Unclear Compliance was reported to be similar across treatment arms (P = 0.24) but was not reported for each arm. Self‐reported compliance: 90.5% (87,715/96,955) Compliance measured by spot checks: 84.6% (1918/2267) | ||
| Topical repellent | cRCT | Self‐reported compliance through questionnaires combined with an estimation of the amount used by counting the empty returned bottles. | Mean number of bottles of repellent issued to each household per month. | Monthly surveys | Unclear Authors stated that self‐reported data was unreliable so they used the data from the empty bottles to estimate compliance. Compliance was poorly reported. The authors reported mean number of bottles issued per household per month rather than estimating the compliance level for each treatment arm: Repellent arm: 6.73 bottles (95% CI 6.51 to 6.95) Placebo arm: 6.92 bottles (95% CI 6.68 to 7.16) | ||
| Topical repellent | cRCT | Self‐reported compliance was assessed using questionnaires during 3 surveys in October 2012, March 2013 and October 2013. The repellent consumption rate was measured per family every 2 weeks during the repellent distribution by visual inspection of the leftover repellent divided into categories (for example, empty, half full, full). A social science study was done to assess the acceptability and use of repellents in 10 selected clusters. | Unit of measurement was not clearly defined. Self‐reported compliance is likely the percentage of compliant households during the survey period but was not defined in the article. The repellent consumption rate was not reported. Social study reported percentage of participants observed to comply with the application of the repellent from a small selection of 10 clusters in the intervention group. | Non‐periodic surveys (in October 2012, March 2013 and October 2013) along the duration of the trial. | Self‐reported compliance was reported around 70%. However, observational studies reported compliance between 6% and 15% . | No placebo | |
| 1Levels of compliance: high: > 80%; moderate: 50% to 79%; low: < 50%. | |||||||
| Study | Intervention | Design | Transmission intensity1,2 | Region | Main malaria vectors | Biting times | Efficacy of the intervention at repelling Anophelines tested at baseline? (V/N) |
| Topical repellent | cRCT | Hypoendemic 0.83% P. falciparum 0.4% P. vivax Measured through active case detection | South East Asia ‐ Laos | Anopheles dirus An. minimus An. maculatus | From 18:00 to 2:00 with peak biting time from 21.00 to 02.00. | No | |
| Topical repellent | cRCT | Hypoendemic 0.31% P. falciparum Measured through active case detection | South America: Bolivian Amazon Region | An. darlingi | Peak biting activity between 8 p.m. and 10 p.m. | Yes | |
| Spatial repellent | cRCT | Hypoendemic 0.06% P. falciparum 0.28% P. vivax Measured through active case detection | South East Asia: Yunnan Province of China | An. sinensis An. minimus An. kochi An. splendidus An barbirostris An. vagus An. jeyporiensis An. annularis An. philippinsis An. tessallatus An. maculatus An. barbumbrosus An. dirus An culicifacies | Given the diversity of vectors in the area the biting activity occurs from early evening extending to later in the night. | Yes | |
| Topical repellent | RCT | Mesoendemic 11.4% P. falciparum 11.8% P. vivax Measured through active case detection | South East Asia: Thailand | Not reported | Not reported | No | |
| Insecticide treated clothing | cRCT | Holoendemic 20.7% P. falciparum 17.6% P. vivax Measured through passive case detection | North Western Pakistan | An. nigerrimus An. subpictus An. stephensi | Not reported | Yes | |
| Topical repellent | cRCT | Mesoendemic 8.9% P. falciparum 11.7% P. vivax Measured through passive case detection | Asia: Pakistan | An. culicifacies An. stephensi An. nigerrimus An. pulcherrimus | Mosquito biting starts after dusk, peaks around 9 p.m. to 11 p.m. then declines gradually through the night. | Yes | |
| Topical repellent | cRCT | Mesoendemic 6.22% P. falciparum Measured through passive case detection | East Africa: Tanzania | An gambiae s.s. An arabiensis | Biting activity starts early evening and continues into the later hours of the night. | Yes | |
| Topical repellent | cRCT | Hypoendemic 1.33% P. falciparum 1.85% P. vivax Measured through active case detection | Southeast Asia: Cambodia | An. dirus s.s. An. maculatus An barbirostris An. minimus s.s. An. sawadwongporni An aconitus | Early evening biting was common. | Yes | |
| Insecticide‐treated clothing | RCT | Mesoendemic for P.vivax and Hypoenemic for P. falciparum 3.4% P. falciparum 10.4% P. vivax Measured through passive case detection | South America: Colombia | Unclear | Not reported | No | |
| Spatial repellent | cRCT | Holoendemic for Plasmodium spp. 70.1% Plasmodium spp. Measured through passive case detection | Asia: Indonesia | An. sundaicus An. subpictus s.l. An. indefinitus An. vagus An. barbirostris An. annularis An. maculatus An. aconitus An. kochi An. tessellatus | Early evening biting was common with peaks between 18:00 and 20:00 continuing throughout the night. The high diversity of vectors also reflected diverse biting patterns. | Yes | |
| 1Transmission intensity: holo‐endemic: malaria prevalence > 15%; meso‐endemic: malaria prevalence 5% to 15%; and hypo‐endemic: malaria prevalence < 5%. | |||||||
| Study | Intervention | Design | Diagnostic method | Validated | Plasmodium species in the region | Participants screened and cleared for vivax (Y/N) |
| Topical repellent | cRCT | mRDT | Yes, by PCR | 80% P. falciparum 20% P. vivax | No | |
| Topical repellent | cRCT | mRDT | No | P. falciparum P. vivax | No1 | |
| Spatial repellent | cRCT | mRDTs | Yes, positive RDTs were validated through thick blood slide. | 32% P. falciparum 58% P. vivax | Yes | |
| Topical repellent | RCT | Blood smear | No | P. falciparum P. vivax | No | |
| Insecticide‐treated clothing | cRCT | Blood smear | No | P. falciparum P. vivax | No | |
| Topical repellent | cRCT | Blood smear | No | P. falciparum P. vivax | No | |
| Topical repellent | cRCT | mRDT | Unclear if microscopy was used for validation of positive mRDTs | Mainly P. falciparum | No1 | |
| Topical repellent | cRCT | PCR | No | P. falciparum P. vivax | No | |
| Insecticide‐treated clothing | RCT | Blood smear | No | P. falciparum P. vivax | No | |
| Spatial repellent | cRCT | Blood smear | No | P. falciparum P. vivax | Yes | |
| 1mRDT was only specific for P. falciparum. | ||||||
| Outcome or subgroup title | No. of studies | No. of participants | Statistical method | Effect size |
| 1 Clinical malaria caused by Plasmodium falciparum Show forest plot | 3 | 4447 | Risk Ratio (M‐H, Random, 95% CI) | 0.65 [0.40, 1.07] |
| 1.1 Without LLINs | 1 | 869 | Risk Ratio (M‐H, Random, 95% CI) | 0.40 [0.23, 0.71] |
| 1.2 With LLINS | 2 | 3578 | Risk Ratio (M‐H, Random, 95% CI) | 0.84 [0.55, 1.27] |
| 2 Plasmodium falciparum parasitaemia Show forest plot | 4 | 13310 | Risk Ratio (M‐H, Fixed, 95% CI) | 0.84 [0.64, 1.12] |
| 2.1 Without LLINs | 1 | 897 | Risk Ratio (M‐H, Fixed, 95% CI) | 0.78 [0.53, 1.16] |
| 2.2 With LLINs | 3 | 12413 | Risk Ratio (M‐H, Fixed, 95% CI) | 0.91 [0.60, 1.38] |
| 3 Clinical malaria caused by Plasmodium vivax Show forest plot | 2 | 3996 | Risk Ratio (M‐H, Fixed, 95% CI) | 1.32 [0.99, 1.76] |
| 3.1 Without LLINs | 1 | 869 | Risk Ratio (M‐H, Fixed, 95% CI) | 1.42 [1.02, 1.99] |
| 3.2 With LLINs | 1 | 3127 | Risk Ratio (M‐H, Fixed, 95% CI) | 1.11 [0.64, 1.94] |
| 4 Plasmodium vivax parasitaemia Show forest plot | 3 | 9589 | Risk Ratio (M‐H, Fixed, 95% CI) | 1.08 [0.81, 1.43] |
| 4.1 Without LLINs | 1 | 897 | Risk Ratio (M‐H, Fixed, 95% CI) | 0.98 [0.68, 1.40] |
| 4.2 With LLINs | 2 | 8692 | Risk Ratio (M‐H, Fixed, 95% CI) | 1.24 [0.78, 1.97] |
| 5 Anaemia Show forest plot | 1 | 587 | Risk Ratio (M‐H, Fixed, 95% CI) | 1.06 [0.91, 1.23] |
| 6 All‐cause fever Show forest plot | 1 | 3496 | Risk Ratio (M‐H, Fixed, 95% CI) | 0.44 [0.35, 0.55] |
| 7 Adherence to the intervention Show forest plot | Other data | No numeric data | ||
| 8 Adverse events Show forest plot | Other data | No numeric data | ||
| Outcome or subgroup title | No. of studies | No. of participants | Statistical method | Effect size |
| 1 Clinical malaria caused by Plasmodium falciparum Show forest plot | 2 | Risk Ratio (Fixed, 95% CI) | 0.49 [0.29, 0.83] | |
| 2 Clinical malaria caused by Plasmodium vivax Show forest plot | 2 | Risk Ratio (Fixed, 95% CI) | 0.64 [0.40, 1.01] | |
| 3 Adverse events Show forest plot | Other data | No numeric data | ||
| Outcome or subgroup title | No. of studies | No. of participants | Statistical method | Effect size |
| 1 Plasmodium spp. parasitaemia Show forest plot | 2 | Risk Ratio (Random, 95% CI) | 0.24 [0.03, 1.72] | |
| 2 Adherence to the intervention Show forest plot | Other data | No numeric data | ||
| 3 Reduction in mosquito bites Show forest plot | 1 | 16 | Mean Difference (IV, Fixed, 95% CI) | ‐10.8 [‐16.23, ‐5.37] |
| 4 Adverse events Show forest plot | Other data | No numeric data | ||