Yoga for stroke rehabilitation
Abstract
Background
Stroke is a major health issue and cause of long‐term disability and has a major emotional and socioeconomic impact. There is a need to explore options for long‐term sustainable interventions that support stroke survivors to engage in meaningful activities to address life challenges after stroke. Rehabilitation focuses on recovery of function and cognition to the maximum level achievable, and may include a wide range of complementary strategies including yoga.
Yoga is a mind‐body practice that originated in India, and which has become increasingly widespread in the Western world. Recent evidence highlights the positive effects of yoga for people with a range of physical and psychological health conditions. A recent non‐Cochrane systematic review concluded that yoga can be used as self‐administered practice in stroke rehabilitation.
Objectives
To assess the effectiveness of yoga, as a stroke rehabilitation intervention, on recovery of function and quality of life (QoL).
Search methods
We searched the Cochrane Stroke Group Trials Register (last searched July 2017), Cochrane Central Register of Controlled Trials (CENTRAL) (last searched July 2017), MEDLINE (to July 2017), Embase (to July 2017), CINAHL (to July 2017), AMED (to July 2017), PsycINFO (to July 2017), LILACS (to July 2017), SciELO (to July 2017), IndMED (to July 2017), OTseeker (to July 2017) and PEDro (to July 2017). We also searched four trials registers, and one conference abstracts database. We screened reference lists of relevant publications and contacted authors for additional information.
Selection criteria
We included randomised controlled trials (RCTs) that compared yoga with a waiting‐list control or no intervention control in stroke survivors.
Data collection and analysis
Two review authors independently extracted data from the included studies. We performed all analyses using Review Manager (RevMan). One review author entered the data into RevMan; another checked the entries. We discussed disagreements with a third review author until consensus was reached. We used the Cochrane 'Risk of bias' tool. Where we considered studies to be sufficiently similar, we conducted a meta‐analysis by pooling the appropriate data. For outcomes for which it was inappropriate or impossible to pool quantitatively, we conducted a descriptive analysis and provided a narrative summary.
Main results
We included two RCTs involving 72 participants. Sixty‐nine participants were included in one meta‐analysis (balance). Both trials assessed QoL, along with secondary outcomes measures relating to movement and psychological outcomes; one also measured disability.
In one study the Stroke Impact Scale was used to measure QoL across six domains, at baseline and post‐intervention. The effect of yoga on five domains (physical, emotion, communication, social participation, stroke recovery) was not significant; however, the effect of yoga on the memory domain was significant (mean difference (MD) 15.30, 95% confidence interval (CI) 1.29 to 29.31, P = 0.03), the evidence for this finding was very low grade. In the second study, QoL was assessed using the Stroke‐Specifc QoL Scale; no significant effect was found.
Secondary outcomes included movement, strength and endurance, and psychological variables, pain, and disability.
Balance was measured in both studies using the Berg Balance Scale; the effect of intervention was not significant (MD 2.38, 95% CI ‐1.41 to 6.17, P = 0.22). Sensititivy analysis did not alter the direction of effect. One study measured balance self‐efficacy, using the Activities‐specific Balance Confidence Scale (MD 10.60, 95% CI ‐7.08,= to 28.28, P = 0.24); the effect of intervention was not significant; the evidence for this finding was very low grade.
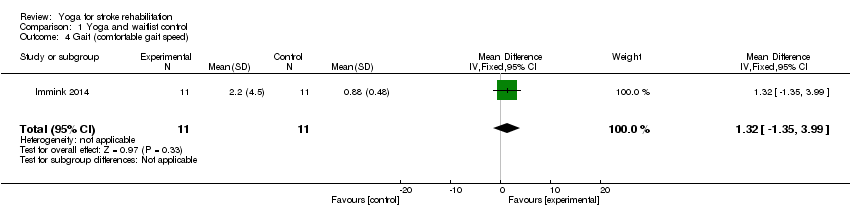
One study measured gait using the Comfortable Speed Gait Test (MD 1.32, 95% CI ‐1.35 to 3.99, P = 0.33), and motor function using the Motor Assessment Scale (MD ‐4.00, 95% CI ‐12.42 to 4.42, P = 0.35); no significant effect was found based on very low‐grade evidence.
One study measured disability using the modified Rankin Scale (mRS) but reported only whether participants were independent or dependent. No significant effect was found: (odds ratio (OR) 2.08, 95% CI 0.50 to 8.60, P = 0.31); the evidence for this finding was very low grade.
Anxiety and depression were measured in one study. Three measures were used: the Geriatric Depression Scale‐Short Form (GCDS15), and two forms of State Trait Anxiety Inventory (STAI, Form Y) to measure state anxiety (i.e. anxiety experienced in response to stressful situations) and trait anxiety (i.e. anxiety associated with chronic psychological disorders). No significant effect was found for depression (GDS15, MD ‐2.10, 95% CI ‐4.70 to 0.50, P = 0.11) or for trait anxiety (STAI‐Y2, MD ‐6.70, 95% CI ‐15.35 to 1.95, P = 0.13), based on very low‐grade evidence. However, a significant effect was found for state anxiety: STAI‐Y1 (MD ‐8.40, 95% CI ‐16.74 to ‐0.06, P = 0.05); the evidence for this finding was very low grade.
No adverse events were reported.
Quality of the evidence
We assessed the quality of the evidence using GRADE. Overall, the quality of the evidence was very low, due to the small number of trials included in the review both of which were judged to be at high risk of bias, particularly in relation to incompleteness of data and selective reporting, and especially regarding the representative nature of the sample in one study.
Authors' conclusions
Yoga has the potential for being included as part of patient‐centred stroke rehabilitation. However, this review has identified insufficient information to confirm or refute the effectiveness or safety of yoga as a stroke rehabilitation treatment. Further large‐scale methodologically robust trials are required to establish the effectiveness of yoga as a stroke rehabilitation treatment.
PICO
Plain language summary
Yoga for stroke rehabilitation
Review question
We wanted to know if yoga helps to improve quality of life for stroke survivors.
Background
Stroke is a major health issue worldwide, which affects people in many different ways. For example, stroke survivors may have problems moving around, and communicating and socialising with other people. Stroke may also affect how people feel. It may cause problems with memory and concentration. After discharge from hospital or other stroke services, stroke survivors have to cope with the long‐term effects of stroke. Research has shown that yoga can help people with other long‐term conditions to cope better. Yoga can improve quality of life (QoL).
Search date
We searched for studies published to July 2017.
Study characteristics
We found two research studies that had assessed yoga for stroke survivors. Seventy‐two people took part in the two studies. One study was in the USA and one was in Australia. On average, the stroke survivors were between 60 and 63 years old and it had been between four years three months and nine years since they had had a stroke. In the American study, yoga classes were held twice a week for eight weeks. In the Australian study, yoga classes were held once a week for 10 weeks. Both studies encouraged people to practice yoga at home, in their own time. Both studies used waiting‐list control groups. This means that people in the control group could go to yoga classes at the end of the study.
Funding sources
The American study was funded by the US Government. The Austrailian study was funded by the National Stroke Foundation (Australia).
Key results
We were able to analyse study data from 69 participants. No significant benefit was found on measures of QoL, balance, strength, endurance, pain, disability scores. No significant benefit was found on measures of movement, although one study reported a significant benefit in improving aspects of range of movement. One study reported a significant benefit in reducing anxiety. Neither study reported on measures of patient harm.
Quality of the evidence
We assessed the quality of the evidence using GRADE. Overall, the quality of the evidence was very low, due to the small number of trials included in the review, both of which we judged to be at high risk of bias, particularly in relation to incompleteness of data and selective reporting, and especially regarding the representative nature of the sample in one study.
Conclusion
The review could not identify enough high‐quality evidence on the benefits and safety of yoga in stroke rehabilitation. More good‐quality research studies are needed to be sure that yoga has benefits for stroke survivors.
Authors' conclusions
Summary of findings
| Yoga compared with waiting‐list control (yoga) for stroke | ||||||
| Patient or population: adults with stroke Settings: community Intervention: yoga Comparison: wait‐list control (yoga) | ||||||
| Outcomes | Illustrative comparative risks* (95% CI) | Relative effect | No of Participants | Quality of the evidence | Comments | |
| Assumed risk | Corresponding risk | |||||
| Waiting‐list control (yoga) | Yoga | |||||
| Quality of life: Stroke Impact Scale (SIS) SIS measures quality of life across five domains: physical (strength, hand‐function, mobility, activities of daily living), emotion, memory, communication, social participation, plus 1 global question about stroke recovery. Each dimension is scored on a 100‐point scale; the higher the score, the higher the quality of life Baseline and post‐intervention | One study: the mean Stroke Recovery Domain in the control group was 63.0 | The mean Stroke Recovery Domain in the intervention group was 2.0 higher | 22 | ⊕⊕⊝⊝ | The quality of evidence was graded as very low due to small sample size, incomplete data, and the small number of studies i.e.1 | |
| Quality of life: Stroke‐specific QoL Scale (SS QoL) The Stroke‐specific QoL Scale measures quality of life across 12 domains (49 items): self‐care, vision, language, mobility, work, upper extremity, thinking, personality, mood, family, social, and energy Each item is scored on a 5‐point Likert scale; the higher the score, the higher the quality of life (score 0‐245) Baseline and post‐intervention | One study: the mean SS QoL in the control group was 33.0 | The mean SS QoL in the intervention group was 2.8 higher | 47 (1) | ⊕⊕⊝⊝ | The quality of evidence was graded as very low due to small sample size, incomplete data, and the small number of studies i.e.1 | |
| Balance: Berg Balance Scale (BBS) 14‐item physical performance measure of static and dynamic balance (score: 0‐56) Baseline and post‐intervention | Two studies: the mean BBS ranged across control groups from 43.8‐48.5 | The mean BBS in the intervention groups was 2.4 higher (2.2, 2.5) | 69 | ⊕⊝⊝⊝ | The quality of the evidence was graded as very low due to high risk of bias in relation to sample size, incomplete data, and unrepresentative sample, across the 2 studies | |
| Gait: Comfortable Gait Speed (CGS) Gait measured over 7 metres (3 repetitions; average time calculated) Baseline and post‐intervention | One study: the mean CGS in the control group was 0.88 | The mean CGS in the intervention group was 1.32 higher | 22 | ⊕⊕⊝⊝ | The quality of evidence was graded as very low due to small sample size, and incomplete data | |
| Depression: Geriatric Depression Scale (GDS15) A 15‐item self‐report assessment used to identify depression in the elderly. A yes/no response is required for each item (score 0 or 1). Cummulative score: 0‐4 normal, 5‐9 Mild depression, 10‐15 More severe depression Baseline and post‐intervention | One study: the mean GDS15 in the control group was | The mean GDS15 in the intervention group was 2.1 | 22 | ⊕⊝⊝⊝ | The quality of evidence was graded as very low due to small sample size, incomplete data, and the small number of studies | |
| Anxiety: State Trait Anxiety (STAI‐Y1) A 40‐item, self‐report assessment of anxiety affect. State anxiety can be defined as fear, nervousness, discomfort, and the arousal of the autonomic nervous system induced temporarily by situations perceived as dangerous. Score 20‐80; higher scores suggest higher levels of anxiety Baseline and post‐intervention | One study: the mean STAI‐Y1 in the control group was | The mean STAI‐Y1 in the intervention groups was | 22 | ⊕⊝⊝⊝ | The quality of evidence was graded as very low due to small sample size, incomplete data, and the small number of studies | |
| Anxiety: Trait Anxiety Inventory (STAI‐Y2) A 40‐item, self‐report assessment of anxiety affect. Trait anxiety can be defined as a relatively enduring disposition to feel stress, worry, and discomfort. Score 20‐80; higher scores suggest higher levels of anxiety Baseline and post‐intervention | One study: the mean STAI‐Y2 in the control group was 42 | The mean STAI‐Y2 in the intervention groups was 4.7 lower | 22 | ⊕⊝⊝⊝ | The quality of evidence was graded as very low due to small sample size, incomplete data, and the small number of studies | |
| Disability: modified Rankin Scale (mRS) A measure of disability, with 6 categories: 0 (no symptoms), 1 (no significant disability), 2 (slight disability), 3 (moderate disability), 4 (moderately severe disability), 5 (severe disability), 6 (dead); reported as dependent/independent Baseline and post‐intervention | One study: 50% (n = 5) of the control group were 'independent' | In the intervention group the odds of being 'independent' were higher OR 2.08, 95% CI 0.50 to 8.60 (68%; n = 25) | 47 | ⊕⊝⊝⊝ | The quality of evidence was graded as very low due to small sample size, incomplete data, and unrepresentative sample | |
| Adverse events Post‐intervention | No data | No data | ⊕⊝⊝⊝ | No evidence available | ||
| *The basis for the assumed risk (e.g. the median control group risk across studies) is provided in footnotes. The corresponding risk (and its 95% confidence interval) is based on the assumed risk in the comparison group and the relative effect of the intervention (and its 95% CI). | ||||||
| GRADE Working Group grades of evidence | ||||||
Background
Description of the condition
With 16 million first‐ever cases worldwide each year (Hackett 2014) and a demand of 2% to 4% of total global healthcare costs (Donnan 2008), stroke has reached epidemic proportions and is currently a critical health issue worldwide (Hankey 2014). Classically, stroke is defined by the World Health Organization (WHO) as the "rapidly developing clinical signs of focal (at times global) disturbance of cerebral function, lasting more than 24h or leading to death with no apparent cause other than that of vascular origin" (Hatano 1976). This definition does not include in its spectrum transient ischaemic attacks (TIAs) (Bonita 1992; Hatano 1976), subdural haematomas or haemorrhages and infarctions caused by infection or tumour (Bonita 1992). However, although sometimes deemed outdated, newer definitions have not yet been officially adopted by any major stroke organisation (Sacco 2013). Two main aetiologies of stroke are recognised: ischaemic, due to the blockage of the blood supply to the brain; and haemorrhagic, resulting from a fissure in an intracranial blood vessel (Sims 2009). In stroke survivors, these events may evolve into long‐term disability, age‐related cognitive impairment and dementia (Falcone 2014), potentially having deep emotional and socioeconomic impact on patients and their families and on health services (Feigin 2003). Physical consequences of stroke relate to the motor impairment that results from loss or functional reduction of muscle control or movement or from mobility limitation (Langhorne 2009). In addition, a wide range of non‐cognitive neuropsychiatric symptoms after stroke may occur, such as depression, anxiety, emotional lability, apathy and sometimes post‐stroke fatigue (Hackett 2014). Stroke also predisposes to other adverse health events and impaired quality of life (Garret 2011). Several strategies can be adopted to lessen cerebral damage and improve disability‐free survival in order to reduce the global burden of stroke (Hankey 2014; Reckless 2008). Following acute rehabilitation, there is a need to explore options for long‐term sustainable services that support stroke survivors to engage in meaningful activities to address life challenges after stroke. This includes services that target motor impairments and mood disorders with a view to improving health‐related quality of life (Immink 2014). Active intervention for stroke usually follows a three‐phase scheme, preferably including acute therapy, rehabilitation and secondary prevention (Reckless 2008). In this context, rehabilitation will focus on the stroke survivor recovering function and cognition to the maximum feasible level, but not necessarily living free of symptoms or limitations (Eilertsen 2010), and may include a wide range of complementary strategies.
Description of the intervention
Yoga is a mind‐body practice (Bower 2014; Oken 2006; Wahbeh 2008) that originated in India (DiBenedetto 2005; Tran 2001; Wahbeh 2008), with roots that date back to at least 2000 BC (DiBenedetto 2005). The term 'yoga' stems from the Sanskrit root 'yuj' meaning "to yoke or join together" (Taylor 2003), in allusion to the desired bond between mind, body and spirit (Garret 2011). It is portrayed as a tree consisting of 'limbs' that include universal ethics (yama), physical postures (asanas), breath control (pranayama), control of the senses (pratyahara), concentration (dharana) and meditation (dhyana), which are practised in order to attain 'samadhi', the spiritual bliss (Ross 2010). Yoga has become increasingly widespread in the Western world (Bower 2014; Fischer 2014; Ross 2010); however, practice in these countries is often limited to the physical postures (asana), breath control (pranayama), meditation (dhyana) or a combination of these (Bower 2014). Hatha yoga, particularly the Iyengar approach, is the most practised type of yoga in Western countries, but other approaches are also common, such as Ashtanga, power, Bikram, Viniyoga, Kripalu, integrative and restorative yoga (Taylor 2003). It is nonetheless challenging to determine exactly what types of yoga are practised in the West, as combinations and variations of any of its components can correspond to a 'new' type of yoga (Yang 2016). According to WHO, yoga is deemed to belong to the Complementary and Alternative Medicine (CAM) field, as a form of non‐medication therapy (WHO 2002). This understanding reflects the yoga therapeutics, that is the elements of yoga directly addressing health concerns, in which yoga is used to treat health‐threatening conditions (Taylor 2003). Recent evidence highlights positive effects of yoga for people with an increased risk of cardiovascular disease (Cramer 2014), and as add‐on therapy for treating carpal tunnel syndrome (O'Connor 2003), depression (Uebelacker 2010), rheumatoid arthritis (Bosch 2009) and cancer (Bower 2005). Cochrane reviews assessing yoga practice interventions found limited, or low, evidence of positive effects in the primary prevention of cardiovascular disease (Hartley 2014), low‐moderate evidence of positive effects in the treatment of non‐specific chronic low‐back pain (Wieland 2017) and schizophrenia (Broderick 2015), moderate evidence for positive effect in the treatment of asthma (Yang 2016) and women diagnosed with breast cancer (Cramer 2017). Cochrane review evidence for the effect of yoga in the treatment of haematological malignancies (Felbel 2014) was unclear. A recent non‐Cochrane systematic review concluded that yoga can be used as self‐administered practice in stroke rehabilitation, due to its alleged effect of relieving the mind and body from stress. Yoga was found to act at both psychological and physical levels, and improvements were noted in self‐efficacy and confidence. These changes may lead to a change in behaviour and ultimately an improvement in health. However, the study emphasised the need for further research in the field (Lazaridou 2013).
How the intervention might work
Traditionally, yoga practitioners are reputed to benefit physically and psychologically from yoga practice (Bower 2014). Yoga is considered a physical activity (Sattelmair 2010) and as such has positive effects on brain chemistry and may lead to strengthened physical states (Garret 2011). In addition, the relaxation and personal integration aspects of yoga contribute to mindful awareness and personal acceptance (Garret 2011), enhancing ability to sustain attention (Oken 2006). However, the exact mechanism of action behind the benefits of yoga is yet to be fully clarified (Garret 2011). There has been increasing support for the theory that relates the positive effects of yoga to a close link between the central nervous system and the peripheral autonomic nervous system, along with the endocrine and immune systems (Wahbeh 2008). It is believed that some yoga techniques favour a down‐regulation of the hypothalamic‐pituitary‐adrenal (HPA) axis and the sympathetic nervous system (SNS), leading to a prevalence of the parasympathetic nervous system over the SNS, possibly through direct vagal stimulation (Ross 2010). Moreover, breathing control and meditation practices in yoga are thought to increase autonomic control, reducing blood pressure, heart rate and breathing (Garret 2011). There is also scientific evidence that reciting yoga mantras leads to relaxation, which may, at least in part, be due to synchronisation of respiratory and cardiovascular central rhythms (Bernardi 2001). Therefore, the positive effects of yoga for therapeutic purposes on physical and mental health, especially in the promotion and co‐ordination of complex movements, balance, strengthening, and breathing (Schmid 2012) may be of significance in post‐stroke rehabilitation.
Why it is important to do this review
Scientific evidence indicates that yoga may constitute a promising add‐on therapy for a number of diseases. It is a simple to learn, adaptable and community‐based practice, which could be cost‐effective (DiBenedetto 2005; Garret 2011). There is also increasing evidence that yoga is readily accepted by the elderly population (DiBenedetto 2005), a group that constitutes the vast majority of stroke patients (Feigin 2003). However, the use of yoga for stroke rehabilitation appears to be under‐researched when compared with other health conditions. If review evidence demonstrates that yoga is effective in stroke rehabilitation, the proportion of stroke patients who might benefit from yoga practice could be increased. Hence it is important to undertake this review to systematically examine and critically appraise the most up‐to‐date evidence of yoga for stroke rehabilitation. A review that achieves these goals can be a valuable tool in providing reliable information for both stroke survivors and healthcare teams regarding whether to consider yoga as a viable option in stroke rehabilitation. However, to date, and to our knowledge, only one systematic review of yoga for stroke rehabilitation has been undertaken (Lazaridou 2013). The review did not use a Cochrane protocol, included study designs other than randomised controlled trials (RCTs), and assessed yoga amongst other behavioural therapies; yoga‐only data were not reported.
Objectives
To assess the effectiveness of yoga, as a stroke rehabilitation intervention, on recovery and quality of life (QoL).
Methods
Criteria for considering studies for this review
Types of studies
We included randomised controlled trials (RCTs). We did not apply any restriction regarding publication status.
Types of participants
People who suffered from stroke of any aetiology and severity, regardless of age, gender, ethnicity, language spoken, number of episodes, type of sequelae or time post‐stroke.
Types of interventions
We included trials of stroke rehabilitation that compared yoga with a waiting‐list control or no intervention control. We included studies that tested yoga for stroke rehabilitation irrespective of yoga 'type', dose, frequency, or intervention duration. A clear statement that the intervention was 'yoga' was required. Interventions included two or more of the following: yoga postures (asanas), breath control (pranayama), meditation (dhyana), extreme relaxation (yoga nidra). We excluded interventions based on yoga (e.g. stretching exercises based upon yoga) but not characterised as yoga. We excluded studies of multimodal interventions that included yoga amongst other complementary therapies (e.g. mindfulness‐based stress reduction) or interventions (e.g. aerobic exercise) if the effects of yogic practice could not be assessed separately.
Types of outcome measures
Primary outcomes
Quality of life (QoL): change scores measured by validated questionnaires or generic or condition‐specific QoL scales developed specifically to measure QoL, e.g. Stroke Impact Scale (SIS), Stroke‐Specific QoL Scale.
Secondary outcomes
Impairment/symptoms
-
Blood pressure (systolic and diastolic blood pressure) and heart rate.
-
Depression, assessed using standardised measures e.g. the Geriatric Depression Scale, the Hospital Anxiety and Depression Scale.
-
Anxiety, assessed using standardised measures e.g. the Hospital Anxiety and Depression Scale.
Motor function
-
Balance, assessed using standardised measures e.g. Berg Balance Scale.
-
Movement, including gait: assessed using standardised measures e.g. the Motor Assessment Scale, the Timed Up and Go test.
Activities
-
Activities of daily living, assessed using standardised measures e.g. Barthel Index, Frenchay Activities Index, Nottingham Extended Activities of Daily Living scale.
-
Disability, assessed using standardised measures e.g. modified Rankin Scale.
Adverse events
-
Adverse events, including falls or death.
We chose QoL as the primary outcome of our review because it is a patient‐important outcome. We measured primary and secondary outcomes at two time points: 1) immediately after study end, and 2) at follow‐up, if reported.
Search methods for identification of studies
See the 'Specialized register' section in the Cochrane Stroke Group module. We searched for trials in all languages and arranged for translation of relevant articles where necessary. Due to relocation of personnel, we were not able to complete the review within two years of conducting the first search (March 2015). We updated the search in July 2017. The same search strategy was used but due to altered availability of databases the search of COS Conference Papers was not updated. We limited the updated searches to 2015 to 2017.
Electronic searches
We searched the Cochrane Stroke Group trials register (July 2017) and the following electronic databases.
-
Cochrane Central Register of Controlled Trials (CENTRAL) (Cochrane Library; 2017, Issue 7) in the Cochrane Library (searched July 2017; Appendix 1).
-
MEDLINE Ovid (1946 to July 2017) ( Appendix 2).
-
Embase Ovid (1974 to July 2017); (Appendix 3).
-
CINAHL EBSCO (Cumulative Index to Nursing and Allied Health Literature; 1982 to July 2017) (Appendix 4).
-
PsycINFO Proquest LLC; (1800 to July 2017) (Appendix 5).
-
AMED Ovid (Allied and Complementary Medicine; 1985 to July 2017); (Appendix 6).
-
LILACS (Latin American and Caribbean Health Science Information database; (www.lilacs.bvsalud.org/en/; 1982 to July 2017) (Appendix 7).
-
SciELO (Scientific Electronic Library Online; (www.scielo.org/php/?lang=en; 1998 to July 2017) (Appendix 8).
-
IndMED (www.indmed.nic.in/; 1985 to July 2017) (Appendix 9).
-
OTseeker (University of Queensland; 2003 to July 2017) (Appendix 10).
-
PEDro (Physiotherapy Evidence Database (www.pedro.fhs.usyd.edu.au/); 1929 to July 2017) (Appendix 11).
We developed the MEDLINE search strategy with the help of the Cochrane Stroke Group Information Specialist and adapted it for the other databases (Appendix 2).
We also searched the following ongoing trials registers.
-
US National Institutes of Health Ongoing Trials Register ClinicalTrials.gov (www.clinicaltrials.gov/; last searched July 2017).
-
Stroke Trials Registry (www.strokecenter.org/trials/; last searched July 2017).
-
ISRCTN registry (www.isrctn.com; last searched July 2017).
-
World Health Organization (WHO) International Clinical Trials Registry Platform (who.int/ictrp/en/; last searched July 2017).
Searching other resources
In an effort to identify further published, unpublished and ongoing trials, we conducted the following searches.
-
Bibliographic searching: we searched the reference lists of identified relevant trials and reviews. We obtained copies of the full article for each reference reporting a potentially eligible trial. Where this was not possible, we contacted authors to request additional information. We used the Science Citation Index Cited Reference search for forward tracking of relevant references.
-
Grey literature searching: we accessed relevant conference proceedings abstracts through COS Conference Papers database (ProQuest), from 2010 to current; last searched March 2015 (not available in July 2017).
Data collection and analysis
Selection of studies
Two review authors (FTCJ, HHSM) independently screened titles and abstracts of the references obtained from our search activities and coded them as 'retrieve' (eligible, or potentially eligible or unclear) or 'do not retrieve', and excluded obviously irrelevant reports. We retrieved the full‐text articles for the remaining references and two review authors (of FTCJ, JBe, ML) independently screened the full‐text articles and identified studies for inclusion, and identified and recorded reasons for exclusion of the ineligible studies. We resolved any disagreements through discussion and, as required, consulted a third review author (ML or JBo) to reach consensus. We collated multiple reports of the same study so that each study, not each reference, is the unit of interest in the review. We recorded the selection process and completed a PRISMA flow diagram (Moher 2009).
Data extraction and management
Two review authors (of FTCJ, HHSM, ML) independently extracted and entered data from all included studies into the 'Characteristics of included studies' table in Review Manager (RevMan 2014). We discussed disagreements with a third review author (JBo) until consensus was reached. A third review author (ML or JBo) checked the extracted data. We collected the following information.
-
Methods: study design, methods of allocation, allocation concealment, blinding, dropout rates, and reasons for dropping out.
-
Participants: setting, sample size, diagnosis, age, gender, ethnicity, education, marital and socioeconomic status, country of origin, stroke aetiology and severity, and time post‐stroke.
-
Intervention: type, programme length, frequency, duration, training of intervention providers.
-
Outcomes: type of outcomes, assessment instruments, assessment time point, and follow‐up time point.
For studies with more than one publication, we considered the first publication as the primary reference but extracted data from all of the publications.
Assessment of risk of bias in included studies
Two review authors (of FTCJ, JBe, ML) independently assessed risk of bias for each study using the Cochrane 'Risk of bias' tool described in the Cochrane Handbook for Systematic Reviews of Interventions (Higgins 2011). We resolved any disagreements by discussion or by involving another review author (JBo). We assessed the risk of bias according to the following domains.
-
Random sequence generation.
-
Allocation concealment.
-
Blinding of participants and personnel.
-
Blinding of outcome assessment.
-
Incomplete outcome data.
-
Selective outcome reporting.
-
Other bias.
We graded the risk of bias for each domain as high, low or unclear; and provided information from the study report together with a justification for our judgment in the 'Risk of bias' tables. A study judged to be at high risk of bias across two or more domains, and including the key domains of selection bias and allocation concealment, was considered to be at high risk of bias, across the study outcomes. Where a study was judged to be at high risk of bias in the completeness of data and selective reporting domains, it was considered to be at high risk of bias as confidence was reduced in the estimate of effect for individual outcomes.
Measures of treatment effect
We conducted statistical analyses to determine treatment effect using Review Manager (RevMan 2014), and processed data in accordance with the guidelines proposed in the Cochrane Handbook for Systematic Reviews of Interventions (Higgins 2011).
We classified the primary outcome (QoL) as continuous outcomes, and compared change scores and calculated a mean difference (MD) with 95% confidence intervals (CI) for each study. We expressed dichotomous outcomes as odds ratios (OR) with 95% CIs.
Unit of analysis issues
We considered the inclusion of non‐standard designs, following guidance in Chapter 16 of the Cochrane Handbook for Systematic Reviews of Interventions (Higgins 2011).
Dealing with missing data
According to Section 16.1 of the Cochrane Handbook for Systematic Reviews of Interventions (Higgins 2011), there are several possible types of missing data, which can be related to missing studies, outcomes, summary data, individuals, or study‐level characteristics. We contacted, via email, the first author or primary investigator to obtain missing data. We also contacted trial authors for intervention details if they were missing. If trial authors did not provide a reason as to why the data were missing, we assumed the data to be 'missing at random'.
For studies in which follow‐up of certain individuals was missing and where intention‐to‐treat (ITT) analyses were conducted using imputation, we used the imputed data for our primary analysis, and carried out sensitivity analyses using available case data.
Assessment of heterogeneity
Due to the small number of studies and potential unreliability of tests of heterogeneity, we assessed heterogeneity by evaluating the I² statistic (Higgins 2003). We have categorised the magnitude of heterogeneity as: I² = 0% to 24%, low heterogeneity; I² = 25% to 49%, moderate heterogeneity; I² = 50% to 74%, substantial heterogeneity; and I² = 75% to 100%, considerable heterogeneity. As an additional measure, we considered the Chi² test (Cochran 1954), regarding a P value ≤ 0.10 as indicative of significant heterogeneity.
Assessment of reporting biases
We conducted a comprehensive search that included searching for unpublished studies and searching trials registers in an attempt to avoid reporting biases. As we identified less than 10 trials, we were unable to explore potential publication bias (Sterne 2011).
Data synthesis
Two review authors (of FTCJ, JBe, ML) independently extracted data from the included studies. We performed all analyses using Review Manager (RevMan 2014). One review author (ML) entered the data into RevMan, while another (JBo) checked the entries. We discussed disagreements with a third review author (JBo) until consensus was reached. Where we considered studies to be sufficiently similar, we conducted a meta‐analysis by pooling the appropriate data.
We used a fixed‐effect model where there was no substantial heterogeneity among studies. For outcomes for which it was inappropriate or impossible to pool quantitatively, we conducted a descriptive analysis and provided a narrative summary.
GRADE and Summary of findings table
We assessed the quality of the evidence using GRADE; the results are presented in the summary of findings Table for the main comparison. We included all review primary and secondary outcomes in the table, irrespective of whether relevant data were reported in the included studies. This enables identification of items not reported by trialists but which are of importance to users of the evidence synthesis (including, for example, reporting of adverse events), which can then be highlighted as implications for future research.
Subgroup analysis and investigation of heterogeneity
Due to the small number of papers included in the review we did not conduct any subgroup analysis. In future updates of the review we will conduct subgroup analysis, for example, by age or gender, severity of stroke, or time post‐stroke, or by intervention characteristics such as duration and frequency of classes, and class size, if we have data from four or more trials.
Sensitivity analysis
Following the guidance in Chapter 8 of the Cochrane Handbook for Systematic Reviews of Interventions (Higgins 2011), we analysed the effects of excluding trials that we judged to be at high risk of bias across one or more of the domains of randomisation (implied as randomised with no further details available), allocation concealment, blinding and outcome reporting for the meta‐analysis of the primary outcome, and 'other' sources of bias e.g. unrepresentative sample. If the exclusion of trials at high risk of bias did not substantially alter the direction of effect or the precision of the effect estimates, then we included the data from these trials in the analysis.
Results
Description of studies
See Characteristics of included studies, Characteristics of excluded studies, Characteristics of ongoing studies.
Results of the search
Our electronic searches identified 1433 citations. After removing duplicates, a total of 1292 citations remained for screening (title and abstract). Of these, we excluded 1280 citations and retained 12 citations for full‐text eligibility screening. We excluded nine studies, as well as one ongoing trial for which the authors had no preliminary data to share with us (Yen‐Ting 2013). We screened the reference lists of four systematic reviews (Lynton 2007; Sharma 2012; Lazaridou 2013; Wadden 2013), but identified no additional relevant trials.
We included two trials, reported in three papers, in the meta‐analysis (Immink 2014; Schmid 2012) (see Characteristics of included studies).
The results of the search are summarised in the study flow diagram (Figure 1).

Study flow diagram.
Included studies
Participant characteristics
In the two included trials a total of 72 community‐dwelling stroke survivors were randomised to yoga interventions or control interventions i.e. waiting‐list (Immink 2014; Schmid 2012). Mean time post stroke ranged from 51 months (SD 40.4) (Schmid 2012) to 81.6 (SD 77.5) (Immink 2014).
Reported mean ages of participants ranged from 59.6 (SD 15.7) (Immink 2014) to 63.1 (SD 8.8) years (Schmid 2012).
Both trials included participants of both sexes. Ethnicity was not specified. Schmid 2012 took place in Indianapolis, USA; Immink 2014 in metropolitan Adelaide, South Australia.
Participants in Schmid 2012 were veterans (recruitment 'waves' 1 to 4; n = not reported) recruited through a medical centre for veterans. In recruitment wave 5, non‐veterans (n = not reported) were recruited from "local stroke support groups and previously completed stroke research studies". Participants in Immink 2014 were recruited from the local community using local newspaper, radio, and television, as well as online health and disability organisations and health providers.
Sample size
Schmid 2012 included 47 participants; Immink 2014 included 25 participants.
Interventions
We adapted the TIDieR (Template for Intervention Description and Replication) checklist, which was designed for primary reporting of interventions, to extract data and report the yoga interventions (Hoffmann 2014). The yoga intervention varied between the two trials in terms of course duration, frequency and duration of classes, and course content.
Course content
Schmid 2012 developed standardised protocols for a yoga intervention and a yoga‐plus intervention. The yoga intervention comprised asanas (adapted), pranayama (breath control) and dhyana (meditation), increasing in difficulty over the eight‐week period, for group‐based delivery. The yoga‐plus intervention included an additional 20‐minute relaxation session, to be practised at home, three times per week. Study results were reported without distinction between yoga and yoga‐plus.
Immink 2014 developed a standardised protocol comprising education (10 minutes), asanas (adapted) (30 minutes), pranayama (10 to 12 minutes), Satyananda yoga nidra (meditation/relaxation) (20 to 30 minutes) (Saraswati 2001), discussion (in class); asanas and pranayamas (10 to 20 minutes), Satyananda yoga nidra (25 minutes, at home), for group‐based delivery and home practice.
Trainer/instructor
In Schmid 2012, the course was developed and delivered by a registered yoga therapist, with input from the rehabilitation research team i.e. the research assistant. In Immink 2014, the course was delivered by two accredited yoga instructors.
Duration and frequency
Schmid 2012 tested yoga and yoga‐plus interventions. The yoga intervention was delivered twice a week for eight weeks; class duration was 60 minutes. The yoga‐plus intervention was delivered twice a week for eight weeks with additional 20‐minute relaxation sessions, three times per week at home.
In Immink 2014, the yoga intervention was delivered once a week for 10 weeks. Classes lasted for 90 minutes; participants were expected to practice at home for 35 to 45 minutes daily, for the six days per week that they did not attend class.
Location
The interventions were delivered for Schmid 2012 in a Rehabilitation and Integrative Therapy laboratory at the Indiana University; for Immink 2014, the intervention was delivered in a recreation room on campus at the University of South Australia.
Group size
In Immink 2014 the yoga class was delivered to groups of 11; in Schmid 2012 it was delivered to groups of up to 10 participants.
Materials
Schmid 2012 reported using mat tables, bolsters, blankets, and yoga straps; plus devices with a 20‐minute relaxation audio recording for the yoga‐plus group.
Immink 2014 reported using an illustrated guide book and compact disc containing audio recordings to verbally guide the participants through the various practices.
Compliance (fidelity)
Neither study reported intervention fidelity i.e. instructors' adherence to the intervention protocol.
Schmid 2012 reported participant adherence to the eight‐week yoga course: 29 (78%) completed all eight weeks; four (11%) attended five or fewer sessions. Reasons for non‐attendance (lack of adherence) were reported as: lack of transport, inclement weather, illness, and work.
Immink 2014 reported participant adherence to the 10‐week course for the intervention group only: mean attendance at class was 90% (SD 12.6); mean reported completion of daily home practice was 82% (SD 20.3). Reasons for non‐adherence were not reported.
Comparison groups
The comparison group in both studies was a waiting‐list control, i.e. they received no study‐related intervention during the intervention period (Schmid 2012: eight weeks; Immink 2014; 10 weeks). Following completion of assessments at the post‐intervention time point, waiting‐list participants were offered the yoga course; neither study reported details of uptake.
Outcome measures
Upon completion of the intervention, both studies reported the primary outcome of interest, QoL, along with a heterogeneous range of secondary outcomes measures. Different QoL measures (Stroke Impact Scale (SIS), version 3 and the Stroke‐Specific QoL Scale) were used in the two studies. We considered pooling data from the two different measures, but we deemed this inappropriate due to the differing design of the two tools which makes such pooling impossible. SIS describes five domains: physical (strength, hand‐function, mobility, activities of daily living), emotion, memory, communication, and social participation. Each domain is scored separately on a 100‐point scale. In addition, a single global question is posed (stroke recovery). The Stroke‐Specific QoL Scale describes 49 items across 12 domains, each item is scored on a 5‐point Likert scale.
Schmid 2012 used the modified Rankin Scale (mRS), the Berg Balance Scale (BBS), the Activities‐specific Balance Confidence Scale, Fear of falling (FoF), measured using a dichotomous scale, "Are you worried or concerned about falling?", and the Stroke‐Specific QoL Scale; primary and secondary outcomes were not specified. All measures were reported at baseline and at intervention end.
Addtional outcomes used and reported in the 2014 article of Schmid 2012 were the PEG (Pain intensity, interference with Enjoyment in life, interference with General activity; a functional measure of pain), range of motion (cervical and hip), Arm curl test, Chair‐to‐stand test, six‐minute walk test, and the modified two‐minute step test. All measures were reported at baseline and at intervention end.
Immink 2014 used the 9‐Hole Peg Test (9HPT), the Motor Assessment Scale (MAS), BBS, the two‐Minute Walk Distance (2MWD), Commfortable Gait Speed (CGS), Geriatric Depression Scale‐Short Form (GDS15), the State Trait Anxiety Inventory (STAI), STAI‐Y1, STAI‐Y2, and the Stroke Impact Scale, version 3 (SIS); primary and secondary outcomes were not specified. All measures were reported at baseline and at intervention end, with the exception of the 9HPT, as participants (intervention group n = 6, 54.5%; control group n = 3, 27.3%) were unable to attempt the baseline test with their affected limb.
Excluded studies
We excluded nine full‐text articles that did not meet the inclusion criteria (Chan 2012; Laska 2012; Mead 2007; Page 2005; Page 2007; Portz 2016; Schmid 2016; Schneider 2012; Yoo 2001). See Characteristics of excluded studies.
Reasons for exclusion were as follows.
-
Study participants (not stroke only or mixed populations where stroke only data could not be extracted): (n = 1) (Laska 2012);
-
Intervention (not yoga or mixed intervention where effect of yoga practice could not be extracted separately): (n = 8) (Chan 2012; Mead 2007; Page 2005; Page 2007; Portz 2016; Schmid 2016; Schneider 2012; Yoo 2001).
Risk of bias in included studies
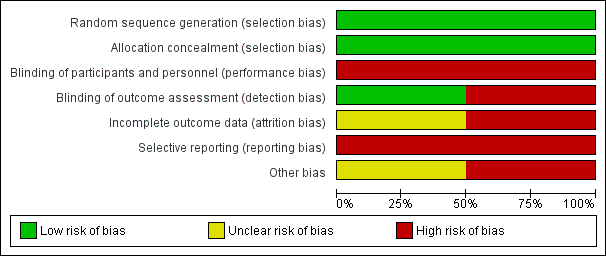
Assessments for risk of bias in individual studies are presented in Characteristics of included studies. See also Figure 2 and Figure 3 for summaries of the results. We considered both of the included studies to be at high risk of bias due to the potential for overestimation of effect of study outcomes.

'Risk of bias' graph: review authors' judgements about each risk of bias item presented as percentages across all included studies.
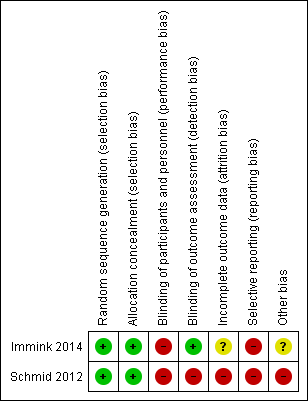
'Risk of bias' summary: review authors' judgements about each risk of bias item for each included study.
Allocation
Generation of randomisation sequence was conducted correctly in both studies, and therefore there is low risk of bias (Immink 2014; Schmid 2012).
Concealment of allocation was conducted correctly in both studies, and therefore there is low risk of bias (Immink 2014; Schmid 2012).
Blinding
Participants
As yoga is a behavioural intervention, it is not possible to blind participants to allocation (Higgins 2011).
Investigators
In Immink 2014, outcomes assessment was conducted by one of the study authors who was blinded to participant allocation. However, two participants "inadvertently disclosed their allocation to the yoga intervention at post‐intervention assessment'. In Schmid 2012, outcomes assessment was completed by the research assistant, who also assisted the yoga instructor and thus would have been aware of participant allocation. It is possible that lack of blinding may have biased the results.
Incomplete outcome data
There is lack of clarity regarding data completion in Schmid 2012. In the 'Statistical analysis' section the authors state that "4 individuals did not complete 8‐week assessments (9%), 1 control, and 3 yoga". However, in the 'Results' section they state "3 did not complete the post‐assessments". In Immink 2014, the 9‐Hole Peg Test was not reported because the authors were unable to collect baseline data from six participants (54.5%) in the intervention group and three participants (27.3%) in the no treatment group due to those participants' hemiparesis.
Withdrawals were reported in both studies: 22% (Schmid 2012) and 9% (Immink 2014). In Schmid 2012, eight participants in the intervention group withdrew or were lost to follow‐up, and in the control group one participant was lost to follow‐up; adequate reasons were provided. In Immink 2014, one participant withdrew from the intervention group (no reason is provided) and one participant withdrew from the control group, citing an unrelated medical condition.
Selective reporting
We retrieved trial registry records for both studies. For Schmid 2012, the trial protocol addressed balance and fear of falling, and blood pressure; however, there was no mention of measurement of blood pressure as an outcome measure, and blood pressure was not addressed in the published article. For Immink 2014, no differences were noted between the protocol and the published article.
There were too few studies in the review to enable examination of the effect of risk of bias on estimates of effect.
Other potential sources of bias
In Schmid 2012, there are two different intervention groups (yoga and yoga plus). The results are reported without distinction between the different interventions, hence there is uncertainty regarding the efficacy of the individual interventions. There are concerns over the sample recruited in the Schmid 2012 study, as this largely comprised male veterans; however, this does not influence the internal validity of the study.
Effects of interventions
See: Summary of findings for the main comparison
Effect of interventions on primary outcome measure: quality of life
Our primary outcome of interest, quality of life (QoL), was addressed by Immink 2014 (22 participants) using the Stroke Impact Scale (SIS), version 3 to measure QoL across nine dimensions (six domains). The nine dimensions included strength, hand function, mobility, activities of daily living, emotion, memory, communication, social participation and stroke recovery, at baseline and post‐intervention. The six domains included: physical, emotion, memory, communication, social participation, and stroke recovery. For each participant and at each assessment time point, we calculated the mean score for five dimensions (strength, hand function, mobility and activities of daily living) to represent the physical domain. The effect of yoga on the physical domain was not significant (mean difference (MD) 5.20, 95% confidence interval (CI) ‐12.28 to 22.68, P = 0.56; Analysis 1.1). The effect of yoga on the emotion domain was not significant (MD 6.80, 95% CI ‐8.55 to 22.15, P = 0.39; Analysis 1.1). The effect of yoga on the memory domain was significant (MD 15.30, 95% CI 1.29 to 29.31, P = 0.03; Analysis 1.1). The effect of yoga on the communication domain was not significant (MD 1.40, 95% CI ‐9.45 to 12.25, P = 0.80; Analysis 1.1). The effect of yoga on the social participation domain was not significant (MD 16.10, 95% CI ‐6.79 to 38.99, P = 0.17; Analysis 1.1). The effect of yoga on the stroke recovery domain was not significant (MD 2.00, 95% CI ‐17.70 to 21.70, P = 0.84; Analysis 1.1).
Schmid 2012 (47 participants) assessed QoL using the Stroke‐Specifc QoL Scale (MD 2.80, 95% CI ‐2.03 to 7.63, P = 0.26; Analysis 1.1); no significant effect was found.
In summary, a significant positive effect was found in one study, in one domain i.e. memory. Due to lack of available data; no meta‐analysis was possible.
Effect of interventions on secondary outcome measures
Of the review secondary outcomes of interest, the following were not measured in the included studies: blood pressure, blood lipids (impairment/symptoms), activities of daily living (activities).
Secondary outcomes measured in at least one of the two included studies, included variables relating to impairment/symptoms, motor function, and activities. A significant effect of the yoga intervention was demonstrated in one study (Schmid 2012) on one aspect of motor function, namely range of movement i.e. active cervical rotation, left and passive hamstring rotation (Analysis 1.8).
Impairment/symptoms
Anxiety and depression
Only Immink 2014 measured anxiety and depression. The authors used three measures: the Geriatric Depression Scale‐Short Form (GDS15), and two forms of State Trait Anxiety Inventory (STAI, Form Y) to measure state anxiety (STAI‐Y1) and trait anxiety (STAI‐Y2).
Depression
Immink 2014 assessed depression using GDS15 (MD ‐2.10, 95% CI ‐4.70 to 0.50, P = 0.11; Analysis 1.13); no significant effect was found.
State anxiety
Immink 2014 assessed state anxiety using STAI‐Y1 (MD ‐8.40, 95% CI ‐16.74 to ‐0.06, P = 0.05; Analysis 1.14); a significant effect was found.
Trait anxiety
Immink 2014 assessed trait anxiety using STAI‐Y2 (MD ‐6.70, 95% CI ‐15.35 to 1.95, P = 0.13; Analysis 1.15); no significant effect was found.
Pain
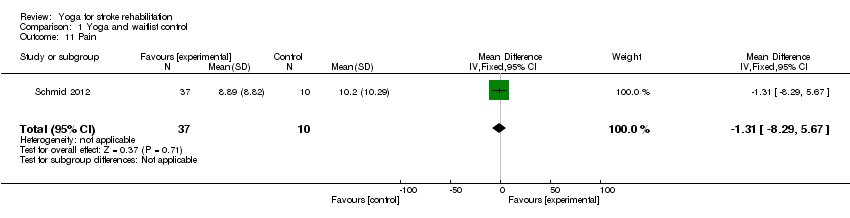
Schmid 2014 (a report from the study Schmid 2012) assessed pain using the 3‐item PEG test (MD ‐1.31, 95% CI ‐8.29 to 5.67, P = 0.71; Analysis 1.11); no significant effect was found.
Motor function
Balance
Balance was measured in both studies (69 participants), using the Berg Balance Scale, the effect of intervention was not significant (MD 2.38, 95% CI ‐1.41 to 6.17, P = 0.22; Analysis 1.2). Schmid 2012 also measured balance self‐efficacy, using the Activities‐specific Balance Confidence Scale (MD 10.60, 95% CI ‐7.08 to 28.28, P = 0.24; Analysis 1.2); the effect of intervention was not significant. Sensitivy analysis was performed and did not alter the direction of the results (P = 0.22 with the trial data; P = 0.47 excluding the data).
Balance confidence
Schmid 2012 assessed balance confidence using the validated 16‐item Activities‐specific Balance Confidence Scale (MD 10.60, 95% CI ‐7.08 to 28.28, P = 0.24; Analysis 1.3); no significant effect was found.
Comfortable Speed Gait (CSG)
Immink 2014 assessed gait speed using the CSG test (MD 1.32, 95% CI ‐1.35 to 3.99, P = 0.33; Analysis 1.4); no significant effect was found.
Motor Assessment Scale (MAS)
Immink 2014 assessed gait speed using MAS (MD ‐4.00, 95% CI ‐12.42 to 4.42, P = 0.35; Analysis 1.5); no significant effect was found.
Two‐Minute Walk Distance (2MWD)
Immink 2014 assessed mobility/gait speed using 2MWD (MD ‐13.80, 95% CI ‐56.02 to 28.42, P = 0.52; Analysis 1.6); no significant effect was found.
Fear of Falling (FoF)
Schmid 2012 assessed FoF using a yes/no question (odds ratio (OR) 3.40, 95% CI 0.63 to 18.22, P = 0.15; Analysis 1.7); no significant effect was found.
Range of motion (ROM)
Schmid 2014 (a report from the study Schmid 2012) assessed ROM using a goniometer.
Schmid and colleagues measured bilateral active cervical rotation ROM and active cervical lateral flexion ROM.
Active cervical rotation ROM, left (MD 3.97, 95% CI ‐6.83 to 14.77, P= 0.47; Analysis 1.8); no significant effect was found. Active cervical rotation ROM, right (MD 7.40, 95% CI ‐0.42 to 15.22, P = 0.06; Analysis 1.8); no significant effect was found.
Active cervical lateral flexion ROM, left (MD 1.50 95% CI ‐2.61 to 5.61, P = 0.47; Analysis 1.8); no significant effect was found. Active cervical lateral flexion ROM, right (MD 6.64, CI 95% 1.95 to 11.33, P = 0.006; Analysis 1.8); significant effect was found.
Schmid and colleagues also assessed bilateral hamstring passive ROM and bilateral hip flexion active ROM.
Hamstring passive ROM, left (MD 7.80, 95% CI 1.33 to 14.27, P = 0.02; Analysis 1.8); no significant effect was found.
Hamstring passive ROM, right (MD ‐0.43, 95% CI ‐6.25 to 5.39, P = 0.88; Analysis 1.8); no significant effect was found.
Hip flexion active ROM, left (MD 30.11, 95% CI ‐2.25 to 62.47, P = 0.07; Analysis 1.8); no significant effect was found.
Hip flexion active ROM, right (MD 32.45, 95% CI 4.69 to 60.21, P = 0.02; Analysis 1.8); no significant effect was found.
Strength
Schmid 2014 (a report from the study Schmid 2012) assessed strength using the arm curl test (upper limb) (MD ‐1.67, 95% CI ‐4.76 to 1.42, P = 0.29; Analysis 1.9 ), and the chair‐to‐stand test (lower limb) (MD ‐1.22, 95% CI ‐2.84 to 0.40, P = 0.14; Analysis 1.9 ); no significant effect was found.
Endurance
Schmid 2014 (a report from the study Schmid 2012) assessed endurance using the six‐minute walk (MD ‐31.80, 95% CI ‐263.55 to 199.95, P = 0.79; Analysis 1.10) and the modified two‐minute step test (MD ‐7.82, 95% CI ‐20.13 to 4.49, P = 0.21; Analysis 1.10); no significant effect was found.
Activities
Disability
Only Schmid 2012 measured disability; they used the modified Rankin Scale (mRS) but reported only whether participants were independent or dependent. Functional independence was defined as 0 to 2 (slight to no disability); dependence as 3 to 5 (moderate to severe disability), citing previous work as precedence. No significant effect was found (OR 2.08, 95% CI 0.50 to 8.60, P = 0.31; Analysis 1.12).
Adverse events
There were no adverse events reported in either study (Immink 2014; Schmid 2012).
Subgroup analysis
No subgroup analysis was undertaken due to the small number of papers included in the review. In any future update of the review, we will conduct subgroup analysis if we have data from four or more trials.
Sensitivity analysis
For the one outcome (balance) for which we were able to conduct a meta‐analysis, we analysed the effects of excluding the trial by Schmid 2012, which we judged to be at high risk of bias due to the unrepresentative nature of its sample. Excluding the trial data did not substantially alter the direction of effect; therefore, the data from that trial were included in the analysis. In any future update of the review, we will conduct sensitivity analysis if we have data from four or more trials.
GRADE and Summary of findings table
We assessed the quality of the evidence using GRADE summary of findings Table for the main comparison. Overall, the quality of the evidence was very low, due to the small number of trials included in the review, both of which were judged to be at high risk of bias, particularly in relation to incompleteness of data and selective reporting, and especially regarding the representative nature of the sample in the study by Schmid 2012.
Discussion
Summary of main results
For an overview of the results see the summary of findings Table for the main comparison.
This review aimed to assess the effectiveness of yoga on recovery and quality of life (QoL) during stroke rehabilitation. We included two studies (three papers) out of 12 potentially relevant papers. Sixty‐nine participants were included in one meta‐analysis (balance; Analysis 1.2). The purpose of the study by Immink 2014 was to assess the efficacy of yoga for motor function, mental health, and QoL outcomes in people with chronic post‐stroke hemiparesis. The purpose of the study by Schmid 2012 was to assess the impact of a yoga‐based rehabilitation intervention on balance, balance self‐efficacy, fear of falling (FoF), and QoL after stroke. Across the two studies, the class‐based yoga interventions lasted eight or 10 weeks; additional home practice was encouraged.
Both trials assessed the primary outcome measure: QoL. Schmid 2012 measured QoL using the Stroke‐Specific QoL scale; no significant effect was found (Analysis 1.1). Immink 2014 used the Stroke Impact Scale v.3 to measure QoL. Six domains were reported (physical, emotion, memory, communication, social participation, stroke recovery). A significant effect was found in the memory domain (Analysis 1.1); however, this is based on very low grade evidence, and might be a chance finding. No significant effect was found in the five other domains (Analysis 1.1).
In this review, both included trials reported secondary outcomes measures relating to motor function (balance, gait) and psychological outcomes (state anxiety, trait anxiety and depression); Schmid 2012 also measured disability, and reported outcomes relating to pain, range of motion (ROM), strength and endurance. No significant effects were found for movement outcomes, for disability, or for strength, endurance or pain (Analysis 1.4; Analysis 1.5; Analysis 1.6; Analysis 1.7; Analysis 1.9; Analysis 1.10; Analysis 1.11; Analysis 1.12). However, a significant effect of the yoga intervention was demonstrated in one study (Schmid 2012) in aspects of range of movement i.e. active cervical rotation, left and passive hamstring rotation, left (Analysis 1.8), based on very low‐grade evidence. In terms of psychological outcomes, no significant effect was found for depression or for trait anxiety (Analysis 1.13; Analysis 1.15); however, a significant effect was found for state anxiety (Analysis 1.14). Evidence regarding the effects of yoga on anxiety from other reviews is mixed. A review of the effects of yoga on a range of outcomes, including anxiety, in adults with haematological malignancies (Felbel 2014), found no significant effect of yoga on anxiety, whereas a review of yoga to promote cardiovascular health in older adults noted significant improvement in mood, anxiety, and/or depression (Barrows 2016). This lack of clarity regarding the effect of yoga on anxiety highlights the need for further research as psychosocial factors, assessed using a combined measure of psychosocial stress, including stress (home and work), life events, and depression, represent a known risk factor for stroke and recurrent stroke (O'Donnell 2016).
Adverse events
No adverse events were reported, suggesting that yoga, appropriately adapted and delivered by trained and certified yoga instructors, may be a safe intervention for community‐dwelling adults following stroke, but more information is required.
Limitation of the studies included in the review
Methodological quality
Both included studies were at high risk of bias. Allowing for the difficulties associated with blinding participants and interventionists, the quality issues largely reflect incomplete or inaccurate reporting, and concerns regarding the representativeness of the sample, which may have introduced bias in the assessment of outcomes.
Intervention reporting
The 12‐item TIDieR (Template for Intervention Description and Replication) checklist and guide, developed to improve and standardise the reporting of interventions (Hoffmann 2014), was used in this review to extract data relating to intervention design and delivery: 1) brief name of intervention, 2) why, 3) what (materials), 4) what (procedures), 5) who provided, 6) how, 7) where, 8) when and how much, 9) tailoring, 10) modifications, 11) how well (planned), 12) how well (actual). Overall, both studies reported sufficient detail about the intervention to enable comparison between the two for items 1 to 8 of the checklist, and facilitating replication in future work. Neither study reported details relating to items 11 and 12, which relate to intervention fidelity and adaptation. Providing detail about fidelity and any adaptations would have enabled a more comprehensive appraisal of the studies, and represents a missed opportunity for transfer of knowledge, which would have implications for future stroke‐yoga research.
Withdrawals
Withdrawals were reported in both studies. This was unremarkable in both studies (Immink 2014; Schmid 2012). As intention‐to‐treat analysis was not conducted, this has implications for the interpretation of the findings.
Limitations of the review
In terms of identification of studies, our searches may not have retrieved all potentially relevant studies. However, working with the Cochrane Stroke Group Information Specialist, we developed an inclusive search strategy incorporating grey literature searches to extend the breadth of our search. To counter reporting bias we elected not to apply delimiters of time or language of publication. Two review authors (FTCJ, JBe) worked separately to screen all potentially relevant papers, to extract data and to conduct the methodological appraisal of the two included studies. ML had oversight of all stages of the review, helped resolve any disagreements between review authors, and ensured compliance with Cochrane guidelines.
Overall completeness and applicability of evidence
Only two studies were included. Both assessed the primary outcome of interest but due to heterogeneity of measures and of reporting methods (e.g. domain level results compared with global score), no meta‐analysis of the primary outcome was possible.
Although both trials recruited community‐dwelling participants, the two participant groups were quite heterogeneous. Schmid 2012 screened veterans' 'charts' to ensure a diagnosis of stroke had been made and then mailed invitations to potential participants. Members of stroke support groups and people who had previously taken part in stroke research studies were also invited to participate. The final study sample included 36 veterans and 11 others. Immink 2014 used a broad social media advertising campaign to identify potential participants.
Quality of the evidence
Overall, the quality of the evidence was very low (summary of findings Table for the main comparison). There were insufficient data to examine the risk of bias on estimates of effect, consequently no funnel plot was generated.
Potential biases in the review process
As described above, due to the limited data available, we were unable to generate funnel plots, and cannot exclude the possibility of publication bias.
Although our search was comprehensive, we identified no potentially relevant studies in languages other than English. Therefore, we cannot rule out the possibility that some studies published in languages other than English may have been missed.
Agreements and disagreements with other studies or reviews
To our knowledge only one previous review of yoga as an intervention for stroke rehabilitation has been published (Lynton 2007). Although Cochrane methods were not used, the searches were comprehensive and found no randomised controlled trial (RCTs). This review reflects and extends that finding, as we found no RCTs published prior to 2012.
The finding that yoga has a positive effect on at least one aspect of QoL confirms findings from previous reviews of stroke populations (Lazaridou 2013), as well as reviews of yoga in study populations with chronic disease (health‐related QoL) (Desveaux 2015); neurological disorders, including stroke (Mishra 2012) and in healthy older adults (Barrows 2016) in which yoga was found to have a positive effect on QoL. Additionally, qualitative studies of participants in stroke‐yoga RCTs indicate that participants derive perceived benefits that equate to domains measured in QoL scales, including improved motor and cognitive function, mood, emotional regulation, daily activity, and social participation (Garret 2011; Van Puymbroeck 2015).
In relation to the positive effect of yoga on memory, an RCT of a yoga intervention with 87 elderly nursing home residents reported a significant improvement in immediate and delayed recall of verbal (RAVLT) and visual memory (CFT), attention and working memory (WMS‐spatial span), verbal fluency (COWA), executive function (Stroop interference) and processing speed (Trail Making Test‐A) when compared with a waiting‐list group at the end of six months after correcting for corresponding baseline score and education (Hariprasad 2013). Similarly, an RCT of an eight‐week Hatha yoga intervention with 118 community‐dwelling, healthy older adults reported significantly improved performance on the executive function measures of working memory capacity and efficiency of mental set shifting and flexibility compared with their stretching‐strengthening counterparts, demonstrating the potential for yoga to maintain or improve cognitive functioning in healthy older adults (Gothe 2014).

Study flow diagram.
'Risk of bias' graph: review authors' judgements about each risk of bias item presented as percentages across all included studies.

'Risk of bias' summary: review authors' judgements about each risk of bias item for each included study.

Comparison 1 Yoga and waitlist control, Outcome 1 Quality of life.

Comparison 1 Yoga and waitlist control, Outcome 2 Balance: Berg Balance Scale.

Comparison 1 Yoga and waitlist control, Outcome 3 Balance confidence.
Comparison 1 Yoga and waitlist control, Outcome 4 Gait (comfortable gait speed).

Comparison 1 Yoga and waitlist control, Outcome 5 Motor Assessment (Motor Assessment Scale).

Comparison 1 Yoga and waitlist control, Outcome 6 Walk distance (2‐Minute Walk Distance).

Comparison 1 Yoga and waitlist control, Outcome 7 Fear of falling.

Comparison 1 Yoga and waitlist control, Outcome 8 Range of movement.

Comparison 1 Yoga and waitlist control, Outcome 9 Strength.

Comparison 1 Yoga and waitlist control, Outcome 10 Endurance.
Comparison 1 Yoga and waitlist control, Outcome 11 Pain.

Comparison 1 Yoga and waitlist control, Outcome 12 Disability.

Comparison 1 Yoga and waitlist control, Outcome 13 Depression: Geriatric Depression Scale (GDS15).

Comparison 1 Yoga and waitlist control, Outcome 14 State Trait Anxiety (STAI‐Y1).

Comparison 1 Yoga and waitlist control, Outcome 15 Trait Anxiety Inventory (STAI‐Y2).
| Yoga compared with waiting‐list control (yoga) for stroke | ||||||
| Patient or population: adults with stroke Settings: community Intervention: yoga Comparison: wait‐list control (yoga) | ||||||
| Outcomes | Illustrative comparative risks* (95% CI) | Relative effect | No of Participants | Quality of the evidence | Comments | |
| Assumed risk | Corresponding risk | |||||
| Waiting‐list control (yoga) | Yoga | |||||
| Quality of life: Stroke Impact Scale (SIS) SIS measures quality of life across five domains: physical (strength, hand‐function, mobility, activities of daily living), emotion, memory, communication, social participation, plus 1 global question about stroke recovery. Each dimension is scored on a 100‐point scale; the higher the score, the higher the quality of life Baseline and post‐intervention | One study: the mean Stroke Recovery Domain in the control group was 63.0 | The mean Stroke Recovery Domain in the intervention group was 2.0 higher | 22 | ⊕⊕⊝⊝ | The quality of evidence was graded as very low due to small sample size, incomplete data, and the small number of studies i.e.1 | |
| Quality of life: Stroke‐specific QoL Scale (SS QoL) The Stroke‐specific QoL Scale measures quality of life across 12 domains (49 items): self‐care, vision, language, mobility, work, upper extremity, thinking, personality, mood, family, social, and energy Each item is scored on a 5‐point Likert scale; the higher the score, the higher the quality of life (score 0‐245) Baseline and post‐intervention | One study: the mean SS QoL in the control group was 33.0 | The mean SS QoL in the intervention group was 2.8 higher | 47 (1) | ⊕⊕⊝⊝ | The quality of evidence was graded as very low due to small sample size, incomplete data, and the small number of studies i.e.1 | |
| Balance: Berg Balance Scale (BBS) 14‐item physical performance measure of static and dynamic balance (score: 0‐56) Baseline and post‐intervention | Two studies: the mean BBS ranged across control groups from 43.8‐48.5 | The mean BBS in the intervention groups was 2.4 higher (2.2, 2.5) | 69 | ⊕⊝⊝⊝ | The quality of the evidence was graded as very low due to high risk of bias in relation to sample size, incomplete data, and unrepresentative sample, across the 2 studies | |
| Gait: Comfortable Gait Speed (CGS) Gait measured over 7 metres (3 repetitions; average time calculated) Baseline and post‐intervention | One study: the mean CGS in the control group was 0.88 | The mean CGS in the intervention group was 1.32 higher | 22 | ⊕⊕⊝⊝ | The quality of evidence was graded as very low due to small sample size, and incomplete data | |
| Depression: Geriatric Depression Scale (GDS15) A 15‐item self‐report assessment used to identify depression in the elderly. A yes/no response is required for each item (score 0 or 1). Cummulative score: 0‐4 normal, 5‐9 Mild depression, 10‐15 More severe depression Baseline and post‐intervention | One study: the mean GDS15 in the control group was | The mean GDS15 in the intervention group was 2.1 | 22 | ⊕⊝⊝⊝ | The quality of evidence was graded as very low due to small sample size, incomplete data, and the small number of studies | |
| Anxiety: State Trait Anxiety (STAI‐Y1) A 40‐item, self‐report assessment of anxiety affect. State anxiety can be defined as fear, nervousness, discomfort, and the arousal of the autonomic nervous system induced temporarily by situations perceived as dangerous. Score 20‐80; higher scores suggest higher levels of anxiety Baseline and post‐intervention | One study: the mean STAI‐Y1 in the control group was | The mean STAI‐Y1 in the intervention groups was | 22 | ⊕⊝⊝⊝ | The quality of evidence was graded as very low due to small sample size, incomplete data, and the small number of studies | |
| Anxiety: Trait Anxiety Inventory (STAI‐Y2) A 40‐item, self‐report assessment of anxiety affect. Trait anxiety can be defined as a relatively enduring disposition to feel stress, worry, and discomfort. Score 20‐80; higher scores suggest higher levels of anxiety Baseline and post‐intervention | One study: the mean STAI‐Y2 in the control group was 42 | The mean STAI‐Y2 in the intervention groups was 4.7 lower | 22 | ⊕⊝⊝⊝ | The quality of evidence was graded as very low due to small sample size, incomplete data, and the small number of studies | |
| Disability: modified Rankin Scale (mRS) A measure of disability, with 6 categories: 0 (no symptoms), 1 (no significant disability), 2 (slight disability), 3 (moderate disability), 4 (moderately severe disability), 5 (severe disability), 6 (dead); reported as dependent/independent Baseline and post‐intervention | One study: 50% (n = 5) of the control group were 'independent' | In the intervention group the odds of being 'independent' were higher OR 2.08, 95% CI 0.50 to 8.60 (68%; n = 25) | 47 | ⊕⊝⊝⊝ | The quality of evidence was graded as very low due to small sample size, incomplete data, and unrepresentative sample | |
| Adverse events Post‐intervention | No data | No data | ⊕⊝⊝⊝ | No evidence available | ||
| *The basis for the assumed risk (e.g. the median control group risk across studies) is provided in footnotes. The corresponding risk (and its 95% confidence interval) is based on the assumed risk in the comparison group and the relative effect of the intervention (and its 95% CI). | ||||||
| GRADE Working Group grades of evidence | ||||||
| Outcome or subgroup title | No. of studies | No. of participants | Statistical method | Effect size |
| 1 Quality of life Show forest plot | 2 | Mean Difference (IV, Fixed, 95% CI) | Subtotals only | |
| 1.1 SIS: Physical domain | 1 | 22 | Mean Difference (IV, Fixed, 95% CI) | 5.20 [‐12.28, 22.68] |
| 1.2 SIS: Emotion domain | 1 | 22 | Mean Difference (IV, Fixed, 95% CI) | 6.80 [‐8.55, 22.15] |
| 1.3 SIS: Memory domain | 1 | 22 | Mean Difference (IV, Fixed, 95% CI) | 15.30 [1.29, 29.31] |
| 1.4 SIS: Communication domain | 1 | 22 | Mean Difference (IV, Fixed, 95% CI) | 1.40 [‐9.45, 12.25] |
| 1.5 SIS: Social participation domain | 1 | 22 | Mean Difference (IV, Fixed, 95% CI) | 16.10 [‐6.79, 38.99] |
| 1.6 SIS: Stroke recovery domain | 1 | 22 | Mean Difference (IV, Fixed, 95% CI) | 2.0 [‐17.70, 21.70] |
| 1.7 Stroke‐specific QoL scale | 1 | 47 | Mean Difference (IV, Fixed, 95% CI) | 2.80 [‐2.03, 7.63] |
| 2 Balance: Berg Balance Scale Show forest plot | 2 | 69 | Mean Difference (IV, Fixed, 95% CI) | 2.38 [‐1.41, 6.17] |
| 3 Balance confidence Show forest plot | 1 | 47 | Mean Difference (IV, Fixed, 95% CI) | 10.60 [‐7.08, 28.28] |
| 4 Gait (comfortable gait speed) Show forest plot | 1 | 22 | Mean Difference (IV, Fixed, 95% CI) | 1.32 [‐1.35, 3.99] |
| 5 Motor Assessment (Motor Assessment Scale) Show forest plot | 1 | 22 | Mean Difference (IV, Fixed, 95% CI) | ‐4.0 [‐12.42, 4.42] |
| 6 Walk distance (2‐Minute Walk Distance) Show forest plot | 1 | 22 | Mean Difference (IV, Fixed, 95% CI) | ‐13.80 [‐56.02, 28.42] |
| 7 Fear of falling Show forest plot | 1 | 47 | Odds Ratio (M‐H, Fixed, 95% CI) | 3.40 [0.63, 18.22] |
| 8 Range of movement Show forest plot | 1 | 376 | Mean Difference (IV, Fixed, 95% CI) | 4.26 [1.96, 6.55] |
| 8.1 Active cervical rotation, left | 1 | 47 | Mean Difference (IV, Fixed, 95% CI) | 3.97 [‐4.70, 12.64] |
| 8.2 Active cervical rotation, right | 1 | 47 | Mean Difference (IV, Fixed, 95% CI) | 7.40 [‐0.42, 15.22] |
| 8.3 Active cervical lateral flexion, left | 1 | 47 | Mean Difference (IV, Fixed, 95% CI) | 1.5 [‐2.61, 5.61] |
| 8.4 Active cervical lateral flexion, right | 1 | 47 | Mean Difference (IV, Fixed, 95% CI) | 6.64 [1.95, 11.33] |
| 8.5 Hamstrings passive ROM, left | 1 | 47 | Mean Difference (IV, Fixed, 95% CI) | 7.80 [1.33, 14.27] |
| 8.6 Hamstrings passive ROM, right | 1 | 47 | Mean Difference (IV, Fixed, 95% CI) | ‐0.43 [‐6.25, 5.39] |
| 8.7 Hip flexion active ROM, left | 1 | 47 | Mean Difference (IV, Fixed, 95% CI) | 30.11 [‐2.25, 62.47] |
| 8.8 Hip flexion active ROM, right | 1 | 47 | Mean Difference (IV, Fixed, 95% CI) | 32.45 [4.69, 60.21] |
| 9 Strength Show forest plot | 1 | 94 | Mean Difference (IV, Fixed, 95% CI) | ‐1.32 [‐2.75, 0.12] |
| 9.1 Upper extremity strength | 1 | 47 | Mean Difference (IV, Fixed, 95% CI) | ‐1.67 [‐4.76, 1.42] |
| 9.2 Lower extremity strength | 1 | 47 | Mean Difference (IV, Fixed, 95% CI) | ‐1.22 [‐2.84, 0.40] |
| 10 Endurance Show forest plot | 1 | 94 | Mean Difference (IV, Fixed, 95% CI) | ‐7.89 [‐20.18, 4.41] |
| 10.1 6‐minute walk | 1 | 47 | Mean Difference (IV, Fixed, 95% CI) | ‐31.80 [‐263.55, 199.95] |
| 10.2 2‐minute step test | 1 | 47 | Mean Difference (IV, Fixed, 95% CI) | ‐7.82 [‐20.13, 4.49] |
| 11 Pain Show forest plot | 1 | 47 | Mean Difference (IV, Fixed, 95% CI) | ‐1.31 [‐8.29, 5.67] |
| 12 Disability Show forest plot | 1 | 47 | Odds Ratio (M‐H, Fixed, 95% CI) | 2.08 [0.50, 8.60] |
| 13 Depression: Geriatric Depression Scale (GDS15) Show forest plot | 1 | 22 | Mean Difference (IV, Fixed, 95% CI) | ‐2.10 [‐4.70, 0.50] |
| 14 State Trait Anxiety (STAI‐Y1) Show forest plot | 1 | 22 | Mean Difference (IV, Fixed, 95% CI) | ‐8.40 [‐16.74, ‐0.06] |
| 15 Trait Anxiety Inventory (STAI‐Y2) Show forest plot | 1 | 22 | Mean Difference (IV, Fixed, 95% CI) | ‐6.70 [‐15.35, 1.95] |