Intervenciones para el prurito en personas con nefropatía crónica avanzada
Resumen
Antecedentes
El prurito en pacientes con nefropatía crónica (NC) es frecuente, a menudo muy angustioso y se asocia con depresión, reducción de la calidad de vida y aumento de la muerte. El tratamiento de primera línea más habitual ha sido el uso de antihistamínicos a pesar de la falta de evidencia significativa de su uso para el prurito urémico. Existen pocas recomendaciones y guías para el tratamiento.
Objetivos
Se intentó determinar: 1) los efectos beneficiosos y perjudiciales (tanto absolutos como relativos) de todas las intervenciones tópicas y sistémicas para el tratamiento del prurito urémico, ya sea solas o combinadas, en comparación con el placebo o la atención estándar; y, 2) la intensidad o frecuencia de la dosis, el estadio de la nefropatía o el método de diálisis utilizado (cuando corresponda) en los casos en que los efectos de estas intervenciones varíen en función de las cointervenciones.
Métodos de búsqueda
Se realizaron búsquedas en el registro de estudios del Grupo Cochrane de Riñón y trasplante (Cochrane Kidney and Transplant) hasta el 17 de diciembre de 2019 mediante el contacto con el documentalista y el uso de términos de búsqueda relevantes para esta revisión. Los estudios en el registro se identifican mediante búsquedas en CENTRAL, MEDLINE y EMBASE, en actas de congresos, en el portal de búsqueda de la plataforma de registros internacionales de ensayos clínicos (ICTRP), y en ClinicalTrials.gov.
Criterios de selección
Ensayos controlados aleatorizados (ECA) en adultos con NC en estadios 4 ó 5 que compararan tratamientos (farmacológicos, tópicos, exposición, modalidad de diálisis) con placebo u otros tratamientos establecidos para la NC asociada con el prurito.
Obtención y análisis de los datos
Dos autores de la revisión resumieron de forma independiente los datos de los estudios y evaluaron la calidad de los ensayos. Los datos se analizaron utilizando un diseño de metanálisis de efectos aleatorios que estimaba los efectos relativos del tratamiento versus el placebo. Cuando es posible, se incluyen estimaciones de los efectos relativos entre los tratamientos. Para las medidas continuas de la gravedad del prurito hasta los tres meses, se utilizó la diferencia de medias (DM) o la diferencia de medias estandarizada (DME). Cuando se informaron, los efectos adversos se tabularon. La certeza de la evidencia se evaluó mediante los criterios GRADE.
Resultados principales
Se incluyeron 92 ECA que asignaron al azar a 4466 participantes. En 58 estudios (3285 participantes) se proporcionaron datos suficientes para ser metanalizados. De estos, 30 compararon una intervención con un placebo o un control. La Escala visual analógica (EVA) de 10 cm fue el instrumento dominante utilizado para informar sobre el prurito y la puntuación Duo se utilizó en una minoría de estudios.
Los análogos de GABA, la gabapentina y la pregabalina, reducen el prurito en pacientes con NC (cinco estudios, 297 participantes: 4,95 cm de reducción; IC del 95%: 5,46 a 4,44 más bajo en la EVA comparada con el placebo; evidencia de certeza alta). Los agonistas de los receptores opiodes kappa, incluida la nalfurafina, también redujeron el prurito en esta población (seis estudios, 661 participantes: 1,05 cm de reducción; IC del 95%: 1,40 a 0,71 más bajo en la EVA comparada con el placebo; evidencia de certeza alta). El ondansetrón tuvo poco o ningún efecto en las puntuaciones de prurito (tres estudios, 183 participantes: 0,38 cm de reducción; IC del 95%: 1,04 a 0,29 más alto en la EVA comparada con el placebo; evidencia de certeza alta). Se informó de la reducción de la intensidad del prurito con el montelukast oral, la cúrcuma, el sulfato de zinc y la capsaicina tópica. En todas las demás intervenciones, la certeza de la evidencia fue de baja a moderada, y las intervenciones tuvieron efectos inciertos sobre el prurito urémico.
Seis estudios han comunicado un importante apoyo económico de sus respectivos fabricantes, seis se vieron afectados por la falta de cegamiento y 11 estudios tienen 15 participantes o menos. Los ECA más antiguos y pequeños a menudo no siguieron los protocolos por intención de tratar con abandonos inexplicables tras la asignación al azar.
Los efectos adversos en general se informaron de manera deficiente e inconsistente en los ECA. No se informaron eventos adversos graves de ninguna intervención.
Conclusiones de los autores
Los ECA de este metanálisis contienen una gran variedad de intervenciones con un conjunto diverso de comparadores. Para muchas intervenciones los ensayos son escasos, lo que hizo que el metanálisis informativo supusiera un reto.
De todos los tratamientos para el prurito urémico, los gabapentinoides (gabapentina y pregabalina) fueron los más estudiados y muestran la mayor reducción en las puntuaciones de prurito. Es poco probable que futuros ECA, incluso de la dimensión de los ensayos más grandes incluidos en esta revisión, cambien significativamente este hallazgo. Los agonistas de los receptores opiodes kappa (principalmente la nalfurafina) también podrían reducir el prurito, pero la comparación indirecta indica un efecto mucho más modesto en comparación con los análogos de GABA.
La evidencia sobre el montelukast oral, la cúrcuma, el sulfato de zinc y la capsaicina tópica también mostraron una reducción en la puntuación del prurito. Sin embargo, esas reducciones se informaron en estudios pequeños, por lo que es preciso seguir investigándolas. El ondansetrón no redujo el prurito. Es poco probable que un nuevo estudio sobre el ondansetrón cambie este resultado.
PICO
Resumen en términos sencillos
¿Cuál es el mejor tratamiento para el picor en personas con enfermedad renal crónica?
¿Cuál es el tema? El picor (término médico prurito) es un problema habitual en las personas con enfermedad renal crónica (ERC). El picor puede afectar en gran medida a la calidad de vida y puede dar lugar a depresión o a un mayor riesgo de muerte. No existen guías de tratamiento ampliamente utilizadas o consensuadas para el picor asociado con la ERC.
¿Qué se hizo? Se encontraron 92 estudios con 4466 personas que investigaron 30 tratamientos para el picor asociado con la ERC. El tratamiento de control fue un placebo o (menos habitualmente) otro tratamiento para el picor asociado con la ERC.
¿Qué se encontró? Un tipo de fármaco (gabapentina y pregabalina), análogo a un neurotransmisor común, parece reducir el picor en pacientes con ERC. El ondansetrón, un fármaco contra las náuseas, fue otro tratamiento bien estudiado y no parece tener una asociación significativa con la reducción del picor. Los agonistas de los receptores opiodes kappa (nalfurafina) parecen reducir ligeramente el picor. Existe muy poca información sobre los tratamientos restantes para poder evaluar en profundidad su eficacia en el alivio del picor o si existe algún efecto antipicor.
Los tres fármacos mencionados anteriormente se han estudiado en detalle y existe evidencia de mayor calidad sobre estos. Los otros tratamientos estudiados son de calidad inferior a moderada.
Los estudios rara vez documentan una lista exhaustiva de los efectos adversos o secundarios ocurridos durante el tratamiento. Sin embargo, ninguno de los efectos adversos documentados fue grave. No es posible hacer una evaluación más significativa del efecto perjudicial.
Conclusiones Los medicamentos que funcionan como neurotransmisores (gabapentina y pregabalina) reducen el picor en pacientes con ERC. Otras intervenciones o no funcionan, o no funcionan tan bien, o se necesitan más estudios para establecer una conclusión.
Authors' conclusions
Summary of findings
| Pharmacological interventions versus placebo for the relief of itch in people with advanced chronic kidney disease | |||||
| Patient or population: uraemic pruritus Settings: outpatient and multi‐centre Intervention: pharmacological treatments Comparison: placebo | |||||
| Outcomes | Anticipated absolute effects* (95% CI) | Relative Effect | No. of participants | Quality of the evidence | |
|---|---|---|---|---|---|
| Reduction of risk of placebo | Reduction of risk with pharmacological interventions | ||||
| GABA analogue VAS(0 to 10 cm) | The mean VAS score of the placebo group ranged from 0.8 to 2 cm lower than pretreatment scores | The mean reduction in VAS score of the GABA analogue group was 4.95 cm lower (5.46 to 4.44 lower) than placebo | ‐ | 297 (5) | ⊕⊕⊕⊕ HIGH |
| Ondansetron VAS(0 to 10 cm) | The mean VAS score of the placebo group ranged from 0.1 to 2 cm lower than pretreatment scores | The mean reduction in VAS score of the ondansetron agonist group was 0.38 cm lower (1.04 lower to 0.27 higher) than placebo | ‐ | 183 (3) | ⊕⊕⊕⊕ HIGH |
| Kappa‐opioid agonist VAS(0 to 10 cm) | The mean VAS score of the placebo group ranged from 1.3 to 1.9 cm lower than pretreatment scores | The mean reduction in VAS score of the kappa‐opioid agonist group was 1.05 cm lower (1.40 to 0.70 lower) than placebo | ‐ | 661 (5) | ⊕⊕⊕⊕ HIGH |
| Mu‐opioid antagonist VAS(0 to 10 cm) | The mean VAS score of the placebo group ranged from 0.5 to 1 cm lower than pretreatment scores | The mean reduction in VAS score of the mu‐opioid antagonist group was 4.29 cm lower (10.24 lower to 1.66 higher) than placebo | ‐ | 62 (2) | ⊕⊕⊝⊝ LOW1,2 |
| Nalbuphine VAS(0 to 10 cm) | The mean VAS score of the placebo group was 3.2 cm lower than pretreatment scores | The mean reduction in VAS score of the nalbuphine group was 0.75 cm lower (1.70 lower to 0.20 higher) than placebo | ‐ | 179 (1) | ⊕⊕⊝⊝ LOW2,3 |
| Cromolyn VAS(0 to 10 cm) | The mean VAS score of the placebo group was 3 cm lower than pretreatment scores | The mean reduction in VAS score of the cromolyn group was 4.8 cm lower (7.03 to 2.57 lower) than placebo | ‐ | 40 (1) | ⊕⊕⊝⊝ LOW1,2 |
| Nicotinamide VAS(0 to 5 cm) | The mean VAS score of the placebo group was 1.7 cm lower than pretreatment scores | The mean reduction in VAS score of the nicotinamide group was 0.47 cm higher (0.32 lower to 1.26 higher) than placebo | ‐ | 50 (1) | ⊕⊕⊝⊝ LOW1,2 |
| EPO Duo score(0 to 40) | The mean Duo score of the placebo group was 1.5 lower than pretreatment scores | The mean reduction in Duo score of the EPO group was 14.5 lower (38.78 lower to 9.78 higher) than placebo | ‐ | 20 (1) | ⊕⊝⊝⊝ |
| Cholestyramine 0 to 3 severity scale | The mean itch score of the placebo group ranged from 1.3 to 0.7 lower than pretreatment scores | The mean reduction in VAS score of the cholestyramine group was 0.24 higher (0.38 lower to 0.86 higher) than placebo | ‐ | 15 (2) | ⊕⊕⊝⊝ LOW1,4 |
| Montelukast Duo score (0 to 81) and VAS (0 to 10 cm) | The mean Duo score and VAS of the placebo group was 7 points and 0.5 cm lower (respectively) than pretreatment scores. | TheSMD reduction of the montelukast group was 1.4 lower (1.87 to 0.92 lower) than placebo | ‐ | 87 (2) | ⊕⊕⊕⊝ MODERATE5 |
| Sertraline VAS(0 to 10 cm) | The mean VAS score of the placebo group was 3.7 lower than pretreatment scores | The mean reduction in VAS score of the sertraline group was 1.8 cm lower (3.65 lower to 0.05 higher) than placebo | ‐ | 46 (1) | ⊕⊕⊝⊝ LOW1,2 |
| Lidocaine Itch relief | 167 per 1000 | 800 per 1000 | 4.80 | 16 (1) | ⊕⊝⊝⊝ |
| Sodium thalidomide Itch relief | 133 per 1000 | 556 per 1000 | 4.17 | 33 (1) | ⊕⊝⊝⊝ |
| Doxepin Itch relief | 208 per 1000 | 875 per 1000 (396 to 1000) | 4.20 (1.90 to 9.30) | 48 (1) | ⊕⊕⊝⊝ |
| The reduction of risk of pharmacological versus placebo (column 3) is the additional risk reduction in addition to the benefit provided by the placebo. "Lower" indicates a reduction or negative numerical change versus baseline. CI: Confidence interval; SMD: standardised mean difference; RR: Risk Ratio; VAS: visual analogues scale | |||||
| GRADE Working Group grades of evidence | |||||
| 1Evidence of certainty was downgraded one level because of the reliance of the estimated effect on a small number of participants 2Evidence of certainty was downgraded one level because of the imprecise treatment estimate 3Evidence of certainty was downgraded one level because of study risks of bias 4Evidence of certainty was downgraded one level because heterogeneous results utilizing nonvalidated itch scoring methods 5Evidence of certainty was downgraded one level as homogeneity was difficult to assess (due to well validated but different itch scoring methods) and that the analysis would benefit from a greater number of participants | |||||
| Topical treatments versus placebo for the relief of itch in people with advanced chronic kidney disease | ||||
| Patient or population: uraemic pruritus Settings: outpatient and multi‐centre Intervention: topical treatments Comparison: placebo | ||||
| Outcomes | Anticipated absolute effects* (95% CI) | No. of participants | Quality of the evidence | |
|---|---|---|---|---|
| Reduction of risk of placebo | Reduction of risk with topical treatments | |||
| Capsaicin cream VAS and Duo’s score | The mean VAS and Duo score of this vehicle group was 1.7 cm and 13.4 lower (respectively) than pretreatment scores. | The SMD of the capsaicin group was 0.84 lower (1.22 to 0.45 lower) than vehicle | 112 (2) | ⊕⊕⊕⊝ MODERATE1 |
| Pramoxine lotion VAS(0 to 10 cm) | The mean VAS score of this vehicle group was 1.4 cm lower than pretreatment scores. | The mean reduction in VAS score of the pramoxine lotion group was 1.97 lower (6.06 lower to 2.12 higher) than vehicle | 27 (1) | ⊕⊝⊝⊝ VERY LOW2,3,4 |
| Calcineurin inhibitor VAS(0 to 10 cm) | The mean VAS score of this vehicle group was 7.1 cm lower than pretreatment scores. | The mean reduction in VAS score of the calcineurin inhibitor group was 1.2 higher (0.36 lower to 2.76 higher) than vehicle | 80 (2) | ⊕⊝⊝⊝ VERY LOW2,3,4 |
| Dead Sea lotion 1 to 5 severity score | The mean severity score of this vehicle group was 3 lower than pretreatment scores. | The mean reduction in severity score of the Dead Sea Lotion group was 2 lower (4.31 lower to 0.31 higher) than vehicle | 41 (1) | ⊕⊝⊝⊝ VERY LOW2,3,4 |
| Cromolyn cream VAS (0 to 5 cm) | The mean VAS score of this vehicle group was 1.4 cm lower than pretreatment scores. | The mean reduction in VAS score of the cromolyn cream group was 0.8 cm lower (1.98 lower to 0.38 higher) than vehicle | 60 (1) | ⊕⊕⊝⊝ |
| Baby oil Itch Severity Scale(0 to 21) | The mean Itch Severity Scale of this vehicle group was 1 lower than pretreatment scores. | The mean reduction in Itch Severity Scale of the baby oil group was 2.36 lower (3.29 to 1.44 lower) than vehicle | 125 (2) | ⊕⊕⊝⊝ |
| L‐arginine salve 0 to 3 severity score | The mean severity score of this vehicle group was 3.4 lower than pretreatment scores. | The mean reduction in severity score of the L‐arginine salve group was 0.58 lower (1.86 lower to 0.7 higher) than vehicle | 48 (1) | ⊕⊕⊝⊝ |
| Polyunsaturated fatty acids VAS (0 to 10 cm) Duo score | The mean VAS and Duo score of this vehicle group was 1 cm lower and 5 points higher (respectively) than pretreatment scores. | The SMD of the polyunsaturated fatty acids group was 0.91 lower (1.99 lower to 0.17 higher) than vehicle | 78 (2) | ⊕⊕⊝⊝ |
| The reduction of risk of pharmacological versus placebo (column 3) is the additional risk reduction in addition to the benefit provided by the placebo. "Lower" indicates a reduction or negative numerical change versus baseline. CI: Confidence interval; SMD: standardised mean difference; VAS: visual analogue scale | ||||
| GRADE Working Group grades of evidence | ||||
| 1Evidence of certainty was downgraded one level as homogeneity was difficult to assess (due to well validated but different itch scoring methods) and that the analysis would benefit from a greater number of participants 2Evidence of certainty was downgraded one level because of the reliance of the estimated effect on a small number of participants 3Evidence of certainty was downgraded one level because of the imprecise treatment estimate 4Evidence of certainty was downgraded one level because of study risks of bias 5Evidence of certainty was downgraded two levels because of study risks of bias and use of a non‐validated itch scoring method. 6Evidence of certainty was downgraded one level because of the imprecise and small treatment estimate | ||||
| Supplements, HD modalities, and other treatments for the relief of itch in people with advanced chronic kidney disease | ||||
| Patient or population: uraemic pruritus Settings: outpatient and multi‐centre Intervention: supplements, HD modalities, and other treatments Comparison: placebo; other HD comparators | ||||
| Outcomes | Anticipated absolute effects* (95% CI) | No. of participants | Quality of the evidence | |
|---|---|---|---|---|
| Reduction of risk of comparator | Reduction of risk with supplements, HD modalities, and other treatments | |||
| Polyunsaturated fatty acids 0 to 5severity score | The mean severity score of this placebo group was 1.6% lower than pretreatment scores. | The mean reduction in 0 to 5 severity score of the polyunsaturated fatty acids group was 11.3% lower (9.0 to 3.6 lower) than placebo | 22 (1) | ⊕⊕⊝⊝ LOW1,2 |
| L‐carnitine VAS (0 to 6 cm) | The mean VAS score of this placebo group was 0.2 higher than pretreatment scores. | The mean reduction in VAS score of the L‐carnitine group was 0.26 lower (2.85 lower to 2.43 higher) than placebo | 12 (1) | ⊕⊕⊝⊝ |
| Zinc sulfate VAS (0 to 10 cm) | The mean VAS and Duo score of this vehicle group was 4.3cm and 6.1 lower (respectively) than pretreatment scores. | The mean reduction of the zinc sulfate group was 1.77 lower (2.88 to 0.66 lower) than placebo | 76 (2) | ⊕⊕⊕⊝ MODERATE1 |
| Ergocalciferol 21 point scale | The mean score of this vehicle group was 6.1 lower than pretreatment scores. | The mean reduction in VAS score of the ergocalciferol group was 0.4 higher (2.52 lower to 3.32 higher) than placebo | 50 (1) | ⊕⊕⊝⊝ |
| Turmeric Duo score (5 to 40) | The mean Duo’s score of this vehicle group was 2 lower than pretreatment scores. | The mean reduction in VAS score of the turmeric group was 6.4 lower* (7.42 to 5.38 lower) than placebo | 100 (1) | ⊕⊕⊕⊝ MODERATE1 |
| Fumaria parviflora VAS (0 to 10 cm) | The mean VAS score of this vehicle group was 2.2lower than pretreatment scores. | The mean reduction in VAS score of the Fumaria parviflora group was 3.90lower (5.04 to 2.76 lower) than placebo | 63 (1) | ⊕⊕⊝⊝ |
| High flux/permeability dialysis VAS (0 to 10 cm) | The mean VAS score of this control group ranged from 0.6 cm to 5.6 cm lower than pretreatment scores. | The mean reduction in VAS score of the high flow/permeability group was 2.60 cm lower (3.22 to 1.97 lower) than placebo | 202 (3) | ⊕⊕⊝⊝ |
| HD with haemoperfusion VAS (0 to 10 cm) | The mean VAS score of this control group was 0.6 cm lower than pretreatment scores. | The mean reduction in VAS score of the HD with haemoperfusion group was 2.37 cm lower (2.89 to 1.85 lower) than placebo | 90 (1) | ⊕⊕⊝⊝ |
| UV‐B Duo score, VAS, and %improvement | The mean Duo score and VAS of this control group was 2.2 points and 0.3 cm lower (respectively) than pretreatment scores. | The SMD of the UV‐B group was 2.49 lower (4.62 to 0.36 lower) than placebo | 86 (4) | ⊕⊕⊝⊝ |
| Thermal therapy VAS (0 to 10 cm) | The mean VAS score of this control group was 5.8 lower than pretreatment scores. | The mean reduction in VAS score of the thermal therapy group was 2.06 lower (6.98 lower to 2.84 higher) than placebo | 41 (1) | ⊕⊕⊝⊝ |
| The reduction of risk of pharmacological versus placebo (column 3) is the additional risk reduction in addition to the benefit provided by the placebo. "Lower" indicates a reduction or negative numerical change versus baseline. CI: Confidence interval; RR: Risk Ratio; SMD: standardised mean difference; VAS: visual analogue scale | ||||
| GRADE Working Group grades of evidence | ||||
| 1Evidence of certainty was downgraded one level because of the reliance of the estimated effect on a small number of participants 2Evidence of certainty was downgraded one level because of the imprecise treatment estimate 3Evidence of certainty was downgraded one level because of study risks of bias 4Evidence of certainty was downgraded one level because heterogeneity between studies | ||||
Background
Description of the condition
Itch (uraemic pruritus) is a common symptom in people with end‐stage kidney disease (ESKD) and affects 42% to 57% of people on dialysis (Mistik 2006; Patel 2007; Pisoni 2006; Zucker 2003). Itch has significant adverse effects on quality of life (QoL) due to discomfort, disordered sleep, anxiety and depression (Narita 2006; Pisoni 2006). Despite its high prevalence, mechanisms driving uraemic itch remain poorly understood; two common theories implicate hyperactive and disordered immune (Mettang 2002) or opioid systems (Peer 1996). However, roles have also been proposed for hyperparathyroidism (Hampers 1968; Massry 1968), abnormal serum chemistry (Carmichael 1988), mast cell hyperactivity (Kaku 1990), and dialysis technique (Kato 2001; Tan 1991).
Description of the intervention
Itch has generally been used to refer to a symptom that is an intense sensation of the skin, either local or generalized, which triggers repeated scratching in an attempt to relieve the discomfort. Due to the commonality of itch in general, a formal definition in the context of chronic kidney disease (CKD) has been proposed (Zucker 2003). This defines uraemic itch as a) itch appearing shortly before the onset of dialysis, or at any time, without evidence of any other active disease that could explain the itch, b) three or more episodes of itch during a period of less than two weeks, with the symptom appearing a few times a day, lasting at least few minutes, and troubling the patient, and c) appearance of an itch in a regular pattern during a period of six months, but less frequently than listed above.
How the intervention might work
Given the variety of potential mediators in the pathophysiology of uraemic itch, a diverse range of interventions addressing the varied hypotheses has been investigated. These range from topical, symptomatic treatments to systemic treatments aimed at alleged underlying mechanisms. They largely target neurons (thought to be C‐fibres transmitting to the posterior spinothalamic tract and onto the thalamus and somatosensory cortex), their receptors, or their various local inflammatory triggers in the skin. They are presented here by mechanism of action.
Opioid receptor mediation
Recent studies have recognised spinal Mu‐receptor agonism as the mechanism of opioid‐associated itch (Liu 2011), supporting the theory that uraemic itch could represent ‘hyperactivity’ of mu‐receptors. A case report of successful treatment of uraemic itch with naloxone (Andersen 1984), a mu‐receptor antagonist, appeared to supported this concept leading to the conduct of several trials to further define this effect (Pauli‐Magnus 2000; Peer 1996). Mu agonism is typically associated with analgesia. Kappa agonism is typically associated with dysphoria and mu‐antagonism. It has also been suggested that excessive mu‐receptor or inadequate kappa‐receptor activity, with systemic imbalance rather than isolated mu‐receptor hyperactivity, may stimulate itch (Kumagai 2010). Thus, kappa‐receptor agonism such a nalfurafine may also be a therapeutic target (Kumagai 2010; Wikstrom 2005a).
Anti‐inflammatory immunomodulator mediation
A deregulated pro‐inflammatory immune system has also been implicated in the development of uraemic itch. Histamine is the best‐known immune trigger of pruritus. Preformed histamine is present in large amounts in mast cell granules. For this reason, after mast cell activation, it can be immediately released into the surrounding area where it can induce pruritus via H1 receptors on nerve fibres. Antihistamines act via prevention of the histamine fixation on the surface of the histamine receptors. Doxepin, a tricyclic antidepressant with anti‐H1 receptor effect has been investigated with this presumed mechanism (Pour‐Reza‐Gholi 2007).
Increased mast cell numbers have been observed in the skin of patients with CKD (Dimkovic 1992; Matsumoto 1985) leading to speculation that this excess was associated with increased mast cell and histamine activity (Stockenhuber 1987). Antagonising histamine or inhibiting mast cell degranulation would block this pathway. Cromolyn sodium is a drug that blocks mast cell degranulation in response to antigens, leading to decreased release of histamine, leukotrienes, and other inflammatory mast cell products. Another purported mechanism of excessive mast cell degranulation is by relative zinc deficiency. By supplementing zinc, degranulation and histamine release may be prevented (Marone 1986). Leukotriene antagonists prevent the role of leukotrienes in sustaining the inflammatory response after degranulation.
The observation that sun exposure could relieve undifferentiated itch led to trials of ultraviolet radiation in uraemic itch (Gilchrest 1977; Ko 2011). Early positive results were eventually attributed to the effect of ultraviolet B radiation in altering T helper subsets (Garssen 1999). These conclusions led to several controlled and non‐controlled trials of immunomodulators that could suppress T cell responses, such as tacrolimus, pimecrolimus, and thalidomide.
Thalidomide is a drug with anti‐inflammatory properties by modification the immune systems The exact mechanism of action of thalidomide is unknown, but it inhibits TNF‐α, IL‐6, IL‐10 and IL‐12 and other pro‐inflammatory cytokines. It modulates natural killer cell cytotoxicity and also inhibits NF‐κB and COX‐2 activity.
Nicotinamide (vitamin B3/niacin), and it is a member of the vitamin B family. It has no side‐effects like its relative, nicotinic acid such as vasodilation or flushing, and it is considered generally safe as a food additive or as a component in cosmetics and medications (Narita 2006). Nicotinamide has been used for a diverse range of conditions, including acne, rosacea, autoimmune bullous dermatoses, photo‐aging and photo immunosuppression by playing a significant role in DNA repair, maintenance of genomic stability and cellular response to injury, including inflammation and apoptosis (Cho 1997). It has been shown to be capable of inhibition of the expression of MHC‐II and the production of IL‐12, TNF‐α and IL‐1 and to be a potent stabilizer of mast cells and leukocytes (Namazi 2003).
Erythropoietin (EPO), a hormone produced by the kidneys that stimulates the production of red blood cells. The kidney synthetic function of EPO is impaired in CKD. EPO may have some anti‐itch properties as it is has been shown to reduce plasma histamine concentrations (Bohlius 2009).
Turmeric, a powder of the rhizomes of Curcuma longa L. (Zingiberaceae), commonly used as a dietary spice, is also used in Asian and Iranian medicine ordinarily for treatment of inflammation and skin wounds (Baliga 2006). Curcumin (diferuloylmethane), the most active and non‐toxic component of turmeric, is a polyphenol that has been extensively studied for its therapeutic benefits including anti‐ inflammatory activities (Aggarwal 2007).
Neuronal pathways
Gabapentin and pregabalin are structural analogues of the neurotransmitter gamma‐aminobutyric acid (GABA). The exact mechanisms of their antipruritic effects are not clear but may be related to the hindrance of C‐fibre mediated nociceptive sensations to the brain and thus pruritus (Patel 2007). Gabapentin may be particularly useful in forms of peripheral neuropathic pruritus, itch related to cholestasis, and post‐burn itch in addition to uraemic itch (Rayner 2013).
Ondansetron is a 5‐HT3 serotonin receptor antagonist to both the central and peripheral nervous system. 5‐HT3 is known to be an activator of neuronal receptors along the C‐fibre/spinothalamic pathway. The medication’s possible efficacy in uraemic itch has been attributed to this mechanism (Yue 2015).
Capsaicin has been demonstrated to deplete substance P, a principal neurotransmitter regulating passage of noxious stimuli (Burks 1985), and may therefore block transmission of pruritic sensation.
Chilled baby oil can also interrupt the transmission of C nerve fibres and can minimize inflammation and chemical stimulation (Kennet 2007; Wang 2006). This is thought to be mediated by temperature induced vasoconstriction, reduced cell metabolism and nerve transmission speed, and paralysis of neural receptors (Chiu 2008).
Other interventions
Ergocalciferol is a precursor in the local production of active vitamin D in the skin of HD patients after exposure to sunlight. One hypothesis, supported by trials, claims anti‐itch benefit from the positive effect of UVB exposure on uraemic pruritus (Shirazian 2013).
Activated charcoal is an agent that can bind many poisons in the stomach preventing them from being absorbed. Charcoal has been studied for possible effectiveness in uraemic pruritus (Giovannetti 1995).
Several agents have also been trialled on an empiric basis with identifiable mechanism. Cholestyramine and lidocaine have been trialled after published RCTs showed benefit with cholestatic itch (Villamil 2005). L‐carnitine has been suspected as the causative agent in other symptoms of uraemia (Bohmer 1978). Pramoxine is a commercially available topical local anaesthetic that has been shown to have antipruritic properties when used both alone and in combination with lactic acid (Grove 2004). L‐arginine ointment, a semi‐essential amino acid, has been shown to improve skin dryness and, in particular, improve pruritus in haemodialysis (HD) patients (Durant‐Finn 2008). Essential fatty acids and their derivatives have a protective function and influence skin structure and physiological characteristics (Andreassi 1997).
Why it is important to do this review
Itch affects the majority of CKD patients. The majority of patients on HD report itch symptoms. One fifth of all those on HD reported significant sleep disturbances (Narita 2006). Typically, trials investigating itch treatments are single centre studies with small numbers and often have conflicting results. The conclusions from past meta‐analyses were that there was insufficient data to recommend one treatment compared with another, and further rigorous trials were needed. Therefore, it is important that a modern systematic assessment of the existing evidence be conducted to summarise the effect of current studies. The aim of this systematic review is to summarise randomised controlled trials (RCTs) in patients with ESKD comparing any topical or systemic intervention with placebo or usual care in the management of uraemic itch.
Objectives
Our objectives are to determine:
-
the benefits and harms (both absolute and relative) of all topical and systemic interventions for the treatment of uraemic itch, either alone or in combination, when compared with placebo or standard care; and
-
the dose strength or frequency, stage of kidney disease or method of dialysis used (where applicable) in cases where the effects of these interventions vary depending on co‐interventions.
Methods
Criteria for considering studies for this review
Types of studies
All RCTs and quasi‐RCTs (RCTs in which allocation to treatment was obtained by alternation, use of alternate medical records, date of birth or other predictable methods) looking at evaluating interventions involving uraemic itch. Some studies allocated treatment based only on dialysis schedule (e.g. Monday, Wednesday, Friday) which also represent a systemic change in treatment and environment. These studies have not been included.
Types of participants
Inclusion criteria
Patients with advanced CKD defined as CKD stages 4, 5, or 5D were included.
Exclusion criteria
Patients with CKD stages 1, 2 and 3 were excluded. In studies before 2002, patients with CKD not on dialysis were excluded.
Types of interventions
All interventions, administered by any method (oral, intravenous (IV), topical, or otherwise), in any frequency and at any dose strength are included. Among people undergoing dialysis, the intervention may be administered on dialysis or non‐dialysis days. Complementary interventions (such as acupuncture or massage) were excluded because they are not easily comparable or categorised with other interventions.
Participants in included study control arms received no intervention, placebo, a different dose strength or frequency from the experimental intervention, or any other intervention not administered to experimental arm participants.
We included studies of the type:
-
Intervention versus placebo
-
Intervention A versus intervention B
-
Co‐intervention A versus co‐intervention B.
To simplify interpretation, each intervention was assigned a GRADE evidence profile in a summary of findings table (Guyatt 2011).
Types of outcome measures
We assessed outcome measures at the end of the treatment period or up to two weeks post‐treatment, or as reported by investigators.
Primary outcomes
-
Post treatment itch
-
Measured by visual analogue scale (VAS), Duo score or any other validated score for itch
-
Other recognised numerical or categorical itch measurement scores.
-
Secondary outcomes
-
QoL as measured by any validated QoL scale
-
Death
-
Length of treatment in hospital or outpatient clinic
-
Length of time to itch relief
-
Adverse events
-
Sleep disturbances
-
Dermatological reactions
-
Other adverse effects (e.g. neurological, gastrointestinal).
-
Search methods for identification of studies
Electronic searches
We searched the Cochrane Kidney and Transplant Specialised Register up to 17 December 2019 through contact with the Information Specialist using search terms relevant to this review. The Cochrane Kidney and Transplant Specialised Register contains studies identified from several sources.
-
Monthly searches of the Cochrane Central Register of Controlled Trials (CENTRAL)
-
Weekly searches of MEDLINE OVID SP
-
Handsearching of kidney‐related journals and the proceedings of major kidney conferences
-
Searching of the current year of EMBASE OVID SP
-
Weekly current awareness alerts for selected kidney and transplant journals
-
Searches of the International Clinical Trials Register (ICTRP) Search Portal and ClinicalTrials.gov.
Studies contained in the Register are identified through searches of CENTRAL, MEDLINE, and EMBASE based on the scope of Cochrane Kidney and Transplant. Details of search strategies, as well as a list of handsearched journals, conference proceedings and current awareness alerts, are available on the Cochrane Kidney and Transplant website.
See Appendix 1 for search terms used in strategies for this review.
Searching other resources
-
Reference lists of review articles, relevant studies, and clinical practice guidelines.
-
Letters seeking information about unpublished or incomplete trials to investigators known to be involved in previous studies.
-
Additional data sources included clinical study reports and direct correspondence with study authors.
Data collection and analysis
Selection of studies
The search strategy described was used to obtain titles and abstracts of studies that were potentially relevant to the review. Two authors independently screened titles and abstracts, and discarded studies that were not applicable; however, studies and reviews that potentially included relevant data or information on studies were initially retained. The two authors independently assessed retrieved abstracts and appropriate full texts of these studies to determine which studies satisfied our inclusion criteria.
Data extraction and management
Two authors carried out data extraction independently using standardised data extraction forms. Studies reported in non‐English language journals were translated before assessment. The translators are noted in the acknowledgements. When more than one publication of one study exists, reports were grouped together and the publication with the most complete data was used in the analyses. When relevant outcomes are only published in earlier versions then these data were used. Any discrepancy between published versions were to be noted and there were no significant instances in this meta‐analysis.
Assessment of risk of bias in included studies
The following items are independently assessed by two authors using the risk of bias assessment tool (Higgins 2011) (see Appendix 2).
-
Was there adequate sequence generation (selection bias)?
-
Was allocation adequately concealed (selection bias)?
-
Was knowledge of the allocated interventions adequately prevented during the study?
-
Participants and personnel (performance bias)
-
Outcome assessors (detection bias)
-
-
Were incomplete outcome data adequately addressed (attrition bias)?
-
Are reports of the study free of suggestion of selective outcome reporting (reporting bias)?
-
Was the study apparently free of other problems that could put it at a risk of bias?
Measures of treatment effect
For dichotomous outcomes (e.g. any itch versus no itch) results were expressed as risk ratios (RR) with 95% confidence intervals (CI). Where continuous scales of measurement were used to assess the effects of treatment (e.g. Duo score or VAS), the mean difference (MD) was used, or the standardised mean difference (SMD) if different scales needed to be resolved.
Any validated tool for the quantification of itch was used. These included, but were not limited, to VAS and the Duo scoring system, which were the most commonly reported measurement tools for itch. VAS was scored on a 10‐point scale and the Duo scoring system is based on severity, distribution, and sleep disturbance up to a maximum score (usually 45). RCTs with clearly documented, but non‐validated scoring systems were considered as non‐ideal evidence.
Unit of analysis issues
The unit of focus was the quantities and qualities affecting a single person. For example, itch episodes/person was preferable to total number of itch episodes affecting an unspecified number of people or time frame.
Dealing with missing data
Further information required from the original author was requested by written correspondence (e.g. emailing corresponding author/s) and any relevant information obtained in this manner was included in the review. Evaluation of important numerical data such as screened, randomised patients as well as intention‐to‐treat, as‐treated and per‐protocol population were to be performed. Attrition rates, for example drop‐outs, losses to follow‐up and withdrawals were investigated.
For missing data of the second stage of a cross‐over RCT, assuming appropriate data can be acquired from the first (pre‐cross‐over) stage, the second stage was dropped from the analysis. The "first" stage was treated at as a parallel RCT. When all the means and SD for both groups and both periods were available with an incomplete paired data analysis, all measurements from both periods were treated as parallel group studies. If this analysis in consistent with the data provided within the study, we accepted this with the acknowledgement of risk of bias in both the inflation of confidence intervals and study heterogeneity. Finally, if paired data were available (or able to be fully reconstructed) then the generic inverse variance method was used to incorporate the studies into the meta‐analysis.
Issues of missing data and imputation methods (for example, last‐observation‐carried‐forward) was critically appraised (Higgins 2011).
Assessment of heterogeneity
Heterogeneity was analysed using a Chi² test on N‐1 degrees of freedom, with an alpha of 0.05 used for statistical significance and with the I² test (Higgins 2003). I² values of 25%, 50% and 75% correspond to low, medium and high levels of heterogeneity.
Assessment of reporting biases
Given the size and organisation of participants in this review, funnel plots (used to assess for the potential existence of small study bias) were not included. Reporting bias was discussed on an individual study basis (Characteristics of included studies).
Data synthesis
Data was pooled using the random‐effects model.
Subgroup analysis and investigation of heterogeneity
Subgroup analysis was used to explore possible sources of heterogeneity (e.g. participants, interventions, and study quality). Heterogeneity among participants could be related to age, geography, and stage of CKD. Heterogeneity in treatments could be related to prior agent(s) used and the agent, dose, and duration of therapy (such as increased tolerance after prolonged use of anti‐itch agents). Additionally, cross‐over studies may represent an independent source of bias due to their paired design. Adverse effects have been tabulated and assessed using descriptive techniques, because they are likely to differ among agents used. We planned to calculate the 95% risk difference for each adverse effect. However, due to the variety of interventions used and the inadequate reporting of adverse events, this was not done.
Sensitivity analysis
We planned to undertake sensitivity analyses however due the wide variety of interventions this was not performed.
Summary of findings' tables
We have presented the main results of the review in 'Summary of findings' tables. These tables present key information concerning the quality of the evidence, the magnitude of the effects of the interventions examined, and the sum of the available data for the main outcomes (Schunemann 2011a). The 'Summary of findings' tables also include an overall grading of the evidence related to each of the main outcomes using the GRADE (Grades of Recommendation, Assessment, Development and Evaluation) approach (GRADE 2008; Guyatt 2008). The GRADE approach defines the quality of a body of evidence as the extent to which one can be confident that an estimate of effect or association is close to the true quantity of specific interest. The quality of a body of evidence involves consideration of within‐trial risk of bias (methodological quality), directness of evidence, heterogeneity, precision of effect estimates and risk of publication bias (Schunemann 2011b). We presented the following outcomes in the 'Summary of findings' tables.
-
Itch severity: a patient's subjective rating of their sensation of itch. Severity is measured on a continuous scale or as a binary response. The most common itch scales included were the VAS and Duo score. Few studies included their own holistic scale based on varying degrees of validated evidence.
-
VAS: a 0 to 10 cm rating using the horizontal or vertical numeric rating scale for subjective characteristics or attitudes that cannot be directly measured. It was developed originally to assess the intensity of pain, but subsequently it was also adopted for pruritus evaluation. A number of studies dealing with itch have demonstrated that VAS is a reliable method of pruritus severity measurement (Reich 2012)
-
Duo score: a numerical measure of itching scoring according to severity, frequency, and distribution with roughly equal contributions from each category. Originally proposed by Duo 1987, modified by Mettang 1990, and again by (Hiroshige 1995), the structure has remained consistent, while the range of score has varied from 0 to 10 to 3 to 81.
-
Adverse events: adverse effects were poorly and inconsistently reported across all studies. These have been documented in the results section and 'additional tables' (Table 1; Table 2; Table 3; Table 4; Table 5). Further meaningful assessments on harm could not be made and were not included in the 'Summary of findings' tables.
| Intervention | Participants | Route/dose | Intervention adverse effects | Control adverse effects |
|---|---|---|---|---|
| GABA analogue (pregabalin or gabapentin) versus placebo | 271 (6) | Pregabalin (a) Oral: 75 mg, twice/week Gabapentin (b) Oral: 400 mg, twice/week (c) Oral: 300 mg, 3 times/week (d) Oral: 300 mg/day (e) Oral: dose not reported | Gunal 2004 (c): somnolence, dizziness, fatigue Naghibi 2007 (e): somnolence Naini 2007 (b): somnolence, dizziness, nausea Nofal 2016 (d): somnolence (9/27), dizziness (5/27) Tol 2010 (c): not reported Yue 2015 (a): somnolence (3/67), loss of balance (2/67) | Gunal 2004: not reported Naghibi 2007: not reported Naini 2007: not reported Nofal 2016: not reported Tol 2010: not reported Yue 2015: not reported |
| Ondansetron versus placebo | 161 (3) | (a) Oral: 8 mg, 3 times/day (b) Oral: 8 mg, once/day (c) Oral: 8 mg, twice/day | Ashmore 2000 (a): not reported Murphy 2003 (b): constipation (1/14), ischaemic stroke (1/18), line sepsis (1/17) Yue 2015 (c): nausea and vomiting (2/64) | Ashmore 2000: not reported Murphy 2003: not reported Yue 2015: none |
| Kappa opioid agonists versus placebo | 626 (4) | Nalfurafine (a) Oral: 2.5 µg once/day (b) Oral: 5 µg once/day (c) IV: 5 µg, 3 times/week (d) IV: 2.5, 5 µg with dialysis CR845 (e) IV: 0.5 to 1.5 µg/kg with dialysis | Kumagai 2010 (a, b) 2.5 µg (oral): somnolence (4.5%); insomnia (7.1%), diarrhoea (4.5%), nasopharyngitis (8.0%) 5 µg (oral): constipation (7.9%), somnolence (3.5%), insomnia (14.9%), nasopharyngitis (12.3%) Spencer 2015 (e): not reported Spencer 2017 (e) (0.5 to 1.5 µg/kg): somnolence (9/129), dizziness (12/129), headache (5/129), diarrhoea (16/129), nausea (11/129) Bhaduri 2006 (d): not reported Wikstrom 2005 (c): headache (3/26), nausea (3/26), vomiting (2/26), insomnia (2/26), vertigo (2/26) | Kumagai 2010: nasopharyngitis (17.1%), headache (3.6%), vomiting (3.6%) Spencer 2015: not reported Spencer 2017: somnolence (1/45), dizziness (2/45), headache (1/45), diarrhoea (0/45) Wikstrom 2005: 13/25 (type not reported) |
| Mu opioid antagonists versus placebo | 31 (2) | Oral: 50 mg once/day | Pauli‐Magnus 2000: loss of appetite and nausea (9) Peer 1996: heartburn (2), abdominal discomfort (3) | Pauli‐Magnus 2000: nausea (1) Peer 1996: not reported |
| Nalbuphine versus placebo | 373 (1) | Oral: 60 or 120 mg, twice/day | 60 mg: serious adverse events (12.7%), adverse events leading to discontinuation (33/128) 120 mg: serious adverse events (6.7%), adverse events leading to discontinuation (27/120) | TREVITR02 2017: serious adverse events (15.4%), adverse events leading to discontinuation (7/123) |
| EPO versus placebo | 39 (2) | (a) IV: 36 U/kg/dialysis (b) SC: 2000 IU twice/day | De Marchi 1992 (a): not reported Sja'bani 1997 (b): not reported | De Marchi 1992: not reported Sja'bani 1997: not reported |
| Nicotinamide versus placebo | 50 (1) | Oral: 500 mg twice/day | Omidian 2013: not reported | Omidian 2013: not reported |
| Lidocaine versus placebo | 20 (1) | IV: 200 mg | Tapia 1977: not reported | Tapia 1977: not reported |
| Cholestyramine | 20 (2) | Oral: 5 mg, twice/day | Silverberg 1977: constipation (1/5), nausea (1/5) van Leusen 1978: not reported | Silverberg 1977: not reported van Leusen 1978: not reported |
| Montelukast versus placebo | 89 (2) | Oral: 10 mg/day | Mahmudpour 2017: not reported Nasrollahi 2007: myelodysplastic syndrome (1/8) | Mahmudpour 2017: Not reported Nasrollahi 2007: myocardial infarction (1/8) |
| Sertraline versus placebo | 50 (1) | Oral: 50 mg twice/day | Pakfetrat 2018: not reported | Pakfetrat 2018: not reported |
| Sodium thiosulfate versus placebo | 45 (1) | IV: 12.5 mg/dialysis session | Mohamed 2012: not reported | Mohamed 2012: not reported |
| Doxepin versus placebo | 24 (1) | Oral: 10 mg, twice/day | Pour‐Reza‐Gholi 2007: drowsiness (12/24) | Pour‐Reza‐Gholi 2007: not reported |
| Thalidomide versus placebo | 29 (1) | Oral: 100 mg/day | Silva 1994: not reported | Silva 1994: not reported |
| Cimetidine versus placebo | 13 (1) | Oral: 600 mg/day | Aubia 1980: not reported | Aubia 1980: not reported |
| Cromolyn versus placebo | 62 (1) | Oral: 135 mg, 3 times/day | Vessal 2010: flatulence (1/32) | Vessal 2010: nausea (5/30), diarrhoea (4/30) |
| Gabapentin versus pregabalin | 50 (1) | Oral gabapentin (300 mg, once/day) versus oral pregabalin (75 mg, once/day) | Gabapentin: not reported Pregabalin: not reported | ‐‐ |
| GADA versus ondansetron | 131 (1) | Oral pregabalin (75 mg twice/week) versus oral ondansetron (8 mg/day) | Pregabalin: somnolence (3/67), loss of balance (2/67) Ondansetron: not reported | ‐‐ |
| GABA analogue versus doxepin | 90 (1) | Oral pregabalin (50 mg every other night) versus oral doxepin (10 mg/night) | Pregabalin: intolerable adverse events (3/46), somnolence (6/37), oedema (3/37), drowsiness (3/27), imbalance (1/37), numbness (1/37) Doxepin: intolerable adverse events (1/44), nervousness (1/35) | ‐‐ |
| GABA analogue versus antihistamine | 212 (4) | (a) Oral gabapentin (100 mg/day) versus oral ketotifen (1 mg, twice/day) (b) Oral gabapentin (300 mg, 3 times/week) versus oral dexchlorpheniramine (6 mg, 3 times/week) (c) Oral gabapentin (300 mg/day) versus oral loratadine (10 mg/day) (d) Oral gabapentin (100 to 200 mg/day) versus oral hydroxyzine (10 mg/day) (e) Oral gabapentin (100 mg/day) versus oral hydroxyzine (10 mg/day) | Amirkhanlou 2016 (a) Gabapentin: drowsiness (4/26), dizziness (1/26) Ketotifen: drowsiness (4/26), dizziness (1/26) Gabapentin: total (11/30), drowsiness (17%) Dexchlorpheniramine: total (8/30), drowsiness (1/30) Marin 2013 (c) Gabapentin: somnolence (8/30) Loratadine: none reported Noshad 2011 (d) Gabapentin: complications (7/20) Hydroxyzine: complications (10/20) Gabapentin: (9/18) Loratadine: (4/16) | ‐‐ |
| Mu opioid antagonists versus antihistamine | 52 (1) | Oral naltrexone (50 mg/day) versus oral loratadine (10 mg/day) | Naltrexone (26): vomiting (2), nausea (9), anorexia (1), abdominal distention (1), malaise (1), cramps (2), sleep disturbances (5), vertigo (5), headache (2), somnolence (1), paraesthesia (1), withdrawn (10) Loratadine (26): vomiting (2), malaise (1), withdrawn from study (2) | ‐‐ |
| Ondansetron versus antihistamine | 20 (1) | (a) Ondansetron tablet (8 mg/day) versus cyproheptadine syrup (8 mg/day) (b) "3 doses ondansetron 8mg" versus "diphenhydramine 25mg" (c) Oral ondansetron (8 mg, 3 times/day) versus oral loratadine (10 mg twice/day) | Ozaykan 2001 (a): not reported Subach 2001 (b): not reported Mirnezami 2013 (c): not reported | ‐‐ |
*when reported
GABA ‐ gamma‐aminobutyric acid
| Intervention | Participants | Route/dose | Intervention adverse effects | Control adverse effects |
|---|---|---|---|---|
| Cromolyn cream versus placebo | 60 (1) | 4% cream | Feily 2012: burning sensation (6/30) | Feily 2012: none |
| Capsaicin cream versus placebo | 91 (4) | (a) 0.025%, 4 times/day (b) 0.03%, 4 times/day | Breneman 1992 (a): burning and stinging sensation (5), decrease in xerosis (3), dryness (2) Cho 1997 (a): not reported Makhlough 2010 (b): skin burning Tarng 1996 (a): local burning and/or stinging sensations | Breneman 1992: not reported Cho 1997: not reported Makhlough 2010: none Tarng 1996: local burning and/or stinging sensations |
| Pramoxine lotion versus placebo | 28 (1) | 1.0% twice/day | Young 2009: none | Young 2009: none |
| Baby oil versus placebo | 92 (1) | Chilled and unchilled 15 min application at least once/day | Lin 2012: not reported | Lin 2012: not reported |
| Dead Sea lotion versus placebo | 50 (1) | Entire body, twice/day | Boaz 2009: total adverse events (2/25) | Boaz 2009: total adverse events (3/25) |
| Sericin cream versus placebo | 50 (1) | 1 g, twice/day | Aramwit 2012a: not reported | Aramwit 2012a: not reported |
| L‐arginine salve versus placebo | 24 (1) | 25 µg/2.5 cm2 twice/day | Durant‐Finn 2008: not reported | Durant‐Finn 2008: not reported |
| Calcineurin inhibitors versus placebo | 80 (2) | TAC: 0.1% twice/day Pimecrolimus: 1.0% twice/day | Duque 2005: warmth sensation (6/12) Ghorbani 2012a: burning sensation which disappeared by the end of 8 weeks | Duque 2005: warmth sensation (3/8) Ghorbani 2012a: none |
| Sweet almond oil versus no intervention | 44 (1) | 100 mg/day | Afrasiabifar 2017: not reported | Afrasiabifar 2017: not reported |
| Gamma‐linoleic acid versus placebo | 17 (1) | 2.2%, 30 mL/day | Chen 2006e: allergic reaction (1/8) | Chen 2006e: none |
| Calcineurin inhibitors versus cromolyn | 60 (1) | Pimecrolimus: 2% twice/day Cromolyn: 4%, twice/day | Ghorbani Birgani 2011: unknown | Ghorbani Birgani 2011: unknown |
| Avena sativa versus diluted vinegar versus hydroxyzine | 23 (1) | Avena sativa: variable dose, twice/day Dilute vinegar: 30 mL twice/day Oral hydroxyzine: 10 mg/day | Nakhaee 2015: not reported | ‐‐ |
| Sarna versus eurax | 30 (1) | Sarna: 0.5% each of camphor, menthol, and phenol "as required" for 7 days Eurax: 10% crotamiton "as required" for 7 days | Sarna: none Eurax: rash (1) | ‐‐ |
*when reported
| Intervention | Participants | Dose/route | Intervention adverse effects | Placebo adverse effects |
|---|---|---|---|---|
| Polyunsaturated fatty acids versus placebo | 89 (4) | Fish oil (a) Oral: 6 g/day (b) Oral: 3 g/day Omega‐3 fatty acids (c) Oral: 3 g/day | Begum 2004 (a): not reported Ghanei 2012 (c): not reported Mojgan 2017 (b): not reported Peck 1996 (a): not reported | Begum 2004: not reported Ghanei 2012: not reported Mojgan 2017: not reported Peck 1996: not reported |
| L‐carnitine versus placebo | 17 (1) | IV: 10 mg/kg, once/day | Mettang 1997: not reported | Mettang 1997: not reported |
| Zinc sulfate versus placebo | 80 (2) | (a) Oral: 220 mg/day (b) Oral: 200 mg twice/day | Mapar 2015 (a): none Najafabadi 2012 (b): none “attributable to zinc sulfate” | Mapar 2015: vomiting (1/20) Najafabadi 2012: not reported |
| Ergocalciferol versus placebo | 50 (1) | Oral: 50,000 IU/week | Shirazian 2013: none | Shirazian 2013: not reported |
| Turmeric (curcumin) versus placebo | 100 (1) | Oral: 500 mg (22.1 mg), 3 times/day | Pakfetrat 2014: none | Pakfetrat 2014: not reported |
| Fumaria parviflora versus placebo | 79 (1) | Oral: 1000 mg, 3 times/day | Akrami 2017: Gastric pain (4/39), rash (1/39) | Akrami 2017: abdominal pain (1/40), constipation (1/40) |
| Senna versus placebo | 60 (1) | Oral: dose and frequency not reported | Fallahzadeh 2015: not reported | Fallahzadeh 2015: not reported |
| Evening primrose oil | 16 (1) | Oral: 2 capsules/day (containing 360 mg of linoleic acid, 50 mg oleic acid and 45 mg of gamma‐linoleic acid) | Yoshimoto‐Furuie 1999: none | Yoshimoto‐Furuie 1999: none |
| Activated charcoal versus placebo | 20 (1) | Oral: 6 g/day | Pederson 1980: not reported | Pederson 1980: not reported |
| Charcoal versus aluminium hydroxide | 30 (1) | Charcoal: 6 g, 3 times/day Aluminium hydroxide: 30 mL, 3 times/day | Shariati 2010: not reported | ‐‐ |
*when reported
| Intervention | Participants | Dose/route | Intervention adverse effects | Control adverse effects |
|---|---|---|---|---|
| High flux/ high permeability/high flow HD | 252 (4) | (a) High‐flow HD (b) High‐permeability HD (c) High‐flux HD | Aliasgharpour 2018 (a): not reported Chen 2009 (b): not reported Hui 2011 (c): not reported Jiang 2016 (c): not reported | Aliasgharpour 2018: not reported Chen 2009: not reported Hui 2011: not reported Jiang 2016: not reported |
| HD with haemoperfusion | 90 (1) | Haemoperfusion HA130‐RHA HA330‐RHA | Li 2017a: not reported | Li 2017a: not reported |
| Haemoperfusion plus HD versus haemoperfusion plus HDF | 40 (1) | Haemoperfusion plus HD Haemoperfusion plus HDF | Haemoperfusion plus HD: not reported Haemoperfusion plus HDF: not reported | ‐‐ |
| Magnesium‐free HD versus standard HD | 17 (1) | Standard HD: 0.85 mmol/L magnesium solution for 2 weeks | Carmichael 1988: not reported | Carmichael 1988: not reported |
| Calcium dialysate HD | 4 (1) | Calcium concentration 1.0 mmol/L 1.25 mmol/L 1.75 mmol/L | Kyriazis 2000: not reported | Kyriazis 2000: not reported |
| Cool versus normal dialysate | 60 (1) | Cool dialysate: 35.5oC, 3 times/week Normal dialysate: 37oC, 3 time/week | Rad 2017: not reported | Rad 2017: not reported |
*when reported
| Intervention | Participants | Dose/route | Intervention adverse effects | Control adverse effects |
|---|---|---|---|---|
| UV‐B exposure | 75 (4) | (a) 0.19 nJ/cm2/sec, 3 times/week (b) Minimal erythema dose, twice/week (c) 4.4 watts/m2, twice/week (d) 200 mJ/cm2, 3 times/week | Blachley 1985 (a): not reported Chan 1995 (b): not reported Gilchrest 1977 (c): sunburn (3/10), tanning (5/10) Gilchrest 1979 (c): mild sunburn and tanning Ko 2011 (d): erythema (2/11) | Blachley 1985: not reported Chan 1995: not reported Gilchrest 1977: not reported Gilchrest 1979: not reported Ko 2011: not reported |
| UV‐A exposure | 11 (1) | UV‐A (exposure): 40 min exposure (10, 180 cm 85W UV‐A lamps) 3 times/week | Taylor 1983: not reported | Taylor 1983: not reported |
| Thermal therapy | 41 (1) | 40oC thermal therapy, twice/week | Hsu 2009: not reported | Hsu 2009: not reported |
| UV‐B exposure versus cetirizine | 30 (1) | UV‐B Whole body: 200 to 1038 mJ/cm2 every 3rd day for 15 sessions Cetirizine Oral: 10 mg/day for the same duration | Sherjeena 2017: not reported | ‐‐ |
*when reported
Results
Description of studies
Results of the search
The process of selecting records and studies for inclusion in this systematic review is outlined in Figure 1. The titles, abstracts, and summaries of 689 records were evaluated from three separate databases and the Specialised Register. Overlap within the database searches resulted in 196 records removed as duplicate records. An additional 312 records were excluded due to failing to meet study design, intervention, participant, or outcome criteria prior to full‐text review.
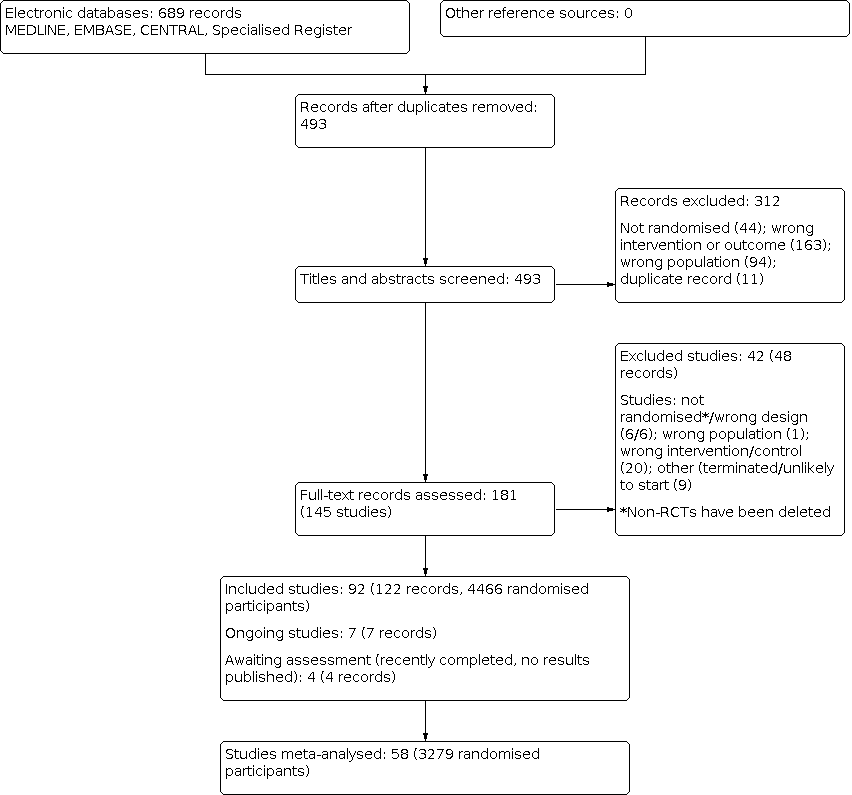
Study flow diagram.
We contacted 27 authors of papers with conflicting or missing data. Of all authors contacted for further clarification seven responded including Dr. Tol, Dr. Ashmore, Dr. Tarng, Dr. Pornanong Aramwit. Dr. Fleicher, Dr. Peer, and Dr. Haghverdi. Five authors provided supplementary data incorporated into the review.
In total we identified 144 studies (181 records). Ninety‐one studies met our inclusion criteria and 42 studies (48 records) were excluded; six non‐RCTs were subsequently deleted. There are seven ongoing studies (ACTRN12614000677606; DON'T ITCH 2015; IRCT201311152417N14; IRCT2015051411940N3; NCT03422653; NCT03636269; SNUG 2019 and three studies (NCT01513161; NCT02696499; NCT02747979) have recently been completed but have yet to report results. These 10 studies will be assessed in a future update of this review.
Included studies
Ninety‐two studies (122 records) randomising 4466 participants met our inclusion criteria. All were RCTs that evaluated changes in itch (the primary outcome) associated with CKD before and after an intervention. Almost 90% of all RCTs originated from the USA, UK, Israel, Taiwan, Iran, Germany, or Japan. Translated non‐English study languages included Farsi, French, Mandarin, Turkish, German, and Spanish.
The identified RCTs yielded a broad spectrum of different interventions for the treatment of itch associated with different underlying diseases. A total of 78 studies were placebo‐controlled, five studies compared gabapentinoids versus antihistamines or gabapentin versus pregabalin, and nine studies compared different dialysis modalities or dialysis solutions.
The most common reason for studies not to be included in this review's quantitative analysis was inadequate reporting that precluded a meaningful comparison (e.g. SD or placebo results not explicitly reported). Thirty additional studies were included in the qualitative analysis.
All but 23 studies described adverse effects in at least the intervention group. Just over half of the studies failed to specify adverse effects (or lack thereof) in the control population. A handful of studies also measured QoL, sleep quality, depression, dialysis quality, or patient satisfaction. Two studies with pharmacological interventions measured the interaction of dialysis modality with their intervention. No meaningful qualitative or quantitative analysis could be made from secondary outcomes other than adverse events.
For additional information on all included studies see Characteristics of included studies.
Excluded studies
Forty‐two studies were excluded from this review after comprehensive full text analysis. The most common reasons for exclusion were not meeting proper criteria for a true RCT, followed by inappropriate intervention. Four studies did not meet our protocol's criteria for the target population. Finally, eight excluded studies appeared to have never been initiated or stopped prematurely without publishing results.
Across all searched studies the most common reasons for exclusion were:
-
Outcome not truly itch‐related (e.g. serum PTH level used as a surrogate monitor)
-
Lack of a true control, self‐control, or comparison group
-
Wrong intervention
-
Selected studies were not truly randomised or pseudo‐randomised.
-
Gross omission of data based on the recommendations of the Cochrane Handbook for Systematic Reviews of Interventions (Higgins 2011).
-
Selected studies include patients without CKD
-
Study was never initiated or stopped prematurely without publishing results.
For additional information on all excluded studies see Characteristics of excluded studies
Risk of bias in included studies
All studies included in the meta‐analyses were RCTs, either parallel or cross‐over. Each explicitly reported patients as randomised to an intervention or placebo group. Sensitivity analyses were conducted for each intervention that included both only parallel RCTs versus cross‐over with parallel RCT data. No significant differences in effect size of heterogeneity were observed. See Figure 2; Figure 3.

Risk of bias summary: review authors' judgements about each risk of bias item for each included study.

Risk of bias graph: review authors' judgements about each risk of bias item presented as percentages across all included studies.
Allocation
Random sequence generation
Forty‐two studies reported a specific method of randomisation, either computer‐generated or the use of a random number table. Three studies were judged to be at high risk of bias (Ghanei 2012; Lin 2012; Sherjeena 2017), and the remaining 47 studies were considered to be uncertain risk.
Allocation concealment
Nineteen studies were judged to be al low risk of bias for allocation concealment, two were at high risk of bias ((Marin 2013; Sherjeena 2017), and the remaining 71 studies were considered to be of uncertain risk.
Blinding
Two studies (Ko 2011; Nasrollahi 2007) only blinded the participants (single blind), and three studies (Lin 2012; Marin 2013; Ozaykan 2001) were open‐label studies. Complicated equipment for emitting UVB radiation (Ko 2011; Sherjeena 2017), administering new dialysis modalities (Zhang 2016a), or the absolute temperature of the intervention (Lin 2012; Rad 2017) may have precluded any blinding efforts. The majority of blinded studies utilized unlabelled pills/infusions for oral/IV interventions or a comparable unlabelled vehicle of similar consistency for blinding of a topical agent.
For performance bias, 10 studies were judged to be at high risk of bias (Afrasiabifar 2017; Hui 2011; Legroux‐Crespel 2004; Li 2017a; Marin 2013; Nakhaee 2015; Ozaykan 2001; Sherjeena 2017; Solak 2012; Zhang 2016a), 59 studies were at low risk of bias, and the remaining 23 studies were considered to be of uncertain risk.
For detection bias, 14 studies were judged to be at high risk of bias (Gilchrest 1977; Gilchrest 1979; Legroux‐Crespel 2004; Li 2017a; Lin 2012; Marin 2013; Mohamed 2012; Nakhaee 2015; Nasrollahi 2007; Ozaykan 2001; Sherjeena 2017; Solak 2012; Taylor 1983; Zhang 2016a), 47 were at low risk of bias, and the remaining 30 studies were considered to be of uncertain risk.
Incomplete outcome data
Eight studies (Carmichael 1988; Gilchrest 1979; Murphy 2003; Peck 1996; Pederson 1980; Silva 1994; Tapia 1977; Vessal 2010) had a greater than 10% dropout rate, mainly reflective of low sample sizes. The average post randomisation size of these eight studies was 28 participants. Only one of these studies analysed on an intention‐to‐treat basis. Twenty‐two of the remaining studies were completed with one or more dropouts after randomisation; half were analysed on an intention‐to‐treat basis.
For attrition bias, 12 studies were judged to be at high risk of bias (Breneman 1992; Carmichael 1988; Gilchrest 1977; Gilchrest 1979; Murphy 2003; Peck 1996; Pederson 1980; Silva 1994; Tamimi 1999; Tapia 1977; Vessal 2010), 52 studies were at low risk of bias, and 28 studies were considered to be of uncertain risk.
Selective reporting
Two studies appeared to only report and collect categorical or binary endpoints such as “significant itch reduction” versus “no significant itch reduction (Gilchrest 1979; Tapia 1977). Silva 1994 clearly collected continuous itch outcomes, but only reported and analysed binomial outcomes. Tol 2010, Pederson 1980, and Tarng 1996 did not report placebo results and could not be included in the quantitative analysis.
For reporting bias, 25 studies were judged to be at high risk of reporting bias (Amirkhanlou 2016; Aubia 1980; Baumelou 1993; Breneman 1992; Carmichael 1988; Chan 1995; De Marchi 1992; Duque 2005; Gilchrest 1977; Kyriazis 2000; Legroux‐Crespel 2004; Mohamed 2012; Mojgan 2017; Nakhaee 2015; Pederson 1980; Rad 2017; Rivory 1984; Silva 1994; Spencer 2017; Tamimi 1999; Tapia 1977; Tarng 1996; Taylor 1983; Tol 2010; Young 2009), 46 studies were at low risk of bias, and 21 studies were considered to be of uncertain risk.
Other potential sources of bias
In all the included studies, post‐randomisation dropout rates were balanced (no statistically significant difference in dropout rates) between intervention and control with the exception of Pauli‐Magnus 2000 which had five dropouts (2.5%) in the intervention group for the indication of opioid pain relief. However, this was anticipated in pretrial planning and the patients were included in the analysis on an intention‐to‐treat basis.
The authors of six studies (Boaz 2009; Duque 2005; Spencer 2015; Spencer 2017; TREVITR02 2017; Young 2009) had financial backing from the respective pharmaceutical manufacturers. One study (Legroux‐Crespel 2004) reported conflicting results and used arbitrary definitions of improvement. These seven studies were judged to be at high risk of bias. Sixty studies were judged to be at low risk of bias and 25 studies were considered to of uncertain risk.
Effects of interventions
See: Summary of findings 1 Pharmacological interventions versus placebo for the relief of itch in people with advanced chronic kidney disease; Summary of findings 2 Topical treatments versus placebo for the relief of itch in people with advanced chronic kidney disease; Summary of findings 3 Supplements, haemodialysis modalities, and other treatments for the relief of itch in people with advanced chronic kidney disease
We organised the studies into the following groups:
-
Pharmacological interventions
-
Topical interventions
-
Oral or IV supplements
-
Dialysis modality
-
All other interventions.
1. Pharmacological interventions
See summary of findings Table 1; adverse effects Table 1.
GABA analogues
Twelve studies (Amirkhanlou 2016; Foroutan 2017; Gobo‐Oliveira 2018; Gunal 2004; Marin 2013; Naghibi 2007; Naini 2007; Nofal 2016; Noshad 2011; Solak 2012; Tol 2010; Yue 2015) involving 618 patients and 13 comparisons, investigating the effects of either oral gabapentin or pregabalin. Dosing included 300 mg twice weekly oral gabapentin (Gunal 2004; Nofal 2016), 400 mg of twice weekly oral gabapentin (Naini 2007) or 75 mg twice weekly oral pregabalin (Yue 2015) compared to placebo. Naghibi 2007 did not explicitly state the dose of gabapentin. These five studies all reported itch on a 10 cm VAS.
GABA analogues versus placebo
GABA analogues reduced symptoms of uraemic itch compared to placebo (Analysis 1.1.1 (5 studies, 297 participants): MD ‐4.95 cm, 95% CI ‐5.46 to ‐4.44 on VAS; I² = 0%; high certainty evidence). The overall certainty of the evidence was high as these results were taken from multiple RCTs with large, homogeneous magnitudes of effect and narrow (%% CI demonstrating precision and efficacy. Risk of bias was uncommon and low overall.
Tol 2010, a placebo controlled cross‐over RCT involving 14 patients taking gabapentin 300 mg/HD session, did not report placebo results and could not be included in the quantitative analysis. Tol 2010 reported a significant absolute reduction in itch during gabapentin treatment: 6.3 cm (95% CI 3.8 to 8.8) versus baseline in VAS similar to the other gabapentin studies.
GABA analogues versus antihistamines
Five studies examined the efficacy of gabapentin versus various antihistamines. Marin 2013 compared 300 mg gabapentin every two days versus 10 mg oral loratidine every two days; Noshad 2011 studied 100 to 200 gabapentin mg/day versus oral hydroxyzine; Amirkhanlou 2016 measured a binary response of itch improvement from gabapentin versus oral ketotifen; Gobo‐Oliveira 2018 compared 300 mg gabapentin 3 times/week versus 6 mg oral dexchlorpheniramine twice/day; and Suwanpidokkul 2007 studied 100 mg gabapentin/day versus 10 mg loratidine/day. Overall, GABA analogues (gabapentin) may reduce symptoms of uraemic itch (Analysis 1.1.2 (5 studies, 220 participants): SMD 0.44 reduction, 95% CI 0.75 to 0.14 lower; I² = 22%; low certainty evidence) compared to antihistamines.
While these are four separate independent RCTs, there was low to moderate heterogeneity (the efficacy of oral antihistamines was highly variable), and two studies are at high risk of bias. Amirkhanlou 2016 does not report baseline scores and Marin 2013 was an open‐label study.
Yue 2015 (in addition to the placebo comparison above) reported a relative reduction of 4.1 cm (95% CI 1.98 to 6.22) with pregabalin over ondansetron. Solak 2012 compared 300 mg gabapentin/day to 75 mg pregabalin/day and reported no significant difference in itch reduction between the two treatments.
Adverse effects
Across the studies, few mild adverse effects occurred. Somnolence, dizziness, and fatigue are reported in less than 5% of patients in the intervention groups. No moderate or severe adverse effects are reported.
Ondansetron
Ondansetron versus placebo
Three studies (Ashmore 2000; Murphy 2003; Yue 2015) investigated the effects of 8 mg oral ondansetron 3 times/day. All three studies reported itch on a 10 cm VAS, however Ashmore 2000 employed a cross‐over design and reported VAS with only medians and interquartile ranges. This analysis extrapolates means and SDs according to the standard practice recommendations of Cochrane. Based on the inherent variability of these changes, a sensitivity analysis of ondansetron interventions without Ashmore 2000 was performed.
Ondansetron did not reduce symptoms of uraemic itch (Analysis 1.1.3 (3 studies, 183 participants): MD ‐0.38 cm, 95% CI ‐1.04 to 0.27 on VAS; high certainty evidence) compared to placebo. These finding remain valid with the exclusion of Ashmore 2000. The placebo group experienced a non‐significant mean decrease in VAS ranging from 0.1 to 2 cm.
Ondansetron versus antihistamine
Ozaykan 2001 compared ondansetron to the antihistamine cyproheptadine. The authors report a slight improvement in itch reduction with ondansetron compared to cyproheptadine.
Subach 2001 and Mirnezami 2013 compared ondansetron to diphenhydramine and loratidine, respectively. Neither study found any difference in measured itch.
Adverse effects
Nausea and vomiting were reported as uncommon and mild in severity.
Kappa‐opioid agonists versus placebo
Six studies investigated the effects of either 5 µg/day or 2.5 µg/day nalfurafine (oral or IV) (Bhaduri 2006; Kumagai 2010; Wikstrom 2005 (1); Wikstrom 2005 (2)) and a newly synthesized agent "CR845" (Spencer 2015; Spencer 2017) at 0.5, 1.0, and 1.5 µg/kg IV with dialysis. All studies reported itch on a 10 cm VAS.
Kappa opioid agonists reduced symptoms of uraemic itch (Analysis 1.1.4 (5 studies, 661 participants): MD ‐1.05 cm, 95% CI ‐1.40 to ‐0.71 on VAS; I² = 0%; high certainty evidence). Bhaduri 2006 reported no decrease in itch on VAS.
Both studies examining CR845 were funded by Cara Therapeutics and were judged to be at high risk of bias. A sensitivity analysis without the CR845 studies yields the similar result. The additional power from these two high risk studies are not required to maintain the high certainty of the evidence.
Adverse effects
Adverse effects were common and were mild to moderate in severity. Somnolence, headache, insomnia, diarrhoea, and nausea/vomiting were reported in 2% to 10% of the intervention group.
Mu opioid antagonists versus placebo
Two cross‐over studies (Pauli‐Magnus 2000; Peer 1996) compared 50 mg naltrexone once/day with placebo. Both studies evaluated itch on a 10 cm VAS.
Mu opioid antagonists may not improve symptoms of uraemic itch (Analysis 1.1.5 (2 studies, 62 participants): MD ‐4.29 cm, 95% CI ‐10.24 to 1.66 on VAS; low certainty evidence).
Pauli‐Magnus 2000 reported interquartile ranges and Peer 1996 reported only percentage changes of VAS. Results are merged according to the standard practice recommendations of Cochrane. Additionally, Peer 1996 evaluated the effect of naltrexone on uraemic itch using Duo scale as well as VAS. There was no significant difference reported between naltrexone and placebo in these studies.
Adverse effects
These studies found that the adverse effects of Mu opioid antagonists are both somewhat common and mild to moderate in severity. Symptoms reported included loss of appetite, nausea, heartburn, and other gastrointestinal symptoms in approximately one third of the intervention groups. In addition, patients ceased any opioid medication for the duration of the trial period. Acute pain management became a common reason for cessation of natrexone during the studies resulting in many dropouts post randomisation.
Nalbuphine versus placebo
TREVITR02 2017 compared nalbuphine, a combined kappa‐opioid agonist and mu‐opioid antagonist, to placebo. Nalbuphine may make little or no difference to uraemic itch (Analysis 1.1.6 (1 study, 179 participants): MD ‐0.75 cm, 95% CI ‐1.70 to 0.20 on VAS; low certainty evidence).
This study did not report on adverse effects.
Cromolyn versus placebo
Vessal 2010 reported oral cromolyn may reduce symptoms of uraemic itch compared to placebo (Analysis 1.1.7 (1 study, 40 participants): MD ‐4.8 cm, 95% CI ‐7.03 to‐ 2.57; low certainty evidence).
Adverse effects
The adverse effects reported were flatulence in one patient in the cromolyn group and three gastrointestinal complaints in the placebo group.
Nicotinamide versus placebo
A four‐week study by Omidian 2013 evaluated nicotinamide versus placebo. Nicotinamide may make little or no difference to the symptoms of uraemic itch (Analysis 1.1.8 (1 study, 50 participants): 0.47 cm, 95% CI ‐0.32 to 1.26; low certainty evidence).
No adverse effects were reported in either the nicotinamide to placebo groups.
Erythropoietin versus placebo
A four‐week study by De Marchi 1992 evaluated erythropoietin versus placebo. Erythropoietin had uncertain effects on the symptoms of uraemic itch (Analysis 1.1.9 (1 study, 29 participants): MD ‐14.50, 95% CI ‐38.78 to 9.78 on 40 point Duo score; very low certainty evidence).
Sja'bani 1997 reported that the erythropoietin group experienced a significantly greater mean reduction in itch than the placebo group. However, baseline itch scores are not fully reported to allow for inclusion in the quantitative review.
These studies did not report on adverse effects.
Cholestyramine versus placebo
Two cross‐over studies (Silverberg 1977; van Leusen 1978) compared cholestyramine and placebo. Cholestyramine may make little or no difference to the symptoms of uraemic itch (Analysis 1.1.10 (2 studies, 15 participants): MD 0.00, 95% CI ‐0.49 to 0.49 on a 0 to 3 severity scale; low certainty evidence).
These studies did not report on adverse effects.
Montelukast versus placebo
One cross‐over study (Nasrollahi 2007) and one parallel study (Mahmudpour 2017) compared montelukast to placebo. Duo score and VAS were measured, respectively.
Montelukast may slightly reduce symptoms of uraemic itch (Analysis 1.1.11 (2 studies, 87 participants): SMD ‐1.40, 95% CI ‐1.87 to ‐0.92; moderate certainty evidence).
Homogeneity was difficult to assess as the RCTs used well validated but slightly different itch severity scores.
Adverse effects
One patient in the intervention group of Nasrollahi 2007 developed myelodysplastic syndrome, but this was not considered an adverse effect of Montelukast. In comparison, one patient in the placebo first group developed a myocardial infarction prior to being allocated to Montelukast. No other adverse effects were reported.
Sertraline versus placebo
Pakfetrat 2018 compared sertraline and placebo. Sertraline may make little or no difference to the symptoms of uraemic itch (Analysis 1.1.12 (1 study, 46 participants): MD ‐1.80 cm, 95% CI ‐3.65 to 0.05 on VAS; low certainty evidence).
This study did not report on adverse effects.
Lidocaine versus placebo
Tapia 1977 compared 600 mg IV lidocaine once/day and placebo. Only acute (15 to 30 minutes) relief of pruritus was included in the analysis. It is unclear whether lidocaine relieved itch (within 30 minutes) compared to placebo due to very low certainty evidence (Analysis 1.1.13 (1 study, 16 participants): MD ‐0.63 cm, 95% CI ‐1.46 to 0.19). Longer term assessment was not reported. Improvement in itch was reported in 8/10 participants receiving lidocaine and 1/6 participants receiving placebo (Analysis 1.2.1); the definition of improvement was not reported.
This study did not report on adverse effects.
Thalidomide versus placebo
Silva 1994 compared 100 mg thalidomide/day for one week with placebo. Thalidomide may relieve itch following administration (Analysis 1.2.2 (1 study, 18 participants): RR 4.17, 95% CI 1.08 to 16.15) compared to placebo, however, the certainty of the evidence was very low as these results were taken from a single study with a small number of participants, and a high number of dropouts (11).
No adverse effects were reported in either the placebo or thalidomide groups.
Sodium thiosulfate versus placebo
Mohamed 2012compared 12.5 mg sodium thiosulfate/dialysis session and placebo. Overall, there was no reported significant difference comparing sodium thiosulfate and placebo. The study was not included in the quantitative analysis due to incomplete reporting of results.
The study did not report on adverse effects.
Doxepin versus placebo
Pour‐Reza‐Gholi 2007 compared 10 mg doxepin twice/day and placebo in a cross‐over study. Complete improvement was achieved in 58% of participants on doxepin which was significantly higher than placebo (P > 0.001).
Adverse effects
Mild drowsiness was a commonly reported complaint and resulted in one dropout. Placebo adverse effects were not reported.
Antihistamines
Aubia 1980compared 400 mg oral cimetidine once/day (over and up to 1 hour), a different unspecified "classical antihistamine", and placebo. The study found no significant differences between the three groups. No measures of variability (e.g. standard error) were reported.
Antihistamines were compared with four other interventions: ondansetron, topically applied dilute vinegar, GABA agonists (gabapentin; see above section on GABA analogues), and Mu opioid antagonists (naltrexone).
-
Ozaykan 2001 reported the ondansetron group experienced a significantly greater mean reduction: 9 point (95% CI 16.34 to 1.64) compared to cyproheptadine (first generation antihistamine) using Duo pruritus score.
-
Nakhaee 2015 reported no significant difference between hydroxyzine and topically applied dilute vinegar.
-
Legroux‐Crespel 2004 reported no significant difference between loratidine and the Mu opioid antagonist naltrexone.
-
Baumelou 1993 reported no significant difference between the two antihistamines cetirizine and dexchlorpheniramine. However, both significantly improved itch compared to placebo.
Other therapies
Several isolated interventions could not be included in the quantitative analysis due to insufficient reporting of results.
-
Fallahzadeh 2015 reported a significant improvement with oral senna compared to placebo in patients with uraemic pruritus.
-
Pederson 1980reported a significant reduction with oral charcoal compared to placebo.
-
Rivory 1984 reported a significant improvement in itch with nicergoline compared to placebo.
-
Shariati 2010 reported oral charcoal was significantly more effective in reducing VAS in patients with uraemic pruritus than oral aluminium hydroxide.
2. Topical interventions
See summary of findings Table 2; adverse effects Table 2.
Capsaicin cream versus vehicle cream
Three studies tested the efficacy of the topical agent capsaicin in treating CKD‐related uraemic pruritus: 0.025% (Cho 1997) or 0.03% (Makhlough 2010; Tarng 1996) capsaicin cream applied 4 times/day versus vehicle cream (placebo). Evaluation of itch was reported on a 10 cm VAS and a customized 4‐point itch scale (Makhlough 2010). Capsaicin cream application probably reduced the symptoms of uraemic itch (Analysis 2.1.1 (2 studies, 112 participants): SMD ‐0.84, 95% CI ‐1.22 to ‐0.45; I2 = 0%; moderate certainty evidence) than during the vehicle application period.
Tarng 1996 did not provide any results for the placebo cross‐over periods and could not be included in the quantitative analysis. Within the intervention group of that study, approximately 80% of patients initially reported moderate to severe pruritus and then none or mild symptoms post‐intervention.
Adverse effects
All studies reported mild local burning sensations and cutaneous erythema as adverse effects.
Pramoxine cream versus vehicle cream
Young 2009) compared 1% pramoxine cream twice/day with vehicle cream. It is uncertain whether pramoxine cream decreased uraemic itch (Analysis 2.1.2 (1 study, 28 participants): MD ‐1.97 cm, 95% CI ‐6.06 to 2.12; very low certainty evidence) compared to vehicle.
This study did not report on adverse effects.
Calcineurin inhibitor cream versus vehicle cream
Two studies compared 0.1% tacrolimus (Duque 2005) and 1% pimecrolimus (Ghorbani 2012a) with vehicle cream. Duque 2005 did not report SD (or any measurement of variability/error) and was not included in the quantitative analysis. Duque 2005 reported pimecrolimus cream application resulted in a non‐significant, but greater reduction in VAS compared to the vehicle cream.
It is uncertain whether 1% pimecrolimus reduced uraemic itch (Analysis 2.1.3 (1 study, 60 participants): MD 1.2 cm, 95% CI ‐0.36 to 2.76; very low certainty evidence) compared to vehicle.
Adverse effects
Adverse effects of the tacrolimus cream included a burning sensation over the area of skin applied with cream.
Dead Sea lotion versus vehicle lotion
Boaz 2009 compared Dead Sea lotion, containing Dead Sea water and sea silt (Dead Sea mud), and two related vehicle lotion groups. Itch was quantified using a 5‐point itch severity scale. It is uncertain whether Dead Sea lotion reduced uraemic itch (Analysis 2.1.4 (1 study, 41 participants): MD ‐2.00, 95% CI ‐4.31 to 0.31 on 5‐point severity scale; very low certainty evidence) compared to vehicle.
This study did not report on adverse effects.
Cromolyn cream
Cromolyn cream versus vehicle cream
Feily 2012 compared 4% cromolyn cream twice/day and vehicle cream. Cromolyn cream may not reduce uraemic itch (Analysis 2.1.5 (1 study, 60 participants): MD 0.8 cm, 95% CI ‐1.98 to 0.38; low certainty evidence) compared to vehicle.
This study did not report on adverse effects.
Cromolyn cream versus calcineurin inhibitor cream
Ghorbani Birgani 2011 compared 4% cromolyn cream with 1% pimecrolimus cream. This study reported both interventions significantly reduced pruritus on a VAS with a non‐significant difference between the two.
Sericin cream versus vehicle cream
Aramwit 2012a compared sericin cream and vehicle cream. Itch was reported on a 10 cm VAS. This study reported the sericin cream group experienced a significant absolute mean decrease in itch: 2.8 cm reduction (95% CI 0.5 lower to 5.1 lower) in VAS. Placebo results were not reported and the study could not be included in the quantitative analysis.
This study did not report on adverse effects.
Baby oil versus placebo
Lin 2012 compared chilled and unchilled baby oil with a common vehicle. Itch was evaluated on with a customized 21‐point itch severity scale that incorporated itching, dryness, peeling, tightness, and sleep disturbances. The itch severity scale does not appear to be well validated unlike VAS or Duo score. The placebo group experienced a 1‐point non‐significant decrease in itch severity scale.
Overall, baby oil application may reduce uraemic itch (Analysis 2.1.6 (1 study, 93 participants): MD ‐2.38, 95% CI ‐3.49 to ‐1.27; low certainty evidence) compared to vehicle.
The report documented that no adverse effects occurred using either intervention or vehicle.
L‐arginine versus vehicle salve
Durant‐Finn 2008compared L‐arginine salve and vehicle salve groups. Itch was quantified using a 3‐point itch severity scale. L‐arginine may make little or no difference to uraemic itch (Analysis 2.1.7 (1 study, 48 participants): MD ‐0.58, 95% CI ‐1.86 to 0.7 on 3‐point severity scale; low certainty evidence) compared to vehicle.
This study did not report on adverse effects.
Polyunsaturated fatty acids versus vehicle cream
Chen 2006e and Afrasiabifar 2017 compared topically applied polyunsaturated fatty acids of varying concentrations and quantity with vehicle cream. Itch was reported with a 10 cm VAS in both studies.
Topically applied polyunsaturated fatty acids may make little or no difference to uraemic itch (Analysis 2.1.8 (2 studies, 78 participants): SMD ‐0.91, 95% CI ‐1.99 to 0.17; I2 = 88% low certainty evidence) compared to vehicle.
These studies did not report on adverse effects.
Eurax cream versus Sarna lotion
Tan 1990 compared Eurax cream with Sarna lotion and reported a statistically significant reduction of uraemic itch for both the Eurax cream and Sarna lotion periods.
This study did not report on adverse effects.
3. Oral or IV supplements
See summary of findings Table 3; adverse effects Table 3.
Oral polyunsaturated fatty acids versus placebo
Three studies (Ghanei 2012; Peck 1996; Yoshimoto‐Furuie 1999) tested the efficacy of 1 g polyunsaturated fatty acids 3 time/day versus placebo. Itch was evaluated with a customized 5‐point itch scale with continuous or binary results reported. Only Ghanei 2012 also reported complete placebo results.
Ghanei 2012 reported oral polyunsaturated fatty acids may decrease uraemic itch (Analysis 3.1.1 (1 study, 22 participants): MD ‐11.30%, 95% CI ‐19.01% to ‐3.59%; low certainty evidence) compared to placebo. Two additional studies (Peck 1996; Yoshimoto‐Furuie 1999) also reported reductions in itch scores versus baseline, but did not include sufficient reporting of placebo results.
Mojgan 2017 examined fish oil supplements versus placebo and reported a small but significant benefit versus placebo; neither CIs nor SDs were reported.
Begum 2004 compared fish oil and safflower oil (both polyunsaturated fatty acids) and found neither significantly reduced itch on a VAS.
These studies did not report on adverse effects.
IV L‐carnitine versus placebo
Mettang 1997 compared 10 mg IV L‐carnitine/kg and IV placebo once/dialysis session. Evaluation of itch used a 10 cm VAS. IV L‐carnitine may make little or no difference to uraemic itch (Analysis 3.1.2 (1 study, 12 participants): MD ‐0.26 cm, 95% CI ‐2.85 to 2.43 on VAS; low certainty evidence) compared to IV placebo.
This study did not report on adverse effects.
Oral zinc sulfate versus placebo
Two studies (Mapar 2015; Najafabadi 2012) compared 220 mg oral zinc sulfate twice/day and placebo. Evaluation of itch was reported on a 10 cm VAS. Zinc sulfate probably reduces uraemic itch (Analysis 3.1.3 (2 studies, 76 participants): MD ‐1.77 cm, 95% CI ‐2.88 to ‐0.66 on VAS; moderate certainty evidence) compared to placebo.
Adverse effects
Mapar 2015 reported vomiting in one participant in the placebo group and Najafabadi 2012 did not specify exact adverse effects, only that none were "attributable to zinc sulfate".
Oral ergocalciferol versus placebo
Shirazian 2013 compared 50,000 IU oral ergocalciferol/week and placebo. Itch was reported with the results of a 21‐point customised itch questionnaire. Ergocalciferol may make little or no difference to uraemic itch (Analysis 3.1.4 (1 study, 50 participants): MD 0.40, 95% CI ‐2.48 to 3.28; low certainty evidence) compared to placebo.
No adverse effects were reported in the ergocalciferol group.
Oral turmeric versus placebo
Pakfetrat 2014compared 22 mg oral turmeric 3 times/day and placebo. Itch was evaluated with a 40‐point modified Duo scale. Turmeric probably reduces uraemic itch (Analysis 3.1.5 (1 study, 100 participants): MD ‐6.40, 95% CI ‐7.42 to ‐5.38 on modified Duo scale; moderate certainty evidence) compared to placebo.
No adverse effects are reported in the intervention group.
Oral Fumaria parviflora versus placebo
Akrami 2017 compared 1 g oral Fumaria parviflora 3 times/day of with placebo. Itch was evaluated on a 10 cm VAS. Fumaria parviflora may reduce uraemic itch (Analysis 3.1.6 (1 study, 63 participants): MD ‐3.90 cm, 95% CI ‐5.04 to ‐2.76 on modified Duo scale; low certainty evidence) compared to placebo.
A few mild abdominal symptoms were observed in both the Fumaria parviflora and placebo groups.
4. Dialysis modality
See summary of findings Table 3; adverse effects Table 4.
High flux/permeability haemodialysis versus conventional haemodialysis
Three studies (Chen 2009; Hui 2011; Jiang 2016) compared high flux/permeability HD to conventional HD. Evaluation of itch used a 10 cm VAS. High flux/permeability HD may decrease uraemic itch (Analysis 4.1.1 (3 studies, 202 participants): MD ‐2.62 cm, 95% CI ‐3.72 to ‐1.52; I2 = 67%; low certainty evidence) compared to conventional HD.
These studies did not report on adverse effects.
Haemodialysis with haemoperfusion versus conventional haemodialysis
Li 2017a compared conventional HD with HD using neutral macroporous resin haemoperfusion with one of two different resin perfusers. Evaluation of itch used a 10 cm VAS. HD with haemoperfusion therapy may decrease uraemic itch (Analysis 4.1.2 (1 study, 202 participants): MD ‐2.37 cm, 95% CI ‐2.89 to ‐1.85; low certainty evidence) compared to conventional HD
This study did not report on adverse effects.
Haemodiafiltration with haemoperfusion against high‐flux haemodialysis
Zhang 2016a compared haemodiafiltration with haemoperfusion to high‐flux HD. They reported that haemodiafiltration with haemoperfusion was significantly more effective in relieving itch than high‐flux HD measured on a VAS.
This study did not report on adverse effects.
High‐flow versus conventional flow haemodialysis
Aliasgharpour 2018 compared high‐flow HD with conventional flow HD. They reported a significant reduction in severity in itch with high‐flow HD measured on a 4‐point VAS.
This study did not report on adverse effects.
Haemodialysis solutions
Carmichael 1988 compared magnesium‐free dialysate with conventional dialysate containing magnesium. They reported no significant itch reduction on a VAS.
Rad 2017 compared cool dialysate with conventional dialysate at a normal temperature. They reported cool dialysate was significantly more effective in relieving uraemic pruritus.
Kyriazis 2000 crossed over four patients with variable concentrations of calcium in their dialysate and reported a non‐significant trend towards lower calcium concentrations reducing uraemic itch.
5. Other interventions
See summary of findings Table 3; adverse effects Table 5.
UV‐B radiation
Four studies (Blachley 1985; Gilchrest 1979; Ko 2011; Sherjeena 2017) compared UV‐B radiation versus placebo (typically UV‐A) exposure 3 times/week for the reduction of CKD‐related uraemic pruritus. Due to the mechanism of the intervention there was often inherent difficulties in blinding the administrators and patients. Outcomes included both Duo score and percent of patients experiencing absolute relief.
UV‐B radiation may make little or no difference to uraemic itch (Analysis 5.1.1 (4 studies, 86 participants): SMD ‐2.49, 95% CI ‐4.62 to ‐0.41; I2 = 93%; low certainty evidence) compared to UV‐A/placebo
UV‐A radiation was not originally included in this systemic review as an intervention category. During the 1980s some RCTs (including Sanchez 1986 and Taylor 1983) investigated UV‐A and found that it likely does not decrease uraemic itch. UV‐A has been commonly used as a placebo in RCTs of analogous interventions.
Chan 1995 reported a significant reduction in itch in the UV‐B group but did not report the results of the placebo intervention.
Common adverse effects across all studies included sunburn and tanning; these were also seen in the control UV exposures.
Thermal therapy
Hsu 2009 compared thermal (warming) therapy with a placebo patch. Evaluation of itch used a 10 cm VAS. Thermal therapy may make little or no difference to uraemic itch (Analysis 5.1.2 (1 study, 42 participants): MD ‐2.06 cm, 95% CI ‐6.54 to 2.42; low certainty evidence) compared to the placebo patch.
This study did not report on adverse effects.
Discussion
Summary of main results
This systematic review assesses 92 RCTs evaluating 43 different interventions. Evidence for most interventions include only a single placebo controlled trial, often underpowered. However, the number of studies, participants, statistical power, and evidence quality significantly improves for several interventions. Less often, one intervention was compared to another allowing for some informal indirect comparisons between treatments. Fortunately, the majority of interventions include studies reporting itch with a well‐validated VAS or Duo’s scores aiding in the interpretation of the results. These results allowed reporting as MD or SMD with most interventions.
The results are reported in summary of findings Table 1; summary of findings Table 2; summary of findings Table 3. The grouping of the GABA analogues, kappa opioid agonists, Mu opioid antagonists, polyunsaturated fatty acids, and UV‐B radiation assumed their class effect corroborated by previous studies on their effectiveness in uraemic pruritus, non‐specified pruritus, and related pathophysiology such as pain. For instance pregabalin and gabapentin, known to have similar and highly correlative downstream effects, are studied together for their classed effect on uraemic pruritus (Matsuda 2016). They have also been shown through a head‐to‐head RCT to have similar efficacy in treating uraemic pruritus (Solak 2012). Finally, the results of this review's placebo‐controlled gabapentin and pregabalin RCTs are homogeneous, again supporting this classification.
Five interventions included multiple and/or larger studies with a combined sample size of over 100 participants: GABA analogues, kappa opioid agonists, ondansetron, capsaicin cream, and turmeric. Each of these has no identified major sources of bias limiting their interpretation. Of the five, only ondansetron was not found to be associated with a reduction in uraemic itch versus placebo. GABA analogues achieved the largest effect size of all interventions. The effect size of kappa opioid agonists and capsaicin cream are both modest in comparison. One direct comparison (GABA analogues versus. Ondansetron) was consistent with above with similar effect size to those of the GABA analogue versus placebo RCTs. Supplementing this data on gabapentin and pregabalin are five mixed quality RCTs favouring gabapentin in direct comparison to various antihistamines.
The small sample sizes and often significant sources of bias limit the conclusions drawn from the majority of this review's other interventions. No meaningful quantitative analysis can be drawn from the adverse effects of the interventions due to insufficient and disorganised reporting. As a global assessment, adverse effects of nearly all antipruritic interventions are somewhat uncommon and non severe. One exception may be kappa opioid agonists where adverse effects were slightly more common.
While most studies provided adequate data to contribute to an analysis of itch reduction, few reported on any of the secondary outcomes (e.g. sleep, QoL) described by our protocol. Of the secondary data reported, the conclusions are limited by heterogeneous outcomes and low individual study quality.
Overall completeness and applicability of evidence
Recruited patients included only those already on HD or those with an expectation to begin shortly. All studies outlined prolonged and ongoing significant itch coinciding with CKD as inclusion criteria. Nearly every RCT also outlined exclusion criteria to exclude patients with pathology that potentially otherwise explains their itch symptoms (e.g. dermatological or liver disease). The applicability of the evidence derived from this meta‐analysis may be weaker in populations who have potential non‐renal causes to their itch pathology. This was notable as many patients living with CKD do not have the disease in isolation.
Given the diversity of the interventions and relatively modest number of studies per intervention, it was not possible to make comparisons on the effectiveness of all interventions. For instance, Solak 2012 found both gabapentin and pregabalin to be equally and highly efficacious in reducing uraemic itch. Missing data and inconsistent reporting did not allow us to include data from all studies in the quantitative meta‐analyses. Approximately 70% of all participants (in studies that met protocol inclusion criteria) contributed to our meta‐analyses and the remainder were qualitatively analysed. Patient characteristics in the quantitative and qualitative analyses are very similar.
Multiple studies noted that recruited patients had already failed one anti‐itch treatment prior to being randomised. The most common previous treatment was an antihistamine despite the lack of substantial evidence for its use for uraemic itch. It is unclear if prior antihistamine treatment could be a confounding factor.
Some interventions that are yet to be studied via an RCT are currently recommended by guidelines and authorities for uraemic itch. Often, they are also routinely used in clinical practice. Without at least one placebo‐controlled RCT it is beyond the scope of this systematic review to assess this evidence in a quantitative manner.
There have not been sufficient RCTs using different dosing regimens to give definitive recommendations about the doses of specific interventions. The populations included in the RCT’s tend to be younger than the typical population with CKD. The elderly may be more susceptible to side effects from these drugs. In the case of GABA analogues, evidence from Noshad 2011 and Rayner 2012 suggest that a low dose of gabapentin (100 mg/day) or pregabalin (25 mg/day) should be used initially and then titrated up.
This systematic review's recommendation on individual interventions as monotherapy are generalisable to patients with CKD and chronic itching with no other obvious cause. Thus, there is strong external validity extending to this review's outlined population (patients with stage 4 and 5 CKD and established CKD‐related itch).
Quality of the evidence
Certainty of the evidence varied widely. High quality evidence exists for GABA analogues, kappa opioid agonists, and ondansetron. These interventions draw conclusions from multiple independent well‐powered RCTs with no significant biases identified. There was moderate quality evidence for several other inventions summary of findings Table 1; summary of findings Table 2; summary of findings Table 3. The most common factor limiting the certainty of the evidence was the reliance on a single underpowered RCT. Many of these studies are clearly underpowered with limited participants and large standard error. Other common reasons include the use of a non‐validated itch severity outcome measures, insignificant magnitude of effect, and other significant sources of bias.
Most studies had low or unclear risk of bias across the majority of domains (Figure 2 and Figure 3), however results of this review should be interpreted with caution. Increased risk of bias appears correlated with earlier dates of publication. In this review, underpowered interventions often had increased risk across most of the bias categories. This aside, there are many interventions (both of small and large sample sizes) with low overall risk of bias profiles Figure 2.
Potential biases in the review process
Several intervention are grouped (most notably GABA analogues, Kappa agonists, Mu antagonists, and antihistamines) within the quantitative and qualitative analysis. Opioids, GABA analogues, and antihistamines all have a body of literature externally supporting this "class effect". Additionally, within this systematic review, consistent effects sizes, standard error, and adverse effects provide strong internal validity to this categorisation. However, this inevitably poses a potential for bias and warrants highlighting.
Several cross‐over studies within this review reported results consistent with parallel RCTs. This approach gives rise to a unit‐of‐analysis error with CIs that are likely to be too wide, and the study would receive too little weight, with the possible consequence of disguising clinically important heterogeneity. This was somewhat mitigated by verifying that our calculated results match those that are partially reported and also by an overall sensitivity analysis targeting these "approximated" studies.
This review only examined RCTs. All included studies, save one, were blinded. Chilled baby, some UV‐B, and some HD modality interventions are unlikely to have been able to blind their participants due to the inherent nature of the intervention. Six studies included significant statements of declaration; all declared significant financial conflicts of interest relating to the pharmaceutical manufacturers of those interventions. However, these were unlikely to bias the major findings of this review.
This systematic review addressed a clear research questions and used predefined inclusion criteria to select and appraise studies. We conducted extensive and sensitive searches but the possibility of publication bias remains. This was especially true for interventions with only one RCT identified. Our protocol did not include exhaustive exclusion criteria for patients potentially with pathology associated with non‐uraemic itch. It should be noted that the majority of RCTs in this review excluded such patients.
The review did not impose language restrictions. Seven studies were translated prior to data extraction.
A comprehensive search of the literature was performed by searching multiple databases and well as handsearching for potential RCTs in the grey literature. All possible relevant data was extracted and whenever studies’ reporting proved insufficient the relevant author(s) were contacted or studies were cross checked in the relevant clinical trials registry. Approximately half of all such cases recovered additional original data. Registers of ongoing trials and available conference proceedings were also searched.
Of the studies qualifying for this review, many did not, or only superficially, reported on adverse effects. Overall, the adverse effects reported were somewhat uncommon and generally mild in nature. Often no adverse effects occurred. It was possible that in some studies the authors did not bother to report the lack of adverse effects occurring, however this was not helpful for drawing accurate conclusions. Other secondary outcomes investigated were rarely reported. Significant results of either adverse effects or important secondary outcomes that go unreported may bias the results of this review.
Agreements and disagreements with other studies or reviews
This systematic review found similar results relative to other reviews on the treatment uraemic pruritus. Our search revealed three recent reviews on pathological itch in general. Two are specifically CKD‐related.
Siemens 2016 examined 947 CKD participants in 36 trials. The review included all patients in the palliative care setting, did not focus on non‐pharmacological interventions, and excluded trials comparing interventions. The review did not exclusively focus on patients with CKD. Additionally, substantial new evidence on GABA analogues, ondansetron, and new pharmacological interventions have been published since their search. This new evidence and our review is consistent with the overall findings of Siemens 2016, but notably provided increase power to the positive findings on GABA analogues, kappa opioid agonists, and the non‐efficacy of ondansetron.
Pongcharoen 2015 examined participants in 26 trials in a quasi‐systematic review of all systemic anti‐itch treatments. Again, this review did not exclusively focus on patients with CKD. Less than half of all trials involved patients with CKD.
Simonsen 2017 examined participants in 44 trials examining pharmacological, alternative, and adjunctive interventions. These included interventions such as acupuncture which was not included in our review. The limited number and degree of heterogeneity of the studies did not permit formal meta‐analysis. While the authors did not comment on kappa agonists and ondansetron their results on gabapentin are consistent with the findings of our review.
Other more focused reviews examined the effect of the GABA analogue gabapentin (Lau 2016), opioid receptor antagonist (Phan 2010), and topical capsaicin (Gooding 2010) on uraemic pruritus. Again, the results of this systematic review are consistent with these reviews. Of note, this is the first quantitative meta‐analysis of uraemic pruritus on this scale.

Study flow diagram.

Risk of bias summary: review authors' judgements about each risk of bias item for each included study.

Risk of bias graph: review authors' judgements about each risk of bias item presented as percentages across all included studies.

Comparison 1: Pharmacological interventions (oral or IV), Outcome 1: Itch

Comparison 1: Pharmacological interventions (oral or IV), Outcome 2: Itch (dichotomous)

Comparison 2: Topical interventions, Outcome 1: Itch

Comparison 3: Oral or IV supplements, Outcome 1: Itch

Comparison 4: Haemodialysis modality, Outcome 1: Itch

Comparison 5: Other interventions, Outcome 1: Itch

Comparison 6: Cross‐over studies with paired data, Outcome 1: Cholestyramine
| Pharmacological interventions versus placebo for the relief of itch in people with advanced chronic kidney disease | |||||
| Patient or population: uraemic pruritus Settings: outpatient and multi‐centre Intervention: pharmacological treatments Comparison: placebo | |||||
| Outcomes | Anticipated absolute effects* (95% CI) | Relative Effect | No. of participants | Quality of the evidence | |
|---|---|---|---|---|---|
| Reduction of risk of placebo | Reduction of risk with pharmacological interventions | ||||
| GABA analogue VAS(0 to 10 cm) | The mean VAS score of the placebo group ranged from 0.8 to 2 cm lower than pretreatment scores | The mean reduction in VAS score of the GABA analogue group was 4.95 cm lower (5.46 to 4.44 lower) than placebo | ‐ | 297 (5) | ⊕⊕⊕⊕ HIGH |
| Ondansetron VAS(0 to 10 cm) | The mean VAS score of the placebo group ranged from 0.1 to 2 cm lower than pretreatment scores | The mean reduction in VAS score of the ondansetron agonist group was 0.38 cm lower (1.04 lower to 0.27 higher) than placebo | ‐ | 183 (3) | ⊕⊕⊕⊕ HIGH |
| Kappa‐opioid agonist VAS(0 to 10 cm) | The mean VAS score of the placebo group ranged from 1.3 to 1.9 cm lower than pretreatment scores | The mean reduction in VAS score of the kappa‐opioid agonist group was 1.05 cm lower (1.40 to 0.70 lower) than placebo | ‐ | 661 (5) | ⊕⊕⊕⊕ HIGH |
| Mu‐opioid antagonist VAS(0 to 10 cm) | The mean VAS score of the placebo group ranged from 0.5 to 1 cm lower than pretreatment scores | The mean reduction in VAS score of the mu‐opioid antagonist group was 4.29 cm lower (10.24 lower to 1.66 higher) than placebo | ‐ | 62 (2) | ⊕⊕⊝⊝ LOW1,2 |
| Nalbuphine VAS(0 to 10 cm) | The mean VAS score of the placebo group was 3.2 cm lower than pretreatment scores | The mean reduction in VAS score of the nalbuphine group was 0.75 cm lower (1.70 lower to 0.20 higher) than placebo | ‐ | 179 (1) | ⊕⊕⊝⊝ LOW2,3 |
| Cromolyn VAS(0 to 10 cm) | The mean VAS score of the placebo group was 3 cm lower than pretreatment scores | The mean reduction in VAS score of the cromolyn group was 4.8 cm lower (7.03 to 2.57 lower) than placebo | ‐ | 40 (1) | ⊕⊕⊝⊝ LOW1,2 |
| Nicotinamide VAS(0 to 5 cm) | The mean VAS score of the placebo group was 1.7 cm lower than pretreatment scores | The mean reduction in VAS score of the nicotinamide group was 0.47 cm higher (0.32 lower to 1.26 higher) than placebo | ‐ | 50 (1) | ⊕⊕⊝⊝ LOW1,2 |
| EPO Duo score(0 to 40) | The mean Duo score of the placebo group was 1.5 lower than pretreatment scores | The mean reduction in Duo score of the EPO group was 14.5 lower (38.78 lower to 9.78 higher) than placebo | ‐ | 20 (1) | ⊕⊝⊝⊝ |
| Cholestyramine 0 to 3 severity scale | The mean itch score of the placebo group ranged from 1.3 to 0.7 lower than pretreatment scores | The mean reduction in VAS score of the cholestyramine group was 0.24 higher (0.38 lower to 0.86 higher) than placebo | ‐ | 15 (2) | ⊕⊕⊝⊝ LOW1,4 |
| Montelukast Duo score (0 to 81) and VAS (0 to 10 cm) | The mean Duo score and VAS of the placebo group was 7 points and 0.5 cm lower (respectively) than pretreatment scores. | TheSMD reduction of the montelukast group was 1.4 lower (1.87 to 0.92 lower) than placebo | ‐ | 87 (2) | ⊕⊕⊕⊝ MODERATE5 |
| Sertraline VAS(0 to 10 cm) | The mean VAS score of the placebo group was 3.7 lower than pretreatment scores | The mean reduction in VAS score of the sertraline group was 1.8 cm lower (3.65 lower to 0.05 higher) than placebo | ‐ | 46 (1) | ⊕⊕⊝⊝ LOW1,2 |
| Lidocaine Itch relief | 167 per 1000 | 800 per 1000 | 4.80 | 16 (1) | ⊕⊝⊝⊝ |
| Sodium thalidomide Itch relief | 133 per 1000 | 556 per 1000 | 4.17 | 33 (1) | ⊕⊝⊝⊝ |
| Doxepin Itch relief | 208 per 1000 | 875 per 1000 (396 to 1000) | 4.20 (1.90 to 9.30) | 48 (1) | ⊕⊕⊝⊝ |
| The reduction of risk of pharmacological versus placebo (column 3) is the additional risk reduction in addition to the benefit provided by the placebo. "Lower" indicates a reduction or negative numerical change versus baseline. CI: Confidence interval; SMD: standardised mean difference; RR: Risk Ratio; VAS: visual analogues scale | |||||
| GRADE Working Group grades of evidence | |||||
| 1Evidence of certainty was downgraded one level because of the reliance of the estimated effect on a small number of participants 2Evidence of certainty was downgraded one level because of the imprecise treatment estimate 3Evidence of certainty was downgraded one level because of study risks of bias 4Evidence of certainty was downgraded one level because heterogeneous results utilizing nonvalidated itch scoring methods 5Evidence of certainty was downgraded one level as homogeneity was difficult to assess (due to well validated but different itch scoring methods) and that the analysis would benefit from a greater number of participants | |||||
| Topical treatments versus placebo for the relief of itch in people with advanced chronic kidney disease | ||||
| Patient or population: uraemic pruritus Settings: outpatient and multi‐centre Intervention: topical treatments Comparison: placebo | ||||
| Outcomes | Anticipated absolute effects* (95% CI) | No. of participants | Quality of the evidence | |
|---|---|---|---|---|
| Reduction of risk of placebo | Reduction of risk with topical treatments | |||
| Capsaicin cream VAS and Duo’s score | The mean VAS and Duo score of this vehicle group was 1.7 cm and 13.4 lower (respectively) than pretreatment scores. | The SMD of the capsaicin group was 0.84 lower (1.22 to 0.45 lower) than vehicle | 112 (2) | ⊕⊕⊕⊝ MODERATE1 |
| Pramoxine lotion VAS(0 to 10 cm) | The mean VAS score of this vehicle group was 1.4 cm lower than pretreatment scores. | The mean reduction in VAS score of the pramoxine lotion group was 1.97 lower (6.06 lower to 2.12 higher) than vehicle | 27 (1) | ⊕⊝⊝⊝ VERY LOW2,3,4 |
| Calcineurin inhibitor VAS(0 to 10 cm) | The mean VAS score of this vehicle group was 7.1 cm lower than pretreatment scores. | The mean reduction in VAS score of the calcineurin inhibitor group was 1.2 higher (0.36 lower to 2.76 higher) than vehicle | 80 (2) | ⊕⊝⊝⊝ VERY LOW2,3,4 |
| Dead Sea lotion 1 to 5 severity score | The mean severity score of this vehicle group was 3 lower than pretreatment scores. | The mean reduction in severity score of the Dead Sea Lotion group was 2 lower (4.31 lower to 0.31 higher) than vehicle | 41 (1) | ⊕⊝⊝⊝ VERY LOW2,3,4 |
| Cromolyn cream VAS (0 to 5 cm) | The mean VAS score of this vehicle group was 1.4 cm lower than pretreatment scores. | The mean reduction in VAS score of the cromolyn cream group was 0.8 cm lower (1.98 lower to 0.38 higher) than vehicle | 60 (1) | ⊕⊕⊝⊝ |
| Baby oil Itch Severity Scale(0 to 21) | The mean Itch Severity Scale of this vehicle group was 1 lower than pretreatment scores. | The mean reduction in Itch Severity Scale of the baby oil group was 2.36 lower (3.29 to 1.44 lower) than vehicle | 125 (2) | ⊕⊕⊝⊝ |
| L‐arginine salve 0 to 3 severity score | The mean severity score of this vehicle group was 3.4 lower than pretreatment scores. | The mean reduction in severity score of the L‐arginine salve group was 0.58 lower (1.86 lower to 0.7 higher) than vehicle | 48 (1) | ⊕⊕⊝⊝ |
| Polyunsaturated fatty acids VAS (0 to 10 cm) Duo score | The mean VAS and Duo score of this vehicle group was 1 cm lower and 5 points higher (respectively) than pretreatment scores. | The SMD of the polyunsaturated fatty acids group was 0.91 lower (1.99 lower to 0.17 higher) than vehicle | 78 (2) | ⊕⊕⊝⊝ |
| The reduction of risk of pharmacological versus placebo (column 3) is the additional risk reduction in addition to the benefit provided by the placebo. "Lower" indicates a reduction or negative numerical change versus baseline. CI: Confidence interval; SMD: standardised mean difference; VAS: visual analogue scale | ||||
| GRADE Working Group grades of evidence | ||||
| 1Evidence of certainty was downgraded one level as homogeneity was difficult to assess (due to well validated but different itch scoring methods) and that the analysis would benefit from a greater number of participants 2Evidence of certainty was downgraded one level because of the reliance of the estimated effect on a small number of participants 3Evidence of certainty was downgraded one level because of the imprecise treatment estimate 4Evidence of certainty was downgraded one level because of study risks of bias 5Evidence of certainty was downgraded two levels because of study risks of bias and use of a non‐validated itch scoring method. 6Evidence of certainty was downgraded one level because of the imprecise and small treatment estimate | ||||
| Supplements, HD modalities, and other treatments for the relief of itch in people with advanced chronic kidney disease | ||||
| Patient or population: uraemic pruritus Settings: outpatient and multi‐centre Intervention: supplements, HD modalities, and other treatments Comparison: placebo; other HD comparators | ||||
| Outcomes | Anticipated absolute effects* (95% CI) | No. of participants | Quality of the evidence | |
|---|---|---|---|---|
| Reduction of risk of comparator | Reduction of risk with supplements, HD modalities, and other treatments | |||
| Polyunsaturated fatty acids 0 to 5severity score | The mean severity score of this placebo group was 1.6% lower than pretreatment scores. | The mean reduction in 0 to 5 severity score of the polyunsaturated fatty acids group was 11.3% lower (9.0 to 3.6 lower) than placebo | 22 (1) | ⊕⊕⊝⊝ LOW1,2 |
| L‐carnitine VAS (0 to 6 cm) | The mean VAS score of this placebo group was 0.2 higher than pretreatment scores. | The mean reduction in VAS score of the L‐carnitine group was 0.26 lower (2.85 lower to 2.43 higher) than placebo | 12 (1) | ⊕⊕⊝⊝ |
| Zinc sulfate VAS (0 to 10 cm) | The mean VAS and Duo score of this vehicle group was 4.3cm and 6.1 lower (respectively) than pretreatment scores. | The mean reduction of the zinc sulfate group was 1.77 lower (2.88 to 0.66 lower) than placebo | 76 (2) | ⊕⊕⊕⊝ MODERATE1 |
| Ergocalciferol 21 point scale | The mean score of this vehicle group was 6.1 lower than pretreatment scores. | The mean reduction in VAS score of the ergocalciferol group was 0.4 higher (2.52 lower to 3.32 higher) than placebo | 50 (1) | ⊕⊕⊝⊝ |
| Turmeric Duo score (5 to 40) | The mean Duo’s score of this vehicle group was 2 lower than pretreatment scores. | The mean reduction in VAS score of the turmeric group was 6.4 lower* (7.42 to 5.38 lower) than placebo | 100 (1) | ⊕⊕⊕⊝ MODERATE1 |
| Fumaria parviflora VAS (0 to 10 cm) | The mean VAS score of this vehicle group was 2.2lower than pretreatment scores. | The mean reduction in VAS score of the Fumaria parviflora group was 3.90lower (5.04 to 2.76 lower) than placebo | 63 (1) | ⊕⊕⊝⊝ |
| High flux/permeability dialysis VAS (0 to 10 cm) | The mean VAS score of this control group ranged from 0.6 cm to 5.6 cm lower than pretreatment scores. | The mean reduction in VAS score of the high flow/permeability group was 2.60 cm lower (3.22 to 1.97 lower) than placebo | 202 (3) | ⊕⊕⊝⊝ |
| HD with haemoperfusion VAS (0 to 10 cm) | The mean VAS score of this control group was 0.6 cm lower than pretreatment scores. | The mean reduction in VAS score of the HD with haemoperfusion group was 2.37 cm lower (2.89 to 1.85 lower) than placebo | 90 (1) | ⊕⊕⊝⊝ |
| UV‐B Duo score, VAS, and %improvement | The mean Duo score and VAS of this control group was 2.2 points and 0.3 cm lower (respectively) than pretreatment scores. | The SMD of the UV‐B group was 2.49 lower (4.62 to 0.36 lower) than placebo | 86 (4) | ⊕⊕⊝⊝ |
| Thermal therapy VAS (0 to 10 cm) | The mean VAS score of this control group was 5.8 lower than pretreatment scores. | The mean reduction in VAS score of the thermal therapy group was 2.06 lower (6.98 lower to 2.84 higher) than placebo | 41 (1) | ⊕⊕⊝⊝ |
| The reduction of risk of pharmacological versus placebo (column 3) is the additional risk reduction in addition to the benefit provided by the placebo. "Lower" indicates a reduction or negative numerical change versus baseline. CI: Confidence interval; RR: Risk Ratio; SMD: standardised mean difference; VAS: visual analogue scale | ||||
| GRADE Working Group grades of evidence | ||||
| 1Evidence of certainty was downgraded one level because of the reliance of the estimated effect on a small number of participants 2Evidence of certainty was downgraded one level because of the imprecise treatment estimate 3Evidence of certainty was downgraded one level because of study risks of bias 4Evidence of certainty was downgraded one level because heterogeneity between studies | ||||
| Intervention | Participants | Route/dose | Intervention adverse effects | Control adverse effects |
|---|---|---|---|---|
| GABA analogue (pregabalin or gabapentin) versus placebo | 271 (6) | Pregabalin (a) Oral: 75 mg, twice/week Gabapentin (b) Oral: 400 mg, twice/week (c) Oral: 300 mg, 3 times/week (d) Oral: 300 mg/day (e) Oral: dose not reported | Gunal 2004 (c): somnolence, dizziness, fatigue Naghibi 2007 (e): somnolence Naini 2007 (b): somnolence, dizziness, nausea Nofal 2016 (d): somnolence (9/27), dizziness (5/27) Tol 2010 (c): not reported Yue 2015 (a): somnolence (3/67), loss of balance (2/67) | Gunal 2004: not reported Naghibi 2007: not reported Naini 2007: not reported Nofal 2016: not reported Tol 2010: not reported Yue 2015: not reported |
| Ondansetron versus placebo | 161 (3) | (a) Oral: 8 mg, 3 times/day (b) Oral: 8 mg, once/day (c) Oral: 8 mg, twice/day | Ashmore 2000 (a): not reported Murphy 2003 (b): constipation (1/14), ischaemic stroke (1/18), line sepsis (1/17) Yue 2015 (c): nausea and vomiting (2/64) | Ashmore 2000: not reported Murphy 2003: not reported Yue 2015: none |
| Kappa opioid agonists versus placebo | 626 (4) | Nalfurafine (a) Oral: 2.5 µg once/day (b) Oral: 5 µg once/day (c) IV: 5 µg, 3 times/week (d) IV: 2.5, 5 µg with dialysis CR845 (e) IV: 0.5 to 1.5 µg/kg with dialysis | Kumagai 2010 (a, b) 2.5 µg (oral): somnolence (4.5%); insomnia (7.1%), diarrhoea (4.5%), nasopharyngitis (8.0%) 5 µg (oral): constipation (7.9%), somnolence (3.5%), insomnia (14.9%), nasopharyngitis (12.3%) Spencer 2015 (e): not reported Spencer 2017 (e) (0.5 to 1.5 µg/kg): somnolence (9/129), dizziness (12/129), headache (5/129), diarrhoea (16/129), nausea (11/129) Bhaduri 2006 (d): not reported Wikstrom 2005 (c): headache (3/26), nausea (3/26), vomiting (2/26), insomnia (2/26), vertigo (2/26) | Kumagai 2010: nasopharyngitis (17.1%), headache (3.6%), vomiting (3.6%) Spencer 2015: not reported Spencer 2017: somnolence (1/45), dizziness (2/45), headache (1/45), diarrhoea (0/45) Wikstrom 2005: 13/25 (type not reported) |
| Mu opioid antagonists versus placebo | 31 (2) | Oral: 50 mg once/day | Pauli‐Magnus 2000: loss of appetite and nausea (9) Peer 1996: heartburn (2), abdominal discomfort (3) | Pauli‐Magnus 2000: nausea (1) Peer 1996: not reported |
| Nalbuphine versus placebo | 373 (1) | Oral: 60 or 120 mg, twice/day | 60 mg: serious adverse events (12.7%), adverse events leading to discontinuation (33/128) 120 mg: serious adverse events (6.7%), adverse events leading to discontinuation (27/120) | TREVITR02 2017: serious adverse events (15.4%), adverse events leading to discontinuation (7/123) |
| EPO versus placebo | 39 (2) | (a) IV: 36 U/kg/dialysis (b) SC: 2000 IU twice/day | De Marchi 1992 (a): not reported Sja'bani 1997 (b): not reported | De Marchi 1992: not reported Sja'bani 1997: not reported |
| Nicotinamide versus placebo | 50 (1) | Oral: 500 mg twice/day | Omidian 2013: not reported | Omidian 2013: not reported |
| Lidocaine versus placebo | 20 (1) | IV: 200 mg | Tapia 1977: not reported | Tapia 1977: not reported |
| Cholestyramine | 20 (2) | Oral: 5 mg, twice/day | Silverberg 1977: constipation (1/5), nausea (1/5) van Leusen 1978: not reported | Silverberg 1977: not reported van Leusen 1978: not reported |
| Montelukast versus placebo | 89 (2) | Oral: 10 mg/day | Mahmudpour 2017: not reported Nasrollahi 2007: myelodysplastic syndrome (1/8) | Mahmudpour 2017: Not reported Nasrollahi 2007: myocardial infarction (1/8) |
| Sertraline versus placebo | 50 (1) | Oral: 50 mg twice/day | Pakfetrat 2018: not reported | Pakfetrat 2018: not reported |
| Sodium thiosulfate versus placebo | 45 (1) | IV: 12.5 mg/dialysis session | Mohamed 2012: not reported | Mohamed 2012: not reported |
| Doxepin versus placebo | 24 (1) | Oral: 10 mg, twice/day | Pour‐Reza‐Gholi 2007: drowsiness (12/24) | Pour‐Reza‐Gholi 2007: not reported |
| Thalidomide versus placebo | 29 (1) | Oral: 100 mg/day | Silva 1994: not reported | Silva 1994: not reported |
| Cimetidine versus placebo | 13 (1) | Oral: 600 mg/day | Aubia 1980: not reported | Aubia 1980: not reported |
| Cromolyn versus placebo | 62 (1) | Oral: 135 mg, 3 times/day | Vessal 2010: flatulence (1/32) | Vessal 2010: nausea (5/30), diarrhoea (4/30) |
| Gabapentin versus pregabalin | 50 (1) | Oral gabapentin (300 mg, once/day) versus oral pregabalin (75 mg, once/day) | Gabapentin: not reported Pregabalin: not reported | ‐‐ |
| GADA versus ondansetron | 131 (1) | Oral pregabalin (75 mg twice/week) versus oral ondansetron (8 mg/day) | Pregabalin: somnolence (3/67), loss of balance (2/67) Ondansetron: not reported | ‐‐ |
| GABA analogue versus doxepin | 90 (1) | Oral pregabalin (50 mg every other night) versus oral doxepin (10 mg/night) | Pregabalin: intolerable adverse events (3/46), somnolence (6/37), oedema (3/37), drowsiness (3/27), imbalance (1/37), numbness (1/37) Doxepin: intolerable adverse events (1/44), nervousness (1/35) | ‐‐ |
| GABA analogue versus antihistamine | 212 (4) | (a) Oral gabapentin (100 mg/day) versus oral ketotifen (1 mg, twice/day) (b) Oral gabapentin (300 mg, 3 times/week) versus oral dexchlorpheniramine (6 mg, 3 times/week) (c) Oral gabapentin (300 mg/day) versus oral loratadine (10 mg/day) (d) Oral gabapentin (100 to 200 mg/day) versus oral hydroxyzine (10 mg/day) (e) Oral gabapentin (100 mg/day) versus oral hydroxyzine (10 mg/day) | Amirkhanlou 2016 (a) Gabapentin: drowsiness (4/26), dizziness (1/26) Ketotifen: drowsiness (4/26), dizziness (1/26) Gabapentin: total (11/30), drowsiness (17%) Dexchlorpheniramine: total (8/30), drowsiness (1/30) Marin 2013 (c) Gabapentin: somnolence (8/30) Loratadine: none reported Noshad 2011 (d) Gabapentin: complications (7/20) Hydroxyzine: complications (10/20) Gabapentin: (9/18) Loratadine: (4/16) | ‐‐ |
| Mu opioid antagonists versus antihistamine | 52 (1) | Oral naltrexone (50 mg/day) versus oral loratadine (10 mg/day) | Naltrexone (26): vomiting (2), nausea (9), anorexia (1), abdominal distention (1), malaise (1), cramps (2), sleep disturbances (5), vertigo (5), headache (2), somnolence (1), paraesthesia (1), withdrawn (10) Loratadine (26): vomiting (2), malaise (1), withdrawn from study (2) | ‐‐ |
| Ondansetron versus antihistamine | 20 (1) | (a) Ondansetron tablet (8 mg/day) versus cyproheptadine syrup (8 mg/day) (b) "3 doses ondansetron 8mg" versus "diphenhydramine 25mg" (c) Oral ondansetron (8 mg, 3 times/day) versus oral loratadine (10 mg twice/day) | Ozaykan 2001 (a): not reported Subach 2001 (b): not reported Mirnezami 2013 (c): not reported | ‐‐ |
| *when reported GABA ‐ gamma‐aminobutyric acid | ||||
| Intervention | Participants | Route/dose | Intervention adverse effects | Control adverse effects |
|---|---|---|---|---|
| Cromolyn cream versus placebo | 60 (1) | 4% cream | Feily 2012: burning sensation (6/30) | Feily 2012: none |
| Capsaicin cream versus placebo | 91 (4) | (a) 0.025%, 4 times/day (b) 0.03%, 4 times/day | Breneman 1992 (a): burning and stinging sensation (5), decrease in xerosis (3), dryness (2) Cho 1997 (a): not reported Makhlough 2010 (b): skin burning Tarng 1996 (a): local burning and/or stinging sensations | Breneman 1992: not reported Cho 1997: not reported Makhlough 2010: none Tarng 1996: local burning and/or stinging sensations |
| Pramoxine lotion versus placebo | 28 (1) | 1.0% twice/day | Young 2009: none | Young 2009: none |
| Baby oil versus placebo | 92 (1) | Chilled and unchilled 15 min application at least once/day | Lin 2012: not reported | Lin 2012: not reported |
| Dead Sea lotion versus placebo | 50 (1) | Entire body, twice/day | Boaz 2009: total adverse events (2/25) | Boaz 2009: total adverse events (3/25) |
| Sericin cream versus placebo | 50 (1) | 1 g, twice/day | Aramwit 2012a: not reported | Aramwit 2012a: not reported |
| L‐arginine salve versus placebo | 24 (1) | 25 µg/2.5 cm2 twice/day | Durant‐Finn 2008: not reported | Durant‐Finn 2008: not reported |
| Calcineurin inhibitors versus placebo | 80 (2) | TAC: 0.1% twice/day Pimecrolimus: 1.0% twice/day | Duque 2005: warmth sensation (6/12) Ghorbani 2012a: burning sensation which disappeared by the end of 8 weeks | Duque 2005: warmth sensation (3/8) Ghorbani 2012a: none |
| Sweet almond oil versus no intervention | 44 (1) | 100 mg/day | Afrasiabifar 2017: not reported | Afrasiabifar 2017: not reported |
| Gamma‐linoleic acid versus placebo | 17 (1) | 2.2%, 30 mL/day | Chen 2006e: allergic reaction (1/8) | Chen 2006e: none |
| Calcineurin inhibitors versus cromolyn | 60 (1) | Pimecrolimus: 2% twice/day Cromolyn: 4%, twice/day | Ghorbani Birgani 2011: unknown | Ghorbani Birgani 2011: unknown |
| Avena sativa versus diluted vinegar versus hydroxyzine | 23 (1) | Avena sativa: variable dose, twice/day Dilute vinegar: 30 mL twice/day Oral hydroxyzine: 10 mg/day | Nakhaee 2015: not reported | ‐‐ |
| Sarna versus eurax | 30 (1) | Sarna: 0.5% each of camphor, menthol, and phenol "as required" for 7 days Eurax: 10% crotamiton "as required" for 7 days | Sarna: none Eurax: rash (1) | ‐‐ |
| *when reported | ||||
| Intervention | Participants | Dose/route | Intervention adverse effects | Placebo adverse effects |
|---|---|---|---|---|
| Polyunsaturated fatty acids versus placebo | 89 (4) | Fish oil (a) Oral: 6 g/day (b) Oral: 3 g/day Omega‐3 fatty acids (c) Oral: 3 g/day | Begum 2004 (a): not reported Ghanei 2012 (c): not reported Mojgan 2017 (b): not reported Peck 1996 (a): not reported | Begum 2004: not reported Ghanei 2012: not reported Mojgan 2017: not reported Peck 1996: not reported |
| L‐carnitine versus placebo | 17 (1) | IV: 10 mg/kg, once/day | Mettang 1997: not reported | Mettang 1997: not reported |
| Zinc sulfate versus placebo | 80 (2) | (a) Oral: 220 mg/day (b) Oral: 200 mg twice/day | Mapar 2015 (a): none Najafabadi 2012 (b): none “attributable to zinc sulfate” | Mapar 2015: vomiting (1/20) Najafabadi 2012: not reported |
| Ergocalciferol versus placebo | 50 (1) | Oral: 50,000 IU/week | Shirazian 2013: none | Shirazian 2013: not reported |
| Turmeric (curcumin) versus placebo | 100 (1) | Oral: 500 mg (22.1 mg), 3 times/day | Pakfetrat 2014: none | Pakfetrat 2014: not reported |
| Fumaria parviflora versus placebo | 79 (1) | Oral: 1000 mg, 3 times/day | Akrami 2017: Gastric pain (4/39), rash (1/39) | Akrami 2017: abdominal pain (1/40), constipation (1/40) |
| Senna versus placebo | 60 (1) | Oral: dose and frequency not reported | Fallahzadeh 2015: not reported | Fallahzadeh 2015: not reported |
| Evening primrose oil | 16 (1) | Oral: 2 capsules/day (containing 360 mg of linoleic acid, 50 mg oleic acid and 45 mg of gamma‐linoleic acid) | Yoshimoto‐Furuie 1999: none | Yoshimoto‐Furuie 1999: none |
| Activated charcoal versus placebo | 20 (1) | Oral: 6 g/day | Pederson 1980: not reported | Pederson 1980: not reported |
| Charcoal versus aluminium hydroxide | 30 (1) | Charcoal: 6 g, 3 times/day Aluminium hydroxide: 30 mL, 3 times/day | Shariati 2010: not reported | ‐‐ |
| *when reported | ||||
| Intervention | Participants | Dose/route | Intervention adverse effects | Control adverse effects |
|---|---|---|---|---|
| High flux/ high permeability/high flow HD | 252 (4) | (a) High‐flow HD (b) High‐permeability HD (c) High‐flux HD | Aliasgharpour 2018 (a): not reported Chen 2009 (b): not reported Hui 2011 (c): not reported Jiang 2016 (c): not reported | Aliasgharpour 2018: not reported Chen 2009: not reported Hui 2011: not reported Jiang 2016: not reported |
| HD with haemoperfusion | 90 (1) | Haemoperfusion HA130‐RHA HA330‐RHA | Li 2017a: not reported | Li 2017a: not reported |
| Haemoperfusion plus HD versus haemoperfusion plus HDF | 40 (1) | Haemoperfusion plus HD Haemoperfusion plus HDF | Haemoperfusion plus HD: not reported Haemoperfusion plus HDF: not reported | ‐‐ |
| Magnesium‐free HD versus standard HD | 17 (1) | Standard HD: 0.85 mmol/L magnesium solution for 2 weeks | Carmichael 1988: not reported | Carmichael 1988: not reported |
| Calcium dialysate HD | 4 (1) | Calcium concentration 1.0 mmol/L 1.25 mmol/L 1.75 mmol/L | Kyriazis 2000: not reported | Kyriazis 2000: not reported |
| Cool versus normal dialysate | 60 (1) | Cool dialysate: 35.5oC, 3 times/week Normal dialysate: 37oC, 3 time/week | Rad 2017: not reported | Rad 2017: not reported |
| *when reported | ||||
| Intervention | Participants | Dose/route | Intervention adverse effects | Control adverse effects |
|---|---|---|---|---|
| UV‐B exposure | 75 (4) | (a) 0.19 nJ/cm2/sec, 3 times/week (b) Minimal erythema dose, twice/week (c) 4.4 watts/m2, twice/week (d) 200 mJ/cm2, 3 times/week | Blachley 1985 (a): not reported Chan 1995 (b): not reported Gilchrest 1977 (c): sunburn (3/10), tanning (5/10) Gilchrest 1979 (c): mild sunburn and tanning Ko 2011 (d): erythema (2/11) | Blachley 1985: not reported Chan 1995: not reported Gilchrest 1977: not reported Gilchrest 1979: not reported Ko 2011: not reported |
| UV‐A exposure | 11 (1) | UV‐A (exposure): 40 min exposure (10, 180 cm 85W UV‐A lamps) 3 times/week | Taylor 1983: not reported | Taylor 1983: not reported |
| Thermal therapy | 41 (1) | 40oC thermal therapy, twice/week | Hsu 2009: not reported | Hsu 2009: not reported |
| UV‐B exposure versus cetirizine | 30 (1) | UV‐B Whole body: 200 to 1038 mJ/cm2 every 3rd day for 15 sessions Cetirizine Oral: 10 mg/day for the same duration | Sherjeena 2017: not reported | ‐‐ |
| *when reported | ||||
| Outcome or subgroup title | No. of studies | No. of participants | Statistical method | Effect size |
| 1.1 Itch Show forest plot | 30 | Std. Mean Difference (IV, Random, 95% CI) | Subtotals only | |
| 1.1.1 GABA analogues | 5 | 297 | Std. Mean Difference (IV, Random, 95% CI) | ‐2.14 [‐2.43, ‐1.85] |
| 1.1.2 GABA analogues versus antihistamine | 5 | 220 | Std. Mean Difference (IV, Random, 95% CI) | ‐0.44 [‐0.75, ‐0.14] |
| 1.1.3 Ondansetron | 3 | 183 | Std. Mean Difference (IV, Random, 95% CI) | ‐0.17 [‐0.49, 0.15] |
| 1.1.4 Kappa‐opioid agonist | 4 | 661 | Std. Mean Difference (IV, Random, 95% CI) | ‐0.43 [‐0.60, ‐0.27] |
| 1.1.5 Mu‐opioid antagonist | 2 | 62 | Std. Mean Difference (IV, Random, 95% CI) | ‐4.10 [‐11.05, 2.85] |
| 1.1.6 Nalbuphine | 1 | 179 | Std. Mean Difference (IV, Random, 95% CI) | ‐0.22 [‐0.54, 0.10] |
| 1.1.7 Cromolyn | 1 | 40 | Std. Mean Difference (IV, Random, 95% CI) | ‐1.31 [‐2.00, ‐0.62] |
| 1.1.8 Nicotinamide | 1 | 50 | Std. Mean Difference (IV, Random, 95% CI) | 0.32 [‐0.23, 0.88] |
| 1.1.9 EPO | 1 | 20 | Std. Mean Difference (IV, Random, 95% CI) | ‐0.50 [‐1.39, 0.39] |
| 1.1.10 Cholestyramine | 2 | 20 | Std. Mean Difference (IV, Random, 95% CI) | 0.00 [‐0.89, 0.89] |
| 1.1.11 Montelukast | 2 | 87 | Std. Mean Difference (IV, Random, 95% CI) | ‐1.40 [‐1.87, ‐0.92] |
| 1.1.12 Sertraline | 1 | 46 | Std. Mean Difference (IV, Random, 95% CI) | ‐0.56 [‐1.15, 0.03] |
| 1.1.13 Lidocaine | 1 | 16 | Std. Mean Difference (IV, Random, 95% CI) | ‐0.81 [‐1.87, 0.25] |
| 1.1.14 Gabapentin versus pregabalin | 1 | 40 | Std. Mean Difference (IV, Random, 95% CI) | 0.01 [‐0.61, 0.63] |
| 1.1.15 GABA analogues versus doxepin | 1 | 72 | Std. Mean Difference (IV, Random, 95% CI) | ‐0.84 [‐1.33, ‐0.36] |
| 1.2 Itch (dichotomous) Show forest plot | 3 | Risk Ratio (M‐H, Random, 95% CI) | Totals not selected | |
| 1.2.1 Lidocaine | 1 | Risk Ratio (M‐H, Random, 95% CI) | Totals not selected | |
| 1.2.2 Thalidomide | 1 | Risk Ratio (M‐H, Random, 95% CI) | Totals not selected | |
| 1.2.3 Doxepin | 1 | Risk Ratio (M‐H, Random, 95% CI) | Totals not selected | |
| Outcome or subgroup title | No. of studies | No. of participants | Statistical method | Effect size |
| 2.1 Itch Show forest plot | 10 | Std. Mean Difference (IV, Random, 95% CI) | Subtotals only | |
| 2.1.1 Capsaicin cream | 2 | 112 | Std. Mean Difference (IV, Random, 95% CI) | ‐0.84 [‐1.22, ‐0.45] |
| 2.1.2 Pramoxine cream | 1 | 27 | Std. Mean Difference (IV, Random, 95% CI) | ‐0.35 [‐1.11, 0.41] |
| 2.1.3 Calcineurin Inhibitor cream | 1 | 60 | Std. Mean Difference (IV, Random, 95% CI) | 0.39 [‐0.13, 0.90] |
| 2.1.4 Dead Sea lotion | 1 | 41 | Std. Mean Difference (IV, Random, 95% CI) | ‐0.52 [‐1.14, 0.10] |
| 2.1.5 Cromolyn cream | 1 | 60 | Std. Mean Difference (IV, Random, 95% CI) | ‐0.34 [‐0.85, 0.17] |
| 2.1.6 Baby oil | 1 | 93 | Std. Mean Difference (IV, Random, 95% CI) | ‐0.87 [‐1.32, ‐0.43] |
| 2.1.7 L‐arginine salve | 1 | 48 | Std. Mean Difference (IV, Random, 95% CI) | ‐0.25 [‐0.82, 0.32] |
| 2.1.8 Polyunsaturated fatty acids | 2 | 78 | Std. Mean Difference (IV, Random, 95% CI) | ‐0.91 [‐1.99, 0.17] |
| Outcome or subgroup title | No. of studies | No. of participants | Statistical method | Effect size |
| 3.1 Itch Show forest plot | 7 | Mean Difference (IV, Random, 95% CI) | Subtotals only | |
| 3.1.1 Polyunsaturated fatty acids | 1 | 22 | Mean Difference (IV, Random, 95% CI) | ‐11.30 [‐19.01, ‐3.59] |
| 3.1.2 L‐carnitine (IV) | 1 | 12 | Mean Difference (IV, Random, 95% CI) | ‐0.26 [‐2.85, 2.33] |
| 3.1.3 Zinc sulfate | 2 | 76 | Mean Difference (IV, Random, 95% CI) | ‐1.77 [‐2.88, ‐0.66] |
| 3.1.4 Ergocalciferol | 1 | 50 | Mean Difference (IV, Random, 95% CI) | 0.40 [‐2.48, 3.28] |
| 3.1.5 Turmeric | 1 | 100 | Mean Difference (IV, Random, 95% CI) | ‐6.40 [‐7.42, ‐5.38] |
| 3.1.6 Fumaria parviflora | 1 | 63 | Mean Difference (IV, Random, 95% CI) | ‐3.90 [‐5.04, ‐2.76] |
| Outcome or subgroup title | No. of studies | No. of participants | Statistical method | Effect size |
| 4.1 Itch Show forest plot | 4 | Mean Difference (IV, Random, 95% CI) | Subtotals only | |
| 4.1.1 High flux or permeability HD | 3 | 202 | Mean Difference (IV, Random, 95% CI) | ‐2.62 [‐3.72, ‐1.52] |
| 4.1.2 NMR haemoperfusion | 1 | 90 | Mean Difference (IV, Random, 95% CI) | ‐2.37 [‐2.89, ‐1.85] |
| Outcome or subgroup title | No. of studies | No. of participants | Statistical method | Effect size |
| 5.1 Itch Show forest plot | 5 | Mean Difference (IV, Random, 95% CI) | Subtotals only | |
| 5.1.1 UV‐B | 4 | 86 | Mean Difference (IV, Random, 95% CI) | ‐4.06 [‐8.40, 0.28] |
| 5.1.2 Thermal therapy | 1 | 49 | Mean Difference (IV, Random, 95% CI) | ‐2.06 [‐6.54, 2.42] |
| Outcome or subgroup title | No. of studies | No. of participants | Statistical method | Effect size |
| 6.1 Cholestyramine Show forest plot | 2 | Mean Difference (IV, Random, 95% CI) | ‐0.24 [‐0.86, 0.38] | |