Intervenciones farmacológicas para la pancreatitis aguda
Resumen
Antecedentes
En los pacientes con pancreatitis aguda, no está claro cuál debería ser la función del tratamiento médico sumado a la atención de apoyo, como el equilibrio hidroelectrolítico y el apoyo a los órganos en pacientes con insuficiencia orgánica.
Objetivos
Evaluar los efectos de diferentes intervenciones farmacológicas en pacientes con pancreatitis aguda.
Métodos de búsqueda
Se hicieron búsquedas en el Registro Cochrane Central de Ensayos Controlados (Cochrane Central Register of Controlled Trials) (CENTRAL, 2016, número 9), MEDLINE, Embase, Science Citation Index Expanded, y en registros de ensayos hasta octubre 2016 para identificar ensayos controlados aleatorios (ECA). También se buscaron las referencias de los ensayos incluidos para identificar ensayos adicionales.
Criterios de selección
Se consideró la inclusión en la revisión de ECA realizados en pacientes con pancreatitis aguda solamente, de manera independiente de la etiología, la gravedad, la presencia de infección, el idioma, el cegamiento o el estado de publicación.
Obtención y análisis de los datos
Dos autores de la revisión de forma independiente identificaron los ensayos y extrajeron los datos. No se realizó el metanálisis en red programado por la falta de información sobre los modificadores del efecto potencial y las diferencias en el tipo de participantes incluidos en las diferentes comparaciones, cuando hubo información disponible. Se calculó el odds ratio (OR) con intervalos de confianza (IC) del 95% para los resultados binarios y los cocientes de tasas con IC del 95% para los resultados de los recuentos mediante un modelo de efectos fijos y un modelo de efectos aleatorios.
Resultados principales
En esta revisión se incluyeron 84 ECA con 8234 participantes. Seis ensayos (N = 658) no informaron ninguno de los resultados de interés para esta revisión. Los 78 ensayos restantes excluyeron a 210 participantes después de la asignación al azar. En consecuencia, un total de 7366 participantes en 78 ensayos contribuyeron a uno o más resultados para esta revisión. Los tratamientos evaluados en estos 78 ensayos fueron: antibióticos, antioxidantes, aprotinina, atropina, calcitonina, cimetidina, EDTA (ácido etilendiaminotetraacético), gabexato, glucagón, iniprol, lexipafant, AINE (fármacos antiinflamatorios no esteroideos), octreotida, oxifenonio, probióticos, proteína C activada, somatostatina, somatostatina más omeprazol, somatostatina más ulinastatina, timosina, ulinastatina y control inactivo. Además de la comparación de antibióticos versus control, que incluyó a gran parte de los participantes con pancreatitis necrosante, en las comparaciones restantes sólo hubo una proporción pequeña de pacientes con este trastorno. La mayoría de los ensayos incluyeron sólo a pacientes con pancreatitis aguda grave o una combinación de pacientes con pancreatitis aguda leve y pancreatitis aguda grave (75 ensayos). En términos generales, el riesgo de sesgo en los ensayos fue poco claro o alto para todos los ensayos excepto uno.
Fuente de financiación: siete ensayos no fueron financiados o fueron financiados por organismos sin intereses personales en los resultados. Las compañías farmacéuticas financiaron parcial o totalmente 21 ensayos. La fuente de financiación no estaba disponible en los ensayos restantes.
Debido a que la mortalidad a corto plazo se consideró el resultado más importante, en el resumen sólo se presentaron estos resultados de forma detallada. Sesenta y siete estudios con 6638 participantes informaron la mortalidad a corto plazo. No hubo pruebas de diferencias en la mortalidad a corto plazo en ninguna de las comparaciones (evidencia de muy baja calidad). Con respecto a otros resultados primarios, los eventos adversos graves (número) fueron inferiores que en el control en los participantes que recibieron lexipafant (cociente de tasas 0,67; IC del 95%: 0,46 a 0,96; N = 290; un estudio; evidencia de muy baja calidad), octreotida (cociente de tasas 0,74; IC del 95%: 0,60 a 0,89; N = 770; cinco estudios; evidencia de muy baja calidad), somatostatina más omeprazol (cociente de tasas 0,36; IC del 95%: 0,19 a 0,70; N = 140; un estudio; evidencia de baja calidad) y somatostatina más ulinastatina (cociente de tasas 0,30; IC del 95%: 0,15 a 0,60; N = 122; un estudio; evidencia de baja calidad). La proporción de pacientes con insuficiencia orgánica fue inferior en el grupo de octreotida que en el control (OR 0,51; IC del 95%: 0,27 a 0,97; N = 430; tres estudios; evidencia de muy baja calidad). La proporción de pacientes con sepsis fue inferior en el grupo de lexipafant que en el control (OR 0,26; IC del 95%: 0,08 a 0,83; N = 290; un estudio; evidencia de muy baja calidad). No hubo evidencia de diferencias en ninguna de las comparaciones restantes en estos resultados ni para ninguno de los resultados primarios restantes (la proporción de pacientes con al menos un evento adverso grave y la presencia de necrosis pancreática infectada). Ninguno de los ensayos informó la calidad de vida relacionada con la salud.
Conclusiones de los autores
La evidencia de muy baja calidad indica que ninguno de los tratamientos farmacológicos estudió la disminución en la mortalidad a corto plazo en los pacientes con pancreatitis aguda. Sin embargo, los intervalos de confianza fueron amplios y compatibles con un aumento o una disminución en la mortalidad a corto plazo debido a las intervenciones. No se encontraron beneficios clínicos consistentes con ninguna intervención. Dadas las limitaciones en los sistemas de puntuación de pronóstico y debido a que el daño a los órganos puede ocurrir en la pancreatitis aguda antes de que se manifieste clínicamente, los ensayos futuros deben considerar la posibilidad de incluir todos los casos de pancreatitis pero aportar al estudio el poder estadístico suficiente para medir las diferencias en el subgrupo de pacientes con pancreatitis aguda grave. Puede ser difícil que los estudios basados en la mortalidad tengan un poder estadístico suficiente. Los ensayos futuros en pacientes con pancreatitis aguda deben considerar otros resultados, como las complicaciones o la calidad de vida relacionada con la salud como resultados primarios. Estos ensayos deben incluir la calidad de vida relacionada con la salud, los costos y el retorno al trabajo como resultados y deben realizar el seguimiento de los pacientes durante al menos tres meses (preferentemente durante al menos un año).
PICOs
Resumen en términos sencillos
Tratamiento médico para los pacientes con pancreatitis aguda (inflamación aguda del páncreas)
Antecedentes
El páncreas es un órgano ubicado en el abdomen que secreta varias enzimas digestivas (sustancias que permiten y aceleran las reacciones químicas en el cuerpo) en el sistema ductal pancreático, y el contenido luego se vacía en el intestino delgado. También contiene los islotes de Langerhans, que secretan varias hormonas incluida la insulina (que ayuda a regular el azúcar sanguíneo). La pancreatitis aguda es una enfermedad potencialmente mortal caracterizada por la inflamación súbita del páncreas, que puede dar lugar a la insuficiencia de otros órganos, como el pulmón y el riñón. Hay mucha investigación sobre diferentes tratamientos médicos para la pancreatitis aguda, aunque no están claros los beneficios de cada tratamiento ni si algún tratamiento médico es beneficioso además del tratamiento de apoyo. Esta atención incluye hidratación corporal y tratamiento con cuidados intensivos en los pacientes con insuficiencia orgánica (para apoyar los órganos deteriorados). Se intentó resolver este problema mediante la búsqueda de los estudios existentes sobre el tema. Se incluyeron todos los ensayos controlados aleatorios (estudios clínicos en que los pacientes son asignados al azar a uno de dos o más grupos de tratamiento) cuyos resultados se presentaron hasta el 7 de octubre de 2016.
Características de los estudios
En esta revisión, se incluyeron 84 ECA con 8234 participantes. Seis ensayos (658 participantes) no informaron ninguno de los resultados de interés para esta revisión. En los 78 ensayos restantes, 210 participantes fueron excluidos después de la asignación al azar. Así, un total de 7366 participantes en 78 ensayos contribuyeron a uno o más resultados para esta revisión. Además de la comparación de si deben usarse antibióticos, las otras comparaciones incluyeron sólo un porcentaje pequeño de pacientes con necrosis pancreática (una forma sumamente grave de pancreatitis, que resulta en la destrucción pancreática). La mayoría de los ensayos incluyeron sólo la forma grave de la pancreatitis aguda o incluyeron formas tanto leves como graves de pancreatitis.
Fuente de financiación: siete ensayos no fueron financiados o fueron financiados por organismos sin intereses personales en los resultados. Veintiún ensayos fueron financiados parcial o totalmente por las compañías farmacéuticas. La fuente de financiación no estaba disponible en los ensayos restantes.
Calidad de la evidencia
La calidad general de la evidencia fue baja para todas las medidas debido a que el riesgo de sesgo en los ensayos fue poco claro o alto (un error sistemático o desviación de la verdad que afecta los resultados, favoreciendo un tratamiento sobre otro) y a que se trataba de ensayos pequeños. Como resultado, se necesitan más estudios sobre este tema.
Resultados clave
Sesenta y siete estudios con 6638 participantes informaron las muertes a corto plazo. En términos generales, se registró un promedio de un 12% de defunciones entre los pacientes que recibieron sólo atención de apoyo. No hubo evidencia de que ninguno de los tratamientos redujera las muertes a corto plazo. Hubo evidencia de que diversos tratamientos podrían ser beneficiosos en varios resultados; sin embargo, éstos no fueron consistentes, y no es posible establecer conclusiones sobre si alguno de los tratamientos puede ser beneficioso. Ninguno de los ensayos informó la calidad de vida relacionada con la salud.
En conclusión, sobre la base de las pruebas de muy baja calidad, no existe evidencia de que algún tratamiento farmacológico sumado a la atención de apoyo reduzca las muertes a corto plazo. Los ensayos futuros en los pacientes con pancreatitis aguda deben incluir la calidad de vida relacionada con la salud, los costos y el retorno al trabajo como resultados y deben realizar el seguimiento de los pacientes durante al menos tres meses (preferentemente durante al menos un año).
Authors' conclusions
Summary of findings
| Pharmacological interventions for treatment of acute severe pancreatitis (mortality) | |||||
| Patient or population: people with acute pancreatitis | |||||
| Outcomes | Illustrative comparative risks* (95% CI) | Relative effect | No of participants | Quality of the evidence | |
| Assumed risk Inactive control | Corresponding risk Various treatments | ||||
| Short‐term mortality Follow‐up: up to 3 months | Antibiotics | OR 0.81 | 1058 | ⊕⊝⊝⊝ | |
| 120 per 1000 | 99 per 1000 | ||||
| Antioxidants | OR 2.01 | 163 | ⊕⊝⊝⊝ | ||
| 120 per 1000 | 215 per 1000 | ||||
| Aprotinin | OR 0.68 | 651 | ⊕⊝⊝⊝ | ||
| 120 per 1000 | 85 per 1000 | ||||
| Calcitonin | OR 0.55 | 125 | ⊕⊝⊝⊝ | ||
| 120 per 1000 | 69 per 1000 | ||||
| Cimetidine | OR 1.00 | 40 | ⊕⊝⊝⊝ | ||
| 120 per 1000 | 120 per 1000 | ||||
| EDTA | OR 0.94 | 64 | ⊕⊝⊝⊝ | ||
| 120 per 1000 | 113 per 1000 | ||||
| Gabexate | OR 0.79 | 576 | ⊕⊝⊝⊝ | ||
| 120 per 1000 | 98 per 1000 | ||||
| Glucagon | OR 0.97 | 409 | ⊕⊝⊝⊝ | ||
| 120 per 1000 | 117 per 1000 | ||||
| Iniprol | OR 0.14 | 24 | ⊕⊝⊝⊝ | ||
| 120 per 1000 | 19 per 1000 | ||||
| Lexipafant | OR 0.55 | 423 | ⊕⊝⊝⊝ | ||
| 120 per 1000 | 70 per 1000 | ||||
| Octreotide | OR 0.76 | 927 | ⊕⊝⊝⊝ | ||
| 120 per 1000 | 94 per 1000 | ||||
| Probiotics | OR 1.70 | 358 | ⊕⊝⊝⊝ | ||
| 120 per 1000 | 188 per 1000 | ||||
| Activated protein C | OR 8.56 | 32 | ⊕⊝⊝⊝ | ||
| 120 per 1000 | 539 per 1000 | ||||
| Somatostatin | OR 0.57 | 493 | ⊕⊝⊝⊝ | ||
| 120 per 1000 | 72 per 1000 | ||||
| Somatostatin plus omeprazole | OR 0.23 | 140 | ⊕⊝⊝⊝ | ||
| 120 per 1000 | 30 per 1000 | ||||
| Somatostatin plus ulinastatin | OR 0.43 | 122 | ⊕⊝⊝⊝ | ||
| 120 per 1000 | 55 per 1000 | ||||
| Thymosin | Not estimable | 24 | ⊕⊝⊝⊝ | ||
| 120 per 1000 | not estimable | ||||
| Ulinastatin | OR 0.45 | 132 | ⊕⊝⊝⊝ | ||
| 120 per 1000 | 58 per 1000 | ||||
| Long‐term mortality | None of the trials with inactive treatment in the control group reported long‐term mortality. | ||||
| *The basis for the assumed risk is the average control group proportion across all comparisons. The corresponding risk (and its 95% confidence interval) is based on the assumed risk in the comparison group and the relative effect of the intervention (and its 95% CI). CI: confidence intervals; OR: odds ratio; EDTA: ethylenediaminetetraacetic acid. | |||||
| GRADE Working Group grades of evidence | |||||
| aRisk of bias: downgraded by one level. | |||||
| Pharmacological interventions for treatment of acute severe pancreatitis (other outcomes) | |||||
| Patient or population: people with acute pancreatitis | |||||
| Outcomes | Illustrative comparative risks* (95% CI) | Relative effect | No of participants | Quality of the evidence | |
| Assumed risk | Corresponding risk | ||||
| Inactive control | Various treatments | ||||
| Serious adverse events (proportion) Follow‐up: up to 3 months | Antibiotics | OR 0.65 | 304 | ⊕⊝⊝⊝ | |
| 147 per 1000 | 101 per 1000 | ||||
| Antioxidants | OR 1.98 | 82 | ⊕⊝⊝⊝ | ||
| 147 per 1000 | 255 per 1000 | ||||
| EDTA | OR 0.52 | 64 | ⊕⊝⊝⊝ | ||
| 147 per 1000 | 83 per 1000 | ||||
| Gabexate | OR 1.31 | 201 | ⊕⊝⊝⊝ | ||
| 147 per 1000 | 185 per 1000 | ||||
| Glucagon | OR 0.29 | 127 | ⊕⊝⊝⊝ | ||
| 147 per 1000 | 48 per 1000 | ||||
| Octreotide | OR 1.73 | 58 | ⊕⊝⊝⊝ | ||
| 147 per 1000 | 230 per 1000 | ||||
| Somatostatin | OR 1.07 | 111 | ⊕⊝⊝⊝ | ||
| 147 per 1000 | 156 per 1000 | ||||
| Serious adverse events (number) Follow‐up: up to 3 months | Antibiotics | Rate ratio0.86 | 716 | ⊕⊝⊝⊝ | |
| 437 per 1000 | 374 per 1000 | ||||
| Antioxidants | Rate ratio0.22 | 71 | ⊕⊝⊝⊝ | ||
| 437 per 1000 | 94 per 1000 | ||||
| Aprotinin | Rate ratio0.79 | 264 | ⊕⊝⊝⊝ | ||
| 437 per 1000 | 345 per 1000 | ||||
| Cimetidine | Rate ratio1.00 | 60 | ⊕⊝⊝⊝ | ||
| 437 per 1000 | 437 per 1000 | ||||
| EDTA | Rate ratio0.94 | 64 | ⊕⊝⊝⊝ | ||
| 437 per 1000 | 411 per 1000 | ||||
| Gabexate | Rate ratio0.86 | 375 | ⊕⊝⊝⊝ | ||
| 437 per 1000 | 375 per 1000 | ||||
| Glucagon | Rate ratio1.00 | 68 | ⊕⊝⊝⊝ | ||
| 437 per 1000 | 437 per 1000 | ||||
| Lexipafant | rate ratio0.67 | 290 | ⊕⊝⊝⊝ | ||
| 437 per 1000 | 292 per 1000 | ||||
| Octreotide | Rate ratio0.74 | 770 | ⊕⊝⊝⊝ | ||
| 437 per 1000 | 321 per 1000 | ||||
| Probiotics | Rate ratio0.94 | 397 | ⊕⊝⊝⊝ | ||
| 437 per 1000 | 412 per 1000 | ||||
| Somatostatin | Rate ratio1.03 | 257 | ⊕⊝⊝⊝ | ||
| 437 per 1000 | 449 per 1000 | ||||
| Somatostatin plus omeprazole | Rate ratio0.36 | 140 | ⊕⊕⊝⊝ | ||
| 437 per 1000 | 159 per 1000 | ||||
| Somatostatin plus ulinastatin | Rate ratio0.30 | 122 | ⊕⊕⊝⊝ | ||
| 437 per 1000 | 133 per 1000 | ||||
| Organ failure Follow‐up: up to 3 months | Antibiotics | OR 0.78 | 258 | ⊕⊝⊝⊝ | |
| 289 per 1000 | 241 per 1000 | ||||
| Antioxidants | OR 0.92 | 163 | ⊕⊝⊝⊝ | ||
| 289 per 1000 | 271 per 1000 | ||||
| Gabexate | OR 0.32 | 50 | ⊕⊝⊝⊝ | ||
| 289 per 1000 | 115 per 1000 | ||||
| Lexipafant | OR 0.68 | 340 | ⊕⊝⊝⊝ | ||
| 289 per 1000 | 216 per 1000 | ||||
| Octreotide | OR 0.51 | 430 | ⊕⊝⊝⊝ | ||
| 289 per 1000 | 173 per 1000 | ||||
| Probiotics | OR 0.80 | 358 | ⊕⊝⊝⊝ | ||
| 289 per 1000 | 246 per 1000 | ||||
| Ulinastatin | OR 0.27 | 129 | ⊕⊝⊝⊝ | ||
| 289 per 1000 | 100 per 1000 | ||||
| Infected pancreatic necrosis Follow‐up: up to 3 months | Antibiotics | OR 0.82 | 714 | ⊕⊝⊝⊝ | |
| 140 per 1000 | 118 per 1000 | ||||
| Octreotide | OR 0.52 | 58 | ⊕⊝⊝⊝ | ||
| 140 per 1000 | 78 per 1000 | ||||
| Probiotics | OR 1.10 | 397 | ⊕⊝⊝⊝ | ||
| 140 per 1000 | 152 per 1000 | ||||
| Sepsis Follow‐up: up to 3 months | Antibiotics | OR 0.42 | 60 | ⊕⊝⊝⊝ | |
| 122 per 1000 | 56 per 1000 | ||||
| Aprotinin | OR 1.84 | 103 | ⊕⊝⊝⊝ | ||
| 122 per 1000 | 204 per 1000 | ||||
| Gabexate | OR 1.10 | 373 | ⊕⊝⊝⊝ | ||
| 122 per 1000 | 133 per 1000 | ||||
| Lexipafant | OR 0.26 | 290 | ⊕⊝⊝⊝ | ||
| 122 per 1000 | 35 per 1000 | ||||
| Octreotide | OR 0.40 | 340 | ⊕⊝⊝⊝ | ||
| 122 per 1000 | 53 per 1000 | ||||
| Probiotics | OR 0.36 | 62 | ⊕⊝⊝⊝ | ||
| 122 per 1000 | 48 per 1000 | ||||
| Health‐related quality of life | None of the trials reported this outcome. | ||||
| *The basis for the assumed risk is the average control group proportion across all comparisons. The corresponding risk (and its 95% confidence interval) is based on the assumed risk in the comparison group and the relative effect of the intervention (and its 95% CI). CI: confidence intervals; OR = odds ratio; EDTA = ethylenediaminetetraacetic acid. | |||||
| GRADE Working Group grades of evidence | |||||
| aRisk of bias: downgraded by one level. | |||||
Background
Description of the condition
The pancreas is an abdominal organ that secretes several digestive enzymes into the pancreatic ductal system before it empties into the small bowel. The pancreas also lodges the Islets of Langerhans, which secrete several hormones including insulin (NCBI 2014). Acute pancreatitis is a sudden inflammatory process in the pancreas, with variable involvement of nearby organs or other organ systems (Bradley 1993). The annual incidence of acute pancreatitis ranges from 5 to 30 per 100,000 population (Roberts 2013; Yadav 2006). There has been an increase in the incidence of acute pancreatitis in the last 10 to 20 years in the UK and USA (Roberts 2013; Yang 2008). Acute pancreatitis is the commonest gastrointestinal (digestive tract) cause of hospital admission in the USA (Peery 2012), and gallstones and alcohol are the two main causes. Approximately, 50% to 70% of acute pancreatitis is caused by gallstones (Roberts 2013; Yadav 2006); these slip into the common bile duct and obstruct the ampulla of Vater (a common channel formed by the union of common bile duct and pancreatic duct), resulting in obstruction to the flow of pancreatic enzymes and leading to activation of trypsinogen within the pancreas and acute pancreatitis (Sah 2013).
Advanced age, male sex, and lower socioeconomic class are associated with higher incidence of acute pancreatitis (Roberts 2013).
Clinicians generally diagnose acute pancreatitis when at least two of the following three features are present (Banks 2013).
-
Acute onset of a persistent, severe, epigastric pain, often radiating to the back.
-
Serum lipase activity (or amylase activity) at least three times greater than the upper limit of normal.
-
Characteristic findings of acute pancreatitis on contrast‐enhanced computed tomography (CECT) and less commonly magnetic resonance imaging (MRI) or transabdominal ultrasonography.
Depending upon the type of inflammation, acute pancreatitis can be classified into interstitial oedematous pancreatitis (diffuse (widespread) or occasionally localised enlargement of the pancreas due to inflammatory oedema as seen on CECT) or necrotising pancreatitis (necrosis involving either the pancreas, peripancreatic tissues, or both) (Banks 2013). Approximately 90% to 95% of people with acute pancreatitis have interstitial oedematous pancreatitis, while the remainder have necrotising pancreatitis (Banks 2013). Necrotising pancreatitis may be sterile or infected (Banks 2013). Various theories exist as to how pancreatic and peripancreatic tissues get infected. These include spread from blood circulation, lymphatics, bile, and the small bowel (duodenum) through the pancreatic duct, as well as movement (translocation) through the large bowel wall (Schmid 1999).
Local complications of acute pancreatitis include acute peripancreatic fluid collection, pancreatic pseudocyst, acute necrotic collection, and walled‐off necrosis (Banks 2013). The systemic complications of acute pancreatitis include worsening of pre‐existing illnesses such as heart or chronic lung disease (Banks 2013). The mortality rates following an attack of acute pancreatitis are between 6% and 20% (Roberts 2013; Yadav 2006), according to severity. Acute pancreatitis can be classified as mild, moderate, or severe, depending on the presence of local or systemic complications, transient organ failure involving one of more of lungs, kidneys, and cardiovascular system (heart and blood vessels) lasting up to 48 hours, or persistent failure of these organs lasting beyond 48 hours. Mild pancreatitis has the best prognosis, and there are no local or systemic complications or organ failure. In moderately severe acute pancreatitis, there may be local or systemic complications or transient organ failure. Severe acute pancreatitis carries the worst prognosis in terms of mortality, and there is persistent organ failure (Banks 2013).
The clinical manifestation of acute pancreatitis is believed to be caused by activation of inflammatory pathways either directly by the pathologic insult or indirectly by activation of trypsinogen (an enzyme that digests protein or a protease), resulting in formation of trypsin, a protease that can break down the pancreas (Sah 2013). This activation of inflammatory pathways manifests clinically as systemic inflammatory response syndrome (SIRS) (Banks 2013; Sah 2013; Tenner 2013). Systemic inflammatory response syndrome is characterised by two or more of the following criteria (Bone 1992).
-
Temperature of less than 36°C or more than 38°C.
-
Heart rate less than 90 beats/minute.
-
Respiratory rate more than 20/min or PCO₂ less than 32 mm Hg.
-
White blood cell count more than 12,000/mm³, less than 4000/mm³, or more than 10% immature (band) forms.
See Appendix 1 for a glossary of terms.
Description of the intervention
The main purpose of treatment is to decrease the mortality and morbidity associated with acute pancreatitis. The various pharmacological interventions that have been evaluated in the treatment of acute pancreatitis include agents such as somatostatin or octreotide that decrease pancreatic secretions; protease inhibitors such as gabexate mesilate, aprotinin, ulinastatin, and nafamostat; antioxidants such as vitamin C and selenium; platelet activating factor such as lexipafant; other agents that modulate the inflammatory pathway such as steroids and tumour necrosis factor‐alpha (TNF‐α) antibody; probiotics; and antibiotics (Bang 2008; Neumann 2011; Rada 2011; Yang 2011). We included any pharmacological intervention aimed at the treatment of acute pancreatitis.
We did not cover endoscopic sphincterotomy for the treatment of common bile duct stones (Ayub 2010), nor did we focus on endoscopic, radiology‐guided percutaneous treatments or surgical treatments for treatment of complications of acute pancreatitis (Tenner 2013). Furthermore, we did not cover the use of non‐steroidal anti‐inflammatory drugs (NSAIDs) or other drugs such as somatostatin analogues for preventing postendoscopic retrograde cholangiopancreatography (post‐ECRP)‐induced pancreatitis (Elmunzer 2012; Zhang 2009).
How the intervention might work
Somatostatin and its analogues decrease pancreatic secretion (Bang 2008). Since autodigestion (breakdown of pancreas) due to trypsinogen activation is one of the mechanisms believed to cause acute pancreatitis, decreasing pancreatic secretion can decrease the amount of trypsinogen. Inhibition of trypsin by protease inhibitors may result in decreased damage to the pancreas (Neumann 2011). Antioxidants, platelet‐activating factor inhibitors, steroids, and TNF‐α antibody are all aimed at decreasing the inflammatory response or at mitigating the damage resulting from the inflammatory response (Bang 2008). Probiotics decrease the bacterial colonisation of the gut, and antibiotics have antibacterial actions (Bang 2008).
Why it is important to do this review
Despite various pharmacological interventions being evaluated in acute pancreatitis, none is currently recommended in the treatment of acute pancreatitis, with the exception of antibiotics in infected necrotising pancreatitis (Tenner 2013). Systematic reviews and meta‐analyses increase the precision of the treatment effects (i.e. they provide a narrower range of the average treatment effect) (Higgins 2011), and so decrease the risk of a type II error (concluding that there is no difference between treatments when there is actually a difference). Systematic reviews also help in identifying the differences in the treatment effects between studies and allow exploration of the reasons behind these differences. Many studies have compared these interventions with placebo or with no treatment. It is therefore not possible to obtain accurate information on how one treatment compares with another treatment. Multiple treatment comparisons or a network meta‐analysis allow comparison of several treatments simultaneously and provide information on the relative effect of one treatment versus another, even when there is no direct comparison. There is no Cochrane Review or network meta‐analysis on this topic. So, we planned to perform a network meta‐analysis if the type of participants were included across all the comparisons. This systematic review will identify the relative effects of different treatments and identify any research gaps.
Objectives
To assess the effects of different pharmacological interventions in people with acute pancreatitis.
Methods
Criteria for considering studies for this review
Types of studies
We included only randomised controlled trials (RCTs). We included studies reported as full text, those published as abstract only, and unpublished data.
Types of participants
We included adults with acute pancreatitis irrespective of the severity (mild, moderately severe, or severe acute pancreatitis) or the type of acute pancreatitis (acute interstitial oedematous pancreatitis or necrotising pancreatitis).
Types of interventions
We included trials comparing any pharmacological interventions mentioned above with another, with placebo, or with no intervention, provided that the only difference between the randomised groups was the pharmacological intervention or interventions being assessed. Some of the interventions that we included are listed below.
-
Activated protein C.
-
Antibiotics.
-
Antioxidants.
-
Aprotinin.
-
Calcitonin.
-
Cimetidine.
-
EDTA (ethylenediaminetetraacetic acid).
-
Gabexate.
-
Glucagon.
-
Iniprol.
-
Lexipafant.
-
Octreotide.
-
Omeprazole.
-
Probiotics.
-
Somatostatin.
-
Thymosin.
-
Ulinastatin.
We did not combine the different somatostatin analogues (such as somatostatin or octreotide) as a single treatment in order to avoid further clinical heterogeneity. We assessed a combination of drugs as a separate treatment.
Types of outcome measures
Primary outcomes
-
Mortality.
-
Short‐term mortality (in‐hospital mortality or mortality within six months).
-
Long‐term mortality (at maximum follow‐up).
-
-
Serious adverse events (within six months). We accepted the definition of serious adverse events from the International Conference on Harmonisation ‐ Good Clinical Practice guideline (ICH‐GCP 1997): any untoward medical occurrence that results in death, is life‐threatening, requires inpatient hospitalisation or prolongation of existing hospitalisation, or results in persistent or significant disability/incapacity. Wealso accepted other variations of ICH‐GCP classifications such as Food and Drug Administration (FDA) classification (FDA 2006), Medicines and Healthcare products Regulatory Agency (MHRA) classification (MHRA 2013).
-
Proportion of people who developed serious adverse events (i.e. the percentage of people who developed one or more serious adverse events) and the number of serious adverse events (i.e. the total number of serious adverse events in each group regardless of the number of people in whom the serious adverse events developed).
-
Organ failure (however reported by authors).
-
Infected necrotising pancreatitis (cytology or positive culture).
-
Sepsis (however reported by authors).
-
-
Health‐related quality of life (using any validated scale).
-
Short‐term (four weeks to three months).
-
Medium‐term (three months to one year).
-
Long‐term (more than one year).
-
-
Health‐related quality of life (using any validated scale).
-
Short‐term (four weeks to three months).
-
Medium‐term (three months to one year).
-
Long‐term (more than one year).
-
Secondary outcomes
-
Adverse events (within six months). We accepted all adverse events reported by the trial authors, irrespective of the severity of the adverse event.
-
Measures of decreased complications and earlier recovery (within six months).
-
Length of hospital stay (including the index admission for acute pancreatitis and any disease‐related or intervention‐related readmissions including those for recurrent episodes).
-
Length of intensive care unit (ICU) stay (including the index admission for acute pancreatitis and any disease‐ or intervention‐related readmissions).
-
Requirement for additional invasive intervention such as necrosectomy for pancreatic necrosis, endoscopic or radiological drainage of collections.
-
Time to return to normal activity (return to pre‐acute pancreatitis episode mobility without any additional caregiver support).
-
Time to return to work (in those who were employed previously).
-
-
Costs (within six months).
We chose the above clinical outcomes based on the necessity to assess whether the pharmacological interventions were effective in decreasing complications, thereby decreasing the length of ICU and hospital stay, decreasing any additional interventions, and resulting in earlier return to normal activity and work as well as improvement in quality of life. The costs provide an indication of resource requirement.
We did not regard the reporting of the outcomes listed here as an inclusion criterion for the review.
Search methods for identification of studies
Electronic searches
We conducted a literature search to identify all published and unpublished randomised controlled trials. The literature search identified potential studies in all languages. We translated the non‐English language papers and fully assessed them for potential inclusion in the review as necessary.
We searched the following electronic databases for identifying potential studies.
-
Cochrane Central Register of Controlled Trials (CENTRAL; Issue 9, 2016; searched 7 October 2016; Appendix 2).
-
MEDLINE (1966 to 7 October 2016; Appendix 3).
-
Embase (1988 to 7 October 2016; Appendix 4).
-
Science Citation Index (1982 to 7 October 2016; Appendix 5).
We also conducted a search of ClinicalTrials.gov (Appendix 6) and World Health Organization International Clinical Trials Registry Platform (WHO ICTRP) (Appendix 8) on 7 October 2016.
Searching other resources
We checked the reference lists of all primary studies and review articles for additional references. We contacted authors of identified trials and asked them to identify any other published and unpublished studies.
We searched for errata or retractions from eligible trials on www.ncbi.nlm.nih.gov/pubmed on 7 October 2016.
Data collection and analysis
Selection of studies
Two review authors (KG and AB) independently screened titles and abstracts of all the potential studies that we identified through the searches and coded them as 'retrieve' (eligible or potentially eligible/unclear) or 'do not retrieve'. We retrieved the full‐text study reports, and two review authors (KG and RK or EM) independently screened them and identified studies for inclusion; we identified and recorded reasons for exclusion of the ineligible studies. We resolved any disagreement through discussion. We identified and excluded duplicates and collated multiple reports of the same study so that each study rather than each report was the unit of interest in the review. We planned to contact the investigators of trials of unclear eligibility. We recorded the selection process in sufficient detail to complete a PRISMA flow diagram (Figure 1) and a 'Characteristics of excluded studies' table.

Study flow diagram.
Data extraction and management
We used a standard data collection form for study characteristics and outcome data, which had been piloted on three studies in the review. Two review authors (KG and RK or EM) independently extracted the following study characteristics.
-
Methods: study design, total duration study and run‐in, number of study centres and location, study setting, withdrawals, date of study.
-
Participants: number (N), mean age, age range, sex, severity and type of acute pancreatitis, inclusion criteria, exclusion criteria.
-
Interventions: intervention, comparison, co‐interventions, number of participants randomised to each group.
-
Outcomes: primary and secondary outcomes specified and collected, time points reported. For binary outcomes, we obtained the number of participants with events and the number of participants included in the analysis in each group. For continuous outcomes, we obtained the unit or scale of measurement, mean, standard deviation, and the number of participants included in the analysis for each group. For count outcomes, we obtained the number of events and number of participants included in the analysis in each group. For time‐to‐event outcomes, we obtained the proportion of people with events, the average duration of follow‐up of participants in the trial, and the number of participants included in the analysis for each group.
-
Notes: funding for trial, notable conflicts of interest of trial authors.
Two review authors (KG and RK or EM) independently extracted outcome data from included studies. If outcomes were reported at multiple time points, we planned to extract the data for all time points. We obtained information on the number of participants with adverse events (or serious adverse events) and the number of such events where applicable. We planned to extract all information on costs using the currency reported by the trial authors and planned to convert this to USD at the conversion rates on the day of the analysis. We extracted data for every trial arm that was an included intervention. If studies reported outcome data in an unusable way, we attempted to contact the trial authors and tried to obtain usable data. If we were unable to obtain usable data despite this, we planned to summarise the unusable data in an appendix. We resolved disagreements by consensus. One review author (EM) copied across the data for 'Characteristics of included studies' and 'Characteristics of excluded studies' from the data collection form into the Review Manager 5 (RevMan 5) file (RevMan 2014). One review author (KG) copied across the data for 'Data and analyses' from the data collection form into the RevMan 5 file. We double‐checked that the data were entered correctly by comparing the study reports with how the data were presented in the systematic review.
Assessment of risk of bias in included studies
Two review authors (KG and RK or EM) independently assessed the risk of bias for each study using the criteria outlined in the Cochrane Handbook for Systematic Reviews of Interventions (Higgins 2011). We resolved any disagreements by discussion. We assessed the risk of bias according to the following domains.
-
Random sequence generation.
-
Allocation concealment.
-
Blinding of participants and personnel.
-
Blinding of outcome assessment.
-
Incomplete outcome data.
-
Selective outcome reporting.
-
Bias due to funding source.
-
Other potential bias.
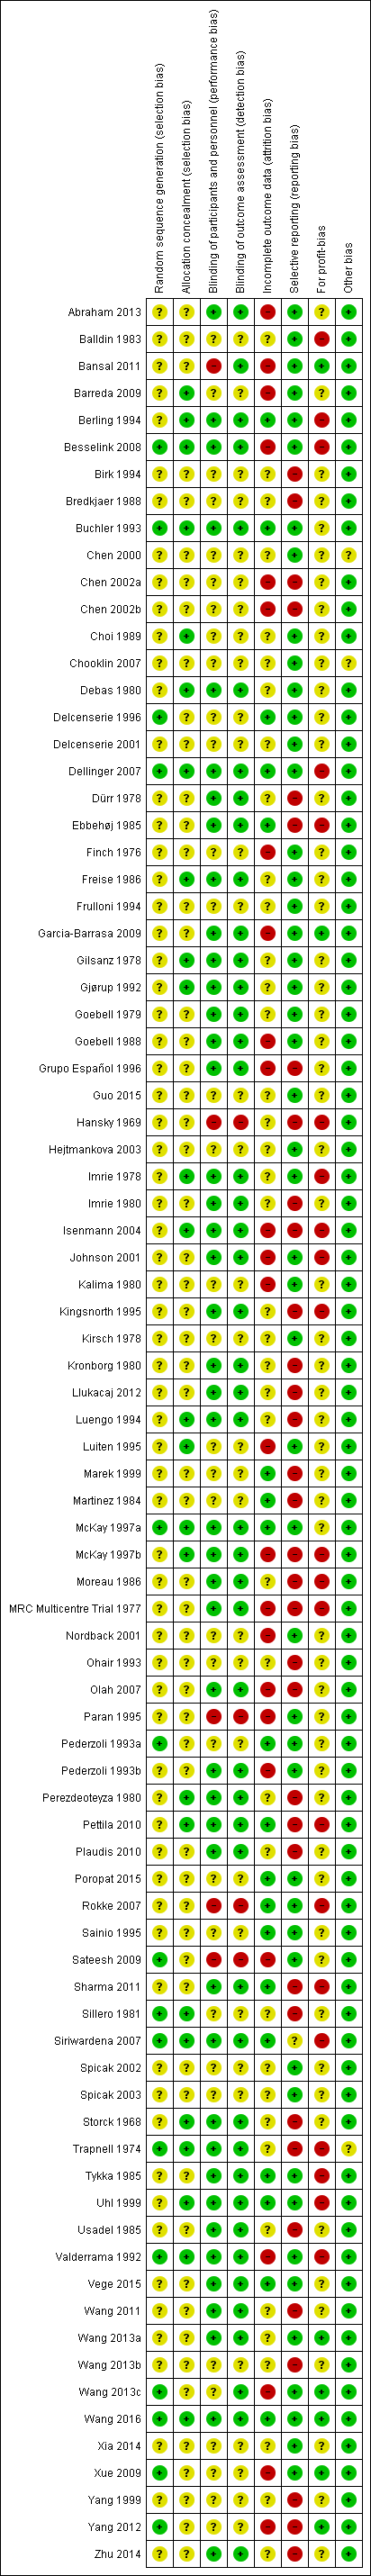
We graded each potential source of bias as high, low, or unclear and provided a quote from the study report together with a justification for our judgement in the 'Risk of bias' tables. We summarised the risk of bias judgements across different studies for each of the domains listed. We considered blinding separately for different key outcomes where necessary, for example, for unblinded outcome assessment, risk of bias for all‐cause mortality may be very different than for a participant‐reported pain scale. Where information on risk of bias relates to unpublished data or to correspondence with a trial author, we planned to note this in the 'Risk of bias' table. We presented the risk of bias in each pair‐wise comparison in Table 1.
| Study name | No of participants randomised | Postrandomisation dropouts | No of participants for whom outcome was reported | Treatment 1 | Treatment 2 | Selection bias | Performance and detection bias | Attrition bias | Selective reporting bias | Other bias |
| 32 | 0 | 32 | Activated protein C | Placebo | Unclear | Low | Low | High | High | |
| 80 | 22 | 58 | Antibiotics | No active intervention | Unclear | Unclear | High | Low | Unclear | |
| 23 | 0 | 23 | Antibiotics | No active intervention | Unclear | Unclear | Low | Low | Unclear | |
| 81 | Not stated | 81 | Antibiotics | No active intervention | Unclear | Unclear | Unclear | Low | Unclear | |
| 100 | 0 | 100 | Antibiotics | Placebo | Low | Low | Low | Low | High | |
| 62 | 4 | 58 | Antibiotics | No active intervention | Unclear | Unclear | High | Low | Unclear | |
| 46 | 5 | 41 | Antibiotics | Placebo | Unclear | Low | High | Low | Low | |
| 41 | Not stated | 41 | Antibiotics | No active intervention | Unclear | Unclear | Unclear | Low | Unclear | |
| 119 | 5 | 114 | Antibiotics | Placebo | Unclear | Low | High | High | High | |
| 80 | Not stated | 80 | Antibiotics | Placebo | Unclear | Low | Unclear | High | Unclear | |
| 109 | 7 | 102 | Antibiotics | No active intervention | Unclear | Unclear | High | Low | Unclear | |
| 90 | 32 | 58 | Antibiotics | Placebo | Unclear | Unclear | High | Low | Unclear | |
| 47 | 0 | 47 | Antibiotics | No active intervention | Unclear | Unclear | Low | Low | Unclear | |
| 74 | Not stated | 74 | Antibiotics | No active intervention | Unclear | Unclear | Low | Low | Unclear | |
| 73 | 0 | 73 | Antibiotics | No active intervention | Unclear | High | Low | Low | High | |
| 60 | 0 | 60 | Antibiotics | No active intervention | Unclear | Unclear | Low | Low | Unclear | |
| 63 | Not stated | 63 | Antibiotics | No active intervention | Unclear | Unclear | Unclear | Low | Unclear | |
| 41 | Not stated | 41 | Antibiotics | No active intervention | Unclear | Unclear | Unclear | Low | Unclear | |
| 59 | 3 | 56 | Antibiotics | No active intervention | Unclear | Unclear | High | Low | Low | |
| 44 | 5 | 39 | Antioxidants | No active intervention | Unclear | High | High | Low | Low | |
| 20 | Not stated | 20 | Antioxidants | No active intervention | Unclear | Unclear | Unclear | High | Unclear | |
| 73 | 0 | 73 | Antioxidants | Placebo | Unclear | Unclear | Low | High | Unclear | |
| 56 | 3 | 53 | Antioxidants | No active intervention | Unclear | High | High | Low | Unclear | |
| 43 | 0 | 43 | Antioxidants | Placebo | Low | Low | Low | Low | High | |
| 28 | Not stated | 28 | Antioxidants | Placebo | Unclear | Low | Low | Low | Unclear | |
| 34 | Not stated | 34 | Antioxidants plus Corticosteroids | No active intervention | Unclear | Unclear | Unclear | High | Unclear | |
| (this is a 3‐armed trial; the numbers stated included all 3 arms) | 264 | 7 | 257 | Aprotinin | Placebo | Unclear | Low | High | High | High |
| 55 | Not stated | 55 | Aprotinin | No active intervention | Unclear | Unclear | Unclear | Low | High | |
| 48 | Not stated | 48 | Aprotinin | No active intervention | Unclear | Low | Low | Low | High | |
| 161 | Not stated | 161 | Aprotinin | Placebo | Unclear | Low | Unclear | Low | High | |
| 50 | Not stated | 50 | Aprotinin | Placebo | Unclear | Low | Unclear | High | Unclear | |
| 43 | Not stated | 43 | Aprotinin | Placebo | Unclear | Low | Unclear | High | Unclear | |
| 105 | Not stated | 105 | Aprotinin | Placebo | Low | Low | Unclear | High | High | |
| (this is a 3‐armed trial; the numbers stated included all 3 arms) | 264 | 7 | 257 | Aprotinin | Glucagon | Unclear | Low | High | High | High |
| 94 | Not stated | 94 | Calcitonin | Placebo | Unclear | Low | Unclear | Low | Unclear | |
| 31 | 0 | 31 | Calcitonin | Placebo | Unclear | Unclear | Low | High | Unclear | |
| 40 | Not stated | 40 | Cimetidine | Placebo | Unclear | Low | Unclear | High | Unclear | |
| 60 | Not stated | 60 | Cimetidine | Placebo | Low | Unclear | Unclear | High | Unclear | |
| 64 | 0 | 64 | EDTA | Placebo | Unclear | Low | Low | Low | High | |
| 116 | Not stated | 116 | Gabexate | Aprotinin | Unclear | Unclear | Unclear | Low | Unclear | |
| 199 | 17 | 182 | Gabexate | Aprotinin | Unclear | Low | High | Low | Unclear | |
| 223 | Not stated | 223 | Gabexate | Placebo | Low | Low | Low | Low | Unclear | |
| 52 | Not stated | 52 | Gabexate | Placebo | Unclear | Unclear | Unclear | Low | Unclear | |
| 50 | Not stated | 50 | Gabexate | Placebo | Unclear | Low | Unclear | Low | Unclear | |
| 162 | 11 | 151 | Gabexate | Placebo | Unclear | Low | High | Low | Unclear | |
| 105 | 5 | 100 | Gabexate | Placebo | Low | Low | High | Low | High | |
| 150 | Not stated | 150 | Glucagon | Atropine | Unclear | Unclear | Unclear | Low | Unclear | |
| (this is a 3‐armed trial; the numbers stated included all 3 arms) | 264 | 7 | 257 | Glucagon | Placebo | Unclear | Unclear | Unclear | Low | High |
| 66 | Not stated | 66 | Glucagon | Placebo | Unclear | Low | Unclear | Low | Unclear | |
| 69 | Not stated | 69 | Glucagon | Placebo | Unclear | Low | Unclear | High | Unclear | |
| 80 | 9 | 71 | Glucagon | Placebo | Unclear | Unclear | High | Low | Unclear | |
| 22 | Not stated | 22 | Glucagon | Placebo | Unclear | Low | Unclear | High | Unclear | |
| 62 | Not stated | 62 | Glucagon | Oxyphenonium | Unclear | Low | Unclear | Low | Unclear | |
| 24 | Not stated | 24 | Iniprol | No active intervention | Unclear | High | Unclear | High | High | |
| 291 | 1 | 290 | Lexipafant | Placebo | Unclear | Low | High | Low | High | |
| 83 | Not stated | 83 | Lexipafant | Placebo | Unclear | Low | Unclear | High | High | |
| 51 | 1 | 50 | Lexipafant | Placebo | Unclear | Low | High | High | High | |
| 66 | 9 | 57 | NSAID | Placebo | Unclear | Unclear | Unclear | High | Unclear | |
| 30 | 0 | 30 | NSAID | Placebo | Unclear | Low | Low | High | High | |
| 58 | 0 | 58 | Octreotide | Placebo | Low | Low | Low | Low | Unclear | |
| 180 | Not stated | 180 | Octreotide | Placebo | Unclear | Unclear | Unclear | High | Unclear | |
| 51 | 13 | 38 | Octreotide | No active intervention | Unclear | High | High | Low | Unclear | |
| 302 | 0 | 302 | Octreotide | Placebo | Unclear | Low | Low | Low | High | |
| 372 | Not stated | 372 | Octreotide | No active intervention | Unclear | Unclear | High | Low | Low | |
| 163 | 6 | 157 | Octreotide | No active intervention | Unclear | Unclear | High | High | Low | |
| 354 | Not stated | 354 | Octreotide plus NSAID | Octreotide | Unclear | Unclear | Unclear | High | Unclear | |
| 120 | Not stated | 120 | Octreotide plus ulinastatin | Octreotide | Unclear | Unclear | Unclear | Low | Unclear | |
| 298 | 2 | 296 | Probiotics | Placebo | Low | Low | High | Low | High | |
| 83 | 21 | 62 | Probiotics | No active intervention | Unclear | Low | High | High | Unclear | |
| 90 | Not stated | 58 | Probiotics | No active intervention | Unclear | Low | Unclear | High | Unclear | |
| 50 | 0 | 50 | Probiotics | Placebo | Unclear | Low | Low | High | High | |
| 39 | Not stated | 39 | Probiotics | Placebo | Unclear | Low | Unclear | High | Unclear | |
| 70 | 9 | 61 | Somatostatin | Placebo | Unclear | Low | High | High | Unclear | |
| 71 | Not stated | 71 | Somatostatin | No active intervention | Unclear | Unclear | Unclear | Low | Unclear | |
| 63 | Not stated | 63 | Somatostatin | Placebo | Unclear | Low | Unclear | Low | Unclear | |
| 100 | Not stated | 100 | Somatostatin | No active intervention | Unclear | Low | Unclear | High | Unclear | |
| 87 | 3 | 84 | Somatostatin | Placebo | Unclear | Low | Unclear | High | High | |
| 77 | Not stated | 77 | Somatostatin | Placebo | Unclear | Low | Unclear | High | Unclear | |
| Wang 2013a (this is a 3‐armed trial; the numbers stated included all 3 arms) | 183 | Not stated | 183 | Somatostatin | No active intervention | Unclear | Low | Unclear | Low | Low |
| 48 | Not stated | 48 | Somatostatin | No active intervention | Unclear | Unclear | Unclear | High | Unclear | |
| 140 | Not stated | 140 | Somatostatin plus omeprazole | No active intervention | Unclear | Unclear | Unclear | Low | Unclear | |
| Wang 2013a (this is a 3‐armed trial; the numbers stated included all 3 arms) | 183 | Not stated | 183 | Somatostatin plus ulinastatin | Placebo | Unclear | Unclear | Unclear | High | Unclear |
| Wang 2013a (this is a 3‐armed trial; the numbers stated included all 3 arms) | 183 | Not stated | 183 | Somatostatin plus ulinastatin | Somatostatin | Unclear | Low | Unclear | Low | Low |
| Wang 2016 (this is a 4‐armed trial; the numbers stated included all 4 arms) | 492 | 0 | 492 | Somatostatin plus ulinastatin | Somatostatin | Low | Low | Low | Low | Low |
| Wang 2016 (this is a 4‐armed trial; the numbers stated included all 4 arms) | 492 | 0 | 492 | Somatostatin plus gabexate | Somatostatin | Low | Low | Low | Low | Low |
| Wang 2016 (this is a 4‐armed trial; the numbers stated included all 4 arms) | 492 | 0 | 492 | Somatostatin plus ulinastatin plus gabexate | Somatostatin | Low | Low | Low | Low | Low |
| Wang 2016 (this is a 4‐armed trial; the numbers stated included all 4 arms) | 492 | 0 | 492 | Somatostatin plus ulinastatin | Somatostatin plus gabexate | Low | Low | Low | Low | Low |
| Wang 2016 (this is a 4‐armed trial; the numbers stated included all 4 arms) | 492 | 0 | 492 | Somatostatin plus ulinastatin plus gabexate | Somatostatin plus gabexate | Low | Low | Low | Low | Low |
| Wang 2016 (this is a 4‐armed trial; the numbers stated included all 4 arms) | 492 | 0 | 492 | Somatostatin plus ulinastatin plus gabexate | Somatostatin plus ulinastatin | Low | Low | Low | Low | Low |
| 24 | Not stated | 24 | Thymosin | Placebo | Unclear | Low | Unclear | High | Unclear | |
| 135 | 6 | 129 | Ulinastatin | Placebo | Unclear | Low | High | Low | Unclear | |
| 68 | 6 | 62 | Ulinastatin | Gabexate | Unclear | Unclear | High | High | Unclear | |
| 26 | 1 | 25 | Ulinastatin | Octreotide | Unclear | Unclear | High | High | Unclear |
When considering treatment effects, we took into account the risk of bias for the studies that contribute to that outcome by a sensitivity analysis.
Assessment of bias in conducting the systematic review
We conducted the review according to the published protocol and reported any deviations from it in the 'Differences between protocol and review' section of this review.
Measures of treatment effect
For dichotomous variables (short‐term mortality, proportion of participants with adverse events, requirement for additional interventions), we calculated the odds ratio (OR) with 95% confidence interval (CI). For continuous variables, such as length of hospital stay, ICU stay, time to return to normal activity, time to return to work, and costs, we planned to calculate the mean difference (MD) with 95% CI. We planned to use standardised mean difference (SMD) with 95% CI for quality of life if different scales were used. For count outcomes such as the number of adverse events, we calculated the rate ratio with 95% CIs. For time‐to‐event data, such as long‐term mortality, we planned to use the hazard ratio (HR) with a 95% CI. However, only one trial reported mortality beyond 3 months and presented the number of deaths at two years. We analysed this information as binary data.
A common way that trial authors indicate when they have skewed data is by reporting medians and interquartile ranges. When we encountered this, we reported the difference in means or medians in a table.
Unit of analysis issues
The unit of analysis was individual participants with acute pancreatitis. As anticipated, we did not find any cluster‐randomised trials for this comparison.
In multi‐arm trials, the models account for the correlation between trial‐specific treatment effects from the same trial.
Dealing with missing data
We attempted to contact investigators or study sponsors in order to verify key study characteristics and obtain missing numerical outcome data where possible (e.g. when a study was identified as abstract only). For binary, count, and time‐to‐event outcomes, we performed an intention‐to‐treat analysis whenever possible (Newell 1992). Since this was not possible, we performed an available‐case analysis but planned to assess the impact of 'best‐best', 'best‐worst', 'worst‐best', and 'worst‐worst' scenario analyses on the results for binary outcomes. For continuous outcomes, we planned to perform an available‐case analysis. If we were unable to obtain the information from the investigators or study sponsors, we planned to impute the mean from the median (i.e. consider the median as the mean) and the standard deviation from the standard error, interquartile range, or P values according to the Cochrane Handbook for Systematic Reviews of Interventions (Higgins 2011), but we planned to assess the impact of including such studies as indicated in a sensitivity analysis. If we were unable to calculate the standard deviation from the standard error, interquartile range, or P values, we planned to impute the standard deviation as the highest standard deviation in the remaining trials included in the outcome, being fully aware that this method of imputation would decrease the weight of the studies in the meta‐analysis of mean difference and shift the effect estimate towards no effect for standardised mean difference. We planned to assess the impact of including such studies by sensitivity analysis.
Assessment of heterogeneity
We assessed the heterogeneity in each pair‐wise comparison by assessing the Higgins I² (Higgins 2003), the Chi² test with significance set at a P value less than 0.10, and by visual inspection.
Assessment of reporting biases
We attempted to contact trial authors, asking them to provide missing outcome data. Where this was not possible, and if we thought that the missing data may introduce serious bias, we planned to explore the impact of including such studies in the overall assessment of results by a sensitivity analysis.
If we were able to pool more than 10 trials for a specific comparison, we created and examined a funnel plot to explore possible publication biases. We used Egger's test to determine the statistical significance of the reporting bias (Egger 1997). We considered a P value of less than 0.05 to indicate statistically significant reporting bias.
Data synthesis
We undertook meta‐analyses only where this was meaningful (i.e. if the treatments, participants and the underlying clinical question were similar enough for pooling to make sense). In general, we favoured performing a meta‐analysis and clearly highlighted the reason for not performing one if we decided against it. We used both the fixed‐effect and random‐effects model, reporting the fixed‐effect model when the choice of models did not alter the conclusion and the random‐effects model when it did. We did not perform a network meta‐analysis as planned because of the lack of information on potential effect modifiers and differences of type of participants included in the different comparisons, when information was available (i.e. the transitivity assumption was not satisfied).
Subgroup analysis and investigation of heterogeneity
We planned to perform the following subgroup analyses regardless of heterogeneity.
-
Different types of acute pancreatitis (acute interstitial oedematous pancreatitis or necrotising pancreatitis).
-
Different severity of acute pancreatitis (mild pancreatitis versus moderate or severe acute pancreatitis).
-
Presence of persistent organ failure (mild or moderate acute pancreatitis versus severe acute pancreatitis).
-
Presence of infection (infected necrotising pancreatitis versus non‐infected necrotising pancreatitis).
We planned to calculate the test for subgroup differences to identify differences between subgroups.
Sensitivity analysis
We planned to perform the following sensitivity analyses defined a priori to assess the robustness of our conclusions.
-
Excluding trials at unclear or high risk of bias (one or more of the 'Risk of bias' domains classified as unclear or high).
-
Excluding trials in which either the mean or the standard deviation or both were imputed.
-
Imputation of binary outcomes under 'best‐best', 'best‐worst', 'worst‐best', and 'worst‐worst' scenarios.
'Summary of findings' table
Although we planned to create a 'Summary of findings' table using all the outcomes, this would have resulted in a incomprehensible table. So, we presented the 'Summary of findings' table for the primary outcomes only. We used the five GRADE considerations (study limitations, inconsistency of effect, imprecision, indirectness and publication bias) to assess the quality of the body of evidence as it related to the studies contributing data to the meta‐analyses for the prespecified outcomes. We justified all decisions to down‐ or upgrade the quality rating of studies using footnotes, making comments to aid the reader's understanding of the review where necessary. We considered whether there was any additional outcome information that we were not able to incorporate into meta‐analyses and planned to note this in the comments, stating whether it supported or contradicted the information from the meta‐analyses.
Reaching conclusions
We based our conclusions only on findings from the quantitative or narrative synthesis of included studies for this review. We have avoided making recommendations for practice, and our implications for research give the reader a clear sense of where the focus of any future research in the area should be and what the remaining uncertainties are.
Results
Description of studies
Results of the search
We identified a total of 13,825 references through electronic searches of CENTRAL (1345 records), MEDLINE (5649 records), Embase (4102 records), Science Citation Index Expanded (2604 records), World Health Organization International Clinical Trials Registry Platform (78 records) and ClinicalTrials.gov (47 records). After removing 3548 duplicates, we obtained 10,277 references. We then excluded 10,030 clearly irrelevant references through screening titles and reading abstracts. We sought 247 references for further assessment but could not obtain 2 (Hansen 1966; Perez 1980). Seven references were ongoing trials, suspended trials, or completed trials identified from clinical registers with no interim reports available (ChiCTR‐IPR‐16008301; EUCTR2014‐004844‐37‐ES; NCT01132521; NCT02025049; NCT02212392; NCT02692391; NCT02885441). We did not identify any new trials by scanning reference lists of the identified randomised trials. We excluded 102 references for the reasons listed under the table 'Characteristics of excluded studies'. In total, 136 references (84 trials) met the inclusion criteria. The reference flow is summarised in the study flow diagram (Figure 1).
Included studies
A total of 8234 participants were included in these 84 trials. Six trials (N = 658) did not report any of the outcomes of interest for this review (Birk 1994; Chooklin 2007; Marek 1999; Moreau 1986; Plaudis 2010; Wang 2013b). The remaining 78 trials excluded 210 participants after randomisation. Thus, a total of 7366 participants in 78 trials contributed to one or more outcomes for this review.
One trial included only participants with acute interstitial oedematous pancreatitis (Chen 2002a); 12 trials included only participants with acute necrotising pancreatitis (Barreda 2009; Chen 2002b; Delcenserie 2001; Dellinger 2007; Frulloni 1994; Garcia‐Barrasa 2009; Llukacaj 2012; Nordback 2001; Pederzoli 1993a; Rokke 2007; Sainio 1995; Xue 2009); the remaining trials did not state clearly whether they included any participants with acute necrotising pancreatitis. All the trials that included acute necrotising pancreatitis either stated explicitly or implied that they excluded participants with infected necrotising pancreatitis.
Two trials included only participants with mild acute pancreatitis (Chen 2002a; Yang 2012). Twenty‐six trials included only severe acute pancreatitis (Balldin 1983; Berling 1994; Birk 1994; Chen 2000; Chen 2002b; Chooklin 2007; Delcenserie 1996; Dellinger 2007; Garcia‐Barrasa 2009; Grupo Español 1996; Guo 2015; Hejtmankova 2003; Luiten 1995; Martinez 1984; Olah 2007; Pettila 2010; Plaudis 2010; Rokke 2007; Spicak 2002; Spicak 2003; Wang 2011; Wang 2013a; Wang 2016; Xia 2014; Xue 2009; Zhu 2014). Two trials reported data separately for mild and severe acute pancreatitis (Abraham 2013; Wang 2013c). These trials presented the data separately for mild pancreatitis and acute severe pancreatitis. The remaining trials either included mild and severe acute pancreatitis or did not state the severity of pancreatitis in the participants. It should be noted that none of the trials used the current definition of severe acute pancreatitis (i.e. organ failure persisting for 48 hours or more).
The potential effect modifiers, arranged by comparisons, are shown in Table 2. As shown in the table, important potential effect modifiers were missing. In addition, it appeared that most trials in the comparison on antibiotics versus no active intervention included participants with necrotising pancreatitis. Because of this, there were serious concerns about the inclusion of similar participants in the different comparisons.
| Study name | Treatment 1 | Treatment 2 | Severe pancreatitis | Necrotising pancreatitis | Organ failure | Infection |
| Activated protein C | Placebo | yes | not stated | not stated | not stated | |
| Antibiotics | No active intervention | not stated | yes | not stated | not stated | |
| Antibiotics | No active intervention | yes | not stated | not stated | not stated | |
| Antibiotics | No active intervention | not stated | yes | not stated | not stated | |
| Antibiotics | Placebo | yes | yes | not stated | no | |
| Antibiotics | No active intervention | not stated | not stated | not stated | not stated | |
| Antibiotics | Placebo | yes | yes | not stated | not stated | |
| Antibiotics | No active intervention | yes | not stated | not stated | not stated | |
| Antibiotics | Placebo | not stated | not stated | not stated | not stated | |
| Antibiotics | Placebo | not stated | yes | not stated | no | |
| Antibiotics | No active intervention | yes | not stated | not stated | no | |
| Antibiotics | Placebo | not stated | yes | no | not stated | |
| Antibiotics | No active intervention | not stated | yes | not stated | not stated | |
| Antibiotics | No active intervention | yes | yes | not stated | not stated | |
| Antibiotics | No active intervention | not stated | yes | not stated | not stated | |
| Antibiotics | No active intervention | yes | not stated | not stated | not stated | |
| Antibiotics | No active intervention | yes | not stated | not stated | not stated | |
| Antibiotics | No active intervention | yes | yes | not stated | no | |
| Antioxidants | No active intervention | not stated | not stated | not stated | not stated | |
| Antioxidants | No active intervention | yes | not stated | not stated | not stated | |
| Antioxidants | Placebo | not stated | not stated | not stated | not stated | |
| Antioxidants | No active intervention | not stated | not stated | not stated | not stated | |
| Antioxidants | Placebo | not stated | not stated | not stated | not stated | |
| Antioxidants | Placebo | not stated | not stated | not stated | not stated | |
| Antioxidants plus corticosteroids | No active intervention | yes | not stated | not stated | not stated | |
| Aprotinin | No active intervention | yes | not stated | not stated | not stated | |
| Aprotinin | No active intervention | yes | not stated | not stated | not stated | |
| Aprotinin | Placebo | not stated | not stated | not stated | not stated | |
| Aprotinin | Placebo | not stated | not stated | not stated | not stated | |
| Aprotinin | Placebo | not stated | not stated | not stated | not stated | |
| Aprotinin | Placebo | not stated | not stated | not stated | not stated | |
| Aprotinin | Placebo | not stated | not stated | not stated | not stated | |
| Calcitonin | Placebo | not stated | not stated | not stated | not stated | |
| Calcitonin | Placebo | yes | not stated | not stated | not stated | |
| Cimetidine | Placebo | not stated | not stated | not stated | not stated | |
| Cimetidine | Placebo | not stated | not stated | not stated | not stated | |
| EDTA | Placebo | not stated | not stated | not stated | not stated | |
| Gabexate | Placebo | not stated | not stated | not stated | not stated | |
| Gabexate | Placebo | yes | not stated | yes | not stated | |
| Gabexate | Placebo | not stated | not stated | not stated | not stated | |
| Gabexate | Placebo | not stated | not stated | not stated | not stated | |
| Gabexate | Placebo | not stated | not stated | not stated | not stated | |
| Glucagon | Placebo | not stated | not stated | not stated | not stated | |
| Glucagon | Placebo | not stated | not stated | not stated | not stated | |
| Glucagon | Placebo | not stated | not stated | not stated | not stated | |
| Glucagon | Placebo | not stated | not stated | not stated | not stated | |
| Glucagon | Placebo | not stated | not stated | not stated | not stated | |
| Iniprol | No active intervention | not stated | not stated | not stated | not stated | |
| Lexipafant | Placebo | not stated | not stated | not stated | not stated | |
| Lexipafant | Placebo | not stated | not stated | not stated | not stated | |
| Lexipafant | Placebo | not stated | not stated | not stated | not stated | |
| NSAID | Placebo | not stated | not stated | not stated | not stated | |
| NSAID | Placebo | not stated | not stated | not stated | not stated | |
| Octreotide | Placebo | not stated | not stated | not stated | not stated | |
| Octreotide | Placebo | not stated | not stated | not stated | not stated | |
| Octreotide | No active intervention | not stated | not stated | not stated | not stated | |
| Octreotide | Placebo | not stated | not stated | not stated | not stated | |
| Wang 2013c (mild pancreatitis) | Octreotide | No active intervention | no | not stated | not stated | not stated |
| Wang 2013c (severe pancreatitis) | Octreotide | No active intervention | yes | not stated | not stated | not stated |
| Octreotide | No active intervention | no | not stated | not stated | not stated | |
| Probiotics | Placebo | not stated | not stated | not stated | not stated | |
| Probiotics | No active intervention | yes | not stated | not stated | not stated | |
| Probiotics | No active intervention | yes | not stated | not stated | not stated | |
| Probiotics | Placebo | not stated | not stated | not stated | not stated | |
| Probiotics | Placebo | yes | not stated | not stated | not stated | |
| Somatostatin | No active intervention | not stated | not stated | not stated | not stated | |
| Somatostatin | Placebo | not stated | not stated | not stated | not stated | |
| Somatostatin | Placebo | yes | not stated | not stated | not stated | |
| Somatostatin | No active intervention | not stated | not stated | not stated | not stated | |
| Somatostatin | Placebo | not stated | not stated | not stated | not stated | |
| Somatostatin | Placebo | not stated | not stated | not stated | not stated | |
| Somatostatin | No active intervention | yes | not stated | not stated | not stated | |
| Somatostatin | No active intervention | not stated | not stated | not stated | not stated | |
| Somatostatin plus omeprazole | No active intervention | yes | not stated | not stated | not stated | |
| Somatostatin plus ulinastatin | No active intervention | yes | not stated | not stated | not stated | |
| Thymosin | Placebo | yes | not stated | not stated | not stated | |
| Abraham 2013 (mild pancreatitis) | Ulinastatin | Placebo | no | not stated | not stated | no |
| Abraham 2013 (severe pancreatitis) | Ulinastatin | Placebo | yes | not stated | not stated | not stated |
| Gabexate | Aprotinin | not stated | yes | not stated | not stated | |
| Gabexate | Aprotinin | not stated | not stated | not stated | not stated | |
| Glucagon | Atropine | not stated | not stated | not stated | not stated | |
| Ulinastatin | Gabexate | no | no | no | not stated | |
| Aprotinin | Glucagon | not stated | not stated | not stated | not stated | |
| Octerotide plus ulinastatin | Octreotide | yes | not stated | not stated | not stated | |
| Octreotide plus NSAID | Octreotide | not stated | not stated | not stated | not stated | |
| Ulinastatin | Octreotide | yes | yes | not stated | not stated | |
| Glucagon | Oxyphenonium | not stated | not stated | not stated | not stated | |
| Antibiotics | No active intervention | not stated | not stated | not stated | no | |
| Somatostatin plus gabexate | Somatostatin | yes | not stated | not stated | not stated | |
| Somatostatin plus ulinastatin | Somatostatin | yes | not stated | not stated | not stated | |
| Somatostatin plus ulinastatin | Somatostatin | yes | not stated | not stated | not stated | |
| Somatostatin plus ulinastatin plus gabexate | Somatostatin | yes | not stated | not stated | not stated | |
| Somatostatin plus ulinastatin | Somatostatin plus gabexate | yes | not stated | not stated | not stated | |
| Somatostatin plus ulinastatin plus gabexate | Somatostatin plus gabexate | yes | not stated | not stated | not stated | |
| Somatostatin plus ulinastatin plus gabexate | Somatostatin plus ulinastatin | yes | not stated | not stated | not stated |
Source of funding: seven trials were not funded or they were funded by agencies without vested interest in results (Bansal 2011; Garcia‐Barrasa 2009; Wang 2013a; Wang 2013c; Wang 2016; Xue 2009; Yang 2012). Pharmaceutical companies partially or fully funded 21 trials (Balldin 1983; Berling 1994; Besselink 2008; Dellinger 2007; Ebbehøj 1985; Hansky 1969; Imrie 1978; Isenmann 2004; Johnson 2001; Kingsnorth 1995; McKay 1997b; Moreau 1986; MRC Multicentre Trial 1977; Pettila 2010; Rokke 2007; Sharma 2011; Siriwardena 2007; Trapnell 1974; Tykka 1985; Uhl 1999; Valderrama 1992). The source of funding was not available from the remaining trials.
Excluded studies
None of the excluded studies were eligible for this review. The reasons for exclusion are listed in 'Characteristics of excluded studies'.
Risk of bias in included studies
We summarised the overall risk of bias in Figure 2 and Figure 3. Only Wang 2016 was at low risk of bias in all the domains and can be considered a trial at overall low risk of bias.

Risk of bias graph: review authors' judgements about each risk of bias item presented as percentages across all included studies.
Risk of bias summary: review authors' judgements about each risk of bias item for each included study.
Allocation
Fifteen trials were at low risk of bias for random sequence generation (Besselink 2008; Buchler 1993; Delcenserie 1996; Dellinger 2007; McKay 1997a; Pederzoli 1993a; Sateesh 2009; Sillero 1981; Siriwardena 2007; Trapnell 1974; Valderrama 1992; Wang 2013c; Wang 2016; Xue 2009; Yang 2012). Twenty‐six trials were at low risk of bias for allocation concealment (Barreda 2009; Berling 1994; Besselink 2008; Buchler 1993; Choi 1989; Debas 1980; Dellinger 2007; Freise 1986; Gilsanz 1978; Gjørup 1992; Imrie 1978; Isenmann 2004; Luengo 1994; Luiten 1995; McKay 1997a; McKay 1997b; Perezdeoteyza 1980; Pettila 2010; Sharma 2011; Sillero 1981; Siriwardena 2007; Storck 1968; Trapnell 1974; Uhl 1999; Valderrama 1992; Wang 2016). Eight trials were at low risk of selection bias (Besselink 2008; Buchler 1993; Dellinger 2007; McKay 1997a; Siriwardena 2007; Trapnell 1974; Valderrama 1992; Wang 2016). The remaining trials were at unclear risk of selection bias since they did not describe random sequence generation or allocation concealment.
Blinding
Forty‐five trials were at low risk of bias for blinding of participants, healthcare providers, and outcomes assessors (Abraham 2013; Berling 1994; Besselink 2008; Buchler 1993; Debas 1980; Dellinger 2007; Dürr 1978; Ebbehøj 1985; Freise 1986; Garcia‐Barrasa 2009; Gilsanz 1978; Gjørup 1992; Goebell 1979; Goebell 1988; Grupo Español 1996; Imrie 1978; Imrie 1980; Isenmann 2004; Johnson 2001; Kingsnorth 1995; Kronborg 1980; Llukacaj 2012; Luengo 1994; McKay 1997a; McKay 1997b; Moreau 1986; MRC Multicentre Trial 1977; Olah 2007; Pederzoli 1993b; Perezdeoteyza 1980; Pettila 2010; Plaudis 2010; Sharma 2011; Siriwardena 2007; Storck 1968; Trapnell 1974; Tykka 1985; Uhl 1999; Usadel 1985; Valderrama 1992; Vege 2015; Wang 2011; Wang 2013a; Wang 2016; Zhu 2014). While Bansal 2011 and Wang 2013c were also at low risk of bias for the blinding of outcome assessors, Bansal 2011 was at high risk and Wang 2013c at unclear risk for the blinding of participants and healthcare providers. Overall, five trials were at high risk of bias due to lack of blinding (Bansal 2011; Hansky 1969; Paran 1995; Rokke 2007; Sateesh 2009). The remaining trials were at unclear risk of bias for blinding.
Incomplete outcome data
Nineteen trials were at low risk of attrition bias due to missing outcome data (Berling 1994; Buchler 1993; Delcenserie 1996; Dellinger 2007; Ebbehøj 1985; Marek 1999; Martinez 1984; McKay 1997a; Pederzoli 1993a; Pettila 2010; Poropat 2015; Rokke 2007; Sainio 1995; Sharma 2011; Siriwardena 2007; Tykka 1985; Uhl 1999; Vege 2015; Wang 2016). Twenty‐five trials were at high risk of attrition bias (Abraham 2013; Bansal 2011; Barreda 2009; Besselink 2008; Chen 2002a; Chen 2002b; Finch 1976; Garcia‐Barrasa 2009; Goebell 1988; Grupo Español 1996; Isenmann 2004; Johnson 2001; Kalima 1980; Luiten 1995; McKay 1997b; MRC Multicentre Trial 1977; Nordback 2001; Olah 2007; Paran 1995; Pederzoli 1993b; Sateesh 2009; Valderrama 1992; Wang 2013c; Xue 2009; Yang 2012). The remaining trials were at unclear risk of attrition bias.
Selective reporting
Forty‐nine trials were at low risk of selective reporting bias (Abraham 2013; Balldin 1983; Bansal 2011; Barreda 2009; Berling 1994; Besselink 2008; Buchler 1993; Chen 2000; Choi 1989; Debas 1980; Delcenserie 1996; Delcenserie 2001; Dellinger 2007; Finch 1976; Freise 1986; Frulloni 1994; Garcia‐Barrasa 2009; Gilsanz 1978; Gjørup 1992; Goebell 1979; Goebell 1988; Guo 2015; Hejtmankova 2003; Imrie 1978; Johnson 2001; Kalima 1980; Kirsch 1978; Luiten 1995; McKay 1997a; Nordback 2001; Paran 1995; Pederzoli 1993a; Pederzoli 1993b; Poropat 2015; Rokke 2007; Sainio 1995; Sateesh 2009; Siriwardena 2007; Spicak 2002; Spicak 2003; Tykka 1985; Uhl 1999; Valderrama 1992; Vege 2015; Wang 2013a; Wang 2013c; Wang 2016; Xia 2014; Xue 2009). The remaining trials were at high or unclear risk of reporting bias.
Other potential sources of bias
Source of funding bias: seven trials were at low risk of due to source of funding (Bansal 2011; Garcia‐Barrasa 2009; Wang 2013a; Wang 2013c; Wang 2016; Xue 2009; Yang 2012). Twenty‐one trials were at high risk of bias due to source of funding (Balldin 1983; Berling 1994; Besselink 2008; Dellinger 2007; Ebbehøj 1985; Hansky 1969; Imrie 1978; Isenmann 2004; Johnson 2001; Kingsnorth 1995; McKay 1997b; Moreau 1986; MRC Multicentre Trial 1977; Pettila 2010; Rokke 2007; Sharma 2011; Siriwardena 2007; Trapnell 1974; Tykka 1985; Uhl 1999; Valderrama 1992). The remaining trials were at unclear risk of bias due to the source of funding.
No other bias was noted in any of the trials.
Effects of interventions
See: Summary of findings for the main comparison Summary of findings (mortality); Summary of findings 2 Summary of findings (other primary outcomes)
Primary outcomes
Mortality
Short‐term mortality
A total of 67 studies (N = 6638) reported short‐term mortality (Abraham 2013; Balldin 1983; Bansal 2011; Barreda 2009; Berling 1994; Besselink 2008; Buchler 1993; Chen 2000; Choi 1989; Debas 1980; Delcenserie 1996; Delcenserie 2001; Dellinger 2007; Dürr 1978; Finch 1976; Freise 1986; Frulloni 1994; Garcia‐Barrasa 2009; Gjørup 1992; Goebell 1979; Goebell 1988; Grupo Español 1996; Guo 2015; Hansky 1969; Hejtmankova 2003; Imrie 1978; Imrie 1980; Johnson 2001; Kalima 1980; Kingsnorth 1995; Kirsch 1978; Kronborg 1980; Llukacaj 2012; Luengo 1994; Luiten 1995; Martinez 1984; McKay 1997a; McKay 1997b; MRC Multicentre Trial 1977; Nordback 2001; Olah 2007; Paran 1995; Pederzoli 1993a; Pederzoli 1993b; Perezdeoteyza 1980; Pettila 2010; Poropat 2015; Rokke 2007; Sainio 1995; Sateesh 2009; Siriwardena 2007; Spicak 2002; Spicak 2003; Storck 1968; Trapnell 1974; Tykka 1985; Uhl 1999; Usadel 1985; Valderrama 1992; Vege 2015; Wang 2011; Wang 2013a; Wang 2013c; Wang 2016; Xia 2014; Xue 2009; Yang 2012). There was no evidence of difference in any of the comparisons (Analysis 1.1).
Long‐term mortality (maximum follow‐up)
Only one study (N = 62) reported mortality beyond six months (Gilsanz 1978). There was no evidence of difference in the only comparison possible.
Serious adverse events
A total of 17 studies (N = 1139) reported serious adverse events as a proportion or participants who experienced at least one serious adverse event (i.e. each person with a serious adverse event will be counted only once regardless of the number of serious adverse events that the person develops) (Bansal 2011; Chen 2002a; Debas 1980; Delcenserie 1996; Dellinger 2007; Freise 1986; Frulloni 1994; Garcia‐Barrasa 2009; Gjørup 1992; Goebell 1988; Kalima 1980; Llukacaj 2012; McKay 1997a; Sainio 1995; Siriwardena 2007; Tykka 1985; Yang 1999). There was no evidence of difference in any of the comparisons (Analysis 1.2).
A total of 37 studies (N = 3804) reported the number of serious adverse events observed in all participants (i.e. if a person develops more than one serious adverse event, the number of serious adverse events that the person develops is included) (Balldin 1983; Bansal 2011; Barreda 2009; Berling 1994; Besselink 2008; Buchler 1993; Chen 2000; Choi 1989; Debas 1980; Delcenserie 1996; Delcenserie 2001; Garcia‐Barrasa 2009; Gjørup 1992; Guo 2015; Imrie 1978; Isenmann 2004; Johnson 2001; Kirsch 1978; McKay 1997a; Nordback 2001; Olah 2007; Paran 1995; Pederzoli 1993a; Poropat 2015; Sainio 1995; Sillero 1981; Spicak 2002; Spicak 2003; Tykka 1985; Uhl 1999; Valderrama 1992; Vege 2015; Wang 2013a; Wang 2013c; Xia 2014; Xue 2009; Zhu 2014). There were fewer serious adverse events in participants receiving lexipafant (rate ratio 0.67, 95% CI 0.46 to 0.96; participants = 290; studies = 1), octreotide (rate ratio 0.74, 95% CI 0.60 to 0.89; participants = 770; studies = 5), somatostatin plus omeprazole (rate ratio 0.36, 95% CI 0.19 to 0.70; participants = 140; studies = 1), and somatostatin plus ulinastatin (rate ratio 0.30, 95% CI 0.15 to 0.60; participants = 122; studies = 1) than control. There were also fewer serious adverse events in participants taking octreotide plus ulinastatin compared to octreotide (rate ratio 0.30, 95% CI 0.17 to 0.51; participants = 120; studies = 1) and in participants taking somatostatin plus ulinastatin versus somatostatin (rate ratio 0.28, 95% CI 0.15 to 0.56; participants = 123; studies = 1). There was no evidence of difference in the remaining comparisons (Analysis 1.3).
Organ failure
A total of 18 studies (N = 2220) reported organ failure (Abraham 2013; Bansal 2011; Besselink 2008; Delcenserie 1996; Freise 1986; Garcia‐Barrasa 2009; Johnson 2001; McKay 1997a; McKay 1997b; Olah 2007; Pederzoli 1993a; Poropat 2015; Rokke 2007; Sateesh 2009; Siriwardena 2007; Vege 2015; Wang 2013c; Wang 2016). The proportion of people with organ failure was lower in the octreotide group than in control (OR 0.51, 95% CI 0.27 to 0.97; participants = 430; studies = 3). There was no evidence of difference in any of the remaining comparisons (Analysis 1.4).
Infected pancreatic necrosis
A total of 15 studies (N = 1173) reported infected pancreatic necrosis (Barreda 2009; Besselink 2008; Delcenserie 1996; Dellinger 2007; Garcia‐Barrasa 2009; Isenmann 2004; Llukacaj 2012; McKay 1997a; Olah 2007; Pederzoli 1993a; Poropat 2015; Rokke 2007; Spicak 2002; Spicak 2003; Zhu 2014). As shown in Analysis 1.5, there was no evidence of difference in any of the comparisons.
Sepsis
A total of 11 studies (N = 1350) reported sepsis (Balldin 1983; Berling 1994; Buchler 1993; Freise 1986; Frulloni 1994; Johnson 2001; Olah 2007; Paran 1995; Sainio 1995; Uhl 1999; Valderrama 1992). The proportion of people with sepsis was lower in those receiving lexipafant compared to control (OR 0.26, 95% CI 0.08 to 0.83; participants = 290; studies = 1). There was no evidence of difference in any of the remaining comparisons (Analysis 1.6).
Health‐related quality of life
None of the trials reported health‐related quality of life at any time point.
Secondary outcomes
Adverse events
A total of 27 studies (N = 2807) reported adverse events as a proportion or participants who experienced at least one adverse event (i.e. each person with an adverse event will be counted only once regardless of the number of adverse events that the person develops) (Bansal 2011; Buchler 1993; Chen 2002a; Chen 2002b; Debas 1980; Dellinger 2007; Finch 1976; Freise 1986; Frulloni 1994; Gjørup 1992; Goebell 1979; Kalima 1980; Kingsnorth 1995; Llukacaj 2012; McKay 1997a; Nordback 2001; Olah 2007; Paran 1995; Pederzoli 1993b; Rokke 2007; Sainio 1995; Tykka 1985; Uhl 1999; Valderrama 1992; Wang 2016; Xia 2014; Yang 1999). This proportion was lower in those receiving antibiotics (OR 0.51, 95% CI 0.32 to 0.80; participants = 429; studies = 6) and somatostatin plus omeprazole (OR 0.00, 95% CI 0.00 to 0.04; participants = 140; studies = 1) compared to control. There was no evidence of difference in the remaining comparisons (Analysis 1.7).
A total of 40 studies (N = 3894) reported the number of adverse events observed in all participants (i.e. if a person develops more than one adverse event, the number of adverse events that the person develops is included) (Abraham 2013; Balldin 1983; Bansal 2011; Barreda 2009; Berling 1994; Besselink 2008; Buchler 1993; Chen 2000; Choi 1989; Debas 1980; Garcia‐Barrasa 2009; Gilsanz 1978; Gjørup 1992; Goebell 1979; Guo 2015; Hejtmankova 2003; Imrie 1978; Isenmann 2004; Johnson 2001; Kirsch 1978; Kronborg 1980; Luiten 1995; McKay 1997a; Nordback 2001; Olah 2007; Paran 1995; Pederzoli 1993a; Pederzoli 1993b; Poropat 2015; Sainio 1995; Sateesh 2009; Sillero 1981; Spicak 2002; Spicak 2003; Tykka 1985; Uhl 1999; Valderrama 1992; Wang 2013c; Xue 2009; Zhu 2014). Compared to control, there were fewer adverse events in participants receiving antibiotics (rate ratio 0.75, 95% CI 0.58 to 0.95; participants = 755; studies = 12), gabexate (rate ratio 0.76, 95% CI 0.61 to 0.95; participants = 375; studies = 3), and lexipafant (rate ratio 0.61, 95% CI 0.44 to 0.85; participants = 290; studies = 1). There were also fewer adverse events for the octreotide plus ulinastatin group versus ulinastatin alone (rate ratio 0.29, 95% CI 0.17 to 0.48; participants = 120; studies = 1). There was no evidence of difference in any of the remaining comparisons (Analysis 1.8).
Measures of decreased complication or earlier recovery
Length of hospital stay
Forty‐four trials (N = 4405) reported the length of hospital stay (Abraham 2013; Balldin 1983; Bansal 2011; Barreda 2009; Berling 1994; Besselink 2008; Bredkjaer 1988; Buchler 1993; Debas 1980; Delcenserie 1996; Dürr 1978; Ebbehøj 1985; Finch 1976; Garcia‐Barrasa 2009; Gjørup 1992; Goebell 1979; Guo 2015; Hansky 1969; Hejtmankova 2003; Isenmann 2004; Johnson 2001; Luengo 1994; Luiten 1995; Martinez 1984; McKay 1997a; McKay 1997b; Ohair 1993; Olah 2007; Paran 1995; Pettila 2010; Rokke 2007; Sainio 1995; Sateesh 2009; Sharma 2011; Siriwardena 2007; Spicak 2002; Spicak 2003; Uhl 1999; Vege 2015; Wang 2011; Wang 2013c; Wang 2016; Xue 2009; Yang 2012). Since most trials did not report the mean and standard deviation, we reported this outcome in Table 3. As seen in the table, none of the interventions consistently decreased length of hospital stay.
| Study name | Intervention | Comparator | Number of participants in intervention | Number of participants in control | Mean or median (standard deviation or interquartile range, if reported) hospital stay in intervention group | Mean or median (standard deviation or interquartile range, if reported) hospital stay in control group | Difference | Statistical significance (P‐value if reported) |
| Antibiotics | No active intervention | 24 | 34 | 54 | 45 | 9 | Not significant | |
| Antibiotics | No active intervention | 11 | 12 | 27.8 | 22 | 5.8 | Not significant | |
| Antibiotics | No active intervention | 31 | 27 | 10.4 | 11.3 | −0.9 | Not significant | |
| Antibiotics | Placebo | 22 | 19 | 21 | 19 | 2 | Not significant (0.80) | |
| Antibiotics | No active intervention | 20 | 21 | 18 (7.2) | 25 (14.8) | −7 | Not significant | |
| Antibiotics | Placebo | 58 | 56 | 21 | 18 | 3 | Not significant | |
| Antibiotics | No active intervention | 50 | 52 | 30 | 32 | −2 | Not significant | |
| Antibiotics | No active intervention | 36 | 37 | 18 | 22 | −4 | Not significant (0.32) | |
| Antibiotics | No active intervention | 30 | 30 | 33.2 (22.1) | 43.8 (43.1) | −10.6 | Not significant (0.24) | |
| Antibiotics | No active intervention | 33 | 30 | 18.9 (8.1) | 23.8 (19.3) | −4.9 | Not significant | |
| Antibiotics | No active intervention | 20 | 21 | 18 (7.2) | 25 (14.8) | −7 | Not significant | |
| Antibiotics | No active intervention | 29 | 27 | 28.3 | 30.7 | −2.4 | Not significant | |
| Antioxidants | No active intervention | 19 | 20 | 12.8 | 15.1 | −2.3 | Not significant | |
| Antioxidants | No active intervention | 23 | 30 | 7.2 (5) | 10.3 (7) | −3.1 | Not significant (0.07) | |
| Antioxidants | Placebo | 22 | 21 | 20.4 (24.4) | 14.3 (15.7) | 6.1 | Not significant (0.34) | |
| Antioxidants | Placebo | 14 | 14 | 3 | 5 | −2 | Not significant (0.06) | |
| Aprotinin | No active intervention | 26 | 29 | 17.3 | 16.5 | 0.8 | Not significant | |
| Aprotinin | No active intervention | 22 | 26 | 25 (15‐32) | 33 (17‐38) | −8 | Not significant (0.24) | |
| Calcitonin | Placebo | 50 | 44 | 18.3 (6.4) | 20.2 (7.5) | −1.9 | Not significant | |
| Calcitonin | Placebo | 14 | 17 | 24 (20.2) | 30 (21.7) | −6 | Not significant | |
| Gabexate | Placebo | 115 | 108 | 26 (20‐43) | 23 (28‐34) | 3 | Not significant | |
| Glucagon | Placebo | 33 | 33 | 26 (28.7) | 20 (19.2) | 6 | Not significant | |
| Glucagon | Placebo | 33 | 36 | 32.6 | 26.9 | 5.7 | Not significant | |
| Iniprol | No active intervention | 15 | 9 | 14.7 (9.3) | 18.7 (10.2) | −4 | Not significant | |
| Lexipafant | Placebo | 151 | 139 | 9 | 10 | −1 | Not significant | |
| Lexipafant | Placebo | 26 | 24 | 13.3 | 14.9 | −1.6 | Not significant | |
| NSAID | Placebo | 27 | 30 | 9 | 10 | −1 | Not significant | |
| NSAID | Placebo | 14 | 16 | 13 | 15 | −2 | Not significant | |
| Octreotide | Placebo | 28 | 30 | 10 | 10 | 0 | Not significant | |
| Octreotide | Placebo | 90 | 90 | 7.3 | 8.2 | −0.9 | Not significant | |
| Octreotide | No active intervention | 19 | 19 | 17.9 (13.2) | 34.1 (22.7) | −16.2 | Significant (0.02) | |
| Octreotide | Placebo | 199 | 103 | 21.5 | 21 | 0.5 | Not significant | |
| (mild acute pancreatitis) | Octreotide | No active intervention | 157 | 79 | 14.4 | 15.37 | −0.97 | Not significant |
| (severe acute pancreatitis) | Octreotide | No active intervention | 91 | 45 | 16 | 16 | 0 | Not significant |
| Octreotide | No active intervention | 80 | 77 | 7.4 (2) | 11.8 (4) | −4.4 | Significant | |
| Probiotics | Placebo | 152 | 144 | 28.9 (41.5) | 23.5 (25.9) | 5.4 | Not significant (0.98) | |
| Probiotics | No active intervention | 33 | 29 | 14.9 | 19.7 | −4.8 | Not significant | |
| Probiotics | Placebo | 24 | 26 | 13.23 (18.19) | 9.69 (9.69) | 3.54 | Not significant (0.76) | |
| Activated protein C | Placebo | 16 | 16 | 17.1 | 34.4 | −17.3 | Significant (P < 0.05) | |
| Somatostatin | Placebo | 33 | 30 | 12 | 10 | 2 | Not significant | |
| Somatostatin | No active intervention | 50 | 50 | 14.92 (11.46) | 20.28 (15) | −5.36 | Significant | |
| Thymosin | Placebo | 12 | 12 | 37.1 (22.7) | 60.6 (32.9) | −23.5 | Not significant (0.06) | |
| (mild acute pancreatitis) | Ulinastatin | Placebo | 30 | 32 | 7 (5‐22) | 8 (5‐15) | −1 | Not significant (0.07) |
| (severe acute pancreatitis) | Ulinastatin | Placebo | 35 | 32 | 9 (6‐22) | 10 (6‐22) | −1 | Not significant (0.21) |
| Octerotide plus ulinastatin | Octreotide | 60 | 60 | 11.8 (3.9) | 23.7 (16.3) | −11.9 | Significant | |
| Somatostatin plus ulinastatin plus gabexate | Somatostatin | 116 | 122 | 17.7 (32.1) | 31.3 (37.6) | ‐13.6 | Significant | |
| Somatostatin plus ulinastatin | Somatostatin | 124 | 122 | 22.6 (34.5) | 31.3 (37.6) | ‐8.7 | Significant | |
| Somatostatin plus gabexate | Somatostatin | 130 | 122 | 23.2 (29.6) | 31.3 (37.6) | ‐8.1 | Significant | |
| Somatostatin plus ulinastatin plus gabexate | Somatostatin plus gabexate | 116 | 130 | 17.7 (32.1) | 23.2 (29.6) | −5.5 | Significant | |
| Somatostatin plus ulinastatin | Somatostatin plus gabexate | 124 | 130 | 22.6 (34.5) | 23.2 (29.6) | −0.6 | Significant | |
| Somatostatin plus ulinastatin plus gabexate | Somatostatin plus ulinastatin | 116 | 124 | 17.7 (32.1) | 22.6 (34.5) | −4.9 | Significant |
NSAID: non‐steroidal anti‐inflammatory drug.
Length of intensive care unit stay
Thirteen trials (N = 1188) reported the length of intensive care unit (ICU) stay (Berling 1994; Besselink 2008; Garcia‐Barrasa 2009; Isenmann 2004; Johnson 2001; Nordback 2001; Rokke 2007; Sainio 1995; Sharma 2011; Siriwardena 2007; Spicak 2002; Vege 2015; Wang 2011). Since most trials did not report the mean and standard deviation, we reported the ICU stay in Table 4. As seen in the table, none of the interventions consistently decreased length of ICU stay.
| Study name | Intervention | Control | Number of participants in intervention | Number of participants in control | Mean or median (standard deviation or interquartile range, if reported) intensive care stay in intervention group | Mean or median (standard deviation or interquartile range, if reported) intensive care stay in control group | Difference | Statistical significance (P‐value, reported) |
| Antibiotics | Placebo | 22 | 19 | 17 | 18 | ‐1 | Not significant (P‐value = 0.83) | |
| Antibiotics | Placebo | 58 | 56 | 8 | 6 | 2 | Not significant | |
| Antibiotics | Placebo | 25 | 33 | 8 | 8 | 0 | Not significant | |
| Antibiotics | No active intervention | 36 | 37 | 8 | 7 | 1 | Not significant (P‐value = 0.78) | |
| Antibiotics | No active intervention | 30 | 30 | 12.7 (10.7) | 23.6 (28.7) | ‐10.9 | Not significant (P‐value = 0.06) | |
| Antibiotics | No active intervention | 33 | 30 | 11.4 (5.4) | 15.9 (12) | ‐4.5 | Not significant | |
| Antioxidants | Placebo | 22 | 21 | 4 (10.3) | 0 (0) | 4 | Not significant (P‐value = 0.08) | |
| Antioxidants | Placebo | 14 | 14 | 0 | 0 | 0 | Significant (P‐value = 0.03) | |
| Aprotinin | No active intervention | 22 | 26 | 9.5 (4 ‐ 10) | 12 (3‐20) | ‐2.5 | Not significant (P‐value = 0.47) | |
| Lexipafant | Placebo | 151 | 139 | 9.5 | 11 | ‐1.5 | Not significant | |
| Probiotics | Placebo | 152 | 144 | 6.6 (17.1) | 3 (9.3) | 3.6 | Not significant (P‐value = 0.08) | |
| Probiotics | Placebo | 24 | 26 | 4.94 (9.54) | 4 (5.86) | 0.94 | Not significant (P‐value = 0.94) | |
| Thymosin | Placebo | 12 | 12 | 24.6 (19.6) | 50.5 (25.7) | ‐25.9 | Significant (P‐value = 0.01) |
Requirement for additional invasive intervention
A total of 32 studies (N = 3495) reported requirement for additional invasive intervention (Barreda 2009; Berling 1994; Besselink 2008; Buchler 1993; Chen 2000; Delcenserie 1996; Dürr 1978; Garcia‐Barrasa 2009; Gilsanz 1978; Goebell 1979; Goebell 1988; Hejtmankova 2003; Isenmann 2004; Llukacaj 2012; Luengo 1994; Luiten 1995; Martinez 1984; MRC Multicentre Trial 1977; Nordback 2001; Ohair 1993; Olah 2007; Pederzoli 1993a; Pederzoli 1993b; Rokke 2007; Sainio 1995; Sillero 1981; Spicak 2002; Spicak 2003; Tykka 1985; Uhl 1999; Wang 2013c; Xue 2009). The proportion of people who needed an additional invasive intervention was lower in the gabexate group compared to control (OR 0.58, 95% CI 0.37 to 0.90; participants = 426; studies = 3). There was no evidence of difference in any of the remaining comparisons (Analysis 1.9).
Endoscopic or radiological drainage of collections
Three studies (N = 436) reported endoscopic or radiological drainage of collections (Delcenserie 1996; Wang 2013c; Zhu 2014). As shown in Analysis 1.10, there was no evidence of difference in any of the comparisons.
Time to return to normal activity
None of the trials reported this outcome.
Time to work
None of the trials reported this outcome.
Costs
None of the trials reported this outcome.
Subgroup analysis
Because of the paucity of data, we could only analyse a subgroup of acute necrotising pancreatitis and severe acute pancreatitis participants.
Acute necrotising pancreatitis
There was no evidence of difference in any of the outcomes (Analysis 2.1; Analysis 2.2; Analysis 2.3; Analysis 2.4; Analysis 2.5; Analysis 2.6).
Severe acute pancreatitis
Short‐term mortality was lower in the gabexate group versus control (OR 0.19, 95% CI 0.04 to 0.99; participants = 52; studies = 1) (Analysis 3.1)
There was no evidence of difference in the proportion of participants experiencing serious adverse events in any of the comparisons (Analysis 3.2). The number of serious adverse events was lower in the somatostatin plus omeprazole group (rate ratio 0.36, 95% CI 0.19 to 0.70; participants = 140; studies = 1) and the somatostatin plus ulinastatin group (rate ratio 0.30, 95% CI 0.15 to 0.60; participants = 122; studies = 1) compared to control. There were also fewer serious adverse events in the somatostatin plus ulinastatin group versus somatostatin alone (rate ratio 0.28, 95% CI 0.15 to 0.56; participants = 123; studies = 1). There was no evidence of differences in other comparisons (Analysis 3.3). Organ failure was lower in the ulinastatin group than in control (OR 0.05, 95% CI 0.01 to 0.21; participants = 67; studies = 1). There was no evidence of differences between other comparisons (Analysis 3.4). There was no evidence of differences in infected pancreatic necrosis or sepsis in any of the comparisons (Analysis 3.5; Analysis 3.6).
Readers should keep in mind that all the comparisons in which there was evidence of difference are based on single trials at high risk of bias and with small sample size (i.e. random errors).
Sensitivity analysis
All the trials except one were at unclear or high risk of bias in one or more domains (Wang 2016). Since most trials reported median rather than mean for length of hospital stay and length of ICU stay, we did not perform a meta‐analysis by imputing mean and standard deviation. So, we did not perform a sensitivity analysis excluding trials in which either the mean or the standard deviation or both were imputed. We did not perform a sensitivity analysis imputing missing data based on different scenarios since the details of the postrandomisation dropouts were not available from the different trials in which there were postrandomisation dropouts.
Quality of evidence
Most of the comparisons in all the outcomes had low or very low quality evidence because of the risk of bias in the trials (downgraded by one level), imprecision (small sample size (downgraded by one level), and/or overlap of confidence intervals with clinically insignificant effect or no effect (downgraded by one level). There was evidence of heterogeneity in some of the outcomes, which resulted in further downgrading by one level for some comparisons.
Reporting bias
We evaluated the reporting bias for short‐term mortality, serious adverse events (number), infected pancreatic necrosis, adverse events (number), and the requirement for additional intervention for antibiotics versus control, the only comparisons with at least 10 trials. There was no evidence of reporting bias either on visual inspection or by Egger's test for the short‐term mortality, infected pancreatic necrosis, and requirement for additional intervention (Figure 4, P = 0.88; Figure 5, P = 0.74; and Figure 6, P = 0.98, respectively). There was evidence of reporting bias both on visual inspection and by Egger's test for number of serious adverse events (Figure 7; P = 0.021). There was evidence of reporting bias on visual inspection but not by Egger's test for number of adverse events (Figure 8; P = 0.079).

Funnel plot of short‐term mortality indicating no evidence of reporting bias.
Funnel plot of infected pancreatic necrosis indicating no evidence of reporting bias.
Funnel plot of requirement for additional invasive intervention indicating no evidence of reporting bias.
Funnel plot of serious adverse events (number) indicating that trials with lower precision favoured antibiotics without matching trials with lower precision which showed no effect or favouring control.
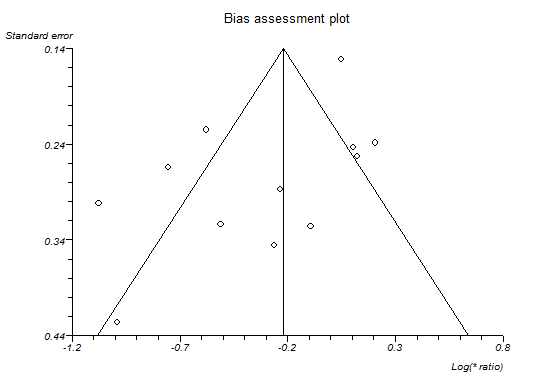
Funnel plot of adverse events (number) indicating that trials with lower precision favoured antibiotics while trials with greater precision favoured control.
Discussion
Summary of main results
A total of 7366 participants in 78 trials contributed to one or more outcomes for this review. The treatments assessed in these 78 trials included antibiotics, antioxidants, aprotinin, atropine, calcitonin, cimetidine, EDTA, gabexate, glucagon, iniprol, lexipafant, NSAID, octreotide, oxyphenonium, probiotics, activated protein C, somatostatin, somatostatin plus omeprazole, somatostatin plus ulinastatin, thymosin, ulinastatin, and inactive control.
Despite the number of trials included, network meta‐analysis was not performed because of major concerns about the transitivity assumption, that is, whether all participants in the network were sufficiently similar and therefore had an equal chance of receiving any of the treatments in the network . In particular, we highlight the fact that a total of 18 trials were included in the comparison under antibiotics versus inactive control (Delcenserie 1996; Delcenserie 2001; Dellinger 2007; Finch 1976; Garcia‐Barrasa 2009; Hejtmankova 2003; Isenmann 2004; Llukacaj 2012; Luiten 1995; Nordback 2001; Pederzoli 1993a; Poropat 2015; Rokke 2007; Sainio 1995; Spicak 2002; Spicak 2003; Xue 2009). Ten of these trials included only participants with acute necrotising pancreatitis (Barreda 2009; Delcenserie 2001; Dellinger 2007; Garcia‐Barrasa 2009; Llukacaj 2012Nordback 2001; Pederzoli 1993a; Rokke 2007; Sainio 1995; Xue 2009). Just two other trials that included only participants with acute necrotising pancreatitis were featured in all the other comparisons put together (Chen 2002b; Frulloni 1994). Thus, there is some clinical heterogeneity in the type of participants that were included in the different comparisons. As a result, we performed direct comparison only.
There was no evidence of difference in short‐term mortality between the groups in any of the comparisons. However, the confidence intervals were wide and consistent with significant benefits or harms of interventions. Because of the number of outcomes reported in the different trials, it is reasonable to expect that the beneficial effect is consistent across clinical outcomes. Interventions with at least two clinical benefits were: lexipafant, which was associated with fewer adverse events (and severe adverse events) and a lower proportion of people with sepsis; octreotide, which was associated with fewer serious adverse events and a lower proportion of people with organ failure; and gabexate, which was associated with fewer adverse events and a lower proportion of people requiring an additional invasive intervention compared to inactive intervention. However, because of the number of analyses performed ('Potential biases in the review process'), concerns about the availability of the drug ('Overall completeness and applicability of evidence'), and the quality of evidence ('Quality of the evidence'), further trials are required before recommending any of the interventions routinely.
Only one trial reported mortality beyond six months (Gilsanz 1978). The follow‐up in the remaining trials was three months in six trials (Besselink 2008; Buchler 1993; Chen 2000; Frulloni 1994; Goebell 1988; Pederzoli 1993b), while in the rest it was less than six weeks. A three‐month follow‐up would identify all the complications related to acute pancreatitis and most deaths related to these complications. However, a period less than three months is likely to miss a considerable proportion. None of the trials reported health‐related quality of life, costs, or other important socioeconomic measures such as return to work. Health‐related quality of life continues to improve between three months and one year after necrotising pancreatitis, although some impairment in quality of life may remain beyond then (Wright 2009). The quality of life after acute severe pancreatitis also appears to be impaired even several years after the acute pancreatitis episode (Hochman 2006; Pendharkar 2014). Future trials on acute pancreatitis should assess the health‐related quality of life for at least 3 months to 12 months and report socioeconomic measures so that it is possible to understand whether the treatments are cost‐effective.
We can only speculate on why no intervention showed any consistent benefit. One possible reason is that the trials were not powered to measure differences in short‐term mortality. The short‐term mortality in the inactive control group was 12% overall and 17.4% (102/586) in the subgroup of acute severe pancreatitis. To measure a 20% relative risk reduction in short‐term mortality using an alpha error of 5% and a beta error of 20%, 3422 participants are required. Clearly, the trials included only a small proportion of the required sample size, so the lack of evidence of difference may be due to random error. The complications related to mild pancreatitis are very infrequent, which means that an even greater sample size than 3422 is required to demonstrate a difference in clinical benefits. On the other hand, if the interventions are targeted against patients with severe pancreatitis, then it can take several hours or even days for the full picture of severe acute pancreatitis to develop. By this time, the damage may be too much for any treatment (other than supportive treatment including organ support) to make a difference. Several prognostic indexes exist for predicting whether the pancreatitis is mild or severe before the clinical picture fully emerges. However, these indexes have a modest sensitivity and specificity in predicting severe acute pancreatitis (Gao 2015a), so it may be reasonable to administer the treatment in all patients with acute pancreatitis and accept that only a proportion will benefit. The proportion of patients with severe pancreatitis in trials that included both mild and severe acute pancreatitis in this review ranged between 17% and 87% (median 35%). The sample size of the trial may have to be estimated on the basis that only the subgroup of severe acute pancreatitis will benefit. It is unlikely that trials powered to measure differences in mortality can be conducted in patients with acute pancreatitis. Using outcomes such as health‐related quality of life or clinically significant complications may allow clinically meaningful trials to be conducted in this population.
Overall completeness and applicability of evidence
This review included all pharmacological interventions without restriction by the year of publication of the trials or whether the drugs are currently licensed. The European Agency for the Evaluation of Medicinal Products (EMEA) had refused marketing authorisation for lexipafant in 1998 after reviewing the data submitted by the company (WHO 2001). Some of the reasons for this refusal included concerns about not having a functional independent data monitoring committee to monitor the results and allegations of financial misconduct by the company that manufactured lexipafant (Hampton 2000; Masood 1998).
Apart from the trials comparing antibiotics versus control, most of the remaining trials did not clearly state whether they included participants with necrotising pancreatitis. So, it is not clear whether this evidence is applicable to patients with acute necrotising pancreatitis. Most trials included a totality or at least a significant proportion of participants with severe acute pancreatitis, so the results of the review are applicable to patients with severe acute pancreatitis in addition to those with mild acute pancreatitis.
This review is only about pharmacological interventions for acute pancreatitis. We have not included any nutritional interventions or interventions on fluid management in this review. We are unable to comment on whether any of the above are effective in the treatment of acute pancreatitis based on the results of this review. We have only reviewed treatment of acute pancreatitis and not prophylaxis. Thus, our review is applicable only in people with acute pancreatitis.
Quality of the evidence
We assessed the quality of the evidence formally only for short‐term mortality, probably the most important outcome for patients with acute pancreatitis. This was low for most of the comparisons. The reason for this is that the risk of bias was unclear or high and because the results were imprecise. Overall, there was not much heterogeneity within each comparison or across comparisons as demonstrated by the I² and Chi² values within comparisons. There was no evidence of publication bias in the one comparison we could assess for short‐term mortality (antibiotics versus control). However, there was evidence of publication bias in serious adverse events (number).There was no indirectness in the short‐term mortality because of the nature of the outcome.
Although we did not undertake a formal assessment of the quality of evidence for the remaining outcomes, the quality of evidence is similarly low because of the issues discussed above, or possibly even lower (i.e. very low) because of having a smaller overall sample size. In addition, there appeared to be reporting bias for the number of both serious adverse events and all adverse events for the comparison antibiotics versus control, although Egger's test was statistically significant only for the number of serious adverse events.
Potential biases in the review process
We followed the Cochrane Handbook for Systematic Reviews of Interventions for the conduct of the direct comparison of the review. Two review authors selected studies and extracted data, reducing the errors in data collection. We used formal search strategies to identify the trials. While the likelihood of missing trials from the identified references was low, the review included the time frame before the mandatory trial registration era, and it was possible that some trials were not reported in journals because of their results. However, one has to be pragmatic and accept that this is the best level of evidence that is currently available.
Network meta‐analysis has its advantages in combining direct and indirect evidence (resulting in more precise evidence); however, when providing effect estimates in the absence of direct comparison and calculating the probability that an intervention is the best treatment, one has to be wary about the transitivity assumption (i.e. whether similar participants were included in the trials across all the comparisons and thus had an equal chance of being randomised to each treatment). As mentioned above, there is some clinical heterogeneity in the type of participants who were included in 'antibiotics versus control' (a high proportion of trials included only participants with acute necrotising pancreatitis) compared to other comparisons (only a very low proportion of trials included only participants with acute necrotising pancreatitis). In the presence of such heterogeneity, it is not appropriate to conduct a network meta‐analysis. In addition to the differences in the presence or absence of necrotising pancreatitis, the type of participants included in the trials were also different in terms of the severity of pancreatitis. We are not able to assess this fully since the definitions used in the trials were not the current definition of severe acute pancreatitis. So, there is likely to be heterogeneity in the type of participants included in the trials. In addition to the clinical heterogeneity in the type of participants included, there were variations in the treatments used in the trials; the definitions used for the different outcomes were not clear or were different in different trials. We did not find any systematic differences in the definitions used for specific comparisons; nevertheless, the lack of uniform definitions used in the trials along with other heterogeneity mentioned above is another potential bias in this review.
We included a number of outcomes to assess effectiveness. Although the outcomes are clinically significant, the outcomes reported in different trials were different. While we found evidence of reporting bias only in a few outcomes where it was possible to formally assess the reporting bias by funnel plots, there is a significant possibility that the outcomes reported in the trials were based on the results of the outcome. Examining a lot of outcomes can also lead to false positives because of multiplicity issues. However, we have decreased the impact of this by focusing on the most important outcome in acute pancreatitis, that is, mortality.
We were not able to obtain full texts for two references (Hansen 1966; Perez 1980). From the title, it appears that Perez 1980 was an abstract of an included trial (Perezdeoteyza 1980). The second reference was published 50 years ago and may or may not be a randomised controlled trial (Hansen 1966), but even if it were, it is unlikely to alter our conclusions.
Agreements and disagreements with other studies or reviews
This is the first attempted network meta‐analysis on this topic. We agree with Villatoro 2010 and Jiang 2012 in that there is no evidence that antibiotics decrease mortality or infected pancreatic necrosis in patients with acute pancreatitis.
Of the systematic reviews on other interventions, we agree with Xu 2013 that octreotide does not appear to be beneficial in major clinical outcomes related to acute pancreatitis and with Messori 1995 that gabexate might decrease the complications without affecting mortality. We disagree with Andriulli 1998 that somatostatin and octreotide decrease mortality. The differences in conclusions between Andriulli 1998 and this review may be due to the inclusion of non‐randomised studies and the publication of new trials subsequent to the conduct of the systematic review.
Risk of bias graph: review authors' judgements about each risk of bias item presented as percentages across all included studies.
Risk of bias summary: review authors' judgements about each risk of bias item for each included study.
Funnel plot of short‐term mortality indicating no evidence of reporting bias.
Funnel plot of infected pancreatic necrosis indicating no evidence of reporting bias.
Funnel plot of requirement for additional invasive intervention indicating no evidence of reporting bias.
Funnel plot of serious adverse events (number) indicating that trials with lower precision favoured antibiotics without matching trials with lower precision which showed no effect or favouring control.
Funnel plot of adverse events (number) indicating that trials with lower precision favoured antibiotics while trials with greater precision favoured control.

Network plot showing the treatment comparisons that included short‐term mortality. The circles represent treatments while the lines represent the comparisons between the treatments.
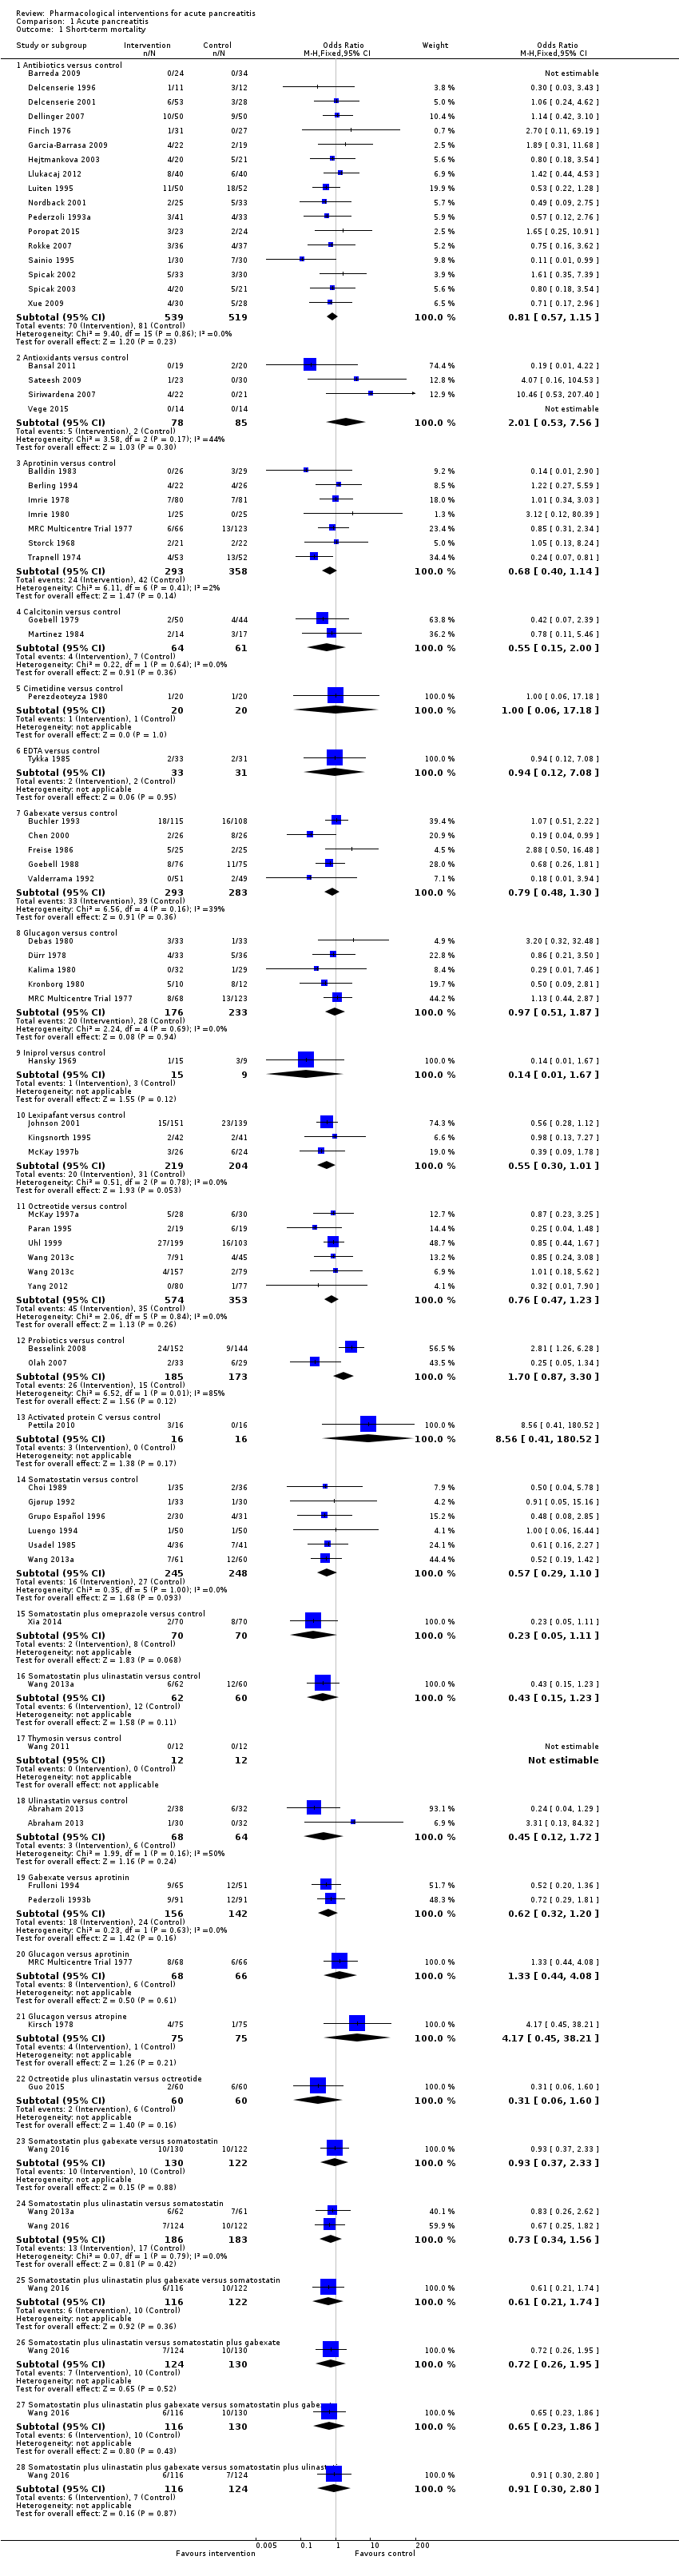
Comparison 1 Acute pancreatitis, Outcome 1 Short‐term mortality.
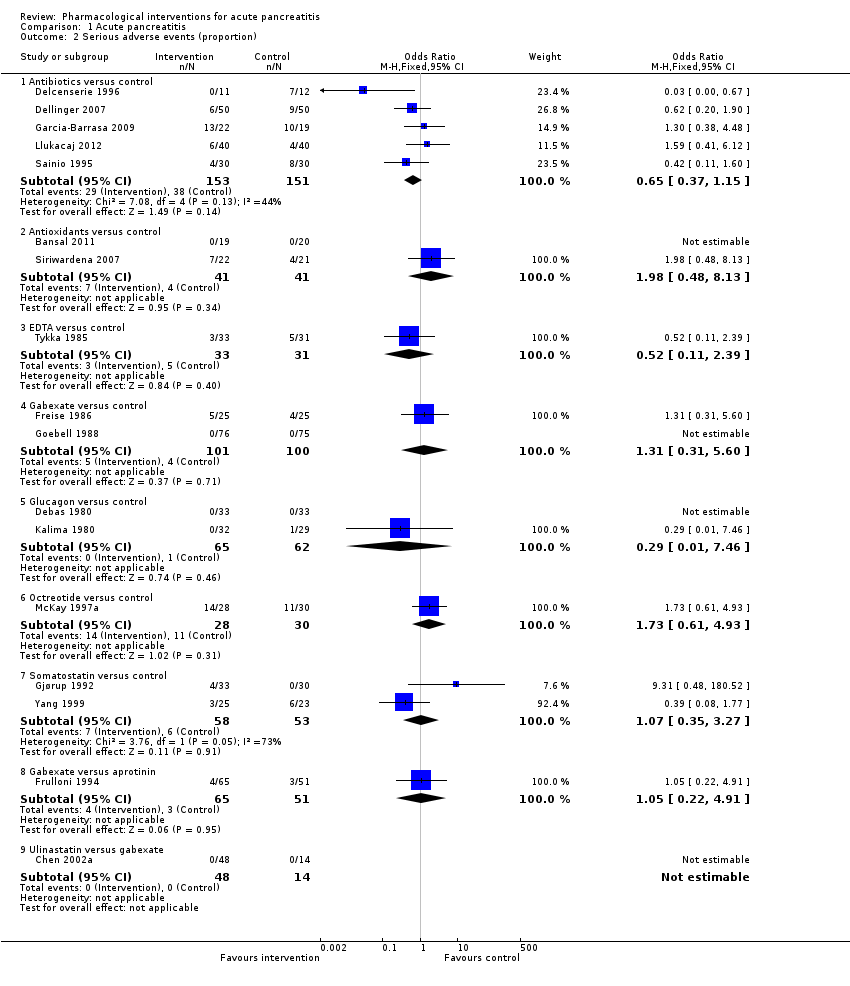
Comparison 1 Acute pancreatitis, Outcome 2 Serious adverse events (proportion).
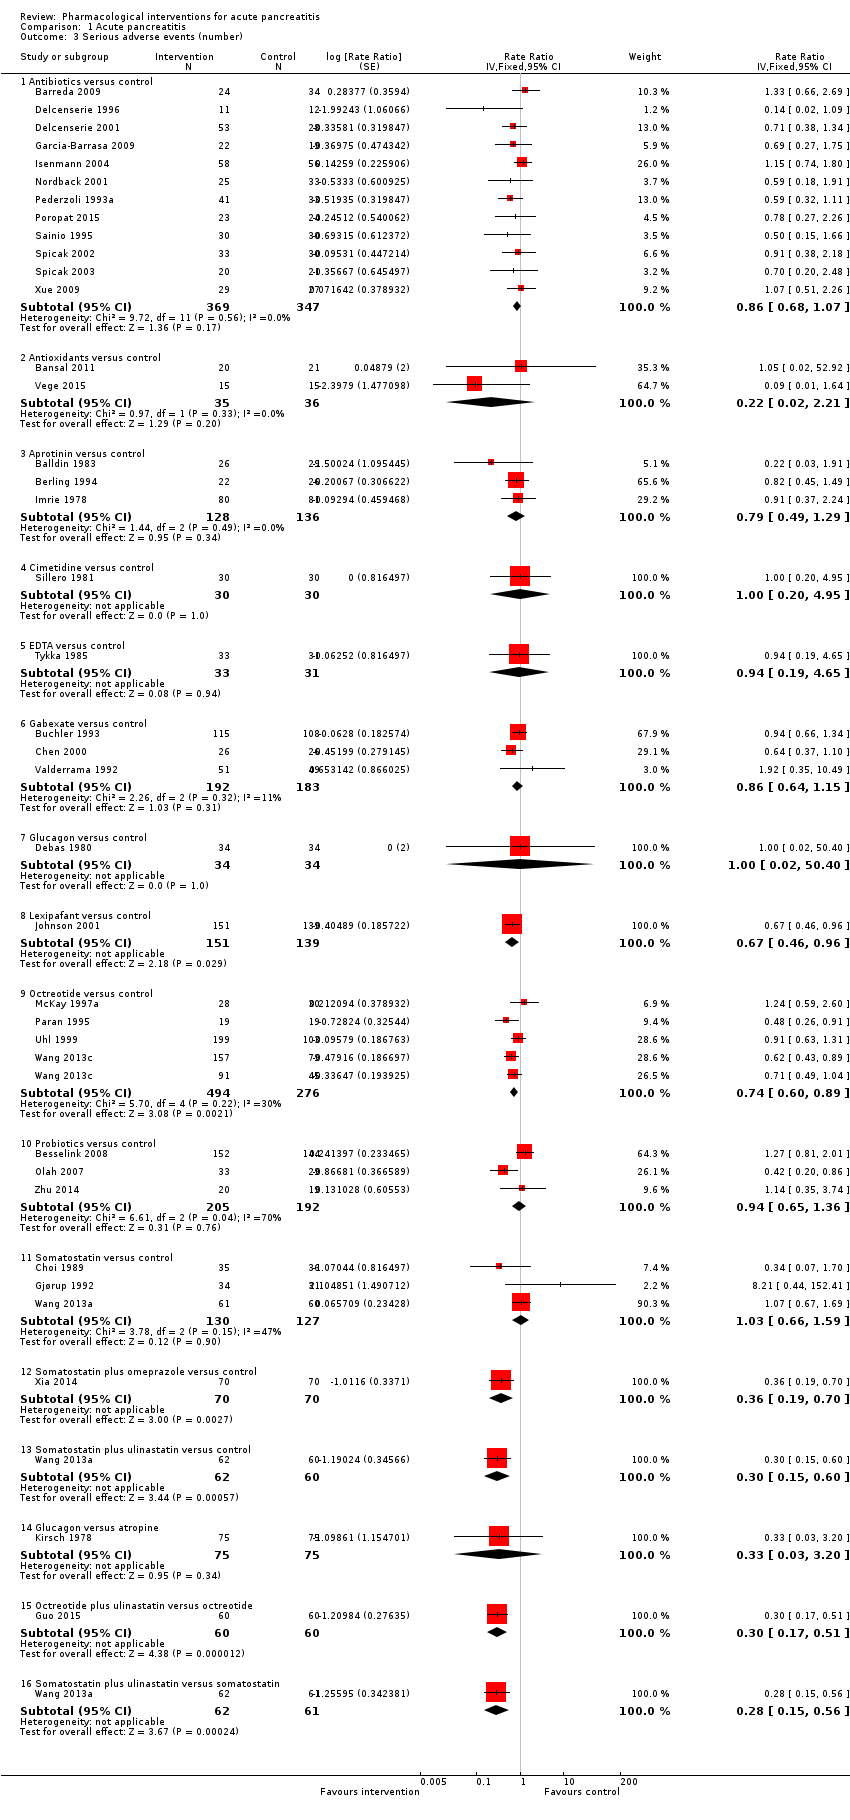
Comparison 1 Acute pancreatitis, Outcome 3 Serious adverse events (number).

Comparison 1 Acute pancreatitis, Outcome 4 Organ failure.

Comparison 1 Acute pancreatitis, Outcome 5 Infected pancreatic necrosis.

Comparison 1 Acute pancreatitis, Outcome 6 Sepsis.
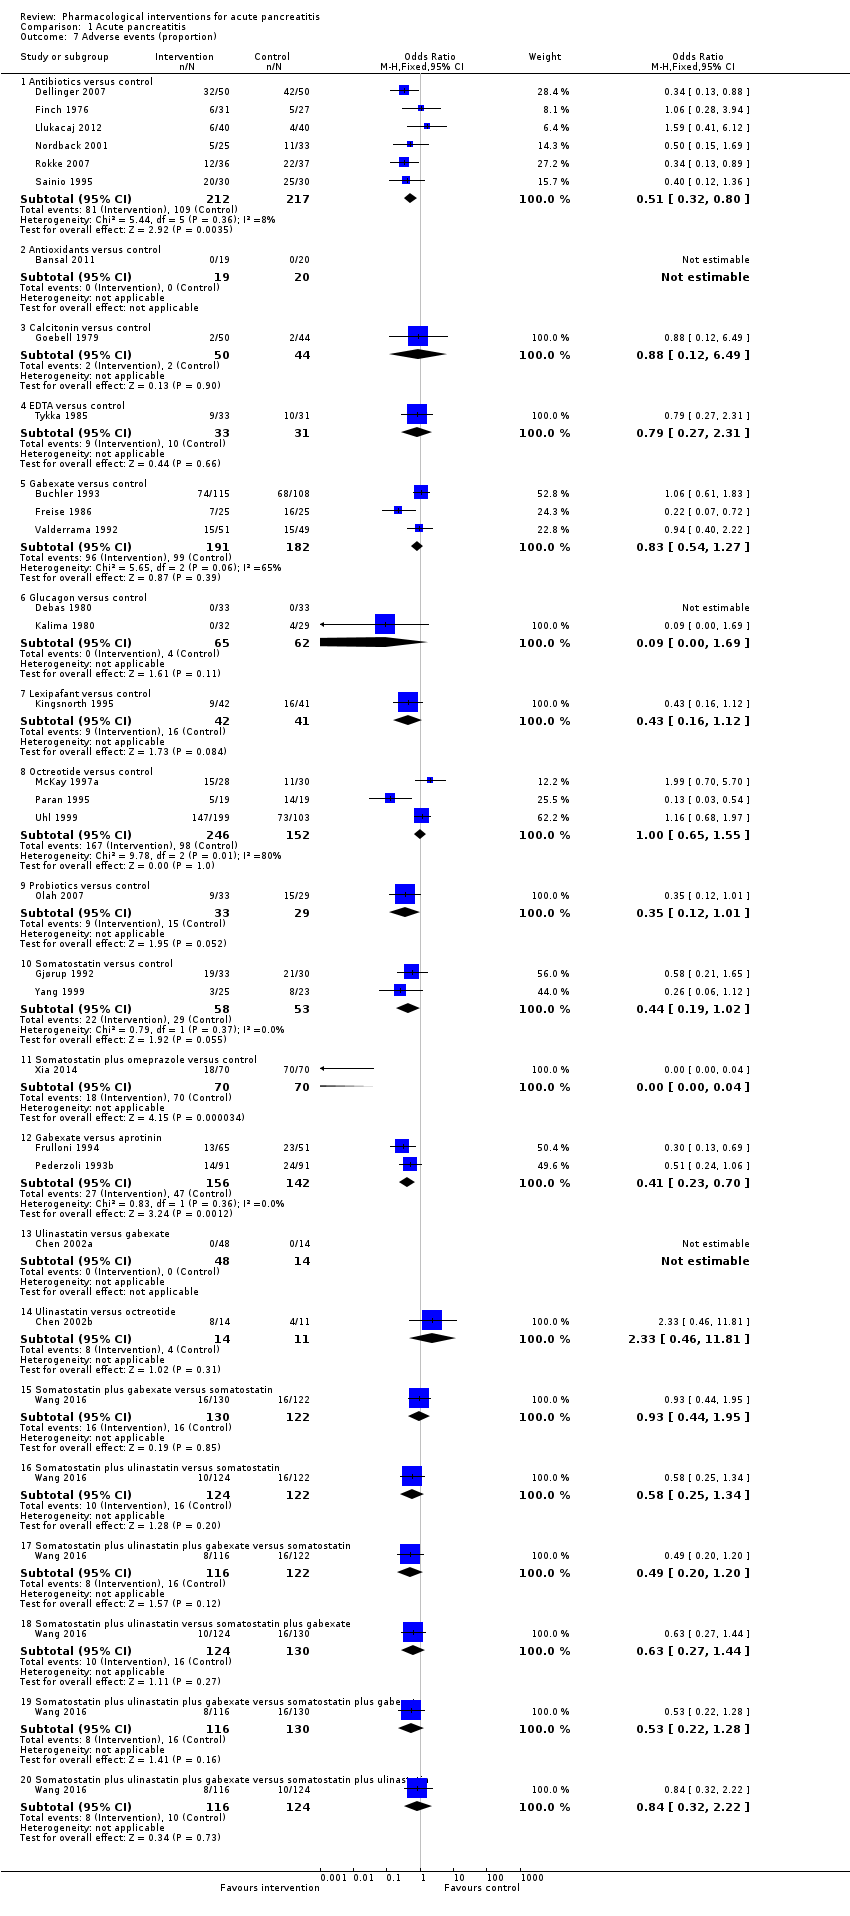
Comparison 1 Acute pancreatitis, Outcome 7 Adverse events (proportion).
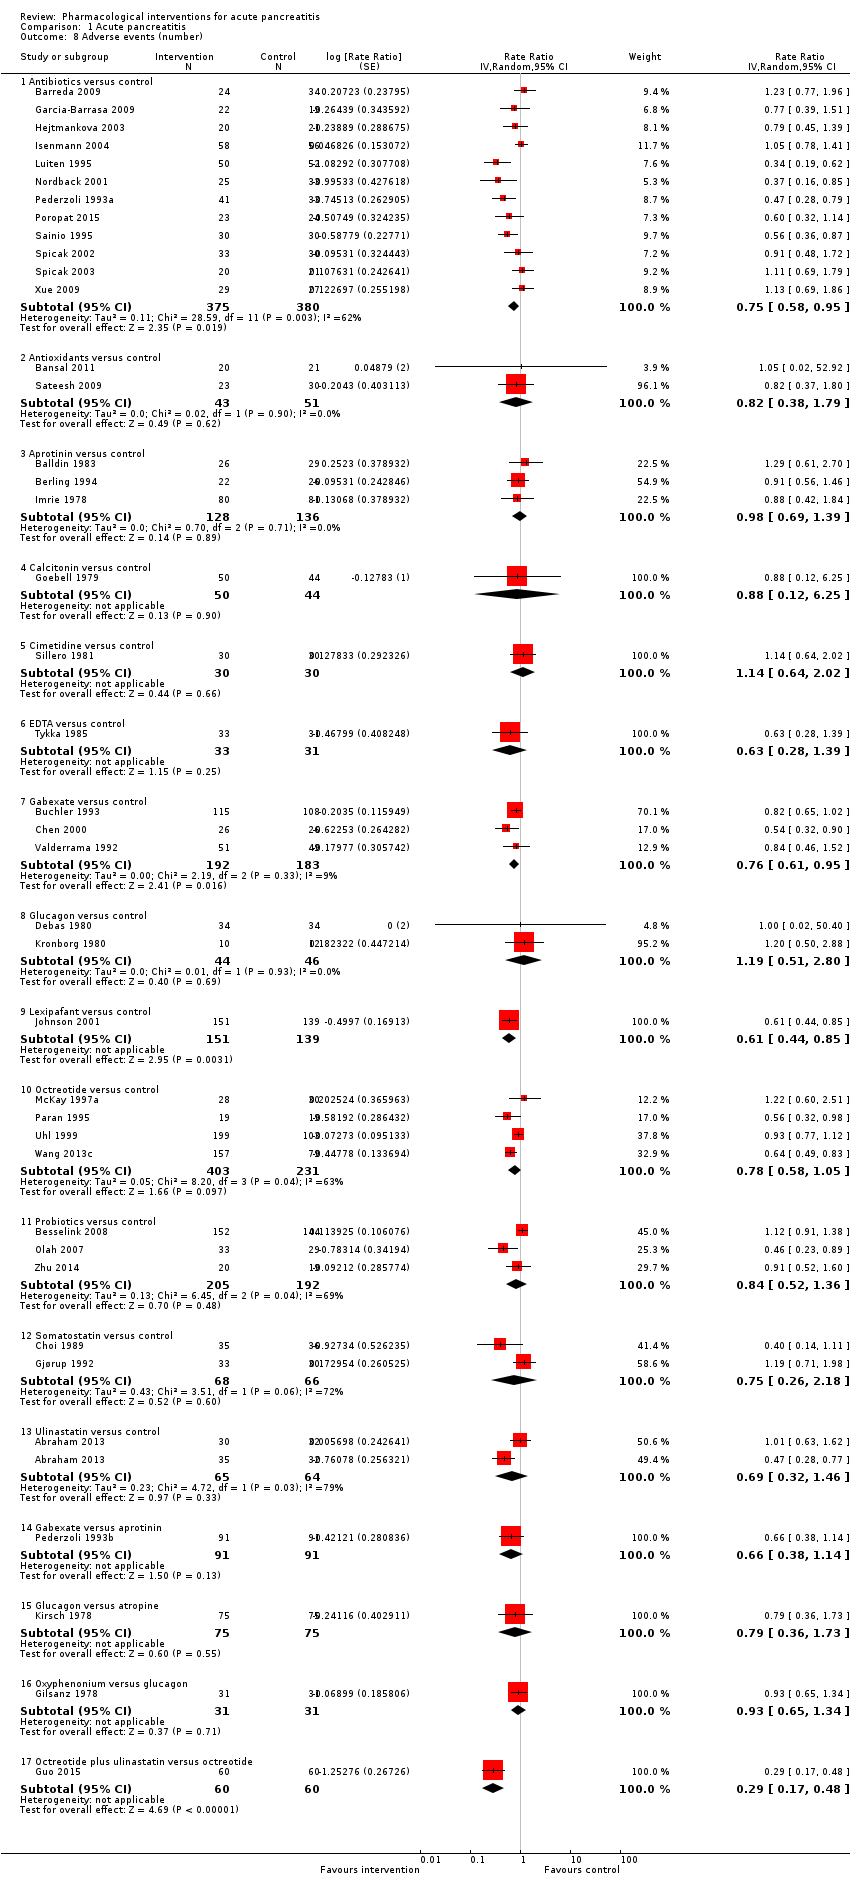
Comparison 1 Acute pancreatitis, Outcome 8 Adverse events (number).

Comparison 1 Acute pancreatitis, Outcome 9 Requirement for additional invasive intervention.
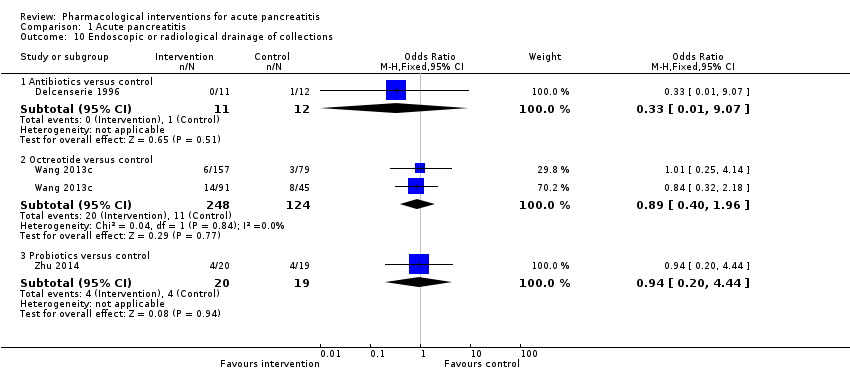
Comparison 1 Acute pancreatitis, Outcome 10 Endoscopic or radiological drainage of collections.

Comparison 2 Acute necrotising pancreatitis, Outcome 1 Short‐term mortality.
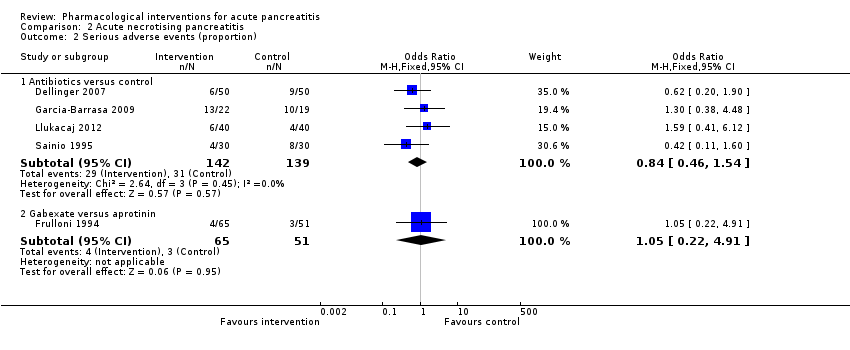
Comparison 2 Acute necrotising pancreatitis, Outcome 2 Serious adverse events (proportion).

Comparison 2 Acute necrotising pancreatitis, Outcome 3 Serious adverse events (number).

Comparison 2 Acute necrotising pancreatitis, Outcome 4 Organ failure.
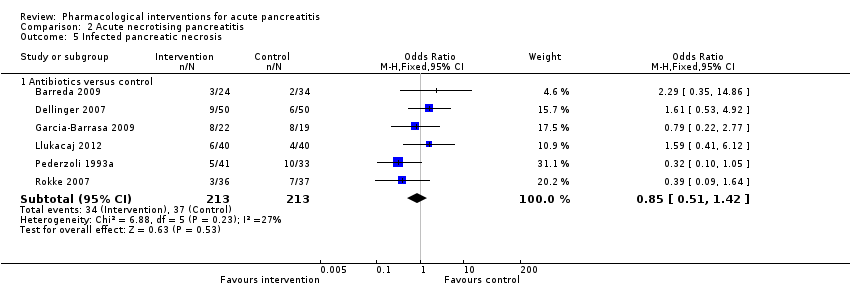
Comparison 2 Acute necrotising pancreatitis, Outcome 5 Infected pancreatic necrosis.
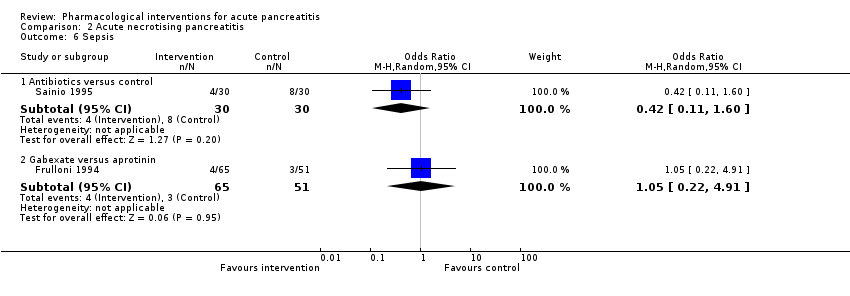
Comparison 2 Acute necrotising pancreatitis, Outcome 6 Sepsis.
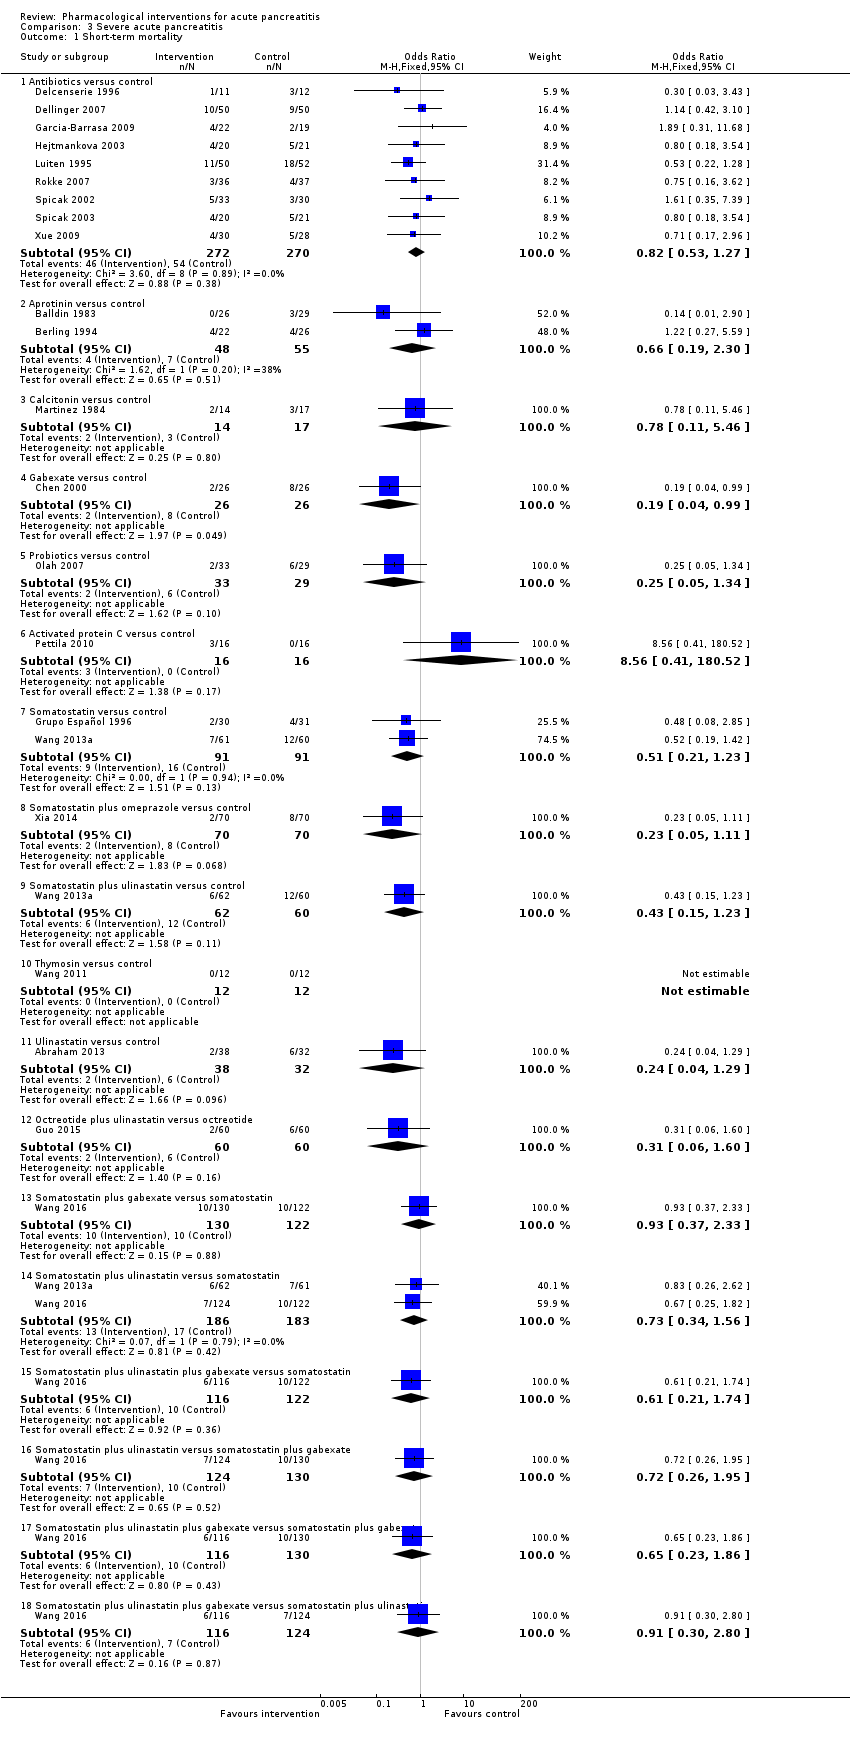
Comparison 3 Severe acute pancreatitis, Outcome 1 Short‐term mortality.

Comparison 3 Severe acute pancreatitis, Outcome 2 Serious adverse events (proportion).

Comparison 3 Severe acute pancreatitis, Outcome 3 Serious adverse events (number).
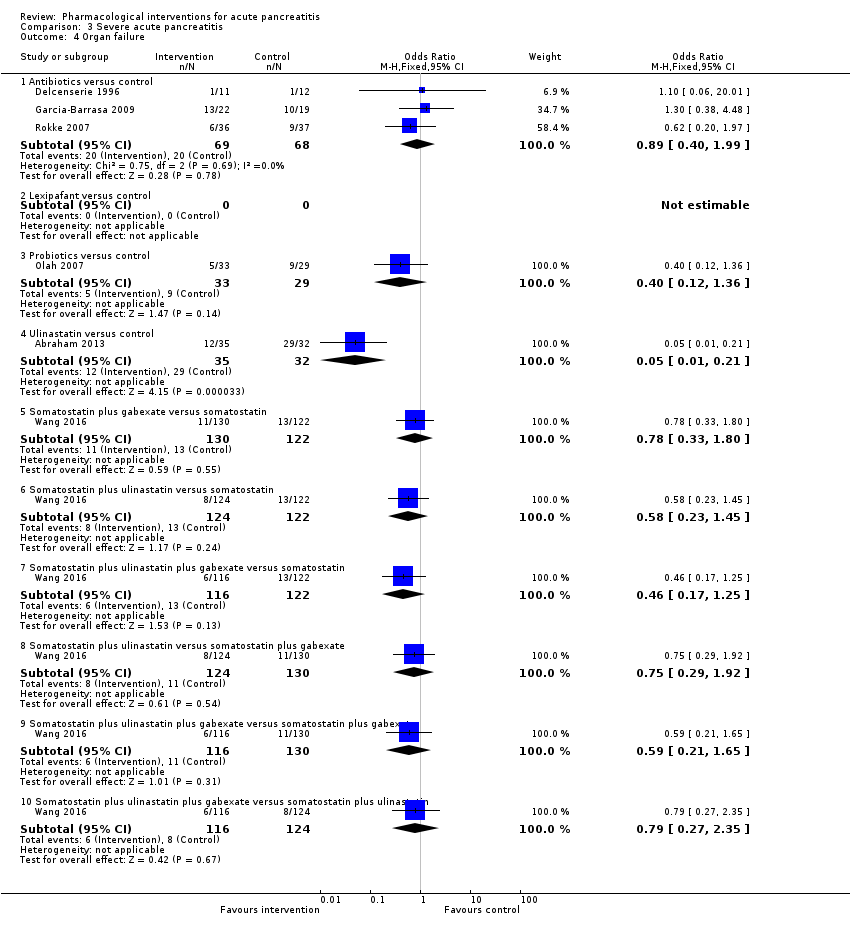
Comparison 3 Severe acute pancreatitis, Outcome 4 Organ failure.

Comparison 3 Severe acute pancreatitis, Outcome 5 Infected pancreatic necrosis.

Comparison 3 Severe acute pancreatitis, Outcome 6 Sepsis.
| Pharmacological interventions for treatment of acute severe pancreatitis (mortality) | |||||
| Patient or population: people with acute pancreatitis | |||||
| Outcomes | Illustrative comparative risks* (95% CI) | Relative effect | No of participants | Quality of the evidence | |
| Assumed risk Inactive control | Corresponding risk Various treatments | ||||
| Short‐term mortality Follow‐up: up to 3 months | Antibiotics | OR 0.81 | 1058 | ⊕⊝⊝⊝ | |
| 120 per 1000 | 99 per 1000 | ||||
| Antioxidants | OR 2.01 | 163 | ⊕⊝⊝⊝ | ||
| 120 per 1000 | 215 per 1000 | ||||
| Aprotinin | OR 0.68 | 651 | ⊕⊝⊝⊝ | ||
| 120 per 1000 | 85 per 1000 | ||||
| Calcitonin | OR 0.55 | 125 | ⊕⊝⊝⊝ | ||
| 120 per 1000 | 69 per 1000 | ||||
| Cimetidine | OR 1.00 | 40 | ⊕⊝⊝⊝ | ||
| 120 per 1000 | 120 per 1000 | ||||
| EDTA | OR 0.94 | 64 | ⊕⊝⊝⊝ | ||
| 120 per 1000 | 113 per 1000 | ||||
| Gabexate | OR 0.79 | 576 | ⊕⊝⊝⊝ | ||
| 120 per 1000 | 98 per 1000 | ||||
| Glucagon | OR 0.97 | 409 | ⊕⊝⊝⊝ | ||
| 120 per 1000 | 117 per 1000 | ||||
| Iniprol | OR 0.14 | 24 | ⊕⊝⊝⊝ | ||
| 120 per 1000 | 19 per 1000 | ||||
| Lexipafant | OR 0.55 | 423 | ⊕⊝⊝⊝ | ||
| 120 per 1000 | 70 per 1000 | ||||
| Octreotide | OR 0.76 | 927 | ⊕⊝⊝⊝ | ||
| 120 per 1000 | 94 per 1000 | ||||
| Probiotics | OR 1.70 | 358 | ⊕⊝⊝⊝ | ||
| 120 per 1000 | 188 per 1000 | ||||
| Activated protein C | OR 8.56 | 32 | ⊕⊝⊝⊝ | ||
| 120 per 1000 | 539 per 1000 | ||||
| Somatostatin | OR 0.57 | 493 | ⊕⊝⊝⊝ | ||
| 120 per 1000 | 72 per 1000 | ||||
| Somatostatin plus omeprazole | OR 0.23 | 140 | ⊕⊝⊝⊝ | ||
| 120 per 1000 | 30 per 1000 | ||||
| Somatostatin plus ulinastatin | OR 0.43 | 122 | ⊕⊝⊝⊝ | ||
| 120 per 1000 | 55 per 1000 | ||||
| Thymosin | Not estimable | 24 | ⊕⊝⊝⊝ | ||
| 120 per 1000 | not estimable | ||||
| Ulinastatin | OR 0.45 | 132 | ⊕⊝⊝⊝ | ||
| 120 per 1000 | 58 per 1000 | ||||
| Long‐term mortality | None of the trials with inactive treatment in the control group reported long‐term mortality. | ||||
| *The basis for the assumed risk is the average control group proportion across all comparisons. The corresponding risk (and its 95% confidence interval) is based on the assumed risk in the comparison group and the relative effect of the intervention (and its 95% CI). CI: confidence intervals; OR: odds ratio; EDTA: ethylenediaminetetraacetic acid. | |||||
| GRADE Working Group grades of evidence | |||||
| aRisk of bias: downgraded by one level. | |||||
| Pharmacological interventions for treatment of acute severe pancreatitis (other outcomes) | |||||
| Patient or population: people with acute pancreatitis | |||||
| Outcomes | Illustrative comparative risks* (95% CI) | Relative effect | No of participants | Quality of the evidence | |
| Assumed risk | Corresponding risk | ||||
| Inactive control | Various treatments | ||||
| Serious adverse events (proportion) Follow‐up: up to 3 months | Antibiotics | OR 0.65 | 304 | ⊕⊝⊝⊝ | |
| 147 per 1000 | 101 per 1000 | ||||
| Antioxidants | OR 1.98 | 82 | ⊕⊝⊝⊝ | ||
| 147 per 1000 | 255 per 1000 | ||||
| EDTA | OR 0.52 | 64 | ⊕⊝⊝⊝ | ||
| 147 per 1000 | 83 per 1000 | ||||
| Gabexate | OR 1.31 | 201 | ⊕⊝⊝⊝ | ||
| 147 per 1000 | 185 per 1000 | ||||
| Glucagon | OR 0.29 | 127 | ⊕⊝⊝⊝ | ||
| 147 per 1000 | 48 per 1000 | ||||
| Octreotide | OR 1.73 | 58 | ⊕⊝⊝⊝ | ||
| 147 per 1000 | 230 per 1000 | ||||
| Somatostatin | OR 1.07 | 111 | ⊕⊝⊝⊝ | ||
| 147 per 1000 | 156 per 1000 | ||||
| Serious adverse events (number) Follow‐up: up to 3 months | Antibiotics | Rate ratio0.86 | 716 | ⊕⊝⊝⊝ | |
| 437 per 1000 | 374 per 1000 | ||||
| Antioxidants | Rate ratio0.22 | 71 | ⊕⊝⊝⊝ | ||
| 437 per 1000 | 94 per 1000 | ||||
| Aprotinin | Rate ratio0.79 | 264 | ⊕⊝⊝⊝ | ||
| 437 per 1000 | 345 per 1000 | ||||
| Cimetidine | Rate ratio1.00 | 60 | ⊕⊝⊝⊝ | ||
| 437 per 1000 | 437 per 1000 | ||||
| EDTA | Rate ratio0.94 | 64 | ⊕⊝⊝⊝ | ||
| 437 per 1000 | 411 per 1000 | ||||
| Gabexate | Rate ratio0.86 | 375 | ⊕⊝⊝⊝ | ||
| 437 per 1000 | 375 per 1000 | ||||
| Glucagon | Rate ratio1.00 | 68 | ⊕⊝⊝⊝ | ||
| 437 per 1000 | 437 per 1000 | ||||
| Lexipafant | rate ratio0.67 | 290 | ⊕⊝⊝⊝ | ||
| 437 per 1000 | 292 per 1000 | ||||
| Octreotide | Rate ratio0.74 | 770 | ⊕⊝⊝⊝ | ||
| 437 per 1000 | 321 per 1000 | ||||
| Probiotics | Rate ratio0.94 | 397 | ⊕⊝⊝⊝ | ||
| 437 per 1000 | 412 per 1000 | ||||
| Somatostatin | Rate ratio1.03 | 257 | ⊕⊝⊝⊝ | ||
| 437 per 1000 | 449 per 1000 | ||||
| Somatostatin plus omeprazole | Rate ratio0.36 | 140 | ⊕⊕⊝⊝ | ||
| 437 per 1000 | 159 per 1000 | ||||
| Somatostatin plus ulinastatin | Rate ratio0.30 | 122 | ⊕⊕⊝⊝ | ||
| 437 per 1000 | 133 per 1000 | ||||
| Organ failure Follow‐up: up to 3 months | Antibiotics | OR 0.78 | 258 | ⊕⊝⊝⊝ | |
| 289 per 1000 | 241 per 1000 | ||||
| Antioxidants | OR 0.92 | 163 | ⊕⊝⊝⊝ | ||
| 289 per 1000 | 271 per 1000 | ||||
| Gabexate | OR 0.32 | 50 | ⊕⊝⊝⊝ | ||
| 289 per 1000 | 115 per 1000 | ||||
| Lexipafant | OR 0.68 | 340 | ⊕⊝⊝⊝ | ||
| 289 per 1000 | 216 per 1000 | ||||
| Octreotide | OR 0.51 | 430 | ⊕⊝⊝⊝ | ||
| 289 per 1000 | 173 per 1000 | ||||
| Probiotics | OR 0.80 | 358 | ⊕⊝⊝⊝ | ||
| 289 per 1000 | 246 per 1000 | ||||
| Ulinastatin | OR 0.27 | 129 | ⊕⊝⊝⊝ | ||
| 289 per 1000 | 100 per 1000 | ||||
| Infected pancreatic necrosis Follow‐up: up to 3 months | Antibiotics | OR 0.82 | 714 | ⊕⊝⊝⊝ | |
| 140 per 1000 | 118 per 1000 | ||||
| Octreotide | OR 0.52 | 58 | ⊕⊝⊝⊝ | ||
| 140 per 1000 | 78 per 1000 | ||||
| Probiotics | OR 1.10 | 397 | ⊕⊝⊝⊝ | ||
| 140 per 1000 | 152 per 1000 | ||||
| Sepsis Follow‐up: up to 3 months | Antibiotics | OR 0.42 | 60 | ⊕⊝⊝⊝ | |
| 122 per 1000 | 56 per 1000 | ||||
| Aprotinin | OR 1.84 | 103 | ⊕⊝⊝⊝ | ||
| 122 per 1000 | 204 per 1000 | ||||
| Gabexate | OR 1.10 | 373 | ⊕⊝⊝⊝ | ||
| 122 per 1000 | 133 per 1000 | ||||
| Lexipafant | OR 0.26 | 290 | ⊕⊝⊝⊝ | ||
| 122 per 1000 | 35 per 1000 | ||||
| Octreotide | OR 0.40 | 340 | ⊕⊝⊝⊝ | ||
| 122 per 1000 | 53 per 1000 | ||||
| Probiotics | OR 0.36 | 62 | ⊕⊝⊝⊝ | ||
| 122 per 1000 | 48 per 1000 | ||||
| Health‐related quality of life | None of the trials reported this outcome. | ||||
| *The basis for the assumed risk is the average control group proportion across all comparisons. The corresponding risk (and its 95% confidence interval) is based on the assumed risk in the comparison group and the relative effect of the intervention (and its 95% CI). CI: confidence intervals; OR = odds ratio; EDTA = ethylenediaminetetraacetic acid. | |||||
| GRADE Working Group grades of evidence | |||||
| aRisk of bias: downgraded by one level. | |||||
| Study name | No of participants randomised | Postrandomisation dropouts | No of participants for whom outcome was reported | Treatment 1 | Treatment 2 | Selection bias | Performance and detection bias | Attrition bias | Selective reporting bias | Other bias |
| 32 | 0 | 32 | Activated protein C | Placebo | Unclear | Low | Low | High | High | |
| 80 | 22 | 58 | Antibiotics | No active intervention | Unclear | Unclear | High | Low | Unclear | |
| 23 | 0 | 23 | Antibiotics | No active intervention | Unclear | Unclear | Low | Low | Unclear | |
| 81 | Not stated | 81 | Antibiotics | No active intervention | Unclear | Unclear | Unclear | Low | Unclear | |
| 100 | 0 | 100 | Antibiotics | Placebo | Low | Low | Low | Low | High | |
| 62 | 4 | 58 | Antibiotics | No active intervention | Unclear | Unclear | High | Low | Unclear | |
| 46 | 5 | 41 | Antibiotics | Placebo | Unclear | Low | High | Low | Low | |
| 41 | Not stated | 41 | Antibiotics | No active intervention | Unclear | Unclear | Unclear | Low | Unclear | |
| 119 | 5 | 114 | Antibiotics | Placebo | Unclear | Low | High | High | High | |
| 80 | Not stated | 80 | Antibiotics | Placebo | Unclear | Low | Unclear | High | Unclear | |
| 109 | 7 | 102 | Antibiotics | No active intervention | Unclear | Unclear | High | Low | Unclear | |
| 90 | 32 | 58 | Antibiotics | Placebo | Unclear | Unclear | High | Low | Unclear | |
| 47 | 0 | 47 | Antibiotics | No active intervention | Unclear | Unclear | Low | Low | Unclear | |
| 74 | Not stated | 74 | Antibiotics | No active intervention | Unclear | Unclear | Low | Low | Unclear | |
| 73 | 0 | 73 | Antibiotics | No active intervention | Unclear | High | Low | Low | High | |
| 60 | 0 | 60 | Antibiotics | No active intervention | Unclear | Unclear | Low | Low | Unclear | |
| 63 | Not stated | 63 | Antibiotics | No active intervention | Unclear | Unclear | Unclear | Low | Unclear | |
| 41 | Not stated | 41 | Antibiotics | No active intervention | Unclear | Unclear | Unclear | Low | Unclear | |
| 59 | 3 | 56 | Antibiotics | No active intervention | Unclear | Unclear | High | Low | Low | |
| 44 | 5 | 39 | Antioxidants | No active intervention | Unclear | High | High | Low | Low | |
| 20 | Not stated | 20 | Antioxidants | No active intervention | Unclear | Unclear | Unclear | High | Unclear | |
| 73 | 0 | 73 | Antioxidants | Placebo | Unclear | Unclear | Low | High | Unclear | |
| 56 | 3 | 53 | Antioxidants | No active intervention | Unclear | High | High | Low | Unclear | |
| 43 | 0 | 43 | Antioxidants | Placebo | Low | Low | Low | Low | High | |
| 28 | Not stated | 28 | Antioxidants | Placebo | Unclear | Low | Low | Low | Unclear | |
| 34 | Not stated | 34 | Antioxidants plus Corticosteroids | No active intervention | Unclear | Unclear | Unclear | High | Unclear | |
| (this is a 3‐armed trial; the numbers stated included all 3 arms) | 264 | 7 | 257 | Aprotinin | Placebo | Unclear | Low | High | High | High |
| 55 | Not stated | 55 | Aprotinin | No active intervention | Unclear | Unclear | Unclear | Low | High | |
| 48 | Not stated | 48 | Aprotinin | No active intervention | Unclear | Low | Low | Low | High | |
| 161 | Not stated | 161 | Aprotinin | Placebo | Unclear | Low | Unclear | Low | High | |
| 50 | Not stated | 50 | Aprotinin | Placebo | Unclear | Low | Unclear | High | Unclear | |
| 43 | Not stated | 43 | Aprotinin | Placebo | Unclear | Low | Unclear | High | Unclear | |
| 105 | Not stated | 105 | Aprotinin | Placebo | Low | Low | Unclear | High | High | |
| (this is a 3‐armed trial; the numbers stated included all 3 arms) | 264 | 7 | 257 | Aprotinin | Glucagon | Unclear | Low | High | High | High |
| 94 | Not stated | 94 | Calcitonin | Placebo | Unclear | Low | Unclear | Low | Unclear | |
| 31 | 0 | 31 | Calcitonin | Placebo | Unclear | Unclear | Low | High | Unclear | |
| 40 | Not stated | 40 | Cimetidine | Placebo | Unclear | Low | Unclear | High | Unclear | |
| 60 | Not stated | 60 | Cimetidine | Placebo | Low | Unclear | Unclear | High | Unclear | |
| 64 | 0 | 64 | EDTA | Placebo | Unclear | Low | Low | Low | High | |
| 116 | Not stated | 116 | Gabexate | Aprotinin | Unclear | Unclear | Unclear | Low | Unclear | |
| 199 | 17 | 182 | Gabexate | Aprotinin | Unclear | Low | High | Low | Unclear | |
| 223 | Not stated | 223 | Gabexate | Placebo | Low | Low | Low | Low | Unclear | |
| 52 | Not stated | 52 | Gabexate | Placebo | Unclear | Unclear | Unclear | Low | Unclear | |
| 50 | Not stated | 50 | Gabexate | Placebo | Unclear | Low | Unclear | Low | Unclear | |
| 162 | 11 | 151 | Gabexate | Placebo | Unclear | Low | High | Low | Unclear | |
| 105 | 5 | 100 | Gabexate | Placebo | Low | Low | High | Low | High | |
| 150 | Not stated | 150 | Glucagon | Atropine | Unclear | Unclear | Unclear | Low | Unclear | |
| (this is a 3‐armed trial; the numbers stated included all 3 arms) | 264 | 7 | 257 | Glucagon | Placebo | Unclear | Unclear | Unclear | Low | High |
| 66 | Not stated | 66 | Glucagon | Placebo | Unclear | Low | Unclear | Low | Unclear | |
| 69 | Not stated | 69 | Glucagon | Placebo | Unclear | Low | Unclear | High | Unclear | |
| 80 | 9 | 71 | Glucagon | Placebo | Unclear | Unclear | High | Low | Unclear | |
| 22 | Not stated | 22 | Glucagon | Placebo | Unclear | Low | Unclear | High | Unclear | |
| 62 | Not stated | 62 | Glucagon | Oxyphenonium | Unclear | Low | Unclear | Low | Unclear | |
| 24 | Not stated | 24 | Iniprol | No active intervention | Unclear | High | Unclear | High | High | |
| 291 | 1 | 290 | Lexipafant | Placebo | Unclear | Low | High | Low | High | |
| 83 | Not stated | 83 | Lexipafant | Placebo | Unclear | Low | Unclear | High | High | |
| 51 | 1 | 50 | Lexipafant | Placebo | Unclear | Low | High | High | High | |
| 66 | 9 | 57 | NSAID | Placebo | Unclear | Unclear | Unclear | High | Unclear | |
| 30 | 0 | 30 | NSAID | Placebo | Unclear | Low | Low | High | High | |
| 58 | 0 | 58 | Octreotide | Placebo | Low | Low | Low | Low | Unclear | |
| 180 | Not stated | 180 | Octreotide | Placebo | Unclear | Unclear | Unclear | High | Unclear | |
| 51 | 13 | 38 | Octreotide | No active intervention | Unclear | High | High | Low | Unclear | |
| 302 | 0 | 302 | Octreotide | Placebo | Unclear | Low | Low | Low | High | |
| 372 | Not stated | 372 | Octreotide | No active intervention | Unclear | Unclear | High | Low | Low | |
| 163 | 6 | 157 | Octreotide | No active intervention | Unclear | Unclear | High | High | Low | |
| 354 | Not stated | 354 | Octreotide plus NSAID | Octreotide | Unclear | Unclear | Unclear | High | Unclear | |
| 120 | Not stated | 120 | Octreotide plus ulinastatin | Octreotide | Unclear | Unclear | Unclear | Low | Unclear | |
| 298 | 2 | 296 | Probiotics | Placebo | Low | Low | High | Low | High | |
| 83 | 21 | 62 | Probiotics | No active intervention | Unclear | Low | High | High | Unclear | |
| 90 | Not stated | 58 | Probiotics | No active intervention | Unclear | Low | Unclear | High | Unclear | |
| 50 | 0 | 50 | Probiotics | Placebo | Unclear | Low | Low | High | High | |
| 39 | Not stated | 39 | Probiotics | Placebo | Unclear | Low | Unclear | High | Unclear | |
| 70 | 9 | 61 | Somatostatin | Placebo | Unclear | Low | High | High | Unclear | |
| 71 | Not stated | 71 | Somatostatin | No active intervention | Unclear | Unclear | Unclear | Low | Unclear | |
| 63 | Not stated | 63 | Somatostatin | Placebo | Unclear | Low | Unclear | Low | Unclear | |
| 100 | Not stated | 100 | Somatostatin | No active intervention | Unclear | Low | Unclear | High | Unclear | |
| 87 | 3 | 84 | Somatostatin | Placebo | Unclear | Low | Unclear | High | High | |
| 77 | Not stated | 77 | Somatostatin | Placebo | Unclear | Low | Unclear | High | Unclear | |
| Wang 2013a (this is a 3‐armed trial; the numbers stated included all 3 arms) | 183 | Not stated | 183 | Somatostatin | No active intervention | Unclear | Low | Unclear | Low | Low |
| 48 | Not stated | 48 | Somatostatin | No active intervention | Unclear | Unclear | Unclear | High | Unclear | |
| 140 | Not stated | 140 | Somatostatin plus omeprazole | No active intervention | Unclear | Unclear | Unclear | Low | Unclear | |
| Wang 2013a (this is a 3‐armed trial; the numbers stated included all 3 arms) | 183 | Not stated | 183 | Somatostatin plus ulinastatin | Placebo | Unclear | Unclear | Unclear | High | Unclear |
| Wang 2013a (this is a 3‐armed trial; the numbers stated included all 3 arms) | 183 | Not stated | 183 | Somatostatin plus ulinastatin | Somatostatin | Unclear | Low | Unclear | Low | Low |
| Wang 2016 (this is a 4‐armed trial; the numbers stated included all 4 arms) | 492 | 0 | 492 | Somatostatin plus ulinastatin | Somatostatin | Low | Low | Low | Low | Low |
| Wang 2016 (this is a 4‐armed trial; the numbers stated included all 4 arms) | 492 | 0 | 492 | Somatostatin plus gabexate | Somatostatin | Low | Low | Low | Low | Low |
| Wang 2016 (this is a 4‐armed trial; the numbers stated included all 4 arms) | 492 | 0 | 492 | Somatostatin plus ulinastatin plus gabexate | Somatostatin | Low | Low | Low | Low | Low |
| Wang 2016 (this is a 4‐armed trial; the numbers stated included all 4 arms) | 492 | 0 | 492 | Somatostatin plus ulinastatin | Somatostatin plus gabexate | Low | Low | Low | Low | Low |
| Wang 2016 (this is a 4‐armed trial; the numbers stated included all 4 arms) | 492 | 0 | 492 | Somatostatin plus ulinastatin plus gabexate | Somatostatin plus gabexate | Low | Low | Low | Low | Low |
| Wang 2016 (this is a 4‐armed trial; the numbers stated included all 4 arms) | 492 | 0 | 492 | Somatostatin plus ulinastatin plus gabexate | Somatostatin plus ulinastatin | Low | Low | Low | Low | Low |
| 24 | Not stated | 24 | Thymosin | Placebo | Unclear | Low | Unclear | High | Unclear | |
| 135 | 6 | 129 | Ulinastatin | Placebo | Unclear | Low | High | Low | Unclear | |
| 68 | 6 | 62 | Ulinastatin | Gabexate | Unclear | Unclear | High | High | Unclear | |
| 26 | 1 | 25 | Ulinastatin | Octreotide | Unclear | Unclear | High | High | Unclear |
| Study name | Treatment 1 | Treatment 2 | Severe pancreatitis | Necrotising pancreatitis | Organ failure | Infection |
| Activated protein C | Placebo | yes | not stated | not stated | not stated | |
| Antibiotics | No active intervention | not stated | yes | not stated | not stated | |
| Antibiotics | No active intervention | yes | not stated | not stated | not stated | |
| Antibiotics | No active intervention | not stated | yes | not stated | not stated | |
| Antibiotics | Placebo | yes | yes | not stated | no | |
| Antibiotics | No active intervention | not stated | not stated | not stated | not stated | |
| Antibiotics | Placebo | yes | yes | not stated | not stated | |
| Antibiotics | No active intervention | yes | not stated | not stated | not stated | |
| Antibiotics | Placebo | not stated | not stated | not stated | not stated | |
| Antibiotics | Placebo | not stated | yes | not stated | no | |
| Antibiotics | No active intervention | yes | not stated | not stated | no | |
| Antibiotics | Placebo | not stated | yes | no | not stated | |
| Antibiotics | No active intervention | not stated | yes | not stated | not stated | |
| Antibiotics | No active intervention | yes | yes | not stated | not stated | |
| Antibiotics | No active intervention | not stated | yes | not stated | not stated | |
| Antibiotics | No active intervention | yes | not stated | not stated | not stated | |
| Antibiotics | No active intervention | yes | not stated | not stated | not stated | |
| Antibiotics | No active intervention | yes | yes | not stated | no | |
| Antioxidants | No active intervention | not stated | not stated | not stated | not stated | |
| Antioxidants | No active intervention | yes | not stated | not stated | not stated | |
| Antioxidants | Placebo | not stated | not stated | not stated | not stated | |
| Antioxidants | No active intervention | not stated | not stated | not stated | not stated | |
| Antioxidants | Placebo | not stated | not stated | not stated | not stated | |
| Antioxidants | Placebo | not stated | not stated | not stated | not stated | |
| Antioxidants plus corticosteroids | No active intervention | yes | not stated | not stated | not stated | |
| Aprotinin | No active intervention | yes | not stated | not stated | not stated | |
| Aprotinin | No active intervention | yes | not stated | not stated | not stated | |
| Aprotinin | Placebo | not stated | not stated | not stated | not stated | |
| Aprotinin | Placebo | not stated | not stated | not stated | not stated | |
| Aprotinin | Placebo | not stated | not stated | not stated | not stated | |
| Aprotinin | Placebo | not stated | not stated | not stated | not stated | |
| Aprotinin | Placebo | not stated | not stated | not stated | not stated | |
| Calcitonin | Placebo | not stated | not stated | not stated | not stated | |
| Calcitonin | Placebo | yes | not stated | not stated | not stated | |
| Cimetidine | Placebo | not stated | not stated | not stated | not stated | |
| Cimetidine | Placebo | not stated | not stated | not stated | not stated | |
| EDTA | Placebo | not stated | not stated | not stated | not stated | |
| Gabexate | Placebo | not stated | not stated | not stated | not stated | |
| Gabexate | Placebo | yes | not stated | yes | not stated | |
| Gabexate | Placebo | not stated | not stated | not stated | not stated | |
| Gabexate | Placebo | not stated | not stated | not stated | not stated | |
| Gabexate | Placebo | not stated | not stated | not stated | not stated | |
| Glucagon | Placebo | not stated | not stated | not stated | not stated | |
| Glucagon | Placebo | not stated | not stated | not stated | not stated | |
| Glucagon | Placebo | not stated | not stated | not stated | not stated | |
| Glucagon | Placebo | not stated | not stated | not stated | not stated | |
| Glucagon | Placebo | not stated | not stated | not stated | not stated | |
| Iniprol | No active intervention | not stated | not stated | not stated | not stated | |
| Lexipafant | Placebo | not stated | not stated | not stated | not stated | |
| Lexipafant | Placebo | not stated | not stated | not stated | not stated | |
| Lexipafant | Placebo | not stated | not stated | not stated | not stated | |
| NSAID | Placebo | not stated | not stated | not stated | not stated | |
| NSAID | Placebo | not stated | not stated | not stated | not stated | |
| Octreotide | Placebo | not stated | not stated | not stated | not stated | |
| Octreotide | Placebo | not stated | not stated | not stated | not stated | |
| Octreotide | No active intervention | not stated | not stated | not stated | not stated | |
| Octreotide | Placebo | not stated | not stated | not stated | not stated | |
| Wang 2013c (mild pancreatitis) | Octreotide | No active intervention | no | not stated | not stated | not stated |
| Wang 2013c (severe pancreatitis) | Octreotide | No active intervention | yes | not stated | not stated | not stated |
| Octreotide | No active intervention | no | not stated | not stated | not stated | |
| Probiotics | Placebo | not stated | not stated | not stated | not stated | |
| Probiotics | No active intervention | yes | not stated | not stated | not stated | |
| Probiotics | No active intervention | yes | not stated | not stated | not stated | |
| Probiotics | Placebo | not stated | not stated | not stated | not stated | |
| Probiotics | Placebo | yes | not stated | not stated | not stated | |
| Somatostatin | No active intervention | not stated | not stated | not stated | not stated | |
| Somatostatin | Placebo | not stated | not stated | not stated | not stated | |
| Somatostatin | Placebo | yes | not stated | not stated | not stated | |
| Somatostatin | No active intervention | not stated | not stated | not stated | not stated | |
| Somatostatin | Placebo | not stated | not stated | not stated | not stated | |
| Somatostatin | Placebo | not stated | not stated | not stated | not stated | |
| Somatostatin | No active intervention | yes | not stated | not stated | not stated | |
| Somatostatin | No active intervention | not stated | not stated | not stated | not stated | |
| Somatostatin plus omeprazole | No active intervention | yes | not stated | not stated | not stated | |
| Somatostatin plus ulinastatin | No active intervention | yes | not stated | not stated | not stated | |
| Thymosin | Placebo | yes | not stated | not stated | not stated | |
| Abraham 2013 (mild pancreatitis) | Ulinastatin | Placebo | no | not stated | not stated | no |
| Abraham 2013 (severe pancreatitis) | Ulinastatin | Placebo | yes | not stated | not stated | not stated |
| Gabexate | Aprotinin | not stated | yes | not stated | not stated | |
| Gabexate | Aprotinin | not stated | not stated | not stated | not stated | |
| Glucagon | Atropine | not stated | not stated | not stated | not stated | |
| Ulinastatin | Gabexate | no | no | no | not stated | |
| Aprotinin | Glucagon | not stated | not stated | not stated | not stated | |
| Octerotide plus ulinastatin | Octreotide | yes | not stated | not stated | not stated | |
| Octreotide plus NSAID | Octreotide | not stated | not stated | not stated | not stated | |
| Ulinastatin | Octreotide | yes | yes | not stated | not stated | |
| Glucagon | Oxyphenonium | not stated | not stated | not stated | not stated | |
| Antibiotics | No active intervention | not stated | not stated | not stated | no | |
| Somatostatin plus gabexate | Somatostatin | yes | not stated | not stated | not stated | |
| Somatostatin plus ulinastatin | Somatostatin | yes | not stated | not stated | not stated | |
| Somatostatin plus ulinastatin | Somatostatin | yes | not stated | not stated | not stated | |
| Somatostatin plus ulinastatin plus gabexate | Somatostatin | yes | not stated | not stated | not stated | |
| Somatostatin plus ulinastatin | Somatostatin plus gabexate | yes | not stated | not stated | not stated | |
| Somatostatin plus ulinastatin plus gabexate | Somatostatin plus gabexate | yes | not stated | not stated | not stated | |
| Somatostatin plus ulinastatin plus gabexate | Somatostatin plus ulinastatin | yes | not stated | not stated | not stated |
| Study name | Intervention | Comparator | Number of participants in intervention | Number of participants in control | Mean or median (standard deviation or interquartile range, if reported) hospital stay in intervention group | Mean or median (standard deviation or interquartile range, if reported) hospital stay in control group | Difference | Statistical significance (P‐value if reported) |
| Antibiotics | No active intervention | 24 | 34 | 54 | 45 | 9 | Not significant | |
| Antibiotics | No active intervention | 11 | 12 | 27.8 | 22 | 5.8 | Not significant | |
| Antibiotics | No active intervention | 31 | 27 | 10.4 | 11.3 | −0.9 | Not significant | |
| Antibiotics | Placebo | 22 | 19 | 21 | 19 | 2 | Not significant (0.80) | |
| Antibiotics | No active intervention | 20 | 21 | 18 (7.2) | 25 (14.8) | −7 | Not significant | |
| Antibiotics | Placebo | 58 | 56 | 21 | 18 | 3 | Not significant | |
| Antibiotics | No active intervention | 50 | 52 | 30 | 32 | −2 | Not significant | |
| Antibiotics | No active intervention | 36 | 37 | 18 | 22 | −4 | Not significant (0.32) | |
| Antibiotics | No active intervention | 30 | 30 | 33.2 (22.1) | 43.8 (43.1) | −10.6 | Not significant (0.24) | |
| Antibiotics | No active intervention | 33 | 30 | 18.9 (8.1) | 23.8 (19.3) | −4.9 | Not significant | |
| Antibiotics | No active intervention | 20 | 21 | 18 (7.2) | 25 (14.8) | −7 | Not significant | |
| Antibiotics | No active intervention | 29 | 27 | 28.3 | 30.7 | −2.4 | Not significant | |
| Antioxidants | No active intervention | 19 | 20 | 12.8 | 15.1 | −2.3 | Not significant | |
| Antioxidants | No active intervention | 23 | 30 | 7.2 (5) | 10.3 (7) | −3.1 | Not significant (0.07) | |
| Antioxidants | Placebo | 22 | 21 | 20.4 (24.4) | 14.3 (15.7) | 6.1 | Not significant (0.34) | |
| Antioxidants | Placebo | 14 | 14 | 3 | 5 | −2 | Not significant (0.06) | |
| Aprotinin | No active intervention | 26 | 29 | 17.3 | 16.5 | 0.8 | Not significant | |
| Aprotinin | No active intervention | 22 | 26 | 25 (15‐32) | 33 (17‐38) | −8 | Not significant (0.24) | |
| Calcitonin | Placebo | 50 | 44 | 18.3 (6.4) | 20.2 (7.5) | −1.9 | Not significant | |
| Calcitonin | Placebo | 14 | 17 | 24 (20.2) | 30 (21.7) | −6 | Not significant | |
| Gabexate | Placebo | 115 | 108 | 26 (20‐43) | 23 (28‐34) | 3 | Not significant | |
| Glucagon | Placebo | 33 | 33 | 26 (28.7) | 20 (19.2) | 6 | Not significant | |
| Glucagon | Placebo | 33 | 36 | 32.6 | 26.9 | 5.7 | Not significant | |
| Iniprol | No active intervention | 15 | 9 | 14.7 (9.3) | 18.7 (10.2) | −4 | Not significant | |
| Lexipafant | Placebo | 151 | 139 | 9 | 10 | −1 | Not significant | |
| Lexipafant | Placebo | 26 | 24 | 13.3 | 14.9 | −1.6 | Not significant | |
| NSAID | Placebo | 27 | 30 | 9 | 10 | −1 | Not significant | |
| NSAID | Placebo | 14 | 16 | 13 | 15 | −2 | Not significant | |
| Octreotide | Placebo | 28 | 30 | 10 | 10 | 0 | Not significant | |
| Octreotide | Placebo | 90 | 90 | 7.3 | 8.2 | −0.9 | Not significant | |
| Octreotide | No active intervention | 19 | 19 | 17.9 (13.2) | 34.1 (22.7) | −16.2 | Significant (0.02) | |
| Octreotide | Placebo | 199 | 103 | 21.5 | 21 | 0.5 | Not significant | |
| (mild acute pancreatitis) | Octreotide | No active intervention | 157 | 79 | 14.4 | 15.37 | −0.97 | Not significant |
| (severe acute pancreatitis) | Octreotide | No active intervention | 91 | 45 | 16 | 16 | 0 | Not significant |
| Octreotide | No active intervention | 80 | 77 | 7.4 (2) | 11.8 (4) | −4.4 | Significant | |
| Probiotics | Placebo | 152 | 144 | 28.9 (41.5) | 23.5 (25.9) | 5.4 | Not significant (0.98) | |
| Probiotics | No active intervention | 33 | 29 | 14.9 | 19.7 | −4.8 | Not significant | |
| Probiotics | Placebo | 24 | 26 | 13.23 (18.19) | 9.69 (9.69) | 3.54 | Not significant (0.76) | |
| Activated protein C | Placebo | 16 | 16 | 17.1 | 34.4 | −17.3 | Significant (P < 0.05) | |
| Somatostatin | Placebo | 33 | 30 | 12 | 10 | 2 | Not significant | |
| Somatostatin | No active intervention | 50 | 50 | 14.92 (11.46) | 20.28 (15) | −5.36 | Significant | |
| Thymosin | Placebo | 12 | 12 | 37.1 (22.7) | 60.6 (32.9) | −23.5 | Not significant (0.06) | |
| (mild acute pancreatitis) | Ulinastatin | Placebo | 30 | 32 | 7 (5‐22) | 8 (5‐15) | −1 | Not significant (0.07) |
| (severe acute pancreatitis) | Ulinastatin | Placebo | 35 | 32 | 9 (6‐22) | 10 (6‐22) | −1 | Not significant (0.21) |
| Octerotide plus ulinastatin | Octreotide | 60 | 60 | 11.8 (3.9) | 23.7 (16.3) | −11.9 | Significant | |
| Somatostatin plus ulinastatin plus gabexate | Somatostatin | 116 | 122 | 17.7 (32.1) | 31.3 (37.6) | ‐13.6 | Significant | |
| Somatostatin plus ulinastatin | Somatostatin | 124 | 122 | 22.6 (34.5) | 31.3 (37.6) | ‐8.7 | Significant | |
| Somatostatin plus gabexate | Somatostatin | 130 | 122 | 23.2 (29.6) | 31.3 (37.6) | ‐8.1 | Significant | |
| Somatostatin plus ulinastatin plus gabexate | Somatostatin plus gabexate | 116 | 130 | 17.7 (32.1) | 23.2 (29.6) | −5.5 | Significant | |
| Somatostatin plus ulinastatin | Somatostatin plus gabexate | 124 | 130 | 22.6 (34.5) | 23.2 (29.6) | −0.6 | Significant | |
| Somatostatin plus ulinastatin plus gabexate | Somatostatin plus ulinastatin | 116 | 124 | 17.7 (32.1) | 22.6 (34.5) | −4.9 | Significant | |
| NSAID: non‐steroidal anti‐inflammatory drug. | ||||||||
| Study name | Intervention | Control | Number of participants in intervention | Number of participants in control | Mean or median (standard deviation or interquartile range, if reported) intensive care stay in intervention group | Mean or median (standard deviation or interquartile range, if reported) intensive care stay in control group | Difference | Statistical significance (P‐value, reported) |
| Antibiotics | Placebo | 22 | 19 | 17 | 18 | ‐1 | Not significant (P‐value = 0.83) | |
| Antibiotics | Placebo | 58 | 56 | 8 | 6 | 2 | Not significant | |
| Antibiotics | Placebo | 25 | 33 | 8 | 8 | 0 | Not significant | |
| Antibiotics | No active intervention | 36 | 37 | 8 | 7 | 1 | Not significant (P‐value = 0.78) | |
| Antibiotics | No active intervention | 30 | 30 | 12.7 (10.7) | 23.6 (28.7) | ‐10.9 | Not significant (P‐value = 0.06) | |
| Antibiotics | No active intervention | 33 | 30 | 11.4 (5.4) | 15.9 (12) | ‐4.5 | Not significant | |
| Antioxidants | Placebo | 22 | 21 | 4 (10.3) | 0 (0) | 4 | Not significant (P‐value = 0.08) | |
| Antioxidants | Placebo | 14 | 14 | 0 | 0 | 0 | Significant (P‐value = 0.03) | |
| Aprotinin | No active intervention | 22 | 26 | 9.5 (4 ‐ 10) | 12 (3‐20) | ‐2.5 | Not significant (P‐value = 0.47) | |
| Lexipafant | Placebo | 151 | 139 | 9.5 | 11 | ‐1.5 | Not significant | |
| Probiotics | Placebo | 152 | 144 | 6.6 (17.1) | 3 (9.3) | 3.6 | Not significant (P‐value = 0.08) | |
| Probiotics | Placebo | 24 | 26 | 4.94 (9.54) | 4 (5.86) | 0.94 | Not significant (P‐value = 0.94) | |
| Thymosin | Placebo | 12 | 12 | 24.6 (19.6) | 50.5 (25.7) | ‐25.9 | Significant (P‐value = 0.01) |
| Outcome or subgroup title | No. of studies | No. of participants | Statistical method | Effect size |
| 1 Short‐term mortality Show forest plot | 67 | Odds Ratio (M‐H, Fixed, 95% CI) | Subtotals only | |
| 1.1 Antibiotics versus control | 17 | 1058 | Odds Ratio (M‐H, Fixed, 95% CI) | 0.81 [0.57, 1.15] |
| 1.2 Antioxidants versus control | 4 | 163 | Odds Ratio (M‐H, Fixed, 95% CI) | 2.01 [0.53, 7.56] |
| 1.3 Aprotinin versus control | 7 | 651 | Odds Ratio (M‐H, Fixed, 95% CI) | 0.68 [0.40, 1.14] |
| 1.4 Calcitonin versus control | 2 | 125 | Odds Ratio (M‐H, Fixed, 95% CI) | 0.55 [0.15, 2.00] |
| 1.5 Cimetidine versus control | 1 | 40 | Odds Ratio (M‐H, Fixed, 95% CI) | 1.0 [0.06, 17.18] |
| 1.6 EDTA versus control | 1 | 64 | Odds Ratio (M‐H, Fixed, 95% CI) | 0.94 [0.12, 7.08] |
| 1.7 Gabexate versus control | 5 | 576 | Odds Ratio (M‐H, Fixed, 95% CI) | 0.79 [0.48, 1.30] |
| 1.8 Glucagon versus control | 5 | 409 | Odds Ratio (M‐H, Fixed, 95% CI) | 0.97 [0.51, 1.87] |
| 1.9 Iniprol versus control | 1 | 24 | Odds Ratio (M‐H, Fixed, 95% CI) | 0.14 [0.01, 1.67] |
| 1.10 Lexipafant versus control | 3 | 423 | Odds Ratio (M‐H, Fixed, 95% CI) | 0.55 [0.30, 1.01] |
| 1.11 Octreotide versus control | 5 | 927 | Odds Ratio (M‐H, Fixed, 95% CI) | 0.76 [0.47, 1.23] |
| 1.12 Probiotics versus control | 2 | 358 | Odds Ratio (M‐H, Fixed, 95% CI) | 1.70 [0.87, 3.30] |
| 1.13 Activated protein C versus control | 1 | 32 | Odds Ratio (M‐H, Fixed, 95% CI) | 8.56 [0.41, 180.52] |
| 1.14 Somatostatin versus control | 6 | 493 | Odds Ratio (M‐H, Fixed, 95% CI) | 0.57 [0.29, 1.10] |
| 1.15 Somatostatin plus omeprazole versus control | 1 | 140 | Odds Ratio (M‐H, Fixed, 95% CI) | 0.23 [0.05, 1.11] |
| 1.16 Somatostatin plus ulinastatin versus control | 1 | 122 | Odds Ratio (M‐H, Fixed, 95% CI) | 0.43 [0.15, 1.23] |
| 1.17 Thymosin versus control | 1 | 24 | Odds Ratio (M‐H, Fixed, 95% CI) | 0.0 [0.0, 0.0] |
| 1.18 Ulinastatin versus control | 1 | 132 | Odds Ratio (M‐H, Fixed, 95% CI) | 0.45 [0.12, 1.72] |
| 1.19 Gabexate versus aprotinin | 2 | 298 | Odds Ratio (M‐H, Fixed, 95% CI) | 0.62 [0.32, 1.20] |
| 1.20 Glucagon versus aprotinin | 1 | 134 | Odds Ratio (M‐H, Fixed, 95% CI) | 1.33 [0.44, 4.08] |
| 1.21 Glucagon versus atropine | 1 | 150 | Odds Ratio (M‐H, Fixed, 95% CI) | 4.17 [0.45, 38.21] |
| 1.22 Octreotide plus ulinastatin versus octreotide | 1 | 120 | Odds Ratio (M‐H, Fixed, 95% CI) | 0.31 [0.06, 1.60] |
| 1.23 Somatostatin plus gabexate versus somatostatin | 1 | 252 | Odds Ratio (M‐H, Fixed, 95% CI) | 0.93 [0.37, 2.33] |
| 1.24 Somatostatin plus ulinastatin versus somatostatin | 2 | 369 | Odds Ratio (M‐H, Fixed, 95% CI) | 0.73 [0.34, 1.56] |
| 1.25 Somatostatin plus ulinastatin plus gabexate versus somatostatin | 1 | 238 | Odds Ratio (M‐H, Fixed, 95% CI) | 0.61 [0.21, 1.74] |
| 1.26 Somatostatin plus ulinastatin versus somatostatin plus gabexate | 1 | 254 | Odds Ratio (M‐H, Fixed, 95% CI) | 0.72 [0.26, 1.95] |
| 1.27 Somatostatin plus ulinastatin plus gabexate versus somatostatin plus gabexate | 1 | 246 | Odds Ratio (M‐H, Fixed, 95% CI) | 0.65 [0.23, 1.86] |
| 1.28 Somatostatin plus ulinastatin plus gabexate versus somatostatin plus ulinastatin | 1 | 240 | Odds Ratio (M‐H, Fixed, 95% CI) | 0.91 [0.30, 2.80] |
| 2 Serious adverse events (proportion) Show forest plot | 17 | Odds Ratio (M‐H, Fixed, 95% CI) | Subtotals only | |
| 2.1 Antibiotics versus control | 5 | 304 | Odds Ratio (M‐H, Fixed, 95% CI) | 0.65 [0.37, 1.15] |
| 2.2 Antioxidants versus control | 2 | 82 | Odds Ratio (M‐H, Fixed, 95% CI) | 1.98 [0.48, 8.13] |
| 2.3 EDTA versus control | 1 | 64 | Odds Ratio (M‐H, Fixed, 95% CI) | 0.52 [0.11, 2.39] |
| 2.4 Gabexate versus control | 2 | 201 | Odds Ratio (M‐H, Fixed, 95% CI) | 1.31 [0.31, 5.60] |
| 2.5 Glucagon versus control | 2 | 127 | Odds Ratio (M‐H, Fixed, 95% CI) | 0.29 [0.01, 7.46] |
| 2.6 Octreotide versus control | 1 | 58 | Odds Ratio (M‐H, Fixed, 95% CI) | 1.73 [0.61, 4.93] |
| 2.7 Somatostatin versus control | 2 | 111 | Odds Ratio (M‐H, Fixed, 95% CI) | 1.07 [0.35, 3.27] |
| 2.8 Gabexate versus aprotinin | 1 | 116 | Odds Ratio (M‐H, Fixed, 95% CI) | 1.05 [0.22, 4.91] |
| 2.9 Ulinastatin versus gabexate | 1 | 62 | Odds Ratio (M‐H, Fixed, 95% CI) | 0.0 [0.0, 0.0] |
| 3 Serious adverse events (number) Show forest plot | 37 | Rate Ratio (Fixed, 95% CI) | Subtotals only | |
| 3.1 Antibiotics versus control | 12 | 716 | Rate Ratio (Fixed, 95% CI) | 0.86 [0.68, 1.07] |
| 3.2 Antioxidants versus control | 2 | 71 | Rate Ratio (Fixed, 95% CI) | 0.22 [0.02, 2.21] |
| 3.3 Aprotinin versus control | 3 | 264 | Rate Ratio (Fixed, 95% CI) | 0.79 [0.49, 1.29] |
| 3.4 Cimetidine versus control | 1 | 60 | Rate Ratio (Fixed, 95% CI) | 1.0 [0.20, 4.95] |
| 3.5 EDTA versus control | 1 | 64 | Rate Ratio (Fixed, 95% CI) | 0.94 [0.19, 4.65] |
| 3.6 Gabexate versus control | 3 | 375 | Rate Ratio (Fixed, 95% CI) | 0.86 [0.64, 1.15] |
| 3.7 Glucagon versus control | 1 | 68 | Rate Ratio (Fixed, 95% CI) | 1.0 [0.02, 50.40] |
| 3.8 Lexipafant versus control | 1 | 290 | Rate Ratio (Fixed, 95% CI) | 0.67 [0.46, 0.96] |
| 3.9 Octreotide versus control | 4 | 770 | Rate Ratio (Fixed, 95% CI) | 0.74 [0.60, 0.89] |
| 3.10 Probiotics versus control | 3 | 397 | Rate Ratio (Fixed, 95% CI) | 0.94 [0.65, 1.36] |
| 3.11 Somatostatin versus control | 3 | 257 | Rate Ratio (Fixed, 95% CI) | 1.03 [0.66, 1.59] |
| 3.12 Somatostatin plus omeprazole versus control | 1 | 140 | Rate Ratio (Fixed, 95% CI) | 0.36 [0.19, 0.70] |
| 3.13 Somatostatin plus ulinastatin versus control | 1 | 122 | Rate Ratio (Fixed, 95% CI) | 0.30 [0.15, 0.60] |
| 3.14 Glucagon versus atropine | 1 | 150 | Rate Ratio (Fixed, 95% CI) | 0.33 [0.03, 3.20] |
| 3.15 Octreotide plus ulinastatin versus octreotide | 1 | 120 | Rate Ratio (Fixed, 95% CI) | 0.30 [0.17, 0.51] |
| 3.16 Somatostatin plus ulinastatin versus somatostatin | 1 | 123 | Rate Ratio (Fixed, 95% CI) | 0.28 [0.15, 0.56] |
| 4 Organ failure Show forest plot | 18 | Odds Ratio (M‐H, Random, 95% CI) | Subtotals only | |
| 4.1 Antibiotics versus control | 5 | 258 | Odds Ratio (M‐H, Random, 95% CI) | 0.78 [0.44, 1.38] |
| 4.2 Antioxidants versus control | 4 | 163 | Odds Ratio (M‐H, Random, 95% CI) | 0.92 [0.39, 2.12] |
| 4.3 Gabexate versus control | 1 | 50 | Odds Ratio (M‐H, Random, 95% CI) | 0.32 [0.01, 8.25] |
| 4.4 Lexipafant versus control | 2 | 340 | Odds Ratio (M‐H, Random, 95% CI) | 0.68 [0.36, 1.27] |
| 4.5 Octreotide versus control | 2 | 430 | Odds Ratio (M‐H, Random, 95% CI) | 0.51 [0.27, 0.97] |
| 4.6 Probiotics versus control | 2 | 358 | Odds Ratio (M‐H, Random, 95% CI) | 0.80 [0.26, 2.47] |
| 4.7 Ulinastatin versus control | 1 | 129 | Odds Ratio (M‐H, Random, 95% CI) | 0.27 [0.01, 6.67] |
| 4.8 Somatostatin plus gabexate versus somatostatin | 1 | 252 | Odds Ratio (M‐H, Random, 95% CI) | 0.78 [0.33, 1.80] |
| 4.9 Somatostatin plus ulinastatin versus somatostatin | 1 | 246 | Odds Ratio (M‐H, Random, 95% CI) | 0.58 [0.23, 1.45] |
| 4.10 Somatostatin plus ulinastatin plus gabexate versus somatostatin | 1 | 238 | Odds Ratio (M‐H, Random, 95% CI) | 0.46 [0.17, 1.25] |
| 4.11 Somatostatin plus ulinastatin versus somatostatin plus gabexate | 1 | 254 | Odds Ratio (M‐H, Random, 95% CI) | 0.75 [0.29, 1.92] |
| 4.12 Somatostatin plus ulinastatin plus gabexate versus somatostatin plus gabexate | 1 | 246 | Odds Ratio (M‐H, Random, 95% CI) | 0.59 [0.21, 1.65] |
| 4.13 Somatostatin plus ulinastatin plus gabexate versus somatostatin plus ulinastatin | 1 | 240 | Odds Ratio (M‐H, Random, 95% CI) | 0.79 [0.27, 2.35] |
| 5 Infected pancreatic necrosis Show forest plot | 15 | Odds Ratio (M‐H, Fixed, 95% CI) | Subtotals only | |
| 5.1 Antibiotics versus control | 11 | 714 | Odds Ratio (M‐H, Fixed, 95% CI) | 0.82 [0.53, 1.25] |
| 5.2 Octreotide versus control | 1 | 58 | Odds Ratio (M‐H, Fixed, 95% CI) | 0.52 [0.04, 6.06] |
| 5.3 Probiotics versus control | 3 | 397 | Odds Ratio (M‐H, Fixed, 95% CI) | 1.10 [0.62, 1.96] |
| 6 Sepsis Show forest plot | 11 | Odds Ratio (M‐H, Random, 95% CI) | Subtotals only | |
| 6.1 Antibiotics versus control | 1 | 60 | Odds Ratio (M‐H, Random, 95% CI) | 0.42 [0.11, 1.60] |
| 6.2 Aprotinin versus control | 2 | 103 | Odds Ratio (M‐H, Random, 95% CI) | 1.84 [0.49, 6.96] |
| 6.3 Gabexate versus control | 3 | 373 | Odds Ratio (M‐H, Random, 95% CI) | 1.10 [0.55, 2.19] |
| 6.4 Lexipafant versus control | 1 | 290 | Odds Ratio (M‐H, Random, 95% CI) | 0.26 [0.08, 0.83] |
| 6.5 Octreotide versus control | 2 | 340 | Odds Ratio (M‐H, Random, 95% CI) | 0.40 [0.05, 3.53] |
| 6.6 Probiotics versus control | 1 | 62 | Odds Ratio (M‐H, Random, 95% CI) | 0.36 [0.10, 1.36] |
| 6.7 Gabexate versus aprotinin | 1 | 116 | Odds Ratio (M‐H, Random, 95% CI) | 1.05 [0.22, 4.91] |
| 7 Adverse events (proportion) Show forest plot | 27 | Odds Ratio (M‐H, Fixed, 95% CI) | Subtotals only | |
| 7.1 Antibiotics versus control | 6 | 429 | Odds Ratio (M‐H, Fixed, 95% CI) | 0.51 [0.32, 0.80] |
| 7.2 Antioxidants versus control | 1 | 39 | Odds Ratio (M‐H, Fixed, 95% CI) | 0.0 [0.0, 0.0] |
| 7.3 Calcitonin versus control | 1 | 94 | Odds Ratio (M‐H, Fixed, 95% CI) | 0.88 [0.12, 6.49] |
| 7.4 EDTA versus control | 1 | 64 | Odds Ratio (M‐H, Fixed, 95% CI) | 0.79 [0.27, 2.31] |
| 7.5 Gabexate versus control | 3 | 373 | Odds Ratio (M‐H, Fixed, 95% CI) | 0.83 [0.54, 1.27] |
| 7.6 Glucagon versus control | 2 | 127 | Odds Ratio (M‐H, Fixed, 95% CI) | 0.09 [0.00, 1.69] |
| 7.7 Lexipafant versus control | 1 | 83 | Odds Ratio (M‐H, Fixed, 95% CI) | 0.43 [0.16, 1.12] |
| 7.8 Octreotide versus control | 3 | 398 | Odds Ratio (M‐H, Fixed, 95% CI) | 1.00 [0.65, 1.55] |
| 7.9 Probiotics versus control | 1 | 62 | Odds Ratio (M‐H, Fixed, 95% CI) | 0.35 [0.12, 1.01] |
| 7.10 Somatostatin versus control | 2 | 111 | Odds Ratio (M‐H, Fixed, 95% CI) | 0.44 [0.19, 1.02] |
| 7.11 Somatostatin plus omeprazole versus control | 1 | 140 | Odds Ratio (M‐H, Fixed, 95% CI) | 0.00 [0.00, 0.04] |
| 7.12 Gabexate versus aprotinin | 2 | 298 | Odds Ratio (M‐H, Fixed, 95% CI) | 0.41 [0.23, 0.70] |
| 7.13 Ulinastatin versus gabexate | 1 | 62 | Odds Ratio (M‐H, Fixed, 95% CI) | 0.0 [0.0, 0.0] |
| 7.14 Ulinastatin versus octreotide | 1 | 25 | Odds Ratio (M‐H, Fixed, 95% CI) | 2.33 [0.46, 11.81] |
| 7.15 Somatostatin plus gabexate versus somatostatin | 1 | 252 | Odds Ratio (M‐H, Fixed, 95% CI) | 0.93 [0.44, 1.95] |
| 7.16 Somatostatin plus ulinastatin versus somatostatin | 1 | 246 | Odds Ratio (M‐H, Fixed, 95% CI) | 0.58 [0.25, 1.34] |
| 7.17 Somatostatin plus ulinastatin plus gabexate versus somatostatin | 1 | 238 | Odds Ratio (M‐H, Fixed, 95% CI) | 0.49 [0.20, 1.20] |
| 7.18 Somatostatin plus ulinastatin versus somatostatin plus gabexate | 1 | 254 | Odds Ratio (M‐H, Fixed, 95% CI) | 0.63 [0.27, 1.44] |
| 7.19 Somatostatin plus ulinastatin plus gabexate versus somatostatin plus gabexate | 1 | 246 | Odds Ratio (M‐H, Fixed, 95% CI) | 0.53 [0.22, 1.28] |
| 7.20 Somatostatin plus ulinastatin plus gabexate versus somatostatin plus ulinastatin | 1 | 240 | Odds Ratio (M‐H, Fixed, 95% CI) | 0.84 [0.32, 2.22] |
| 8 Adverse events (number) Show forest plot | 40 | Rate Ratio (Random, 95% CI) | Subtotals only | |
| 8.1 Antibiotics versus control | 12 | 755 | Rate Ratio (Random, 95% CI) | 0.75 [0.58, 0.95] |
| 8.2 Antioxidants versus control | 2 | 94 | Rate Ratio (Random, 95% CI) | 0.82 [0.38, 1.79] |
| 8.3 Aprotinin versus control | 3 | 264 | Rate Ratio (Random, 95% CI) | 0.98 [0.69, 1.39] |
| 8.4 Calcitonin versus control | 1 | 94 | Rate Ratio (Random, 95% CI) | 0.88 [0.12, 6.25] |
| 8.5 Cimetidine versus control | 1 | 60 | Rate Ratio (Random, 95% CI) | 1.14 [0.64, 2.02] |
| 8.6 EDTA versus control | 1 | 64 | Rate Ratio (Random, 95% CI) | 0.63 [0.28, 1.39] |
| 8.7 Gabexate versus control | 3 | 375 | Rate Ratio (Random, 95% CI) | 0.76 [0.61, 0.95] |
| 8.8 Glucagon versus control | 2 | 90 | Rate Ratio (Random, 95% CI) | 1.19 [0.51, 2.80] |
| 8.9 Lexipafant versus control | 1 | 290 | Rate Ratio (Random, 95% CI) | 0.61 [0.44, 0.85] |
| 8.10 Octreotide versus control | 4 | 634 | Rate Ratio (Random, 95% CI) | 0.78 [0.58, 1.05] |
| 8.11 Probiotics versus control | 3 | 397 | Rate Ratio (Random, 95% CI) | 0.84 [0.52, 1.36] |
| 8.12 Somatostatin versus control | 2 | 134 | Rate Ratio (Random, 95% CI) | 0.75 [0.26, 2.18] |
| 8.13 Ulinastatin versus control | 1 | 129 | Rate Ratio (Random, 95% CI) | 0.69 [0.32, 1.46] |
| 8.14 Gabexate versus aprotinin | 1 | 182 | Rate Ratio (Random, 95% CI) | 0.66 [0.38, 1.14] |
| 8.15 Glucagon versus atropine | 1 | 150 | Rate Ratio (Random, 95% CI) | 0.79 [0.36, 1.73] |
| 8.16 Oxyphenonium versus glucagon | 1 | 62 | Rate Ratio (Random, 95% CI) | 0.93 [0.65, 1.34] |
| 8.17 Octreotide plus ulinastatin versus octreotide | 1 | 120 | Rate Ratio (Random, 95% CI) | 0.29 [0.17, 0.48] |
| 9 Requirement for additional invasive intervention Show forest plot | 32 | Odds Ratio (M‐H, Fixed, 95% CI) | Subtotals only | |
| 9.1 Antibiotics versus control | 14 | 884 | Odds Ratio (M‐H, Fixed, 95% CI) | 0.82 [0.59, 1.13] |
| 9.2 Aprotinin versus control | 2 | 237 | Odds Ratio (M‐H, Fixed, 95% CI) | 0.59 [0.23, 1.47] |
| 9.3 Calcitonin versus control | 2 | 125 | Odds Ratio (M‐H, Fixed, 95% CI) | 0.30 [0.08, 1.16] |
| 9.4 Cimetidine versus control | 1 | 60 | Odds Ratio (M‐H, Fixed, 95% CI) | 0.13 [0.01, 2.61] |
| 9.5 EDTA versus control | 1 | 64 | Odds Ratio (M‐H, Fixed, 95% CI) | 0.68 [0.14, 3.29] |
| 9.6 Gabexate versus control | 3 | 426 | Odds Ratio (M‐H, Fixed, 95% CI) | 0.58 [0.37, 0.90] |
| 9.7 Glucagon versus control | 2 | 260 | Odds Ratio (M‐H, Fixed, 95% CI) | 1.26 [0.58, 2.77] |
| 9.8 Octreotide versus control | 3 | 854 | Odds Ratio (M‐H, Fixed, 95% CI) | 0.76 [0.48, 1.21] |
| 9.9 Probiotics versus control | 2 | 358 | Odds Ratio (M‐H, Fixed, 95% CI) | 1.50 [0.83, 2.71] |
| 9.10 Somatostatin versus control | 1 | 100 | Odds Ratio (M‐H, Fixed, 95% CI) | 0.40 [0.11, 1.38] |
| 9.11 Gabexate versus aprotinin | 1 | 182 | Odds Ratio (M‐H, Fixed, 95% CI) | 0.5 [0.19, 1.32] |
| 9.12 Glucagon versus aprotinin | 1 | 134 | Odds Ratio (M‐H, Fixed, 95% CI) | 1.33 [0.44, 4.08] |
| 9.13 Oxyphenonium versus glucagon | 1 | 62 | Odds Ratio (M‐H, Fixed, 95% CI) | 1.0 [0.13, 7.59] |
| 10 Endoscopic or radiological drainage of collections Show forest plot | 3 | Odds Ratio (M‐H, Fixed, 95% CI) | Subtotals only | |
| 10.1 Antibiotics versus control | 1 | 23 | Odds Ratio (M‐H, Fixed, 95% CI) | 0.33 [0.01, 9.07] |
| 10.2 Octreotide versus control | 1 | 372 | Odds Ratio (M‐H, Fixed, 95% CI) | 0.89 [0.40, 1.96] |
| 10.3 Probiotics versus control | 1 | 39 | Odds Ratio (M‐H, Fixed, 95% CI) | 0.94 [0.20, 4.44] |
| Outcome or subgroup title | No. of studies | No. of participants | Statistical method | Effect size |
| 1 Short‐term mortality Show forest plot | 11 | Odds Ratio (M‐H, Fixed, 95% CI) | Subtotals only | |
| 1.1 Antibiotics versus control | 10 | 683 | Odds Ratio (M‐H, Fixed, 95% CI) | 0.82 [0.52, 1.30] |
| 1.2 Gabexate versus aprotinin | 1 | 116 | Odds Ratio (M‐H, Fixed, 95% CI) | 0.52 [0.20, 1.36] |
| 2 Serious adverse events (proportion) Show forest plot | 5 | Odds Ratio (M‐H, Fixed, 95% CI) | Subtotals only | |
| 2.1 Antibiotics versus control | 4 | 281 | Odds Ratio (M‐H, Fixed, 95% CI) | 0.84 [0.46, 1.54] |
| 2.2 Gabexate versus aprotinin | 1 | 116 | Odds Ratio (M‐H, Fixed, 95% CI) | 1.05 [0.22, 4.91] |
| 3 Serious adverse events (number) Show forest plot | 7 | Rate Ratio (Fixed, 95% CI) | Subtotals only | |
| 3.1 Antibiotics versus control | 7 | Rate Ratio (Fixed, 95% CI) | 0.79 [0.59, 1.06] | |
| 4 Organ failure Show forest plot | 4 | Odds Ratio (M‐H, Random, 95% CI) | Subtotals only | |
| 4.1 Antibiotics versus control | 4 | 211 | Odds Ratio (M‐H, Random, 95% CI) | 0.78 [0.42, 1.45] |
| 5 Infected pancreatic necrosis Show forest plot | 6 | Odds Ratio (M‐H, Fixed, 95% CI) | Subtotals only | |
| 5.1 Antibiotics versus control | 6 | 426 | Odds Ratio (M‐H, Fixed, 95% CI) | 0.85 [0.51, 1.42] |
| 6 Sepsis Show forest plot | 2 | Odds Ratio (M‐H, Random, 95% CI) | Subtotals only | |
| 6.1 Antibiotics versus control | 1 | 60 | Odds Ratio (M‐H, Random, 95% CI) | 0.42 [0.11, 1.60] |
| 6.2 Gabexate versus aprotinin | 1 | 116 | Odds Ratio (M‐H, Random, 95% CI) | 1.05 [0.22, 4.91] |
| Outcome or subgroup title | No. of studies | No. of participants | Statistical method | Effect size |
| 1 Short‐term mortality Show forest plot | 22 | Odds Ratio (M‐H, Fixed, 95% CI) | Subtotals only | |
| 1.1 Antibiotics versus control | 9 | 542 | Odds Ratio (M‐H, Fixed, 95% CI) | 0.82 [0.53, 1.27] |
| 1.2 Aprotinin versus control | 2 | 103 | Odds Ratio (M‐H, Fixed, 95% CI) | 0.66 [0.19, 2.30] |
| 1.3 Calcitonin versus control | 1 | 31 | Odds Ratio (M‐H, Fixed, 95% CI) | 0.78 [0.11, 5.46] |
| 1.4 Gabexate versus control | 1 | 52 | Odds Ratio (M‐H, Fixed, 95% CI) | 0.19 [0.04, 0.99] |
| 1.5 Probiotics versus control | 1 | 62 | Odds Ratio (M‐H, Fixed, 95% CI) | 0.25 [0.05, 1.34] |
| 1.6 Activated protein C versus control | 1 | 32 | Odds Ratio (M‐H, Fixed, 95% CI) | 8.56 [0.41, 180.52] |
| 1.7 Somatostatin versus control | 2 | 182 | Odds Ratio (M‐H, Fixed, 95% CI) | 0.51 [0.21, 1.23] |
| 1.8 Somatostatin plus omeprazole versus control | 1 | 140 | Odds Ratio (M‐H, Fixed, 95% CI) | 0.23 [0.05, 1.11] |
| 1.9 Somatostatin plus ulinastatin versus control | 1 | 122 | Odds Ratio (M‐H, Fixed, 95% CI) | 0.43 [0.15, 1.23] |
| 1.10 Thymosin versus control | 1 | 24 | Odds Ratio (M‐H, Fixed, 95% CI) | 0.0 [0.0, 0.0] |
| 1.11 Ulinastatin versus control | 1 | 70 | Odds Ratio (M‐H, Fixed, 95% CI) | 0.24 [0.04, 1.29] |
| 1.12 Octreotide plus ulinastatin versus octreotide | 1 | 120 | Odds Ratio (M‐H, Fixed, 95% CI) | 0.31 [0.06, 1.60] |
| 1.13 Somatostatin plus gabexate versus somatostatin | 1 | 252 | Odds Ratio (M‐H, Fixed, 95% CI) | 0.93 [0.37, 2.33] |
| 1.14 Somatostatin plus ulinastatin versus somatostatin | 2 | 369 | Odds Ratio (M‐H, Fixed, 95% CI) | 0.73 [0.34, 1.56] |
| 1.15 Somatostatin plus ulinastatin plus gabexate versus somatostatin | 1 | 238 | Odds Ratio (M‐H, Fixed, 95% CI) | 0.61 [0.21, 1.74] |
| 1.16 Somatostatin plus ulinastatin versus somatostatin plus gabexate | 1 | 254 | Odds Ratio (M‐H, Fixed, 95% CI) | 0.72 [0.26, 1.95] |
| 1.17 Somatostatin plus ulinastatin plus gabexate versus somatostatin plus gabexate | 1 | 246 | Odds Ratio (M‐H, Fixed, 95% CI) | 0.65 [0.23, 1.86] |
| 1.18 Somatostatin plus ulinastatin plus gabexate versus somatostatin plus ulinastatin | 1 | 240 | Odds Ratio (M‐H, Fixed, 95% CI) | 0.91 [0.30, 2.80] |
| 2 Serious adverse events (proportion) Show forest plot | 3 | Odds Ratio (M‐H, Fixed, 95% CI) | Subtotals only | |
| 2.1 Antibiotics versus control | 3 | 164 | Odds Ratio (M‐H, Fixed, 95% CI) | 0.56 [0.27, 1.18] |
| 3 Serious adverse events (number) Show forest plot | 13 | Rate Ratio (Random, 95% CI) | Subtotals only | |
| 3.1 Antibiotics versus control | 5 | Rate Ratio (Random, 95% CI) | 0.81 [0.52, 1.25] | |
| 3.2 Aprotinin versus control | 2 | Rate Ratio (Random, 95% CI) | 0.65 [0.25, 1.71] | |
| 3.3 Gabexate versus control | 1 | Rate Ratio (Random, 95% CI) | 0.64 [0.37, 1.10] | |
| 3.4 Probiotics versus control | 2 | Rate Ratio (Random, 95% CI) | 0.62 [0.24, 1.59] | |
| 3.5 Somatostatin versus control | 1 | Rate Ratio (Random, 95% CI) | 1.07 [0.67, 1.69] | |
| 3.6 Somatostatin plus omeprazole versus control | 1 | Rate Ratio (Random, 95% CI) | 0.36 [0.19, 0.70] | |
| 3.7 Somatostatin plus ulinastatin versus control | 1 | Rate Ratio (Random, 95% CI) | 0.30 [0.15, 0.60] | |
| 3.8 Octreotide plus ulinastatin versus octreotide | 1 | Rate Ratio (Random, 95% CI) | 0.30 [0.17, 0.51] | |
| 3.9 Somatostatin plus ulinastatin versus somatostatin | 1 | Rate Ratio (Random, 95% CI) | 0.28 [0.15, 0.56] | |
| 4 Organ failure Show forest plot | 6 | Odds Ratio (M‐H, Fixed, 95% CI) | Subtotals only | |
| 4.1 Antibiotics versus control | 3 | 137 | Odds Ratio (M‐H, Fixed, 95% CI) | 0.89 [0.40, 1.99] |
| 4.2 Lexipafant versus control | 0 | 0 | Odds Ratio (M‐H, Fixed, 95% CI) | 0.0 [0.0, 0.0] |
| 4.3 Probiotics versus control | 1 | 62 | Odds Ratio (M‐H, Fixed, 95% CI) | 0.40 [0.12, 1.36] |
| 4.4 Ulinastatin versus control | 1 | 67 | Odds Ratio (M‐H, Fixed, 95% CI) | 0.05 [0.01, 0.21] |
| 4.5 Somatostatin plus gabexate versus somatostatin | 1 | 252 | Odds Ratio (M‐H, Fixed, 95% CI) | 0.78 [0.33, 1.80] |
| 4.6 Somatostatin plus ulinastatin versus somatostatin | 1 | 246 | Odds Ratio (M‐H, Fixed, 95% CI) | 0.58 [0.23, 1.45] |
| 4.7 Somatostatin plus ulinastatin plus gabexate versus somatostatin | 1 | 238 | Odds Ratio (M‐H, Fixed, 95% CI) | 0.46 [0.17, 1.25] |
| 4.8 Somatostatin plus ulinastatin versus somatostatin plus gabexate | 1 | 254 | Odds Ratio (M‐H, Fixed, 95% CI) | 0.75 [0.29, 1.92] |
| 4.9 Somatostatin plus ulinastatin plus gabexate versus somatostatin plus gabexate | 1 | 246 | Odds Ratio (M‐H, Fixed, 95% CI) | 0.59 [0.21, 1.65] |
| 4.10 Somatostatin plus ulinastatin plus gabexate versus somatostatin plus ulinastatin | 1 | 240 | Odds Ratio (M‐H, Fixed, 95% CI) | 0.79 [0.27, 2.35] |
| 5 Infected pancreatic necrosis Show forest plot | 8 | Odds Ratio (M‐H, Fixed, 95% CI) | Subtotals only | |
| 5.1 Antibiotics versus control | 6 | 341 | Odds Ratio (M‐H, Fixed, 95% CI) | 0.73 [0.41, 1.33] |
| 5.2 Probiotics versus control | 2 | 101 | Odds Ratio (M‐H, Fixed, 95% CI) | 0.60 [0.22, 1.68] |
| 6 Sepsis Show forest plot | 3 | Odds Ratio (M‐H, Fixed, 95% CI) | Subtotals only | |
| 6.1 Aprotinin versus control | 2 | 103 | Odds Ratio (M‐H, Fixed, 95% CI) | 1.87 [0.50, 6.98] |
| 6.2 Probiotics versus control | 1 | 62 | Odds Ratio (M‐H, Fixed, 95% CI) | 0.36 [0.10, 1.36] |