Tratamiento complementario con esteroides para la tuberculosis pulmonar
Resumen
Antecedentes
La tuberculosis causa cerca de 8 600 000 episodios de enfermedad y 1 300 000 muertes por año en todo el mundo. Aunque el tratamiento estandarizado cura la enfermedad, los resultados para algunas formas de tuberculosis mejoran al administrar tratamiento complementario con corticosteroides. Se desconoce si el tratamiento con corticosteroides sería beneficioso para los pacientes con tuberculosis pulmonar.
Objetivos
Evaluar si el tratamiento complementario con corticosteroides reduce la mortalidad, acelera la recuperación clínica o la recuperación microbiológica en pacientes con tuberculosis pulmonar.
Métodos de búsqueda
Se identificaron estudios indexados desde 1966 hasta mayo 2014 mediante la búsqueda: registro de ensayos del Grupo Cochrane de Enfermedades Infecciosas (Cochrane Infectious Diseases Group), Registro Cochrane Central de Ensayos Controlados (Cochrane Central Register of Controlled Trials), MEDLINE,EMBASE y LILACS utilizando términos de búsqueda comparativos. Se realizaron búsquedas manuales en listas de referencias de todos los estudios identificados y en revisiones anteriores y se estableció contacto con investigadores relevantes, organizaciones y empresas para identificar literatura gris.
Criterios de selección
Se incluyeron ensayos controlados aleatorios y ensayos controlados cuasialeatorios de regímenes de combinación antimicrobianos reconocidos y del tratamiento con corticosteroides a cualquier dosis o duración en comparación con ningún tratamiento con corticosteroides o placebo en pacientes con tuberculosis pulmonar.
Obtención y análisis de los datos
Al menos dos investigadores evaluaron de forma independiente la calidad de los ensayos y recopilaron los datos mediante formularios de extracción de datos previamente especificados. Los hallazgos se informaron de forma narrativa o en tablas. Cuando fue apropiado, se utilizaron los modelos de metanálisis de Mantel‐Haenszel para calcular los cocientes de riesgos.
Resultados principales
Se identificaron 18 ensayos con 3816 participantes, que cumplieron los criterios de inclusión. En comparación con placebo o ningún esteroide, la administración de corticosteroides no mostró una reducción en la mortalidad por todas las causas, ni dio lugar a una conversión mayor del esputo a los dos meses o a los seis meses (mortalidad: CR 0,77; IC del 95%: 0,51 a 1,15; 3815 participantes, 18 estudios, pruebas de baja calidad; conversión del esputo a los dos meses CR 1,03; IC del 95%: 0,97 a 1,09; 2750 participantes, 12 estudios; a los 6 meses; CR 1,01; IC del 95%: 1,01; IC del 95%: 0,98 a 1,04; 2150 participantes, nueve estudios, ambas pruebas de baja calidad). Sin embargo, se encontró que la administración de corticosteroides incrementa el aumento de peso (datos no agrupados, ocho ensayos, 1203 participantes, pruebas de baja calidad), disminuye la duración de la estancia hospitalaria (datos no agrupados, tres ensayos, 379 participantes, pruebas de muy baja calidad) y aumenta la mejoría clínica en el plazo de un mes (CR 1,16; IC del 95%: 1,09 a 1,24; cinco ensayos, 497 participantes, pruebas de calidad baja).
Conclusiones de los autores
Es improbable que el tratamiento complementario con corticosteroides proporcione beneficios importantes en pacientes con tuberculosis pulmonar. Los beneficios clínicos que se encontraron a corto plazo no parecieron mantenerse a largo plazo. Sin embargo, las pruebas disponibles hasta la fecha son de baja calidad. Para evaluar si los corticosteroides complementarios reducen la mortalidad, o aceleran la recuperación clínica o microbiológica en los pacientes con tuberculosis pulmonar, se necesitan ensayos controlados aleatorios grandes adicionales con la potencia estadística suficiente para detectar cambios en dichos resultados.
PICO
Resumen en términos sencillos
Tratamiento complementario con esteroides para la tuberculosis pulmonar
La tuberculosis pulmonar es una enfermedad infecciosa común. Aunque la enfermedad es curable con fármacos estándar contra la tuberculosis pulmonar, se ha informado que la recuperación de los pacientes podría mejorar al agregar corticosteroides al tratamiento. Las guías clínicas actuales aconsejan la administración de corticosteroides para el tratamiento de otros tipos de tuberculosis; la meningitis tuberculosa y la pericarditis tuberculosa. Aún no se conoce si los corticosteroides serían beneficiosos en el tratamiento de la tuberculosis pulmonar. Después de examinar las pruebas disponibles hasta la fecha, se encontró que no había datos de alta calidad suficientes para apoyar o rechazar la administración de corticosteroides junto con fármacos contra la tuberculosis pulmonar.
Conclusiones de los autores
Summary of findings
| Steroid therapy comparative to either no therapy or placebo for managing pulmonary tuberculosis | ||||||
| Patient or population: patients with managing pulmonary tuberculosis | ||||||
| Outcomes | Illustrative comparative risks* (95% CI) | Relative effect | No of Participants | Quality of the evidence | Comments | |
| Assumed risk | Corresponding risk | |||||
| Control | Steroid therapy comparative to either no therapy or placebo | |||||
| All‐cause mortality | 27 per 1000 | 21 per 1000 | RR 0.77 | 3815 | ⊕⊕⊝⊝ | |
| Sputum Conversion by 2 months | 656 per 1000 | 722 per 1000 | RR 1.1 | 1475 | ⊕⊕⊝⊝ | |
| Sputum conversion at 6 months | Study population | RR 1.01 | 875 | ⊕⊕⊕⊝ | ||
| 911 per 1000 | 920 per 1000 | |||||
| Clinical Improvement at 1 month | Study population | RR 1.16 | 497 | ⊕⊝⊝⊝ | ||
| 794 per 1000 | 921 per 1000 | |||||
| *The assumed risk is the mean control group risk across studies. The corresponding risk (and its 95% confidence interval) is based on the assumed risk in the comparison group and the relative effect of the intervention (and its 95% CI). | ||||||
| GRADE Working Group grades of evidence | ||||||
| 1 Not downgraded for risk of bias: Most of these studies were conducted in the 1960s and provided minimal detail on trial methods. However, the most recent trial from 2005 was well conducted and showed no evidence of clinical benefit with steroids. | ||||||
Antecedentes
La tuberculosis (TB) es una enfermedad infecciosa crónica que causa una carga alta de mortalidad y morbilidad a nivel global. En 2012 aproximadamente 1 300 000 de muertes y 8 600 000 de episodios de enfermedad se debieron a la TB (WHO 2013). Se propaga, más comúnmente, por transmisión horizontal cuando un individuo inhala microgotas de las vías respiratorias con Mycobacterium tuberculosis que han sido expulsadas por un individuo con TB activa. La tuberculosis se clasifica ampliamente como pulmonar o extrapulmonar en función del sitio de la infección. La tuberculosis pulmonar (TBP) afecta el pulmón o los ganglios linfáticos en el sitio de la infección primaria (generalmente el pulmón y las vías respiratorias superiores) mientras que la TB extrapulmonar describe la TB que afecta otras zonas del cuerpo (WHO NOV 2010).
Aunque hay tratamientos efectivos disponibles, la TB sigue siendo la séptima causa más grande de mortalidad en todo el mundo. Dentro del Reino Unido los números de casos de incidencia han aumentado en aproximadamente un quinto durante el último decenio (PHE 2013). Los regímenes de tratamiento estándar de la TB están compuestos por una combinación de fármacos que en su mayoría incluyen rifampicina. Por lo general, se administran diariamente, a veces de forma intermitente (por ejemplo tres días por semana), durante al menos seis meses (Garner 2003).
La infección por TB inicia una respuesta inmunitaria inflamatoria que por sí misma causa un daño tisular considerable. El tratamiento complementario con esteroides puede usarse para contrarrestarla, especialmente cuando la enfermedad inflamatoria complica la recuperación. Las guías clínicas aconsejan la administración de tratamiento complementario con esteroides para el tratamiento de la meningitis por TB y la pericarditis por TB(NICE 2006; WHO 2009). Sin embargo, cuando se los administra sin tratamiento contra la tuberculosis, en realidad los esteroides pueden promover la activación de la TB (Cisneros 1996). También hay pruebas de que la administración concurrente de fármacos antituberculosos y esteroides causa interacciones farmacocinéticas que obstaculizan la eficacia de ambos fármacos y por lo tanto deterioran los resultados clínicos (Edwards 1974; Sarma 1980; Bergrem 1983; Wagay 1990; Kaojarern 1991).
Tres revisiones Cochrane han examinado la administración de esteroides como un tratamiento coadyuvante para aliviar las complicaciones de la TB: pleuresía (Engel 2007), pericarditis (Mayosi 2002) y meningitis (Prasad 2008). La mayoría de los ensayos incluidos en esta revisión fueron pequeños, y aunque se observaron algunos beneficios, los resultados eran a menudo poco concluyentes.
Aproximadamente un 79% de los casos de TB en el mundo son pulmonares, por eso es importante saber si existe un beneficio a partir del uso de esteroides en el tratamiento de la TBP. Una revisión sistemática anterior(Smego 2003) examinó la administración de esteroides como un tratamiento coadyuvante para la TBP e identificó once estudios, de los cuales todos mostraron una mejoría significativa en al menos un resultado de la TBP en los pacientes que recibieron esteroides. Esta revisión actualiza la revisión anterior (Smego 2003), con búsquedas hasta mayo de 2014; y refina los resultados evaluados para examinar de forma adicional el beneficio de los corticosteroides coadyuvantes para el tratamiento de la TBP.
Objetivos
Evaluar si los corticosteroides coadyuvantes reducen la mortalidad, mejoran la calidad de vida o aceleran la recuperación clínica o microbiológica en los pacientes con TBP.
Métodos
Criterios de inclusión de estudios para esta revisión
Tipos de estudios
Esta revisión incluyó tanto ensayos controlados aleatorios (ECA) como ensayos controlados cuasialeatorios independientemente del contexto y el idioma de publicación.
Tipos de participantes
Se incluyó a participantes con TBP, definidos ya sea de forma clínica o microbiológica. No hubo criterios de exclusión para los estudios con respecto al grupo etario de participantes ni a la comorbilidad.
Tipos de intervenciones
En cada estudio los participantes fueron tratados con el mismo régimen antimicrobiano para la TBP y recibieron la misma atención además de la siguiente:
Grupo de la intervención
También recibieron un corticosteroide en cualquier dosis, duración o modalidad de administración como un complemento del tratamiento estándar para la TBP.
Grupo control
Recibieron tratamiento estándar para la TBP solo o en combinación con un placebo.
Tipos de medida de resultado
Resultados primarios
Mortalidad por todas las causas
Muertes debido a cualquier causa durante el tratamiento y el seguimiento del ensayo.
Resultados secundarios
Resultados microbiológicos
Los resultados microbiológicos se evalúan, de ser posible, mediante los números que logran los resultados de la TB definidos por la OMS dentro de cada brazo del ensayo.
Mejoría clínica
Cambio medio en las puntuaciones de los síntomas definidas de forma clínica o indicadores específicos del estudio de una mejoría clínica.
Fiebre
Cambio en la temperatura promedio desde el inicio o número de participantes que se vuelven afebriles desde el inicio.
Variación en el peso
Cambio de peso medio desde el inicio y, cuando estuvieron disponibles, indicadores de la variación.
Duración de la estancia hospitalaria
Tiempo medio de hospitalización y, cuando estuvieron disponibles, indicadores de la variación.
Discapacidad funcional
Cambio medio desde el inicio en las medidas específicas del ensayo de la función pulmonar y, cuando estuvieron disponibles, indicadores de la variación.
Eventos adversos
Recuentos de cada evento adverso según lo especificado dentro de cada ensayo. De ser posible, se presentaron como el número que se produjo en cada brazo del ensayo; cuando sólo se informaron para el brazo de esteroides, se presentaron por separado.
Results
Description of studies
Please also refer to the following sections: ‘Characteristics of included studies’ and ‘Characteristics of excluded studies’.
We identified 123 papers following searches. Eighteen of these studies met the inclusion criteria and 105 studies were excluded (refer to ‘Characteristics of excluded studies’ for further details). The 18 included studies were conducted between 1955 and 2005 with the majority undertaken over 20 years ago before TB regimens as used today were implemented. The trials included 3816 participants in total, with three trials having over 100 participants (USPHS 1965; BTA 1961; TBRC 1983). Only five of these trials (1087 participants) were completed during a time period when more effective rifampicin‐containing multi‐drug treatment regimens were being used (TBRC 1983; Toppett 1990; Park 1997; Bilaceroglu 1999; Mayanja‐Kizza 2005). One of these five studies enrolled only patients who were HIV positive (Mayanja‐Kizza 2005).
Trials were conducted in a variety of geographical settings including the USA (Weinstein 1959; Angel 1960; USPHS 1965; Marcus 1962; McLean 1963; Johnson 1965; Nemir 1967; Malik 1969), UK (Horne 1960; Keidan 1961; BTA 1961), Belgium (Toppett 1990), Italy (De Alemquer 1955), Turkey (Bilaceroglu 1999), South India (TBRC 1983), South Korea (Park 1997), Uganda (Mayanja‐Kizza 2005) and Ghana (Bell 1960). As such, trial participants when grouped became a very diverse population.
We summarized the specific steroid interventions the trials utilised and reported upon in the ‘Characteristics of included studies’ table. There was large heterogeneity not only in the adjunctive steroid therapy trials used but also in the chemotherapeutic regimens used especially amongst trials conducted before the 1980's when more effective short‐course, rifampicin containing therapy became treatment main‐stay.
All trials reported on all‐cause mortality, 13 studies reported on indicators of microbiological resolution, eight studies on clinical improvement, six on fever, eight on weight change, three on length of time spent in hospital, five studies on functional disability, and 12 studies on adverse events.
Risk of bias in included studies
Methods of allocation generation, allocation concealment and blinding within trials were used as indicators of methodological quality. Although methodological quality of included trials is shown to have differed substantially, it is unlikely that it caused inherent bias within any of the trials (for details on individual trials see ‘Characteristics of included studies’ section). Often descriptions of allocation generation, allocation concealment and blinding were missing from publications meaning that a judgement of unclear was given to the trial for its methodological quality rather than this judgement being made as an unsuitable method had been used. Six trials (Angel 1960; Bell 1960; Malik 1969; Marcus 1962; TBRC 1983; Toppett 1990) had a single indicator judged as being at high risk of causing bias, a summary of methodological assessments is given in Figure 1.
Funnel plots were constructed for each meta‐analysis, most showed no inherent risk of publication bias within the trials included in meta‐analyses. However, asymmetry was seen in funnel plots for the following outcomes; sputum conversion at two months (Figure 2) and clinical improvement at 1 month (Figure 3) indicating a potential risk of publication bias.

Funnel plot of comparison: 1 Steroid therapy comparative to either no therapy or placebo, outcome: 1.2 Sputum conversion by 2 months.

Funnel plot of comparison: 1 Steroid therapy comparative to either no therapy or placebo, outcome: 1.6 Clinical Improvement at 1 month.
Effects of interventions
All‐cause mortality
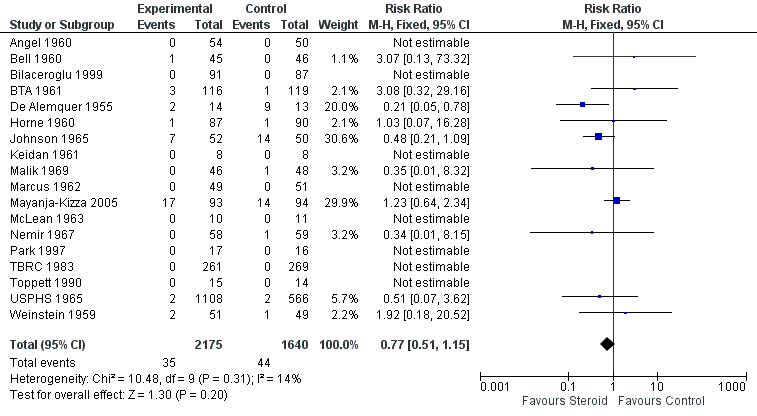
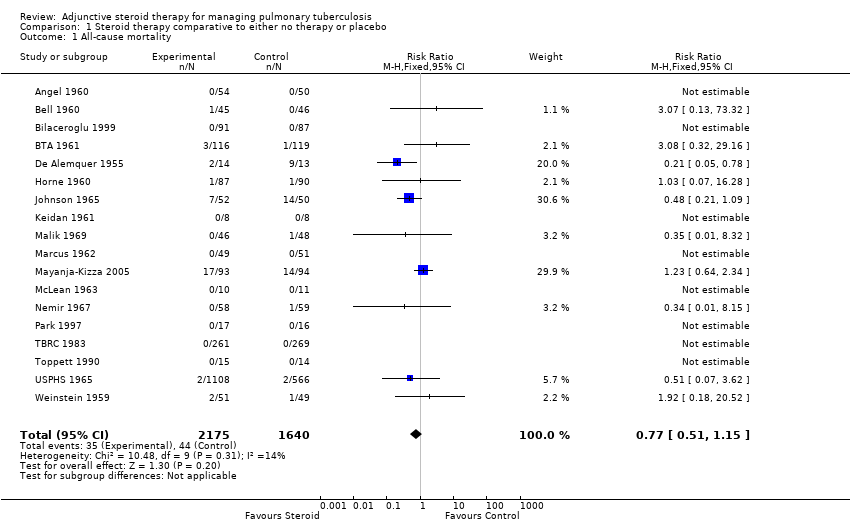
All 18 trials identified, including 3816 participants, reported on all‐cause mortality. Pooled results showed a 23% non significant decrease in all‐cause mortality amongst the intervention group (RR 0.77, 95% CI 0.51 to 1.15; 18 trials, 3816 participants, low quality evidence; Analysis 1.1, Figure 4).

Forest plot of comparison: 1 Steroid therapy comparative to either no therapy or placebo, outcome: 1.1 All‐cause mortality.
Of the included trials, only five trials were carried out after the introduction of rifampicin containing regimens (TBRC 1983; Toppett 1990; Park 1997; Bilaceroglu 1999; Mayanja‐Kizza 2005) and of these five trials only one trial amongst HIV positive PTB participants reported any deaths (Mayanja‐Kizza 2005). The risk ratio of mortality from this trial was RR 1.23, 95% CI 0.64 to 2.34; one trial, 187 participants. A sensitivity analysis pooling only data from these five trials found no difference in mortality amongst individuals taking steroids compared to those taking no steroid or placebo (RR 1.23, 95% CI 0.64 to 2.34; five trials, 957 participants, very low quality evidence). However, pooling the older trials which used non‐rifampicin containing regimens showed a statistically significant 43% decrease in all‐cause mortality amongst the intervention group (RR 0.57, 95% CI 0.34 to 0.97; 13 trials, 2858 participants, very low quality evidence).
We undertook a sensitivity analysis,only pooling studies where bias assessment criteria were judged not to be at high risk of introducing bias (Figure 1). A negligible difference in RR was found (RR 0.76, 95% CI 0.50 to 1.14; 12 trials, 2794 participants).
Secondary outcomes
Microbiological improvement
The WHO lists the following as standardised microbiological outcomes for TB:
-
Cure ‐ a patient initially smear‐positive who becomes smear‐negative by the last month of treatment and was smear negative on at least one previous occasion.
-
Failure ‐ a patient who was initially smear‐positive and who remained smear‐positive at month 5 or later during treatment.
-
Completed treatment ‐ a patient who completed treatment but did not meet the criteria for cure or failure.
-
Successfully treated ‐ a patient who was cured or who completed treatment.
-
Relapse ‐ a patient previously declared cured but with a new episode of bacteriologically positive (sputum smear or culture) tuberculosis.
Data was available amongst the 18 identified trials on sputum conversion, failure and relapse but not on cure, numbers completing treatment, or successfully treated.
Sputum conversion
Thirteen trials reported upon study‐specific indicators of sputum and culture clearance (Weinstein 1959; Angel 1960; Bell 1960; Horne 1960; BTA 1961; USPHS 1965; Marcus 1962; McLean 1963; Johnson 1965; Malik 1969; TBRC 1983; Bilaceroglu 1999; Mayanja‐Kizza 2005), just two of which were undertaken after the introduction of rifampicin‐containing TB regimens (TBRC 1983; Mayanja‐Kizza 2005) (Table 1).
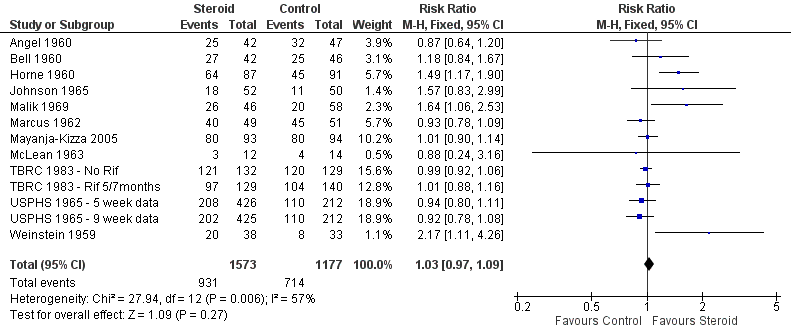
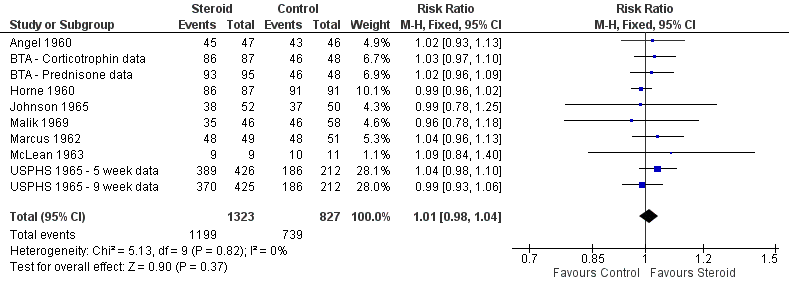
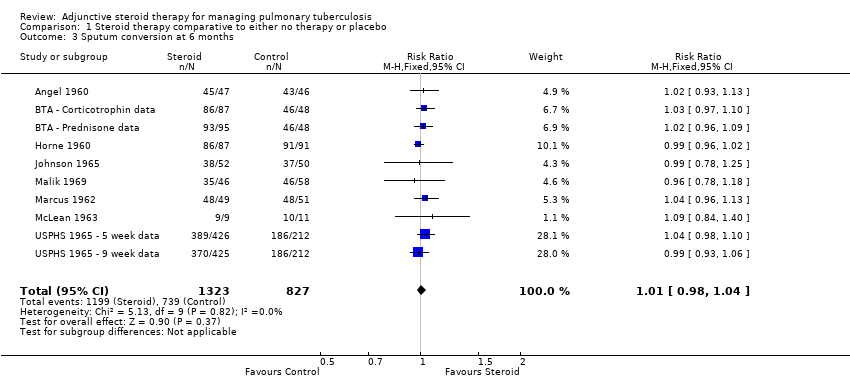
Pooled results showed no difference in sputum conversion both at two months after treatment initiation (RR 1.03, 95% CI 0.97 to 1.09; 12 trials, 2750 participants, Analysis 1.2, Figure 5, low quality evidence) and in the longer term (at six months after treatment initiation) (nine trials, 2150 participants, Analysis 1.3, Figure 6, low quality evidence).

Forest plot of comparison: 1 Steroid therapy comparative to either no therapy or placebo, outcome: 1.2 Sputum conversion by 2 months.

Forest plot of comparison: 1 Steroid therapy comparative to either no therapy or placebo, outcome: 1.3 Sputum conversion at 6 months.
In sensitivity analysis only data from studies where bias assessment criteria were judged not to be at high risk of introducing bias were pooled, a negligible difference in RR was found at both 2 months (RR 1.15, 95% CI 1.05 to 1.24; seven trials, 1232 participants) and 6 months (Figure 1).
Treatment Failure
The WHO defines TB patients as 'failed' if they were initially smear positive and remained so beyond their 5th month of treatment. Nine trials (Weinstein 1959; Angel 1960; Horne 1960; BTA 1961; Marcus 1962; McLean 1963; Johnson 1965; Malik 1969; TBRC 1983) reported on treatment failure, only one of which was completed after the introduction of rifampicin‐containing treatments.
Amongst the nine trials study‐specific definitions of treatment failure differed substantially (for example 'failure to clear susceptible AFB after five consecutive months of anti‐tuberculous therapy’ and ‘those needing re‐treatment up to two years after first regimen of anti‐tuberculous therapy’, see Table 2) and, as such, it was not appropriate to pool these results. However, it was possible to pool results extracted using the WHO definition as a guide, no difference in failure rate was found between those taking steroids comparative to those taking no steroid or placebo (9 trials, participants 1124, Analysis 1.4, Figure 7, very low quality evidence).

Forest plot of comparison: 1 Steroid therapy comparative to either no therapy or placebo, outcome: 1.4 Treatment Failure.
Sensitivity analyses only including studies where bias assessment criteria were judged not to be at high risk of introducing bias made negligible difference (five trials, 558 participants) (Figure 1).
Treatment Relapse
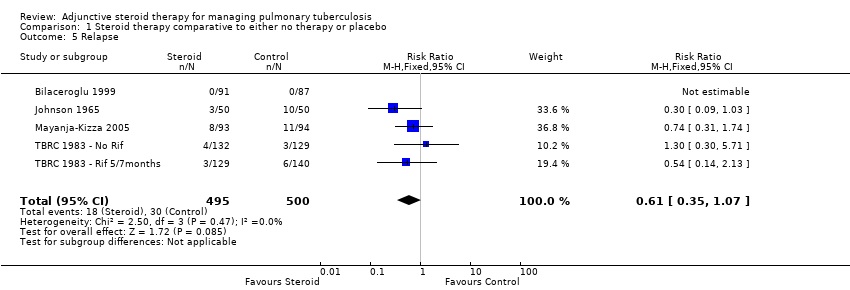
Four trials (Johnson 1965; TBRC 1983; Bilaceroglu 1999; Mayanja‐Kizza 2005) reported on study specific indicators of treatment relapse (see Characteristics of included studies), no trials reported on relapse as defined by the WHO (see Table 3). Three of the four studies were completed after the introduction of rifampicin‐containing treatments (TBRC 1983; Bilaceroglu 1999; Mayanja‐Kizza 2005). No difference in relapse rates were found between those taking steroids comparative to those taking no steroid or placebo (four trials, 995 participants, Analysis 1.5, Figure 8, very low quality evidence).
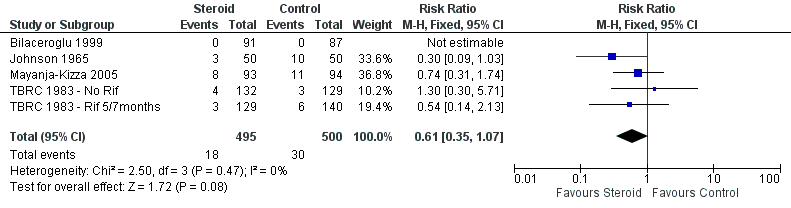
Forest plot of comparison: 1 Steroid therapy comparative to either no therapy or placebo, outcome: 1.5 Relapse.
In sensitivity analyses removing the single study that did not utilise rifampicin made little difference to the results (three trials, 634 participants) as did only including studies where bias assessment criteria were judged not to be at high risk of introducing bias (three trials, 178 participants) (Figure 1) .
Clinical improvement
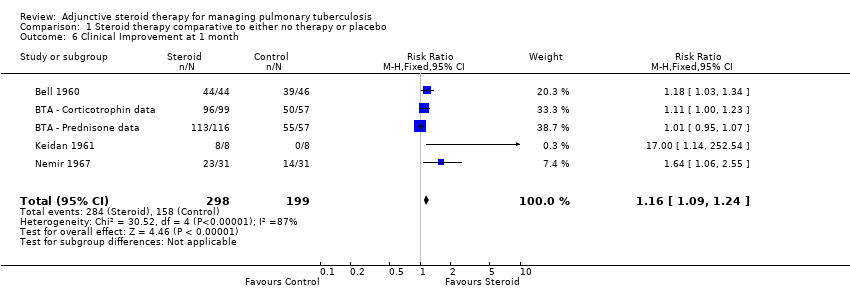
We identified seven trials (Bell 1960; BTA 1961; Marcus 1962; McLean 1963; Johnson 1965; Keidan 1961; Nemir 1967) which reported numeric data for study specific indicators of clinical progress and a single study (Angel 1960) which commented narratively upon this outcome (Table 4). None of these trials were carried out after the introduction of rifampicin‐containing TB regimens (Table 4). Four trials reported upon clinical improvement at one month following treatment (Marcus 1962; BTA 1961; McLean 1963; Nemir 1967; Table 4) with pooled results showing a statistically significant 16% increase in clinical improvement amongst those taking steroids comparative to those taking no steroids or taking placebo (RR 1.16, 95% CI 1.09 to 1.24; four trials, 497 participants, Analysis 1.6, Figure 9, low quality of evidence).

Forest plot of comparison: 1 Steroid therapy comparative to either no therapy or placebo, outcome: 1.6 Clinical Improvement at 1 month.
In sensitivity analyses including only studies where bias assessment criteria were judged to be at low risk of introducing bias (three trials, 178 participants, low quality evidence) the difference in RR was negligible .
Fever
Six trials (Angel 1960; BTA 1961; Marcus 1962; McLean 1963; Johnson 1965; Bilaceroglu 1999) reported upon study specific indicators of fever. Only one of the trials was carried out after the introduction of rifampicin‐containing TB regimens (Bilaceroglu 1999) (Table 5). Five of the six studies (Angel 1960; Marcus 1962; McLean 1963; Johnson 1965; Bilaceroglu 1999) saw an improvement in fever reduction or time to fever reduction amongst the intervention group. Study‐specific indicators of fever abatement differed substantially so it was not appropriate to pool results. For two of the trials (Angel 1960; Marcus 1962) a single indicator of bias assessment is deemed to be at high risk of causing bias (Figure 1).
Weight change
Seven trials (Angel 1960; Bell 1960; Horne 1960; BTA 1961; Marcus 1962; Johnson 1965; Malik 1969; Bilaceroglu 1999) reported upon weight change at different time‐points since baseline (Table 6). Only one of these trials was carried out after the introduction of rifampicin‐containing TB regimens (Bilaceroglu 1999) (Table 6).
In seven of the eight trials reporting upon weight change it is significantly increased (during at least one time‐point) amongst individuals taking steroids compared to those taking no steroid or placebo (data not pooled, seven trials, 1203 participants, low quality evidence). For four of the trials (Angel 1960; Bell 1960; Malik 1969; Marcus 1962) an indicator of bias assessment is deemed to be at high risk of causing bias (Figure 1).
Length of hospital stay
Three trials reported study‐specific indicators of hospital stay length, all demonstrating statistically significant and potentially important reductions in length of stay (ranging from an average of 18 to 30 days) in the steroid group (Weinstein 1959; Johnson 1965; Bilaceroglu 1999), (data not pooled, three trials, participants 379, very low quality evidence). However the relevance of this finding is limited as most TB patients no longer remain inpatients whilst on treatment. Study‐specific indicators for length of stay differed substantially so it was not appropriate to pool results (Table 7).
Only one of these trials was carried out after the introduction of rifampicin‐containing TB regimens (Bilaceroglu 1999) (Table 7). For all three trials, bias assessment criteria were judged to be at low risk of introducing bias (Figure 1).
Functional disability
Five studies (Angel 1960; Marcus 1962; McLean 1963; Malik 1969; Park 1997) reported upon changes in specific indicators of lung function, only one of which was carried out after the introduction of rifampicin‐containing TB regimens (Park 1997).
No differences were found between the control and steroid groups for any indicator of lung function in three of the five trials (Marcus 1962; McLean 1963; Park 1997). Two studies (Angel 1960; Malik 1969) reported a significant difference in one of the three recorded indicators of lung function (Table 8). Amongst all five trials the majority of multiple measures of functional disability are unaffected by steroid use (data not pooled, five trials, participants 363, very low quality evidence).
For three of the five trials, bias assessment criteria were judged to be at high risk of introducing bias (Figure 1).
Adverse Events
There was considerable variation in the way adverse events were reported (Table 9; Table 10). Some studies reported adverse events only amongst the intervention group. It appeared that there was no increase in the number of adverse events amongst the intervention group excluding side effects that would be associated with steroid usage, the majority of which were minor (Table 10, very low quality evidence). However, reporting of adverse events was not consistent and it seems unlikely that all such events were captured by the trials.
Discusión
Se identificaron 18 ensayos que cumplieron los criterios de inclusión de la revisión, publicados entre 1955 y 2005, con un total de 3816 participantes.
Los corticosteroides no redujeron la mortalidad por tuberculosis pulmonar (18 ensayos, 3816 participantes, pruebas de baja calidad). Se intentó estratificar los resultados de la mortalidad por todas las causas de acuerdo a si se habían utilizado regímenes con rifampicina más efectivos. Sin embargo, en la práctica esto no fue concluyente debido a que estos ensayos más recientes generalmente fueron muy pequeños y no informaron muertes, aparte de un único ensayo en pacientes con resultdos positivas para el VIH (Mayanja‐Kizza 2005). Para otros resultados, los análisis de sensibilidad también lograron cambios insignificantes en los hallazgos debido a que los ensayos excluidos nuevamente eran pocos y pequeños.
En comparación con placebo o ningún esteroide complementario, el tratamiento con esteroides se asoció con un aumento significativo del 16% en la mejoría clínica un mes más tarde (CR 1,16; IC del 95%: 1,09 a 1,24; cuatro ensayos, 497 participantes, Análisis 1.6, Figura 9 baja calidad de las pruebas). Sin embargo, estos datos no representaron ninguna diferencia en la conversión del esputo a los dos meses (CR 1,03; IC del 95%: 0,97 a 1,09; 12 ensayos, 2170 participantes). Los beneficios clínicos significativos a corto plazo de la administración de corticosteroides no se mantuvieron a largo plazo. Se encontró que la conversión del esputo a los seis meses (CR 1,01; IC 0,98 a 1,04; nueve ensayos, 2150 participantes), la tasa de fracaso (CR 1,02; IC 0,98 a 1,05; 10 ensayos, 1124 participantes) ni la tasa de recaídas (CR 0,61; IC 0,35 a 1,07; cuatro ensayos, 995 participantes) variaron entre los que recibieron corticosteroides en comparación con los que no recibieron esteroides o placebo.
También se encontró que el uso de corticosteroides: redujo la duración de la fiebre (datos no agrupados, seis ensayos, 851 participantes, pruebas de calidad muy baja), incrementó el aumento de peso durante diferentes puntos temporales específicos del estudio (datos no agrupados, ocho ensayos, 1203 participantes, pruebas de baja calidad) y disminuyó la duración de la estancia hospitalaria (datos no agrupados, tres ensayos, 379 participantes, pruebas de calidad muy baja) en comparación con ningún tratamiento con esteroides o placebo. No se encontró ninguna diferencia en la discapacidad funcional (datos no agrupados, cinco ensayos, 363 participantes, pruebas de baja calidad) entre los que recibieron corticosteroides y los que recibieron ningún esteroide o placebo. El informe de los eventos adversos tanto entre los grupos de intervención como entre los de control fue deficiente en la mayoría de los estudios examinados. Sin embargo, entre los tratados con tratamiento complementario con esteroides en el estudio más reciente (completado entre pacientes con VIH) se informó que la hiperglucemia, la retención de líquido y la hipertensión fueron significativamente más frecuentes.
Aunque la mejoría en los síntomas, los signos, los resultados clínicos y microbiológicos entre los que recibieron corticosteroides se informan continuamente dentro del texto de la publicación y las revisiones narrativas y los resultados apoyan dicha observación, estos datos deben interpretarse con cuidado debido a que las pruebas detrás de estos son de calidad deficiente. Los resultados a menudo se basan en pocos ensayos con números bajos de participantes. En esta revisión, tres ensayos incluidos fueron completados en niños (Keidan 1961; Nemir 1967; Toppett 1990) que se sabe que reaccionan de otro modo a la infección por TB y al tratamiento. También existe gran heterogeneidad dentro de los regímenes de tratamiento de intervención y de control utilizados en los ensayos incluidos, así como en la metodología de los ensayos incluidos. No se conoce cómo los hallazgos de los ensayos que utilizan regímenes de tratamiento históricos pueden extrapolarse a los regímenes de tratamiento modernos y de corta duración que incluyen rifampicina. Por lo tanto, no fue posible extraer conclusiones consistentes sobre si los corticosteroides coadyuvantes reducen la mortalidad o aceleran la recuperación microbiológica o clínica en los pacientes con TBP basado en las pruebas actuales.
Hay pruebas limitadas de los ensayos más antiguos (que no usan regímenes de tratamiento modernos con fármacos múltiples que contienen rifampicina) de que los esteroides podrían mejorar los síntomas clínicos, en particular a corto plazo. Los corticosteroides pueden tener algunos beneficios clínicos para los pacientes con TBP, aunque los ensayos publicados hasta la fecha son demasiado pocos, demasiado pequeños y demasiado antiguos para demostrar efectos estadísticamente significativos y clínicamente relevantes (Critchley 2013).
La incidencia de TB ha seguido siendo elevada en algunas partes del mundo. Uno de los impulsores clave de las tasas de TB durante las décadas recientes ha sido la epidemia de VIH, no obstante, sólo un ensayo identificado se realizó en pacientes con TBP y pruebas positivas para el VIH. Los corticosteroides son una intervención muy económica y podrían tener el potencial de mejorar los resultados del tratamiento de la TB en los pacientes con enfermedad avanzada especialmente en contextos de escasos recursos, en los que la mortalidad por TBP sigue siendo alta. Sin embargo, también debe señalarse que los corticosteroides pueden causar efectos adversos graves, y aún no se conoce la relación entre los beneficios y los riesgos de su uso para la TBP. Se necesitan ECA adicionales, con el poder estadístico suficiente y bien diseñados sobre el uso de esteroides coadyuvantes en pacientes con pruebas positivas para el VIH, inmunocomprometidos e inmunocompetentes antes de poder establecer conclusiones consistentes sobre los beneficios potenciales de esta intervención. Dichos ensayos deben informar la calidad de vida de los pacientes y el costo‐eficacia, así como más resultados estándar del tratamiento para la TB.

Risk of bias summary: review authors' judgements regarding each risk of bias item for each included study.

Funnel plot of comparison: 1 Steroid therapy comparative to either no therapy or placebo, outcome: 1.2 Sputum conversion by 2 months.

Funnel plot of comparison: 1 Steroid therapy comparative to either no therapy or placebo, outcome: 1.6 Clinical Improvement at 1 month.
Forest plot of comparison: 1 Steroid therapy comparative to either no therapy or placebo, outcome: 1.1 All‐cause mortality.
Forest plot of comparison: 1 Steroid therapy comparative to either no therapy or placebo, outcome: 1.2 Sputum conversion by 2 months.
Forest plot of comparison: 1 Steroid therapy comparative to either no therapy or placebo, outcome: 1.3 Sputum conversion at 6 months.

Forest plot of comparison: 1 Steroid therapy comparative to either no therapy or placebo, outcome: 1.4 Treatment Failure.

Forest plot of comparison: 1 Steroid therapy comparative to either no therapy or placebo, outcome: 1.5 Relapse.

Forest plot of comparison: 1 Steroid therapy comparative to either no therapy or placebo, outcome: 1.6 Clinical Improvement at 1 month.
Comparison 1 Steroid therapy comparative to either no therapy or placebo, Outcome 1 All‐cause mortality.

Comparison 1 Steroid therapy comparative to either no therapy or placebo, Outcome 2 Sputum conversion by 2 months.
Comparison 1 Steroid therapy comparative to either no therapy or placebo, Outcome 3 Sputum conversion at 6 months.

Comparison 1 Steroid therapy comparative to either no therapy or placebo, Outcome 4 Treatment Failure.
Comparison 1 Steroid therapy comparative to either no therapy or placebo, Outcome 5 Relapse.
Comparison 1 Steroid therapy comparative to either no therapy or placebo, Outcome 6 Clinical Improvement at 1 month.
| Steroid therapy comparative to either no therapy or placebo for managing pulmonary tuberculosis | ||||||
| Patient or population: patients with managing pulmonary tuberculosis | ||||||
| Outcomes | Illustrative comparative risks* (95% CI) | Relative effect | No of Participants | Quality of the evidence | Comments | |
| Assumed risk | Corresponding risk | |||||
| Control | Steroid therapy comparative to either no therapy or placebo | |||||
| All‐cause mortality | 27 per 1000 | 21 per 1000 | RR 0.77 | 3815 | ⊕⊕⊝⊝ | |
| Sputum Conversion by 2 months | 656 per 1000 | 722 per 1000 | RR 1.1 | 1475 | ⊕⊕⊝⊝ | |
| Sputum conversion at 6 months | Study population | RR 1.01 | 875 | ⊕⊕⊕⊝ | ||
| 911 per 1000 | 920 per 1000 | |||||
| Clinical Improvement at 1 month | Study population | RR 1.16 | 497 | ⊕⊝⊝⊝ | ||
| 794 per 1000 | 921 per 1000 | |||||
| *The assumed risk is the mean control group risk across studies. The corresponding risk (and its 95% confidence interval) is based on the assumed risk in the comparison group and the relative effect of the intervention (and its 95% CI). | ||||||
| GRADE Working Group grades of evidence | ||||||
| 1 Not downgraded for risk of bias: Most of these studies were conducted in the 1960s and provided minimal detail on trial methods. However, the most recent trial from 2005 was well conducted and showed no evidence of clinical benefit with steroids. | ||||||
| Study ID | Outcome Definition | Culture or Smear (if culture not reported) Negative | ||||
| Time point (month) | Steroid | Control | Reported Statistical Significance | |||
| Culture negative; three samples of sputum or gastric washings were sent for culture at start of treatment then at monthly intervals. | Baseline | 0/54 | 0/50 | No significant difference | ||
| 1 | 7/34 | 12/38 | ||||
| 2 | 25/42 | 32/47 | ||||
| 3 | 29/46 | 39/42 | P < 0.001 significantly greater among controls | |||
| 4 | 39/45 | 41/45 | No significant difference | |||
| 5 | 40/44 | 38/40 | ||||
| 6 | 45/47 | 43/46 | ||||
| Culture negative; 24 hour specimens of sputum were collected until treatment started, then collected monthly. Concentrates prepared by tri‐sodium phosphate method and incubated for 12 weeks. | Baseline | 0/45 | 0/46 | No significant difference | ||
| 1 | 16/44 | 11/45 | ||||
| 2 | 27/42 | 25/46 | ||||
| 3 | 31/41 | 35/43 | ||||
| Culture conversion rate (Sputum taken twice weekly) | Reported as 'comparable' | P = 0.0794 | ||||
| Culture negative; direct smear and culture exam taken monthly and analysed using local lab facilities | Baseline | 9/111 | 5/118 | Not reported | ||
| 1 | 36/100 | 31/109 | ||||
| 3 | 70/89 | 77/104 | ||||
| 6 | 86/87 | 91/95 | ||||
| 9 | 67/67 | 74/74 | ||||
| 12 | 40/40 | 39/40 | ||||
| Culture negative; direct smear and culture exam taken monthly and analysed using local lab facilities | Baseline | 4/115 | 5/118 | |||
| 1 | 36/109 | 31/109 | ||||
| 3 | 80/104 | 77/104 | ||||
| 6 | 93/95 | 91/95 | ||||
| 9 | 80/80 | 74/74 | ||||
| 12 | 45/45 | 39/40 | ||||
| Culture negative; direct sputum smear, gastric lavage or laryngeal swabs | 1 | 40/87 | 28/91 | No significant difference | ||
| 2 | 64/87 | 45/91 | P < 0.01 | |||
| 3 | 67/87 | 62/91 | No significant difference | |||
| 4 | 75/87 | 75/91 | ||||
| 5 | 80/87 | 82/91 | ||||
| 6 | 86/87 | 91/91 | ||||
| 9 | 75/77 | 80/80 | ||||
| 12 | 77/77 | 80/80 | ||||
| Specimens of sputum were collected every two weeks for four months and then every month thereafter Reversal of infectiousness; the first of three consecutive monthly specimens negative for tubercle bacilli on microscopy and culture | 2 | 18/52 | 11/50 | No significant difference | ||
| 4 | 30/52 | 31/50 | ||||
| 6 | 38/52 | 37/50 | ||||
| 8 | 46/52 | 42/50 | ||||
| 10 | 49/52 | 44/50 | ||||
| 12 | 48/52 | 46/50 | ||||
| Sputum negative; disappearance of sputum in bacilli was monitored for monthly | 1 | 11/46 | 14/58 | No significant difference | ||
| 2 | 26/46 | 20/58 | P < 0.05 | |||
| 3 | 28/46 | 28/58 | P < 0.05 | |||
| 6 | 35/46 | 46/58 | No significant difference | |||
| Culture negative; specimens of sputum were collected every two weeks until 2 months then at 3 months and 6 months | 1 | 35/49 | 31/51 | Not reported | ||
| 2 | 40/49 | 45/51 | ||||
| 3 | 45/49 | 45/51 | ||||
| 6 | 48/49 | 48/51 | ||||
| Culture negative; sputum cultures obtained at month 1 and 2 and examined for AFB | 1 | 58/93 | 35/94 | P = 0.001 | ||
| 2 | 80/93 | 80/94 | No significant difference | |||
| Smear or sputum negative; Smear or culture of sputum or gastric aspirate | 1 | 0/13 | 0/14 | No significant difference | ||
| 2 | 3/12 | 4/14 | ||||
| 3 | 5/11 | 8/14 | ||||
| 4 | 8/12 | 11/14 | ||||
| 5 | 8/11 | 13/13 | ||||
| 6 | 9/9 | 10/11 | ||||
| Culture from bronchial aspiration and gastric washings on 3 successive morning on admission; culture positive after therapy | During therapy | 4/58 | 2/59 | Not reported | ||
| After therapy | 2/58 | 2/59 | Not reported | |||
| Culture negative; Sputum smears examined by fluorescence microscopy and cultured using a modification of Petroffs method. TB chemotherapeutic with rifampicin for either 5 or 7 months. | 1 | 59/132 | 70/129 | No significant difference | ||
| 2 | 121/132 | 120/129 | ||||
| 3 | 1284/132 | 123/129 | ||||
| Culture negative; Sputum smears examined by fluorescence microscopy and cultured using a modification of Petroffs method.TB chemotherapeutic regimen without rifampicin. | 1 | 46/129 | 36/140 | No significant difference | ||
| 2 | 97/129 | 104/140 | ||||
| 3 | 116/129 | 123/140 | ||||
| Culture negative | 1 | 121/426 | 101/424 | Not reported | ||
| 2 | 208/426 | 220/424 | Not reported | |||
| 3 | 316/426 | 308/424 | Not reported | |||
| 4 | 365/426 | 342/424 | Not reported | |||
| 5 | 387/426 | 374/424 | Not reported | |||
| 6 | 389/426 | 372/424 | Not reported | |||
| 8 | 410/426 | 392/424 | Not reported | |||
| Culture negative | 1 | 107/425 | 101/424 | Not reported | ||
| 2 | 202/425 | 220/424 | Not reported | |||
| 3 | 263/425 | 308/424 | Not reported | |||
| 4 | 330/425 | 342/424 | Not reported | |||
| 5 | 368/425 | 374/424 | Not reported | |||
| 6 | 395/425 | 372/424 | Not reported | |||
| 8 | 389/425 | 392/424 | Not reported | |||
| Sputum negative; Cumulative sputum conversion | Baseline | 16/38 | 6/33 | Not reported | ||
| 2 | 20/38 | 8/33 | ||||
| 8 | 33/38 | 25/33 | ||||
| Study ID | Outcome Definition | Steroid | Control | Reported Statistical Significance | |
| Culture positive at 5 months | 4/44 | 2/40 | Not reported | ||
| Culture positive at 6 months | 1/87 | 4/95 | |||
| Culture positive at 6 months | 2/95 | 4/95 | |||
| Culture positive at 5 months | 7/87 | 9/91 | |||
| Culture or smear positive at 6 months | 8/50 | 8/52 | |||
| Study specific indicator, failure to convert by 12 months | 2/50 | 4/52 | |||
| Culture or smear positive at 6 months | 11/46 | 12/58 | |||
| Culture or smear positive at 6 months | 1/49 | 3/51 | |||
| Study specific indicator, not described further | 1/93 | 1/94 | No significant difference | ||
| Culture positive at 6 months | 0/9 | 1/11 | Not reported | ||
| Sputum positive at end of study (6 to 16 months) | 2/38 | 6/33 | |||
| Study ID | Method | Steroid | Control | Reported Statistical Significance | |
| Smear or culture positive TB within 3 years follow up | 0/91 | 0/87 | Not reported | ||
| Number readmitted for TB during up to five years of follow up | 3/50 | 10/50 | P < 0.05 | ||
| Those needing re‐treatment up to two years after first regimen of anti‐tuberculous therapy. | 8/93 | 11/94 | No difference | ||
| Two or more of six cultures positive in any three consecutive monthly exams | 4/132 | 3/129 | No difference | ||
| 3/129 | 6/140 | ||||
| Study ID | Outcome Definition | Time Point (months) | Steroid Group | Control Group | Reported Statstical Significance | |
| Immediate and pronounced non‐specific improvement in general condition reported by nurses and patients | N/A, described as being immeasurable numerically | |||||
| Number of participants judged by treating physician to be in 'fair' or 'good' condition as opposed to 'severely ill' or 'poor' condition. | 1 | 44/44 | 39/46 | Improvement from baseline greater in steroid group P < 0.01 | ||
| 2 | 42/42 | 46/46 | No difference | |||
| Number of patients judged by treating physician to have had 'considerable', 'moderate' or 'slight improvement' as opposed to 'no change' or 'deterioration' | 1 | 96/99 | 100/114 | Not reported | ||
| 3 | 91/92 | 102/107 | ||||
| 6 | 85/86 | 94/95 | ||||
| Number of patients judged by treating physician to have had considerable, moderate or slight improvement | 1 | 113/116 | 100/114 | |||
| 3 | 107/108 | 102/107 | ||||
| 6 | 98/98 | 94/95 | ||||
| Participants initially with; any degree of cough or sputum, or moderate to severe symptoms, who saw moderate to marked improvement in condition. | 10 weeks | 39/48 | 28/46 | P < 0.05 | ||
| Participants showing definite‐striking improvement | 1 | 8/8 | 0/8 | Not reported | ||
| Improvement in 'well‐being and strength' | 7 weeks | 49/49 | 48/51 | Not reported | ||
| 'Rapid symptom response'; method of assessment unclear | Not reported | 13/13 | 1/14 | P < 0.0001 | ||
| 'Improved'; Method of assessment unclear. | 1 | 23/31 | 14/31 | No difference | ||
| 2 | 10/16 | 9/18 | ||||
| 3 | 5/6 | 3/4 | ||||
| 6 | 0/1 | 0/2 | ||||
| 7 | 0/1 | 0/1 | ||||
| time point unclear | 39/58 | 27/59 | P < 0.05 | |||
| Author | Outcome Definition | Steroid Group | Control Group | Reported Statistical Significance | |
| Mean time till patients afebrile, temperature not specified | 5 days | 19.4 days | Not reported | ||
| Mean time till patients afebrile (<37.5°C) | 25 days | 47 days | Not reported | ||
| Mean temperature change 72 hours after treatment initiation | ‐1.2 ºC | + 0.2ºC | P = 0.003 | ||
| Patients with an average temperature of 99°F or more (1 month) | 23/100 | 52/113 | Not reported | ||
| 17/113 | 52/113 | ||||
| Patients with an average temperature of 99°F or more (3 months) | 12/92 | 24/104 | |||
| 36/106 | 24/104 | ||||
| Patients with an average temperature of 99°F or more (6 months) | 7/92 | 10/104 | |||
| 7/106 | 10/104 | ||||
| Median fever duration | 1 day | 6 days | Not reported | ||
| Mean fever duration | 1 day | 13 days | |||
| Mean number of days for temperature to permanently drop below 100°F | 1 day | 26 day | Not reported | ||
| Mean number of febrile days | 2.9 days | 10.2 days | Not reported | ||
| Study ID | Outcome | Time Point | Steroid Group | Control Group | Reported Statistical Significance | |
| Mean gain in weight from baseline (lbs)* | 1 months | 13 | 4 | Not reported | ||
| 2 months | 19 | 8 | ||||
| 3 months | 24 | 11 | P < 0.001 | |||
| 4 months | 25 | 13 | Not reported | |||
| 5 months | 26 | 15 | ||||
| 6 months | 27 | 17 | P < 0.001 | |||
| Mean gain in weight from baseline (lbs) | 1 month | 2.75 | 2.13 | No statistically significant differences in mean weight of trial arms at any time point. | ||
| 2 months | 7.56 | 4.93 | ||||
| 3 months | 8.05 | 8.09 | ||||
| Mean gain in weight (kg) | from day 18 to 70 | 7.2 | 4.2 | P = 0.0022 | ||
| Mean gain in weight from baseline (lbs) | 1 month | 12 | 6 | Not reported | ||
| 3 months | 21 | 11 | ||||
| 6 months | 24 | 17 | P = 0.1 | |||
| 12 months | 23 | 21 | ||||
| Mean gain in weight from baseline (lbs) | 1 month | 9 | 6 | P = 0.1 | ||
| 3 months | 26 | 11 | ||||
| 6 months | 24 | 17 | No statistically significant difference | |||
| 12 months | 21 | 21 | ||||
| Mean gain in weight from baseline(lbs) | 1 month | 8 | 6 | Not reported | ||
| 2 months | 17 | 11 | ||||
| 3 months | 21 | 15 | ||||
| 4 months | 21 | 15 | ||||
| 5 months | 21 | 16 | ||||
| 6 months | 21 | 16 | ||||
| Patients initially under 130 lbs who gained 15 lbs or more (n) | 2 months | 8/23 | 0/17 | P<0.025 | ||
| Number of patients initially 15 lbs or more under ideal weight who gained 15 lbs or more by | 2 months | 9/24 | 2/21 | P<0.05 | ||
| Number of patients initially more than 20 lbs under ideal weight who gained 15 lbs or more by | 2 months | 9/24 | 2/19 | |||
| Mean gain in weight from baseline (lbs) | 1 month | 8.6 | 4.4 | Not significant | ||
| 2 months | 12.3 | 5.1 | P<0.05 | |||
| 3 months | 13.3 | 7.2 | ||||
| 6 months | 16.51 | 11.74 | Not significant | |||
| Mean gain in weight from baseline (lbs) | 6 months | 25 | 16 | P<0.01 | ||
| *Read from graph, | ||||||
| Author | Outcome definition | Steroid Group | Control Group | Statistical Significance |
| Average length of stay for those discharged | 53.4 +/‐ 3.1 days | 71.3 +/‐ 5.6 days | P=0.0284 | |
| Average length of stay for those discharged | 10 months | 11 months | Not reported | |
| Average length of stay for those discharged | 188.7 days | 207.4 days | Not reported |
| Study ID | Outcome definition | Time point (months) | Steroid | Control | Statistical Significance Reported |
| Max expiratory flow rate (body temperature and pressure saturated; litres/minute) | Baseline | 189.8 (SD 101.7) | 205.1 (SD 114.4) | Significantly higher in the corticotrophin group, no value given | |
| 3 | 241.1 (SD 137.7) | 227.3 (SD 115.4) | |||
| 6 | 238.7 (SD 125.2) | 228.4 (SD 100.2) | |||
| Mean vital capacity (maximal inhalation; standard temperature and pressure dry) | Baseline | 2,649 (SD 751) | 2,523 (SD 838) | Increased to the same extent in both groups, no value given | |
| 3 | 2,940 (SD 757) | 2,728 (SD 790) | |||
| 6 | 2,995 (SD 817) | 2,874 (SD 786) | |||
| Max breathing capacity (body temperature and pressure saturated; litres/minute) | Baseline | 88.6 (SD 36.3) | 82.0 (SD 26.5) | Increased to the same extent in both groups, no value given | |
| 3 | 102.6 (SD 25.6) | 97.8 (SD 32.3) | |||
| 6 | 100.4 (SD 28.7) | 99.1 (SD 31.2) | |||
| Abnormal maximal voluntary ventilation | 6 | 12/46 | 20/58 | P < 0.05 | |
| 12 | 19/46 | 20/58 | No significant difference | ||
| Abnormal vital capacity | 6 | 14/46 | 12/58 | ||
| 12 | 19/46 | 24/58 | |||
| Abnormal maximal expiratory flow | 6 | 17/46 | 21/58 | ||
| 12 | 19/46 | 24/58 | |||
| Diffusion capacity normal | 1 | 34/49 | 35/51 | No significant difference | |
| 2 | 34/49 | 35/51 | |||
| 3 | 34/49 | 36/51 | |||
| 6 | 34/49 | 37/51 | |||
| Maximal Mid expiratory flow rate (1/sec) | 1 | 2 | 2 | No significant difference | |
| 2 | 2.1 | 2.1 | |||
| 3 | 2.1 | 2.3 | |||
| 6 | 2.2 | 2.3 | |||
| Vital capacity normal | 1 | 35/49 | 36/51 | No significant difference | |
| 2 | 36/49 | 37/51 | |||
| 3 | 36/49 | 37/51 | |||
| 6 | 39/49 | 40/51 | |||
| Lung volumes (6 variables measured) | Not reported | Data not extracted | No significant difference in any of the measures | ||
| Ventilation Effects (6 variables measured) | |||||
| Perfusion Effects (6 variables measured) | |||||
| Diffusion Effects (3 variables measured) | |||||
| Mean improvement in forced vital capacity (%) | 2 | 9.2 | 10.4 | No significant difference | |
| Mean improvement in forced expiratory capacity (%) | 13.1 | 9.4 | No significant difference | ||
| Author | Outcome definition | Steroid | Control | Statistical significance |
| Sepsis, venous thrombosis, mental changes, and partial deafness | Numbers not given, stated equal in each treatment arm. | Not reported | ||
| Hypersensitivity reactions | 4/54 | 8/54 | ||
| Hypertension | 1/45 | 0/46 | ||
| Toxicity | 0/45 | 0/46 | ||
| Drug resistance | 18/91 | Not reported | ||
| Developed co‐morbidities | 28/275 | 13/133 | ||
| Chemotherapy regimen changed due to PAS intolerance | 3/275 | 0/133 | ||
| Chemotherapy regimen changed due to streptomycin toxicity | 6/275 | 6/133 | ||
| Chemotherapy regimen changed due to hypersensitivity reactions | 7/275 | 9/133 | ||
| Vestibular disturbance | 2/87 | 5/91 | ||
| Hypersensitivity | 5/87 | 4/91 | ||
| Hypertension, diabetes, peptic ulcer, psychosis and infections | Incidence equal in each treatment arm (6%, 4%, 0%, 0%, and 4% respectively) | |||
| Changes to chemo regimen due to hypersensitivity, intolerance, drug resistance and ineffectiveness | 29/52 | 24/50 | P < 0.05 | |
| Related respiratory illness (5 years follow up) | 11/52 | 15/50 | Not reported | |
| Acne | 23/52 | 9/50 | ||
| Mooning of the face | 34/52 | 8.5/50 | ||
| Bronchitis, pneumonia or respiratory insufficiency | 4/52 | 11/50 | Not reported | |
| Hypersensitivity reactions | 19/52 | 7/50 | P < 0.025 | |
| Hypersensitivity reactions | 1/49 | 4/51 | Not reported | |
| ≥ 1 adverse event | 87/93 | 82/94 | P = 0.38 | |
| ≥ 1 severe or life threatening event within 3 years | 22/93 | 18/94 | P = 0.19 | |
| Candidiasis | 32/93 | 36/94 | Not reported | |
| Hyperglycemia | 9/93 | 3/94 | P = 0.036 | |
| Abdominal pain | 17/93 | 13/94 | P = 0.47 | |
| Hepatitis | 12/93 | 6/94 | P = 0.09 | |
| Fluid retention | 28/93 | 4/94 | P < 0.001 | |
| Pruritis | 33/93 | 33/94 | P = 0.95 | |
| Herpes simplex | 10/93 | 4/94 | Not reported | |
| Herpes Zoster | 16/93 | 17/94 | P = 0.99 | |
| Kaposi sarcoma | 0/93 | 2/94 | P = 0.49 | |
| Pneumonia | 16/93 | 16/94 | P = 0.93 | |
| Urinary tract infection | 14/93 | 7/94 | P = 0.19 | |
| Hypertension | 12/93 | 4/94 | P = 0.039 | |
| Number of complications | 1/14 | 5/13 | Not reported | |
| Number of side effects | 3/14 | 13/13 | ||
| Rebound phenomena ‐ fever | 8/13 | 0/14 | ||
| Infectious disease | 1/19 | 5/29 | ||
| Viral disease | 2/19 | 9/29 | ||
| bacterial disease | 2/19 | 3/29 | ||
| Incidence of adverse events | Figures not reported, stated no difference between groups | |||
| Athralgia | Figures not reported, stated no difference between groups | |||
| Swelling of feet or face | 62/344 | 3/339 | P = 0.00001 | |
| GI disturbances | 21/344 | 1/339 | P = 0.00001 | |
| Induced hyperglycaemia | 2/344 | 0/339 | Not reported | |
| Severe adverse event requiring discontinuation | 2/851 | 1/424 | Not reported | |
| Hepatitis | 4/851 | 2/424 | Not reported | |
| Sensitivity to Streptomycin‐Pyrazinamide | 68/851 | 22/424 | More patients showed intolerance in steroid groups | |
| Senstivity to Isoniazid‐PAS | 38/851 | 26/424 | Not reported | |
| Blood pressure | No differences in mean SBP or DBP at any time point | |||
| Fasting plasma glucose | No differences at any time points | |||
| Acne | 14/426 | 11/424 | Not reported | |
| Moonface | 10/426 | 3/424 | Not reported | |
| Euphoria | 6/426 | 4/424 | Not reported | |
| Oedema | 3/426 | 9/424 | Not reported | |
| Acne | 17/425 | 11/424 | Not reported | |
| Moonface | 11/425 | 3/424 | Not reported | |
| Euphoria | 11/425 | 4/424 | Not reported | |
| Oedema | 8/425 | 9/424 | Not reported | |
| Author | Outcome definition | Steroid | |
| Acne | 11/54 | ||
| Mooning of face | 22/54 | ||
| Fluid retention | 7/54 | ||
| Transient diabetes mellitus | 6/54 | ||
| DBP over 100 mm | 2/54 | ||
| Paroxysmal nocturnal dyspnoea | 1/54 | ||
| Withdrawal phenomena | None | ||
| Mooning of face | None | ||
| Steroid side effects | None | ||
| Steroid therapy changed or stopped | 15/111 | ||
| Mooning of the face | 7/72 | ||
| Rebound Phenomena | 6/111 | ||
| Hypertension | 7/111 | ||
| Pyschiatric disturbance | 6/111 | ||
| Steroid therapy changed or stopped | 7/116 | ||
| Mooning of the face | 30/116 | ||
| Rebound Phenomena | 34/116 | ||
| Hypertension | 6/116 | ||
| Glycosuria | 10/116 | ||
| Pyschiatric problems | 2/116 | ||
| Marked obesity | 3/87 | ||
| Hypertension | 11/87 | ||
| Mooning of the face | 18/87 | ||
| Hirsuitism | 1/87 | ||
| Transient glycosuria | 6/87 | ||
| Transient rash on prednisolone withdrawal | 17/87 | ||
| Withdrawn from prednisolone therapy | 2/87 | ||
| Acute thrombophlebitis | 1 | ||
| Herpes Zoster | 1 | ||
| Diabetes | 1 | ||
| Marked weight gain (23lb) | 1 | ||
| Moderate Acne | 1 | ||
| Temporary elevation of blood pressure | 3 | ||
| Abdominal distension | 7 | ||
| Steroid therapy suspended | 2 | ||
| Adverse events | None | ||
| Increased infection rate | None | ||
| Outcome or subgroup title | No. of studies | No. of participants | Statistical method | Effect size |
| 1 All‐cause mortality Show forest plot | 18 | 3815 | Risk Ratio (M‐H, Fixed, 95% CI) | 0.77 [0.51, 1.15] |
| 2 Sputum conversion by 2 months Show forest plot | 13 | 2750 | Risk Ratio (M‐H, Fixed, 95% CI) | 1.03 [0.97, 1.09] |
| 3 Sputum conversion at 6 months Show forest plot | 10 | 2150 | Risk Ratio (M‐H, Fixed, 95% CI) | 1.01 [0.98, 1.04] |
| 4 Treatment Failure Show forest plot | 10 | 1124 | Risk Ratio (M‐H, Fixed, 95% CI) | 1.02 [0.98, 1.05] |
| 5 Relapse Show forest plot | 5 | 995 | Risk Ratio (M‐H, Fixed, 95% CI) | 0.61 [0.35, 1.07] |
| 6 Clinical Improvement at 1 month Show forest plot | 5 | 497 | Risk Ratio (M‐H, Fixed, 95% CI) | 1.16 [1.09, 1.24] |