Automated mandatory bolus versus basal infusion for maintenance of epidural analgesia in labour
Abstract
Background
Childbirth may cause the most severe pain some women experience in their lifetime. Epidural analgesia is an effective form of pain relief during labour and is considered to be the reference standard. Traditionally epidural analgesia has been delivered as a continuous infusion via a catheter in the epidural space, with or without the ability for the patient to supplement the analgesia received by activating a programmable pump to deliver additional top‐up doses, known as patient‐controlled epidural analgesia (PCEA). There has been interest in delivering maintenance analgesic medication via bolus dosing (automated mandatory bolus ‐ AMB) instead of the traditional continuous basal infusion (BI); recent randomized controlled trials (RCTs) have shown that the AMB technique leads to improved analgesia and maternal satisfaction.
Objectives
To assess the effects of automated mandatory bolus versus basal infusion for maintaining epidural analgesia in labour.
Search methods
We searched CENTRAL, MEDLINE, Embase, the World Health Organization International Clinial Trials Registry Platform (WHO‐ICTRP) and ClinicalTrials.gov on 16 January 2018. We screened the reference lists of all eligible trials and reviews. We also contacted authors of included studies in this field in order to identify unpublished research and trials still underway, and we screened the reference lists of the included articles for potentially relevant articles.
Selection criteria
We included all RCTs that compared the use of bolus dosing AMB with continuous BI for providing pain relief during epidural analgesia for labour in women.
Data collection and analysis
We used the standard methodological procedures expected by Cochrane. Our primary outcomes were: risk of breakthrough pain with the need for anaesthetic intervention; risk of caesarean delivery; risk of instrumental delivery. Secondary outcomes included: duration of labour; local anaesthetic consumption. We used GRADE to assess the certainty of evidence for each outcome.
Main results
We included 12 studies with a total of 1121 women. Ten studies enrolled healthy nulliparous women only and two studies enrolled healthy parous women at term as well. All studies excluded women with complicated pregnancies. There were variations in the technique of initiation of epidural analgesia. Seven studies utilized the combined spinal epidural (CSE) technique, and the other five studies only placed an epidural catheter without any intrathecal injection. Seven studies utilized ropivacaine: six with fentanyl and one with sufentanil. Two studies used levobupivacaine: one with sufentanil and one with fentanyl. Three used bupivacaine with or without fentanyl. The overall risk of bias of the studies was low.
AMB probably reduces the risk of breakthrough pain compared with BI for maintaining epidural analgesia for labour (from 33% to 20%; risk ratio (RR) 0.60; 95% confidence interval (CI) 0.39 to 0.92, 10 studies, 797 women, moderate‐certainty evidence). AMB may make little or no difference to the risk of caesarean delivery compared to BI (15% and 16% respectively; RR 0.92; 95% CI 0.70 to 1.21, 11 studies, 1079 women, low‐certainty evidence).
AMB may make little or no difference in the risk of instrumental delivery compared to BI (12% and 9% respectively; RR 0.75; 95% CI 0.54 to 1.06, 11 studies, 1079 women, low‐certainty evidence). There is probably little or no difference in the mean duration of labour with AMB compared to BI (mean difference (MD) −10.38 min; 95% CI −26.73 to 5.96, 11 studies, 1079 women, moderate‐certainty evidence). There is probably a reduction in the hourly consumption of local anaesthetic with AMB compared to BI for maintaining epidural analgesia during labour (MD −1.08 mg/h; 95% CI −1.78 to −0.38, 12 studies, 1121 women, moderate‐certainty evidence). Five out of seven studies reported an increase in maternal satisfaction with AMB compared to BI for maintaining epidural analgesia for labour; however, we did not pool these data due to their ordinal nature. Seven studies reported Apgar scores, though there was significant heterogeneity in reporting. None of the studies showed any significant difference between Apgar scores between groups.
Authors' conclusions
There is predominantly moderate‐certainty evidence that AMB is similar to BI for maintaining epidural analgesia for labour for all measured outcomes and may have the benefit of decreasing the risk of breakthrough pain and improving maternal satisfaction while decreasing the amount of local anaesthetic needed.
PICO
Plain language summary
Epidural with intermittent (automated mandatory bolus) versus constant delivery (basal infusion) for maintaining pain relief in childbirth
Background
Epidural analgesia involves the injection of pain relieving medication into the epidural space (area just outside the spinal column). It is an effective form of pain relief during childbirth. The medication is usually given via a programmable pump that injects the medication through a small tube positioned in the epidural space. Traditionally the medication was delivered at a constant rate known as a 'basal infusion'. Recently there has been interest in delivering the medication as an intermittent dose (every now and again) instead. This so‐called 'bolus dosing', or 'automated mandatory bolus', may be better for pain relief. This study reviewed the evidence regarding two interventions for maintaining epidural analgesia in childbirth: automated mandatory bolus and basal infusion.
Study characteristics
The evidence is current to January 2018. We found 12 studies involving 1121 women with uncomplicated pregnancies. We did not specifically assess the impact of the funding sources on the studies. The people taking part in the trials we looked for (known as randomized controlled trials) are randomly assigned to either the group receiving the treatment under investigation or to a group receiving standard treatment as the control. This is to reduce any bias that either the investigators or the participants of the trial may have.
Key results
We found that automated mandatory bolus decreases the risk of breakthrough pain (pain requiring medical intervention from an anaesthesiologist) compared with basal infusion during childbirth. It does this without increasing the risk of a caesarean section; the risk of instrumental delivery (whether the obstetrician intervenes to assist delivery using an obstetric forceps or vacuum device); or the duration of childbirth. It may also reduce the dose of medication required on a per hourly basis. In addition, five of seven studies found that mothers preferred the automated mandatory bolus over basal infusion.
Certainty of the evidence
The evidence was of moderate‐certainty for all the outcomes we measured, with the exception of the risk of caesarean delivery and risk of instrumental delivery, which had only low‐certainty evidence.
Authors' conclusions
Summary of findings
| Automated mandatory bolus versus basal infusion for maintenance of epidural analgesia in labour | |||||
| Patient or population: maintenance of epidural analgesia in labour | |||||
| Outcomes | Anticipated absolute effects* (95% CI) | Relative effect | № of participants | Certainty of the evidence | |
| Risk with basal infusion | Risk with automated mandatory bolus | ||||
| Breakthrough pain | Study population | RR 0.60 | 797 | ⊕⊕⊕⊝ | |
| 333 per 1000 | 200 per 1000 | ||||
| Caesarean delivery | Study population | RR 0.92 | 1079 | ⊕⊕⊝⊝ | |
| 160 per 1000 | 147 per 1000 | ||||
| Instrumental delivery | Study population | RR 0.75 | 1079 | ⊕⊕⊝⊝ | |
| 123 per 1000 | 92 per 1000 | ||||
| Duration of labour in min | The mean duration of labour in min ranged from 186.3 to 690.0 min | MD 10.38 min lower | — | 1079 | ⊕⊕⊕⊝ |
| LA consumption per hour | The mean LA consumption per hour ranged from 3 mg to 21.4 mg | MD 1.08 mg/h lower | — | 1121 | ⊕⊕⊕⊝ |
| *The risk in the intervention group (and its 95% confidence interval) is based on the assumed risk in the comparison group and the relative effect of the intervention (and its 95% CI). | |||||
| GRADE Working Group grades of evidence | |||||
| aDowngraded one level due to considerable statistical heterogeneity for this outcome, i.e. I2 = 69%. | |||||
Background
Description of the condition
Labour is arguably one of the most painful experiences a woman can undergo in her lifetime. The pain experienced during labour is affected by psychosocial influences, pain experiences and obstetric interventions, such as oxytocin augmentation. Epidural analgesia is considered to be the reference standard for labour analgesia and is often preferable to other modes of pain relief such as systemic opioids, nitrous oxide and non‐pharmacological methods. It is a common anaesthetic technique whereby women receive injections of local anaesthetics or opioids in the epidural space to cause numbness and weakness in the lower part of the body, providing pain relief during labour. Women most commonly receive long‐acting local anaesthetics like bupivacaine and ropivacaine. Opioids such as fentanyl and sufentanil are routinely co‐administered to supplement the effects of the local anaesthetics.
Description of the intervention
Two techniques are used to maintain epidural analgesia during labour: automated mandatory boluses and basal infusion. The initial bolus is given as an epidural or combined spinal epidural dose administration. Automated mandatory bolus is a drug delivery technique in which the dose is delivered intermittently in a bolus. Basal infusion is a drug delivery technique in which the dose is delivered continuously. Drug delivery by automated mandatory bolus results in a higher injectate pressure (pressure when injecting the medication) compared to basal infusion; the difference in the delivery technique is believed to affect the spread and distribution of the drug in the epidural space after administration. A greater spread and distribution in the epidural space may provide effective pain relief and produce lower risk of motor blockade.
Patient‐controlled epidural analgesia (PCEA) has been established as a preferred mode of epidural drug delivery since its introduction by Gambling in 1988 (Gambling 1988). The PCEA technique allows patient‐initiated activation of a bolus of pain medication to treat labour pain. In comparison with continuous epidural infusion, studies have shown that PCEA decreases breakthrough pain requiring anaesthetic intervention, reduces local anaesthetic consumption without compromising analgesic efficacy and increases patient satisfaction by allowing the patient autonomy during labour. PCEA is commonly administered with a basal infusion in addition to boluses on patient demand.
How the intervention might work
Cadaveric and experimental models have suggested that epidural medications given as boluses may lead to wider and more uniform spread of the drugs in the epidural space (Hogan 2002; Kaynar 1999). Hogan found that the spread of liquids in the epidural space is highly non‐uniform, through multiple small channels, and suggested that the spread would be most uniform when using large volumes and a correspondingly high injectate pressure near the site of injection to engage the most channels (Hogan 2002). Kaynar and Shankar's experimental model used a multi‐orifice epidural catheter with bolus or continuous infusion delivery (Kaynar 1999). The bolus technique resulted in a wider and more uniform spread of contrast agent, whilst the continuous infusion resulted in smaller spread that was exclusively through the proximal port of the epidural catheter.
Several trials have shown that the automated mandatory bolus technique appears to reduce breakthrough pain and increase patient satisfaction during epidural labour analgesia, due to a more uniform spread in the epidural space (Fettes 2006; Lim 2005; Sia 2013; Wong 2006). The two modes of epidural drug delivery differ in the injectate pressure generated during drug delivery, although the total amount of drug may be similar (e.g. the amount of drug in one hour).
Why it is important to do this review
In the development of epidural analgesia, several trials have compared maintenance of epidural analgesia using automated mandatory boluses with basal infusion, but none have conclusively shown one technique to be superior to the other (Capogna 2011; Chua 2004; Ferrer 2017; Fettes 2006; Leo 2010; Lim 2005; Lim 2010; Lin 2016; Salim 2005; Sia 2007; Sia 2013; Wong 2006). Chua and Sia performed the first clinical trial that showed that the bolus technique increased the duration and quality of pain relief during epidural analgesia in 42 nulliparous labouring women (Chua 2004). Several studies have found that automated mandatory boluses may reduce breakthrough pain (having pain despite being on epidural medication that requires the anaesthetist to give additional pain medication) when compared with continuous infusion (Ferrer 2017; Fettes 2006; Lim 2005; Sia 2013; Wong 2006), whilst others have not observed any difference between the two techniques (Capogna 2011; Leo 2010; Lim 2010; Salim 2005; Sia 2007). There may also be the potential that automated mandatory bolus may decrease the risk and/or degree of motor block, which may lead to a decrease in instrumental vaginal delivery and increased maternal satisfaction (Capogna 2011).
Presently there is no clear evidence whether this new technology of delivery of anaesthetics is superior to the current practice. We considered the anaesthetic, obstetric and foetal outcomes relevant to women and side effects of the treatments, including risk of breakthrough pain, caesarean delivery, instrumental birth, local anaesthetic consumption and duration of labour. If one intervention was found to be more effective or safer, or resulted in a decrease in the total drug used, the practice of epidural drug delivery could be more standardized for epidural analgesia in labour.
Objectives
To assess the effects of automated mandatory bolus versus basal infusion for maintaining epidural analgesia in labour.
Methods
Criteria for considering studies for this review
Types of studies
We included parallel‐group randomized controlled trials (RCTs) that compared the use of automated mandatory bolus with basal infusion for providing epidural analgesia pain relief during labour in women. We included studies irrespective of language and publication date and type. We included studies with and without a patient‐controlled epidural analgesia (PCEA) component.
We excluded non‐randomized studies such as cohort studies because of their increased risk of bias. We also excluded cross‐over trials, as this methodology is not appropriate for evaluating interventions that are administered at a specific time point. We excluded studies with combined automated mandatory boluses and basal infusion. We also excluded studies that did not use automated administration of bolus doses.
Types of participants
We included studies that recruited pregnant term women requesting epidural analgesia during labour.
We excluded studies that recruited women in preterm labour, with multiple pregnancy or malposition of fetus including breech presentations.
Types of interventions
We included studies that compared the use of automated intermittent mandatory boluses to basal infusion for maintaining epidural analgesia in labour. We included all local anaesthetics, with or without opioid maintenance regimens, administered during the epidural analgesia.
We excluded parturients (pregnant women who undergo labour) who received an intrathecal or spinal catheter for pain relief during labour. We excluded studies that utilized manually delivered boluses.
Types of outcome measures
Primary outcomes
-
Risk of breakthrough pain with the need for anaesthetic intervention (dichotomous)
-
Risk of caesarean delivery (dichotomous) (safety outcome)
-
Risk of instrumental delivery (dichotomous) (safety outcome)
Secondary outcomes
-
Duration of labour analgesia (continuous)
-
Local anaesthetic consumption per hour (continuous)
-
Maternal satisfaction (short ordinal scale)
-
Apgar scores (continuous): measured by Apgar score scale (safety outcome)
We considered the minimally important difference for risk of breakthrough pain, risk of caesarean delivery and risk of instrumental delivery when comparing automated mandatory bolus with basal infusion to be 5% for each outcome.
Search methods for identification of studies
Electronic searches
We searched the Cochrane Central Register of Controlled Trials (CENTRAL; 2018, Issue 1); MEDLINE (January 1966 to 16 January 2018) and Embase (January 1980 to 16 January 2018). We also searched the World Health Organization International Clinial Trials Registry Platform (WHO‐ICTRP) (August 2005 to 16 January 2018), and clinicaltrials.gov (February 2000 to 16 January 2018). Appendix 1 describes our search strategies for CENTRAL, MEDLINE, Embase, WHO‐ICTRP and clinicaltrials.gov.
We searched the Cochrane Pregnancy and Childbirth Group Trials Register with the Highly Sensitive Search Strategy (HSSS) found in the Cochrane Handbook for Systematic Reviews of Interventions (Higgins 2011), with the help of their Trials Search Co‐ordinator. In addition, we screened the bibliography of included studies to identify potentially eligible records. We did not place any language restrictions on our searches.
Searching other resources
We used free‐text terms in all databases and subject headings in combination when thesauri were a component of a database.
We reviewed the 'Related articles' feature of PubMed for all eligible trials and reviews.
We screened the reference lists of all eligible trials and reviews.
We also contacted authors of included studies in this field in order to identify unpublished research and trials still underway on 8 July 2016. We screened the reference lists of the included articles for potentially relevant articles.
Data collection and analysis
Two authors (LWL, OTT) independently collected data on a standardized data collection form (see Appendix 2), and a third author (SBL) resolved any remaining disagreements through discussion.
Selection of studies
Two authors (LWL, OTT) independently assessed for inclusion all the potential studies we identified as a result of the search strategy (Criteria for considering studies for this review) and reviewed the titles and abstracts from the searches.
Data extraction and management
Two authors (LWL, OTT) independently extracted the data using a standardized form (see Appendix 2). We extracted information pertaining to the study design, method of randomization, use of allocation concealment, reporting of the study setting and participants, inclusion and exclusion criteria, sample size, interventions and outcomes. Two authors (SBL, FJS) entered and checked the data independently, and a third author (PNA) resolved disagreements.
Assessment of risk of bias in included studies
Two authors (LWL, OTT) independently assessed trial quality and risk of bias for each study using the criteria outlined in the Cochrane Handbook for Systematic Reviews of Interventions (Higgins 2011), and a third author (SBL) resolved any disagreements.
Based on the Cochrane 'Risk of bias' tool in Review Manager 5 (RevMan 5) (RevMan 2014), we considered the following domains (Higgins 2011): random sequence generation, allocation concealment, blinding of participants and personnel, blinding of outcome assessment, incomplete outcome data, selective reporting, and other bias. Appendix 3 presents the details on the Cochrane 'Risk of bias' tool and criteria for judgment.
We graded each of the above dimensions of trial quality as being at low, high or unclear risk of bias. Given the low risk of bias for all studies and high quality of evidence for each outcome, we did not conduct a stratified analysis based on study quality.
Measures of treatment effect
Dichotomous data
For dichotomous data, we presented results as summary risk ratio (RR) with 95% confidence intervals (CIs).
Continuous data
For continuous data, we used the mean difference (MD) if trials measured the outcomes in the same way. We planned to use the standardized mean difference (SMD) to obtain pooled estimates of an outcome measured on different scales.
Unit of analysis issues
The woman was the unit of analysis in all of the studies.
Dealing with missing data
We attempted to contact the study authors if key information was unavailable in the publications.
Assessment of heterogeneity
We evaluated clinical heterogeneity by qualitatively appraising differences in study characteristics such as participants, interventions, outcomes assessed and study methodology. Quantitative pooling of the data was first justified by a consensus clinical judgement of sufficient clinical homogeneity. We informally evaluated and investigated the degree of statistical heterogeneity by visual inspection of forest plots and more formally by using the Tau2, I2 and Chi2 statistics. We regarded heterogeneity as considerable if I2 was greater than 75%, substantial if I2 was between 50% and 90%, moderate if I2 was between 30% and 60%, and low if I2 was less than 40%.
Assessment of reporting biases
We checked the methodology and study protocols of the primary studies where available. We assessed publication bias and other small study effects in a qualitative manner using a funnel plot.
In future updates of this review, we will test for funnel plot asymmetry using weighted linear regression of effect estimates on their standard error if more than 10 trials are included (Egger 1997).
Data synthesis
We carried out statistical analyses using RevMan 2014. For data synthesis of dichotomous outcomes, we used the Mantel‐Haenszel method and reported the RRs and 95% CIs. For continuous outcomes we used the inverse variance method. We analysed maternal satisfaction as a continuous outcome, even if measured on ordinal scales. Some studies administered ropivacaine or levobupivacaine local anaesthesia in place of bupivacaine. For such studies we assumed 60% potency of bupivacaine based on a similar systematic review and meta‐analysis (George 2012). Hence we multiplied the means and standard deviations by 0.6. We used the RR to report pooled results for dichotomous outcomes. We used MDs to pool the results of the continuous outcomes. Where studies reported medians and interquartile ranges, we obtained the means and standard deviations (SD) from George 2012, we converted them using the formula by Hozo 2005, or we excluded them from the meta‐analysis and reported results qualitatively.
We expected both clinical and statistical heterogeneity, and therefore we used the random‐effects model to meta‐analyse all outcomes.
Subgroup analysis and investigation of heterogeneity
We performed the following subgroup analysis for all the outcomes.
-
Local anaesthetic alone versus local anaesthetic plus opioid regimens.
-
Epidural technique: epidural alone versus combined spinal‐epidural technique.
-
PCEA: regimens that used PCEA versus those that did not.
Sensitivity analysis
We did not perform sensitivity analyses because the quality of the studies was consistent across the different studies (Risk of bias in included studies).
We will consider performing sensitivity analysis in future updates of this review if required.
Sensitivity analysis for trial quality involves analysis based on rating of selection bias and attrition bias. We would exclude studies of poor quality from the analysis (those rated as unclear or high risk of bias) in order to assess for any substantive difference to the overall result. The sensitivity analysis for compliance would be based on trials where women did not receive their allocated treatment, combination therapy or intervention, or they received an additional form of analgesia to the one allocated. These sensitivity analyses will use only the primary outcomes.
'Summary of findings' table
We used the principles of the GRADE system in order to assess the certainty of the body of evidence associated with the following specific outcomes (Guyatt 2008).
-
Risk of breakthrough pain requiring anaesthetic intervention.
-
Risk of caesarean delivery.
-
Risk of instrumental delivery.
-
Duration of labour analgesia.
-
Total dose of local anaesthetic per hour.
We constructed a 'Summary of findings' table comparing automated mandatory bolus versus basal infusion therapy using GRADEpro software (GRADEpro GDT 2015). The GRADE approach assesses the certainty of a body of evidence based on the extent to which one can be confident that an estimate of effect or association reflects the item being assessed. Assessment of the certainty of a body of evidence involved considering the methodological quality of studies, the directness of the evidence, the heterogeneity of the data, the precision of the effect estimates and the risk of publication bias.
Results
Description of studies
Results of the search
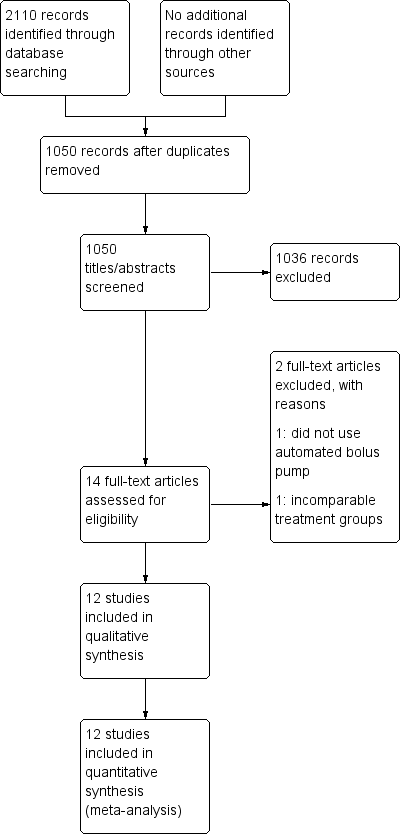
See Figure 1.

Study flow diagram.
We identified 2110 citations from the database searches. After screening by title and abstract, we obtained full text articles for 14 citations that we judged as potentially eligible for inclusion in the review. After excluding one study that did not use an automated bolus pump as their intervention and one study that utilized varying concentrations and volumes of local anaesthetic (rendering the different groups incomparable), we finally included 12 studies in our review.
Included studies
Characteristics of included studies
We included 12 studies involving 1121 women. Ten of the 12 studies enrolled healthy nulliparous women (Capogna 2011; Chua 2004; Fettes 2006; Leo 2010; Lim 2005; Lim 2010; Lin 2016; Salim 2005; Sia 2007; Sia 2013), while two studies enrolled healthy parous women at term (Ferrer 2017; Wong 2006). Ten studies involved women with singleton fetus in vertex presentation, while two studies did not specify the fetal position (Ferrer 2017; Lin 2016). All studies excluded women with complicated pregnancies.
All 12 studies reported the local anaesthetic consumption (either as total consumed or per hour consumption). The other outcomes included breakthrough pain, number of women who underwent caesarean delivery, number of women who underwent instrumental birth, duration of labour (total or first and second stage) and Apgar scores.
There were variations in the technique of initiation of epidural analgesia. Seven studies used the combined spinal epidural (CSE) technique (Chua 2004; Leo 2010; Lim 2005; Lim 2010; Sia 2007; Sia 2013; Wong 2006), with two of these studies giving only an opioid (fentanyl in both) without any local anaesthetic intrathecally (Chua 2004; Lim 2005). The other five studies only placed an epidural catheter without any intrathecal injection (Capogna 2011; Ferrer 2017; Fettes 2006; Lin 2016; Salim 2005).
There was also variation with the analgesic medications given in terms of the choice of drugs as well as the dosages. Six studies utilized ropivacaine with fentanyl (Chua 2004; Fettes 2006; Leo 2010; Lim 2010; Sia 2007; Sia 2013), one used ropivacaine with sufentanil (Lin 2016). Two studies utilized levobupivacaine: Capogna 2011 with sufentanil and Lim 2005 with fentanyl, and three studies utilized bupivacaine with or without fentanyl (Ferrer 2017; Salim 2005; Wong 2006).
In one study, the analgesic medication provided differed between the two groups, with the AMB group receiving bupivacaine only and the BI group receiving bupivacaine plus fentanyl (Salim 2005).
Excluded studies
We excluded two studies in total. One study did not use automated mandatory boluses but rather manual intermittent boluses (Patkar 2015). In the other, the interventions between the groups were not comparable: the continuous infusion group received half the volume of local anaesthetic as the AMB group, and there were two different concentrations of local anaesthetic administered to the two different AMB groups (Nunes 2014).
See Characteristics of excluded studies.
Studies awaiting classification
There are no studies awaiting classification.
Ongoing studies
We identified no ongoing studies.
Risk of bias in included studies

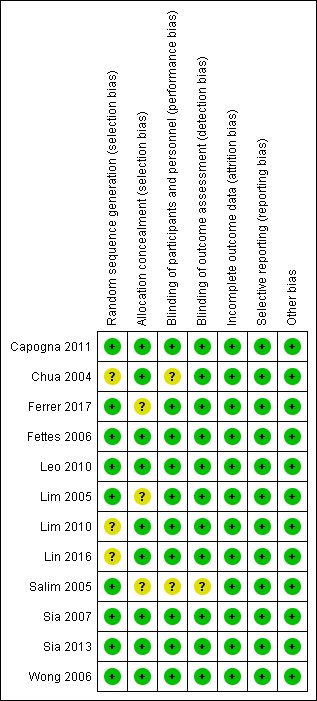
Risk of bias summary: review authors' judgements about each risk of bias item for each included study.

Risk of bias graph: review authors' judgements about each risk of bias item presented as percentages across all included studies.
Overall, there was low risk of selection, performance, detection, attrition and reporting bias, and no overt sources of other potential biases in the included studies. For allocation bias, 6 of the 12 studies reported the methods for both randomization and allocation (computer‐generated random numbers and sealed opaque envelopes respectively). Three studies reported using a computer‐generated randomization sequence but no allocation concealment (Ferrer 2017; Lim 2005; Salim 2005), and three studies reported using sealed opaque envelopes for allocation concealment but no randomization (Chua 2004; Lim 2010; Lin 2016). For performance and detection bias, 10 studies were double‐blinded and provided a description of the blinding, while one study did not report any blinding (Salim 2005), and one study was single‐blinded (Ferrer 2017). Apart from Lim 2005, no studies specifically mentioned performing an intention‐to‐treat analysis. All studies reported prespecified outcomes and had minimal missing data (< 10%). We therefore judged them to be at low risk of attrition and reporting bias.
Allocation
Nine studies utilized computer‐generated random numbers for randomization (Capogna 2011; Ferrer 2017; Fettes 2006; Leo 2010; Lim 2010; Salim 2005; Sia 2007; Sia 2013; Wong 2006). We judged these studies to be at low risk for selection bias (random sequence generation). Three studies did not describe the method of randomization (Chua 2004; Lim 2010; Lin 2016). We judged these studies as being at unclear risk of selection bias (random sequence generation).
Nine studies utilized sealed opaque envelopes for allocation (Capogna 2011; Chua 2004; Fettes 2006; Leo 2010; Lim 2010; Lin 2016; Sia 2007; Sia 2013; Wong 2006). We judged these studies as being at low risk of selection bias (allocation concealment). Three studies did not describe the method of allocation concealment (Ferrer 2017; Lim 2005; Salim 2005). Although Ferrer 2017 and Salim 2005 did state that the allocation was concealed, we judged these studies to be at unclear risk of selection bias (allocation concealment) because the method of allocation concealment was not described.
Blinding
Ten studies were double‐blinded and provided a description of the blinding (Capogna 2011; Chua 2004; Fettes 2006; Leo 2010; Lim 2005; Lim 2010; Lin 2016; Sia 2007; Sia 2013; Wong 2006). The principal investigator performed one of these blocks in one study, but a blinded anaesthetist handled subsequent data collection (Chua 2004). We judged these studies to be at low risk of performance bias except for Chua 2004, which we judged to be at unclear risk for performance bias.
One study described itself as single‐blinded, although the research assistant and the nurse staff in charge of drug administration were the only ones that knew the randomization sequence. Neither the participant nor the attending anaesthesiologist or the outcome assessor knew the randomization sequence (Ferrer 2017), so we judged it to be at low risk. One study did not describe blinding (Salim 2005), so we judged this study to be at unclear risk of performance and detection bias.
Incomplete outcome data
All 12 studies had a low risk of attrition bias, reporting all outcome data (recruitment and attrition data) with no missing data. We performed the analyses using the intention‐to‐treat principle (Capogna 2011; Chua 2004; Ferrer 2017; Fettes 2006; Leo 2010; Lim 2005; Lim 2010; Lin 2016; Salim 2005; Sia 2007; Sia 2013; Wong 2006). We judged all studies to be at low risk of attrition bias.
Selective reporting
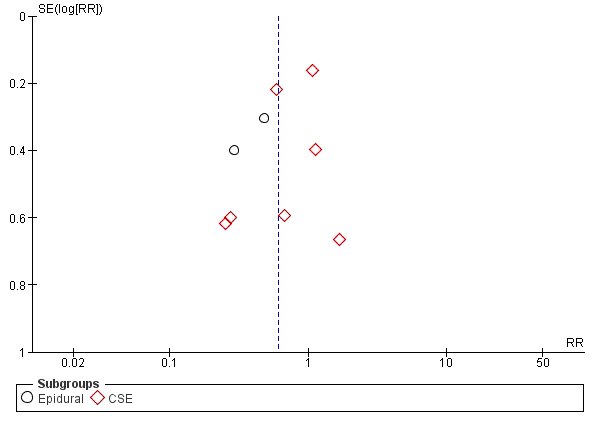
All 12 studies reported all prespecified outcomes, and we judged them to be at low risk for reporting bias (Capogna 2011; Chua 2004; Fettes 2006; Ferrer 2017; Leo 2010; Lim 2005; Lim 2010; Lin 2016; Salim 2005; Sia 2007; Sia 2013; Wong 2006). The funnel plot also suggested no reporting bias (Figure 4).

Funnel plot of comparison: 1 Automated mandatory bolus vs basal infusion, outcome: 1.2 Breakthrough pain (epidural vs CSE).
Other potential sources of bias
We judged all 12 studies to be at low risk for other bias (Capogna 2011; Chua 2004; Ferrer 2017; Fettes 2006; Leo 2010; Lim 2005; Lim 2010; Lin 2016; Salim 2005; Sia 2007; Sia 2013; Wong 2006).
Effects of interventions
See summary of findings Table for the main comparison.
Primary outcomes
1. Risk of breakthrough pain
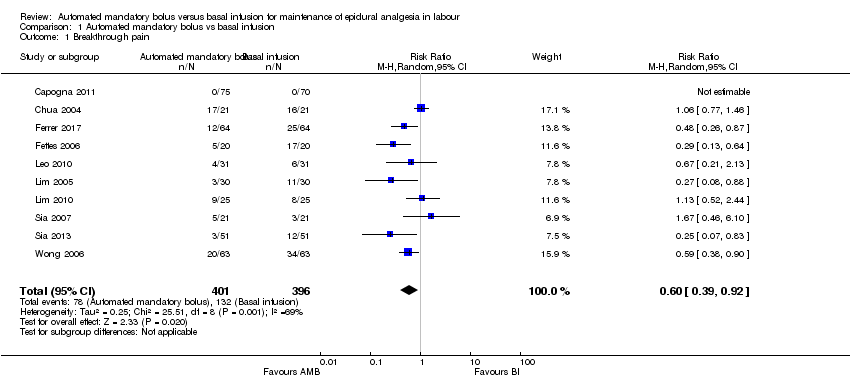
Ten studies in 797 women reported the incidence of breakthrough pain (Capogna 2011; Chua 2004; Ferrer 2017; Fettes 2006; Leo 2010; Lim 2005; Lim 2010; Sia 2007; Sia 2013; Wong 2006). The pooled results showed automated mandatory bolus probably reduces the risk of breakthrough pain (RR 0.60 95%, CI −0.39 to 0.92; Analysis 1.1) compared to continuous infusion for maintaining epidural analgesia.
There was substantial heterogeneity (I2 = 69%). The overall certainty of evidence based on GRADE was moderate.
We grouped studies on the basis of the method of initiation of the epidural (epidural versus combined spinal‐epidural). For the subgroup of CSE, the automated mandatory bolus probably reduces the risk of breakthrough pain (RR 0.71, 95% CI 0.44 to 1.13, random‐effects, 7 studies, 484 participants; moderate‐certainty evidence; Analysis 1.2) compared to continuous infusion for maintenance of epidural analgesia. There was substantial heterogeneity (I2 = 64%).
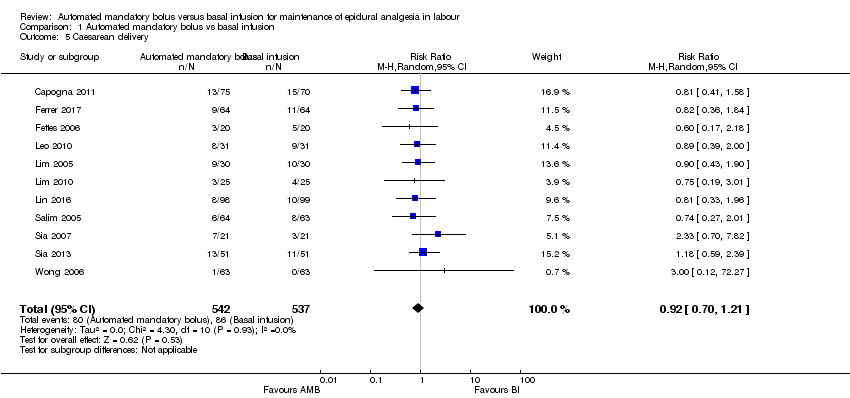
2. Risk of caesarean delivery (safety outcome)
Eleven studies in 1079 women reported the incidence of caesarean delivery (Capogna 2011; Ferrer 2017; Fettes 2006; Leo 2010; Lim 2005; Lim 2010; Lin 2016; Salim 2005; Sia 2007; Sia 2013; Wong 2006). The pooled results showed that automated mandatory bolus may make little or no difference in the risk of caesarean delivery (RR 0.92, 95% CI 0.70 to 1.21, random‐effects; Analysis 1.5) compared with continuous infusion for maintenance of epidural analgesia. This difference was also not clinically meaningful as the risk difference did not exceed 5% (RD 0.00, 95% CI −0.03 to 0.03).
There was low heterogeneity (I2 = 0%). The overall certainty of the evidence based on GRADE was low.
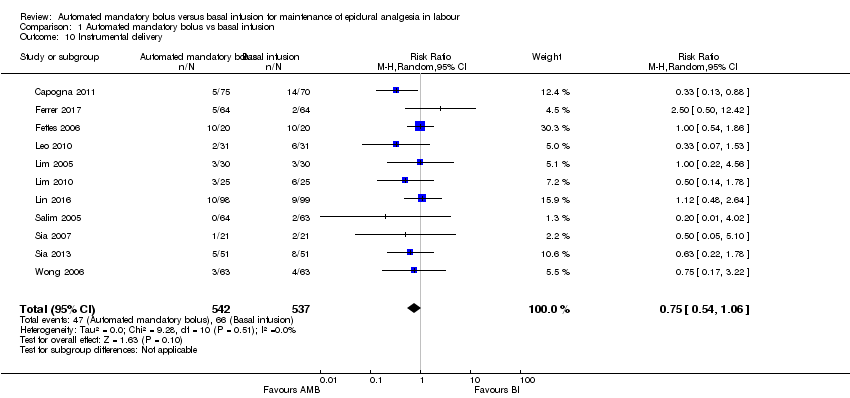
3. Risk of instrumental delivery (safety outcome)
Eleven studies in 1079 women reported the incidence of instrumental delivery (Capogna 2011; Ferrer 2017; Fettes 2006; Leo 2010; Lim 2005; Lim 2010; Lin 2016; Salim 2005; Sia 2007; Sia 2013; Wong 2006). The pooled results showed that automated mandatory bolus may make little or no difference in the risk of instrumental delivery (RR 0.75, 95% CI 0.54 to 1.06, random‐effects; Analysis 1.10) compared with continuous infusion. The difference was also not clinically meaningful, as the risk difference did not exceed 5% difference (RD −0.03, 95% CI −0.06 to −0.01).
There was low heterogeneity (I2 = 0%). The overall certainty of the evidence based on GRADE was low .
Secondary outcomes
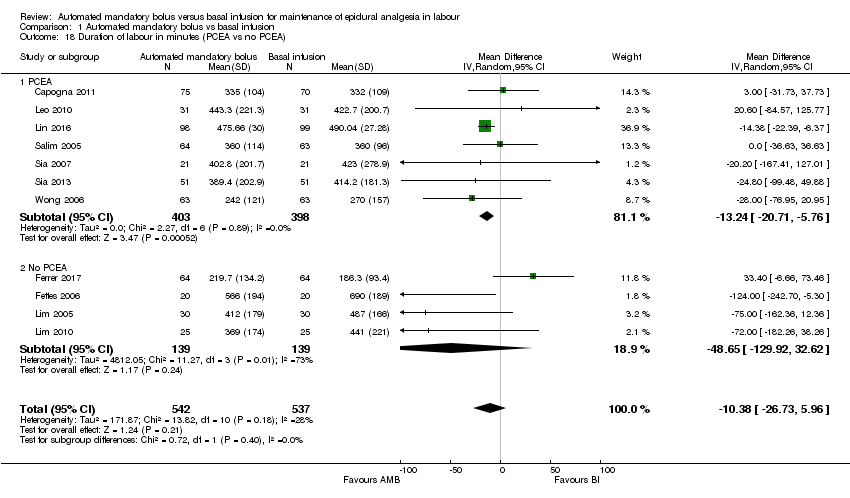
1. Duration of labour analgesia in minutes
Eleven studies in 1079 women reported the duration of labour analgesia (Capogna 2011; Ferrer 2017; Fettes 2006; Leo 2010; Lim 2005; Lim 2010; Lin 2016; Salim 2005; Sia 2007; Sia 2013; Wong 2006). The pooled results showed that automated mandatory bolus probably makes little or no difference in the duration of labour analgesia (MD −10.38 min, 95% CI −26.73 to 5.96, random‐effects; Analysis 1.15) compared with continuous infusion. There was low heterogeneity (I2 = 28%), and the overall certainty of the evidence based on GRADE was moderate.
We grouped studies based on the regimen used to maintain epidural analgesia (PCEA versus no PCEA). For the subgroup that utilized PCEA, the results showed that automated mandatory bolus probably reduces the duration of labour analgesia (MD −13.24 min, 95% CI −20.71 to −5.76, random‐effects; 7 studies, 801 participants; Analysis 1.18) compared with continuous infusion for maintenance of epidural analgesia. There was low heterogeneity (I2 = 0%). For the subgroup that did not utilize PCEA, the results showed that automated mandatory bolus probably makes little or no difference in the duration of labour analgesia (MD −48.65 min, 95% CI −129.92 to 32.62, random‐effects; 4 studies, 278 participants; Analysis 1.18) compared with continuous infusion. There was substantial heterogeneity (I2 = 73%).
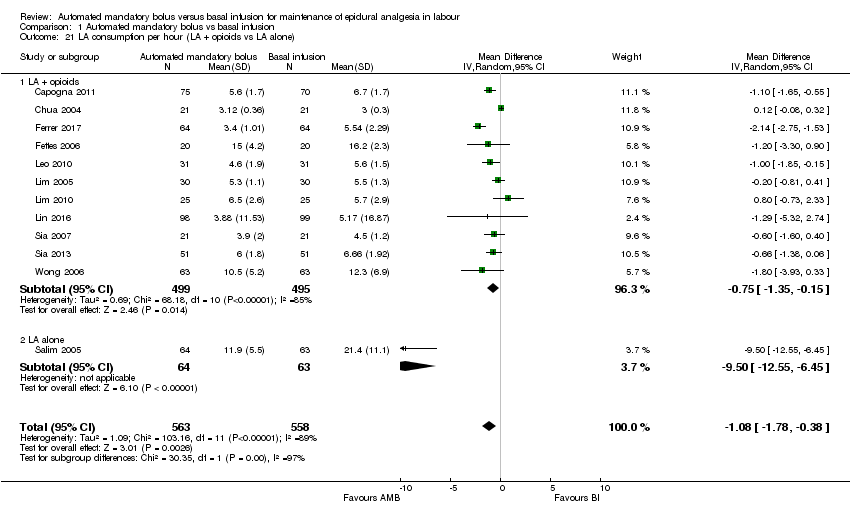
2. Local anaesthetic consumption per hour
Twelve studies in 1121 women reported the local anaesthetic consumption per hour (Capogna 2011; Chua 2004; Ferrer 2017; Fettes 2006; Leo 2010; Lim 2005; Lim 2010; Lin 2016; Salim 2005; Sia 2007; Sia 2013; Wong 2006). We accounted for differing LAs used by various studies by converting them to bupivacaine equivalents as described in a previous study (George 2012). The pooled results showed that automated mandatory bolus probably reduces local anaesthetic consumption per hour in parturients admitted into the labour ward (MD −1.08 mg/h, 95% CI −1.78, −0.38; random‐effects; Analysis 1.20) compared to continuous infusion for maintenance of epidural analgesia. There was considerable heterogeneity (I2 = 89%). The overall certainty of the evidence based on GRADE was moderate.
We grouped studies based on the regimen used to maintain epidural analgesia (PCEA versus no PCEA). For the subgroup that utilized PCEA, the results showed that automated mandatory bolus probably reduces local anaesthetic consumption per hour in parturients admitted into the labour ward (MD −1.59 mg/h, 95% CI −2.58 to −0.60, random‐effects; 7 studies, 801 participants; Analysis 1.23) as compared to continuous infusion. There was considerable heterogeneity (I2 = 81%). For the subgroup that did not utilize PCEA, the results showed that automated mandatory bolus may make little or no difference in the amount of local anaesthetic consumed per hour (MD −0.53 mg/h, 95% CI −1.58, 0.52, random‐effects; 4 studies, 278 participants; Analysis 1.23) as compared with continuous infusion for maintenance of epidural analgesia. There was high heterogeneity (I2 = 92%).
3. Maternal satisfaction
Seven studies in 570 women reported maternal satisfaction scores (Ferrer 2017; Leo 2010; Lim 2005; Lim 2010; Sia 2007; Sia 2013; Wong 2006). The common definition of maternal satisfaction is using a score of 0 (very dissatisfied) to 100 (very satisfied) using patient verbal reporting or a visual analogue scale (VAS) for pain as a proxy for satisfaction. As maternal satisfaction scores are ordinal in nature, we have decided to review the data qualitatively. Five studies reported increased maternal satisfaction with AMB as compared to BI (Leo 2010; Lim 2005; Lim 2010; Sia 2013; Wong 2006), while two studies found no difference in maternal satisfaction between AMB and BI (Ferrer 2017; Sia 2007).
4. Apgar scores: measured by Apgar score scale (safety outcome)
Nine studies reported Apgar scores, with one study reporting Apgar scores at 1, 5 and 10 minutes (Ferrer 2017), four studies reporting Apgar scores at 5 minutes (Leo 2010; Lim 2005; Lim 2010; Sia 2013), three studies reporting Apgar scores at both 1 and 5 minutes (Fettes 2006; Lin 2016; Salim 2005), and one study reporting Apgar scores greater than seven at 5 minutes (Sia 2007). In view of heterogeneity of reporting we have decided to review the data qualitatively. None of the studies showed any significant difference between Apgar scores between groups.
Discussion
Summary of main results
Moderate‐certainty evidence from 12 studies (1121 women) contributing data to the outcomes of this review showed a significant reduction in the risk of breakthrough pain with automated mandatory bolus (AMB) as compared with basal infusion (BI). There was high‐certainty evidence that showed no difference in the risk of caesarean delivery between groups, while moderate‐certainty evidence showed no difference in the risk of instrumental delivery. There was moderate‐certainty evidence that showed no difference in the duration of labour analgesia. Of note, four studies reported the duration from epidural initiation to time of breakthrough pain (Lim 2005; Leo 2010; Lim 2010; Sia 2013), but there was no difference between groups. Few participants in each study had breakthrough pain, which led to a small number of events. There was moderate‐certainty evidence of a statistically significant reduction in local anaesthetic consumption per hour with AMB. Qualitatively, there was increased maternal satisfaction with AMB compared to BI and no difference in Apgar scores between AMB and BI.
The 12 studies identified and addressed most of the objectives of the review. However, only 7 of the 12 studies reported maternal satisfaction. The results of this review are relevant to current practice as AMBs are increasingly used internationally.
Overall completeness and applicability of evidence
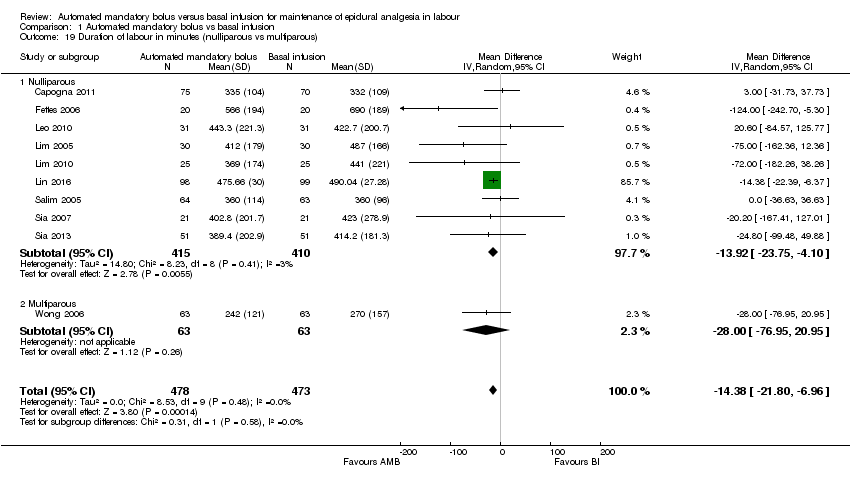
Ten of the 12 included studies enrolled healthy nulliparous women (Capogna 2011; Chua 2004; Fettes 2006; Leo 2010; Lim 2005; Lim 2010; Lin 2016; Salim 2005; Sia 2007; Sia 2013), while one study enrolled healthy parous women at term (Wong 2006), and one study enrolled both nulliparous and multiparous women (Ferrer 2017). Ten studies involved women with a singleton fetus in vertex presentation, while two studies did not specify the fetal lie (Ferrer 2017; Lin 2016); all 12 studies excluded women with complicated pregnancies. The studies were of sufficient scope to address the objectives of the review, investigating most relevant participants, interventions and outcomes; however, only two studies included multiparous women.
Quality of the evidence
All 12 studies with 1121 women reported random allocation, but only 9 described the method of randomization, all used computer‐generated random numbers (Capogna 2011; Ferrer 2017; Fettes 2006; Leo 2010; Lim 2005; Salim 2005; Sia 2007; Sia 2013; Wong 2006). Nine studies reported the method for allocation concealment, which consisted of sealed opaque envelopes in all cases (Capogna 2011; Chua 2004; Fettes 2006; Leo 2010; Lim 2010; Lin 2016; Sia 2007; Sia 2013; Wong 2006). There was overall low risk of selection bias.
There was a overall low risk of performance bias, detection bias, attrition bias, reporting bias and other potential bias. The overall certainty of evidence was moderate for incidence of breakthrough pain, instrumental delivery, duration of labour and hourly local anaesthesia consumption. This was mostly due to imprecision resulting from wide 95% confidence intervals. The quality of evidence for the risk of caesarean delivery was high.
Potential biases in the review process
Potential biases in the review process can arise from clinical heterogeneity due to the following factors: differing types and concentrations of local anaesthesia (details provided in Data synthesis), usage of adjuvants (e.g. opioids), technique of initiation of epidural analgesia (epidural alone versus combined spinal‐epidural) and methods of reporting Apgar scores. Women could receive epidural analgesia at various stages of labour and would have different pain thresholds. Hence, the different onset of epidural analgesia could influence the duration of epidural use, local anaesthetic consumption and the likelihood of developing motor blockade. The use of oxytocin augmentation should also be considered as a confounder.
Potential bias may also arise from statistical heterogeneity, even after stratifying into the pre‐planned subgroups. However, we did not select the subgroups based on anticipated statistical heterogeneity, but after careful consideration of clinically meaningful sub‐populations that may be generalizable to other similar populations.
With regard to the search, potential publication bias may arise due to varied search terms used for each database and the fact that we were unable to identify unpublished studies through author contacts. WIth this in mind, we have developed a highly sensitive search strategy and extended our search beyond CENTRAL, Embase and Pubmed to include trial registries (clinicaltrials.gov and www.who.int/ictrp/en) and a discipline‐specific database (Cochrane Pregnancy and Childbirth Group Trials Register).
Alex Sia is the author of six of the studies included in this review (Chua 2004; Leo 2010; Lim 2005; Lim 2010; Sia 2007; Sia 2013). He was not involved in the process of appraising quality of papers or abstracting data from papers.
Agreements and disagreements with other studies or reviews
We compared this review with the systematic review performed by George 2012. Our data is consistent with theirs, and we utilized the same method of conversion for studies with different local anaesthetics to bupivacaine equivalents. We also included two additional studies in this review (Lin 2016; Sia 2013).
Our results show good agreement with George and colleagues' review in the pooled results (George 2012). We found similar results for the risk of caesarean delivery (no difference), instrumental delivery (no difference), local anaesthetic consumption (decreased with AMB) and maternal satisfaction (increased with AMB). We also found a decrease in duration of labour with AMB, while George 2012 found a decrease in the duration of second stage of labour with AMB (we did not separately analyse the duration of first and second stages of labour). However, we found a decrease in the risk of breakthrough pain with AMB, whereas George 2012 did not.
Study flow diagram.
Risk of bias summary: review authors' judgements about each risk of bias item for each included study.

Risk of bias graph: review authors' judgements about each risk of bias item presented as percentages across all included studies.
Funnel plot of comparison: 1 Automated mandatory bolus vs basal infusion, outcome: 1.2 Breakthrough pain (epidural vs CSE).
Comparison 1 Automated mandatory bolus vs basal infusion, Outcome 1 Breakthrough pain.

Comparison 1 Automated mandatory bolus vs basal infusion, Outcome 2 Breakthrough pain (epidural vs CSE).

Comparison 1 Automated mandatory bolus vs basal infusion, Outcome 3 Breakthrough pain (PCEA vs no PCEA).
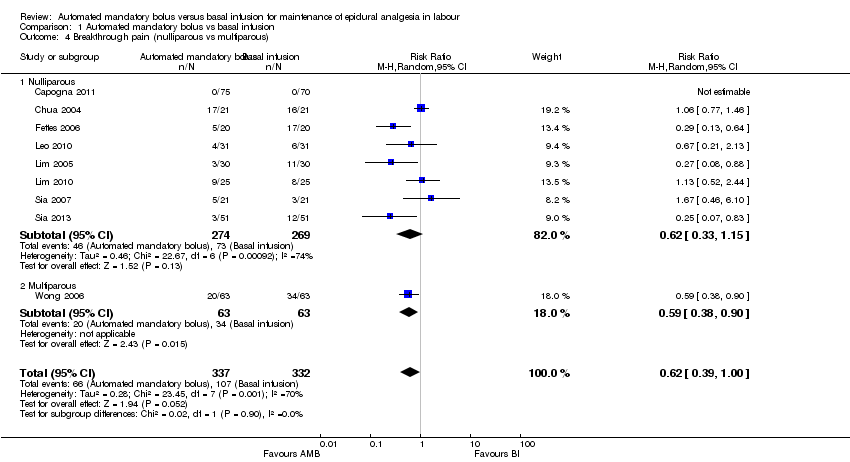
Comparison 1 Automated mandatory bolus vs basal infusion, Outcome 4 Breakthrough pain (nulliparous vs multiparous).
Comparison 1 Automated mandatory bolus vs basal infusion, Outcome 5 Caesarean delivery.

Comparison 1 Automated mandatory bolus vs basal infusion, Outcome 6 Caesarean delivery (LA + opioids vs LA alone).

Comparison 1 Automated mandatory bolus vs basal infusion, Outcome 7 Caesarean delivery (epidural vs CSE).

Comparison 1 Automated mandatory bolus vs basal infusion, Outcome 8 Caesarean delivery (PCEA vs no PCEA).

Comparison 1 Automated mandatory bolus vs basal infusion, Outcome 9 Caesarean delivery (nulliparous vs multiparous).
Comparison 1 Automated mandatory bolus vs basal infusion, Outcome 10 Instrumental delivery.

Comparison 1 Automated mandatory bolus vs basal infusion, Outcome 11 Instrumental delivery (LA + opioids vs LA alone).
Comparison 1 Automated mandatory bolus vs basal infusion, Outcome 12 Instrumental delivery (epidural vs CSE).

Comparison 1 Automated mandatory bolus vs basal infusion, Outcome 13 Instrumental delivery (PCEA vs No PCEA).
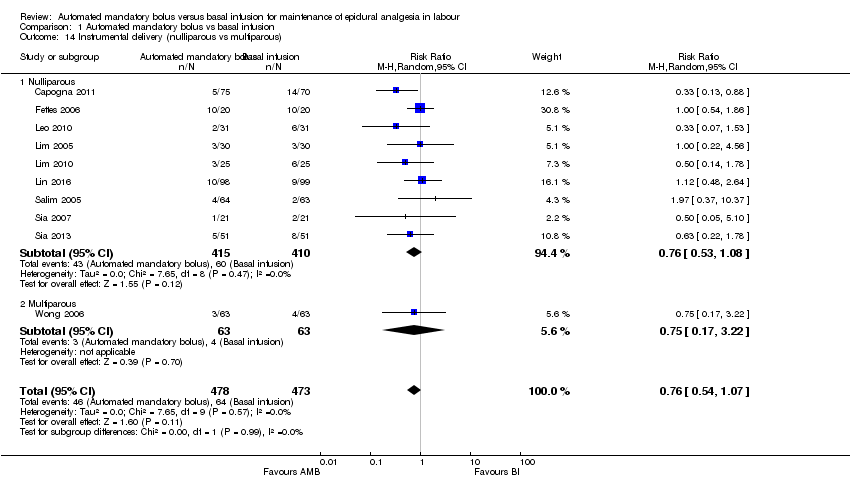
Comparison 1 Automated mandatory bolus vs basal infusion, Outcome 14 Instrumental delivery (nulliparous vs multiparous).

Comparison 1 Automated mandatory bolus vs basal infusion, Outcome 15 Duration of labour in minutes.

Comparison 1 Automated mandatory bolus vs basal infusion, Outcome 16 Duration of labour in minutes (LA + opioids vs LA alone).

Comparison 1 Automated mandatory bolus vs basal infusion, Outcome 17 Duration of labour in minutes (epidural vs CSE).
Comparison 1 Automated mandatory bolus vs basal infusion, Outcome 18 Duration of labour in minutes (PCEA vs no PCEA).
Comparison 1 Automated mandatory bolus vs basal infusion, Outcome 19 Duration of labour in minutes (nulliparous vs multiparous).

Comparison 1 Automated mandatory bolus vs basal infusion, Outcome 20 LA consumption per hour.
Comparison 1 Automated mandatory bolus vs basal infusion, Outcome 21 LA consumption per hour (LA + opioids vs LA alone).

Comparison 1 Automated mandatory bolus vs basal infusion, Outcome 22 LA consumption per hour (epidural vs CSE).

Comparison 1 Automated mandatory bolus vs basal infusion, Outcome 23 LA consumption per hour (PCEA vs no PCEA).

Comparison 1 Automated mandatory bolus vs basal infusion, Outcome 24 LA consumption per hour (nulliparous vs multiparous).
| Automated mandatory bolus versus basal infusion for maintenance of epidural analgesia in labour | |||||
| Patient or population: maintenance of epidural analgesia in labour | |||||
| Outcomes | Anticipated absolute effects* (95% CI) | Relative effect | № of participants | Certainty of the evidence | |
| Risk with basal infusion | Risk with automated mandatory bolus | ||||
| Breakthrough pain | Study population | RR 0.60 | 797 | ⊕⊕⊕⊝ | |
| 333 per 1000 | 200 per 1000 | ||||
| Caesarean delivery | Study population | RR 0.92 | 1079 | ⊕⊕⊝⊝ | |
| 160 per 1000 | 147 per 1000 | ||||
| Instrumental delivery | Study population | RR 0.75 | 1079 | ⊕⊕⊝⊝ | |
| 123 per 1000 | 92 per 1000 | ||||
| Duration of labour in min | The mean duration of labour in min ranged from 186.3 to 690.0 min | MD 10.38 min lower | — | 1079 | ⊕⊕⊕⊝ |
| LA consumption per hour | The mean LA consumption per hour ranged from 3 mg to 21.4 mg | MD 1.08 mg/h lower | — | 1121 | ⊕⊕⊕⊝ |
| *The risk in the intervention group (and its 95% confidence interval) is based on the assumed risk in the comparison group and the relative effect of the intervention (and its 95% CI). | |||||
| GRADE Working Group grades of evidence | |||||
| aDowngraded one level due to considerable statistical heterogeneity for this outcome, i.e. I2 = 69%. | |||||
| Outcome or subgroup title | No. of studies | No. of participants | Statistical method | Effect size |
| 1 Breakthrough pain Show forest plot | 10 | 797 | Risk Ratio (M‐H, Random, 95% CI) | 0.60 [0.39, 0.92] |
| 2 Breakthrough pain (epidural vs CSE) Show forest plot | 10 | 797 | Risk Ratio (M‐H, Random, 95% CI) | 0.60 [0.39, 0.92] |
| 2.1 Epidural | 3 | 313 | Risk Ratio (M‐H, Random, 95% CI) | 0.40 [0.25, 0.64] |
| 2.2 CSE | 7 | 484 | Risk Ratio (M‐H, Random, 95% CI) | 0.71 [0.44, 1.13] |
| 3 Breakthrough pain (PCEA vs no PCEA) Show forest plot | 10 | 797 | Risk Ratio (M‐H, Random, 95% CI) | 0.60 [0.39, 0.92] |
| 3.1 PCEA | 5 | 477 | Risk Ratio (M‐H, Random, 95% CI) | 0.61 [0.35, 1.07] |
| 3.2 No PCEA | 5 | 320 | Risk Ratio (M‐H, Random, 95% CI) | 0.58 [0.30, 1.12] |
| 4 Breakthrough pain (nulliparous vs multiparous) Show forest plot | 9 | 669 | Risk Ratio (M‐H, Random, 95% CI) | 0.62 [0.39, 1.00] |
| 4.1 Nulliparous | 8 | 543 | Risk Ratio (M‐H, Random, 95% CI) | 0.62 [0.33, 1.15] |
| 4.2 Multiparous | 1 | 126 | Risk Ratio (M‐H, Random, 95% CI) | 0.59 [0.38, 0.90] |
| 5 Caesarean delivery Show forest plot | 11 | 1079 | Risk Ratio (M‐H, Random, 95% CI) | 0.92 [0.70, 1.21] |
| 6 Caesarean delivery (LA + opioids vs LA alone) Show forest plot | 11 | 1079 | Risk Ratio (M‐H, Random, 95% CI) | 0.92 [0.70, 1.21] |
| 6.1 LA + opioids | 10 | 952 | Risk Ratio (M‐H, Random, 95% CI) | 0.93 [0.70, 1.24] |
| 6.2 LA alone | 1 | 127 | Risk Ratio (M‐H, Random, 95% CI) | 0.74 [0.27, 2.01] |
| 7 Caesarean delivery (epidural vs CSE) Show forest plot | 11 | 1079 | Risk Ratio (M‐H, Random, 95% CI) | 0.92 [0.70, 1.21] |
| 7.1 Epidural | 5 | 637 | Risk Ratio (M‐H, Random, 95% CI) | 0.78 [0.53, 1.15] |
| 7.2 CSE | 6 | 442 | Risk Ratio (M‐H, Random, 95% CI) | 1.08 [0.73, 1.59] |
| 8 Caesarean delivery (PCEA vs no PCEA) Show forest plot | 11 | 1079 | Risk Ratio (M‐H, Random, 95% CI) | 0.92 [0.70, 1.21] |
| 8.1 PCEA | 7 | 801 | Risk Ratio (M‐H, Random, 95% CI) | 0.98 [0.70, 1.37] |
| 8.2 No PCEA | 4 | 278 | Risk Ratio (M‐H, Random, 95% CI) | 0.81 [0.50, 1.30] |
| 9 Caesarean delivery (nulliparous vs multiparous) Show forest plot | 10 | 951 | Risk Ratio (M‐H, Random, 95% CI) | 0.93 [0.70, 1.25] |
| 9.1 Nulliparous | 9 | 825 | Risk Ratio (M‐H, Random, 95% CI) | 0.92 [0.69, 1.23] |
| 9.2 Multiparous | 1 | 126 | Risk Ratio (M‐H, Random, 95% CI) | 3.0 [0.12, 72.27] |
| 10 Instrumental delivery Show forest plot | 11 | 1079 | Risk Ratio (M‐H, Random, 95% CI) | 0.75 [0.54, 1.06] |
| 11 Instrumental delivery (LA + opioids vs LA alone) Show forest plot | 11 | 1079 | Risk Ratio (M‐H, Random, 95% CI) | 0.80 [0.57, 1.12] |
| 11.1 LA + opioids | 10 | 952 | Risk Ratio (M‐H, Random, 95% CI) | 0.77 [0.54, 1.08] |
| 11.2 LA alone | 1 | 127 | Risk Ratio (M‐H, Random, 95% CI) | 1.97 [0.37, 10.37] |
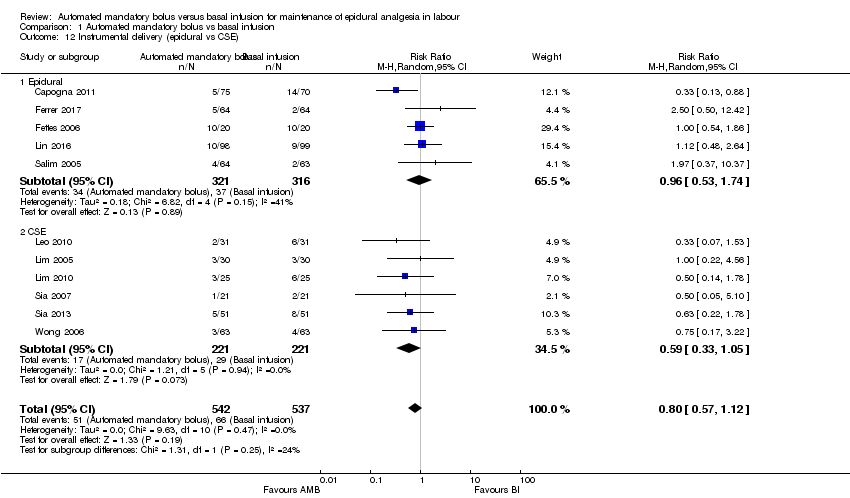
| 12 Instrumental delivery (epidural vs CSE) Show forest plot | 11 | 1079 | Risk Ratio (M‐H, Random, 95% CI) | 0.80 [0.57, 1.12] |
| 12.1 Epidural | 5 | 637 | Risk Ratio (M‐H, Random, 95% CI) | 0.96 [0.53, 1.74] |
| 12.2 CSE | 6 | 442 | Risk Ratio (M‐H, Random, 95% CI) | 0.59 [0.33, 1.05] |
| 13 Instrumental delivery (PCEA vs No PCEA) Show forest plot | 11 | 1079 | Risk Ratio (M‐H, Random, 95% CI) | 0.80 [0.57, 1.12] |
| 13.1 No PCEA | 4 | 278 | Risk Ratio (M‐H, Random, 95% CI) | 0.98 [0.60, 1.61] |
| 13.2 PCEA | 7 | 801 | Risk Ratio (M‐H, Random, 95% CI) | 0.67 [0.42, 1.05] |
| 14 Instrumental delivery (nulliparous vs multiparous) Show forest plot | 10 | 951 | Risk Ratio (M‐H, Random, 95% CI) | 0.76 [0.54, 1.07] |
| 14.1 Nulliparous | 9 | 825 | Risk Ratio (M‐H, Random, 95% CI) | 0.76 [0.53, 1.08] |
| 14.2 Multiparous | 1 | 126 | Risk Ratio (M‐H, Random, 95% CI) | 0.75 [0.17, 3.22] |
| 15 Duration of labour in minutes Show forest plot | 11 | 1079 | Mean Difference (IV, Random, 95% CI) | ‐10.38 [‐26.73, 5.96] |
| 16 Duration of labour in minutes (LA + opioids vs LA alone) Show forest plot | 11 | 1079 | Mean Difference (IV, Random, 95% CI) | ‐10.38 [‐26.73, 5.96] |
| 16.1 LA + opioids | 10 | 952 | Mean Difference (IV, Random, 95% CI) | ‐12.52 [‐31.87, 6.82] |
| 16.2 Duration of labor in minutes (LA alone) | 1 | 127 | Mean Difference (IV, Random, 95% CI) | 0.0 [‐36.63, 36.63] |
| 17 Duration of labour in minutes (epidural vs CSE) Show forest plot | 11 | 1079 | Mean Difference (IV, Random, 95% CI) | ‐10.38 [‐26.73, 5.96] |
| 17.1 Epidural | 5 | 637 | Mean Difference (IV, Random, 95% CI) | ‐3.04 [‐26.42, 20.34] |
| 17.2 CSE | 6 | 442 | Mean Difference (IV, Random, 95% CI) | ‐32.70 [‐65.20, ‐0.20] |
| 18 Duration of labour in minutes (PCEA vs no PCEA) Show forest plot | 11 | 1079 | Mean Difference (IV, Random, 95% CI) | ‐10.38 [‐26.73, 5.96] |
| 18.1 PCEA | 7 | 801 | Mean Difference (IV, Random, 95% CI) | ‐13.24 [‐20.71, ‐5.76] |
| 18.2 No PCEA | 4 | 278 | Mean Difference (IV, Random, 95% CI) | ‐48.65 [‐129.92, 32.62] |
| 19 Duration of labour in minutes (nulliparous vs multiparous) Show forest plot | 10 | 951 | Mean Difference (IV, Random, 95% CI) | ‐14.38 [‐21.80, ‐6.96] |
| 19.1 Nulliparous | 9 | 825 | Mean Difference (IV, Random, 95% CI) | ‐13.92 [‐23.75, ‐4.10] |
| 19.2 Multiparous | 1 | 126 | Mean Difference (IV, Random, 95% CI) | ‐28.0 [‐76.95, 20.95] |
| 20 LA consumption per hour Show forest plot | 12 | 1121 | Mean Difference (IV, Random, 95% CI) | ‐1.08 [‐1.78, ‐0.38] |
| 21 LA consumption per hour (LA + opioids vs LA alone) Show forest plot | 12 | 1121 | Mean Difference (IV, Random, 95% CI) | ‐1.08 [‐1.78, ‐0.38] |
| 21.1 LA + opioids | 11 | 994 | Mean Difference (IV, Random, 95% CI) | ‐0.75 [‐1.35, ‐0.15] |
| 21.2 LA alone | 1 | 127 | Mean Difference (IV, Random, 95% CI) | ‐9.50 [‐12.55, ‐6.45] |
| 22 LA consumption per hour (epidural vs CSE) Show forest plot | 12 | 1121 | Mean Difference (IV, Random, 95% CI) | ‐1.08 [‐1.78, ‐0.38] |
| 22.1 Epidural | 5 | 637 | Mean Difference (IV, Random, 95% CI) | ‐2.59 [‐4.13, ‐1.05] |
| 22.2 CSE | 7 | 484 | Mean Difference (IV, Random, 95% CI) | ‐0.35 [‐0.80, 0.11] |
| 23 LA consumption per hour (PCEA vs no PCEA) Show forest plot | 12 | 1121 | Mean Difference (IV, Random, 95% CI) | ‐1.08 [‐1.78, ‐0.38] |
| 23.1 PCEA | 7 | 801 | Mean Difference (IV, Random, 95% CI) | ‐1.59 [‐2.58, ‐0.60] |
| 23.2 No PCEA | 5 | 320 | Mean Difference (IV, Random, 95% CI) | ‐0.53 [‐1.58, 0.52] |
| 24 LA consumption per hour (nulliparous vs multiparous) Show forest plot | 11 | 993 | Mean Difference (IV, Random, 95% CI) | ‐0.89 [‐1.55, ‐0.23] |
| 24.1 Nulliparous | 10 | 867 | Mean Difference (IV, Random, 95% CI) | ‐0.83 [‐1.51, ‐0.15] |
| 24.2 Multiparous | 1 | 126 | Mean Difference (IV, Random, 95% CI) | ‐1.80 [‐3.93, 0.33] |