Strategies for improving postpartum contraceptive use: evidence from non‐randomized studies
Abstract
Background
Nearly two‐thirds of women in their first postpartum year have an unmet need for family planning. Adolescents often have repeat pregnancies within a year of giving birth. Women may receive counseling on family planning both antepartum and postpartum. Decisions about contraceptive use made right after counseling may differ considerably from actual postpartum use. In earlier work, we found limited evidence of effectiveness from randomized trials on postpartum contraceptive counseling. For educational interventions, non‐randomized studies may be conducted more often than randomized trials.
Objectives
We reviewed non‐randomized studies of educational strategies to improve postpartum contraceptive use. Our intent was to examine associations between specific interventions and postpartum contraceptive use or subsequent pregnancy.
Search methods
We searched for eligible non‐randomized studies until 3 November 2014. Sources included CENTRAL, PubMed, POPLINE, and Web of Science. We also sought current trials via ClinicalTrials.gov and ICTRP. For additional citations, we examined reference lists of relevant reports and reviews.
Selection criteria
The studies had to be comparative, i.e., have intervention and comparison groups. The educational component could be counseling or another behavioral strategy to improve contraceptive use among postpartum women. The intervention had to include contact within six weeks postpartum. The comparison condition could be another behavioral strategy to improve contraceptive use, usual care, other health education, or no intervention. Our primary outcomes were postpartum contraceptive use and subsequent pregnancy.
Data collection and analysis
Two authors evaluated abstracts for eligibility and extracted data from included studies. We computed the Mantel‐Haenszel odds ratio (OR) for dichotomous outcomes and the mean difference (MD) for continuous measures, both with 95% Confidence Intervals (CI). Where studies used adjusted analyses for continuous outcomes, we presented the results as reported by the investigators. Due to differences in interventions and outcome measures, we did not conduct meta‐analysis. To assess the evidence quality, we used the Newcastle‐Ottawa Quality Assessment Scale.
Main results
Six studies met our inclusion criteria and included a total of 5143 women. Of three studies with self‐reported pregnancy data, two showed pregnancy to be less likely in the experimental group than in the comparison group (OR 0.48, 95% CI 0.27 to 0.87) (OR 0.60, 95% CI 0.41 to 0.87). The interventions included a clinic‐based counseling program and a community‐based communication project.
All studies showed some association of the intervention with contraceptive use. Two showed that treatment‐group women were more likely to use a modern method than the control group: ORs were 1.77 (95% CI 1.08 to 2.89) and 3.08 (95% CI 2.36 to 4.02). In another study, treatment‐group women were more likely than control‐group women to use pills (OR 1.78, 95% CI 1.26 to 2.50) or an intrauterine device (IUD) (OR 3.72, 95% CI 1.27 to 10.86) but less likely to use and injectable method (OR 0.23, 95% CI 0.05 to 1.00). One study used a score for method effectiveness. The methods of the special‐intervention group scored higher than those of the comparison group at three months (MD 13.26, 95% CI 3.16 to 23.36). A study emphasizing IUDs showed women in the intervention group were more likely to use an IUD (OR 1.79, 95% CI 1.20 to 2.69) and less likely to use no method (OR 0.48, 95% CI 0.31 to 0.75). In another study, contraceptive use was more likely among women in a health service intervention compared to women in a community awareness program at four months (OR 1.79, 95% CI 1.40 to 2.30) or women receiving standard care at 10 to 12 months (OR 2.08, 95% CI 1.58 to 2.74). That study was the only one with a specific component on the lactational amenorrhea method (LAM) that had sufficient data on LAM use. Women in the health service group were more likely than those in the community awareness group to use LAM (OR 41.36, 95% CI 10.11 to 169.20).
Authors' conclusions
We considered the quality of evidence to be very low. The studies had limitations in design, analysis, or reporting. Three did not adjust for potential confounding and only two had sufficient information on intervention fidelity. Outcomes were self reported and definitions varied for contraceptive use. All studies had adequate follow‐up periods but most had high losses, as often occurs in contraception studies.
Plain language summary
Programs to improve birth control use by postpartum women
Most postpartum women do not have the birth control they would like. Teens often get pregnant again within a year. In earlier work, we found few randomized trials on learning about postpartum family planning. Here, we looked at other types of studies that tested ways to improve postpartum use of birth control. We wanted to see if certain programs were related to more use of family planning after giving birth.
Until 3 November 2014, we ran computer searches for studies of programs to improve family planning among postpartum women. We wrote to researchers for missing data. Programs had to have contact within six weeks postpartum. The special program was compared with a different program, usual care, or no service. Our main outcomes were birth control use and pregnancy.
We found six studies with a total of 5143 women. Of three studies with pregnancy data, two showed fewer pregnancies in the treatment group compared to the control group. The programs in those studies were clinic counseling and community education. All studies showed the special program was related to more birth control use. In two studies, more women in the treatment group used a modern method of birth control than those in the control group. In another study, women in the treatment group were more likely to use pills or an IUD but less likely to use an injectable method. One study used a score for how well the birth control method usually worked. The methods of the treatment group scored higher than those of the control group. A study focused on IUDs showed more IUDs in the treatment group and less use of no method. Women in a health service program used birth control more often than those in a community education program or those getting standard care. Also, women in the health service group were more likely to use the lactation method.
We believe the data were very low quality for pregnancy and birth control use. The studies had problems in design, analysis, and reporting. Some did not adjust for factors that could affect the results. They had self‐reported outcomes and used different measures for the outcomes. All studies had good follow‐up times but most lost many women to follow up.
Authors' conclusions
Background
Description of the condition
Millions of women, especially in lower‐resource areas, have an unmet need for pregnancy prevention (Thurman 2011). Nearly two‐thirds of women in their first postpartum year have an unmet need for family planning (USAID 2014). Later Demographic and Health Surveys indicate that unmet need for modern contraceptive methods is 32% among married women in general, while one‐third to one‐half of unmarried women have an unmet need for such methods (Westhoff 2012). Unplanned pregnancy increases risk for morbidity and mortality. Data from 17 countries show that return to sexual activity is associated with the return of menses, breastfeeding status, and postpartum duration, but generally not associated with contraceptive use (Borda 2010). Long‐term surveillance in very low‐income areas of Nairobi indicated most women resumed sexual activity at three to five months postpartum (Ndugwa 2011). About half of the women used modern contraceptive by seven months; therefore, 28% of sexually‐active months were unprotected. In Haiti, with high rates of unintended pregnancy, only 25% of women who were married or in union used a modern contraceptive method (Lathrop 2011). Even in higher‐resource areas such as the USA, nearly 60% of pregnancies are unintended, i.e., either unwanted (23%) or mistimed (37%) (Mosher 2012). Adolescents often have repeat pregnancies within a year of giving birth (Thurman 2007). Many adolescent new mothers are discharged without having or identifying a contraceptive method to use (Baldwin 2013). While some adolescents may start using contraception during the postpartum period, they often discontinue due to lack of information or support (Wilson 2011).
Description of the intervention
Relevant strategies for this review include counseling or education about family planning, which may be provided to individuals or groups. Such efforts may increase contraceptive uptake as well as improve use and continuation of the chosen method. Counseling can help women meet their fertility goals of avoiding or delaying childbearing or of spacing children. The counseling should be appropriate for the woman's fertility intentions, lifestyle, preferences, and socioeconomic situation. In the USA, a qualitative study with low‐income minority women showed that many of the women had experienced poor communication during postpartum contraceptive counseling (Yee 2011). Appropriate interventions may help increase understanding about pregnancy risk and prevention, as well as improve use of effective contraceptive methods.
Programs may focus on direct oral communication and written materials or be complex communication campaigns. Social marketing can have greater reach than direct interpersonal interventions and may increase awareness and promote use of contraceptives (Chapman 2012). Personal interaction can help women choose an appropriate method and obtain more detailed information about method use. Projects also utilize technology, such as mobile phone reminders for appointments and medication use, and may also include education. Some programs engage peer educators or community workers to provide reminders and encourage method continuation.
Women may receive counseling on family planning both antepartum as well as postpartum (Glazer 2011). Counseling limited to one encounter is unlikely to affect behavior. Further, decisions about contraceptive use made right after counseling may differ considerably from actual postpartum use (Engin‐Üstün 2007; Glazer 2011). In Kenya and Zambia, postpartum contraceptive use was examined in relation to prenatal and postnatal care using survey data (Do 2013). Only the intensity of prenatal care was significantly associated with postpartum contraceptive use. However, less information was available on postpartum care than for prenatal care. In these locations, postpartum care may be limited and undocumented, and may focus on the infant rather than the mother (Do 2013).
Why it is important to do this review
As common as postpartum contraceptive education has become, research evaluating such interventions is still sparse (Glazer 2011). More is known about the appropriateness of specific contraceptive methods for postpartum women than about how to help women use certain contraceptives. Program descriptions seem easier to locate than evidence of intervention effectiveness. Further, evaluations of programs to promote contraceptive use often depend on self report. They could benefit from using objective outcome measures such as pregnancy in addition to self report.
In earlier work, we found limited evidence of effectiveness from randomized controlled trials (RCTs) on postpartum contraceptive counseling (Lopez 2012). When educational interventions are being examined, non‐randomized studies (NRS) may be conducted more often than RCTs. Funding opportunities for behavioral interventions may be more limited than they are for pharmaceutical or medical device trials. Also, blinding is usually not feasible with educational strategies. Aside from study design, the eligibility criteria in this review differ somewhat from those in the review of RCTs (Lopez 2012). After conducting this review, we were able to compare the quantity and quality of evidence from NRS with that from RCTs.
Objectives
We reviewed non‐randomized studies of educational strategies to improve postpartum contraceptive use. Our intent was to examine associations between specific interventions and postpartum contraceptive use or subsequent pregnancy.
Methods
Criteria for considering studies for this review
Types of studies
The study must have had at least two arms, i.e., an experimental or special‐intervention group and a comparison or control group. Cohort studies were eligible. Studies that randomized clusters rather than individuals were considered non‐randomized if they had too few clusters for a reasonable randomization, e.g., two clusters per study group.
Types of participants
Postpartum women in the eligible studies were included.
Types of interventions
The educational component could have been counseling or a more complex behavioral intervention to improve contraceptive use among postpartum women. The intervention could have started during pregnancy but must have included contact within six weeks postpartum. The comparison condition could have been another behavioral intervention to improve contraceptive use among postpartum women, usual care, other health education, or no intervention.
The report had to describe the strategy content or process. Counseling described as standard or routine was not considered sufficient for the 'test' or 'experimental' condition. Standard contraceptive counseling would not be informative about how to improve contraceptive use. However, routine services were acceptable for the comparison or control condition.
Interventions must have addressed family planning methods that are generally considered to be 'more effective' (Trussell 2011) or modern methods (WHO 2013), e.g., oral contraceptives, implants, intrauterine contraceptive devices, injectable contraceptives, female sterilization, or the lactational amenorrhea method (LAM). We did not include interventions focused on condom use to prevent transmission of HIV or sexually transmitted infections.
Types of outcome measures
Primary outcomes
The reports had to provide data on at least one of the following:
-
reported postpartum contraceptive use, e.g., consistent use, improved adherence, or continuation;
-
subsequent pregnancy (reported or tested).
Measurement time frames were as follows:
-
Study eligibility: at least six weeks postpartum and six or more weeks after the educational intervention began.
-
Quality assessment:
-
contraceptive use ‐ three or more months after the intervention began
-
pregnancy ‐ six or more months after the intervention began.
-
Secondary outcomes
Additional outcomes were knowledge and attitudes about contraception or about specific contraceptive method, as well as satisfaction with the contraceptive method used.
Search methods for identification of studies
Electronic searches
We searched for eligible non‐randomized studies until 3 November 2014. Databases included the Cochrane Central Register of Controlled Trials (CENTRAL), PubMed, POPLINE, and Web of Science. We also sought current trials via ClinicalTrials.gov and ICTRP. The search strategies are given in Appendix 1.
Searching other resources
We examined reference lists of relevant reports and reviews for additional citations. We also contacted investigators to seek information we may have missed in our search.
Data collection and analysis
Selection of studies
We assessed all titles and abstracts identified during the search. Two authors examined the search results for potentially eligible studies (Contributions of authors). They resolved any discrepancies by discussion. For studies that appeared eligible for this review, we obtained and examined the full‐text articles.
Data extraction and management
Two authors conducted the data extraction. One author entered the data into Review Manager (RevMan 2014), and a second author checked accuracy (Contributions of authors). These data included the study characteristics, risk of bias (quality assessment for NRS), and outcome data. No discrepancies occurred.
Assessment of risk of bias in included studies
Intervention fidelity
We used the framework in Borrelli 2011 to assess the quality of the intervention. Domains of treatment fidelity are study design, training of providers, delivery of treatment (intervention), receipt of treatment, and enactment of treatment skills. The framework was intended for assessing current trials. Criteria of interest for our review are shown below.
-
Study design: had a curriculum or treatment manual
-
Prior training of providers: specified providers' credentials
-
Project‐specific training: provided standardized training for the intervention
-
Delivery: assessed adherence to the protocol
-
Receipt: assessed participants' understanding and skills regarding the intervention.
For the assessment of evidence quality, we downgraded the studies that met fewer than four of these criteria.
Research design
For these NRS, we followed recommended principles for assessing the evidence quality (Higgins 2011). The Newcastle‐Ottawa Quality Assessment Scale (NOS) was developed for use with NRS (Wells 2013). Reportedly, the content validity and inter‐rater reliability of this scale have been established, and criterion validity and intra‐rater reliability are being examined. The investigators are developing a plan to assess construct validity. The scale does not have an overall scoring or cutoff for a 'good' or 'poor' quality study. Of the two NOS versions, i.e., for case‐control and cohort studies, the latter is more pertinent here (Appendix 2). We adapted specific NOS items as suggested by the developers (Wells 2013) and as indicated below.
The NOS has eight items within the three domains of selection (representativeness), comparability (due to design or analysis), and outcomes (assessment and follow‐up). A study can receive one star (✸) for meeting each NOS criterion. The exception is comparability, for which a study can receive a maximum of two stars (for design and analysis).
-
Comparability: assessment of analysis included adjustment for potential confounding factors.
-
For one star, the study controlled for age.
-
For two stars, adjustment included at least two of the following: parity, marital status or living with partner, sexual activity, prior contraceptive use, education or socioeconomic status.
-
-
Length of follow up: at least three months for contraceptive use and six months for pregnancy.
-
Losses of 20% or more were considered high.
We excluded one NOS criterion from our assessment, i.e., 'Demonstration that outcome of interest was not present at start of study.' Our primary outcomes were postpartum contraceptive use and subsequent pregnancy. Enrollment occurred during the prenatal period or the postpartum hospital stay. Subsequent pregnancy was irrelevant at enrollment and postpartum contraceptive use was highly unlikely prior to the planned intervention. We did not identify any exception. We adapted the Risk of bias table for the remaining seven NOS criteria.
Measures of treatment effect
With NRS, investigators need to control for confounding factors and may use a variety of adjustment strategies. We have specified whether potential confounding was considered in the design (e.g., matching or stratification) or analysis, and noted the specific confounding factors addressed. When investigators used multivariate models to adjust for potential confounding, we did not analyze the treatment effect as that would usually require individual participant data. Nor did we combine adjusted estimates. Instead, we presented the results from adjusted models as reported by the investigators. If no adjusted measure was given as part of the primary analysis, we used unadjusted measures. For such dichotomous outcomes, we used Review Manager (RevMan 2014) to calculate the Mantel‐Haenszel odds ratio (OR) with 95% confidence interval (CI). For continuous outcomes, we computed the mean difference; Review Manager uses the inverse variance approach. Fixed effect and random effects give the same result if no heterogeneity exists, as when a comparison includes only one study. We did not conduct a meta‐analysis (see Assessment of heterogeneity).
Unit of analysis issues
If clustering was part of the design, we assessed whether the analyses were properly adjusted to account for clustering effects. Investigators may use various methods such as multilevel modeling. We give the specific methods in the results for each study.
Dealing with missing data
If reports were missing information on design or data needed for analysis, we wrote to the study investigators. However, we limited our requests to studies less than 10 years old, as well as older studies with a report in the past five years. Investigators are unlikely to have access to data from older studies.
Assessment of heterogeneity
Given the diversity of design features with NRS, we did not conduct a meta‐analysis for pooled estimates. Further, the behavioral interventions varied in design. Therefore, we assessed sources of heterogeneity without pooling the data. We addressed differences in study design, analysis strategies, and confounding adjustment. To interpret the intervention results, we examined the location, i.e., country and setting (clinic, school, community); participant characteristics; and intervention content and implementation.
Data synthesis
We applied principles from GRADE to assess the evidence quality and address confidence in the effect estimates (Balshem 2011). In particular, we rated the quality of evidence from the studies and the overall body of evidence. However, the criteria differ for NRS and RCTs. Also, when a meta‐analysis is not viable due to varied interventions, a 'Summary of findings' table is not feasible. Therefore, we did not conduct a formal GRADE assessment with an evidence profile and 'Summary of findings' table (Guyatt 2011).
For these NRS, we assessed the quality of evidence with the Newcastle‐Ottawa Quality Assessment Scale, as noted in Assessment of risk of bias in included studies. We included intervention fidelity in the overall quality assessment. Because these were NRS, we considered the evidence to be moderate quality initially and then downgraded for the following: 1) having no stars for comparability (i.e., not controlling for any confounding); 2) not meeting four or more of the remaining six NOS criteria; and 3) not having information for four or more intervention fidelity categories. Quality grades were moderate, low, very low, and poor; which differed slightly from the levels used for RCTs (Balshem 2011).
Sensitivity analysis
We had planned to examine studies that provided sufficient outcome data and had evidence of at least moderate quality. However, none of the included studies met those criteria.
Results
Description of studies
Results of the search
The database searches produced 774 citations; 81 duplicates were removed electronically and we removed 38 by hand, which left 655 unduplicated citations (Figure 1). From other sources, we obtained four more reports and four conference abstracts for a total of 663 references. We discarded 628 for not meeting the eligibility criteria according to the title or abstract. Many did not have a relevant intervention or an appropriate comparison group. We reviewed the full text of 35 articles for eligibility, then excluded 17 and included 7 (6 primary reports plus 1 secondary report). We discarded another 11 articles when we realized the abstract indicated the study did not meet the eligibility criteria.

Study flow diagram.
Searches of ClinicalTrials.gov and ICTRP yielded 44 unduplicated studies. We discarded 43 based on title or summary and listed one as excluded due to potential relevance for readers.
Included studies
Six studies met our inclusion criteria, and included a total of 5143 women. Four placed some emphasis on the lactational amenorrhea method (LAM), but also included information on other contraceptive methods (Hardy 1998; Nacar 2003; Abdel‐Tawab 2008; Sebastian 2012). One provided counseling and contraceptive methods, including IUD insertion prior to discharge (Foreit 1993); another provided interactive sexual health education (Lee 2011).
Four studies assigned groups rather than individuals (Foreit 1993; Abdel‐Tawab 2008; Lee 2011; Sebastian 2012). Since they had few groups, adjustment for clustering was not feasible. We considered them non‐randomized studies. Another study appeared to assign women to treatment and control groups on alternate days (Nacar 2003), and one selected women for the treatment and control groups at different time points (Hardy 1998).
All six studies assessed our primary outcomes of contraceptive use. Contraceptive use was reported as any use in two studies (Foreit 1993; Abdel‐Tawab 2008) and categorized as modern or traditional methods in three studies (Hardy 1998; Nacar 2003; Sebastian 2012). One assigned a score for effectiveness of method used (Lee 2011). Three studies assessed pregnancy by self report (Foreit 1993; Hardy 1998; Sebastian 2012).
Assessments of our secondary outcomes included knowledge of LAM (Abdel‐Tawab 2008); knowledge of healthy spacing of pregnancy and of contraceptive methods available (Sebastian 2012); sexual health knowledge and attitudes as well as contraceptive self‐efficacy (Lee 2011).
Risk of bias in included studies
Intervention fidelity
We extracted information on five criteria: study design, two training items, delivery, and receipt (Table 1). Four studies provided information on three or fewer criteria (Foreit 1993; Hardy 1998; Nacar 2003; Lee 2011). All four lacked information on adherence to the protocol (e.g., monitoring provision of counseling), three did not assess whether the participants understood the intervention content, two did not mention the providers' credentials, and two did not report any specific training for the intervention. In contrast, Abdel‐Tawab 2008 and Sebastian 2012 provided sufficient detail for all five fidelity criteria.
| Study | Curriculum or manual | Provider credentials | Training for intervention | Assessed adherence | Assessed intervention | Fidelity criteria |
| ‐‐‐ | Educators for counseling; physicians for IUD insertion | 5 days for educators on FP; 4 days for physicians on IUD insertion | ‐‐‐ | ‐‐‐ | 2 | |
| Counseling material; leaflet on LAM for participants | ‐‐‐ | Training of all personnel on FP, including LAM as method | ‐‐‐ | ‐‐‐ | 2 | |
| 20‐minute educational session plus pamphlet | Researchers | ‐‐‐ | ‐‐‐ | ‐‐‐ | 2 | |
| Birth‐spacing messages and material for education and communication | Health care (HC) providers (physicians, nurses, Raedat Refiyat (community workers); community leaders | 3 days for HC managers and supervisors as trainers; 3 days for HC providers; 2 days for community leaders | Monthly supervision and monitoring visits by MCH and FP supervisors; checklists for monitoring intervention components. | Clinic exit interview had several knowledge and attitude items. | 5 | |
| Sexual health program (pamphlet) and educator guide booklet | Obstetric nurse educator | ‐‐‐ | ‐‐‐ | Assessed sexual health knowledge and attitudes and contraceptive self‐efficacy. | 3 | |
| Educational materials and counseling aids | Community midwife for antenatal clinic (18 months training); social health activist for counseling in homes (3 weeks training); anganwadi workers for counseling (1 month plus on‐job training) | 1 day for medical and child development officers, who trained community workers over 2 days (with counseling practice) | Supervisors spot‐checked knowledge of women; project staff observed counseling quality and content. | Knowledge assessed at 4 and 9 months postpartum. | 5 |
aAssessed participants' understanding and skills regarding the intervention.
Research design
We adapted the Risk of bias tables for the NOS criteria. Therefore, 'judgements' in the tables were limited to the Review Manager choices of high, unclear, or low risk. In this review, high risk (of bias) refers to not meeting the NOS criterion and low risk means the study met the criterion. We used 'unclear' when the information was insufficient for determining if the NOS criterion was met, e.g., whether a structured questionnaire was used for interviews.
Exposed cohort representativeness
The treatment‐group women did not appear to be representative of women in the general community. They gave birth in a specific hospital or lived in a certain area. Four studies selected subpopulations such as low‐parity women (Abdel‐Tawab 2008; Sebastian 2012) or those who returned for regular postpartum check‐ups (Hardy 1998), had full‐term healthy babies or lived with their husbands (Lee 2011). Two studies were considered unclear regarding representativeness (Foreit 1993; Nacar 2003).
Nonexposed cohort selection
Three studies met the criterion, since they selected women for the control group from the same source as the treatment group (Foreit 1993; Nacar 2003; Lee 2011). In Hardy 1998, women in the control group were selected at one‐year postpartum versus the 40‐day visit for treatment‐group women. The control‐group women had returned for regular check‐ups. Many women may not have gone to the same clinic for care or missed certain visits.
Exposure ascertainment: method used
In Hardy 1998, the control group was selected after the standard counseling purportedly occurred. Women in the control group were interviewed at one‐year postpartum. We classed this criterion as unclear. Information on traditional postpartum counseling might have been obtained from hospital records, the woman's recall, or the assumption that counseling was provided because that was standard practice at the time.
Five studies provided the family planning services in a hospital or clinic and some had home visits. The report of Abdel‐Tawab 2008 noted they used checklists of services provided. The other four studies planned the intervention as part of the study and provided the counseling in a clinical situation. Presumably the studies involved some recording of encounters and services.
Comparability of groups: design or analysis
Two studies adjusted for the potential confounding factors that we identified (Hardy 1998; Sebastian 2012). For Abdel‐Tawab 2008, the districts were matched on several factors but the women were not matched. The investigators reported baseline differences between the study groups but apparently did not adjust for them in the analysis. The other three studies did not involve any matching nor adjust for potential confounding factors. Nacar 2003 reported differences in prior contraceptive use but did not adjust the analysis.
Outcome assessment: method used
Contraceptive use is generally assessed by self report. In clinical trials of specific contraceptive methods, the investigators may use electronic monitoring of pill use or appointments kept for injections. However, with the variety of methods chosen by the participants, self report is typical.
All studies were considered to have unclear risk for contraceptive use data due to self reporting. Three studies gathered pregnancy data, all apparently by self report. For Hardy 1998, the assessments were conducted during clinic visits for the study. In Foreit 1993 and Sebastian 2012, the women were interviewed in their homes.
Follow‐up length
All six studies met this criterion. Five had follow‐up from 6 to 12 months. Lee 2011 had the shortest time but met our criterion of three months for assessing contraceptive use.
Follow‐up adequacy
Only two studies met the criterion, with losses less than 20% (Nacar 2003; Abdel‐Tawab 2008). The loss in Sebastian 2012 was 20%; the other three studies had losses greater than 20%, which is common in contraceptive studies.
Effects of interventions
Counseling
For Hardy 1998, the study groups received counseling at different time points. The experimental intervention introduced LAM as a contraceptive method during family planning (FP) counseling. The control group received traditional FP counseling before the intervention was developed that included LAM for contraception; they were interviewed a year later.
-
Pregnancy: Women in the experimental group were less likely than those in the control group to report a pregnancy by 12 months postpartum (OR 0.48; 95% CI 0.27 to 0.87) (Analysis 1.1). Pregnancy was apparently obtained by self report.
-
Use of modern method at 12 months: Compared to the control group, women in the experimental group were more likely to use pills (OR 1.78; 95% CI 1.26 to 2.50) or an intrauterine device (OR 3.72; 95% CI 1.27 to 10.86) (Analysis 1.2). However, the confidence interval for IUD use was wide; few women in either group had an IUD. Use of injectables was more likely among the control than the experimental group (OR 0.23; 95% CI 0.05 to 1.00). The study groups did not differ significantly in reported use of condoms or in tubal sterilization (Analysis 1.2). The subgroup analysis showed some heterogeneity (I2 = 58.9). However, the samples were taken at different time points. The intervention developed for the introduction of LAM with other contraceptive methods may have differed from the earlier educational materials on other contraceptive methods.
-
No contraceptive use: The experimental‐group women were less likely to report no contraceptive use at 12 months than the control‐group women (OR 0.37; 95% CI 0.21 to 0.67) (Analysis 1.3).
-
Traditional contraceptive methods used at 12 months included rhythm and withdrawal (WHO 2013). The study groups did not differ significantly in reported use (Analysis 1.4).
-
Logistic regression for contraceptive use and for pregnancy by 12 months postpartum: No independent variables were associated with pregnancy (Table 2). For contraceptive use, we calculated the ORs and 95% CIs from the reported effect estimates and standard errors. Contraceptive use was more likely for women who had a partner (OR 6.63; 95% CI 4.46 to 9.85) and were in the experimental group (OR 3.04; 95% CI 1.71 to 5.40); contraceptive use was less likely for those with two or more living children (OR 0.51; 95% CI 0.31 to 0.87) (Table 2).
Open in table viewer
Table 2. Introducing LAM into postpartum care program (Hardy 1998)Outcome at 12 months postpartum1
Variable
Reported
effect estimateReported
standard errorReported
P valueOdds Ratio
95% CI
Cumulative pregnancy rate
‐‐‐
‐‐‐
‐‐‐
‐‐‐
‐‐‐
‐‐‐
Contraceptive use
Having partner
1.8914
0.2020
<0.0001
6.63
4.46 to 9.85
Experimental group
1.1113
0.2931
0.0002
3.04
1.71 to 5.40
>= 2 living children
‐0.6636
0.2670
0.0129
0.51
0.31 to 0.87
1Logistic regression model included age, schooling (>= high school), # living children (>= 2), marital state (with partner), study group.
In Nacar 2003, women in the treatment group were provided an educational session on postpartum contraception, including information on the relationship of lactation and contraception. The investigators analyzed family planning methods as modern, traditional, or no method. The lactation method was categorized as traditional (limited effectiveness). At six‐months postpartum, women in the treatment group were more likely to use a modern contraceptive method than those in the control group (OR 1.77; 95% CI 1.08 to 2.89) (Analysis 2.1) and less likely to be using no method (OR 0.33, 95% CI 0.17 to 0.64) (Analysis 2.2). The study groups did not differ significantly in use of a traditional method at six months (Analysis 2.1).
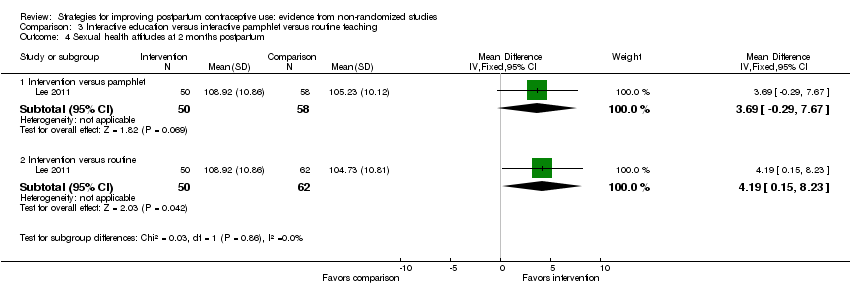
In Lee 2011, the special intervention was an interactive program on sexual health for postpartum women. A comparison group received an 'interactive pamphlet' without the sexual health education, while the control group had routine postpartum education on sexual health. The main outcome, effective contraceptive behavior was based on the effectiveness of the method used most often. The score ranged from 0 (no use) to 99 (more effective), but the actual scores assigned for each method were not specified.
-
Effectiveness of contraceptive method used most often: The special‐intervention group had a higher effectiveness score at three months postpartum compared to the interactive‐pamphlet group (MD 13.26; 95% CI 3.16 to 23.36) though the 95% CI was wide (Analysis 3.1). The special‐intervention group and routine‐education group did not differ significantly in contraceptive effectiveness score at two or three months postpartum (Analysis 3.2).
-
Sexual health knowledge: The special‐intervention had a higher mean than the pamphlet group at two months postpartum (MD 0.54; 95% CI 0.06 to 1.02) (Analysis 3.3). The special‐intervention group also had a higher mean than the routine‐education group at two months (MD 1.55; 95% CI 1.13 to 1.97) (Analysis 3.3).
-
Sexual health attitudes were not significantly different between the intervention and pamphlet groups at two months postpartum (Analysis 3.4). The special‐intervention group had a higher mean than the routine‐education group at two months (MD 4.19; 95% CI 0.15 to 8.23) (Analysis 3.4).
Counseling and method provision
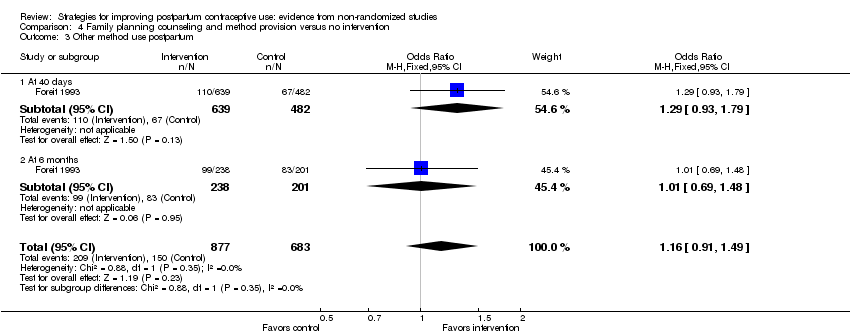
In Foreit 1993, women in the treatment group received family planning counseling and reversible contraceptives were offered to them. An IUD could be inserted immediately after delivery or before hospital discharge. Barrier methods were provided if the woman declined an IUD and OCs were provided if she was not planning to breastfeed. The investigators selected independent samples of women who were 40 days postpartum and who were six months postpartum.
-
Pregnancy: The study groups were not significantly different for reported pregnancy at six months postpartum (Analysis 4.1). Five women reported a pregnancy (one IUD acceptor in the treatment group and four controls).
-
IUD: Women in the intervention group were more likely than those in the control group to have an IUD inserted within both the 40‐day subgroup (OR 2.76; 95% CI 1.99 to 3.82) and the six‐month subgroup (OR 1.79; 95% CI 1.20 to 2.69) (Analysis 4.2). Heterogeneity was present in the subgroup analysis (I2 = 62.1%). The difference between the study groups was greater in the 40‐day subgroup than in the six‐month subgroup. For the intervention group, the report indicates most of the 40‐day subgroup had their IUDs inserted in the hospital, while the six‐month subgroup was more evenly divided between the hospital and an outpatient clinic. All the control women reportedly had their IUDs inserted in an outpatient clinic.
-
Use of other contraceptive methods: The intervention and control groups did not differ significantly (Analysis 4.3).
-
No method use: Women in the intervention group were less likely to use no contraceptive method within the 40‐day subgroup (OR 0.43; 95% CI 0.34 to 0.56) and the six‐month subgroup (OR 0.48; 95% CI 0.31 to 0.75) (Analysis 4.4).
Education and communication
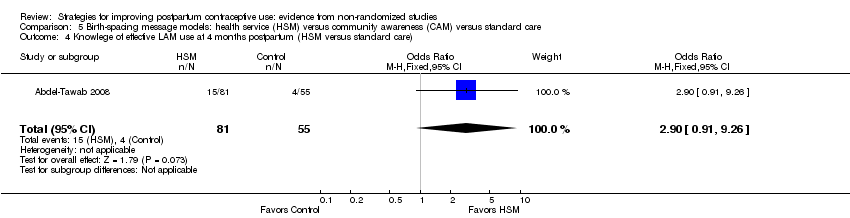
One organization conducted two studies with the same government funding source and used similar methodology (Abdel‐Tawab 2008; Sebastian 2012). The interventions in Abdel‐Tawab 2008 were two birth‐spacing message models. In the health services model (HSM), messages were communicated to women through prenatal and postpartum services. Effective use of LAM was included. The community awareness model (CAM) had the same services as the HSM plus a communication program to increase awareness among men. The comparison condition was standard care.
-
Contraceptive use was more likely in the HSM group than in the standard‐care group at four months (OR 2.07; 95% CI 1.58 to 2.71) and at 10 to 12 months (OR 2.08; 95% CI 1.58 to 2.74) (Analysis 5.1). Women in the HSM group were also more likely than those in the CAM group to use contraception at four months (OR 1.79; 95% CI 1.40 to 2.30) but not at 10 to 12 months (Analysis 5.2).
-
Use of LAM did not differ significantly between the HSM and standard‐care groups at four months (14.7% versus 14.3%) (Analysis 5.3). However, LAM use was more likely in the HSM group than in the CAM group at four months (OR 41.36; 95% CI 10.11 to 169.20) (Analysis 5.3). Only two women in the CAM group reported using LAM (0.4%). The effect estimate was not precise given the width of the 95% CI.
-
Knowledge of LAM criteria: Users of LAM in the HSM and standard care group did not differ significantly in the proportion that knew at least three criteria for effective LAM use (Analysis 5.4).
-
In their conclusions, the investigators attributed some differences to the HSM women having more schooling and employment that those in CAM. Also, the HSM intervention was apparently implemented better than the CAM. More women in the HSM clinics received counseling and home visits.
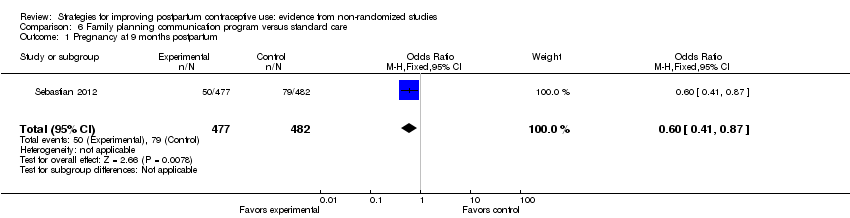
Sebastian 2012 implemented an educational campaign that addressed healthy timing and spacing of pregnancy, LAM, and postpartum contraception. Messages were communicated to women during the prenatal and postpartum periods. Postpartum contraception information was also provided to the mothers‐in‐law or other female family members. An educational campaign also focused on males in the community. The comparison group received standard services.
-
Pregnancy: Women in the experimental group were less likely to report a pregnancy by nine months postpartum than those in the control group (OR 0.60; 95% CI 0.41 to 0.87) (Analysis 6.1).
-
Use of modern method: The experimental‐group women were more likely than women with standard care to report using a modern contraceptive at nine months postpartum (OR 3.08; 95% CI 2.36 to 4.02) (Analysis 6.2). Modern contraceptives reported were pill, IUD, condoms, and sterilization. Compared to the standard‐care group, women in the experimental group were less likely to use a traditional contraceptive method (OR 0.69; 95% CI 0.50 to 0.93) (Analysis 6.3) and less likely to use no method (OR 0.39; 95% CI 0.30 to 0.52) (Analysis 6.4).
-
LAM use: Reportedly, 64% of the intervention‐group women knew the three conditions for LAM, but only 23% had used LAM as a contraceptive method during the recent postpartum period. None of the comparison‐group women knew the LAM criteria but 13% met the conditions.
-
Logistic regression, use of a modern method at nine months postpartum: The model included study group, education, age, age at initiation of cohabitation, caste (scheduled caste or tribe, other backward‐caste Hindu, high‐caste Hindu, other religious groups), and parity (Table 3). Contraceptive use was more likely for women in the intervention group than those in the control group (reported OR 3.66; 95% CI 2.72 to 4.91), for those with at least a high school education (reported OR 1.88; 95% CI 1.27 to 2.79), and for those identified as other backward‐caste Hindu (reported OR 1.60; 95% CI 1.07 to 2.38).
Open in table viewer
Table 3. Family planning communication program (Sebastian 2012)Outcome1
Variable
Reported adjusted
odds ratioReported
95% CIReported
P valueUse of modern contraceptive method (9 months postpartum)
intervention group
3.66
2.72 to 4.91
< 0.01
education >= high school
1.88
1.27 to 2.79
< 0.01
caste: other backward‐caste Hindu
1.60
1.07 to 2.38
< 0.05
Change in knowledge of >= 2 healthy spacing messages (4 months postpartum)2
intervention group
2.07
‐‐‐
< 0.01
age 20 to 24 years
1.65
‐‐‐
< 0.05
caste: high‐caste Hindu
1.93
‐‐‐
< 0.01
Change in knowledge of >= 2 spacing methods (9 months postpartum)2
intervention group
1.96
‐‐‐
< 0.01
baseline value
1.53
‐‐‐
< 0.05
education: middle school
2.07
‐‐‐
< 0.01
education: >= high school
3.18
‐‐‐
< 0.01
1Logistic regression models did not include LAM use or knowledge because only 0.2% of control‐group women knew about the method. Models included study group, education, age, age at initiation of cohabitation, caste, and parity. Modern methods included pill, condoms, IUD, and sterilization. Models for change in knowledge also included baseline value.
2Report did not include 95% CI for these models. -
Logistic regression, knowledge of healthy spacing practice: These models included the baseline value and the variables listed for contraceptive use. At four months postpartum, knowledge of healthy spacing messages was more likely for women in the intervention group than those in the control group (reported adjusted OR 2.07), as well as for those 20 to 24 years old (reported adjusted OR 1.65), and for those identified as 'high‐caste Hindu' (reported adjusted OR 1.93) (Table 3). At nine months postpartum, knowledge of two or more spacing methods was more likely for women in the intervention group (reported OR 1.96) and for those with a middle school education (reported OR 2.07) or a high school education (reported OR 3.18) (Table 3).
Discussion
Summary of main results
Of three studies with self‐reported pregnancy data, two showed pregnancies to be less likely in the experimental group than in the comparison group. One was a clinic‐based counseling program and the other a community‐based education project. Both had multiple contacts that began prenatally.
All six studies showed some association of the intervention on contraceptive use, but the outcome measures varied. Two showed that treatment‐group women were more likely to use a modern method than the control group. In another study, women in the treatment group were more likely than those in the control group to use pills or an IUD, but were less likely to use injectables. In a study using an effectiveness score for method used, the special‐intervention group had a higher score than the comparison group at three months. The investigators did not indicate what score was assigned to any particular method other than zero for no method. The study emphasizing the IUD showed women in the intervention group were more likely to use the IUD and less likely to be using no method. In another study, contraceptive use in general was more likely among women in a health service intervention compared to those in a community awareness program at four months and compared to women receiving standard care at 10 to 12 months. This was the only one of four with a specific LAM component that had sufficient data on LAM use. Women in the health service group were more likely than those in the community awareness group to use LAM. The investigators attributed this to demographic differences between the study groups as well as how the interventions were implemented.
Two studies examined knowledge or attitudes about contraceptive use. In one study, the special‐intervention group had a higher knowledge mean than a group with limited intervention or the standard‐care group. Similarly, the other showed the intervention group had greater change in knowledge than the control group.
Overall completeness and applicability of evidence
Four of the interventions were clinic‐based and two were community‐based. Three of the clinic‐based studies involved a single postpartum contact. The remaining three studies had multiple contacts that began in the antenatal period. Four studies had a specific component on the lactational amenorrhea method. Of the other two studies, one focused on IUD insertion and another provided theory‐based sexual health education.
The studies were conducted in Egypt, Peru, Brazil, Taiwan, Turkey, and India. We did not find any eligible studies from North America or Western Europe. Four studies were based in urban areas, including Lima (Peru) and Taiwan. Two were conducted in rural areas (Abdel‐Tawab 2008; Sebastian 2012); they involved community members and included home visits.
Quality of the evidence
Because we considered all these studies to be non‐randomized, we began with a grade of moderate quality. The studies that randomized groups had too few clusters for meaningful cluster analysis adjustment. None of those reports mentioned such adjustment.
Overall, we considered the quality of evidence for pregnancy and contraceptive use to be very low (Table 4). Limiting inclusion to non‐randomized studies led to overall lower quality assessment, since moderate quality was the starting point. Evidence from the individual studies ranged from low to poor. The studies met two to four of the seven NOS criteria in this review. Treatment‐group women did not necessarily represent the general population of postpartum women. Three studies did not adjust for potential confounders or use any matching. Only two studies provided adequate information on intervention fidelity. We did not conduct a sensitivity analysis since no included study provided evidence of moderate quality.
| NOS criteria for cohort studies | ||||||
| Exposed cohort representativeness | ‐‐‐ | ‐‐‐ | ‐‐‐ | ‐‐‐ | ‐‐‐ | ‐‐‐ |
| Nonexposed cohort selection | ✸ | ‐‐‐ | ✸ | ‐‐‐ | ✸ | ‐‐‐ |
| Exposure ascertainment: method used | ✸ | ‐‐‐ | ✸ | ✸ | ✸ | ✸ |
| Comparability of groups: design or analysis | ‐‐‐ | ✸✸ | ‐‐‐ | ✸ | ‐‐‐ | ✸✸ |
| Outcome assessment: method used | ‐‐‐ | ‐‐‐ | ‐‐‐ | ‐‐‐ | ‐‐‐ | ‐‐‐ |
| Follow‐up length | ✸ | ✸ | ✸ | ✸ | ✸ | ✸ |
| Follow‐up adequacy | ‐‐‐ | ‐‐‐ | ✸ | ✸ | ‐‐‐ | ‐‐‐ |
| Intervention fidelity (>= 4 criteria) | ‐‐‐ | ‐‐‐ | ‐‐‐ | ✸ | ‐‐‐ | ✸ |
| Quality of evidence1,2 | Poor | Very low | Very low | Low | Poor | Low |
1Evidence was initially considered moderate quality and then downgraded for 1) no stars for comparability (not controlling for confounding), 2) not meeting >= 4 of remaining 6 NOS criteria, and 3) not having intervention fidelity information for >= 4 categories. Quality grades were moderate, low, very low, or poor.
2We did not use criterion for 'outcome of interest not present at study start' (Assessment of risk of bias in included studies).
In an earlier review of RCTs on this subject (Lopez 2012), we considered the overall quality of evidence to be moderate. RCTs start at high quality, so the overall assessment of the RCTs was downgraded one level in that review, as opposed to two levels for the NRS here. Half of the 10 RCTs in the earlier review showed some evidence of effect on pregnancy or contraceptive use.

Study flow diagram.

Comparison 1 Postpartum FP counseling plus LAM versus traditional FP counseling, Outcome 1 Pregnancy by 12 months.
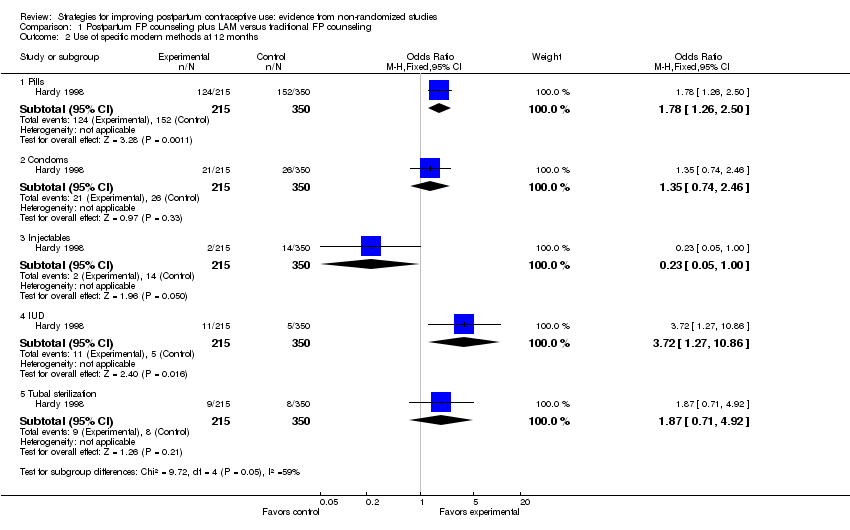
Comparison 1 Postpartum FP counseling plus LAM versus traditional FP counseling, Outcome 2 Use of specific modern methods at 12 months.

Comparison 1 Postpartum FP counseling plus LAM versus traditional FP counseling, Outcome 3 No contraceptive use at 12 months.
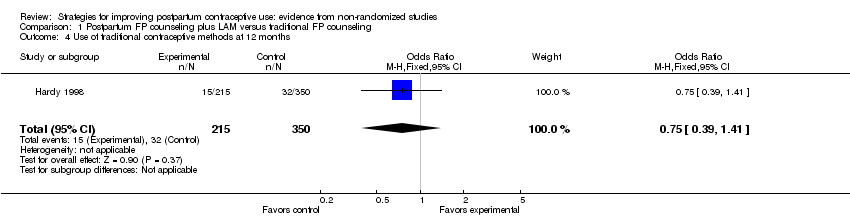
Comparison 1 Postpartum FP counseling plus LAM versus traditional FP counseling, Outcome 4 Use of traditional contraceptive methods at 12 months.
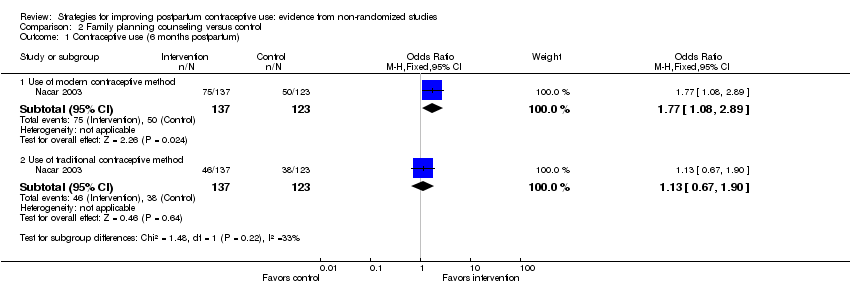
Comparison 2 Family planning counseling versus control, Outcome 1 Contraceptive use (6 months postpartum).
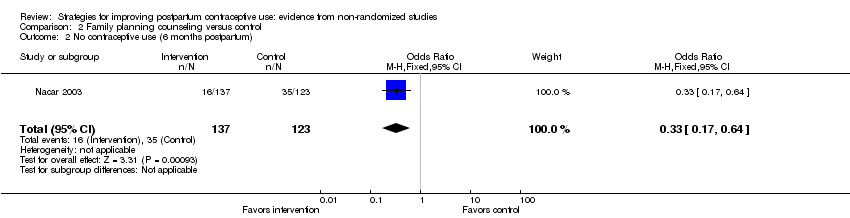
Comparison 2 Family planning counseling versus control, Outcome 2 No contraceptive use (6 months postpartum).

Comparison 3 Interactive education versus interactive pamphlet versus routine teaching, Outcome 1 Effectiveness of contraceptive method used most often (intervention versus pamphlet).

Comparison 3 Interactive education versus interactive pamphlet versus routine teaching, Outcome 2 Effectiveness of contraceptive method used most often (intervention versus routine).

Comparison 3 Interactive education versus interactive pamphlet versus routine teaching, Outcome 3 Sexual health knowledge at 2 months postpartum.
Comparison 3 Interactive education versus interactive pamphlet versus routine teaching, Outcome 4 Sexual health attitudes at 2 months postpartum.

Comparison 4 Family planning counseling and method provision versus no intervention, Outcome 1 Pregnancy at 6 months postpartum.

Comparison 4 Family planning counseling and method provision versus no intervention, Outcome 2 IUD use postpartum.
Comparison 4 Family planning counseling and method provision versus no intervention, Outcome 3 Other method use postpartum.

Comparison 4 Family planning counseling and method provision versus no intervention, Outcome 4 No contraceptive method use postpartum.

Comparison 5 Birth‐spacing message models: health service (HSM) versus community awareness (CAM) versus standard care, Outcome 1 Contraceptive use postpartum (HSM versus standard care).

Comparison 5 Birth‐spacing message models: health service (HSM) versus community awareness (CAM) versus standard care, Outcome 2 Contraceptive use postpartum (HSM versus CAM).

Comparison 5 Birth‐spacing message models: health service (HSM) versus community awareness (CAM) versus standard care, Outcome 3 Use of LAM at 4 months postpartum.
Comparison 5 Birth‐spacing message models: health service (HSM) versus community awareness (CAM) versus standard care, Outcome 4 Knowlege of effective LAM use at 4 months postpartum (HSM versus standard care).
Comparison 6 Family planning communication program versus standard care, Outcome 1 Pregnancy at 9 months postpartum.

Comparison 6 Family planning communication program versus standard care, Outcome 2 Use of modern contraceptive method at 9 months postpartum.
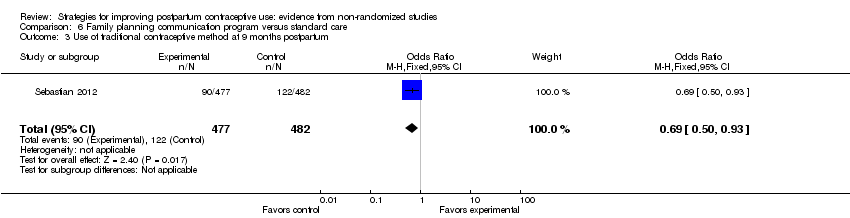
Comparison 6 Family planning communication program versus standard care, Outcome 3 Use of traditional contraceptive method at 9 months postpartum.
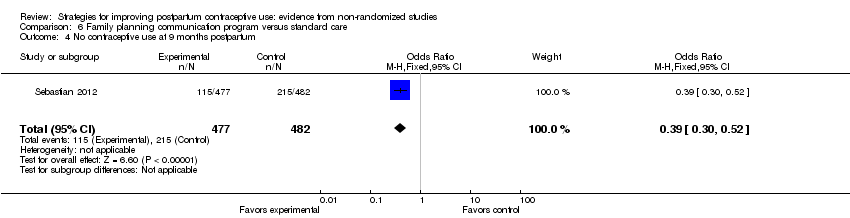
Comparison 6 Family planning communication program versus standard care, Outcome 4 No contraceptive use at 9 months postpartum.
| Study | Curriculum or manual | Provider credentials | Training for intervention | Assessed adherence | Assessed intervention | Fidelity criteria |
| ‐‐‐ | Educators for counseling; physicians for IUD insertion | 5 days for educators on FP; 4 days for physicians on IUD insertion | ‐‐‐ | ‐‐‐ | 2 | |
| Counseling material; leaflet on LAM for participants | ‐‐‐ | Training of all personnel on FP, including LAM as method | ‐‐‐ | ‐‐‐ | 2 | |
| 20‐minute educational session plus pamphlet | Researchers | ‐‐‐ | ‐‐‐ | ‐‐‐ | 2 | |
| Birth‐spacing messages and material for education and communication | Health care (HC) providers (physicians, nurses, Raedat Refiyat (community workers); community leaders | 3 days for HC managers and supervisors as trainers; 3 days for HC providers; 2 days for community leaders | Monthly supervision and monitoring visits by MCH and FP supervisors; checklists for monitoring intervention components. | Clinic exit interview had several knowledge and attitude items. | 5 | |
| Sexual health program (pamphlet) and educator guide booklet | Obstetric nurse educator | ‐‐‐ | ‐‐‐ | Assessed sexual health knowledge and attitudes and contraceptive self‐efficacy. | 3 | |
| Educational materials and counseling aids | Community midwife for antenatal clinic (18 months training); social health activist for counseling in homes (3 weeks training); anganwadi workers for counseling (1 month plus on‐job training) | 1 day for medical and child development officers, who trained community workers over 2 days (with counseling practice) | Supervisors spot‐checked knowledge of women; project staff observed counseling quality and content. | Knowledge assessed at 4 and 9 months postpartum. | 5 | |
| aAssessed participants' understanding and skills regarding the intervention. | ||||||
| Outcome at 12 months postpartum1 | Variable | Reported | Reported | Reported | Odds Ratio | 95% CI |
| Cumulative pregnancy rate | ‐‐‐ | ‐‐‐ | ‐‐‐ | ‐‐‐ | ‐‐‐ | ‐‐‐ |
| Contraceptive use | Having partner | 1.8914 | 0.2020 | <0.0001 | 6.63 | 4.46 to 9.85 |
| Experimental group | 1.1113 | 0.2931 | 0.0002 | 3.04 | 1.71 to 5.40 | |
| >= 2 living children | ‐0.6636 | 0.2670 | 0.0129 | 0.51 | 0.31 to 0.87 | |
| 1Logistic regression model included age, schooling (>= high school), # living children (>= 2), marital state (with partner), study group. | ||||||
| Outcome1 | Variable | Reported adjusted | Reported | Reported |
| Use of modern contraceptive method (9 months postpartum) | intervention group | 3.66 | 2.72 to 4.91 | < 0.01 |
| education >= high school | 1.88 | 1.27 to 2.79 | < 0.01 | |
| caste: other backward‐caste Hindu | 1.60 | 1.07 to 2.38 | < 0.05 | |
| Change in knowledge of >= 2 healthy spacing messages (4 months postpartum)2 | intervention group | 2.07 | ‐‐‐ | < 0.01 |
| age 20 to 24 years | 1.65 | ‐‐‐ | < 0.05 | |
| caste: high‐caste Hindu | 1.93 | ‐‐‐ | < 0.01 | |
| Change in knowledge of >= 2 spacing methods (9 months postpartum)2 | intervention group | 1.96 | ‐‐‐ | < 0.01 |
| baseline value | 1.53 | ‐‐‐ | < 0.05 | |
| education: middle school | 2.07 | ‐‐‐ | < 0.01 | |
| education: >= high school | 3.18 | ‐‐‐ | < 0.01 | |
| 1Logistic regression models did not include LAM use or knowledge because only 0.2% of control‐group women knew about the method. Models included study group, education, age, age at initiation of cohabitation, caste, and parity. Modern methods included pill, condoms, IUD, and sterilization. Models for change in knowledge also included baseline value. | ||||
| NOS criteria for cohort studies | ||||||
| Exposed cohort representativeness | ‐‐‐ | ‐‐‐ | ‐‐‐ | ‐‐‐ | ‐‐‐ | ‐‐‐ |
| Nonexposed cohort selection | ✸ | ‐‐‐ | ✸ | ‐‐‐ | ✸ | ‐‐‐ |
| Exposure ascertainment: method used | ✸ | ‐‐‐ | ✸ | ✸ | ✸ | ✸ |
| Comparability of groups: design or analysis | ‐‐‐ | ✸✸ | ‐‐‐ | ✸ | ‐‐‐ | ✸✸ |
| Outcome assessment: method used | ‐‐‐ | ‐‐‐ | ‐‐‐ | ‐‐‐ | ‐‐‐ | ‐‐‐ |
| Follow‐up length | ✸ | ✸ | ✸ | ✸ | ✸ | ✸ |
| Follow‐up adequacy | ‐‐‐ | ‐‐‐ | ✸ | ✸ | ‐‐‐ | ‐‐‐ |
| Intervention fidelity (>= 4 criteria) | ‐‐‐ | ‐‐‐ | ‐‐‐ | ✸ | ‐‐‐ | ✸ |
| Quality of evidence1,2 | Poor | Very low | Very low | Low | Poor | Low |
| 1Evidence was initially considered moderate quality and then downgraded for 1) no stars for comparability (not controlling for confounding), 2) not meeting >= 4 of remaining 6 NOS criteria, and 3) not having intervention fidelity information for >= 4 categories. Quality grades were moderate, low, very low, or poor. | ||||||
| Outcome or subgroup title | No. of studies | No. of participants | Statistical method | Effect size |
| 1 Pregnancy by 12 months Show forest plot | 1 | 565 | Odds Ratio (M‐H, Fixed, 95% CI) | 0.48 [0.27, 0.87] |
| 2 Use of specific modern methods at 12 months Show forest plot | 1 | Odds Ratio (M‐H, Fixed, 95% CI) | Subtotals only | |
| 2.1 Pills | 1 | 565 | Odds Ratio (M‐H, Fixed, 95% CI) | 1.78 [1.26, 2.50] |
| 2.2 Condoms | 1 | 565 | Odds Ratio (M‐H, Fixed, 95% CI) | 1.35 [0.74, 2.46] |
| 2.3 Injectables | 1 | 565 | Odds Ratio (M‐H, Fixed, 95% CI) | 0.23 [0.05, 1.00] |
| 2.4 IUD | 1 | 565 | Odds Ratio (M‐H, Fixed, 95% CI) | 3.72 [1.27, 10.86] |
| 2.5 Tubal sterilization | 1 | 565 | Odds Ratio (M‐H, Fixed, 95% CI) | 1.87 [0.71, 4.92] |
| 3 No contraceptive use at 12 months Show forest plot | 1 | 565 | Odds Ratio (M‐H, Fixed, 95% CI) | 0.37 [0.21, 0.67] |
| 4 Use of traditional contraceptive methods at 12 months Show forest plot | 1 | 565 | Odds Ratio (M‐H, Fixed, 95% CI) | 0.75 [0.39, 1.41] |
| Outcome or subgroup title | No. of studies | No. of participants | Statistical method | Effect size |
| 1 Contraceptive use (6 months postpartum) Show forest plot | 1 | Odds Ratio (M‐H, Fixed, 95% CI) | Subtotals only | |
| 1.1 Use of modern contraceptive method | 1 | 260 | Odds Ratio (M‐H, Fixed, 95% CI) | 1.77 [1.08, 2.89] |
| 1.2 Use of traditional contraceptive method | 1 | 260 | Odds Ratio (M‐H, Fixed, 95% CI) | 1.13 [0.67, 1.90] |
| 2 No contraceptive use (6 months postpartum) Show forest plot | 1 | 260 | Odds Ratio (M‐H, Fixed, 95% CI) | 0.33 [0.17, 0.64] |
| Outcome or subgroup title | No. of studies | No. of participants | Statistical method | Effect size |
| 1 Effectiveness of contraceptive method used most often (intervention versus pamphlet) Show forest plot | 1 | Mean Difference (IV, Fixed, 95% CI) | Subtotals only | |
| 1.1 At 2 months postpartum | 1 | 108 | Mean Difference (IV, Fixed, 95% CI) | 3.74 [‐5.07, 12.55] |
| 1.2 At 3 months postpartum | 1 | 93 | Mean Difference (IV, Fixed, 95% CI) | 13.26 [3.16, 23.36] |
| 2 Effectiveness of contraceptive method used most often (intervention versus routine) Show forest plot | 1 | Mean Difference (IV, Fixed, 95% CI) | Subtotals only | |
| 2.1 At 2 months postpartum | 1 | 112 | Mean Difference (IV, Fixed, 95% CI) | 3.96 [‐4.31, 12.23] |
| 2.2 At 3 months postpartum | 1 | 90 | Mean Difference (IV, Fixed, 95% CI) | ‐0.58 [‐7.07, 5.91] |
| 3 Sexual health knowledge at 2 months postpartum Show forest plot | 1 | Mean Difference (IV, Fixed, 95% CI) | Subtotals only | |
| 3.1 Intervention versus pamphlet | 1 | 108 | Mean Difference (IV, Fixed, 95% CI) | 0.54 [0.06, 1.02] |
| 3.2 Intervention versus routine | 1 | 112 | Mean Difference (IV, Fixed, 95% CI) | 1.55 [1.13, 1.97] |
| 4 Sexual health attitudes at 2 months postpartum Show forest plot | 1 | Mean Difference (IV, Fixed, 95% CI) | Subtotals only | |
| 4.1 Intervention versus pamphlet | 1 | 108 | Mean Difference (IV, Fixed, 95% CI) | 3.69 [‐0.29, 7.67] |
| 4.2 Intervention versus routine | 1 | 112 | Mean Difference (IV, Fixed, 95% CI) | 4.19 [0.15, 8.23] |
| Outcome or subgroup title | No. of studies | No. of participants | Statistical method | Effect size |
| 1 Pregnancy at 6 months postpartum Show forest plot | 1 | 439 | Odds Ratio (M‐H, Fixed, 95% CI) | 0.21 [0.02, 1.87] |
| 2 IUD use postpartum Show forest plot | 1 | 1560 | Odds Ratio (M‐H, Fixed, 95% CI) | 2.35 [1.82, 3.02] |
| 2.1 At 40 days | 1 | 1121 | Odds Ratio (M‐H, Fixed, 95% CI) | 2.76 [1.99, 3.82] |
| 2.2 At 6 months | 1 | 439 | Odds Ratio (M‐H, Fixed, 95% CI) | 1.79 [1.20, 2.69] |
| 3 Other method use postpartum Show forest plot | 1 | 1560 | Odds Ratio (M‐H, Fixed, 95% CI) | 1.16 [0.91, 1.49] |
| 3.1 At 40 days | 1 | 1121 | Odds Ratio (M‐H, Fixed, 95% CI) | 1.29 [0.93, 1.79] |
| 3.2 At 6 months | 1 | 439 | Odds Ratio (M‐H, Fixed, 95% CI) | 1.01 [0.69, 1.48] |
| 4 No contraceptive method use postpartum Show forest plot | 1 | 1560 | Odds Ratio (M‐H, Fixed, 95% CI) | 0.45 [0.36, 0.56] |
| 4.1 At 40 days | 1 | 1121 | Odds Ratio (M‐H, Fixed, 95% CI) | 0.43 [0.34, 0.56] |
| 4.2 At 6 months | 1 | 439 | Odds Ratio (M‐H, Fixed, 95% CI) | 0.48 [0.31, 0.75] |
| Outcome or subgroup title | No. of studies | No. of participants | Statistical method | Effect size |
| 1 Contraceptive use postpartum (HSM versus standard care) Show forest plot | 1 | Odds Ratio (M‐H, Fixed, 95% CI) | Subtotals only | |
| 1.1 At 4 months | 1 | 935 | Odds Ratio (M‐H, Fixed, 95% CI) | 2.07 [1.58, 2.71] |
| 1.2 At 10 to 12 months (if at risk) | 1 | 930 | Odds Ratio (M‐H, Fixed, 95% CI) | 2.08 [1.58, 2.74] |
| 2 Contraceptive use postpartum (HSM versus CAM) Show forest plot | 1 | Odds Ratio (M‐H, Fixed, 95% CI) | Subtotals only | |
| 2.1 At 4 months | 1 | 1031 | Odds Ratio (M‐H, Fixed, 95% CI) | 1.79 [1.40, 2.30] |
| 2.2 At 10 to 12 months (if at risk) | 1 | 1025 | Odds Ratio (M‐H, Fixed, 95% CI) | 1.24 [0.97, 1.59] |
| 3 Use of LAM at 4 months postpartum Show forest plot | 1 | Odds Ratio (M‐H, Fixed, 95% CI) | Subtotals only | |
| 3.1 HSM versus standard care | 1 | 935 | Odds Ratio (M‐H, Fixed, 95% CI) | 1.04 [0.72, 1.50] |
| 3.2 HSM versus CAM | 1 | 1031 | Odds Ratio (M‐H, Fixed, 95% CI) | 41.36 [10.11, 169.20] |
| 4 Knowlege of effective LAM use at 4 months postpartum (HSM versus standard care) Show forest plot | 1 | 136 | Odds Ratio (M‐H, Fixed, 95% CI) | 2.90 [0.91, 9.26] |
| Outcome or subgroup title | No. of studies | No. of participants | Statistical method | Effect size |
| 1 Pregnancy at 9 months postpartum Show forest plot | 1 | 959 | Odds Ratio (M‐H, Fixed, 95% CI) | 0.60 [0.41, 0.87] |
| 2 Use of modern contraceptive method at 9 months postpartum Show forest plot | 1 | 959 | Odds Ratio (M‐H, Fixed, 95% CI) | 3.08 [2.36, 4.02] |
| 3 Use of traditional contraceptive method at 9 months postpartum Show forest plot | 1 | 959 | Odds Ratio (M‐H, Fixed, 95% CI) | 0.69 [0.50, 0.93] |
| 4 No contraceptive use at 9 months postpartum Show forest plot | 1 | 959 | Odds Ratio (M‐H, Fixed, 95% CI) | 0.39 [0.30, 0.52] |