Neuromuscular electrical stimulation (NMES) for patellofemoral pain syndrome
Abstract
Background
Patellofemoral pain syndrome, now generally referred to as patellofemoral pain (PFP), is one of the most common orthopaedic disorders, characterised by pain in the anterior or retropatellar knee region. Neuromuscular electrical stimulation (NMES) has been proposed generally as a complementary treatment, associated with other interventions such as exercise, or as a single treatment to increase muscle force, reduce knee pain, and improve function.
Objectives
To assess the effects (benefits and harms) of neuromuscular electrical stimulation for people with patellofemoral pain.
Search methods
We searched the Cochrane Bone, Joint and Muscle Trauma Group Specialised Register, the Cochrane Central Register of Controlled Trials (CENTRAL), MEDLINE, Embase, PEDro, CINAHL, SPORTDiscus, AMED, LILACS, trial registers, conference abstracts, and reference lists. We carried out the search in May 2017.
Selection criteria
We included randomised controlled clinical trials that evaluated the use of NMES for people with PFP.
Data collection and analysis
Two review authors independently performed the process of study selection, data extraction, and 'Risk of bias' assessment in duplicate. The primary outcomes were knee pain, knee function, and adverse events. The timing of outcome measurements was up to three months (short term), three to 12 months (medium term), and 12 months and above from trial entry (long term). We calculated risk ratios for dichotomous data and mean differences or standardised mean differences for continuous data. Where appropriate, we pooled data using the fixed‐effect model.
Main results
We included eight randomised clinical trials, reporting results for 345 participants with PFP. The mean ages of trial populations ranged from 25 to 43 years, and the majority (53% to 100%) of participants were female. There was a wide duration of symptoms, with the minimum duration of symptoms for trial inclusion ranging from one to six months. In addition to the study inclusion criteria, studies varied widely in the characteristics of the NMES and its application, and associated co‐interventions. We assessed all trials as at high risk of bias in at least one domain, particularly blinding and incomplete outcome data. The results of a laboratory‐based trial reporting knee pain immediately after a single 15‐minute session of NMES are not reported here as these are of questionable clinical relevance. The seven remaining trials provided evidence for three comparisons. We assessed the overall quality of the evidence, using GRADE, for all primary outcomes for all comparisons as very low, thus we are very unsure of the findings.
Four studies compared NMES plus exercise versus exercise alone. Patellar taping was applied as well as exercise to all participants of one study, and patellar taping and ice were also applied in another study. Each trial tested a different multiple‐session NMES programme. Pooled data from three studies (118 participants) provided very low‐quality evidence that NMES is associated with reduced pain at the end of treatment (ranging from 3 to 12 weeks): mean difference ‐1.63, 95% confidence interval (CI) ‐2.23 to ‐1.02; visual analogue scale (VAS) 0 to 10; higher scores = worse pain. However, this result may not be clinically relevant since the minimal clinically important difference for VAS during activities (1.5 to 2.0, out of 10 points) lies within the 95% CI. We found very low‐quality evidence from pooled data from two trials of little effect of NMES on knee function, as measured by two knee function rating systems. We found inconclusive and very low‐quality evidence from one trial (29 participants) of little effect of NMES on pain and function at one‐year follow‐up. None of the four trials reported on adverse effects of treatment.
One study (94 participants) compared NMES, applied four hours per day on a daily basis for four weeks, with two types of exercises (isometric and isokinetic). The study did not report on knee pain or adverse events. The study provided very low‐quality evidence of no important difference between the two groups in knee function at the end of the four‐week treatment. Of note is the potentially onerous NMES schedule in this study, which does not correspond to that typically used in clinical practice.
Two studies compared different types of NMES. Simultaneously delivered high‐low frequencies NMES was compared with sequentially delivered high‐low frequencies NMES in one trial (14 participants) and with fixed frequency NMES in the second trial (64 participants). The studies provided very low‐quality evidence of no important differences at the end of the six‐week treatment programme between the simultaneous frequencies NMES and the two other NMES programmes in overall knee pain, knee function, or in quadriceps fatigue (an adverse event).
Authors' conclusions
This review found insufficient and inconclusive evidence from randomised controlled trials to inform on the role of NMES for treating people with PFP in current clinical practice. The very low‐quality evidence available means that we are uncertain whether or not a multiple‐session programme of NMES combined with exercise over several weeks versus exercise alone results in clinically important differences in knee pain and function at the end of the treatment period or at one year. There were no data on adverse effects such as muscle fatigue and discomfort. High‐quality randomised clinical trials are needed to inform on the use of NMES for people with PFP. However, professional and stakeholder consensus is required on prioritisation of the research questions for interventions for treating people with PFP, including on the NMES treatment protocol for trials testing NMES.
PICO
Plain language summary
Muscle stimulation for people with anterior knee pain
Background
Patellofemoral pain syndrome, commonly known as anterior knee pain, is characterised by short‐ or long‐term pain in the front part of the knee or behind the kneecap. Muscle stimulation has been proposed as a treatment for this condition. This involves the use of a device that produces a muscle contraction by placing electrodes on the skin of the leg. Muscle stimulation is often used together with exercises and other treatments but can also be used on its own.
Results of the search
We searched the medical literature up to May 2017 and found eight studies reporting results for a total of 345 participants who had anterior knee pain for at least one month, and sometimes over several years. Most of the participants were female. The average age of participants in the studies ranged from 25 to 43 years. All the studies were small and had flaws that meant they were at risk of bias. There was very little evidence on longer‐term outcome. The results of one study that reported on immediate pain after a single 15‐minute session of muscle stimulation are not reported here as these are of questionable clinical relevance.
Key results
Each of the seven remaining studies tested one of three comparisons.
Four studies compared a multiple‐session muscle stimulation programme combined with exercise over several weeks with exercise on its own for the same period. All participants in two studies had adhesive tape applied across their knee cap, with ice also being applied in one study. We found very low‐quality evidence that muscle stimulation with exercise may slightly reduce knee pain at the end of a treatment period of between 3 and 12 weeks better than exercise alone. However, very low‐quality evidence did not show an effect on knee function. None of the studies reported on harms such as muscle fatigue and discomfort. There was very little useful information on longer‐term effects.
One study compared muscle stimulation lasting four hours each day for four weeks with exercise. Very low‐quality evidence showed no important difference between the two groups in knee function at the end of the four‐week treatment. Of note is that the duration of muscle stimulation is much longer than used nowadays.
Two studies compared different types of muscle stimulation. Very low‐quality evidence showed no important differences at the end of the six‐week treatment programme between the different types of muscle stimulation.
Quality of the evidence
The overall quality of the evidence for all reported outcomes was very low. This means that we are very uncertain about the findings of these studies.
Conclusions
We found insufficient evidence to inform on the role of neuromuscular electrical stimulation for treating people with anterior knee pain. Further research is needed.
Authors' conclusions
Summary of findings
| Neuromuscular electrical stimulation (NMES) plus other intervention (e.g. exercise) versus no NMES plus same other intervention for patellofemoral pain syndrome | ||||||
| Patient or population: people with patellofemoral pain syndrome1 Comparison: no NMES control plus same other active intervention | ||||||
| Outcomes | Illustrative comparative risks* (95% CI) | Relative effect | No. of participants | Quality of the evidence | Comments | |
| Assumed risk | Corresponding risk | |||||
| No NMES plus same other intervention | NMES plus other intervention (e.g. exercise) | |||||
| Knee pain (short term) | The mean knee pain ranged across control groups from | The mean knee pain in the intervention groups was | MD ‐1.63 (‐2.23 to ‐1.02) | 118 | ⊕⊝⊝⊝ | This difference may not be clinically important since the MCID for VAS (1.5 to 2.0, out of 10 points)5 lies within the 95% CI. |
| Knee pain (long term) | The median pain score in the study control group was 0.4 points (IQR 0.2 to 3.4). | The median pain score in the NMES group was 1.8 points (IQR 0.1 to 3.6). | See comment | 29 | ⊕⊝⊝⊝ | The difference was reported as not statistically significant. |
| Knee function (short term) | The mean knee function in the study control groups was | The mean difference in knee function in the intervention groups was | SMD 0.37 (‐0.11 to 0.84) | 70 | ⊕⊝⊝⊝ | 0.2 SD represents a small difference, 0.5 SD a moderate difference, and 0.8 SD a large difference. However, the mean differences in the 2 trials were small and unlikely to be clinically important (LEFS scale: MD 0.73; Cincinnati score: MD 4.65). |
| Knee function (long term) Kujala Patellofemoral Score (KPS) (0 to 100; higher score = better function). | The median KPS in the study control group was 95 (IQR 85 to 96). | The median KPS in the NMES group was 94 (IQR 88 to 96). | See comment | 29 | ⊕⊝⊝⊝ | The very small difference was reported as not statistically significant. |
| Adverse events ‐ not measured | See comment | See comment | Not estimable | ‐ | See comment | Not measured |
| *The basis for the assumed risk (e.g. the median control group risk across studies) is provided in footnotes. The corresponding risk (and its 95% confidence interval) is based on the assumed risk in the comparison group and the relative effect of the intervention (and its 95% CI). | ||||||
| GRADE Working Group grades of evidence | ||||||
| 1Where reported, there was a higher percentage of females (63% to 100%). The mean ages of the participants in the four trials ranged from 25 to 39 years. There was a wide duration of symptoms, with the minimum duration of symptoms for trial inclusion ranging from one to six months. | ||||||
| Neuromuscular electrical stimulation (NMES) versus exercise for patellofemoral pain syndrome | ||||||
| Patient or population: people with patellofemoral pain syndrome Comparison: exercise (either isokinetic or isometric; data combined in the analyses) | ||||||
| Outcomes | Illustrative comparative risks* (95% CI) | Relative effect | No. of participants | Quality of the evidence | Comments | |
| Assumed risk | Corresponding risk | |||||
| Exercise | NMES | |||||
| Knee pain (short term: < 3 months) | See comment | See comment | Not estimable | ‐ | See comment | Not estimable |
| Knee pain (longer term: > 3 months) | See comment | See comment | Not estimable | ‐ | See comment | Not estimable |
| Knee function | The mean knee function in the study control group was | The mean knee function in the intervention groups was | MD ‐0.94 (‐2.10 to 0.22) | 94 | ⊕⊝⊝⊝ | |
| Knee function (longer term: > 3 months) | See comment | See comment | Not estimable | ‐ | See comment | Not estimable |
| Adverse events | See comment | See comment | Not estimable | ‐ | See comment | Not measured |
| *The basis for the assumed risk (e.g. the median control group risk across studies) is provided in footnotes. The corresponding risk (and its 95% confidence interval) is based on the assumed risk in the comparison group and the relative effect of the intervention (and its 95% CI). | ||||||
| GRADE Working Group grades of evidence | ||||||
| 1This very demanding schedule is unlikely to be found in clinical practice. | ||||||
Background
Description of the condition
Patellofemoral pain syndrome (also known as patella malalignment syndrome, chondromalacia patellae, and anterior knee pain syndrome) is characterised by pain in the anterior or retropatellar (behind the kneecap) knee region that is exacerbated during activities that overload the patellofemoral joint such as running, prolonged sitting, stair climbing, kneeling, or squatting. Additional symptoms of the disorder include reduced muscle strength and knee function (Collins 2013; Petersen 2013; Rathleff 2013). In line with the International Patellofemoral Pain consensus statements published in 2014, we now use the term 'patellofemoral pain' (PFP) in this review (Witvrouw 2014). Patellofemoral pain is one of the most common orthopaedic disorders, accounting for 25% to 40% of all sports‐related knee problems; it predominantly affects adolescents and young adults, especially physically active women (Fagan 2008; Frye 2012). The prevalence of PFP is higher in active populations, including athletes and military recruits, than in the general population. However, the prevalence of this disorder in unselected populations is unclear (Lankhorst 2012; Petersen 2013; Roush 2012).
The aetiology of PFP is multifactorial. Common causes include mechanical and structural changes in the patellofemoral joint, malalignment of the patella (also known as patella maltracking), weakness of the knee extensor muscles (quadriceps musculature), poor muscle flexibility, and altered lower extremity kinematics (Bolgla 2011; Lankhorst 2012; Powers 2003). There are no specific diagnostic tests for PFP, and the diagnosis is usually based on clinical symptoms and physical examination (Crossley 2002; Roush 2012).
It is widely believed that patellofemoral malalignment is the primary mechanism responsible for anterior knee pain. Since the patella acts as a lever for the knee extensor muscles, any changes in the angle of the knee will also affect the peak force of the quadriceps (Bolgla 2011; Powers 2012). Recent studies have shown that the patella of people with PFP tends to deviate laterally within the femoral trochlear groove to a greater extent than normal during knee movement, leading to both a decrease in the patellofemoral contact area and an increase in the pressure on the articular surface, thus resulting in peripatellar tissue inflammation and pain (Kaya 2011; Powers 2012; Salsich 2001).
Several factors, including large quadriceps angle, abnormalities of the patellofemoral joint, excessive foot pronation, and tightness of hamstrings, calf, and lateral retinaculum can lead to abnormal patellar gliding (Barton 2009; Davies 2000; Fagan 2008; Pal 2012). However, according to biomechanical studies, hip muscle weakness and decreased quadriceps torque (especially the imbalance between activation of the vastus lateralis (VL) and vastus medialis oblique (VMO) muscles) are the main causes of patellar maltracking and patellofemoral pain (Chiu 2012; Cowan 2009; Pal 2012; Petersen 2013).
The response of people with PFP to conservative (non‐surgical) interventions such as physical therapy (including patellar taping, joint mobilisation, quadriceps strengthening, and foot orthoses, among others) and analgesic medications is variable. Long‐term results are not always satisfactory, and therefore the disorder can become chronic (Pattyn 2012; Rathleff 2012). A recent study showed that approximately half of treated patients reported persistent symptoms after 12 months (Collins 2013). Factors that may be associated with poor prognosis include higher age, female gender, overweight, reduced muscle strength, sports participation (overuse of the patellofemoral joint), and duration of symptoms over two months (Collins 2013; Pattyn 2012; Rathleff 2012). Those prognostic factors indicate that early diagnosis and treatment may lead to better long‐term results (Rathleff 2012).
Description of the intervention
Exercise therapy has been highly regarded as an essential tool in the treatment of people with PFP (Rathleff 2012). According to several clinical trials, muscle‐strengthening exercises help to correct abnormal patellar alignment and reduce clinical symptoms such as pain and impaired function (Bolgla 2011; Chiu 2012; Crossley 2002; Frye 2012). However, in some people, exercise can exacerbate pain and inflammation and reduce voluntary muscle activation (Dye 2005). Neuromuscular electrical stimulation (NMES) has been proposed as a complementary treatment, associated with other interventions such as voluntary exercise, or as a single treatment to increase muscle force by activating motor units and promoting muscle contraction (Lake 2011; Monaghan 2010; Taradaj 2013).
Electrical stimulation is produced by a device that delivers intermittent electrical impulses to muscle fibres through electrodes placed on the skin. These impulses induce action potentials, which stimulate motor nerves, thus producing contractions (Doucet 2012). These parameters include: frequency (usually set between 50 to 70 Hz); pulse (monophasic or biphasic, in waveform geometrical patterns such as rectangular); pulse duration (between 1 to 1000 µs, most often between 100 to 400 µs); duty cycle/duration of muscle contraction (intermittent pulse stimulation, i.e. pulses on and off, usually set as 10 seconds on and 50 seconds off); and intensity (adjusted according to individual tolerance) (Doucet 2012; Maffiuletti 2010; Sillen 2013). When comparing an NMES group with a control or a placebo group (e.g. NMES parameters configured not to produce muscle contraction), there is a significant increase in quadriceps muscle strength in people who receive active NMES (Maddocks 2013).
Although there is still no consensus on the standardisation of optimal NMES parameters, some studies suggest that electrical stimulation should be able to produce 50% of maximal voluntary contraction and recommend the use of biphasic rectangular pulses of 100 to 400 microseconds delivered at 50 to 100 Hz, at the highest tolerated intensity. The usual treatment for quadriceps muscles involves two or more sessions per week, 10 to 30 minutes each, for a period of four to five months (Sillen 2013; Vanderthommen 2007).
The main adverse effects of NMES are muscular discomfort caused by the electrical stimuli and excessive neuromuscular fatigue, which can be reduced by adjusting the NMES parameters (Maffiuletti 2014). Furthermore, the use of NMES over the thoracic region can cause changes in cardiac rhythm, therefore this intervention is not recommended for people with hypertension or those using pacemakers (Doucet 2012; Maffiuletti 2010; Monaghan 2010).
How the intervention might work
Researchers report the use of NMES in people with PFP to strengthen the quadriceps muscles in general and also to selectively strengthen the VMO muscle in cases where this muscle is hypotrophic and contracting after the VL muscle (Maffiuletti 2010; Werner 1993). Because NMES promotes simultaneous VMO and VL muscle contractions, it apparently leads to a significant increase in quadriceps muscles' force (Vengust 2001; Werner 1993).
Good results also depend on using electrodes of appropriate size and their adequate positioning (Doucet 2012; Maffiuletti 2010). Since the electric current produced by NMES is superficial, stimulation delivered is not sufficient to recruit a large number of motor units and produce an effective muscle contraction, therefore the characteristics and the spatial position of surface electrodes can influence the effectiveness of the muscle contraction. Despite the lack of a standard procedure, electrodes are often used in pairs of the same size, placed side by side over the muscle (Maffiuletti 2010; Sillen 2013; Vanderthommen 2007). Some authors have shown that the use of multiple electrodes, of large size, produces better results in muscle strengthening and reduction of discomfort, presumably due to the wide distribution and greater intensity of the electrical current. Additionally, gradual increase of the NMES intensity is recommended in order to activate deep muscle fibres and optimise muscle contraction (Maffiuletti 2010; Maffiuletti 2014).
Why it is important to do this review
Neuromuscular electrical stimulation is currently widely used by physical therapists to treat people with several types of knee problems and in postoperative rehabilitation; however, the effectiveness of NMES for PFP remains uncertain. Through a critical summary of the evidence for NMES for treating PFP, this review aims to help health professionals and patients make informed clinical decisions about treatment choices for PFP and identify research gaps in this area in relation to NMES.
Objectives
To assess the effects (benefits and harms) of neuromuscular electrical stimulation for people with patellofemoral pain.
Methods
Criteria for considering studies for this review
Types of studies
We included randomised controlled clinical trials evaluating the use of NMES for people with PFP.
Types of participants
We included studies involving adolescents and adults diagnosed with PFP. We excluded studies of participants with patellar luxation, patellar fracture, osteoarthritis, or other intra‐articular knee pathology. We excluded studies that included a mixed population where a percentage of the participants had some other knee pathology or were children, unless the results of people with PFP were presented separately or the proportion of those with other knee pathology or children was small (less than 5%) and preferably balanced between groups.
Types of interventions
We included trials comparing any kind of NMES with:
-
placebo or sham intervention (e.g. stimulation parameters below the level required to promote muscle contraction or no stimulator output);
-
no treatment;
-
exercise.
We also included trials comparing different programmes of NMES (e.g. different frequencies, intensity, and duration). For these comparisons, we designated the control group to be the one with a lower frequency, less intensive, or shorter duration programme.
We included studies that tested NMES as an isolated procedure or in combination with other conservative interventions (e.g. exercise programme), as long as the same intervention was also offered to people in the control group.
Types of outcome measures
Primary outcomes
-
Knee pain (measured by validated pain scores, such as visual analogue scales (VAS)) (Revill 1976).
-
Knee function measured by validated knee questionnaires (such as Kujala Patellofemoral Score and Lysholm score) (Kujala 1993; Lysholm 1982).
-
Adverse events (e.g. skin injuries, excessive discomfort, excessive fatigue, bradycardia or other cardiac arrhythmia, or substantially increased pain as a direct effect of treatment).
Secondary outcomes
-
Objectively measured performance tests (such as hop test, timed up‐and‐go, stair climbing).
-
Health‐related quality of life (measured by validated assessment tools such as Medical Outcomes Study 36‐item short‐form health survey (SF‐36) for general measures) (Ware 1992).
-
Participant satisfaction (preferably measured by validated assessment tools).
-
Muscle strength (directly measured, e.g. by isokinetic dynamometer).
We did not consider trials where muscle strength or outcome measures such as EMG (electromyogram) data and gait analysis were studied without evaluation of pain or knee function.
Timing of outcome measurement
We adjusted the previous criteria subsequent to external referee's feedback (see Differences between protocol and review). This included starting the follow‐up at trial entry.
-
Up to three months (short term); this coincided with the end of the treatment programme in all trials
-
Three to up to 12 months (medium term)
-
12 months or over (long term)
Search methods for identification of studies
Electronic searches
We searched the Cochrane Bone, Joint and Muscle Trauma Group Specialised Register (9 May 2017), the Cochrane Central Register of Controlled Trials (CENTRAL) (2017; Issue 5), Ovid MEDLINE (including MEDLINE In‐Process & Other Non‐Indexed Citations, MEDLINE Daily and Epub Ahead of Print) (1946 to 5 May 2017), Embase (Ovid Online) (1974 to 2017 Week 18), the Physiotherapy Evidence Database (PEDro) (1999 to 15 July 2016), the Cumulative Index to Nursing and Allied Health Literature (CINAHL) (EBSCO) (1982 to 5 May 2017), SPORTDiscus (EBSCO) (1985 to 5 May 2017), Allied and Complementary Medicine Database (AMED) (Ovid Online) (1985 to 5 May 2017), and Latin American and Caribbean Health Sciences (LILACS) (BIREME) (1982 to 5 May 2017). We also searched the WHO International Clinical Trials Registry Platform (apps.who.int/trialsearch/), ClinicalTrials.gov (www.clinicaltrials.gov/), and the ISRCTN registry (www.isrctn.com/) for ongoing trials (5 May 2017). We did not apply any restrictions based on publication status or language.
In MEDLINE (Ovid Online), the subject specific strategy was combined with the sensitivity‐maximising version of the Cochrane Highly Sensitive Search Strategy for identifying randomised trials (Lefebvre 2011). The search strategies for all databases are reported in Appendix 1.
Searching other resources
We searched the reference lists of relevant studies and conference abstracts of the International Patellofemoral Pain Research Retreat (IPRR) (ipfrn.org/conference/) (from 2009 to 2013) and the International Patellofemoral Pain Clinical Symposium (ipfrn.org/clinicalsymposium/) (2013). We also contacted experts in the field to identify published, unpublished, or ongoing trials.
Data collection and analysis
We carried out data collection and analysis according to the methods stated in the published protocol (Martimbianco 2014).
Selection of studies
Two review authors (ALCM and GP) independently screened the titles and abstracts retrieved through the search strategy. The full texts of all studies considered potentially eligible for inclusion were retrieved and read independently by the two review authors for final selection. Disagreements were settled by a third author (RR).
Data extraction and management
Two review authors (ALCM and GP) independently extracted the data from all reports of the included studies using a piloted extraction form that included information on participant characteristics, methodological aspects, interventions, comparisons, outcomes, follow‐up, and results. Unresolved disagreements between the two review authors were settled by a third review author (RR). We attempted to contact trial authors for clarification and additional information when necessary.
Assessment of risk of bias in included studies
Two review authors (ALCM and BNGA) independently assessed the risk of bias in the included studies using the Cochrane 'Risk of bias' tool (Higgins 2011), which assesses seven domains: sequence generation, allocation concealment, blinding of participants and personnel, blinding of outcome assessors, incomplete outcome data, selective reporting, and other sources of bias. Regarding this last domain we looked for major baseline imbalance as a potential cause of bias. We judged each of the seven domains as being at high, low, or unclear risk of bias. Disagreements between the two review authors were settled by a third review author (RR).
Measures of treatment effect
We calculated risk ratios (RR) with 95% confidence intervals (95% CI) for dichotomous data and mean differences (MD) with 95% CIs for continuous data. In cases where different scales were used to measure the same outcome, we planned to use standardised mean differences (SMD) with 95% CIs.
Unit of analysis issues
As we expected, the unit of randomisation in the included trials was the individual participant. In future updates of this review, if we find studies in which the unit of analysis is the knee rather than the individual participant, and where corrections have not been made, we will consider presenting the data for the trials where the disparity between the units of analysis and randomisation is small. Had we found studies with cross‐over designs, we would have considered the first stage as indicated in our protocol. We avoided unit of analysis issues related to repeated observations of the same outcome. For example, where trial results were presented for several periods of follow‐up, we presented data for these separately according to the different follow‐up periods defined in Types of outcome measures.
Dealing with missing data
We contacted trial authors to obtain any missing data and information. Where we were successful, we recorded the date of communication and the information obtained. We planned to conduct intention‐to‐treat analyses whenever possible. If necessary and possible, for continuous data we planned to calculate missing standard deviations (SDs) from exact P values, 95% CIs, or standard errors.
Assessment of heterogeneity
We assessed heterogeneity by visual inspection of forest plots and by using the I2 statistic, as recommended by Higgins 2011: 0% to 40% indicated no significant heterogeneity; 30% to 60% indicated moderate heterogeneity; 50% to 90% could represent substantial heterogeneity; and 75% to 100% was indicative of very substantial heterogeneity. We also used the Chi2 test: statistical significance (P < 0.1) was interpreted as significant heterogeneity.
Assessment of reporting biases
In future updates of this review, if there are at least 10 studies in a meta‐analysis of any primary outcome, we intend to perform a funnel plot to explore potential publication bias.
Data synthesis
When considered appropriate and where data were available, we pooled the results of comparable groups of trials using the fixed‐effect or random‐effects analysis models. Our choice of the fixed‐effect model for reporting purposes was guided by a careful consideration of the extent of heterogeneity and whether it could be explained, in addition to other factors such as the number and size of the included studies. We planned not to pool data where there was considerable heterogeneity (I2 > 75%) that could not be explained by differences in methodological or clinical features among the trials. Where it was not appropriate to pool data, we presented trial data in the analyses for illustrative purposes and reported these in the text.
Subgroup analysis and investigation of heterogeneity
We planned the following subgroup analyses: according to control group intervention (placebo versus no NMES control); when NMES was the main intervention or a complementary or auxiliary intervention; age of participants (18 years or more versus less than 18 years); gender; physical activity level (athletic, i.e. regular sports participation, versus non‐athletic); and duration of PFP symptoms (acute, i.e. less than three months, versus chronic). However, subgroup analysis was not possible because data were insufficient. In future updates, if sufficient data are available, we will perform subgroup analysis to investigate whether the results of subgroups were significantly different by inspecting the overlap of CIs and by performing the test for subgroup differences available in Review Manager 5 (RevMan 2014).
Sensitivity analysis
In future updates of this review, if sufficient trials are available, we plan to perform sensitivity analyses examining various aspects of trial and review methodology, including: the effects of missing data; of excluding trials at high or unclear risk of bias (specifically, selection bias from lack of allocation concealment, and detection bias from lack of outcome assessor blinding); trials only reported in abstracts; trials with unit of analysis problems related to the inclusion of participants with bilateral PFP; and the selection of the statistical model (fixed‐effect versus random‐effects). We also plan to examine the effect of including trials that provide suboptimal dosing: less than two sessions per week, lasting under 15 minutes each, for less than two weeks (Doucet 2012; Maffiuletti 2010).
Assessing the quality of the evidence and presenting 'Summary of findings' tables
We assessed the quality of the evidence for the primary outcomes (pain, function, and adverse events) according to the GRADE approach per Section 12.2 of the Cochrane Handbook for Systematic Reviews of Interventions (Higgins 2011). We prepared two 'Summary of findings' tables for the following comparisons: NMES plus other intervention (e.g. exercise) versus no NMES plus same other intervention; and NMES versus exercise. We presented knee pain and knee function at end of treatment (short term) and in the longer term (three months or above) and adverse events.
Results
Description of studies
Results of the search
We retrieved a total of 340 records from the following databases: Cochrane Bone, Joint and Muscle Trauma Group Specialised Register (5); CENTRAL (21), MEDLINE (47), Embase (123), PEDro (19), CINAHL (29), SPORTDiscus (14), AMED (16), LILACS (9), the WHO International Clinical Trials Registry Platform (11), ClinicalTrials.gov (44), and the ISRCTN registry (2). After excluding 87 duplicates, we screened 253 citations and excluded 241 that were not relevant. We judged 12 reports to be potentially eligible, which we selected for full‐text reading. Eight studies (nine reports) met our selection criteria and were included in the review (Akarcali 2002; Bily 2008; Callaghan 2001; Callaghan 2004; Glaviano 2016 (two reports); Gobelet 1992; Kaya 2013; Tunay 2003). We excluded two studies (Dursun 2001; Kuru 2012), and identified one ongoing study from our search of ClinicalTrials.gov (NCT02441712). There are no trials awaiting classification. A flow diagram summarising the study selection process is shown in Figure 1.

Study flow diagram.
Included studies
We have provided full details on the individual studies in the Characteristics of included studies table. We contacted the authors of all studies for clarification and additional information and received responses from authors of five studies (Akarcali 2002; Bily 2008; Callaghan 2001; Callaghan 2004; Tunay 2003). One study, Glaviano 2016, was reported in two different articles, one of which reported the findings for the 15 female participants of the 22 participants in the full report.
Design
All eight included studies were randomised, controlled, parallel‐group clinical trials. Two of them were pilot studies (Bily 2008; Callaghan 2001). Glaviano 2016 was a sports laboratory‐based study that assessed the immediate effects of a single session of NMES. Gobelet 1992 had three treatment groups; we considered the two groups testing different types of exercise (isokinetic versus isometric) together in this review. Kaya 2013 had three treatment groups, of which one was excluded as it was not relevant for this review, and Tunay 2003 had four groups, two of which were excluded as they were not relevant.
Sample size
Overall, 390 participants were randomised and 345 were available for analysis. Sample sizes in the eight studies ranged from 16, in Callaghan 2001, to 120, in Gobelet 1992. The number of participants in the intervention group ranged from 7, in Callaghan 2001, to 37, in Callaghan 2004.
Setting
The trials were conducted in five different countries: one in Switzerland (Gobelet 1992), two in the United Kingdom (Callaghan 2001; Callaghan 2004), one in Austria (Bily 2008), three in Turkey (Akarcali 2002; Kaya 2013; Tunay 2003), and one in the United States (Glaviano 2016). The publication dates ranged from 1992, in Gobelet 1992, to 2016, in Glaviano 2016.
Participants
All studies included participants with PFP diagnosed through clinical examination of the knee, including pain provoking clinical tests (prolonged sitting, kneeling, squatting, ascending or descending stairs), in Bily 2008, Callaghan 2001, Callaghan 2004, and Glaviano 2016, and positive patellar compression tests (Akarcali 2002; Glaviano 2016). Two studies also used magnetic resonance imaging for diagnosis (Callaghan 2001; Kaya 2013). Three trials included X‐rays to investigate anatomical bone changes (Akarcali 2002; Bily 2008; Gobelet 1992). Four studies included only participants with unilateral complaints (Callaghan 2001; Callaghan 2004; Kaya 2013; Tunay 2003). Akarcali 2002 and Glaviano 2016 included people with bilateral PFP, but the authors treated only the most symptomatic knee in these participants; Bily 2008 included only people with bilateral PFP, and both knees were treated and evaluated; and Gobelet 1992 provided no information on the side(s) affected. Seven studies reported the minimum duration of symptoms (Akarcali 2002; Bily 2008; Callaghan 2001; Callaghan 2004; Glaviano 2016; Kaya 2013; Tunay 2003), which ranged from one month, in Tunay 2003, to six months (Bily 2008; Callaghan 2001; Callaghan 2004; Kaya 2013). The mean age of participants ranged from 25.4 years, in Bily 2008, to 42.7 years, in Kaya 2013. Tunay 2003 did not report the gender of the participants. All of the other seven trials recruited a higher percentage of females, ranging from 53% in Gobelet 1992 to 100% in Kaya 2013, which recruited females only. None of the included studies described the level of activity of their participants.
Interventions and controls
All studies gave the participants in the intervention group an NMES portable device for use at home (Bily 2008; Callaghan 2001; Callaghan 2004; Gobelet 1992), during an outpatient rehabilitation programme (Akarcali 2002; Kaya 2013; Tunay 2003), or in a research laboratory (Glaviano 2016). The participants using the portable device at home received instructions about the stimulation programme and electrode placement. In four studies, self adhesive electrodes were to be placed on the quadriceps muscles (Bily 2008; Callaghan 2001; Callaghan 2004; Kaya 2013). In two studies (Akarcali 2002; Gobelet 1992), the investigators aimed to specifically stimulate the vastus medialis oblique (VMO) muscle. In one study (Glaviano 2016), the electrodes were positioned over the VMO and gluteus medius muscles (agonist muscles), and over the adductor and the hamstrings muscle groups (antagonist muscles). Tunay 2003 did not describe the position of the electrodes.
Glaviano 2016 used a novel form of NMES (patterned electrical neuromuscular stimulation (PENS) with a frequency of 50 Hz) that mimics voluntary movement patterns of muscular contractions (stimulation of the agonist muscles, followed by antagonist muscles), and compared it with a sham intervention ("sub sensory" treatment).
Four studies compared NMES plus another intervention versus no NMES plus the same other intervention (Akarcali 2002; Bily 2008; Kaya 2013; Tunay 2003). The other intervention was an exercise programme in Akarcali 2002 and Bily 2008; an exercise programme and patellar taping in Kaya 2013; and ice, patellar taping, and exercises in Tunay 2003. Akarcali 2002 and Kaya 2013 used a high‐voltage pulsed galvanic stimulation (HVPGS) with a frequency of 60 Hz, and Bily 2008 and Tunay 2003 used an NMES device with a frequency of 40 Hz and 30 Hz, respectively.
Gobelet 1992 compared NMES (with sequentially combined periods of high and low frequencies (50 Hz and 10 Hz)) alone versus an exercise programme (isokinetic and isometric exercises).
The last two studies compared different NMES programmes (Callaghan 2001; Callaghan 2004). Callaghan 2001 used an NMES device that simultaneously combined high and low frequencies superimposed, comparing it with an NMES device that sequentially combined high and low frequencies (control group). Callaghan 2004 used a new type of NMES with simultaneous delivery of mixed frequencies, comparing it with a fixed‐frequency NMES device (control group).
All studies reported that the intensity of stimulation was adjusted to the highest possible level that was tolerated by the participants. The duration of the stimulation session ranged from 10 minutes, in Akarcali 2002 and Tunay 2003, to four hours per day (Gobelet 1992). NMES session frequency ranged from a single session, in Glaviano 2016, to seven times per week, in Callaghan 2001. The treatment duration ranged from 15 minutes, in Glaviano 2016, to 12 weeks, in Bily 2008.
Outcomes
All studies evaluated outcomes in the short term, which was timed after the single session in Glaviano 2016, and at end of the treatment programme (3 weeks in Tunay 2003 to 12 weeks in Bily 2008). Bily 2008 also assessed participants at 12 months after the end of treatment (long term). Seven trials used a visual analogue scale (VAS) to assess knee pain (Akarcali 2002; Bily 2008; Callaghan 2001; Callaghan 2004; Glaviano 2016; Kaya 2013; Tunay 2003). Three studies used the Kujala Patellofemoral Score to assess knee function (Bily 2008; Callaghan 2001; Callaghan 2004); one used the Cincinnati Knee Rating System (Tunay 2003); one used the Lower Extremity Functional Scale (LEFS) (Kaya 2013); and one used the Arpège function scale (Gobelet 1992). Only two studies evaluated adverse events, such as muscle fatigue using bipolar electrode surface electromyography (EMG) (Callaghan 2001; Callaghan 2004). Four studies assessed muscle flexion strength: Callaghan 2001 and Callaghan 2004 used an isokinetic dynamometer; Bily 2008 used a specifically designed chair with a circuit configuration that measured maximal isometric contractions; and Akarcali 2002 used Lovett’s manual muscle test (grades from 0 to 5; higher indicates better muscle strength). Two studies assessed lower limb muscle function (Callaghan 2001; Callaghan 2004), measured through performance tests such as step up and down and squat flexion. None of the included studies reported quality of life or participant satisfaction.
Excluded studies
We excluded two potentially eligible studies for reasons detailed in the Characteristics of excluded studies table (Dursun 2001; Kuru 2012). Briefly, Dursun 2001 investigated the effects of electromyographic biofeedback (EMG) on PFP, and Kuru 2012 was not a randomised controlled trial.
Ongoing studies
We found one ongoing study, which aimed to recruit 32 participants to test the results at four weeks of the same comparison as in Glaviano 2016. Further details are given in Characteristics of ongoing studies.
Risk of bias in included studies
We assessed studies for risk of bias ('low', 'high', or 'unclear') relating to seven domains. The results for individual studies are summarised in Figure 2, with details given in the Characteristics of included studies table. An overall summary of the ratings for each domain is shown in Figure 3.
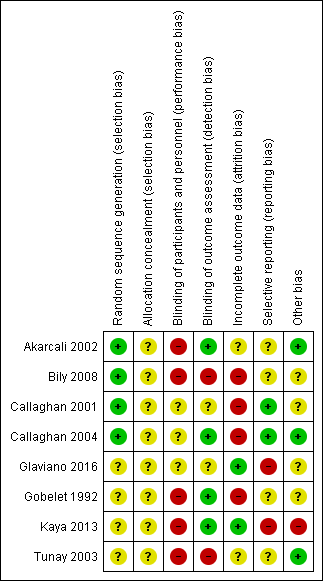
Risk of bias summary: review authors' judgements about each risk of bias item for each included study.

Risk of bias graph: review authors' judgements about each risk of bias item presented as percentages across all included studies.
Allocation
Random sequence allocation was adequate in four studies: two studies used a computer‐generated randomisation list (Callaghan 2001; Callaghan 2004); one used a sample of shuffled sealed envelopes, and the participant took one out of the batch (Bily 2008, in reply to our email); and one study used the coin‐tossing technique (Akarcali 2002, in reply to our email). The other four trials provided insufficient information about the randomisation process and were therefore judged as at unclear risk of bias for this domain (Gobelet 1992; Glaviano 2016; Kaya 2013; Tunay 2003). We judged all eight studies as at unclear risk of bias relating to allocation concealment. Six studies provided no details about the method used for allocation concealment (Akarcali 2002; Callaghan 2001; Callaghan 2004; Gobelet 1992; Kaya 2013; Tunay 2003). Bily 2008 and Glaviano 2016 used sealed envelopes but did not mention if they were opaque.
Blinding
Seven studies provided no information on participant blinding and were classified as being at high or unclear risk of performance bias depending on whether blinding would have been feasible: we judged five studies that compared different interventions between groups as at high risk of bias (Akarcali 2002; Bily 2008; Gobelet 1992; Kaya 2013; Tunay 2003), and two studies that compared the same intervention (different NMES parameters) as at unclear risk of bias for this domain (Callaghan 2001; Callaghan 2004). Glaviano 2016 compared NMES with a sham control but, since the authors did not exclude people who had received previous NMES therapy, it is difficult to judge whether the blinding was effective; we therefore also classified this study as at unclear risk of bias for this domain. Regarding detection bias, four trials reported blinding of outcome assessors and were judged to be at low risk of bias (Akarcali 2002; Callaghan 2004; Gobelet 1992; Kaya 2013). Bily 2008 reported by email that no measures were used to ensure blinding of the outcome assessors, and was therefore judged as at high risk of bias. Callaghan 2001, Glaviano 2016, and Tunay 2003 did not clearly report if the outcome assessors were blinded; we judged the first two studies as being at unclear risk of bias for this domain, and Tunay 2003 as at high risk of bias given the clear differences in the interventions.
Incomplete outcome data
We categorised only two studies as at low risk of bias for this domain because all participants completed the study (Glaviano 2016; Kaya 2013). Tunay 2003 provided insufficient information to make a judgement regarding losses and was assessed as being at unclear risk of bias for this domain. We judged the remaining five trials as at high risk of bias because they had at least one of the following issues: a high dropout rate (> 20%), an imbalance between groups due to loss of participants, no reporting of intention‐to‐treat analysis and uncertainty of the effects of postrandomisation exclusions due to adverse events (Akarcali 2002; Bily 2008; Callaghan 2001; Callaghan 2004; Gobelet 1992).
Selective reporting
None of the trials had a published study protocol or trial registration. It was unclear in six studies if the results included all expected outcomes (Akarcali 2002; Bily 2008; Glaviano 2016; Gobelet 1992; Kaya 2013; Tunay 2003); furthermore, these studies did not consider adverse event as an outcome, and were therefore judged as at unclear risk of bias for this domain. We assessed two studies as at further high risk of bias: Glaviano 2016 because of the very short follow‐up and data inconsistencies between the two reports of the trial, and Kaya 2013 because of contradictions between the text and tables for pain results. We categorised Callaghan 2001 and Callaghan 2004 as being at low risk of bias because although they considered only one adverse event (muscle fatigue), this is one of the most important adverse events in clinical practice.
Other potential sources of bias
Three studies were apparently free of other sources of bias (Akarcali 2002; Callaghan 2004; Tunay 2003), including major between‐group imbalances in key baseline characteristics, and were rated as at low risk of bias for this domain. We judged four studies as at unclear risk of bias: Bily 2008 because of some imbalances in participant characteristics, particularly in pre‐training muscle strength; Callaghan 2001 due to lack of information on participant characteristics at baseline; Glaviano 2016 because of some doubts as to the reliability of the presented data; and Gobelet 1992 because the authors did not provide information on the side(s) affected, and it was unclear which knee was treated. We judged Kaya 2013 as at high risk of other bias due to there being a major difference between the two groups in the initial pain during activities data, given that pain is the top primary outcome of this review.
Effects of interventions
See: Summary of findings for the main comparison Neuromuscular electrical stimulation + other intervention (e.g. exercise) versus same other intervention only for patellofemoral pain syndrome; Summary of findings 2 Neuromuscular electrical stimulation versus exercise for patellofemoral pain syndrome
Comparison 1: NMES versus placebo
One laboratory study compared NMES versus sham NMES in a single 15‐minute session (Glaviano 2016). Glaviano 2016 assessed knee pain immediately at the end of the treatment in 22 participants. This study did not report on all other outcomes pertinent to our review, such as function or adverse events. We rated the quality of the evidence as very low, downgrading one level for serious risk of bias, one level for indirectness (the single session of NMES does not correspond to that used in clinical practice; the results immediately post‐treatment may not be representative), and one level for serious imprecision, reflecting the low numbers available.
Knee pain (VAS: 0 to 10; higher scores = worse pain)
Glaviano 2016 found NMES was associated with reduced pain during a single leg squat (mean difference (MD) ‐1.90, 95% confidence interval (CI) ‐3.10 to ‐0.70) and during a lateral step‐down (MD ‐2.20, 95% CI ‐3.47 to ‐0.93) (Analysis 1.1). However, the 95% CI also included the probability that this benefit may not be clinically relevant because the 95% CI overlap the minimal clinically important difference (MCID) for VAS during activities (1.3 out of 10 points; Crossley 2004).
Comparison 2: NMES plus other active intervention (e.g. exercise) versus no NMES plus same other active intervention
Four studies compared NMES versus no NMES, where all participants received another intervention, typically exercise. Two studies compared NMES associated with exercise versus exercise alone (Akarcali 2002; Bily 2008). In Kaya 2013, the common co‐intervention was an exercise programme and patellar taping, and in Tunay 2003, all participants received exercises, patellar taping, and ice. All studies reported results at the end of the treatment (short term): three weeks in Tunay 2003, six weeks in Akarcali 2002 and Kaya 2013, and 12 weeks in Bily 2008. Bily 2008 also reported results at one year after treatment (long term). None of the four trials reported on adverse events, performance tests, quality of life or participant satisfaction. We rated the quality of the evidence for all reported outcomes as very low, downgrading one or two levels for serious or very serious risk of bias, and one or two levels for serious or very serious imprecision, reflecting the low numbers available and often broad confidence intervals.
Knee pain (VAS: 0 to 10; higher scores = worse pain)
Pooled results from three studies showed NMES was associated with lower pain scores in the short term (ranging from 3 to 12 weeks): MD ‐1.63, 95% CI ‐2.23 to ‐1.02; 118 participants; 3 studies; I2 = 2%; Analysis 2.1 (Akarcali 2002; Bily 2008; Tunay 2003). However, this benefit may not be clinically relevant since the absolute value (1.02) for the upper 95% CI was less than the MCID for VAS during activities (1.5 to 2.0, out of 10 points; Crossley 2004).
Conversely, Kaya 2013 (30 participants), which evaluated knee pain during three activities after six weeks of treatment, reported clinically important higher pain scores in the NMES group during step‐down (MD 3.32, 95% CI 2.38 to 4.26), and step‐up (MD 3.15, 95% CI 2.10 to 4.20); Analysis 2.2. This did not apply for pain during squatting (MD 0.58, 95% CI ‐0.91 to 2.07). However, these results must be considered in the context of the imbalances in baseline pain scores, which were statistically significantly higher in the NMES group: step‐down: MD 2.12, 95% CI 0.2 to 4.04; step‐up: MD 1.90, 95% CI 0.01 to 3.79; and during squat: MD 1.77, 95% CI 0.22 to 3.32. Additionally, these findings disfavouring NMES were contradicted in the abstract conclusions for this trial, which stated that "Additional HVPGS [NMES] application in PFP rehabilitation may decrease pain levels during activities including step up and down".
Bily 2008 reported that the NMES group had a median pain score of 1.5 (interquartile range (IQR) 0.3 to 2.8; 18 participants) at 12 weeks, while the control group had a median score of 1.3 (IQR 0.4 to 3.3; 18 participants) (reported P = 0.64). At one‐year follow‐up, the NMES group had a higher median score of 1.8 (IQR 0.1 to 3.6; 16 participants), while the control group had a median score of 0.4 (IQR 0.2 to 3.4; 13 participants) (P value not available). However, the study reported that the change score for pain at one‐year follow‐up "remained constant" to that at 12 weeks (Analysis 2.1).
Knee function
Kaya 2013 measured knee function using the Lower Extremity Functional Scale (LEFS) scale (0 to 80; higher scores indicate better function) after six weeks of treatment. Tunay 2003 assessed knee function using the Cincinnati Knee Rating System (6 to 100; higher scores indicating better function) after three weeks of treatment. Pooled results from these two studies did not confirm a difference between the groups (standardised mean difference 0.37 favouring NMES, 95% CI ‐0.11 to 0.84; 70 participants; I2 = 7%; Analysis 2.3). The between‐group differences in the two scores in the individual trials were also small and unlikely to be clinically important (LEFS scale: MD 0.73; Cincinnati score: MD 4.65).
Bily 2008 evaluated knee function using the Kujala Patellofemoral Score (KPS) (0 to 100; higher scores indicating better function) and found no statistically significant difference between groups after the end of the 12‐week treatment and at one year. After 12 weeks, the NMES group had a median score of 89 (IQR 82 to 96; 18 participants), while the control group had a median score of 90 (IQR 85 to 95; 18 participants) (reported P = 0.29). At one‐year follow‐up, the NMES group had a median of 94 (IQR 88 to 96; 16 participants), while the control group had a median of 95 (IQR 85 to 96; 13 participants) (P value not available). There was no clinically important difference in change score for KPS at 12 weeks (MD 3.70, 95% CI ‐2.90 to 10.30; 36 participants; Analysis 2.4). The study reported that the change score for KPS at one‐year follow‐up remained constant.
Muscle strength
Akarcali 2002 assessed muscle strength using Lovett’s manual muscle test (graded between 0 and 5; higher scores indicating better muscle strength). There was very little difference between the two groups with good or normal muscle strength (grades 4 and 5) at the end of the six‐week treatment: 20/20 versus 21/22; risk ratio 1.04, 95% CI 0.92 to 1.19; very low‐quality evidence; Analysis 2.5.
Bily 2008 (36 participants) evaluated isometric knee extensor strength (measured in newtons (N)) through a specifically designed chair (see Characteristics of included studies). Neuromuscular electrical stimulation was associated with greater muscle strength at 12 weeks (30° knee flexion: MD 38.30 N, 95% CI 13.71 to 62.89; and 60° knee flexion: MD 50.00 N, 95% CI 11.30 to 88.70; Analysis 2.6). However, we are not confident about the clinical relevance of these differences, especially since the muscle strengths before training were greater in the NMES group at both knee flexion settings (MD 14 N and 36 N).
Comparison 3: NMES versus exercise
One trial compared NMES versus exercises (isometric and isokinetic exercises), reporting results at the end of the four‐week treatment (short term) for 94 participants (Gobelet 1992). In our analyses, we pooled data from the two exercise groups. Since Gobelet 1992 did not report which knee was treated and assessed, we considered the participant as the unit of analysis. Gobelet 1992 did not report on knee pain, adverse events, performance tests, quality of life or participant satisfaction. For both reported outcomes, we rated the quality of the evidence as very low, downgrading one level for serious risk of bias, one level for indirectness given the protracted application of NMES (four hours per day), and one level for serious imprecision, reflecting the low numbers available.
Knee function
Gobelet 1992, which used the Arpège function scale (0 to 18; higher scores indicating better function) to assess knee function, found no important difference in knee function at four weeks between the two groups (MD ‐0.94, 95% CI ‐2.10 to 0.22; 94 participants; Analysis 3.1).
Muscle strength
Gobelet 1992 assessed muscle strength using an isokinetic dynamometer (measured in Nm) at speeds of 30°/s and 300°/s. There were no important differences in strength at four weeks between the two groups at either speed (at 30°/s: MD 0.06 Nm, 95% CI ‐29.67 to 29.79; 94 participants; at 300°/s: MD 1.04 Nm, 95% CI ‐14.00 to 16.08; 94 participants; Analysis 3.2).
Comparison 4: NMES (simultaneous frequencies) versus control NMES (sequential or fixed frequencies)
Two studies assessed this comparison (Callaghan 2001; Callaghan 2004). Callaghan 2001 compared simultaneously delivered high‐low frequencies versus sequentially delivered high‐low frequencies (control group). Callaghan 2004 compared simultaneously delivered high‐low frequencies versus a fixed frequency (control group). Both studies assessed outcomes in the short term, at the end of the six‐week treatment programme. Neither study reported on quality of life or participant satisfaction. We rated the quality of the evidence as very low for all reported outcomes, downgrading one level for serious risk of bias, one level for indirectness given the experimental nature of the intervention, and one level for serious imprecision, reflecting the low numbers available.
Knee pain (VAS: 0 to 10; higher scores = worse pain)
Both studies assessed this outcome and provided very low‐quality evidence of no important difference in knee pain between the two groups at six weeks (MD 0.40, 95% CI ‐1.76 to 2.56; 14 participants; 1 study; Analysis 4.1). In Callaghan 2004 (74 participants), participants in the NMES group with simultaneous frequencies had a median score of 2 points (IQR 0 to 4; 37 participants), and those in the NMES group with fixed frequencies had a median score of 2 points (IQR 1 to 4; 37 participants) (reported P = 0.249).
Knee function (KPS: 0 to 100; higher scores = better function)
We found very low‐quality evidence of no important difference between the groups in knee function at six weeks (MD ‐1.16, 95% CI ‐6.79 to 4.47; 88 participants; 2 studies; I2 = 15%; Analysis 4.2).
Adverse events
Both studies assessed muscle fatigue only as an adverse event (quadriceps fatigue rates through bipolar electrode surface EMG, at 60% of maximum contraction for 60 seconds). Both studies reported no statistically significant difference between groups (Callaghan 2001: reported P > 0.05; Callaghan 2004: reported P = 0.724). There were no reports of dropouts due to adverse events.
Functional performance tests
Both studies assessed this outcome by combining the step‐up and step‐down tests in a single measure ('steps up and down') and presented the total number of steps achieved until the onset of patellar pain. Neither study found evidence showing a difference between the two groups at six weeks (MD 4.50 steps, 95% CI ‐8.21 to 17.21; 14 participants; 1 study; Analysis 4.3). In Callaghan 2004, the participants of the NMES group with simultaneous frequencies had a median of 27 steps (IQR 16 to 46; 37 participants), and those in the NMES fixed‐frequency group had a median of 28 steps (IQR 11 to 60; 37 participants) (reported P = 0.562).
Muscle strength
Both studies assessed quadriceps isometric and isokinetic muscle strength using an isokinetic dynamometer (measured in Nm), with angular velocity at 90°/s. Pooled results showed no evidence of important differences between the two groups at six weeks for either isometric muscle strength (MD ‐1.15 Nm, 95% CI ‐16.24 to 13.94; 88 participants; 2 studies; I2 = 0%; Analysis 4.4) or isokinetic muscle strength (MD ‐7.28 Nm, 95% CI ‐24.45 to 9.89; 88 participants; 2 studies; I2 = 0%; Analysis 4.5).
Subgroup and sensitivity analyses
There were insufficient data to perform our planned subgroup and sensitivity analyses.
Discussion
Summary of main results
This review evaluated the effects (benefits and harms) of NMES for people with a diagnosis of PFP. We included eight heterogeneous randomised clinical trials reporting results for a total of 345 participants. These studies contributed data to one of the four comparisons summarised below.
NMES alone versus placebo (sham NMES)
One laboratory‐based study compared a single 15‐minute session of NMES versus sham (placebo control) in 22 participants. This study reported only on pain during two functional activities assessed immediately after treatment (short term). We found very low‐quality evidence (downgraded one level for serious risk of bias, one level for indirectness given that the single 15‐minute session of NMES does not correspond to clinical practice, and one level for imprecision) that NMES is associated with reduced pain during both functional activities. However, the 95% CI results also include the probability that the difference was not clinically important. There were no data on function, adverse events, or longer‐term outcomes. Overall, the evidence from this study is limited and of uncertain clinical relevance.
NMES plus another intervention (e.g. exercise) versus no NMES control plus the same other intervention
The evidence for this comparison, which is summarised in summary of findings Table for the main comparison, was from four trials, each testing a different multiple‐session NMES programme. Exercise was the common intervention in all four trials in this comparison; in one trial patellar taping was also used, and in another trial patellar taping and ice were also used.
We found very low‐quality evidence from three trials (118 participants) that NMES is associated with reduced pain in the short term (at the end of the 3 and 12 weeks' treatment programmes). However, the 95% CI included the possibility that the difference is not clinically important. We found very low‐quality evidence from pooled data from two trials of little effect of NMES on knee function at the end of treatment (three and six weeks). There was inconclusive and very low‐quality evidence from one trial (29 participants) of little effect of NMES on pain and function at one‐year follow‐up. None of the four trials reported on adverse effects of treatment.
NMES versus exercise
The evidence for this comparison, which is summarised in summary of findings Table 2, was from one trial (94 participants) that compared NMES applied four hours per day on a daily basis for four weeks, with two types of exercises (isometric and isokinetic). The trial did not report on knee pain or adverse events. There was very low‐quality evidence of no important difference between the two groups in knee function at the end of the four‐week treatment (short term).
Different types of NMES
Two studies reporting data for 88 participants compared simultaneously delivered high‐low frequencies NMES versus control NMES, which was either sequentially delivered high‐low frequencies (14 participants) or fixed frequency (74 participants). We found very low‐quality evidence of no important differences at the end of the six‐week treatment programme between the simultaneous frequencies NMES and the control NMES in overall knee pain, knee function, or quadriceps fatigue (adverse event).
Overall completeness and applicability of evidence
Overall, outcome data from the eight included trials were available for 345 participants, thus 88.5% of the 390 randomised participants. The majority (26 participants; 22% of 120) were lost from the largest and oldest trial (Gobelet 1992). The eight trials contributed data to one of four comparisons, thus reducing again the quantity of data available to address individual questions. Clinical and methodological heterogeneity among studies in the same comparison precluded the pooling of data for several outcomes. The maximum number of participants in any analysis was 118 participants from three studies (Analysis 2.1). There were very few data for longer‐term outcomes.
Except Glaviano 2016, which was carried out in a sports laboratory, the trials were conducted in typical settings, with NMES applied in outpatients or at home.
Where details were provided, the study populations were representative of those treated for PFP. In three studies, the minimum duration of the complaints was from one to three months, which could present a better prognosis than the other four studies, which only included participants who had symptoms for more than six months. Three studies stipulated a maximum duration of symptoms of three and five years, and a further study recorded a maximum duration of symptoms of five years (Tunay 2003). On duration of symptoms alone, there was clearly a large variation within each study. None of the included studies reported the level of physical activity of their participants, which can also influence treatment effect. Finally, it was not possible to assess the influence of age and gender in the effectiveness of the intervention, but these factors were in accordance with the incidence of the disease. The variation in the inclusion and diagnostic criteria and the actual population characteristics could thus limit the applicability of the evidence.
The included studies used different NMES devices and stimulation parameters (e.g. frequency, pulse waveform, pulse duration, duty cycle, intensity, and treatment duration), as well as different types of co‐interventions (exercises, taping, ice). Only one study compared NMES with placebo, and although this comparison is considered clinically relevant (since it evaluates the specific active effect of electrostimulation), this study evaluated only a single NMES session, which could be insufficient to produce a true clinical benefit. In contrast, in the study that compared NMES versus exercise, participants were prescribed NMES for four hours a day, which seems to be very demanding and impracticable. Moreover, the length of treatment also varied between studies, ranging from a single session to 12 weeks.
Although appropriate outcome measures were generally used, most studies did not record or report on adverse events, and none reported on quality of life and participant satisfaction, both of which are important patient‐related outcomes. Moreover, most studies measured the outcome immediately at the end of treatment (in the short term), and there were very few data on the longer‐term effects of NMES.
All these factors contribute to the poor quality and applicability of the available evidence. For example, it is not possible to identify the best NMES programme and whether it is applicable to all people with PFP.
Quality of the evidence
All eight trials included in this review were at high risk of bias for at least one of the seven assessed domains, and at unclear risk of bias for several other domains, notably for allocation concealment, where no trial was judged as meeting the criteria for low risk of selection bias. We considered the overall quality of the evidence, based on the GRADE approach, as very low for all primary outcomes for each comparison, which means that we are very uncertain about the estimates of treatment effect. We downgraded evidence levels due methodological limitations that resulted in serious risk of bias, imprecision (small sample size and usually wide confidence intervals), and indirectness (the NMES scheme did not correspond to what is used in clinical practice, and the time point of pain assessment was very far from the end of the intervention). We did not assess publication bias due to the small number of studies available for pooling. While there was clinical heterogeneity as illustrated above, statistical heterogeneity was low in all pooled analyses, and thus we did not downgrade for inconsistency.
Potential biases in the review process
To minimise the probability of bias, we followed the recommendations on searching, trial selection, data extraction and analysis in the Cochrane Handbook for Systematic Reviews of Interventions (Higgins 2011). The search strategy was broad and sensitive, and we anticipate that we have identified all fully published randomised clinical trials that met the inclusion criteria. However, we cannot rule out that we have missed some trials, especially unpublished trials that are available, for example, only in conference proceedings. We contacted all trial authors via email for additional information. Although adhering to our protocol, our decision to pool data from clearly heterogeneous trials may be questioned (comparison 2). However, we have been cautious in our interpretation of the results and made clear the limitations in the applicability of the evidence.
Agreements and disagreements with other studies or reviews
Although we did not find another published systematic review on this topic, we located two Cochrane Reviews on related topics. One Cochrane Review assessed the effects of NMES for quadriceps strengthening before and after total knee replacement (Monaghan 2010). Based on two studies with a high risk of bias, Monaghan 2010 concluded that the evidence for the use of NMES for this clinical situation was unclear. A more recent Cochrane Review that included 31 heterogeneous trials evaluated exercises for treating PFP (van der Heijden 2015). van der Heijden 2015 concluded that there is very low‐quality but consistent evidence that exercise may improve clinical outcomes such as pain, function, and long‐term recovery.

Study flow diagram.

Risk of bias summary: review authors' judgements about each risk of bias item for each included study.

Risk of bias graph: review authors' judgements about each risk of bias item presented as percentages across all included studies.
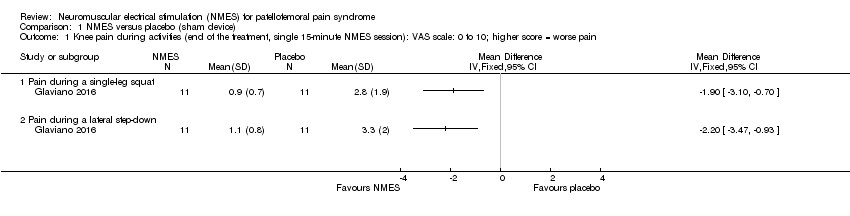
Comparison 1 NMES versus placebo (sham device), Outcome 1 Knee pain during activities (end of the treatment, single 15‐minute NMES session): VAS scale: 0 to 10; higher score = worse pain.

Comparison 2 NMES (+ other intervention) versus no NMES (+ same other intervention), Outcome 1 Knee pain (end of the treatment, 3 to 12 weeks): VAS scale: 0 to 10; higher score = worse pain.

Comparison 2 NMES (+ other intervention) versus no NMES (+ same other intervention), Outcome 2 Knee pain during activities (end of the treatment, 6 weeks): VAS scale: 0 to 10; higher score = worse pain.

Comparison 2 NMES (+ other intervention) versus no NMES (+ same other intervention), Outcome 3 Knee function (end of the treatment, 3 and 6 weeks): Cincinnati Knee Rating System and LEFS; higher score = better function.
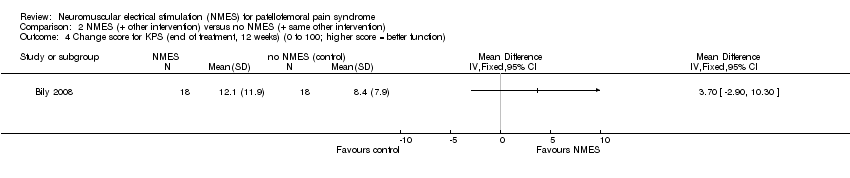
Comparison 2 NMES (+ other intervention) versus no NMES (+ same other intervention), Outcome 4 Change score for KPS (end of treatment, 12 weeks) (0 to 100; higher score = better function).

Comparison 2 NMES (+ other intervention) versus no NMES (+ same other intervention), Outcome 5 Good or normal muscle strength (end of the treatment, 6 weeks): grades 4 to 5 Lovett’s manual muscle scale.

Comparison 2 NMES (+ other intervention) versus no NMES (+ same other intervention), Outcome 6 Muscle strength (end of the treatment, 12 weeks): isokinetic dynamometer (N).

Comparison 3 NMES versus exercise, Outcome 1 Knee function (end of the treatment, 4 weeks): Arpège function scale: 0 to 18; higher score = better function.

Comparison 3 NMES versus exercise, Outcome 2 Muscle strength (end of the treatment, 4 weeks): isokinetic dynamometer (Nm).
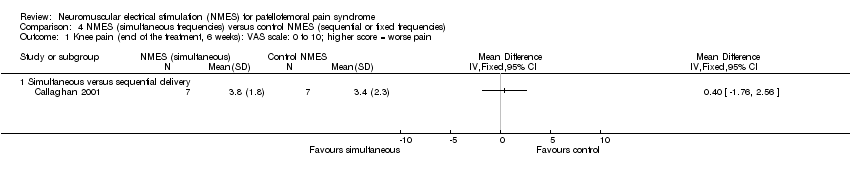
Comparison 4 NMES (simultaneous frequencies) versus control NMES (sequential or fixed frequencies), Outcome 1 Knee pain (end of the treatment, 6 weeks): VAS scale: 0 to 10; higher score = worse pain.

Comparison 4 NMES (simultaneous frequencies) versus control NMES (sequential or fixed frequencies), Outcome 2 Knee function (end of the treatment, 6 weeks): KPS: 0 to 100 scale; higher score = better function.
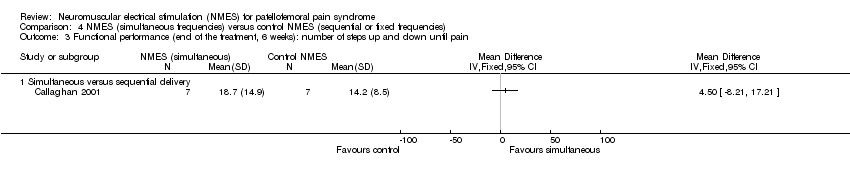
Comparison 4 NMES (simultaneous frequencies) versus control NMES (sequential or fixed frequencies), Outcome 3 Functional performance (end of the treatment, 6 weeks): number of steps up and down until pain.

Comparison 4 NMES (simultaneous frequencies) versus control NMES (sequential or fixed frequencies), Outcome 4 Quadriceps isometric muscle strength (end of the treatment, 6 weeks): dynamometer at 90°/s (Nm).

Comparison 4 NMES (simultaneous frequencies) versus control NMES (sequential or fixed frequencies), Outcome 5 Quadriceps isokinetic muscle strength (end of the treatment, 6 weeks): dynamometer at 90°/s (Nm).
| Neuromuscular electrical stimulation (NMES) plus other intervention (e.g. exercise) versus no NMES plus same other intervention for patellofemoral pain syndrome | ||||||
| Patient or population: people with patellofemoral pain syndrome1 Comparison: no NMES control plus same other active intervention | ||||||
| Outcomes | Illustrative comparative risks* (95% CI) | Relative effect | No. of participants | Quality of the evidence | Comments | |
| Assumed risk | Corresponding risk | |||||
| No NMES plus same other intervention | NMES plus other intervention (e.g. exercise) | |||||
| Knee pain (short term) | The mean knee pain ranged across control groups from | The mean knee pain in the intervention groups was | MD ‐1.63 (‐2.23 to ‐1.02) | 118 | ⊕⊝⊝⊝ | This difference may not be clinically important since the MCID for VAS (1.5 to 2.0, out of 10 points)5 lies within the 95% CI. |
| Knee pain (long term) | The median pain score in the study control group was 0.4 points (IQR 0.2 to 3.4). | The median pain score in the NMES group was 1.8 points (IQR 0.1 to 3.6). | See comment | 29 | ⊕⊝⊝⊝ | The difference was reported as not statistically significant. |
| Knee function (short term) | The mean knee function in the study control groups was | The mean difference in knee function in the intervention groups was | SMD 0.37 (‐0.11 to 0.84) | 70 | ⊕⊝⊝⊝ | 0.2 SD represents a small difference, 0.5 SD a moderate difference, and 0.8 SD a large difference. However, the mean differences in the 2 trials were small and unlikely to be clinically important (LEFS scale: MD 0.73; Cincinnati score: MD 4.65). |
| Knee function (long term) Kujala Patellofemoral Score (KPS) (0 to 100; higher score = better function). | The median KPS in the study control group was 95 (IQR 85 to 96). | The median KPS in the NMES group was 94 (IQR 88 to 96). | See comment | 29 | ⊕⊝⊝⊝ | The very small difference was reported as not statistically significant. |
| Adverse events ‐ not measured | See comment | See comment | Not estimable | ‐ | See comment | Not measured |
| *The basis for the assumed risk (e.g. the median control group risk across studies) is provided in footnotes. The corresponding risk (and its 95% confidence interval) is based on the assumed risk in the comparison group and the relative effect of the intervention (and its 95% CI). | ||||||
| GRADE Working Group grades of evidence | ||||||
| 1Where reported, there was a higher percentage of females (63% to 100%). The mean ages of the participants in the four trials ranged from 25 to 39 years. There was a wide duration of symptoms, with the minimum duration of symptoms for trial inclusion ranging from one to six months. | ||||||
| Neuromuscular electrical stimulation (NMES) versus exercise for patellofemoral pain syndrome | ||||||
| Patient or population: people with patellofemoral pain syndrome Comparison: exercise (either isokinetic or isometric; data combined in the analyses) | ||||||
| Outcomes | Illustrative comparative risks* (95% CI) | Relative effect | No. of participants | Quality of the evidence | Comments | |
| Assumed risk | Corresponding risk | |||||
| Exercise | NMES | |||||
| Knee pain (short term: < 3 months) | See comment | See comment | Not estimable | ‐ | See comment | Not estimable |
| Knee pain (longer term: > 3 months) | See comment | See comment | Not estimable | ‐ | See comment | Not estimable |
| Knee function | The mean knee function in the study control group was | The mean knee function in the intervention groups was | MD ‐0.94 (‐2.10 to 0.22) | 94 | ⊕⊝⊝⊝ | |
| Knee function (longer term: > 3 months) | See comment | See comment | Not estimable | ‐ | See comment | Not estimable |
| Adverse events | See comment | See comment | Not estimable | ‐ | See comment | Not measured |
| *The basis for the assumed risk (e.g. the median control group risk across studies) is provided in footnotes. The corresponding risk (and its 95% confidence interval) is based on the assumed risk in the comparison group and the relative effect of the intervention (and its 95% CI). | ||||||
| GRADE Working Group grades of evidence | ||||||
| 1This very demanding schedule is unlikely to be found in clinical practice. | ||||||
| Outcome or subgroup title | No. of studies | No. of participants | Statistical method | Effect size |
| 1 Knee pain during activities (end of the treatment, single 15‐minute NMES session): VAS scale: 0 to 10; higher score = worse pain Show forest plot | 1 | Mean Difference (IV, Fixed, 95% CI) | Totals not selected | |
| 1.1 Pain during a single‐leg squat | 1 | Mean Difference (IV, Fixed, 95% CI) | 0.0 [0.0, 0.0] | |
| 1.2 Pain during a lateral step‐down | 1 | Mean Difference (IV, Fixed, 95% CI) | 0.0 [0.0, 0.0] | |
| Outcome or subgroup title | No. of studies | No. of participants | Statistical method | Effect size |
| 1 Knee pain (end of the treatment, 3 to 12 weeks): VAS scale: 0 to 10; higher score = worse pain Show forest plot | 3 | 118 | Mean Difference (IV, Fixed, 95% CI) | ‐1.63 [‐2.23, ‐1.02] |
| 2 Knee pain during activities (end of the treatment, 6 weeks): VAS scale: 0 to 10; higher score = worse pain Show forest plot | 1 | Mean Difference (IV, Fixed, 95% CI) | Totals not selected | |
| 2.1 Pain during step‐down | 1 | Mean Difference (IV, Fixed, 95% CI) | 0.0 [0.0, 0.0] | |
| 2.2 Pain during step‐up | 1 | Mean Difference (IV, Fixed, 95% CI) | 0.0 [0.0, 0.0] | |
| 2.3 Pain during squat | 1 | Mean Difference (IV, Fixed, 95% CI) | 0.0 [0.0, 0.0] | |
| 3 Knee function (end of the treatment, 3 and 6 weeks): Cincinnati Knee Rating System and LEFS; higher score = better function Show forest plot | 2 | 70 | Std. Mean Difference (IV, Fixed, 95% CI) | 0.37 [‐0.11, 0.84] |
| 4 Change score for KPS (end of treatment, 12 weeks) (0 to 100; higher score = better function) Show forest plot | 1 | Mean Difference (IV, Fixed, 95% CI) | Totals not selected | |
| 5 Good or normal muscle strength (end of the treatment, 6 weeks): grades 4 to 5 Lovett’s manual muscle scale Show forest plot | 1 | Risk Ratio (M‐H, Fixed, 95% CI) | Totals not selected | |
| 6 Muscle strength (end of the treatment, 12 weeks): isokinetic dynamometer (N) Show forest plot | 1 | Mean Difference (IV, Fixed, 95% CI) | Totals not selected | |
| 6.1 Isometric strength with 30° knee flexion | 1 | Mean Difference (IV, Fixed, 95% CI) | 0.0 [0.0, 0.0] | |
| 6.2 Isometric strength with 60° knee flexion | 1 | Mean Difference (IV, Fixed, 95% CI) | 0.0 [0.0, 0.0] | |
| Outcome or subgroup title | No. of studies | No. of participants | Statistical method | Effect size |
| 1 Knee function (end of the treatment, 4 weeks): Arpège function scale: 0 to 18; higher score = better function Show forest plot | 1 | Mean Difference (IV, Fixed, 95% CI) | Totals not selected | |
| 2 Muscle strength (end of the treatment, 4 weeks): isokinetic dynamometer (Nm) Show forest plot | 1 | Mean Difference (IV, Fixed, 95% CI) | Totals not selected | |
| 2.1 Isokinetic dynamometer at 30°/s | 1 | Mean Difference (IV, Fixed, 95% CI) | 0.0 [0.0, 0.0] | |
| 2.2 Isokinetic dynamometer at 300°/s | 1 | Mean Difference (IV, Fixed, 95% CI) | 0.0 [0.0, 0.0] | |
| Outcome or subgroup title | No. of studies | No. of participants | Statistical method | Effect size |
| 1 Knee pain (end of the treatment, 6 weeks): VAS scale: 0 to 10; higher score = worse pain Show forest plot | 1 | Mean Difference (IV, Fixed, 95% CI) | Totals not selected | |
| 1.1 Simultaneous versus sequential delivery | 1 | Mean Difference (IV, Fixed, 95% CI) | 0.0 [0.0, 0.0] | |
| 2 Knee function (end of the treatment, 6 weeks): KPS: 0 to 100 scale; higher score = better function Show forest plot | 2 | 88 | Mean Difference (IV, Fixed, 95% CI) | ‐1.16 [‐6.79, 4.47] |
| 2.1 Simultaneous versus sequential delivery | 1 | 14 | Mean Difference (IV, Fixed, 95% CI) | ‐5.90 [‐16.14, 4.34] |
| 2.2 Simultaneous versus fixed delivery | 1 | 74 | Mean Difference (IV, Fixed, 95% CI) | 0.90 [‐5.84, 7.64] |
| 3 Functional performance (end of the treatment, 6 weeks): number of steps up and down until pain Show forest plot | 1 | Mean Difference (IV, Fixed, 95% CI) | Totals not selected | |
| 3.1 Simultaneous versus sequential delivery | 1 | Mean Difference (IV, Fixed, 95% CI) | 0.0 [0.0, 0.0] | |
| 4 Quadriceps isometric muscle strength (end of the treatment, 6 weeks): dynamometer at 90°/s (Nm) Show forest plot | 2 | 88 | Mean Difference (IV, Fixed, 95% CI) | ‐1.15 [‐16.24, 13.94] |
| 4.1 Simultaneous versus sequential delivery | 1 | 14 | Mean Difference (IV, Fixed, 95% CI) | 3.40 [‐25.83, 32.63] |
| 4.2 Simultaneous versus fixed delivery | 1 | 74 | Mean Difference (IV, Fixed, 95% CI) | ‐2.80 [‐20.42, 14.82] |
| 5 Quadriceps isokinetic muscle strength (end of the treatment, 6 weeks): dynamometer at 90°/s (Nm) Show forest plot | 2 | 88 | Mean Difference (IV, Fixed, 95% CI) | ‐7.28 [‐24.45, 9.89] |
| 5.1 Simultaneous versus sequential delivery | 1 | 14 | Mean Difference (IV, Fixed, 95% CI) | 6.10 [‐30.70, 42.90] |
| 5.2 Simultaneous versus fixed delivery | 1 | 74 | Mean Difference (IV, Fixed, 95% CI) | ‐11.0 [‐30.41, 8.41] |