Transferencias de embriones frescos versus congelados en la reproducción asistida
Resumen
Antecedentes
Los tratamientos de fecundación in vitro (FIV) o de inyección intracitoplasmática de espermatozoides (ICSI) consisten convencionalmente en una transferencia de embriones en fresco, posiblemente seguida de una o más transferencias de embriones crioconservados en ciclos posteriores. Una opción alternativa es congelar todos los embriones adecuados y transferir los embriones crioconservados sólo en ciclos posteriores, lo que se conoce como la estrategia de "criotransferencia". Esta es la primera actualización de la revisión Cochrane sobre esta comparación.
Objetivos
Evaluar la efectividad y la seguridad de la estrategia de criotransferencia en comparación con la estrategia convencional de FIV/ICSI en mujeres sometidas a tecnología de reproducción asistida.
Métodos de búsqueda
Se realizaron búsquedas de estudios relevantes en el Registro de ensayos del Grupo Cochrane de Ginecología y fertilidad (Cochrane Gynaecology and Fertility Group), CENTRAL, MEDLINE, Embase, PsycINFO, CINAHL y dos registros de ensayos en curso desde su inicio hasta el 23 de septiembre de 2020, se verificaron las referencias de las publicaciones encontradas y se estableció contacto con los autores de los estudios para obtener datos adicionales.
Criterios de selección
Dos autores de la revisión, de forma independiente, seleccionaron los estudios para inclusión, evaluaron el riesgo de sesgo y extrajeron los datos de los estudios. Se incluyeron ensayos controlados aleatorizados que compararon una estrategia de "criotransferencia " con una estrategia convencional de FIV/ICSI que incluyó una transferencia de embriones frescos en mujeres sometidas a tratamiento de FIV o ICSI.
Obtención y análisis de los datos
Los desenlaces principales fueron la tasa de nacidos vivos y la tasa de síndrome de hiperestimulación ovárica (SHEO). Los desenlaces secundarios incluyeron desenlaces de efectividad (que incluyen la tasa de embarazo en curso y la tasa de embarazo clínico), el tiempo hasta el embarazo y desenlaces obstétricos, perinatales y neonatales.
Resultados principales
Se incluyeron 15 estudios en la revisión sistemática, y ocho estudios con 4712 mujeres en el metanálisis. La evidencia general fue de calidad moderada a baja. Se calificaron todos los desenlaces y la calidad se disminuyó debido al riesgo grave de sesgo, la imprecisión grave y la heterogeneidad grave no explicada. El riesgo de sesgo se asoció con el cegamiento poco claro de los investigadores a los desenlaces preliminares de los estudios durante los análisis intermedios, a errores en la unidad de análisis y a la falta de reglas adecuadas para la terminación de los estudios. Hubo falta de evidencia de calidad alta según los criterios GRADE para los desenlaces primarios, lo que se refleja en el lenguaje cauteloso que se utiliza a continuación.
Probablemente haya poca o ninguna diferencia en la tasa acumulada de nacidos vivos entre la estrategia de "criotransferencia" y la estrategia convencional de FIV/ICSI (odds ratio [OR] 1,08; IC del 95%: 0,95 a 1,22; I2 = 0%; ocho ECA, 4712 mujeres; evidencia de calidad moderada). Lo anterior indica que para una tasa acumulada de nacidos vivos del 58% luego de la estrategia convencional, la tasa acumulada de nacidos vivos luego de la estrategia de "criotransferencia" estaría entre el 57% y el 63%.
Las mujeres podrían desarrollar menos síndrome de hiperestimulación ovárica después de la estrategia de "criotransferencia" en comparación con la estrategia convencional de FIV/ICSI (OR 0,26; IC del 95%: 0,17 a 0,39; I2 = 0%; seis ECA, 4478 mujeres; evidencia de calidad baja). Estos datos indican que para una tasa de SHEO del 3% luego de la estrategia convencional, la tasa luego de la estrategia de "criotransferencia" sería del 1%.
Probablemente hay poca o ninguna diferencia entre las dos estrategias en cuanto a la tasa acumulada de embarazos en curso (OR 0,95; IC del 95%: 0,75 a 1,19; I2 = 31%; cuatro ECA, 1245 mujeres; evidencia de calidad moderada).
No fue posible analizar el tiempo hasta el embarazo; por diseño, el tiempo hasta el embarazo es más corto en la estrategia convencional que en la estrategia de "criotransferencia" cuando la tasa acumulada de nacidos vivos es comparable, ya que en la estrategia de "criotransferencia" la transferencia de embriones se retrasa. No existe certeza acerca de si las dos estrategias difieren en cuanto a la tasa acumulada de abortos espontáneos porque la evidencia es de calidad muy baja para este desenlace (OR de Peto 1,06; IC del 95%: 0,72 a 1,55; I2 = 55%; dos ECA, 986 mujeres; evidencia de calidad muy baja) ni para la tasa acumulada de embarazos múltiples (OR de Peto 0,88; IC del 95%: 0,61 a 1,25; I2 = 63%; dos ECA, 986 mujeres; evidencia de calidad muy baja). Los riesgos de trastornos hipertensivos del embarazo (OR de Peto 2,15; IC del 95%: 1,42 a 3,25; I2 = 29%; tres ECA, 3940 mujeres; evidencia de calidad baja), tener un recién nacido grande para la edad gestacional (OR de Peto 1,96; IC del 95%: 1,51 a 2.55; I2 = 0%; tres ECA, 3940 mujeres; evidencia de calidad baja) y un mayor peso al nacer de los recién nacidos (diferencia de medias [DM] 127 g; IC 95% 77,1 a 177,8; I2 = 0%; cinco ECA, 1607 recién nacidos únicos; evidencia de calidad moderada) pueden aumentar luego de la estrategia de "criotransferencia". No existe certeza acerca de si las dos estrategias difieren en cuanto al riesgo de tener un recién nacido pequeño para la edad gestacional porque la evidencia es de calidad baja (OR de Peto 0,82; IC del 95%: 0,65 a 1,05; I2 = 64%; tres ECA, 3940 mujeres; evidencia de calidad baja).
Conclusiones de los autores
Se encontró evidencia de calidad moderada que muestra que una estrategia probablemente no es superior a la otra en cuanto a la tasa acumulada de nacidos vivos y la tasa de embarazos en curso. El riesgo de SHEO puede disminuir con la estrategia de "criotransferencia". Sobre la base de los resultados de los estudios incluidos no fue posible analizar el tiempo hasta el embarazo. Es probable que sea más corto cuando se utiliza una estrategia convencional de FIV/ICSI con transferencia de embriones en fresco en el caso de una tasa acumulada de nacidos vivos similar, ya que en una estrategia de "criotransferencia" la transferencia de embriones se retrasa. El riesgo de trastornos hipertensivos maternos durante el embarazo, de tener un recién nacido grande para la edad gestacional y de que los recién nacidos tengan un mayor peso al nacer puede aumentar tras la estrategia de "criotransferencia". No existe certeza acerca de si la estrategia de "criotransferencia" reduce el riesgo de aborto espontáneo, la tasa de embarazo múltiple o de tener un recién nacido pequeño para la edad gestacional, en comparación con la FIV/ICSI convencional.
PICO
Resumen en términos sencillos
Transferencias de embriones frescos versus congelados para la reproducción asistida
Pregunta de la revisión
¿La estrategia de criotransferencia es segura y efectiva en los tratamientos de FIV e ICSI en comparación con los tratamientos convencionales de FIV e ICSI?
Antecedentes
Convencionalmente, los tratamientos de fecundación in vitro (FIV) o de inyección intracitoplasmática de espermatozoides (ICSI) consisten en una transferencia de embriones en fresco directamente después de la hiperestimulación ovárica, que se utiliza para recuperar los ovocitos en el procedimiento de FIV/ICSI. En el tratamiento convencional de FIV/ICSI, la transferencia de embriones frescos puede ir seguida de una o más transferencias de embriones congelados en ciclos posteriores, cuando se dispone de suficientes embriones. También se puede optar por la "criotransferencia" de los embriones adecuados y transferir los embriones congelados solo en ciclos posteriores, lo que también se conoce como la estrategia de "criotransferencia". En la estrategia de "criotransferencia" se congelan todos los embriones para transferirlos en un momento posterior en el que los ovarios no estén estimulados. Por lo tanto, este método podría reducir el riesgo de síndrome de hiperestimulación ovárica (SHEO, una reacción exagerada a los medicamentos para la fertilidad), ya que el SHEO es más grave cuando se produce el embarazo. Además, los estudios han indicado que la respuesta hormonal de la mujer a los medicamentos para la fertilidad podría afectar al revestimiento del útero y dificultar la implantación del embrión. Por lo tanto, podría ser beneficioso congelar los embriones y transferirlos más tarde, cuando el revestimiento del útero no esté afectado por los medicamentos para la fertilidad.
En la última década, un número cada vez mayor de clínicas ha aplicado la estrategia de "criotransferencia" como estrategia de tratamiento estándar en su práctica. En la práctica, la estrategia de "criotransferencia" y la estrategia convencional pueden variar desde el punto de vista técnico.
Se comparó la efectividad y seguridad de estas estrategias de tratamiento en mujeres sometidas a tecnología de reproducción asistida.
Características de los estudios
Se examinaron todos los estudios de investigación publicados en la literatura científica hasta el 23 de septiembre de 2020.
En la revisión se incluyeron 15 ensayos controlados aleatorizados (experimentos en los que cada persona tiene la misma posibilidad de ser elegida para recibir el tratamiento o un comparador). Fue posible combinar y analizar los resultados de ocho ensayos con 4712 mujeres.
Resultados clave
Es probable que haya poca o ninguna diferencia en la tasa acumulada de nacidos vivos y en la tasa de embarazos en curso entre la estrategia de "criotransferencia" y la estrategia convencional de FIV/ICSI. Los hallazgos indican que si la tasa acumulativa de nacidos vivos es del 58% después de una estrategia convencional de FIV/ICSI, la tasa después de una estrategia de criotransferencia estaría entre el 57% y el 63%. El hecho de no realizar una transferencia en fresco, como se hace en una estrategia de criotransferencia, podría reducir el riesgo de SHEO en las mujeres en riesgo. Estos hallazgos indican que si la tasa de SHEO es del 3% después de una estrategia convencional de FIV/ICSI, la tasa después de una estrategia de criotransferencia sería del 1%. No existe certeza acerca de si la estrategia de "criotransferencia " tiene algún efecto sobre el riesgo de aborto, la tasa de embarazo múltiple y el tiempo hasta el embarazo, en comparación con la FIV/ICSI convencional.
También se evaluaron las diferencias en los riesgos para la madre y el niño. La estrategia de "criotransferencia" puede aumentar el riesgo de trastornos hipertensivos del embarazo, el riesgo de tener un recién nacido grande para la edad gestacional y puede dar lugar a un mayor peso al nacer de los niños. Se necesita precaución al establecer conclusiones, ya que el análisis se basa en un número muy bajo de episodios.
Calidad de la evidencia
La evidencia fue de calidad moderada para la tasa acumulada de nacidos vivos y de calidad baja para los desenlaces de seguridad. La calidad baja se debió en general a la imprecisión grave en vista de los relativamente pocos episodios, a la heterogeneidad grave no explicada, que significa que los resultados entre los ensayos variaron ampliamente, y al riesgo de sesgo dentro de los ensayos incluidos.
Authors' conclusions
Summary of findings
| Fresh compared to frozen embryo transfer (cumulatively) in assisted reproduction | ||||||
| Patient or population: women undergoing assisted reproduction | ||||||
| Outcomes | Anticipated absolute effects* (95% CI) | Relative effect | № of participants | Quality of the evidence | Comments | |
|---|---|---|---|---|---|---|
| Risk with fresh and frozen embryo transfers | Risk with frozen embryo transfer only | |||||
| Live birth rate: cumulatively | 579 per 1000 | 589 per 1000 | OR 1.08 | 4712 | ⊕⊕⊕⊝ | |
| OHSS: per cycle with ovarian hyperstimulation | 33 per 1000 | 9 per 1000 | OR 0.26 | 4478 | ⊕⊕⊝⊝ | |
| Ongoing pregnancy rate: cumulatively | 508 per 1000 | 495 per 1000 | OR 0.95 | 1245 | ⊕⊕⊕⊝ | |
| Miscarriage rate: cumulatively | 118 per 1000 | 124 per 1000 | OR 1.06 | 986 | ⊕⊝⊝⊝ | |
| Multiple pregnancy rate: cumulatively | 156 per 1000 | 140 per 1000 | OR 0.88 | 986 | ⊕⊝⊝⊝ | |
| Time to pregnancy | Outcome could not be analysed. By design, time to pregnancy is shorter in the conventional strategy compared to the 'freeze all' strategy when the cumulative live birth rate is comparable, as embryo transfer is delayed in a 'freeze all' strategy. | |||||
| *The risk in the intervention group (and its 95% confidence interval) is based on the assumed risk in the comparison group and the relative effect of the intervention (and its 95% CI). | ||||||
| GRADE Working Group grades of evidence High quality: further research is very unlikely to change our confidence in the estimate of effect. Moderate quality: further research is likely to have an important impact on our confidence in the estimate of effect and may change the estimate. Low quality: further research is very likely to have an important impact on our confidence in the estimate of effect and is likely to change the estimate. Very low quality: we are very uncertain about the estimate. | ||||||
| aDowngraded one level due to serious risk of bias associated with lack of power calculation (unclear what determined end of study) and/or use of interim analysis that was calculated per transfer (unit of analysis error) with absence of adequate stopping rules (possible overestimation of treatment effect). | ||||||
| Fresh compared to frozen embryo transfers in assisted reproduction regarding pregnancy and neonatal outcomes (cumulatively and after first embryo transfer) | ||||||
| Patient or population: women undergoing assisted reproduction | ||||||
| Outcomes | Anticipated absolute effects* (95% CI) | Relative effect | № of participants | Quality of the evidence | Comments | |
|---|---|---|---|---|---|---|
| Risk with fresh and frozen embryo transfers | Risk with frozen embryo transfer only | |||||
| Hypertensive disorders of pregnancy: cumulatively | 26 per 1000 | 18 per 1000 | OR 0.70 | 782 | ⊕⊕⊝⊝ | |
| Hypertensive disorders of pregnancy: after first ET | 15 per 1000 | 31 per 1000 | OR 2.15 | 3940 | ⊕⊕⊝⊝ | |
| Large for gestational age (birth weight above 90th percentile): cumulatively | 10 per 1000 | 20 per 1000 | OR 1.97 | 782 | ⊕⊕⊝⊝ | |
| Large for gestational age (birth weight above 90th percentile): after first ET | 42 per 1000 | 79 per 1000 | OR 1.96 | 3940 | ⊕⊕⊝⊝ | |
| Small for gestational age (birth weight below 10th percentile): cumulatively | 46 per 1000 | 17 per 1000 | OR 0.36 | 782 | ⊕⊕⊝⊝ | |
| Small for gestational age (birth weight below 10th percentile): after first ET | 82 per 1000 | 68 per 1000 | OR 0.82 | 3940 | ⊕⊝⊝⊝ | |
| Birth weight of babies born: singletons | MD 127.4 g higher | ‐ | 1607 | ⊕⊕⊕⊝ | ||
| Birth weight of babies born: multiples | MD 49.5 g higher | ‐ | 804 | ⊕⊕⊝⊝ | ||
| *The risk in the intervention group (and its 95% confidence interval) is based on the assumed risk in the comparison group and the relative effect of the intervention (and its 95% CI). | ||||||
| GRADE Working Group grades of evidence High quality: further research is very unlikely to change our confidence in the estimate of effect. Moderate quality: further research is likely to have an important impact on our confidence in the estimate of effect and may change the estimate. Low quality: further research is very likely to have an important impact on our confidence in the estimate of effect and is likely to change the estimate. Very low quality: we are very uncertain about the estimate. | ||||||
| aDowngraded one level due to serious risk of bias associated with lack of power calculation (unclear what determined end of study) and/or use of interim analysis that was calculated per transfer (unit of analysis error) with absence of adequate stopping rules (possible overestimation of treatment effect). | ||||||
Background
Description of the condition
Subfertility is defined as the failure to conceive after 12 months of regular unprotected intercourse (Van Voorhis 2007; Zegers‐Hochschild 2017). One in six couples experience subfertility at least once during their reproductive lifetime, and approximately 10% of couples worldwide are subfertile (CDC 2016; ESHRE 2018). Common causes of infertility include poor semen quality, obstruction of the fallopian tubes or absence of ovulation (Hull 1985). Poor semen quality can manifest itself as low sperm concentration, as low as no sperm (azoospermia), low motility, or low numbers of sperm with normal morphology. Fallopian tubes can be blocked or damaged by infection, for example, chlamydia, or there can be adhesions of the tubes or ovaries caused by surgery, infection or endometriosis. Couples who fail to conceive naturally are diagnosed as having unexplained infertility if no cause can be found after standard fertility tests. Numbers of couples with unexplained fertility have increased recently, which may be due to an increase in older women undergoing ART. Also genetic and environmental factors might play a role in unexplained infertility.
Description of the intervention
Assisted reproductive technology (ART) has rapidly evolved as an intervention to improve pregnancy rates. It is now estimated that more than 8 million babies have been born worldwide with assisted reproduction since the first ART baby was born in 1978 (ESHRE 2018). ART involves the handling of gametes and embryos outside the human body and consists of in vitro fertilisation (IVF) with or without intracytoplasmic sperm injection (ICSI). After fertilisation, fresh transfer of the morphologically best embryo(s) into the uterine cavity is performed. Embryos suitable for transfer, but not transferred fresh, are cryopreserved for future use. If a woman does not get pregnant after the fresh transfer or has a wish for a second child the frozen embryo(s) can be thawed and transferred.
In some cases, pregnancy after a fresh embryo transfer can lead to ovarian hyperstimulation syndrome (OHSS). OHSS is characterised by a fluid shift from blood vessels to the abdominal cavity, resulting in, for example, abdominal bloating, high risk of clots within the blood vessels (thrombosis) and decreased blood supply to important organs such as kidneys and liver. Severe OHSS is potentially life‐threatening and can lead to lethal complications. The development of OHSS is mainly an iatrogenic side effect of the high doses of gonadotropin used for ovarian stimulation, resulting in multi‐follicular growth. Multiple follicles will in their turn produce vascular endothelial growth factor, which induces hyperpermeability of ovarian blood vessels, leading to a fluid shift from the intravascular to the third space. The administration of human chorionic gonadotrophin (hCG) can trigger OHSS. Moreover, the extra hCG rise accompanying (multiple) pregnancy after a fresh embryo transfer can aggravate already existing OHSS or induce late‐onset OHSS (Mourad 2017; Youssef 2016).
In order to reduce OHSS by avoiding fresh embryo transfer, in 2011 Devroey and colleagues promoted the option to 'freeze all' suitable embryos after IVF/ICSI treatment, and transfer cryopreserved embryos in subsequent cycles only, which is also known as the 'freeze all' strategy (Devroey 2011).
Recent technical improvements in cryopreservation have led to increased chances of embryo survival after thawing and subsequently increased pregnancy rates per cryopreserved embryo transfer (CDC 2016; ESHRE 2018; Wong 2014). In fact, pregnancy rates after cryopreserved embryo transfer are now almost equal to pregnancy rates after fresh transfer when calculated per transfer. This has fuelled the idea that the 'freeze all' strategy might increase the cumulative live birth rate. Therefore, the 'freeze all' strategy has become a strategy that possibly increases effectiveness in IVF/ICSI treatment, with safety not its only objective (Devroey 2011; Griesinger 2011; Maheshwari 2013; Mastenbroek 2011; Roque 2019).
How the intervention might work
In contrast to the conventional strategy, in a 'freeze all' strategy there are no fresh embryo transfers in the cycle with ovarian stimulation with exogenous gonadotropins, but only cryopreserved embryo transfers in subsequent cycles without ovarian stimulation. This avoids possible adverse effects of ovarian stimulation on the endometrial environment.
During ovarian stimulation for IVF/ICSI, the development of multiple follicles leads to elevated oestradiol (Kosmas 2004), and progesterone levels (Venetis 2013; Venetis 2015). This endocrine milieu may reduce endometrial receptivity for the implanting embryo (Bourgain 2003; Kolibianakis 2002; Roque 2017; Fatemi 2015; Venetis 2013; Venetis 2016). Studies on the molecular level comparing stimulated with unstimulated endometrium samples have shown distinct gene‐expression profiles between the two conditions (Haouzi 2009; Van Vaerenbergh 2009; Fatemi 2015). Transfer of cryopreserved embryos only would thus circumvent a possible negative effect of gonadotropins on the endometrium in the cycle with ovarian stimulation, and consequently increase live birth rates, the main outcome of interest to subfertile couples.
Ovarian stimulation with exogenous gonadotropins in IVF increases the risk of OHSS when a pregnancy occurs right after the ovarian stimulation. Avoiding a pregnancy in the cycle with ovarian stimulation by only transferring cryopreserved embryos in subsequent unstimulated cycles would eliminate or significantly reduce the risks of OHSS.
In order to evaluate the efficacy of the 'freeze all' strategy, we have to compare the 'freeze all' cumulative live birth rate with the conventional IVF/ICSI strategy cumulative live birth rate. Currently, some studies primarily compare live birth rate after first transfer. This possibly shows differences in outcome for a stimulated versus unstimulated uterus, although this does not take the number of embryos that were thawed for transfer into account. For women, the live birth rate per first transfer is less relevant, since at the same time of first transfer in a 'freeze all' strategy, they would already have received the second transfer in a conventional IVF/ICSI strategy. Considering the important perspective of time, it would only be fair to compare cumulative live birth rate between groups instead of live birth rate after first transfer (Zaat 2019).
Why it is important to do this review
An increasing number of clinics apply the 'freeze all' strategy as a standard treatment strategy in their practice (Pereira 2016; Pereira 2019). Data from the Centers for Disease Control and Prevention (CDC) in the USA indicate that there has been a very steep rise of the 'freeze all' strategy from almost none of the cycles in 2007 to 25% of all IVF/ICSI cycles in 2016 (CDC 2016). Data from the European Society of Human Reproduction and Embryology (ESHRE) from the European IVF‐monitoring Consortium, presented provisionally for 2015 at last year's Annual Meeting, also revealed strong growth in the number of 'freeze all' cycles (up 7% on the previous year), and accounting for 15% of all IVF cycles in 2015 (Focus on Reproduction 2019). The Human Fertilisation & Embryology Authority (HFEA) of the UK states that 'freeze all' cycles have increased by 39% since 2014 (Focus on Reproduction 2019).
However, despite its increasing use, the relative effectiveness and safety of IVF treatment with the 'freeze all' strategy compared to the conventional IVF/ICSI strategy is unclear. It is important to do this review in order to evaluate the effectiveness and safety of the 'freeze all' strategy compared to the conventional IVF/ICSI strategy including fresh embryo transfer in women undergoing ART.
The previous version of this Cochrane review included data from 1892 women comparing a 'freeze all' strategy with a conventional IVF/ICSI strategy. Concerning effectiveness, moderate‐quality evidence showed that one strategy is not superior to the other in terms of cumulative live birth rate. With respect to safety, low‐quality evidence suggested that not performing a fresh transfer lowers the OHSS risk for women at risk of OHSS (Wong 2017).
Objectives
To evaluate the effectiveness and safety of the 'freeze all' strategy compared to the conventional IVF/ICSI strategy in women undergoing assisted reproductive technology.
Methods
Criteria for considering studies for this review
Types of studies
We included published RCTs comparing the 'freeze all' strategy with the conventional IVF/ICSI strategy with fresh embryo transfer regardless of the context of the evaluation (OHSS or susceptibility of the endometrium). We excluded quasi‐ and pseudo‐randomised controlled trials. We excluded trials published only as abstracts. We planned to include cross‐over trials for completeness, but would only pool the data from the first phase in the meta‐analysis (Vail 2003).
Types of participants
All women undergoing IVF or ICSI irrespectively of the reason for 'freeze all', the infertility factor, age, ethnicity, number of previous IVF cycles, type of stimulation protocol and type of embryo transfer protocol.
Types of interventions
Trials comparing the 'freeze all' strategy with transfer of cryopreserved embryos only versus the conventional IVF/ICSI strategy with transfer of fresh and subsequent cryopreserved embryos until a live birth occurred or until all embryos from the initial cycle were transferred.
Types of outcome measures
Primary outcomes
-
Effectiveness: cumulative live birth rate per randomised woman. That is, the rate of live birth following the transfer of all (fresh or cryopreserved) embryos within the time horizon of the follow‐up defined by the authors of the original study
-
Safety: OHSS per randomised woman
Secondary outcomes
-
Cumulative ongoing pregnancy rate, defined as the number of ongoing pregnancies per woman randomised (demonstrated by the presence of a gestational sac with fetal heartbeat on ultrasound at 10 to 12 weeks of gestation)
-
Cumulative clinical pregnancy rate, defined as the cumulative number of clinical pregnancies per woman randomised (demonstrated by a pregnancy confirmed by ultrasonographic visualisation of one or more gestational sacs)
-
Time to pregnancy, defined as the time between randomisation and ongoing pregnancy
-
Pregnancy outcomes and obstetric, perinatal and neonatal outcomes per woman.
-
Ectopic pregnancy, defined as a pregnancy in which implantation takes place outside the uterine cavity
-
Miscarriage rate, defined as the spontaneous demise of a pregnancy before the fetus reaches viability. The term therefore includes all pregnancy losses from the time of conception until 24 weeks of gestation
-
Multiple pregnancy rate, defined as presence of more than one sac at early pregnancy ultrasound six to eight weeks' gestation
-
Gestational diabetes mellitus
-
Hypertensive disorders of pregnancy, comprising pregnancy‐induced hypertension (PIH), pre‐eclampsia (PE) and haemolysis, elevated liver enzymes, and low platelets in the blood (HELLP syndrome)
-
Preterm delivery, defined as delivery more than 24 and less than 37 weeks of gestational age
-
Perinatal and neonatal death, defined as stillbirths and the death of a newborn within 28 days after delivery
-
Neonatal hospitalisation, defined as admission for longer than three days or admission to the neonatal intensive care unit (NICU)
-
Large for gestational age, defined as birth weight above 90th percentile
-
Small for gestational age, defined as birth weight below 10th percentile
-
Congenital abnormalities per live‐born children, defined as the number of congenital abnormalities at birth per live‐born children plus number of foetuses therapeutically terminated
-
Birth weight of babies born, per baby
-
We also provide multiple pregnancy rate and miscarriage rate per clinical pregnancy.
As an additional analysis we calculated the live birth rate per woman after first embryo transfer only.
Search methods for identification of studies
We searched for all published randomised controlled trials on the 'freeze all' strategy, without language or date restriction and in consultation with the Cochrane Gynaecology and Fertility (CGF) Information Specialist.
Electronic searches
We searched the following electronic databases, trials registers, and websites from their inception to 23 September 2020 in consultation with the CGF Information Specialist:
-
Cochrane Gynaecology and Fertility Group Specialised Register, Procite platform (searched 23 September 2020; Appendix 1);
-
CENTRAL via the Cochrane Central Register of Studies Online (CRSO), Web platform (searched 23 September 2020; Appendix 2);
-
MEDLINE, Ovid platform (searched 1946 to 23 September 2020; Appendix 3);
-
Embase, Ovid platform (searched 1980 to 23 September 2020; Appendix 4);
-
PsycINFO, Ovid platform (searched 1806 to 23 September 2020; Appendix 5);
-
CINAHL, Ebsco platform (searched 1961 to 23 September 2020; Appendix 6).
Other electronic sources of trials included:
-
trials registers for ongoing and registered trials:
-
US National Institutes of Health Ongoing Trials Register ClinicalTrials.gov (clinicaltrials.gov/ct2/home; searched 23 September 2020; Appendix 7);
-
World Health Organization International Clinical Trials Registry Platform (WHO ICTRP) (www.who.int/trialsearch/Default.aspx; searched 23 September 2020; Appendix 8);
-
-
DARE (Database of Abstracts of Reviews of Effects) in the Cochrane Library for reference lists from relevant non‐Cochrane reviews (onlinelibrary.wiley.com/o/cochrane/cochrane_cldare_articles_fs.html);
-
PubMed (www.ncbi.nlm.nih.gov/pubmed/).
Searching other resources
We examined the reference lists of eligible articles and contacted study authors where necessary to obtain additional relevant data and handsearched relevant journals and conference abstracts that were not covered in the CGF Register.
Data collection and analysis
Selection of studies
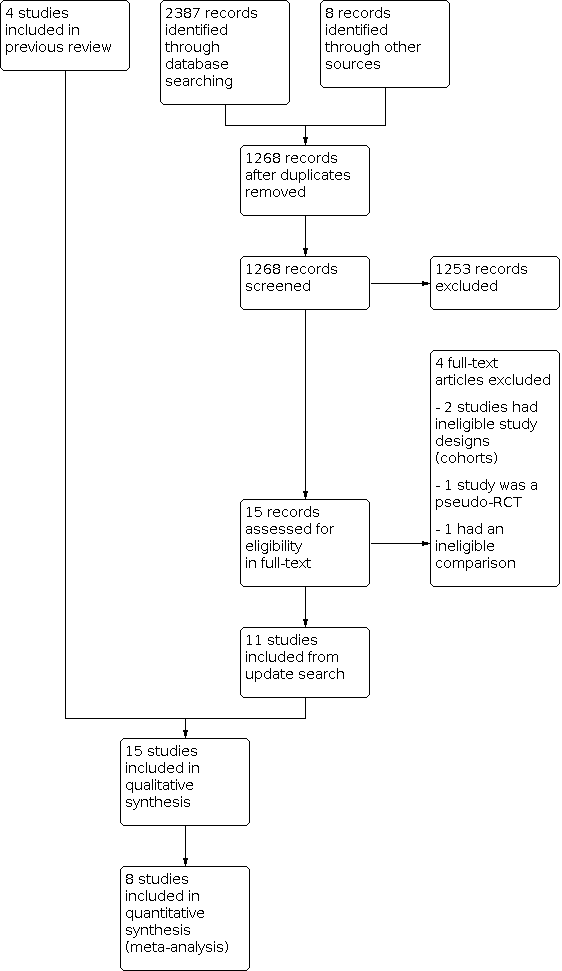
Two review authors (TZ and MZ) screened the titles and abstracts retrieved by the search and retrieved the full texts of all potentially eligible studies using Covidence. We independently examined these full‐text articles for compliance with the inclusion criteria and selected studies eligible for inclusion in the review. We corresponded with study investigators as required to clarify study eligibility. We resolved any disagreements about study eligibility by discussion or by consulting a third review author (SM). We documented the selection process with a PRISMA flow chart (Moher 2009; Figure 1).
Data extraction and management
Two review authors (TZ and MZ) independently extracted data from the eligible studies using a data extraction form designed and pilot‐tested by the review authors. We resolved any discrepancies by discussion. The data extraction forms included methodological quality and allocation information. We included this information in the review and presented it in the Characteristics of included studies and Characteristics of excluded studies tables.
We corresponded with study investigators to request further data on methods or results, or both, as required. Whenever we did not receive a response within six weeks we sent a reminder email to the study authors.
Assessment of risk of bias in included studies
Two review authors (TZ and MZ) independently assessed the included studies for risk of bias using the Cochrane 'Risk of bias' assessment tool for the following domains (Higgins 2011).
Sequence generation
We allocated a low risk of bias if the investigators described a random component in the sequence generation process, such as:
-
using a computerised random number generator;
-
using a random numbers table.
Allocation concealment
We allocated a low risk of bias if the participants and investigators enrolling participants could not foresee assignment because one of the following, or an equivalent method, was used to conceal allocation:
-
central computer randomisation;
-
serially numbered, sealed, opaque envelopes.
Blinding
In this study design it was not possible to blind participants and clinicians and therefore the risk of performance bias will be low.
Completeness of outcome data
We allocated a low risk of bias if there were no missing data, which meant live birth rate and length of follow‐up were stated, loss to follow‐up was accounted for, and an intention‐to‐treat analysis had been carried out.
Selective outcome reporting
We allocated a low risk of bias if all of the study's primary, secondary, and additional outcomes that were of interest in the review had been reported in a prespecified way.
Other sources of bias
We allocated a low risk of bias if the study:
-
was free of commercial funding;
-
had no other source of bias identified (e.g. imbalance in prognostic factors at baseline).
Two review authors (TZ and MZ) assessed these domains and resolved any disagreements by consensus or by consulting a third review author (SM). We described the judgements and presented the conclusions in the 'Risk of bias' figures. We took into account all judgements in the interpretation of review findings.
Measures of treatment effect
For dichotomous data (e.g. live birth rates), we used the numbers of events in the 'freeze all' strategy and in the conventional IVF/ICSI strategy group of each study to calculate Mantel‐Haenszel odds ratios (ORs) with 95% confidence intervals (CI). We used Peto ORs where the event was very rare (less than 1%) or in the case of zero cell counts. For continuous data (e.g. birth weight), we calculated mean difference (MD) between treatment groups provided that the same measure was used. We reversed the direction of effect of individual studies if required to ensure consistency across studies. We treated ordinal data as continuous data. Where data to calculate ORs or MDs were not available, we utilised the most detailed numerical data available that would facilitate similar analyses of included studies (e.g. test statistics, P values). We compared the magnitude and direction of effect reported by studies with how they were presented in the review, taking into account legitimate differences.
We planned to analyse the outcome 'time to pregnancy' using hazard ratios (HRs). However, data were insufficient to conduct these analyses. Should more data become available in the future, we will conduct HR analyses of time to pregnancy in later updates of this review.
Unit of analysis issues
We performed the analyses with data per woman randomised, apart from birth weight, which we analysed per baby. If data of the primary analysis were reported per embryo, per oocyte, per cycle, or per transfer, we contacted the authors of the studies for per‐woman data for completeness.
We counted reported multiple live births as one live birth event.
We planned to include only first‐phase data from cross‐over trials.
We also performed secondary analyses for multiple pregnancy, miscarriage, pregnancy complications, and birth weight per pregnancy since these conditions only occur in pregnant women.
Dealing with missing data
We analysed the data on an intention‐to‐treat basis. In case of missing data we contacted authors of studies to request more data.
We assumed that live births had not occurred in women without a reported outcome. If studies reported sufficient detail to calculate MDs, but provided no information on associated standard deviations (SD), we assumed that the outcome had a SD equal to the highest SD from other studies within the same analysis.
Assessment of heterogeneity
We considered heterogeneity when the clinical and methodological characteristics of the included studies were sufficiently similar for a meta‐analysis to provide a clinically meaningful summary. We performed statistical analyses in accordance with the guidelines developed by Cochrane (Deeks 2020). We assessed heterogeneity between the results of different studies by the I2 statistic (Higgins 2003), considering an I2 value greater than 50% to indicate substantial heterogeneity (Deeks 2020).
Assessment of reporting biases
We aimed to minimise the potential impact of publication and reporting biases by performing a comprehensive search for eligible studies and looking for duplication of data. We planned to perform a funnel plot to investigate the possibility of small‐study effects if we included 10 or more studies in an analysis.
If included studies reported neither the primary outcome measure of live birth nor interim outcomes such as clinical pregnancy, we undertook informal assessment as to whether studies reporting the primary outcome measures reflected typical findings for the interim outcomes. We considered within‐study reporting bias by looking at the protocols.
We addressed the assessment of reporting biases in the Risk of bias in included studies section of the Results.
Data synthesis
We used Review Manager 5 software to perform the meta‐analyses with a fixed‐effect model to calculate pooled ORs and 95% CIs (Review Manager 2020).
To aid interpretation, we translated findings for primary outcomes to absolute risks, expressed as percentages based on the 95% CIs. We combined results for continuous outcomes using MDs.
Prospectively, we planned to present the analyses as:
-
cumulative live birth rates for conventional IVF cycles and 'freeze all' cycles;
-
OHSS rate for conventional IVF cycles and 'freeze all' cycles;
-
cumulative rate for secondary outcomes for conventional IVF cycles and 'freeze all' cycles;
-
time to pregnancy.
We included an additional table (Table 1) with pregnancy and live birth rates for one IVF/ICSI cycle after the first cryopreserved embryo transfer in the 'freeze all' strategy versus one IVF/ICSI cycle after the first fresh embryo transfer in the conventional IVF/ICSI strategy. In the current literature it is usual to report on outcomes only after the first cryopreserved embryo transfer, but this comparison could easily result in the wrong conclusion (Zaat 2019).
| Outcome | Number of studies | Number of participants | Analysis method | OR |
|---|---|---|---|---|
| Live birth ratea after first embryo transfer for all embryo stages of transfer | 13 | 7766 | Odds ratio (Mantel‐Haenszel, fixed‐effect, 95% confidence interval) | 1.17 (95% CI 1.06 to 1.28) |
aLive birth rate calculated after first transfer is added for illustrative purposes as this comparison is often reported in the literature. It possibly shows differences in outcome for a stimulated and an unstimulated uterus, although this does not take into account the number of embryos that were thawed for transfer. This outcome is less relevant for women undergoing treatment since at the same time of first transfer in a freeze‐all strategy, they would already have received the second transfer (as long as there was a sufficient number of embryos) in a conventional strategy that includes fresh transfer. Here, one could consider the result of the first embryo transfer in the frozen group against the combined outcomes of the fresh transfer and the first frozen‐thawed‐transfer in the fresh group. Therefore cumulative live birth rate is the relevant outcome for women.
For the calculated live birth rate after the first embryo transfer, we included the eight studies included for the primary outcome (Chen 2016; Ferraretti 1999; Santos‐Ribeiro 2020; Shapiro 2011a; Shapiro 2011b; Vuong 2018; Wei 2019; Wong 2021) and five additional RCTs: Aflatoonian 2018; Aghahosseini 2017; Coates 2017; Shi 2018; Stormlund 2020. We contacted the authors for additional information regarding cumulative data by email but we did not receive a response.
Aflatoonian 2018 compared live birth rate after the first embryo transfer between a freeze‐all strategy and a conventional strategy in high responders at risk for developing OHSS. Aghahosseini 2017 included infertile women who were candidates for an in vitro fertilisation (IVF) treatment with no further specification of age or type of responder. Coates 2017 excluded women with a suspected decreased ovarian reserve (based on serum follicle‐stimulating hormone and anti‐Müllerian hormone. Women in both groups underwent IVF with assisted hatching and pre‐implantation genetic screening. Shi 2018 compared live birth rate after the first embryo transfer between a freeze‐all strategy and a conventional strategy in young women with a regular menses and the reason for IVF procedure: tubal factor, male factor, or both. Stormlund 2020 compared live birth rate after the first embryo transfer between a freeze‐all strategy and a conventional strategy in young women with a regular menses and the reason for IVF procedure: male, tubal, uterine, or unexplained infertility.
Subgroup analysis and investigation of heterogeneity
We had planned to perform subanalyses on timing of cryopreservation (e.g. day of embryo development) and method of cryopreservation (e.g. slow freezing or vitrification). However, data were insufficient to conduct all planned subgroup analyses. Should more data become available in the future, we will conduct additional subgroup analyses in later updates of this review.
Sensitivity analysis
We conducted sensitivity analyses for the primary outcomes (cumulative live birth rate and OHSS). These analyses included consideration of whether the review conclusions would have differed if:
-
eligibility was restricted to studies without high risk of bias;
-
a random‐effects model had been adopted;
-
the summary effect measure was risk ratio rather than OR.
Summary of findings and assessment of the certainty of the evidence
We prepared a 'Summary of findings' table using GRADEpro GDT software and following Cochrane methods (Schünemann 2020). This table evaluates the overall quality of the body of evidence for the main review outcomes. Two review authors independently evaluated the overall quality of the evidence for the outcomes (live birth, OHSS, multiple pregnancy, miscarriage, pregnancy complications and time to pregnancy) using GRADE criteria (study limitations such as risk of bias, consistency of effect, imprecision, indirectness, and publication bias). We justified, documented, and took into account judgements about evidence quality (high, moderate, low, or very low) in the results for each outcome.
Results
Description of studies
Results of the search
Results of the previous search
Our searches on 14 November 2016 revealed 2401 reports, of which 785 were duplicates, leaving 1622 reports. After screening the title and abstract, we found 12 reports to be potentially eligible, and retrieved these reports in full text.
In the first version of our review (Wong 2017), we included four studies (Chen 2016; Ferraretti 1999; Shapiro 2011a; Shapiro 2011b). We excluded four studies: (Absalan 2013; Aflatoonian 2010; Boostanfar 2016; Yang 2015)). We classified one study as awaiting assessment because it did not clearly report the methods it used (Chandel 2016).
For the previous version of the review, we contacted the authors of three included studies reporting on the primary outcomes Ferraretti 1999; Shapiro 2011a; Shapiro 2011b and one excluded study, Absalan 2013, for missing data. We asked the study authors about these missing data and about bias (e.g. randomisation and blinding). One author did not reply to our request for information (Absalan 2013). The remaining authors very kindly responded to our request for additional information, and we were able to include these data in our analysis.
Results of the current search
Our searches on 23 September 2020 revealed 2395 reports, of which 1127 were duplicates, leaving 1268 reports. After screening the title and abstract, we found 13 reports to be potentially eligible, and retrieved these reports in full text.
We excluded three studies: one we considered not properly randomised (Magdi 2017); one randomised women to a different intervention that was not clear from the abstract (Simon 2020); and one was not the correct study design, which was not clear from the abstract screening (Beyer 2016).
Six studies were ongoing and awaiting data (ACTRN12612000422820; ACTRN12616000643471; ISRCTN61225414; NCT02133950; NCT02570386; NCT03349905).
We contacted the authors of five studies (Aflatoonian 2018; Aghahosseini 2017; Coates 2017; Shi 2018; Stormlund 2020), included in the additional analysis regarding live birth rate after first embryo transfer for cumulative live birth rate. None of the study authors responded to our request for this additional information.
We included 11 new randomised controlled trials (RCTs) in the update.
We reassessed Chandel 2016, which was awaiting assessment from the previous version of the review (Wong 2017). We have excluded this study because we did not consider it to be properly randomised.
The current review includes 15 studies in total: four studies from the first version of the review (Chen 2016; Ferraretti 1999; Shapiro 2011a; Shapiro 2011b), and 11 new studies (Aflatoonian 2018; Aghahosseini 2017; Coates 2017; Santos‐Ribeiro 2020; Shapiro 2016; Shi 2018; Stormlund 2020; Vuong 2018; Wei 2019; Wong 2021; Zhang 2018). We included eight studies in the meta‐analyses, which are the eight primary reports of the RCTs (Chen 2016; Ferraretti 1999; Santos‐Ribeiro 2020; Shapiro 2011a; Shapiro 2011b; Vuong 2018; Wei 2019; Wong 2021).
See the study flow diagram (Figure 1) and study tables (Characteristics of included studies; Characteristics of excluded studies; Characteristics of ongoing studies).
Included studies
Study design and setting
Of the 15 studies included in the systematic review, eight were the primary reports of the RCTs and had data on primary and secondary outcomes and therefore included in the meta‐analysis. Six of these eight were single‐centre studies, conducted in reproductive medical centres in Belgium, Italy, the Netherlands, USA and Vietnam (Ferraretti 1999; Santos‐Ribeiro 2020; Shapiro 2011a; Shapiro 2011b; Vuong 2018; Wong 2021), and two were multicentre studies conducted in reproductive medical centres throughout China (Chen 2016; Wei 2019).
We included two studies for secondary outcomes (Shapiro 2016; Zhang 2018). Both studies are follow‐up studies of included RCTs. Shapiro 2016 reports on the follow‐up data of Shapiro 2011a and Shapiro 2011b. Zhang 2018 reports on the follow‐up data of Chen 2016.
Thirteen studies supplied data for the additional analysis – live birth after a first embryo transplant (Aflatoonian 2018; Aghahosseini 2017; Chen 2016; Coates 2017; Ferraretti 1999; Santos‐Ribeiro 2020; Shapiro 2011a; Shapiro 2011b; Shi 2018; Stormlund 2020; Vuong 2018; Wei 2019; Wong 2021).
Participants
The eight studies reporting on the primary outcome enrolled a total of 4712 women, with 2342 women undergoing the 'freeze all' strategy and 2370 women undergoing the conventional IVF/ICSI strategy with fresh embryo transfer.
Ferraretti 1999 and Santos‐Ribeiro 2020 evaluated the 'freeze all' strategy in the context of prevention of OHSS. Shapiro 2011a; Shapiro 2011b; Vuong 2018; Wei 2019 and Wong 2021 evaluated the 'freeze all' strategy in the context of an offered approach to improve susceptibility of the endometrium. Chen 2016 evaluated the 'freeze all' strategy in the context of both an offered approach to improve susceptibility of the endometrium and prevention of OHSS.
The inclusion criteria of the two Shapiro studies were based on the number of antral follicles observed at baseline ultrasound examination: Shapiro 2011a included normal responders (8 to 15 antral follicles), and Shapiro 2011b included high responders (> 15 antral follicles). Ferraretti 1999 included women at risk of developing OHSS, based on level of estradiol (E2) and number of retrieved eggs (≥ 15 oocytes). Santos‐Ribeiro 2020 included women with an excessive response to ovarian stimulation (≥ 18 follicles measuring ≥ 11 mm on the day of the GnRH triggering). Chen 2016 included women with polycystic ovary syndrome. Vuong 2018 and Wei 2019 included women without polycystic ovary syndrome. Wong 2021 included women with any IVF indication, independent of the number of follicles or available embryos.
In all studies, the baseline characteristics were comparable between the two strategies.
The ages of the women included by Shapiro 2011a and Shapiro 2011b ranged from 18 to 41 years. The mean age for the women included in Ferraretti 1999 ranged from 31.4 to 31.6 years. Women in Chen 2016 were between the ages of 20 and 34 years. The mean age of women in Vuong 2018 was 32 years. In Wei 2019 the mean age of the participants was 28.8 years. The mean age for the women included in Santos‐Ribeiro 2020 ranged from 30.4 to 31.2 years. The mean age for the women included in Wong 2021 ranged from 35.1 to 35.2 years.
For details about the extra studies used for additional analysis (Aflatoonian 2018; Aghahosseini 2017; Coates 2017; Shi 2018; Stormlund 2020), see Characteristics of included studies.
Interventions
In Chen 2016, women received recombinant FSH at a daily dose of 112.5 IU for those weighing less than 60 kg and 150 IU for those weighing over 60 kg starting on day 2 or 3 of the menstrual cycle. This was adjusted following ovarian response. hCG could be added when considered appropriate. On the day of oocyte retrieval, women had to have more than 3 and fewer than 30 oocytes with a low risk of OHSS to be randomised. Intramuscular progesterone at a daily dose of 80 mg was administered for luteal‐phase support in the fresh‐transfer group. Embryos were cryopreserved at day 3 of development. Oral oestradiol valerate was used for endometrial preparation on day 2 or 3 of the second menstrual cycle after oocyte retrieval. Intramuscular progesterone (80 mg/day) was added when endometrial thickness reached 8 mm or more or at the physician’s discretion. On day 4 of progesterone administration, two day‐3 frozen embryos were thawed and transferred. Luteal‐phase support with oestradiol valerate and intramuscular progesterone for endometrium preparation continued until 10 weeks after conception.
Women in Ferraretti 1999 received a down‐regulation protocol with gonadotropin‐releasing hormone (GnRH) analogue (0.3 mg subcutaneous buserelin acetate (Suprefact) twice a day) and ovarian stimulation with urinary gonadotropin (4 ampoules of follicle‐stimulating hormone (FSH) on the first and second days of treatment, and 2 ampoules of FSH plus 2 ampoules of human menopausal gonadotropins on the third and fourth treatment days). This was followed by an adjusted dosage of gonadotropins according to the individual response measured by plasma concentration of E2 and follicular growth assessed by ultrasound (Ferraretti 1996). Human chorionic gonadotropin (hCG) was administered 34 to 36 hours before follicle aspiration followed by 20 g of intravenous albumin. Embryos were frozen at the pronuclear stage. All embryos were transferred at the early cleavage stage (day 3) in artificial cycles. The artificial cycle treatment included oral administration of oestradiol valerate, 2 mg daily for the first 5 days of the cycle; 4 mg/day from day 6 to day 10; 6 mg/day from day 11 to day 13; then 4 mg/day from day 14 onward. On day 15 of the cycle, 50 mg of progesterone in oil was administered daily, and on day 17 the dose was increased to 100 mg/day.
In women in Santos‐Ribeiro 2020, ovarian stimulation commenced after confirmation that the woman was not pregnant and that she had basal serum levels of estradiol (< 80 pg/mL) and progesterone (< 1.5 ng/mL). Treating physicians decided which exogenous gonadotropins should be used according to the woman’s profile and preference, including either recombinant FSH (Gonal‐FVR or Puregon) or highly purified urinary human menopausal gonadotropins (MenopurVR). All women included underwent exogenous ovarian stimulation using GnRH antagonist suppression from day 6 of stimulation onwards with daily injections of either ganirelix or cetrorelix. Final oocyte maturation was triggered with 0.2 mg triptorelin as soon as at least three follicles of larger than 17 mm were observed. A GnRH agonist was the preferred triggering agent for both groups in order to avoid the elevated risk of OHSS associated with hCG triggering in high responders. Oocyte retrieval was performed approximately 36 hours after the GnRH agonist administration. In the fresh transfer arm, following oocyte retrieval, intensified luteal phase support was provided with a single administration of 1500 IU of exogenous hCG approximately one hour after oocyte retrieval followed by 200 mg of vaginal micronized progesterone (UtrogestanVR) three times a day plus 2 mg of oral estradiol valerate (ProgynovaVR) twice daily. The embryo transfer was performed on day 3 or 5 of development with preference to the latter whenever at least four good‐quality embryos were available on day 3. The choice to transfer one or two embryos was decided by the clinician at consultation prior to commencing the ART treatment, mainly depending on the woman’s age and the number of embryos replaced in the previous treatment cycles, according to Belgian law. All remaining good‐quality embryos were vitrified. In the 'freeze all' arm, no fresh luteal phase support was provided following oocyte retrieval. Instead, all viable embryos were vitrified, preferably at blastocyst stage (day 5 or 6), according to the same, before‐mentioned threshold of good‐quality embryos available on day 3. Women started with exogenous hormone therapy for endometrial preparation in the next cycle. This therapy was initiated only after confirmation that the woman had basal serum levels of estradiol/progesterone and consisted of 2 mg of oral estradiol valerate (ProgynovaVR ) twice daily for seven days followed by three times a day for another six days. Endometrial development was assessed using ultrasound and if the endometrium was 7 mm or more, 200 mg of vaginal Utrogestan three times a day was added to the treatment scheme. The frozen embryo transfer was scheduled according to the developmental stage of the embryo.
In Shapiro 2011a and Shapiro 2011b, women received down‐regulation with a GnRH antagonist and a combination of recombinant FSH and highly purified urinary FSH. hCG was administered 34 to 36 hours prior to follicle aspiration. In those women with greater ovarian response, 4 mg leuprolide acetate was added concomitant to the hCG. Embryos were vitrified at the pronuclear stage. All embryos were transferred as blastocysts in artificial cycles. Women with fresh embryo transfers received 6.0 mg daily E2 and daily progesterone injections (100 mg), with progesterone supplementation beginning one to two days after follicle aspiration and E2 initiated as needed. Women with cryopreserved embryo transfers were down‐regulated with leuprolide acetate in a subsequent cycle and received oral 6.0 mg daily E2 and E2 patches as needed starting 10 to 14 days before thawing to achieve a target endometrial thickness of at least 8 mm. Daily progesterone injections (typically 100 mg) were started the day before thawing. In both groups, E2 and progesterone supplements were adjusted as needed to sustain serum levels of at least 200 pg/mL and 15 ng/mL, respectively, until increasing serum levels indicated placental production, at 9 to 10 weeks’ gestation.
Women in Vuong 2018 underwent ovarian hyperstimulation according to the protocol for the use of FSH and GnRH antagonists. The dose of recombinant FSH ranged from 150 to 300 IU per day, depending on the woman’s age, anti‐Müllerian hormone levels, and response to FSH in any prior IVF cycle. When the mean diameter of at least two leading follicles was 17 mm, 250 μg of recombinant hCG was administered, and oocyte retrieval was performed 36 hours later. Embryos were cryopreserved at day 3 of development. In the following cycle, the endometrium was prepared with the use of oral estradiol valerate at a dose of 8 mg per day, starting on the second or third day of the menstrual cycle. Endometrial thickness was monitored from day 6 onward, and vaginal progesterone at a dose of 800 mg per day was started when the endometrial thickness reached 8 mm or more. A maximum of two embryos of grade 1 or 2 were thawed on the day of embryo transfer, three days after the start of progesterone. Luteal‐phase support with oestradiol valerate and vaginal progesterone for endometrium preparation continued until seven weeks after conception.
In Wei 2019 women were given GnRH antagonist (ganirelix) regimen for ovarian stimulation. Recombinant FSH (Puregon) was started on day 1 to 3 of the menstrual cycle. When at least two follicles were 18 mm or greater in mean diameter, hCG at a dose of 4000 IU to 10000 IU was administered to induce the final maturation of oocytes. Oocyte retrieval was done 34 hours to 36 hours after hCG injection. Luteal phase support was started from the day of oocyte retrieval with vaginal progesterone gel (Crinone) 90 mg per day and oral dydrogesterone (Duphaston) 10 mg twice daily. On day 3 of embryo culture, embryos were graded by morphological criteria. Women who had four or more high‐grade embryos were randomly assigned to the fresh or frozen blastocyst transfer group. In the 'freeze all' group, luteal phase support was stopped after randomisation. On day 3, embryos were removed from cleavage media and replaced in blastocyst media. All blastocysts were vitrified on day 5 or day 6 according to embryo development. At least 4 weeks later, the endometrium was prepared either with a natural cycle regimen or artificial cycle regimen, at the discretion of local investigators. For the natural ovulatory cycle regimen, ovulation was determined by ultrasound monitoring. Oral dydrogesterone (Duphaston) 10 mg three times daily was administered for luteal phase support after ovulation. A single cryopreserved blastocyst was transferred on the fifth day after ovulation. If pregnancy was achieved, luteal phase support was continued until 10 weeks’ gestation. For the artificial cycle regimen, oral oestradiol valerate (Progynova) at a dose of 4 mg to 8 mg daily was started on day 1 to 3 of the menstrual cycle. Vaginal progesterone gel (Crinone) 90 mg per day and oral dydrogesterone 10 mg twice daily were added when the endometrial thickness reached 7 mm or more. A single frozen‐thawed blastocyst was transferred on the fifth day after progesterone initiation. If pregnancy was achieved, oral oestradiol valerate was continued until eight weeks’ gestation, and vaginal progesterone gel and oral dydrogesterone were continued until 10 weeks’ gestation.
Women in Wong 2021 underwent pituitary downregulation with a long GnRH agonist protocol with or without oral contraceptive pill pre‐treatment. Ovarian stimulation was conducted with human menopausal gonadotrophin (Menopur) or recombinant FSH (Puregon or Gonal‐F) in women with polycystic ovary syndrome starting from the seventh day without oral contraceptive pill pre‐treatment. The starting dose depended on the antral follicle count. Ovarian stimulation was continued until three or more follicles with a diameter of 18 mm had developed. Ovulation was triggered with 5000 or 10,000 IU hCG (Pregnyl). A single embryo transfer was performed for women below 38 years of age and a double embryo transfer policy for women of 38 years of age and above, if two or more embryos were available. Embryos were cryopreserved on day 6 of culture. Women started with oral oestrogen supplementation of 6 mg daily on the first day of their first menstruation after the follicular aspiration. If the endometrium had reached 8 mm, women started vaginal progesterone of 600 mg daily and continued the oral oestrogen. At the seventh day of vaginal progesterone administration, the cryopreserved embryo transfer was performed. If pregnancy occurred, oestrogen and progesterone supplementation was continued until the eleventh week of gestation.
Outcomes
Data were extracted from study reports or provided by authors for the following outcomes.
Primary outcomes
-
Effectiveness: cumulative live birth rate per woman. Two studies did not report on live birth in their published article (Shapiro 2011a; Shapiro 2011b), but we were able to obtain these data by personal communication with the study authors. One study did not report on live birth rate after the first embryo transfer (Ferraretti 1999), but we were able to obtain these data by personal communication with the study authors. Chen 2016; Santos‐Ribeiro 2020; Vuong 2018; Wei 2019 and Wong 2021 reported these data. Five studies did not report on cumulative live birth rate but only on live birth rate after the first embryo transfer (Aflatoonian 2018; Aghahosseini 2017; Coates 2017; Shi 2018; Stormlund 2020). We contacted the authors for cumulative live birth rate but did not receive any response. We used these studies in the additional analysis on live birth rate per woman after the first embryo transfer.
-
Safety: OHSS. Two studies reported OHSS per woman if hospitalisation was required (Ferraretti 1999; Wong 2021). Two studies did not report on OHSS (Shapiro 2011a; Shapiro 2011b), but we were able to obtain these data by personal communication with the study authors. However, we did not include the data from these two studies in the analysis, as women with high risk of OHSS were excluded and received the 'freeze all' strategy as standard. Chen 2016; Santos‐Ribeiro 2020; Vuong 2018; Wei 2019 and Wong 2021 reported these data.
Secondary outcomes
-
Four studies reported ongoing pregnancy rate determined at 10 to 12 weeks of gestational age (Shapiro 2011a; Shapiro 2011b; Vuong 2018; Wong 2021).
-
Four studies reported cumulative clinical pregnancy rate (Ferraretti 1999; Santos‐Ribeiro 2020; Vuong 2018; Wong 2021).
-
Four of the studies reported time to pregnancy, each in a different way. Santos‐Ribeiro 2020 reported the mean time from randomisation to detection of clinical pregnancy after the first embryo transfer and the overall cumulative time to clinical pregnancy; Vuong 2018 reported on the median time to conception; Wei 2019 reported on the time to live birth; and Wong 2021 reported on the time to ongoing pregnancy.
-
The following studies reported obstetric, perinatal and neonatal complications per woman.
-
Two studies reported on cumulative ectopic pregnancy rate (Vuong 2018; Wong 2021). Five studies reported ectopic pregnancy after first embryo transfer (Chen 2016; Ferraretti 1999; Santos‐Ribeiro 2020; Vuong 2018; Wei 2019).
-
Two studies reported on cumulative miscarriage rate (Vuong 2018; Wong 2021). All eight studies reported the number of miscarriages after first embryo transfer (Chen 2016; Ferraretti 1999; Santos‐Ribeiro 2020; Shapiro 2011a; Shapiro 2011b; Vuong 2018; Wei 2019; Wong 2021).
-
Two studies reported on cumulative multiple‐pregnancy rate (Vuong 2018; Wong 2021). Five studies reported multiple‐pregnancy rate after first embryo transfer (Chen 2016; Shapiro 2011b; Vuong 2018; Wei 2019; Wong 2021).
-
One study reported on cumulative diabetes mellitus rate (Vuong 2018). Three studies reported on gestational diabetes mellitus after first embryo transfer (Vuong 2018; Wei 2019; Zhang 2018).
-
One study reported on cumulative rate of hypertensive disorders of pregnancy (Vuong 2018). Three studies reported on hypertensive disorders of pregnancy after first embryo transfer (Chen 2016; Vuong 2018; Wei 2019).
-
Two studies reported on cumulative rate of preterm delivery (Vuong 2018; Wong 2021). Three studies reported on preterm delivery after first embryo transfer (Chen 2016; Vuong 2018; Wei 2019).
-
Only one study reported on cumulative rate of perinatal and neonatal death (Vuong 2018). Two studies reported on perinatal and neonatal death after first embryo transfer (Chen 2016; Vuong 2018).
-
One study reported on cumulative rate of neonatal hospitalisation (Vuong 2018). Three studies reported on neonatal hospitalisation after first embryo transfer (Vuong 2018; Wei 2019; Zhang 2018).
-
One study reported on cumulative rate of large for gestational age (Vuong 2018). Three studies reported on the rate of babies who were large for gestational age after first embryo transfer (Vuong 2018; Wei 2019; Zhang 2018).
-
One study reported on cumulative rate of small for gestational age (Vuong 2018). Three studies reported on the rate of babies who were small for gestational age after first embryo transfer (Vuong 2018; Wei 2019; Zhang 2018).
-
None of the studies reported on the cumulative rate of babies born with congenital abnormalities. Three studies reported on the rate of babies born with congenital abnormalities after first embryo transfer (Chen 2016; Wei 2019; Wong 2021).
-
Five studies reported on the birth weight of babies born (Chen 2016; Shapiro 2016; Vuong 2018; Wei 2019; Wong 2021).
-
Excluded studies
We excluded eight potentially eligible studies from the review, for the following reasons.
-
Aflatoonian 2010: this study was retracted.
-
Absalan 2013: it was unclear whether this study was truly a RCT. This study compared the clinical and delivery rates between the 'freeze all' strategy and the conventional strategy in women at risk for OHSS. The abstract stated that women with OHSS were randomly divided into two groups, with fresh embryo transfer and with frozen transfer. However, the methods section does not mention the method of randomisation (sequence generation or allocation concealment) nor which method was used to divide women into the two groups. Nothing was reported on the occurrence of OHSS in these women. The study authors did not respond to our request for additional information.
-
Beyer 2016: this study was not the correct study design, which was not clear from the abstract screening.
-
Boostanfar 2016 randomised women to a different intervention that was not clear from the abstract.
-
Chandel 2016 randomised women but, based on results, switched women to the other randomisation group (pseudo‐RCT).
-
Magdi 2017 stated it was a prospective cohort study, however, randomly assigned women into two groups using a computer‐based Microsoft Excel spreadsheet. We did not consider the study to be a properly randomised RCT.
-
Simon 2020 randomised women to a different intervention that was not clear from the abstract.
-
Yang 2015: one‐third of all randomised women chose to be in group 3 (fresh transfer of a day‐3 embryo followed by cryopreserved embryos) after randomisation. We did not consider the study to be a properly randomised RCT.
Awaiting classification
Currently there are no studies awaiting classification.
Ongoing studies
We identified six ongoing studies from trials registers that may have results for inclusion in future versions of this review (ACTRN12612000422820; ACTRN12616000643471; ISRCTN61225414; NCT02133950; NCT02570386; NCT03349905). Note that studies that we did not include studies that were registered in the trials registers but that were not started or that were withdrawn or stopped.
Risk of bias in included studies
See the 'Risk of bias’ summary (Figure 2) and graph (Figure 3) for the included trials (eight RCTs for the primary outcomes, two follow‐up studies for the secondary outcomes and five extra for the additional analysis). See also Characteristics of included studies.

'Risk of bias' summary: review authors' judgements about each 'Risk of bias' item for each included study

'Risk of bias' graph: review authors' judgements about each 'Risk of bias' item presented as percentages across all included studies
Allocation
Sequence generation
Ferraretti 1999 did not describe the method of randomisation in the published article, but replied in a personal communication that the method of randomisation was performed with random sealed envelopes; we judged this study to be at unclear risk of this bias. Shapiro 2011a and Shapiro 2011b did not report on the method for random sequence generation; we judged these two studies at unclear risk of bias.
Sequence generation in Chen 2016 was well described; an online central randomisation system was used. We considered risk of selection bias related to sequence generation to be low. Vuong 2018 performed sequence generation randomly by an independent study co‐ordinator by means of block randomisation using a computer‐generated random list and therefore we considered risk of selection bias related to sequence generation to be low. Risk of selection bias related to sequence generation in Wei 2019 was also considered low based on the use of block randomisation using a computer‐generated random list. Santos‐Ribeiro 2020 randomised women by means of a computer‐generated randomisation list. Wong 2021 randomised women with an online randomisation program using block randomisation with a maximum block size of 6, stratified for age (18 years through 35 and 35 through 43 years) and study centre. Couples were allocated in a 1:1 ratio to the 'freeze all' strategy or the conventional strategy. We judged these two studies at low risk of bias.
Allocation concealment
Shapiro 2011a and Shapiro 2011b performed allocation concealment by drawing randomly among identical, opaque, unmarked, sealed envelopes, and we therefore judged both studies to be at low risk of selection bias related to allocation concealment. Chen 2016 used an online central randomisation system (www.medresman.org) to generate the assignment sequence automatically, which was unknown to the clinical investigators. Santos‐Ribeiro 2020 sealed each entry of the list in a sequentially numbered opaque envelope and allocated participants in that order. Participating physicians did not have access to the randomisation list. Wei 2019 used a sequence that was entered into their central online database, secured by username and password log‐in. Wong 2021 used a randomisation program to generate a unique study number with allocation code after entry of the participant’s date of birth and randomisation date. We also judged these four studies to be at low risk of bias.
The first author of the Ferraretti 1999 study provided additional information on allocation concealment. This study performed participant allocation by sealed envelopes, and we therefore judged it to be unclear risk of bias for this domain. Vuong 2018 randomised patients by means of block randomisation by an independent study co‐ordinator using a computer‐generated random list, there was no further explanation about allocation concealment. We also judged this study to be at unclear risk of bias.
Blinding
Performance bias
Blinding of doctors and participants was not possible due to the nature of the intervention. Therefore the risk of performance bias was low in all eight studies.
Detection bias
As described in the Methods section, blinding of the participant or the clinician is technically not possible due to the nature of the intervention in this study design. We felt that lack of blinding was not likely to influence findings for the primary outcomes live birth or OHSS. The risk of performance bias was low in all eight studies.
Incomplete outcome data
Three studies did not report intention‐to‐treat analysis in the methodological or analysis sections (Ferraretti 1999; Shapiro 2011a; Shapiro 2011b), while five studies did report intention‐to‐treat analysis (Chen 2016; Santos‐Ribeiro 2020; Vuong 2018; Wei 2019; Wong 2021).
We initially judged the studies by Shapiro 2011a and Shapiro 2011b to be at high risk of attrition bias. These studies did not take into account withdrawals or exclusions of randomised women in the reported analyses. Both studies also analysed the outcomes per embryo transferred instead of per woman. However, sufficient data were available for analysis per woman in meta‐analysis. We prespecified ongoing pregnancy as a viable pregnancy at 12 weeks' gestation. These two studies defined ongoing pregnancy at 10 weeks' gestation, which could slightly overestimate the results for this outcome. Taking these issues into account, we considered the risk of bias to be unclear in these two studies.
Ferraretti 1999; Santos‐Ribeiro 2020; Vuong 2018; Wei 2019 and Wong 2021 did analyse all randomised women. The risk of attrition bias was low.
Selective reporting
Four studies were registered in a prospective trials register under the following numbers: NCT01841528 (Chen 2016), NCT02471573 (Vuong 2018), ChiCTR‐IOR‐14005405 (Wei 2019) and NCT02148393 (Santos‐Ribeiro 2020), including an automatically indexed link on the published report on the study, and the study protocol was published beforehand (Chen 2016; Santos‐Ribeiro 2020; Vuong 2018; Wei 2019). Wong 2021 was registered in a prospective trials register with the trial number NTR3187. Prespecified outcomes were generally reported, although in Chen 2016 some prespecified outcomes (e.g. time to pregnancy) were missing from the report. Considering this, we judged Santos‐Ribeiro 2020; Vuong 2018; Wei 2019 and Wong 2021 to be at low risk of reporting bias and Chen 2016 to be at high risk of reporting bias. Two studies were registered in a prospective trials register with the respective trial numbers NCT00963625 and NCT00963079 (Shapiro 2011a; Shapiro 2011b). Data on the follow‐up of the studies were available in the trials register. The prespecified outcomes of interest were reported in the two studies, and we judged these studies to be at low risk of this bias. We could not assess reporting bias for Ferraretti 1999, as trials registers did not exist at that time, therefore the risk of reporting bias for this study was unclear.
Other potential sources of bias
We judged fourteen studies to be at unclear risk of other bias and Ferraretti 1999 to be at high risk of other bias. Three of the studies did not clearly report their prespecified criteria for early termination of their trial. Ferraretti 1999 did not prespecify rules as to when to terminate the study. In the two studies by Shapiro 2011a; Shapiro 2011b, an interim analysis was planned after 100 completed blastocyst transfers. While women were randomised, the interim analyses were based on completed blastocyst transfers (unit of analysis error). They did not report whether the interim analysis was performed by an independent committee that was blinded for the primary outcome. In addition, Shapiro 2011b terminated the study early after an interim analysis based on differences in embryo quality between the two strategies. This reason was not mentioned as one of the criteria to terminate the study. All three studies cryopreserved embryos at the two pro‐nucleate (2pn) stage with slow freezing, which is not currently a common freezing protocol in IVF centres.
After freezing and thawing, the eight studies transferred embryos at a different developmental stage: Chen 2016; Ferraretti 1999 and Vuong 2018 transferred cleavage embryos, and Santos‐Ribeiro 2020; Shapiro 2011a; Shapiro 2011b; Wei 2019 and Wong 2021 transferred blastocysts. Four studies reported a form of time to pregnancy: Vuong 2018 reported the median time to conception, Wei 2019 reported the mean time to live birth, Santos‐Ribeiro 2020 reported the mean time from randomisation to detection of clinical pregnancy after the first embryo transfer and Wong 2021 reported the time to ongoing pregnancy. None of the eight studies reported on blinding of doctors to interim analyses of outcomes of the study.
Effects of interventions
See: Summary of findings 1 Fresh compared to frozen embryo transfer (cumulatively) in assisted reproduction; Summary of findings 2 Fresh compared to frozen embryo transfers in assisted reproduction regarding pregnancy and neonatal outcomes
We included eight studies involving 4,712 women in this review. See summary of findings Table 1.
1. Comparison of the 'freeze all' strategy versus the conventional IVF/ICSI strategy
1.1 Effectiveness: cumulative live birth rate per woman
All studies included in the meta‐analysis collected data on cumulative live birth rates (Chen 2016; Ferraretti 1999; Santos‐Ribeiro 2020; Shapiro 2011a; Shapiro 2011b; Vuong 2018; Wei 2019; Wong 2021).
There is probably little or no difference between the 'freeze all' strategy and the conventional IVF/ICSI strategy in cumulative live birth rate (OR 1.08, 95% CI 0.95 to 1.22; I2 = 0%; 8 RCTs, 4712 women; moderate‐quality evidence). The evidence suggests that for a cumulative live birth rate of 58% following the conventional strategy, the cumulative live birth rate following the 'freeze all' strategy would be between 57% and 63%.
As there was no indication of statistical heterogeneity an identical estimate for the OR was found when using the random‐effects model. The corresponding RR was 1.03 (95% CI 0.99 to 1.08; Table 2). A sensitivity analysis including only studies without risk of selection bias (Chen 2016; Santos‐Ribeiro 2020; Vuong 2018; Wei 2019; Wong 2021), found a comparable result (OR 1.09, 95% CI 0.95 to 1.23; I2 = 0%; 4 RCTs, 4328 women). A sensitivity analysis adopting a random‐effects model or using risk ratio did not lead to a change in result.
| Study (number of participants) | OR (95% CI) | OR (95% CI) | RR (95% CI) | RR (95% CI) |
|---|---|---|---|---|
| Cumulative live birth rate Chen 2016 (1508) Ferraretti 1999 (125) Santos‐Ribeiro 2020 (184) Shapiro 2011a (103) Shapiro 2011b (122) Vuong 2018 (782) Wei 2019 (1650) Wong 2021 (204) | 1.08 (0.95 to 1.22) | 1.08 (0.95 to 1.22) | 1.03 (0.98 to 1.07) | 1.03 (0.99 to 1.08) |
| OHSS Chen 2016 (1508) Ferraretti 1999 (125) Santos‐Ribeiro 2020 (184) Vuong 2018 (782) Wei 2019 (1650) Wong 2021 (204) | 0.26 (0.17 to 0.39) | 0.25 (0.13 to 0.46) | 0.22 (0.14 to 0.37) | 0.25 (0.14 to 0.44) |
| CI: confidence interval; OHSS: ovarian hyperstimulation syndrome; OR: odds ratio;RR: risk ratio | ||||
In the studies of Santos‐Ribeiro 2020; Shapiro 2011a there was lost to follow up for the primary outcome and therefore numbers of participants differ with the Characteristics tables.
There is also probably no difference between the two strategies in cumulative live birth rate when the studies are analysed per cleavage stage (OR 1.09, 95% CI 0.93 to 1.29; I2 = 0%; 3 RCTs, 2415 women; moderate‐quality evidence) or blastocyst transfer stage (OR 1.06, 95% CI 0.88 to 1.27; I2 =14%; 5 RCTs, 2297 women; moderate‐quality evidence; Analysis 1.1; Figure 4).

Forest plot of comparison 1. Freeze‐all versus conventional IVF, outcomes per woman, outcome 1.1 live birth rate
1.2 Safety: ovarian hyperstimulation syndrome (OHSS) per woman
Two studies reported on OHSS per woman if hospitalisation was required (Ferraretti 1999; Wong 2021). Two studies did not report on OHSS (Shapiro 2011a; Shapiro 2011b), but we were able to obtain these data by personal communication with the authors. However, we did not include the data from these two studies in the analysis, as women with high risk of OHSS were excluded and received the 'freeze all' strategy as standard. Chen 2016; Santos‐Ribeiro 2020; Vuong 2018 and Wei 2019 reported these data. The risk for developing OHSS may be lower after the 'freeze all' strategy compared to the conventional IVF/ICSI strategy (Peto OR 0.26, 95% CI 0.17 to 0.39; I2 = 0%; 6 RCTs, 4478 women; low‐quality evidence; Analysis 1.2; Figure 5). As there was no indication of statistical heterogeneity, we found an identical estimate for the OR when using the random‐effects model. The corresponding RR was 0.25 (95% CI 0.14 to 0.44; Table 2). A sensitivity analysis including only studies without risk of selection bias (Chen 2016; Santos‐Ribeiro 2020; Vuong 2018; Wei 2019; Wong 2021), found a comparable result (OR 0.27, 95% CI 0.18 to 0.40; I2 = 12%; 5 RCTs, 4354 women). A sensitivity analysis adopting a random‐effects model or using risk ratio did not lead to a change in result.

Forest plot of comparison 1. Freeze‐all versus conventional IVF, outcomes per woman, outcome 1.2 ovarian hyperstimulation syndrome (OHSS)
Secondary outcomes
1.3 Ongoing pregnancy rate per woman
Four studies reported on the cumulative ongoing pregnancy rates (Shapiro 2011a; Shapiro 2011b; Vuong 2018; Wong 2021). There was probably little or no difference between the two strategies in the cumulative ongoing pregnancy rate (OR 0.95, 95% CI 0.75 to 1.19; I2 = 31%; 4 RCTs, 1245 women; moderate‐quality evidence; Analysis 1.3).
1.4 Clinical pregnancy rate per woman
Four studies reported on cumulative clinical pregnancy rate (Ferraretti 1999; Santos‐Ribeiro 2020; Vuong 2018; Wong 2021). There may be no difference between the two strategies in clinical pregnancy rate though the confidence interval of the estimate (OR 0.92, 95% CI 0.72 to 1.16; I2 = 35%; 4 RCTs; 1320 women; low‐quality evidence; Analysis 1.4).
Time to pregnancy
Four of the studies reported on time to pregnancy. Santos‐Ribeiro 2020 reported the mean time from randomisation to detection of clinical pregnancy after the first embryo transfer (average treatment effect 33.3 days, 95% CI 25.8 to 40.9; P < 0.01) and the overall cumulative time to clinical pregnancy (Cox regression hazard ratio 0.92, 95% CI 0.68 to 1.24; P = 0.59). Vuong 2018 reported median time to pregnancy of 3.6 months in the frozen embryo group and 2.2 months in the fresh embryo group (absolute difference 1.4 months, 95% CI 0.95 to 1.84; P < 0.001). Wei 2019 did not report time to live birth after randomisation but after embryo transfer and is therefore not a fair comparison. All three studies calculated time to pregnancy for the women who became pregnant and not for the entire study group. Therefore no valid analysis can be performed based the results of these three studies. It was not possible to calculate the median time to pregnancy for Wong 2021 due to the limited number of ongoing pregnancies.
Secondary outcomes per woman regarding obstetric, perinatal and neonatal complication
1.5 Ectopic pregnancy rate
Two studies reported on the cumulative ectopic pregnancy rate (Vuong 2018; Wong 2021). We are uncertain whether there is a difference between the two strategies in cumulative ectopic pregnancy rate (Peto OR 0.61, 95% CI 0.31 to 1.22; I2 = 0%; 2 RCTs. 986 women; low‐quality evidence; Analysis 1.5).
Five studies reported on ectopic pregnancy rate after the first embryo transfer (Chen 2016; Ferraretti 1999; Vuong 2018; Wei 2019; Santos‐Ribeiro 2020). We are uncertain whether there is a difference between the two strategies in ectopic rate after the first embryo transfer (Peto OR 0.64, 95% CI 0.39 to 1.06; I2 = 0%; 5 RCTs, 4274 women; low‐quality evidence; Analysis 1.5).
1.6 Miscarriage rate
Two studies reported on the cumulative miscarriage rate (Vuong 2018; Wong 2021). We are uncertain whether the two strategies differ in cumulative miscarriage rate (Peto OR 1.06, 95% CI 0.72 to 1.55; I2 = 55%; 2 RCTs, 986 women; very low‐quality evidence; Analysis 1.6).
All eight studies reported on miscarriage rate after the first embryo transfer (Chen 2016; Ferraretti 1999; Santos‐Ribeiro 2020; Shapiro 2011a; Shapiro 2011b; Vuong 2018; Wei 2019; Wong 2021). We are uncertain about the existence of a difference between the two strategies in miscarriage rate after the first embryo transfer (Peto OR 0.90, 95% CI 0.76 to 1.07; I2 = 64%; 8 RCTs, 4569 women; very low‐quality evidence; Analysis 1.6).
1.7 Multiple pregnancy rate
Two studies reported on the cumulative multiple‐pregnancy rate (Vuong 2018; Wong 2021). We are uncertain whether the two strategies differ in cumulative multiple‐pregnancy rate (Peto OR 0.88, 95% CI 0.61 to 1.25; I2 = 63%; 2 RCTs. 986 women; very low‐quality evidence; Analysis 1.7).
Five studies reported on multiple‐pregnancy rate after the first embryo transfer (Chen 2016; Shapiro 2011b; Vuong 2018; Wei 2019; Wong 2021). We are uncertain whether the two strategies differ in multiple‐pregnancy rate after the first embryo transfer (Peto OR 1.18, 95% CI 0.96 to 1.45; I2 = 45%; 5 RCTs, 4266 women; very low‐quality evidence; Analysis 1.7).
1.8 Gestational diabetes
One study reported the cumulative rates of gestational diabetes (Vuong 2018), therefore pooling was not possible. We are uncertain whether the two strategies differ in cumulative rates of gestational diabetes (Peto OR 0.83, 95% CI 0.36 to 1.94; 1 RCT, 782 women; low‐quality evidence; Analysis 1.8).
Three studies reported on the rate of gestational diabetes after the first embryo transfer (Vuong 2018; Wei 2019; Zhang 2018). We are uncertain whether the two strategies differ in gestational diabetes after the first embryo transfer (Peto OR 1.34, 95% CI 0.96 to 1.86; I2 = 20%; 3 RCTs, 3940 women; low‐quality evidence; Analysis 1.8).
1.9 Hypertensive disorders of pregnancy
One study reported the cumulative rates of hypertensive disorders of pregnancy (Vuong 2018), therefore pooling was not possible. We are uncertain whether the two strategies differ in cumulative rates of hypertensive disorders of pregnancy (Peto OR 0.70, 95% CI 0.27 to 1.82; 1 RCT, 782 women; low‐quality evidence; Analysis 1.9; Figure 6).

Forest plot of comparison: 1 Freeze‐all versus conventional IVF, outcomes per woman, outcome 1.9 hypertensive disorders of pregnancy
Three studies reported on the rate of hypertensive disorders of pregnancy after the first embryo transfer (Chen 2016; Vuong 2018; Wei 2019). The risk of hypertensive disorders might be increased following the 'freeze all' strategy (Peto OR 2.15, 95% CI 1.42 to 3.25; I2 = 29%; 3 RCTs, 3940 women; low‐quality evidence; Analysis 1.9; Figure 6).
1.10 Preterm delivery (less than 37 weeks of gestational age)
Two studies reported the cumulative rates of preterm delivery (Vuong 2018; Wong 2021). We are uncertain whether the two strategies differ in cumulative rates of preterm delivery (Peto OR 0.62, 95% CI 0.39 to 0.99; I2 = 0%; 2 RCTs, 986 women; low‐quality evidence; Analysis 1.10).
Three studies reported on the rate of preterm delivery after the first embryo transfer (Chen 2016; Vuong 2018; Wei 2019). We are uncertain whether the two strategies differ in preterm delivery after the first embryo transfer (Peto OR 1.15, 95% CI 0.89 to 1.50; I2 = 0%; 3 RCTs, 3940 women; low‐quality evidence; Analysis 1.10).
1.11 Perinatal and neonatal death
One study reported the cumulative rates of perinatal and neonatal death (Vuong 2018), therefore pooling was not possible. Based on results from this solitary study (not meta‐analysis) we are uncertain whether the two strategies differ in cumulative rates of perinatal and neonatal death (Peto OR 0.13, 95% CI 0.01 to 1.30; 1 RCT, 782 women; very low‐quality evidence; Analysis 1.11).
Two studies reported on the rate of perinatal and neonatal death after the first embryo transfer (Chen 2016; Vuong 2018). We are uncertain whether the two strategies differ in perinatal and neonatal death after the first embryo transfer (Peto OR 2.27, 95% CI 0.65 to 7.84; I2 = 88%; 2 RCTs, 2290 women; very low‐quality evidence; Analysis 1.11).
1.12 Neonatal hospitalisation (for more than three days or NICU admission)
One study reported the cumulative rates of neonatal hospitalisation (Vuong 2018), therefore pooling was not possible. We are uncertain whether the two strategies differ in cumulative rates of neonatal hospitalisation (Peto OR 1.00, 95% CI 0.29 to 3.48; 1 RCT, 782 women; very low‐quality evidence; Analysis 1.12).
Three studies reported on the rate of neonatal hospitalisation after the first embryo transfer (Vuong 2018; Wei 2019; Zhang 2018). We are uncertain whether the two strategies differ in neonatal hospitalisation after the first embryo transfer (Peto OR 1.37, 95% CI 1.07 to 1.75; I2 = 0%; 3 RCTs, 3940 women; low‐quality evidence; Analysis 1.12).
1.13 Large for gestational age (birth weight above 90th percentile)
One study reported the cumulative rates of large‐for‐gestational‐age babies (Vuong 2018). Based on the results from this solitary study we are uncertain whether the two strategies differ in cumulative rates of having a large‐for‐gestational‐age baby (Peto OR 1.97, 95% CI 0.63 to 6.15; 1 RCT, 782 women; low‐quality evidence; Analysis 1.13; Figure 7).

Forest plot of comparison 1. Freeze‐all versus conventional IVF, outcomes per woman, outcome 1.13 large for gestational age (birth weight above 90th percentile)
Three studies reported on the rate of large for gestational age after the first embryo transfer (Vuong 2018; Wei 2019; Zhang 2018). Based on these studies the risk of having a large‐for‐gestational‐age baby might be increased following the 'freeze all' strategy (Peto OR 1.96, 95% CI 1.51 to 2.55; I2 = 0%; 3 RCTs, 3940 women; low‐quality evidence; Analysis 1.13; Figure 7).
1.14 Small for gestational age (birth weight below 10th percentile)
One study reported the cumulative rates of small for gestational age babies (Vuong 2018), therefore pooling was not possible. The results of this solitary study suggest that the cumulative risk of having a small‐for‐gestational‐age baby might be lower following the 'freeze all' strategy (Peto OR 0.36, 95% CI 0.16 to 0.80; 1 RCT, 782; low‐quality evidence; Analysis 1.14; Figure 8).

Forest plot of comparison 1. Freeze‐all versus conventional IVF, outcomes per woman, outcome 1.14 small for gestational age (birth weight below 10th percentile)
Three studies reported on the rate of small for gestational age after the first embryo transfer (Vuong 2018; Wei 2019; Zhang 2018). We are uncertain whether the two strategies differ in the risk of having a small‐for‐gestational‐age baby after the first embryo transfer (Peto OR 0.82, 95% CI 0.65 to 1.05; I2 = 64%; 3 RCTs, 3940 women; very low‐quality evidence; Analysis 1.14; Figure 8).
1.15 Congenital abnormalities
Three studies reported on congenital abnormalities (Chen 2016; Wei 2019; Wong 2021). We are uncertain whether the two strategies differ in rates of congenital abnormalities per live‐born children plus number of foetuses therapeutically terminated (OR 1.08, 95% CI 0.65 to 1.78; I2 = 0%; 3 RCTs, 1789 live‐born children plus number of foetuses therapeutically terminated; low‐quality evidence; Analysis 1.15).
1.16 Birth weight
Five studies reported on birth weight (Chen 2016; Shapiro 2016; Vuong 2018; Wei 2019; Wong 2021). The risk for having a higher birth weight of singleton babies born is probably increased following the 'freeze all' strategy (MD 127 g, 95% CI 77.1 to 177.8; I2 = 0%; 5 RCTs, 1607 singletons; moderate‐quality evidence).
We are uncertain whether birth weight of multiples is higher in the 'freeze all' strategy compared to the conventional IVF/ICSI strategy (MD 49.5, 95% CI −21.2 to 120.1; I2 = 17%; 4 RCTs, 804 children born from multiples; low‐quality evidence; Analysis 1.16; Figure 9).

Forest plot of comparison 1. Freeze‐all versus conventional IVF, outcomes per woman, outcome 1.16 birth weight of babies born
Wong 2021 had three twin live‐born in the conventional IVF strategy and none in the 'freeze all' strategy and could therefore not be pooled in the analysis.
Other analyses
We also analysed the adverse events, multiple pregnancy and miscarriage per clinical pregnancy (Analysis 2.1; Analysis 2.2).
It is uncertain whether the two strategies differ in multiple pregnancy per clinical pregnancy after the first embryo transfer (OR 1.09, 95% CI 0.87 to 1.36; 5 RCTs, 2223 clinical pregnancies; I2 = 14%; Analysis 2.1). We are uncertain whether the two strategies differ in miscarriage rate per clinical pregnancy after the first embryo transfer (OR 0.82, 95% CI 0.66 to 1.02; I2 = 63%; 8 RCTs, 2451 clinical pregnancies; Analysis 2.2).
Additional analysis
We also calculated and presented the live birth rate after the first transfer (Table 1). Based on this calculation the live birth rate after the first transfer is increased following the 'freeze all' strategy (OR 1.17, 95% CI 1.06 to 1.28; 13 RCTs, 7766 women) for all stages of transfer.
Discussion
Summary of main results
Our findings suggest that the 'freeze all' strategy results in similar cumulative live birth rate but lower OHSS rate than the conventional IVF/ICSI strategy. We could not analyse time to pregnancy. We can assume that it is shorter with conventional IVF/ICSI strategy where cumulative live birth rate is similar, as embryo transfer is delayed in a 'freeze all' strategy (Zaat 2019). Low‐quality evidence suggests that the 'freeze all' strategy might be associated with increased risk of hypertensive disorders of pregnancy, increased risk of having a large‐for‐gestational‐age baby and a higher birth weight of singleton babies.
Overall completeness and applicability of evidence
All eight trials included in the meta‐analysis provided data on the primary outcome, live birth rate, but for OHSS we could use data from only five studies.
Four of these studies involved a small number of women. All studies in the meta‐analysis had specific and differing technical protocols, and studies had distinct inclusion criteria leading to the inclusion of select groups of women (women with a high risk of OHSS, good prognosis women, women with polycystic ovary syndrome, young women without polycystic ovary syndrome and in women with any IVF indication, including the women with possible low ovarian response). Four of the studies reported time to pregnancy, each in a different way and therefore we could not pool these outcomes. One of these three studies (Wei 2019), did not report time to live birth after randomisation but after embryo transfer and is therefore not a fair comparison. Time to a pregnancy leading to a live birth needs to be reported with the date of randomisation as a starting point.
Quality of the evidence
We rated the quality of evidence using GRADE methods and judged it to be moderate to low, due to serious risk of bias and (for some outcomes) serious imprecision. Risk of bias was associated with unclear blinding of investigators for preliminary outcomes of the study during the interim‐analysis, unit of analysis error, and absence of adequate study termination rules.
The eight included studies involved a total of 2342 women undergoing the 'freeze all' strategy and 2370 women undergoing the conventional IVF/ICSI strategy. Varying protocols between studies (some not common in routine practice), varying study population (select groups of women undergoing IVF), one study that did not report power calculation (Ferraretti 1999: unclear what determined the end of study), two studies that calculated interim analysis per transfer (Shapiro 2011a; Shapiro 2011b: unit of analysis error) with absence of adequate stopping rules (possible overestimation of treatment effect) and one study that reported cumulative live birth rate including a possible second ('freeze all' 5.9%, conventional IVF 6.4%) or third ('freeze all' 0.5%, conventional IVF 0.8%) retrieval cycle (Vuong 2018), resulted in an overall judgement of the evidence as moderate to low quality.
Our searches identified six ongoing studies. We anticipate that the evidence from these will provide a more definitive answer on the relative effectiveness and safety of a 'freeze all' strategy.
Potential biases in the review process
We tried to reduce potential bias in the review process to a minimum by identifying all eligible studies for inclusion in this meta‐analysis. We were able to retrieve additional information on three included trials where required, which helped us in providing accurate study outcomes. Unfortunately, we did not receive additional information regarding cumulative data for four other studies, therefore these studies could only be included in the additional analysis.
Agreements and disagreements with other studies or reviews
Cumulative live birth rate
Four out of eight studies included in the meta‐analysis in this review reported higher pregnancy or live birth rates in favour of the 'freeze all' strategy (Chen 2016; Shapiro 2011a; Shapiro 2011b; Wei 2019), while our review concluded that there was no difference in live birth rates between the strategies. This discrepancy in conclusion is attributed to the fact that these publications focused on outcomes that were reported after the first transfer, whereas in our review we focused on the cumulative live birth rate per woman randomised. In case cumulative live birth rates are comparable, as found in this review, then the difference between strategies could be time to pregnancy and possible differences in pregnancy and neonatal complications. For illustrative purposes we also calculated and presented the live birth rate after the first transfer (Table 1). Based on this calculation the live birth rate after the first transfer is increased following the 'freeze all' strategy (OR 1.17, 95% CI 1.06 to 1.28; 13 RCTs, 7766 women) for all stages of transfer. The live birth rate calculated after the first transfer possibly shows differences in outcome for a stimulated and an unstimulated uterus, although this does not take into account the number of embryos that were thawed for transfer.
For women, the live birth rate per first transfer is less relevant, since at the same time of first transfer in a 'freeze all' strategy, they would already have received the second transfer in a conventional IVF/ICSI strategy. Considering the important perspective of time, it would only be fair to compare cumulative live birth rate between groups instead of live birth rate after first transfer (Zaat 2019). In the additional calculation concerning live birth rate after the first transfer, we included a study in which women underwent preimplantation genetic testing for aneuploidies (PGT‐A) (Coates 2017). The use of PGT‐A could have an effect on the current comparison under evaluation, as PGT‐A affects the number of embryos available for transfer (Mastenbroek 2014).
One out of eight included studies reported lower cumulative ongoing pregnancy rate or live birth rates for the 'freeze all' strategy than for conventional IVF/ICSI treatment including fresh transfer (Wong 2021). In this trial, an unselected cohort of couples undergoing IVF was selected, including women with poor prognosis. This could explain the difference from the other included trials, in which only women with a good prognosis (Santos‐Ribeiro 2020; Shapiro 2011a; Shapiro 2011b; Vuong 2018; Wei 2019), women with polycystic ovary syndrome (Chen 2016), and women with a high risk of OHSS were included (Ferraretti 1999). This should be taken into account when considering the 'freeze all' strategy, whether to use it in an unselected population or only in women with a good prognosis, with a minimum number of good‐quality embryos available. The current review does not provide an answer to this.
Two recently published systematic reviews and meta‐analyses, Roque 2019 and Bosdou 2019 reported a higher live birth rate after the first transfer in the 'freeze all' strategy compared to conventional IVF/ICSI. No significant difference was found in cumulative live birth rate between both groups. In Roque 2019 this increased live birth rate was only found in hyper‐responders and in cycles with PGT‐A. However, no significant difference was found in cumulative live birth rate between both groups. Santos‐Ribeiro 2020; Wei 2019 and Wong 2021 had not been published when the review by Roque 2019 was written. In Bosdou 2019, high responders had a significantly higher probability of live birth in the 'freeze all' strategy based on the results after the first transfer. However, the probability of live birth was not significantly different between both groups in normal responders after the first embryo transfer. Bosdou and colleagues did include the Absalan 2013 study, which we excluded based on the unclear study design. No significant difference was found in cumulative live birth rate between both groups.
Ovarian hyperstimulation syndrome (OHSS)
The lower rate of OHSS found in our review is in agreement with previous systematic reviews and studies (Bosdou 2019; D'Angelo 2017; Evans 2014; Roque 2019; Takeshima 2016), and is to be expected. Avoiding a pregnancy in the initial cycle with ovarian stimulation would eliminate the residual risks of OHSS, and OHSS would therefore be self‐limiting. Mild OHSS symptoms can still occur as a result of a hCG trigger in the hyperstimulated cycle in the 'freeze all' strategy, but OHSS in its severe form should be rare and even close to zero when agonist trigger is used (D'Angelo 2017; Youssef 2016). All the included studies in our review used hCG trigger before oocyte aspiration.
Although in agreement with previous studies and our expectations, the quality of evidence for the lower rate of OHSS in the 'freeze all' strategy was low. Definitions of OHSS vary widely in literature as in the studies included in this review. Therefore, this result should be interpreted with caution.
Time to pregnancy
Three of the studies reported on time to pregnancy, all in a different way. All three studies calculated time to pregnancy for the women who became pregnant and not for the entire study group. Therefore no valid analysis can be performed based on the results of these three studies. Reporting on time to pregnancy should be done based on the entire study group, including presenting Kaplan‐Meier curves, calculating hazard ratios, or calculating median survival times. By design, time to pregnancy is shorter in the conventional strategy than in the 'freeze all' strategy when the cumulative live birth rate is comparable, as embryo transfer is delayed in a 'freeze all' strategy (Zaat 2019).
Secondary outcomes concerning effectiveness
Although we reported pregnancy and live birth rates only cumulatively; for other outcomes, such as the number of multiples, the number of miscarriages and the obstetric, perinatal and neonatal outcomes, we reported the numbers cumulatively and also after the first embryo transfer. When the cumulative rates for these outcomes were reported in one or two of the included studies we also plotted the outcomes after first embryo transfer. Definitions used in the included studies for some of the secondary outcomes, especially miscarriages, differ between studies. The included data are insufficient to identify any differences in early or late miscarriage between both strategies.
Secondary outcomes concerning safety
In our review we found that women in the 'freeze all' strategy might have an increased risk of hypertensive disorders of pregnancy.
Several cohort studies (Ishihara 2014; Opdahl 2015; Sazonova 2012), and two recent meta‐analyses (Maheshwari 2018; Roque 2019), reported increased risk of hypertensive disorders of pregnancy after frozen embryo transfer compared to fresh embryo transfer. It is hypothesised that the risk of hypertensive disorders of pregnancy may relate to endometrial preparation with exogenous progesterone and prolonged estrogen use during artificial frozen embryo transfer cycles (Roque 2019). During the implantation period in early pregnancy, extravillous trophoblast cells are the key cells involved in uterine spiral arteriole remodelling during pregnancy, an event that is critical for a successful pregnancy outcome. Some studies suggest that aberrant progesterone levels in early pregnancy can lead to over‐invasion or an invasion defect of the extravillous trophoblast, which may possibly lead to serious complications such as hypertensive disorders of pregnancy (Esh‐Broder 2011; Schatz 2016).
Another hypothesis is that the increased risk of hypertensive disorders of pregnancy may be due to the missing circulating corpus luteum vasoactive products such as relaxin, vascular endothelial growth factor and angiogenic metabolites of estrogen. The absence of these vasoactive factors may lead to deficient circulatory adaptations during early gestation and therefore hypertensive disorders of pregnancy (Conrad 2011; Singh 2020; von Versen‐Höynck 2019a; von Versen‐Höynck 2019b). Recently, in line with this possible biological explanation, the results of two large cohort studies showed that the risk of hypertensive disorders of pregnancy is increased after cryopreserved embryo transfer in an artificial cycle compared to cryopreserved embryo transfer in a natural cycle (Ernstad 2019; Saito 2019).
In this review, seven of the included studies used only artificial cycles for frozen embryo transfer in the 'freeze all' strategy (Chen 2016; Ferraretti 1999; Santos‐Ribeiro 2020; Shapiro 2011a; Shapiro 2011b; Vuong 2018; Wong 2021), of which two studies (Chen 2016; Vuong 2018), reported on this outcome. Chen 2016 found a higher rate of pre‐eclampsia in the 'freeze all' strategy, Vuong 2018 found no difference between both groups. Frozen embryo transfers in the study by Wei 2019 were mainly performed in natural ovulatory cycles (63.7%) or in artificial cycles (36.4%); the type of treatment cycle was decided at the discretion of local physicians. Difference in hypertensive disorders of pregnancy between natural cycle frozen embryo transfer and artificial cycle embryo transfer was not reported. All seven studies used progesterone for luteal support in case of a pregnancy. Based on the results of the included studies in this review it is unclear whether the type of frozen embryo transfer and endometrial preparation is associated with increased risk of hypertensive disorders of pregnancy or whether there could be another explanation.
According to these studies, this over‐invasion or invasion defect of the extravillous trophoblast may also lead to abnormal placentation such as placenta accrete (Esh‐Broder 2011; Schatz 2016). In our current review we could not investigate whether the risk of abnormal placentation differs between the 'freeze all' strategy and the conventional IVF/ICSI strategy because none of the included RCTs reported on abnormal placentation. Regarding future research it would be of great interest to gain more knowledge about a possible difference between the strategies for this pregnancy complication.
The 'freeze all' strategy is associated with an increased risk of a higher birth weight in singleton babies. This finding is in agreement with a recently published meta‐analysis comparing frozen embryo transfer to fresh embryo transfer (Maheshwari 2012; Maheshwari 2018). The higher risk of large for gestational age after frozen embryo transfer is also applicable when compared to the general population (Luke 2017; Pinborg 2014; Spijkers 2017). It has been suggested that artificial endometrial preparation is associated with higher birth weights (Ernstad 2019; Roque 2019). In this review, seven of the included studies used only artificial cycles for frozen embryo transfer in the 'freeze all' strategy (Chen 2016; Ferraretti 1999; Santos‐Ribeiro 2020; Shapiro 2011a; Shapiro 2011b; Vuong 2018; Wong 2021), of which four studies (Chen 2016; Shapiro 2016; Wei 2019; Wong 2021), reported on this outcome. All of these five studies found a higher birth weight of babies born after the 'freeze all' strategy. Frozen embryo transfers in the study by Wei 2019 were mainly performed in natural ovulatory cycles (63.7%) or in artificial cycles (36.4%); the type of treatment cycle was decided at the discretion of local physicians. Difference in birth weight between natural cycle frozen embryo transfer and artificial cycle embryo transfer was not reported. All of the seven studies used progesterone for luteal support in case of a pregnancy. Based on the results of the included studies in this review it is unclear whether the type of endometrial preparation for frozen embryo transfer is associated with the increased risk of higher birth weight or whether there could be another explanation.
It has also been suggested that the freezing and thawing procedures or extended culture may play an independent role in the growth potential of the foetus due to epigenetic alterations at the early embryonic stages (Pinborg 2014).
The lower rate of small for gestational age in the 'freeze all' strategy in our review is in agreement with the findings of a recent meta‐analysis (Maheshwari 2018). It has been hypothesised that because of a state of hyperestrogenism ‐ due to hormonal stimulation of the ovaries ‐ at time of fresh embryo transfer abnormal endometrial angiogenesis occurs and may lead to reduced implantation as well as abnormal placentation. At the time of the frozen embryo transfer, the effect of the ovarian stimulation is worn off and therefore a frozen embryo transfer is performed in a more natural uterine environment compared to the fresh cycle (Healy 2010; Kansal Kalra 2011). However, this hypothesis would also account for findings such as more preterm deliveries and more low birth weight babies, which were not found in our meta‐analysis.


'Risk of bias' summary: review authors' judgements about each 'Risk of bias' item for each included study

'Risk of bias' graph: review authors' judgements about each 'Risk of bias' item presented as percentages across all included studies

Forest plot of comparison 1. Freeze‐all versus conventional IVF, outcomes per woman, outcome 1.1 live birth rate

Forest plot of comparison 1. Freeze‐all versus conventional IVF, outcomes per woman, outcome 1.2 ovarian hyperstimulation syndrome (OHSS)

Forest plot of comparison: 1 Freeze‐all versus conventional IVF, outcomes per woman, outcome 1.9 hypertensive disorders of pregnancy

Forest plot of comparison 1. Freeze‐all versus conventional IVF, outcomes per woman, outcome 1.13 large for gestational age (birth weight above 90th percentile)

Forest plot of comparison 1. Freeze‐all versus conventional IVF, outcomes per woman, outcome 1.14 small for gestational age (birth weight below 10th percentile)

Forest plot of comparison 1. Freeze‐all versus conventional IVF, outcomes per woman, outcome 1.16 birth weight of babies born

Comparison 1: Freeze‐all versus conventional IVF, outcomes per woman, Outcome 1: Cumulative live birth rate

Comparison 1: Freeze‐all versus conventional IVF, outcomes per woman, Outcome 2: Ovarian hyperstimulation syndrome (OHSS)

Comparison 1: Freeze‐all versus conventional IVF, outcomes per woman, Outcome 3: Cumulative ongoing pregnancy rate

Comparison 1: Freeze‐all versus conventional IVF, outcomes per woman, Outcome 4: Cumulative clinical pregnancy rate

Comparison 1: Freeze‐all versus conventional IVF, outcomes per woman, Outcome 5: Ectopic pregnancy

Comparison 1: Freeze‐all versus conventional IVF, outcomes per woman, Outcome 6: Miscarriage

Comparison 1: Freeze‐all versus conventional IVF, outcomes per woman, Outcome 7: Multiple pregnancy

Comparison 1: Freeze‐all versus conventional IVF, outcomes per woman, Outcome 8: Gestational diabetes mellitus

Comparison 1: Freeze‐all versus conventional IVF, outcomes per woman, Outcome 9: Hypertensive disorders of pregnancy

Comparison 1: Freeze‐all versus conventional IVF, outcomes per woman, Outcome 10: Preterm delivery (< 37 weeks of gestational age)

Comparison 1: Freeze‐all versus conventional IVF, outcomes per woman, Outcome 11: Perinatal and neonatal death

Comparison 1: Freeze‐all versus conventional IVF, outcomes per woman, Outcome 12: Neonatal hospitalisation (> 3 days or neonatal intensive care unit admission)

Comparison 1: Freeze‐all versus conventional IVF, outcomes per woman, Outcome 13: Large for gestational age (birth weight > 90th percentile)

Comparison 1: Freeze‐all versus conventional IVF, outcomes per woman, Outcome 14: Small for gestational age (birth weight < 10th percentile)

Comparison 1: Freeze‐all versus conventional IVF, outcomes per woman, Outcome 15: Congenital abnormalities per live‐born children

Comparison 1: Freeze‐all versus conventional IVF, outcomes per woman, Outcome 16: Birth weight of babies born

Comparison 2: Freeze‐all versus conventional IVF, adverse events per clinical pregnancy, Outcome 1: Multiple pregnancy: after first embryo transfer

Comparison 2: Freeze‐all versus conventional IVF, adverse events per clinical pregnancy, Outcome 2: Miscarriage: after first embryo transfer

Comparison 3: Additional analysis: freeze‐all versus conventional IVF, live birth rate after first transfer, Outcome 1: Additional analysis: live birth rate after first transfer per randomised woman
| Fresh compared to frozen embryo transfer (cumulatively) in assisted reproduction | ||||||
| Patient or population: women undergoing assisted reproduction | ||||||
| Outcomes | Anticipated absolute effects* (95% CI) | Relative effect | № of participants | Quality of the evidence | Comments | |
|---|---|---|---|---|---|---|
| Risk with fresh and frozen embryo transfers | Risk with frozen embryo transfer only | |||||
| Live birth rate: cumulatively | 579 per 1000 | 589 per 1000 | OR 1.08 | 4712 | ⊕⊕⊕⊝ | |
| OHSS: per cycle with ovarian hyperstimulation | 33 per 1000 | 9 per 1000 | OR 0.26 | 4478 | ⊕⊕⊝⊝ | |
| Ongoing pregnancy rate: cumulatively | 508 per 1000 | 495 per 1000 | OR 0.95 | 1245 | ⊕⊕⊕⊝ | |
| Miscarriage rate: cumulatively | 118 per 1000 | 124 per 1000 | OR 1.06 | 986 | ⊕⊝⊝⊝ | |
| Multiple pregnancy rate: cumulatively | 156 per 1000 | 140 per 1000 | OR 0.88 | 986 | ⊕⊝⊝⊝ | |
| Time to pregnancy | Outcome could not be analysed. By design, time to pregnancy is shorter in the conventional strategy compared to the 'freeze all' strategy when the cumulative live birth rate is comparable, as embryo transfer is delayed in a 'freeze all' strategy. | |||||
| *The risk in the intervention group (and its 95% confidence interval) is based on the assumed risk in the comparison group and the relative effect of the intervention (and its 95% CI). | ||||||
| GRADE Working Group grades of evidence High quality: further research is very unlikely to change our confidence in the estimate of effect. Moderate quality: further research is likely to have an important impact on our confidence in the estimate of effect and may change the estimate. Low quality: further research is very likely to have an important impact on our confidence in the estimate of effect and is likely to change the estimate. Very low quality: we are very uncertain about the estimate. | ||||||
| aDowngraded one level due to serious risk of bias associated with lack of power calculation (unclear what determined end of study) and/or use of interim analysis that was calculated per transfer (unit of analysis error) with absence of adequate stopping rules (possible overestimation of treatment effect). | ||||||
| Fresh compared to frozen embryo transfers in assisted reproduction regarding pregnancy and neonatal outcomes (cumulatively and after first embryo transfer) | ||||||
| Patient or population: women undergoing assisted reproduction | ||||||
| Outcomes | Anticipated absolute effects* (95% CI) | Relative effect | № of participants | Quality of the evidence | Comments | |
|---|---|---|---|---|---|---|
| Risk with fresh and frozen embryo transfers | Risk with frozen embryo transfer only | |||||
| Hypertensive disorders of pregnancy: cumulatively | 26 per 1000 | 18 per 1000 | OR 0.70 | 782 | ⊕⊕⊝⊝ | |
| Hypertensive disorders of pregnancy: after first ET | 15 per 1000 | 31 per 1000 | OR 2.15 | 3940 | ⊕⊕⊝⊝ | |
| Large for gestational age (birth weight above 90th percentile): cumulatively | 10 per 1000 | 20 per 1000 | OR 1.97 | 782 | ⊕⊕⊝⊝ | |
| Large for gestational age (birth weight above 90th percentile): after first ET | 42 per 1000 | 79 per 1000 | OR 1.96 | 3940 | ⊕⊕⊝⊝ | |
| Small for gestational age (birth weight below 10th percentile): cumulatively | 46 per 1000 | 17 per 1000 | OR 0.36 | 782 | ⊕⊕⊝⊝ | |
| Small for gestational age (birth weight below 10th percentile): after first ET | 82 per 1000 | 68 per 1000 | OR 0.82 | 3940 | ⊕⊝⊝⊝ | |
| Birth weight of babies born: singletons | MD 127.4 g higher | ‐ | 1607 | ⊕⊕⊕⊝ | ||
| Birth weight of babies born: multiples | MD 49.5 g higher | ‐ | 804 | ⊕⊕⊝⊝ | ||
| *The risk in the intervention group (and its 95% confidence interval) is based on the assumed risk in the comparison group and the relative effect of the intervention (and its 95% CI). | ||||||
| GRADE Working Group grades of evidence High quality: further research is very unlikely to change our confidence in the estimate of effect. Moderate quality: further research is likely to have an important impact on our confidence in the estimate of effect and may change the estimate. Low quality: further research is very likely to have an important impact on our confidence in the estimate of effect and is likely to change the estimate. Very low quality: we are very uncertain about the estimate. | ||||||
| aDowngraded one level due to serious risk of bias associated with lack of power calculation (unclear what determined end of study) and/or use of interim analysis that was calculated per transfer (unit of analysis error) with absence of adequate stopping rules (possible overestimation of treatment effect). | ||||||
| Outcome | Number of studies | Number of participants | Analysis method | OR |
|---|---|---|---|---|
| Live birth ratea after first embryo transfer for all embryo stages of transfer | 13 | 7766 | Odds ratio (Mantel‐Haenszel, fixed‐effect, 95% confidence interval) | 1.17 (95% CI 1.06 to 1.28) |
| aLive birth rate calculated after first transfer is added for illustrative purposes as this comparison is often reported in the literature. It possibly shows differences in outcome for a stimulated and an unstimulated uterus, although this does not take into account the number of embryos that were thawed for transfer. This outcome is less relevant for women undergoing treatment since at the same time of first transfer in a freeze‐all strategy, they would already have received the second transfer (as long as there was a sufficient number of embryos) in a conventional strategy that includes fresh transfer. Here, one could consider the result of the first embryo transfer in the frozen group against the combined outcomes of the fresh transfer and the first frozen‐thawed‐transfer in the fresh group. Therefore cumulative live birth rate is the relevant outcome for women. For the calculated live birth rate after the first embryo transfer, we included the eight studies included for the primary outcome (Chen 2016; Ferraretti 1999; Santos‐Ribeiro 2020; Shapiro 2011a; Shapiro 2011b; Vuong 2018; Wei 2019; Wong 2021) and five additional RCTs: Aflatoonian 2018; Aghahosseini 2017; Coates 2017; Shi 2018; Stormlund 2020. We contacted the authors for additional information regarding cumulative data by email but we did not receive a response. Aflatoonian 2018 compared live birth rate after the first embryo transfer between a freeze‐all strategy and a conventional strategy in high responders at risk for developing OHSS. Aghahosseini 2017 included infertile women who were candidates for an in vitro fertilisation (IVF) treatment with no further specification of age or type of responder. Coates 2017 excluded women with a suspected decreased ovarian reserve (based on serum follicle‐stimulating hormone and anti‐Müllerian hormone. Women in both groups underwent IVF with assisted hatching and pre‐implantation genetic screening. Shi 2018 compared live birth rate after the first embryo transfer between a freeze‐all strategy and a conventional strategy in young women with a regular menses and the reason for IVF procedure: tubal factor, male factor, or both. Stormlund 2020 compared live birth rate after the first embryo transfer between a freeze‐all strategy and a conventional strategy in young women with a regular menses and the reason for IVF procedure: male, tubal, uterine, or unexplained infertility. | ||||
| Study (number of participants) | OR (95% CI) | OR (95% CI) | RR (95% CI) | RR (95% CI) |
|---|---|---|---|---|
| Cumulative live birth rate Chen 2016 (1508) Ferraretti 1999 (125) Santos‐Ribeiro 2020 (184) Shapiro 2011a (103) Shapiro 2011b (122) Vuong 2018 (782) Wei 2019 (1650) Wong 2021 (204) | 1.08 (0.95 to 1.22) | 1.08 (0.95 to 1.22) | 1.03 (0.98 to 1.07) | 1.03 (0.99 to 1.08) |
| OHSS Chen 2016 (1508) Ferraretti 1999 (125) Santos‐Ribeiro 2020 (184) Vuong 2018 (782) Wei 2019 (1650) Wong 2021 (204) | 0.26 (0.17 to 0.39) | 0.25 (0.13 to 0.46) | 0.22 (0.14 to 0.37) | 0.25 (0.14 to 0.44) |
| CI: confidence interval; OHSS: ovarian hyperstimulation syndrome; OR: odds ratio;RR: risk ratio | ||||
| In the studies of Santos‐Ribeiro 2020; Shapiro 2011a there was lost to follow up for the primary outcome and therefore numbers of participants differ with the Characteristics tables. | ||||
| Outcome or subgroup title | No. of studies | No. of participants | Statistical method | Effect size |
| 1.1 Cumulative live birth rate Show forest plot | 8 | 4712 | Odds Ratio (M‐H, Fixed, 95% CI) | 1.08 [0.95, 1.22] |
| 1.1.1 Live birth rate: cumulatively for cleavage stage transfer | 3 | 2415 | Odds Ratio (M‐H, Fixed, 95% CI) | 1.09 [0.93, 1.29] |
| 1.1.2 Live birth rate: cumulatively for blastocyst stage transfer | 5 | 2297 | Odds Ratio (M‐H, Fixed, 95% CI) | 1.06 [0.88, 1.27] |
| 1.2 Ovarian hyperstimulation syndrome (OHSS) Show forest plot | 6 | Peto Odds Ratio (Peto, Fixed, 95% CI) | Subtotals only | |
| 1.2.1 Per cycle with ovarian hyperstimulation | 6 | 4478 | Peto Odds Ratio (Peto, Fixed, 95% CI) | 0.26 [0.17, 0.39] |
| 1.3 Cumulative ongoing pregnancy rate Show forest plot | 4 | 1245 | Odds Ratio (M‐H, Fixed, 95% CI) | 0.95 [0.75, 1.19] |
| 1.3.1 Ongoing pregnancy rate: cumulatively for cleavage stage transfer | 1 | 782 | Odds Ratio (M‐H, Fixed, 95% CI) | 1.03 [0.78, 1.37] |
| 1.3.2 Ongoing pregnancy rate: cumulatively for blastocyst stage transfer | 3 | 463 | Odds Ratio (M‐H, Fixed, 95% CI) | 0.80 [0.54, 1.18] |
| 1.4 Cumulative clinical pregnancy rate Show forest plot | 4 | 1320 | Odds Ratio (M‐H, Fixed, 95% CI) | 0.92 [0.72, 1.16] |
| 1.4.1 Clinical pregnancy rate: cumulatively for cleavage stage transfer | 2 | 907 | Odds Ratio (M‐H, Fixed, 95% CI) | 1.00 [0.76, 1.32] |
| 1.4.2 Clinical pregnancy rate: cumulatively for blastocyst stage transfer | 2 | 413 | Odds Ratio (M‐H, Fixed, 95% CI) | 0.70 [0.44, 1.13] |
| 1.5 Ectopic pregnancy Show forest plot | 6 | Peto Odds Ratio (Peto, Fixed, 95% CI) | Subtotals only | |
| 1.5.1 Ectopic pregnancy: cumulatively | 2 | 986 | Peto Odds Ratio (Peto, Fixed, 95% CI) | 0.61 [0.31, 1.22] |
| 1.5.2 Ectopic pregnancy: after first embryo transfer | 5 | 4274 | Peto Odds Ratio (Peto, Fixed, 95% CI) | 0.64 [0.39, 1.06] |
| 1.6 Miscarriage Show forest plot | 8 | Peto Odds Ratio (Peto, Fixed, 95% CI) | Subtotals only | |
| 1.6.1 Miscarriage rate: cumulatively | 2 | 986 | Peto Odds Ratio (Peto, Fixed, 95% CI) | 1.06 [0.72, 1.55] |
| 1.6.2 Miscarriage rate: after first embryo transfer | 8 | 4569 | Peto Odds Ratio (Peto, Fixed, 95% CI) | 0.90 [0.76, 1.07] |
| 1.7 Multiple pregnancy Show forest plot | 5 | 5252 | Peto Odds Ratio (Peto, Fixed, 95% CI) | 1.10 [0.92, 1.31] |
| 1.7.1 Multiple pregnancy rate: cumulatively | 2 | 986 | Peto Odds Ratio (Peto, Fixed, 95% CI) | 0.88 [0.61, 1.25] |
| 1.7.2 Multiple pregnancy rate: after first embryo transfer | 5 | 4266 | Peto Odds Ratio (Peto, Fixed, 95% CI) | 1.18 [0.96, 1.45] |
| 1.8 Gestational diabetes mellitus Show forest plot | 3 | 4722 | Peto Odds Ratio (Peto, Fixed, 95% CI) | 1.26 [0.92, 1.71] |
| 1.8.1 Gestational diabetes mellitus: cumulatively | 1 | 782 | Peto Odds Ratio (Peto, Fixed, 95% CI) | 0.83 [0.36, 1.94] |
| 1.8.2 Gestational diabetes mellitus: after first embryo transfer | 3 | 3940 | Peto Odds Ratio (Peto, Fixed, 95% CI) | 1.34 [0.96, 1.86] |
| 1.9 Hypertensive disorders of pregnancy Show forest plot | 3 | 4722 | Peto Odds Ratio (Peto, Fixed, 95% CI) | 1.80 [1.23, 2.64] |
| 1.9.1 Hypertensive disorders of pregnancy: cumulatively | 1 | 782 | Peto Odds Ratio (Peto, Fixed, 95% CI) | 0.70 [0.27, 1.82] |
| 1.9.2 Hypertensive disorders of pregnancy: after first embryo transfer | 3 | 3940 | Peto Odds Ratio (Peto, Fixed, 95% CI) | 2.15 [1.42, 3.25] |
| 1.10 Preterm delivery (< 37 weeks of gestational age) Show forest plot | 4 | 4926 | Peto Odds Ratio (Peto, Fixed, 95% CI) | 1.00 [0.80, 1.25] |
| 1.10.1 Preterm delivery (< 37 weeks of gestational age): cumulatively | 2 | 986 | Peto Odds Ratio (Peto, Fixed, 95% CI) | 0.62 [0.39, 0.99] |
| 1.10.2 Preterm delivery (< 37 weeks of gestational age): after first embryo transfer | 3 | 3940 | Peto Odds Ratio (Peto, Fixed, 95% CI) | 1.15 [0.89, 1.50] |
| 1.11 Perinatal and neonatal death Show forest plot | 2 | 3072 | Peto Odds Ratio (Peto, Fixed, 95% CI) | 1.18 [0.40, 3.51] |
| 1.11.1 Perinatal and neonatal death: cumulatively | 1 | 782 | Peto Odds Ratio (Peto, Fixed, 95% CI) | 0.13 [0.01, 1.30] |
| 1.11.2 Perinatal and neonatal death: after first embryo transfer | 2 | 2290 | Peto Odds Ratio (Peto, Fixed, 95% CI) | 2.27 [0.65, 7.84] |
| 1.12 Neonatal hospitalisation (> 3 days or neonatal intensive care unit admission) Show forest plot | 3 | 4722 | Peto Odds Ratio (Peto, Fixed, 95% CI) | 1.35 [1.06, 1.72] |
| 1.12.1 Neonatal hospitalisation (> 3 days or neonatal intensive care unit admission): cumulatively | 1 | 782 | Peto Odds Ratio (Peto, Fixed, 95% CI) | 1.00 [0.29, 3.48] |
| 1.12.2 Neonatal hospitalisation (> 3 days or neonatal intensive care unit admission): after first embryo transfer | 3 | 3940 | Peto Odds Ratio (Peto, Fixed, 95% CI) | 1.37 [1.07, 1.75] |
| 1.13 Large for gestational age (birth weight > 90th percentile) Show forest plot | 3 | 4722 | Peto Odds Ratio (Peto, Fixed, 95% CI) | 1.96 [1.52, 2.53] |
| 1.13.1 Large for gestational age (birth weight > 90th percentile): cumulatively | 1 | 782 | Peto Odds Ratio (Peto, Fixed, 95% CI) | 1.97 [0.63, 6.15] |
| 1.13.2 Large for gestational age (birth weight > 90th percentile): after first embryo transfer | 3 | 3940 | Peto Odds Ratio (Peto, Fixed, 95% CI) | 1.96 [1.51, 2.55] |
| 1.14 Small for gestational age (birth weight < 10th percentile) Show forest plot | 3 | 4722 | Peto Odds Ratio (Peto, Fixed, 95% CI) | 0.77 [0.61, 0.97] |
| 1.14.1 Small for gestational age (birth weight < 10th percentile): cumulatively | 1 | 782 | Peto Odds Ratio (Peto, Fixed, 95% CI) | 0.36 [0.16, 0.80] |
| 1.14.2 Small for gestational age (birth weight < 10th percentile): after first embryo transfer | 3 | 3940 | Peto Odds Ratio (Peto, Fixed, 95% CI) | 0.82 [0.65, 1.05] |
| 1.15 Congenital abnormalities per live‐born children Show forest plot | 3 | 1789 | Peto Odds Ratio (Peto, Fixed, 95% CI) | 1.08 [0.65, 1.78] |
| 1.16 Birth weight of babies born Show forest plot | 5 | Mean Difference (IV, Fixed, 95% CI) | Subtotals only | |
| 1.16.1 Birth weight of singletons | 5 | 1607 | Mean Difference (IV, Fixed, 95% CI) | 127.44 [77.08, 177.80] |
| 1.16.2 Birth weight of multiples | 4 | 804 | Mean Difference (IV, Fixed, 95% CI) | 49.46 [‐21.15, 120.08] |
| Outcome or subgroup title | No. of studies | No. of participants | Statistical method | Effect size |
| 2.1 Multiple pregnancy: after first embryo transfer Show forest plot | 5 | 2223 | Odds Ratio (M‐H, Fixed, 95% CI) | 1.09 [0.87, 1.36] |
| 2.2 Miscarriage: after first embryo transfer Show forest plot | 8 | 2451 | Odds Ratio (M‐H, Fixed, 95% CI) | 0.82 [0.66, 1.02] |
| Outcome or subgroup title | No. of studies | No. of participants | Statistical method | Effect size |
| 3.1 Additional analysis: live birth rate after first transfer per randomised woman Show forest plot | 13 | 7766 | Odds Ratio (M‐H, Fixed, 95% CI) | 1.17 [1.06, 1.28] |