Videolaringoscopia versus laringoscopia directa para pacientes adultos que requieren intubación traqueal
Resumen
Antecedentes
La intubación traqueal exitosa durante la anestesia general tradicionalmente requiere una línea de visión a la laringe lograda mediante el posicionamiento de la cabeza y el cuello y el uso de un laringoscopio para retraer la lengua y las partes blandas del suelo de la boca. Es común que surjan dificultades con la intubación, y se han diseñado laringoscopios alternativos que emplean tecnología digital o de fibras ópticas para mejorar la visibilidad cuando se predicen o se encuentran dificultades en las vías respiratorias. Entre estos dispositivos, un videolaringoscopio (VLS) rígido utiliza una hoja para retraer las partes blandas y transmite una imagen de video iluminada a una pantalla.
Objetivos
El objetivo primario fue evaluar si el uso de videolaringoscopia para la intubación traqueal en adultos que requerían anestesia general reduce los riesgos de complicaciones y el fracaso en comparación con la laringoscopia directa. El objetivo secundario fue evaluar los beneficios y los riesgos de estos dispositivos en grupos de población seleccionados, como los adultos con obesidad y los que presentan dificultades conocidas o previstas en las vías respiratorias.
Métodos de búsqueda
Se hicieron búsquedas en el Registro Cochrane Central de Ensayos Controlados (Cochrane Central Register of Controlled Trials) (CENTRAL), MEDLINE y en Embase el 10 febrero 2015. Los términos de búsqueda fueron relevantes para la pregunta de la revisión y no se limitaron según los resultados. Se realizaron búsquedas en los registros de ensayos clínicos y el seguimiento de citas hacia adelante y hacia atrás. Se volvió a realizar la búsqueda el 12 de enero de 2016; a esa búsqueda del 2016 se añadieron nuevos estudios potenciales de interés a una lista de "Estudios en espera de clasificación", y se incorporarán estos estudios en la revisión formal durante la actualización de la revisión.
Criterios de selección
Se consideraron todos los ensayos controlados aleatorizados y los estudios cuasialeatorizados con pacientes adultos sometidos a la laringoscopia realizada con un VLS o un laringoscopio Macintosh en contextos clínicos, de emergencia o extrahospitalarios. Se incluyeron diseños de estudios de grupos paralelos y cruzados (cross‐over).
Obtención y análisis de los datos
Dos autores de la revisión evaluaron de forma independiente la calidad de los ensayos, extrajeron los datos y consultaron con un tercer autor para resolver los desacuerdos. Se utilizaron procedimientos metodológicos Cochrane estándar, incluyendo la evaluación del riesgo de sesgo.
Resultados principales
Se incluyeron 64 estudios identificados durante la búsqueda de 2015 que incluían a 7044 participantes adultos y comparaban un VLS de uno o más diseños con un laringoscopio Macintosh. Se identificaron 38 estudios en espera de clasificación y siete estudios en curso. De los 64 estudios incluidos, 61 incluían a pacientes sometidos a cirugía electiva, y tres se realizaron en un contexto de emergencia. Entre 48 estudios que incluían a participantes sin dificultades previstas en las vías respiratorias, 15 usaron técnicas para simular una vía respiratoria difícil. Siete incluyeron a participantes con dificultades conocidas o previstas en las vías respiratorias, y los estudios restantes no especificaron ni incluyeron las vías respiratorias con dificultades previstas y no previstas. Sólo dos estudios reclutaron específicamente a los participantes obesos. No fue posible cegar al intubador al dispositivo, y se observó un nivel alto de heterogeneidad inevitable, debido al número grande de estudios.
Estadísticamente, se informaron significativamente menos intubaciones fallidas cuando se utilizó un VLS (odds‐ratio (OR) Mantel‐Haenszel (M‐H), efectos aleatorios 0,35; intervalo de confianza (IC) del 95%: 0,19 a 0,65; 38 estudios; 4127 participantes) y menos intubaciones fallidas cuando se utilizó un VLS en participantes con dificultades previstas en las vías respiratorias (OR M‐H, efectos aleatorios 0,28; IC del 95%: 0,15 a 0,55; seis estudios; 830 participantes). La calidad de esta evidencia se consideró moderada sobre la base del sistema GRADE. Las intubaciones fallidas fueron menores cuando se utilizó un VLS en participantes con una simulada vía respiratoria difícil (OR M‐H, efectos aleatorios 0,18; IC del 95%: 0,04 a 0,77; nueve estudios; 810 participantes), pero los grupos sin previsión de tener vías respiratorias difíciles no proporcionaron resultados significativos (OR M‐H, efectos aleatorios 0,61; IC del 95%: 0,22 a 1,67; 19 estudios; 1 743 participantes).
Ocho estudios informaron sobre la hipoxia y sólo tres de ellos describieron algún evento; los resultados no mostraron diferencias entre los dispositivos para este resultado (OR M‐H, efectos aleatorios 0,39; IC del 95%: 0,10 a 1,44; 1319 participantes). De igual manera, pocos estudios informaron sobre la mortalidad y no observaron diferencias entre los dispositivos (OR de M‐H, efecto fijo 1,09; IC del 95%: 0,65 a 1,82; dos estudios; 663 participantes) y sólo un estudio informó sobre la aparición de complicaciones respiratorias (78 participantes); estos tres resultados se calificaron como de muy baja calidad debido a la falta de datos. No se encontraron diferencias estadísticamente significativas entre los dispositivos en la proporción de primeros intentos exitosos (OR M‐H, efectos aleatorios 1,27; IC del 95%: 0,77 a 2,09; 36 estudios; 4731 participantes) ni en aquellos que necesitaban más de un intento. La calidad de esta evidencia se calificó como moderada. Los estudios no informaron diferencias estadísticamente significativas en la incidencia de dolor de garganta en la unidad de cuidados posanestésicos (UPA) (OR M‐H, efectos aleatorios 1,00 (IC del 95%: 0,73 a 1,38); 10 estudios; 1548 participantes) ni a las 24 horas postoperatorias (OR M‐H, efectos aleatorios 0,54; IC del 95%: 0,27 a 1,07; ocho estudios; 844 participantes); se calificó la calidad de esta evidencia como moderada. Los datos combinados para incluir estudios de diseño cruzado (cross‐over) revelaron significativamente menos traumatismos laríngeos o de las vías respiratorias (OR M‐H, efectos aleatorios 0,68; IC del 95%: 0,48 a 0,96; 29 estudios; 3110 participantes) y menos incidencias de ronquera postoperatoria (OR M‐H, efecto fijo 0,57; IC del 95%: 0,36 a 0,88; seis estudios; 527 participantes) cuando se usó un VLS. Un mayor número de laringoscopias realizadas con un VLS lograron una visión de la mayor parte de la glotis (OR M‐H, efectos aleatorios 6,77; IC del 95%: 4,17 a 10,98; 22 estudios; 2240 participantes), menos laringoscopias realizadas con un VLS no lograron una visión de la glotis (OR M‐H, efectos aleatorios 0,18; IC del 95%: 0,13 a 0,27; 22 estudios; 2240 participantes) y un VLS fue más fácil de usar (OR M‐H, efectos aleatorios 7,13; IC del 95%: 3,12 a 16,31; siete estudios; 568 participantes).
Aunque un gran número de estudios informó el tiempo necesario para la intubación traqueal (55 estudios; 6249 participantes), no se presentó una estimación de los efectos para este resultado debido al nivel extremadamente alto de heterogeneidad estadística (I2 = 96%).
Conclusiones de los autores
Los videolaringoscopios podrían reducir el número de fracasos en la intubación, en particular entre los pacientes que se presentan con dificultades en las vías respiratorias. Mejoran la visión glótica y podrían reducir el traumatismo laríngeo/de las vías respiratorias. En la actualidad, no hay evidencia para indicar que el uso de un VLS reduce el número de intentos de intubación o la incidencia de hipoxia o complicaciones respiratorias, ni evidencia para indicar que el uso de un VLS afecta el tiempo requerido para la intubación.
PICOs
Resumen en términos sencillos
Videolaringoscopios para guiar la inserción de tubos respiratorios en pacientes quirúrgicos adultos
Antecedentes
Los pacientes que requieren anestesia general necesitan asistencia respiratoria durante la cirugía. Para brindar dicha asistencia, el anestesista podría insertar un tubo a través de la boca o la nariz, bajar por la tráquea y llegar a los pulmones. Para realizar este procedimiento, conocido como intubación traqueal, el anestesista por lo general usa un instrumento metálico llamado laringoscopio para correr la lengua y los partes blandas de la boca y poder ver las cuerdas vocales directamente antes de la intubación. Sin embargo, podría ser difícil ver las cuerdas vocales, p.ej. cuando el paciente presenta restricciones en el movimiento del cuello, y cualquier dificultad en la intubación podría dar lugar a complicaciones para el paciente. Otros laringoscopios, llamados videolaringoscopios, emplean tecnología de video y podrían mejorar la visión del anestesista antes de la intubación. Esta tecnología permite al anestesista ver realmente la posición del tubo en una pantalla de video mientras lo está insertando. Esta revisión procuró evaluar si los videolaringoscopios reducen los riesgos de complicaciones y el fracaso en la intubación.
Características de los estudios
La evidencia está actualizada hasta el 10 de febrero de 2015. Se encontraron 64 estudios con 6895 participantes. Los estudios compararon a anestesistas que utilizaron diferentes tipos de videolaringoscopios con anestesistas que utilizaron un laringoscopio estándar Macintosh sin la característica de video. Se repitió la búsqueda el 12 de enero de 2016 y se considerarán los nuevos estudios de interés cuando se actualice la revisión.
Resultados clave
Se combinaron los resultados de los estudios mediante pruebas estadísticas y se encontraron menos fracasos en las intubaciones que requirieron intubación con el dispositivo alternativo cuando se usó un videolaringoscopio en los pacientes, incluidos los que presentaban dificultades en las vías respiratorias, en comparación con el uso del laringoscopio estándar. Los participantes también presentaron menos probabilidades de tener lesiones menores en la boca/garganta o de experimentar ronquera después de la intervención quirúrgica. Los anestesistas tuvieron una mejor visión antes de la intubación y evaluaron el videolaringoscopio como más fácil de usar que un laringoscopio estándar. Los investigadores no informaron diferencias en el número de participantes adultos con dolor de garganta ni diferencias en el número de primeros intentos exitosos o el número general de intentos. No fue posible combinar los datos para comparar los estudios estadísticamente para el tiempo que tomó el uso de un videolaringoscopio debido al número de diferencias en los puntos temporales medidos. Se identificaron 38 estudios para su posible inclusión y se evaluarán estos estudios durante la actualización de la revisión.
Calidad de la evidencia
Aunque se observaron buenos métodos en algunos de los estudios, no fue posible para los investigadores ocultar al anestesista al tipo de laringoscopio utilizado, y se cree que este hecho podría haber comprometido la calidad de la evidencia a favor de cualquiera de los tipos de laringoscopio.
Conclusiones
La evidencia indica que los videolaringoscopios podrían mejorar el éxito de la intubación traqueal, en particular cuando el paciente presenta dificultades en las vías respiratorias.
Authors' conclusions
Summary of findings
| Videolaryngoscopy compared with direct laryngoscopy for tracheal intubation | ||||||
| Patient or population: patients requiring tracheal intubation | ||||||
| Outcomes | Illustrative comparative risks* (95% CI) | Relative effect | Number of participants | Quality of the evidence | Comments | |
|---|---|---|---|---|---|---|
| Assumed risk | Corresponding risk | |||||
| Direct laryngoscopy | Videolaryngoscopy | |||||
| Failed intubation | Study population | OR 0.35 | 4127 | ⊕⊕⊕⊝ | Downgraded by 1 level. See footnote. | |
| 94 per 1000 | 35 per 1000 | |||||
| Moderate | ||||||
| Hypoxia | Study population | OR 0.39 | 1319 | ⊕⊝⊝⊝ | Downgraded by 3 levels. See footnotes. | |
| 58 per 1000 | 23 per 1000 | |||||
| Moderate | ||||||
| Serious respiratory complications | See comment | See comment | Not estimable | 78 | ⊕⊝⊝⊝ | Insufficient data to complete meta‐analysis. Downgraded by 2 levels. See footnotes. |
| Mortality | Study population | OR 1.09 | 663 | ⊕⊝⊝⊝ | Downgraded by 3 levels. See footnotes. | |
| 106 per 1000 | 114 per 1000 | |||||
| Very low | ||||||
| Proportion of successful first attempts | Study population | OR 0.79 | 4731 | ⊕⊕⊕⊝ | Downgraded by 1 level. See footnotes. | |
| 831 per 1000 | 795 per 1000 | |||||
| Moderate | ||||||
| Sore throat | Study population | OR 1.00 | 1548 | ⊕⊕⊕⊝ | Downgraded by 1 level. See footnotes. | |
| 250 per 1000 | 289 per 1000 | |||||
| Moderate | ||||||
| Time for tracheal intubation | See comment | See comment | Not estimable | 4488 | ⊕⊝⊝⊝ | High level of statistical heterogeneity between studies; therefore meta‐analysis not completed. Downgraded by 3 levels. See footnotes. |
| *The basis for the assumed risk (e.g. median control group risk across studies) is provided in footnotes. The corresponding risk (and its 95% confidence interval) is based on the assumed risk in the comparison group and the relative effect of the intervention (and its 95% CI). | ||||||
| GRADE Working Group grades of evidence | ||||||
| aNot possible to blind intubator to device. Downgraded for study limitations. | ||||||
Background
Description of the condition
Securing the patient’s airway is a critical step in providing general anaesthesia. Recent data from the Fourth National Audit Project of the Royal College of Anaesthetists and Difficult Airway Society (NAP4) in the UK suggest that tracheal intubation is used for airway management in 38.4% of general anaesthetics, estimated at 1.1 million procedures per year (Woodall 2011). A cuffed tracheal tube, which is considered the most reliable device for securing the airway, is inserted through the mouth and larynx and into the trachea to enable oxygenation and ventilation, and to prevent aspiration, during general anaesthesia.
A clear view may be achieved by flexing the lower cervical spine and extending the upper cervical spine (a 'sniffing the morning air' position), enabling the intubator to create 'line of sight' to the larynx to pass the tracheal tube. Retractor type laryngoscopes, typically a detachable metal blade with handle (e.g. the Macintosh curved blade), are used to retract the tongue and soft tissue in the floor of the mouth during this procedure, which is termed 'direct laryngoscopy'. However, although these laryngoscopes may be adequate for moving soft tissue, the intubator still requires line of sight to the larynx, provided by correct head and neck positioning of the patient.
Failed or difficult intubation is associated with complications, such as increased risk of hypertension, desaturation, unexpected admission to the intensive care unit (ICU) and death (Caplan 1990; King 1990; Rose 1994). Such difficulties during intubation are estimated to occur in 1% to 6% of cases, whereas failed intubation occurs in only 0.1% to 0.3% (Crosby 1998; Shiga 2005).
Airway management difficulties are increased when patients are obese (Juvin 2003; Lundstrom 2009). In the UK, NAP4 showed that obese patients accounted for 42% of patients who experienced a major airway complication during anaesthesia (Cook 2011). Functional residual capacity (FRC), which is the volume of air left in the lungs at the end of normal expiration, is reduced in obese patients; this, along with other factors, reduces respiratory reserve and makes these patients vulnerable to hypoxia if an airway is lost, making airway management more time critical and increasing the risk of postoperative chest infection and other complications (Adams 2000; Malhotra 2008; Marley 2005).
In addition to obesity, intubation may prove difficult for other reasons, for example, restrictions in neck flexion, a narrow jaw opening, an enlarged tongue, poor tissue mobility and cervical instability. Predictive tests, for example, the Mallampati or Wilson index test (Mallampati 1985; Wilson 1988), are used before anaesthesia is given. The Mallampati score, which is based on the view of the soft palate when the patient opens his mouth, is the most widely used predictor of difficult intubation, but this and other prediction tests have been shown to have low positive predictive value for difficult intubation (Shiga 2005).
Patients who are admitted to the ICU and to the emergency department may differ from elective patients scheduled for general anaesthesia. Many patients are admitted to the ICU or the emergency department because they have vulnerable airways, which may be due to major trauma requiring cervical spine protection, airway swelling, direct airway trauma or lung injury, major head and neck surgery or infection. Critical care teams may need to provide airway management in the emergency department at very short notice without the presence of an anaesthetist (Cook 2011).
Description of the intervention and how it might work
Alternative devices, such as a videolaryngoscope (VLS), rely on fibreoptic or digital technology to transmit an image from the tip of the laryngoscope to an eyepiece or monitor, where it is viewed by the intubator. These devices may be flexible or rigid in design for the purpose of assisting in difficult intubations and reducing difficulty, failure, trauma and other complications. For this review, we are interested in the rigid videolaryngoscope, which uses a blade to retract the soft tissues and transmits a video image to a screen attached to the end of the handle or to a monitor. This design enables a lighted view of the larynx without direct 'line of sight' and therefore can assist when difficulty is encountered (or predicted) with direct laryngoscopy.
The Cormack and Lehane classification system describes the intubator’s view of the larynx during laryngoscopy (Cormack 1984), with a score or 4 indicating a poor view and a score of 1 indicating a good view. Studies suggest that the use of videolaryngoscopes improves these visualization scores (e.g. a Storz V‐Mac videolaryngoscope compared with a Macintosh laryngoscope in Kaplan 2006). Videolarngoscopes may therefore provide the possibility of more successful intubation for patients in whom direct laryngoscopy may be difficult. They also may be used after unsuccessful attempts to intubate with direct laryngoscopy.
Why it is important to do this review
Use of a videolaryngoscope may aid visualization, but evidence is required to establish whether this equates with increased success of intubation with reduced complications. Recent non‐Cochrane reviews of VLS models have concentrated on their impact on process measures, such as the view of the larynx, first‐time and overall intubation success rates and intubation time, and have concluded that there is limited evidence to support their use in tracheal intubation in unselected populations and in those with a known or anticipated difficult direct laryngoscopy (Griesdale 2012b; Healy 2012; Niforopoulou 2010). A systematic review and meta‐analysis of 17 studies of the GlideScope reported advantages for non‐expert intubators (Griesdale 2012b).
No reviews have considered the use of VLS specifically in obese patients. The prevalence of obesity is increasing in both developed and developing countries (current figures: http://www.oecd.org/), as is the number of obese patients requiring anaesthesia. It is important to establish whether videolaryngoscopy is a more effective technique for this patient group, as well as for other selected and unselected groups.
We wish to update the non‐Cochrane reviews above by focusing only on evidence derived from randomized controlled trials (RCTs) and by considering, when possible, patient relevant outcomes such as complications. We aimed to consider studies in both unselected and selected populations, and to include studies of obese participants. This review will continue the work of the current review authors in published reviews such as "Supraglottic airway devices versus tracheal intubation for airway management during general anaesthesia in obese patients" (Nicholson 2013a) and "Tracheal intubation with a flexible intubation scope for obese patients requiring general anaesthesia" (Nicholson 2013b). This review does not focus on videolaryngoscopy in children, as this topic is the focus of another Cochrane review (Abdelgadir 2014).
Objectives
Our primary objective was to assess whether use of videolaryngoscopy for tracheal intubation in adults requiring general anaesthesia reduces risks of complications and failure compared with direct laryngoscopy. Our secondary aim was to assess the benefits and risks of these devices in selected population groups, such as adults with obesity and those with a known or predicted difficult airway.
Methods
Criteria for considering studies for this review
Types of studies
We included randomized controlled trials (RCTs) of both parallel and cross‐over design. We did not include simulation or mannequin studies.
Types of participants
We included trials of participants aged 16 years and older who required tracheal intubation during general anaesthesia. We included participants scheduled for surgery, as well as participants requiring tracheal intubation in the emergency department or the ICU under general anaesthesia. We included trials with unselected patient populations, those restricted to participants with known or predicted difficult laryngoscopy (e.g. Mallampati score III or IV (Mallampati 1985) or previous Cormack and Lehane score III or IV (Cormack 1984) with direct laryngoscopy) and those restricted to participants with a body mass index (BMI) > 30 kg/m2.
Types of interventions
We included studies that compared the use of a videolaryngoscope of any model versus direct laryngoscopy with a Macintosh blade.
We provide a list of example models and manufacturers in Appendix 1. We excluded optical stylets.
Types of outcome measures
Our primary outcomes were serious complications that may arise from difficulties with intubation. We included failed intubation with the first choice of device as a primary outcome. This is an important indicator of the success of an intubation technique. Failed intubation with the first device may not always result in an adverse consequence for the patient, but it increases the risk of serious complications, especially in obese patients (Cook 2012). The other primary outcome was hypoxia. Our secondary outcomes included mortality and serious airway complications, as well as surrogate process markers for airway problems, such as the number of attempts at intubation. We also assessed the impact of sore throat or hoarseness after surgery on patient‐reported measures as surrogate measures of airway trauma.
We did not include outcomes as part of the study eligibility assessment. We included studies that reported on any of the relevant outcomes even if they were not primary study outcomes.
Primary outcomes
-
Failed intubation or change of device required
-
Hypoxia between start of intubation and recovery from anaesthesia, with dichotomous data (episodes of arterial oxygen saturation < 90%) or continuous data (lowest or mean arterial oxygen saturation)
Secondary outcomes
-
Mortality within 30 days of anaesthesia
-
Serious respiratory complications (including aspiration) within 30 days of anaesthesia
-
Laryngeal or airway trauma – including any one of damage to vocal cords, bleeding or dental injury
-
Patient‐reported sore throat or hoarseness ‐ both early (within two hours of anaesthesia) and late (within 48 hours of anaesthesia)
-
Proportion of successful first attempts at tracheal intubation
-
Number of attempts at tracheal intubation
-
Total time for tracheal intubation and commencement of ventilation
-
Difficulty of tracheal intubation ‐ assessed by intubator or observer, using a locally derived or validated difficulty scale
-
Improved visualization of the larynx as measured on a validated scale (such as the Cormack and Lehane classification system (Cormack 1984); the POGO (percentage of glottic opening) score (Levitan 1998); or classification system by (Cook 2000).
Search methods for identification of studies
Electronic searches
We searched for eligible trials on 10 February 2015 in the following databases: Cochrane Central Register of Controlled Trials (CENTRAL; 2015, Issue 2) in the Cochrane Library (searched 10 February 2015), MEDLINE via Ovid (1970 to 10 February 2015) and Embase via Ovid (1980 to 10 February 2015). We applied the Cochrane highly sensitive filter for randomized controlled trials in MEDLINE and Embase. We searched the trial register www.clinicaltrials.gov for ongoing trials. We have presented our search strategies for MEDLINE, Embase and CENTRAL in Appendix 2, Appendix 3 and Appendix 4. We searched using both medical subject headings (MeSH) (or equivalent structured vocabulary in other databases) and free text.
We included publications that reported study data, including abstracts. We applied no restrictions on language of publication.
We reran the searches in the databases above (CENTRAL, MEDLINE and Embase) on 12 January 2016. We have added potential new studies identified during the 2016 search to Characteristics of studies awaiting classification and will incorporate these into the formal review during the review update.
Searching other resources
We undertook forward and backward citation tracking for key review articles and eligible articles identified through the electronic resources.
Data collection and analysis
Selection of studies
We collated results of the searches and removed duplicates.
Two review authors (Sharon Lewis (SL) and Andrew Butler (AB)) screened all titles and abstracts to remove studies that were ineligible. If no abstract was available but the title was possibly relevant, we obtained the full text of the article.
We (SL and AB) reviewed the full texts of potentially relevant titles. Each review author used software (www.covidence.org) to record decisions and reach consensus at each stage. We reported in a PRISMA (Preferred Reporting Items for Systematic Reviews and Meta‐analyses) flow chart the numbers of full‐text papers assessed and exclusions at each stage, along with reasons for those reviewed in full text.
Data extraction and management
Two of three review authors (SL, AB and Joshua Parker (JP)) extracted data from eligible studies using Covidence software (Covidence).
We successfully contacted the authors of Ahmad 2013, Cordovani 2013 and Suzuki 2008 for additional information. We resolved disagreements by discussion and, if necessary, by consultation with Tim Cook (TC) or Andrew Smith (AS).
Assessment of risk of bias in included studies
We used the Cochrane risk of bias tool to assess the quality of study design and the extent of potential bias (Higgins 2011) by considering the following domains.
-
Sequence generation.
-
Allocation concealment.
-
Blinding of participants, personnel and outcomes assessors.
-
Incomplete outcome data.
-
Selective outcomes reporting.
It was not possible for the anaesthetist or the intubator to be blinded to the intervention for this research question and, similarly, it was difficult for assessors of outcomes during intubation to be unaware of the allocation of the participant. Outcomes assessed during or after the operation, such as airway trauma or respiratory complications, could be assessed by staff other than the intubator who were unaware of the laryngoscopy device. It is feasible that the asleep participant may not know the device used, which may be important for patient‐reported outcomes, such as sore throat.
Other sources of bias
We paid particular attention to sources of funding and the role of manufacturers and also considered the potential for selective reporting bias. We reviewed the original protocol of the trial, if this was available, to identify any changes to procedure or missing outcome data that may indicate bias.
We considered baseline characteristics of participants as well as the expertise of the anaesthetist, which has the potential to be an important confounder in this review.
We included cross‐over trials, but we conducted sensitivity analyses to determine whether they had introduced bias into the results.
Measures of treatment effect
The outcomes in this review are mainly dichotomous outcomes (mortality, complications, successful first attempt, failed intubation). For dichotomous outcomes, we entered totals and numbers of events within each randomization group into RevMan 5.3 and calculated odds ratios with 95% confidence intervals. For continuous measures (e.g. time for intubation), we calculated mean differences. We recorded some outcomes on short ordinal scales (e.g. number of attempts, intubation difficulty scores, scales of improved visualization). We converted these to dichotomous data when appropriate.
Unit of analysis issues
As well as including studies of cross‐over design, we included studies that reported more than one comparison, for example, groups allocated to two designs of videolaryngoscopes compared with a direct laryngoscopy group. We compared an amalgamated comparison group (combining each type of videolaryngoscope) with the control group, initially at least, to create a single pair‐wise comparison (Section 16.5.4 of Higgins 2011). In subgroup analyses, we presented the data for each device separately. When it was not possible to amalgamate data without unit of analysis error, we chose to include data from the VLS group that would be closest to a result of 'no effect' ‐ we then addressed these decisions in a sensitivity analysis.
Dealing with missing data
We attempted to contact study authors to request missing data and included results only when study authors confirmed data. We did not include results reported in abstracts in which denominator figures were not explicitly stated and for which we were unable to reach study authors.
Assessment of heterogeneity
We expected that the findings for any given outcome may differ between the studies included in the review. This heterogeneity may be due to:
-
BMI > 30 kg/m2 and degree of obesity;
-
anticipated degree of difficulty of airway, with measures such as Mallampati score;
-
expertise of intubator, VLS device used (e.g. GlideScope or Pentax);
-
urgency of intubation (emergency vs elective); or
-
site of intubation (operating theatre, emergency department, ICU).
We assessed heterogeneity by using Chi2 and I2 statistics. We investigated important heterogeneity (Chi2 test with P < 0.1 or I2 > 50%) by performing subgroup analyses.
Assessment of reporting biases
We examined a funnel plot to assess the potential for publication bias for our primary outcome.
Data synthesis
We carried out meta‐analysis for outcomes for which we had comparable effect measures from more than one study, and when measures of heterogeneity indicated that pooling of results was appropriate. An I2 statistical value > 80% would argue against presentation of an overall estimate. Our choice of a fixed‐effect or random‐effects statistical model for any meta‐analysis was influenced by study characteristics, in particular, the extent of methodological or clinical differences between studies. We used Mantel‐Haenszel models for all dichotomous outcomes. For our continuous outcome (i.e. time for tracheal intubation) we used the inverse variance method.
We initially combined all designs of VLS and all population types, when appropriate, before dividing data by VLS design and by unselected and selected participant groups.
Subgroup analysis and investigation of heterogeneity
We considered whether the results of meta‐analysis for the outcome of failed intubation differed for:
-
different designs of VLS;
-
obese and non‐obese participants;
-
anticipated or known difficult laryngoscopy;
-
different sites of intubation (operating theatre, emergency department, ICU); and
-
experienced and inexperienced intubator.
We defined experienced intubators as those who had equivalent experience in the clinical setting of at least 20 uses with each device, and inexperienced intubators as those with fewer than 20 uses of a VLS.
Sensitivity analysis
We undertook sensitivity analyses to explore the potential impact of missing data in our risk of bias assessment. We also considered the potential impact of data analysis decisions on the results.
Summary of findings
We used the principles of the GRADE system to give an overall assessment of evidence related to each of the following outcomes (Guyatt 2008).
-
Failed intubation or change of laryngoscopy device required.
-
Hypoxia between start of intubation and recovery from anaesthesia.
-
Mortality within 30 days of anaesthesia.
-
Serious respiratory complications (including pulmonary aspiration of gastric contents and lower respiratory tract infection) within 30 days of anaesthesia.
-
Sore throat.
-
Proportion of successful first attempts.
-
Total time for tracheal intubation and commencement of ventilation.
The GRADE approach incorporates risk of bias, directness of evidence, heterogeneity of data, precision of effect estimates and risk of publication bias to give an overall measure of how confident we can be that our estimate of effect is correct. SL used GRADEpro software to create a 'Summary of findings' table for each outcome and discussed discrepancies with AS.
Results
Description of studies
Results of the search
We screened 3412 titles and abstracts, of which we identified 406 through forward and backward citation searching. We also screened titles from clinical trials register searches. We assessed 283 full texts for eligibility. See Figure 1.
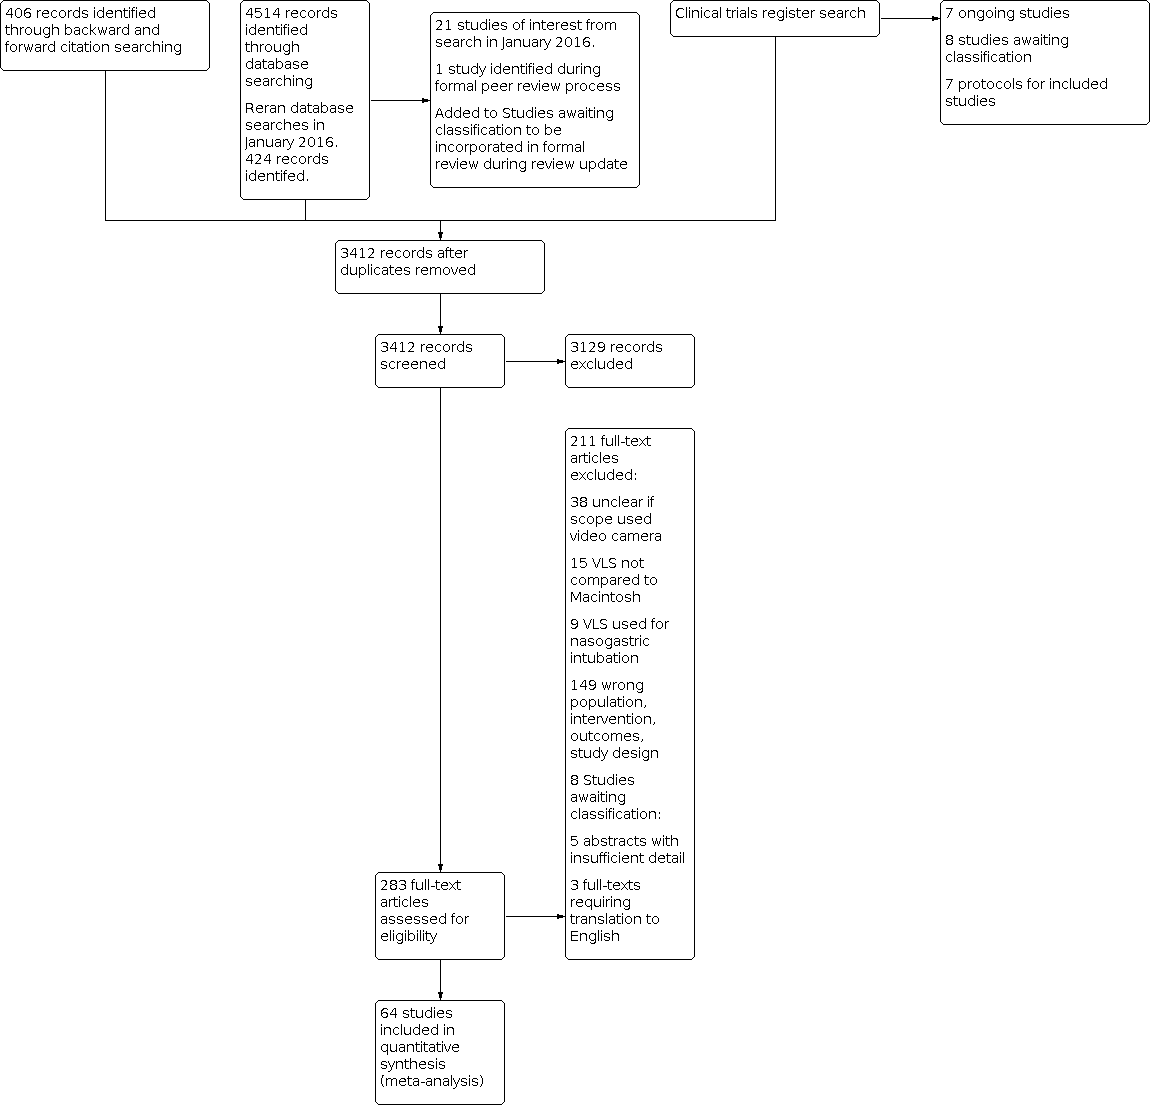
Study flow diagram.
We reran the search in January 2016 and screened an additional 424 titles and abstracts, following removal of duplicates. See Characteristics of studies awaiting classification.
Included studies
From the search in February 2015, we identified 64 studies that we included in the review (Abdallah 2011; Ahmad 2013; Andersen 2011; Aoi 2010; Arici 2014; Arima 2014; Aziz 2012; Bensghir 2010; Bensghir 2013; Bilehjani 2009; Carassiti 2013; Cavus 2011; Choi 2011; Cordovani 2013; Dashti 2014; Enomoto 2008; Frohlich 2011; Griesdale 2012; Gupta 2013; Hirabayashi 2007a; Hirabayashi 2009; Hindman 2014; Hsu 2012; Ilyas 2014; Ithnin 2009; Jungbauer 2009; Kanchi 2011; Kill 2013; Kim 2013; Komatsu 2010; Lee 2009; Lee 2012; Lee 2013; Lim 2005; Lin 2012; Maassen 2012; Malik 2008; Malik 2009a; Malik 2009b; Maruyama 2008a; Maruyama 2008b; McElwain 2011; Najafi 2014; Nishikawa 2009; Peck 2009; Pournajafian 2014; Robitaille 2008; Russell 2012; Russell 2013; Sandhu 2014; Serocki 2010; Serocki 2013; Shippey 2013; Siddiqui 2009; Sun 2005; Suzuki 2008; Takenaka 2011; Taylor 2013; Teoh 2010; Turkstra 2005; Walker 2009; Woo 2012; Xue 2007; Yeatts 2013). All identified studies were RCTs. We identified no quasi‐randomized studies and no cluster trials. We have summarized details of the individual studies, including countries in which studies were conducted, in the Characteristics of included studies section. See Characteristics of studies awaiting classification for potentially relevant studies identified in the search conducted in January 2016.
A total of 7044 participants were included in the 64 studies. One study took place in the intensive care unit (Griesdale 2012), one at a trauma centre (Yeatts 2013) and one in an out‐of‐hospital setting (Arima 2014), all with participants requiring emergency treatment. The remaining 61 studies took place in the hospital theatre setting with elective surgical participants. Two studies specified inclusion of only obese participants (Abdallah 2011; Andersen 2011), one study included only obstetrical participants (Arici 2014), one study only participants with untreated hypertension (Dashti 2014) and one study only participants from the burns unit (Woo 2012).
We identified 17 studies conducted by a cross‐over design (Carassiti 2013; Cavus 2011; Cordovani 2013; Enomoto 2008; Hindman 2014; Ilyas 2014; Lee 2009; Lee 2012; Maassen 2012; Maruyama 2008a; Peck 2009; Robitaille 2008; Russell 2012; Serocki 2010; Serocki 2013; Taylor 2013; Turkstra 2005) and 47 studies with a parallel design. Those studies described by study authors as cross‐over designs used one type of laryngoscope initially to assess glottic view, followed by the other type of laryngoscope to assess glottic view and perform intubation. The exception to this was Hindman 2014, which intubated participants after laryngoscopy with each device. Participants in both cross‐over designs were randomized by different orders of laryngoscope.
We included nine different types of VLS in our analysis; data showed comparisons with GlideScope (29 studies: Ahmad 2013; Andersen 2011; Bilehjani 2009; Carassiti 2013; Choi 2011; Cordovani 2013; Dashti 2014; Griesdale 2012; Hsu 2012; Ithnin 2009; Kill 2013; Lee 2012; Lim 2005; Malik 2008; Malik 2009b; Najafi 2014; Pournajafian 2014; Robitaille 2008; Russell 2012; Russell 2013; Sandhu 2014; Serocki 2010; Serocki 2013; Siddiqui 2009; Sun 2005; Teoh 2010; Turkstra 2005; Xue 2007; Yeatts 2013), Pentax AWS (20 studies: Abdallah 2011; Aoi 2010; Arima 2014; Enomoto 2008; Hirabayashi 2007a; Hirabayashi 2009; Kanchi 2011; Kim 2013; Komatsu 2010; Lee 2013; Malik 2008; Malik 2009a; Malik 2009b; Maruyama 2008a; Maruyama 2008b; Nishikawa 2009; Suzuki 2008; Takenaka 2011; Teoh 2010; Woo 2012), C‐MAC (C‐MAC ‐ nine studies: Aziz 2012; Cavus 2011; Gupta 2013; Jungbauer 2009; Lee 2009; Lee 2012; Maassen 2012; McElwain 2011; Teoh 2010; DCI ‐ one study: Serocki 2010) and McGrath (McGrath Series 5 ‐ six studies: Arici 2014; Frohlich 2011; Ilyas 2014; Lee 2012; Taylor 2013; Walker 2009; McGrath with unspecified design ‐ two studies: Peck 2009; Shippey 2013). The remaining VLS comparisons included X‐lite for only two studies (Bensghir 2010; Bensghir 2013) or individual studies; C‐MAC D‐blade (Serocki 2013); Airtraq (with video) (Hindman 2014; McElwain 2011); Truview EVO2 (Malik 2008); and CEL‐100 (Lin 2012). Most studies used a two‐arm design, comparing one type of VLS with a Macintosh blade. However, eight studies (Cavus 2011; Lee 2012; Malik 2008; Malik 2009b; McElwain 2011; Serocki 2010; Serocki 2013; Teoh 2010) conducted multi‐arm comparisons with two or three types of VLS versus a Macintosh blade. Gupta 2013 used a multi‐arm design but compared a C‐MAC blade and a Macintosh blade, both with and without the use of a stylet, to aid intubation. We have provided further details of included VLS designs in Appendix 5.
Four of the multi‐arm studies (Cavus 2011; Lee 2012; Serocki 2010; Serocki 2013) used a cross‐over design.
We included three studies that used a double‐lumen tracheal tube for intubation (Bensghir 2010; Cordovani 2013; Russell 2013). All remaining studies used a single‐lumen tube.
Forty‐eight studies recruited patients without predicted difficult airways (Andersen 2011; Aoi 2010; Arici 2014; Bensghir 2010; Bensghir 2013; Bilehjani 2009; Carassiti 2013; Choi 2011; Dashti 2014; Enomoto 2008; Griesdale 2012; Gupta 2013; Hirabayashi 2007a; Hirabayashi 2009; Hindman 2014; Hsu 2012; Ilyas 2014; Ithnin 2009; Kanchi 2011; Kill 2013; Kim 2013; Komatsu 2010; Lee 2012; Lee 2013; Lim 2005; Lin 2012; Maassen 2012; Malik 2008; Malik 2009a; Maruyama 2008a; Maruyama 2008b; McElwain 2011; Najafi 2014; Nishikawa 2009; Peck 2009; Pournajafian 2014; Robitaille 2008; Russell 2012; Russell 2013; Shippey 2013; Siddiqui 2009; Sun 2005; Takenaka 2011; Taylor 2013; Turkstra 2005; Walker 2009; Woo 2012; Xue 2007). Six studies recruited patients with a known or predicted difficult airway (Aziz 2012; Cordovani 2013; Jungbauer 2009; Malik 2009b; Serocki 2010; Serocki 2013); of these, two studies specified inclusion of patients with restricted cervical mobility (Aziz 2012; Serocki 2013). Two studies specified recruitment of participants both with and without predicted airway difficulties (Cavus 2011; Teoh 2010). Eight did not specify airway difficulties in the inclusion or exclusion criteria (Abdallah 2011; Ahmad 2013; Arima 2014; Frohlich 2011; Lee 2009; Sandhu 2014; Suzuki 2008; Yeatts 2013). For those participants recruited without predicted difficult airways, 15 studies used techniques (such as manual in‐line stabilization) to simulate a difficult airway (Aoi 2010; Enomoto 2008; Gupta 2013; Ilyas 2014; Komatsu 2010; Lim 2005; Malik 2008; Malik 2009a; Maruyama 2008a; McElwain 2011; Peck 2009; Robitaille 2008; Shippey 2013; Taylor 2013; Turkstra 2005).
Most studies specified the use of experienced anaesthetists to perform laryngoscopies (47 studies: Abdallah 2011; Ahmad 2013; Andersen 2011; Aoi 2010; Arici 2014; Arima 2014; Aziz 2012; Bensghir 2013; Bilehjani 2009; Carassiti 2013; Cavus 2011; Choi 2011; Cordovani 2013; Dashti 2014; Frohlich 2011; Gupta 2013; Hindman 2014; Hsu 2012; Ilyas 2014; Ithnin 2009; Jungbauer 2009; Kanchi 2011; Kim 2013; Komatsu 2010; Lee 2009; Lee 2012; Lee 2013; Lin 2012; Malik 2008; Malik 2009a; Malik 2009b; Maruyama 2008a; McElwain 2011; Najafi 2014; Nishikawa 2009; Pournajafian 2014; Robitaille 2008; Russell 2013; Serocki 2010; Serocki 2013; Siddiqui 2009; Sun 2005; Takenaka 2011; Teoh 2010; Turkstra 2005; Woo 2012; Xue 2007). Five studies used anaesthetists who were described as novices or who were trained with mannequins but had no patient experience (Griesdale 2012; Hirabayashi 2007a; Hirabayashi 2009; Taylor 2013; Walker 2009). Five studies used both novice and experienced anaesthetists (Bensghir 2010; Kill 2013; Lim 2005; Russell 2012; Yeatts 2013). Seven studies did not specify the experience of anaesthetists (Enomoto 2008; Maassen 2012; Maruyama 2008b; Peck 2009; Sandhu 2014; Shippey 2013; Suzuki 2008).
Ten study authors declared that they had received one or more of the intervention devices from the manufacturers for the purpose of the study (Abdallah 2011; Frohlich 2011; Komatsu 2010; Malik 2008; Malik 2009a; Malik 2009b; Maruyama 2008a; Maruyama 2008b; McElwain 2011; Serocki 2010). Five study authors declared that one of their study team had an interest in the company that manufactured the intervention devices (Storz manufacturers: Aziz 2012; Cavus 2011; Serocki 2013. Pentax AWS manufacturers: Enomoto 2008. McGrath manufacturers: Taylor 2013). Other studies reported department or government grant sources or did not report on this.
Excluded studies
We excluded 211 studies at the full text review stage; we have listed 70 of these under Characteristics of excluded studies. A large number of studies had used an Airtraq laryngoscope, which can be used with or without a video camera attachment. We excluded those studies in which it was unclear whether the laryngoscope had been used with the camera device. We also excluded studies of other devices in which it was not clear whether a video camera had been used. Thus we excluded from this review 30 studies comparing an Airtraq scope with a Macintosh blade (Ali 2012; Amor 2013; Chalkeidis 2010; Corso 2010; DiMarco 2011; Erden 2010; Ferrando 2011; Gaszynski 2009; Hayes 2011; Hayes 2012; Hirabayashi 2008a; Koh 2010; Maharaj 2006; Maharaj 2007; Maharaj 2008; Marco 2011; Ndoko 2008a; Park 2010; Ranieri 2012; Ranieri 2014; Sansone 2012; Saxena 2013; Stumpner 2011; Terradillos 2009; Tolon 2012; Trimmel 2011; Turkstra 2009a; Turkstra 2009b; Wang 2009; Wasem 2013) and eight studies that used other devices (Bullard, Truview, WuScope and Optiscope) (Araki 2002; Arora 2013; Barak 2007; Carlino 2009; Hastings 1995; Smith 1999; Watts 1997; Yang 2013). We excluded other studies because they lacked comparison with a Macintosh blade, used nasotracheal intubation, included patients not undergoing general anaesthesia, provided abstracts with insufficient details, did not report relevant outcomes or used the wrong study design. See Characteristics of excluded studies.
Ongoing studies
We identified seven studies through a clinical trials register search (NCT01914523; NCT01914601; NCT02088801; NCT02167477; NCT02292901; NCT02297113; NCT02305667). All studies were potentially eligible and were listed as at the stage of recruiting participants. See Characteristics of ongoing studies.
Studies awaiting classification
We identified a total of 38 studies that required further assessment for inclusion and have listed these under Characteristics of studies awaiting classification.
We identified eight studies through a clinical trials register search (NCT00178555; NCT00602979; NCT00664612; NCT01029756; NCT01114945; NCT01488695; NCT01516164; NCT02190201). All were potentially eligible and were listed as complete. However, study results were not published on the register, and we were unable to establish whether these studies had been published.
We found five additional studies that were reported in abstract form only, with insufficient detail, and we were unable to contact study authors (Ahmadi 2014; Eto 2014; Gharehbaghi 2012; Ishida 2011; Morello 2009). We will await the publication of full texts for these studies. We identified three studies that are awaiting translation before they can be assessed for inclusion (Kita 2014; Liu 2010; Wang 2008).
We identified 21 new studies for potential inclusion through screening of titles and abstracts during the search conducted in January 2016 (Ahmad 2015; Ahmadi 2015; Akbar 2015; Amini 2015; Bakshi 2015; Bhandari 2013; Bhat 2015; Colak 2015; Hamp 2015; Janz 2015; Kido 2015; Laosuwan 2015; Nakayama 2010; Pieters 2015; Postaci 2015; Rovsing 2010; Silverberg 2015; Wallace 2015; Yao 2015; Yousef 2012; Zhao 2014) and one study during the peer review process that we had excluded at an earlier stage (Cattano 2013). We will incorporate these studies into the formal review during the review update.
Risk of bias in included studies
We have included a summary of risk of bias assessments in Figure 2 and Figure 3.

Risk of bias graph: review authors' judgements about each risk of bias item presented as percentages across all included studies.

Risk of bias summary: review authors' judgements about each risk of bias item for each included study.
Allocation
All studies were described as randomized, and 36 studies provided sufficient details on the method of randomization (Abdallah 2011; Andersen 2011; Arici 2014; Aziz 2012; Bensghir 2010; Bensghir 2013; Bilehjani 2009; Carassiti 2013; Cavus 2011; Cordovani 2013; Dashti 2014; Enomoto 2008; Griesdale 2012; Gupta 2013; Hirabayashi 2007a; Hindman 2014; Ilyas 2014; Ithnin 2009; Jungbauer 2009; Kanchi 2011; Komatsu 2010; Lin 2012; Malik 2008; Malik 2009a; Malik 2009b; McElwain 2011; Najafi 2014; Nishikawa 2009; Pournajafian 2014; Robitaille 2008; Russell 2012; Russell 2013; Siddiqui 2009; Sun 2005; Teoh 2010; Turkstra 2005). Other studies failed to provide details, or review authors determined that it was unclear if the method described would be adequate to reveal whether bias had been introduced. We judged only one study (Woo 2012) to be at high risk of selection bias regarding methods of randomization.
Only nine studies provided sufficient detail about methods used to conceal allocation from personnel (Abdallah 2011; Andersen 2011; Griesdale 2012; Hindman 2014; Komatsu 2010; Lin 2012; Pournajafian 2014; Teoh 2010; Walker 2009), and we were unable to make judgements other than 'unclear' for all remaining studies.
Blinding
We judged all studies to be at high risk of performance bias, as it was not possible to blind the anaesthetist from the type of scope used.
Similarly, it was not possible for outcome assessors of the primary outcomes of failed intubation and hypoxia to be blinded, and so again we judged all studies to be at high risk of detection bias. However, seven studies reported that researchers had made attempts to blind assessors to particular outcomes such as assessment of sore throat (Abdallah 2011; Kill 2013; Lee 2013; Lin 2012; Najafi 2014; Nishikawa 2009; Siddiqui 2009). In all, 15 studies described observers as 'independent' for some outcomes (Aoi 2010; Bensghir 2013; Enomoto 2008; Gupta 2013; Hirabayashi 2007a; Hsu 2012; Kanchi 2011; Kim 2013; Lee 2012; Lim 2005; Malik 2008; Malik 2009a; Malik 2009b; McElwain 2011; Teoh 2010); although this does not equate to being blinded to group allocation, these study authors made attempts to reduce detection bias in their studies.
Incomplete outcome data
Most studies reported no participant losses during the trial or only a small number of losses that were unlikely to affect results. We obtained insufficient data for some studies reported in abstract format only (Ahmad 2013; Sandhu 2014; Shippey 2013; Suzuki 2008), and so we were unable to make judgements of bias for these. We judged seven studies as having high risk of bias (Arima 2014; Cavus 2011; Ithnin 2009; Lee 2009; Maruyama 2008b; Woo 2012; Yeatts 2013) because they reported large numbers of losses, used exclusion criteria that introduced bias to the results or made changes to the protocol during the trial.
Selective reporting
We were able to source published protocols for eight of the studies and could adequately judge these as having low risk of bias because study authors had reported on all outcomes as stated in the protocol (Andersen 2011; Aziz 2012; Cordovani 2013; Hindman 2014; Hsu 2012; Kim 2013; Walker 2009; Yeatts 2013). We did not seek protocols for all other studies and therefore could not adequately judge the risk of bias for this domain.
Other potential sources of bias
Experience of intubator
We considered the experience of the intubator to be a potential source of bias in this review, in particular whether the intubator had equivalent experience with the VLS as with the Macintosh blade. It was often not possible to judge from the information presented by study authors whether bias had been introduced by intubators' experience.
Several studies adequately described anaesthetists as having equivalent experience with both devices, and we judged these to be at low risk of bias. Some studies described experience in terms of the number of intubations performed with each device.
If anaesthetists had carried out more than 20 intubations with the VLS device in the clinical setting, or had spent a considerable length of time using the device and at least this much time with the Macintosh device, we judged these studies to be at low risk of bias (Ahmad 2013; Andersen 2011; Bensghir 2013; Carassiti 2013; Choi 2011; Cordovani 2013; Gupta 2013; Hindman 2014; Hsu 2012; Kanchi 2011; Kim 2013; Lee 2012; Lee 2013; Lin 2012; Malik 2008; Malik 2009a; Malik 2009b; Nishikawa 2009; Pournajafian 2014; Robitaille 2008; Russell 2012; Serocki 2010; Serocki 2013; Siddiqui 2009; Sun 2005; Suzuki 2008;Teoh 2010; Turkstra 2005; Woo 2012). Two studies described personnel as experienced in the use of both devices; we assumed this to be equivalent experience and judged these studies as having low risk of bias (Aoi 2010; Xue 2007). Frohlich 2011 described operators as having used the devices on at least five occasions, but we believed this information was insufficient for us to judge whether bias was introduced here.
If however anaesthetists had carried out fewer than 20 intubations with the VLS device in the clinical setting, we assumed, unless otherwise stated, that the balance of experience would favour the Macintosh group and therefore judged these studies as having high risk of bias (Abdallah 2011; Taylor 2013).
Some studies used novice personnel only, and if it was implied that the level of experience between all personnel was equivalent, we judged these studies as having low risk of bias (Griesdale 2012; Hirabayashi 2007a). Hirabayashi 2009 described personnel as novices with less experience with the videolaryngoscope compared to the Macintosh; we judged this study to be at higher risk of bias.
Some studies used both novice and experienced personnel; if study authors did not adequately explain whether the balance of experience was equivalent between groups, we judged these studies to be at high risk of bias (Aziz 2012; Kill 2013; Lim 2005). Enomoto 2008 and Lee 2009 provided adequate descriptions of equivalent experience between novice and experienced personnel for review authors to judge these studies as having low risk of bias.
In two studies, anaesthetists had equivalent experience with the devices but not with use of a double‐lumen tube; therefore, we determined that a higher level of bias had been introduced (Bensghir 2010; Russell 2013). Similarly, in studies designed to assess devices at ground level and in the lateral position, operators had less experience with devices in the simulated position; it was not clear if this experience was equivalent between devices and whether bias had been introduced (Komatsu 2010 and Takenaka 2011, respectively).
Nineteen studies did not specify the experience of the anaesthetist at all, or described the anaesthetist as experienced but did not state whether the experience was equivalent in both devices; we were unable to judge the risk of bias for these (Arici 2014; Arima 2014; Bilehjani 2009; Cavus 2011; Dashti 2014; Ilyas 2014; Ithnin 2009; Jungbauer 2009; Maassen 2012; Maruyama 2008a; Maruyama 2008b; McElwain 2011; Najafi 2014; Peck 2009; Russell 2012; Sandhu 2014; Shippey 2013; Walker 2009; Yeatts 2013).
Baseline characteristics
Four abstracts did not present sufficient information on baseline characteristics, and we were unable to make a sufficient judgement of the risk of bias for this domain (Ahmad 2013; Peck 2009; Sandhu 2014; Suzuki 2008). One full study report provided no information on baseline characteristics, and we were unable to make a decision on bias for this (Robitaille 2008). Eight of the cross‐over design studies had presented baseline characteristics for the whole group of randomized patients and not by order of scope; therefore, it was not possible to judge bias for these studies (Enomoto 2008; Hindman 2014; Maassen 2012; Maruyama 2008a; Serocki 2010; Serocki 2013; Turkstra 2005; Walker 2009). Sixteen studies had presented baseline characteristics for which we noted some differences between study groups (Hsu 2012; Ilyas 2014; Ithnin 2009; Kim 2013; Komatsu 2010; Lee 2012; Malik 2008; Malik 2009a; McElwain 2011; Najafi 2014; Russell 2012; Siddiqui 2009; Takenaka 2011; Taylor 2013; Teoh 2010; Yeatts 2013). However, it was unclear how these differences may have affected the results. We noted significant differences in the numbers of participants reported throughout Woo 2012, leading to concerns about the randomization process and adequate reporting of baseline characteristics; therefore, we judged this study as having high risk of bias.
Funding
We judged studies reporting that they had received no funding or department funding only as having low risk of bias; when studies did not report any funding source, we assumed that no funding had been received and judged these studies to be at low risk of bias (in total, 48 studies: Ahmad 2013; Andersen 2011; Aoi 2010; Arici 2014; Arima 2014; Bensghir 2010; Bensghir 2013; Bilehjani 2009; Carassiti 2013; Choi 2011; Cordovani 2013; Dashti 2014; Griesdale 2012; Gupta 2013; Hindman 2014; Hirabayashi 2007a; Hirabayashi 2009; Hsu 2012; Ilyas 2014; Ithnin 2009; Jungbauer 2009; Kanchi 2011; Kim 2013; Lee 2009; Lee 2012; Lee 2013; Lim 2005; Lin 2012; Maassen 2012; Najafi 2014; Nishikawa 2009; Peck 2009; Pournajafian 2014; Robitaille 2008; Russell 2012; Russell 2013; Sandhu 2014; Shippey 2013; Siddiqui 2009; Sun 2005; Suzuki 2008; Takenaka 2011; Teoh 2010; Turkstra 2005; Walker 2009; Woo 2012; Xue 2007; Yeatts 2013).
Ten study authors declared that they had received one or more of the intervention devices from the manufacturers for the purpose of the study (Abdallah 2011; Frohlich 2011; Komatsu 2010; Malik 2008; Malik 2009a; Malik 2009b; Maruyama 2008a; Maruyama 2008b; McElwain 2011; Serocki 2010). It was unclear if this in itself was sufficient to introduce bias, and we reported these studies as having unclear risk of bias.
Six study authors declared that one member of their study team had an interest in the manufacturing company of the intervention devices (Storz manufacturers: Aziz 2012; Cavus 2011; Serocki 2013. Pentax AWS manufacturers: Enomoto 2008. McGrath manufactures: Taylor 2013. GlideScope manufacturers: Kill 2013). We believe that this connection would present increased risk of bias towards the study results, and we therefore judged these studies to be at high risk of bias.
Effects of interventions
See: Summary of findings 1 Videolaryngoscopy compared with direct laryngoscopy for tracheal intubation
Primary outcomes
Failed intubation
Thirty‐nine studies with 4141 participants reported the number of failed intubations. Of these, eight were multi‐arm studies that presented data for more than one comparison arm (Cavus 2011; Lee 2012; Malik 2008; Malik 2009b; McElwain 2011; Serocki 2010; Serocki 2013; Teoh 2010). We combined the data from these studies for all videolaryngoscope groups and compared them with data for the Macintosh group. We did not include Hindman 2014 in the meta‐analysis, as this cross‐over design included the intubation of participants with both devices; therefore we believed this study introduced too much performance bias to be equivalent to the others. Analysis demonstrated fewer failed intubations when a VLS was used (Mantel‐Haenszel (M‐H) odds ratio (OR), random‐effects 0.35, 95% confidence interval (CI) 0.19 to 0.65; I2 = 52%; 4127 participants). See Analysis 1.1. In our 'Summary of findings' table, we downgraded this outcome owing to risk of performance bias introduced by lack of blinding, grading the quality of the evidence as moderate. See summary of findings Table 1. A funnel plot did not suggest evidence of reporting bias for this outcome. See Figure 4.

Funnel plot of comparison: 1 Failed intubation, outcome: 1.1 Failed intubation.
Hypoxia
Eight studies reported the number of participants who had hypoxia (Andersen 2011; Aziz 2012; Bensghir 2010; Bensghir 2013; Komatsu 2010; Lin 2012; Serocki 2010; Teoh 2010). The multi‐arm studies Serocki 2010 and Teoh 2010 reported no hypoxia in any group, and Andersen 2011, Komatsu 2010 and Lin 2012 reported no events. Only Aziz 2012, Bensghir 2010 and Bensghir 2013 reported participants with hypoxia, and analysis of combined data showed no differences between groups (M‐H OR, random‐effects 0.39, 95% CI 0.10 to 1.44; I2 = 70%; 1319 participants). See Analysis 2.1. Owing to the few studies with data to combine, we downgraded this evidence to very low quality. See summary of findings Table 1.
Secondary outcomes
Mortality
Only two studies with 663 participants reported mortality rates. Griesdale 2012 included a patient group requiring urgent tracheal intubation in the ICU and reported nine deaths in the videolaryngoscope group and 12 deaths in the Macintosh group, with 20 participants in each group. Yeatts 2013 included a patient group in the trauma resuscitation unit and reported 28 out of 303 deaths in the videolaryngoscope group and 24 out of 320 deaths in the Macintosh group (M‐H OR, fixed‐effect 1.09, 95% CI 0.65 to 1.82; I2 = 29%; 663 participants). See Analysis 3.1. Again owing to lack of data, we downgraded the evidence for this outcome to very low quality. See summary of findings Table 1.
Serious airway complications
One study with 78 participants (Bilehjani 2009) reported respiratory complications as an outcome, with one recorded event of pneumothorax in the Macintosh group and none in the videolaryngoscope group. Again owing to lack of data, we downgraded the evidence for this outcome to very low quality. See summary of findings Table 1.
Laryngeal/airway trauma
In all, 29 studies with a total of 41 comparisons reported data for laryngeal or airway trauma, or both. Of these, seven were multi‐arm studies (Cavus 2011; Gupta 2013; Lee 2012; Malik 2008; Malik 2009b; McElwain 2011; Teoh 2010), and to avoid unit of analysis issues, we combined data for all of the intervention arms of each multi‐arm study. We noted no events in either intervention or comparison group in seven studies (Andersen 2011; Arici 2014; Carassiti 2013; Cavus 2011; Frohlich 2011; Lee 2009; Maassen 2012). A total of 22 comparisons yielded event data in analysis for this outcome (Abdallah 2011; Aoi 2010; Aziz 2012; Bensghir 2010; Bensghir 2013; Bilehjani 2009; Gupta 2013; Hsu 2012; Ilyas 2014; Kim 2013; Komatsu 2010; Lee 2012; Lim 2005; Lin 2012; Malik 2008; Malik 2009a; Malik 2009b; McElwain 2011; Russell 2013; Taylor 2013; Teoh 2010; Walker 2009). Results showed fewer trauma events when a videolaryngoscope was used (M‐H OR, random‐effects 0.68, 95% CI 0.48 to 0.96; I2 = 25%; 3110 participants). See Analysis 4.1.
Sore throat or hoarseness
A total of 18 studies with 2238 participants reported on sore throat and/or hoarseness. Maassen 2012 did not provide data by intervention or comparison group; therefore, we did not include this study in the analysis. We had intended to measure sore throat at the time points of two hours and 48 hours postoperatively, but results did not concur with study reports. Five studies (Andersen 2011; Najafi 2014; Siddiqui 2009; Taylor 2013; Teoh 2010) stated that sore throat was assessed in the postanaesthesia care unit (PACU), and eight studies, including two that had reported data for the PACU (Abdallah 2011; Hsu 2012; Lee 2013; Lin 2012; Najafi 2014; Nishikawa 2009; Siddiqui 2009; Woo 2012), gave data obtained at assessment 24 hours postoperatively. We constructed our analysis by using two time points: in the PACU and at 24 hours. To avoid a unit of analysis issue, we included data for Siddiqui 2009 only at the 24‐hour time point. Six studies (Aoi 2010; Aziz 2012; Bilehjani 2009; Ilyas 2014; Peck 2009; Russell 2013) did not state when sore throat was assessed, and for the purpose of this analysis, we included these data in the PACU group. Analysis revealed no difference in incidences of sore throat in the PACU (M‐H OR, random‐effects 1.00, 95% CI 0.73 to 1.38; I2 = 24%;1548 participants) nor at postoperative day one, regardless of which laryngoscope was used (M‐H OR, random‐effects 0.54, 95% CI 0.27 to 1.07; I2 = 74%; 844 participants). See Analysis 5.1. We considered the high level of performance bias to be an important consideration in this outcome and downgraded the evidence to moderate quality. See summary of findings Table 1.
Six studies reported data on hoarseness (Andersen 2011; Aoi 2010; Bilehjani 2009; Hsu 2012; Ilyas 2014; Siddiqui 2009). For the purpose of analysis, we combined data regardless of the time of measurement, including data from the PACU for Siddiqui 2009 rather than at 24 hours postoperatively. Analysis showed fewer incidences of hoarseness for those with whom the VLS had been used (M‐H OR, fixed‐effect 0.57, 95% CI 0.36 to 0.88; I2 = 28%; 527 participants). See Analysis 6.1.
Proportion of successful first attempts
Data from 36 studies on successful first attempt could be combined. For studies with multi‐arm comparisons (Cavus 2011; Gupta 2013; Lee 2012; Malik 2008; Malik 2009b; McElwain 2011; Serocki 2010; Serocki 2013; Teoh 2010), we combined data for all VLS groups, with the exception of Gupta 2013, for which we combined the comparison group of VLS (with and without stylet) versus Macintosh (with and without stylet). Our analysis showed no differences between groups (M‐H OR, random‐effects 1.27, 95% CI 0.77 to 2.09; I2 = 79%; 4731 participants). See Analysis 7.1. Again, we considered the high level of performance bias to be an important consideration in this outcome and downgraded the quality of evidence to moderate. See summary of findings Table 1.
Number of attempts
Thirty studies with 3504 participants reported number of attempts as an outcome. Of these, one study did not report number of attempts clearly for each group (Arima 2014) and data could not be used; another study reported the number of attempts as a mean, and therefore data could not be combined with data from other studies (Siddiqui 2009 ‐ this study reported no statistically significant differences between groups requiring only one attempt at intubation; P = 0.144). We included the remaining 28 studies in our meta‐analysis for requiring only one attempt at intubation with either device (Abdallah 2011; Andersen 2011; Aoi 2010; Bensghir 2010; Bilehjani 2009; Cavus 2011; Frohlich 2011; Griesdale 2012; Gupta 2013; Hirabayashi 2009; Hsu 2012; Kim 2013; Komatsu 2010; Lee 2012; Lim 2005; Lin 2012; Malik 2008; Malik 2009a; Malik 2009b; McElwain 2011; Serocki 2010; Serocki 2013; Shippey 2013; Sun 2005; Teoh 2010; Walker 2009; Woo 2012; Xue 2007). For multi‐arm studies, we combined data for all VLS groups. Our analysis revealed no differences between types of devices for participants intubated in one attempt (M‐H OR, random‐effects 1.25, 95% CI 0.68 to 2.31; I2 = 79%; 3346 participants). See Analysis 8.1. We did not include outcome data from studies that reported 'successful first attempt' but did not also report data on additional attempts.
We combined the data from studies reporting two, three or four attempts. We also included studies that reported data on 'more than two attempts' or 'more than three attempts'. For multi‐arm studies, we combined data for all VLS groups. Results of our analysis showed no difference in types of laryngoscopes with additional attempts (M‐H OR, random‐effects 0.89, 95% CI 0.47 to 1.70; I2 = 79%; 3346 participants). See Analysis 8.1.
Time for tracheal intubation
A total of 55 studies with 6249 participants reported data on time for tracheal intubation. Of these, one did not provide denominator figures (Ahmad 2013), one did not provide a standard deviation or range (Frohlich 2011), one differed from the other studies in time scales of measurement used for this outcome (Lee 2012) and 14 reported data as medians and interquartile ranges (Abdallah 2011; Andersen 2011; Cordovani 2013; Griesdale 2012; Gupta 2013; Kill 2013; Lin 2012; Malik 2009a; Malik 2009b; McElwain 2011; Russell 2012; Serocki 2010; Takenaka 2011; Walker 2009). Therefore, it was not possible to combine these data in our meta‐analysis, nor did we include Hindman 2014, as we believed that this cross‐over design introduced too much performance bias. The remaining 37 studies included multi‐arm studies with a total of 44 comparisons (Aoi 2010; Arici 2014; Aziz 2012; Bensghir 2010; Bensghir 2013; Bilehjani 2009; Carassiti 2013; Cavus 2011; Choi 2011; Dashti 2014; Enomoto 2008; Hirabayashi 2009; Hsu 2012; Ilyas 2014; Kanchi 2011; Kim 2013; Komatsu 2010; Lee 2013; Lim 2005; Malik 2008; Maruyama 2008b; Najafi 2014; Nishikawa 2009; Peck 2009; Pournajafian 2014; Sandhu 2014; Serocki 2013; Shippey 2013; Siddiqui 2009; Sun 2005; Suzuki 2008; Taylor 2013; Teoh 2010; Turkstra 2005; Woo 2012; Xue 2007; Yeatts 2013). From the multi‐arm studies, we included only one comparison in the analysis, using data that showed the most time in the videolaryngoscope group; for Cavus 2011, we used data from the C‐MAC4 group; for Malik 2008, the Truview EVO2 group; for Serocki 2013, the GlideScope group; and for Teoh 2010, the C‐MAC group. When these 37 studies were combined, we identified an extremely high level of statistical heterogeneity (I2 = 96%), which could possibly be explained by the various time points at which individual studies measured time for intubation. Therefore, we have not presented an effects estimate for this outcome. See Included studies above and Analysis 9.1.
Difficulty of intubation
Nineteen studies with 1765 participants reported data on difficulty of tracheal intubation (Abdallah 2011; Andersen 2011; Aoi 2010; Arima 2014; Bensghir 2013; Choi 2011; Frohlich 2011; Gupta 2013; Ilyas 2014; Ithnin 2009; Lim 2005; Lin 2012; Maassen 2012; Malik 2008; Malik 2009a; Malik 2009b; McElwain 2011; Sandhu 2014; Takenaka 2011). Fourteen of these studies used the same validated scale of measurement (Intubation Difficulty Score (IDS)) (Andersen 2011; Aoi 2010; Arima 2014; Bensghir 2010; Frohlich 2011; Gupta 2013; Ilyas 2014; Lin 2012; Malik 2008; Malik 2009a; Malik 2009b; McElwain 2011; Sandhu 2014; Takenaka 2011). Only seven of these 14 studies reported data that could be combined (Aoi 2010; Bensghir 2013; Gupta 2013; Malik 2008; Malik 2009a; Malik 2009b; McElwain 2011), whilst the others reported IDS scores as median and interquartile ratio (IQR) or as an overall mean. For the purpose of this analysis, we combined the videolaryngoscope intervention results of multi‐arm studies and presented the data for all seven studies as dichotomous for those with no difficulty (achieving an IDS of 0). Our analysis showed that the videolaryngoscope was easier to use when compared with the Macintosh, with 165 out of 340 cases given the lowest IDS score of 0 in the videolaryngoscope group versus 31 out of 228 cases in the Macintosh group (M‐H OR, random‐effects 7.13, 95% CI 3.12 to 16.31; P < 0.00001; I2 = 62%; 568 participants). See Analysis 10.1.
Of the remaining studies that used an IDS scoring system, four reported a statistically significant result in favour of the videolaryngoscope (Ilyas 2014 ‐ P = 0.0024, 128 participants; Lin 2012 ‐ P < 0.001, 170 participants; Sandhu 2014 ‐ P < 0.05, 200 participants; and Takenaka 2011 ‐ P < 0.01, 69 participants), one reported a higher IDS score in the videolaryngoscope group (Frohlich 2011 ‐ P < 0.05, 60 participants) and one reported no differences between groups (Arima 2014 ‐ P = 0.66, 109 participants). Andersen 2011 reported results on a graph, from which it was not possible to extract data.
Five studies used an alternative scale to IDS (Abdallah 2011; Choi 2011; Ithnin 2009; Lim 2005; Russell 2013). Abdallah 2011 used a Likert scale measuring ease of intubation (from 0 = extremely easy to 100 = extremely difficult), Choi 2011 and Lim 2005 described a visual analogue scale for recording difficulty of intubation (a 10‐point scale and a 100‐mm scale, respectively), Russell 2013 used a numerical rating scale from 1 (none) to 10 (severe) and Ithnin 2009 used an intubation scoring system to assess jaw relaxation, laryngoscopy, vocal cords, coughing and movement. In Abdallah 2011, study authors reported more difficult intubation in the Pentax AWS group (P = 0.02; 99 participants), in Choi 2011 study authors reported less difficult intubation in the GlideScope group (P < 0.05; 60 participants), Russell 2013 described intubation as easier in the Macintosh group and Ithnin 2009 and Lim 2005 reported no differences between groups.
Improved visualization
A total of 36 studies with 3869 participants assessed visualization using the Cormack and Lehane (CL) scoring system to assign grades of 1 to 4 (1 indicated that > 50% of cords were visible; 4 meant that neither glottis nor epiglottis was seen). Four studies presented data in graphs from which it was not possible to extract precise data (Cavus 2011; Jungbauer 2009; Lee 2009; Serocki 2013). Abdallah 2011 collected data but reported no results in the paper, Ilyas 2014 combined data for each patient between first and second laryngoscope attempts and Sun 2005 collected data between laryngoscopy comparisons that could not be pooled. Sandhu 2014 reported a statistically significant difference between groups for this outcome but presented no figures and no direction of significance.
Six studies used a cross‐over design and recorded the CL grade for all participants for each laryngoscope (Enomoto 2008; Maruyama 2008a; Peck 2009; Robitaille 2008; Serocki 2010; Taylor 2013). We excluded these studies to avoid a unit of analysis issue. Lee 2012 used a cross‐over design but had reported CL scores for each laryngoscope so that the data could be reported separately. We included this study in our analysis by using the lowest CL 1 score, which was provided by the Storz group. For multi‐arm studies, we combined data for each of the VLS groups. Thus we carried out meta‐analysis for 22 studies (Andersen 2011; Aoi 2010; Arici 2014; Aziz 2012; Bensghir 2010; Bensghir 2013; Frohlich 2011; Griesdale 2012; Gupta 2013; Kim 2013; Komatsu 2010; Lee 2012; Lim 2005; Lin 2012; Malik 2008; Malik 2009a; Malik 2009b; Maruyama 2008b; McElwain 2011; Takenaka 2011; Teoh 2010; Walker 2009), which showed a higher number of laryngoscopies achieving a grade 1 CL view when a videolaryngoscope was used (M‐H OR, random‐effects 6.77, 95% CI 4.17 to 10.98; P < 0.00001; I2 = 74%; 2240 participants). See Analysis 11.1.
We combined data for CL grades 1 to 2 and for CL grades 3 to 4, again excluding cross‐over designs with the exception of Lee 2012, for which we used data from the Storz group, and combining the data for multi‐arm studies. This approach revealed more laryngoscopies achieving CL grade 1 or 2 with a VLS (M‐H OR, random‐effects 5.42, 95% CI 3.70 to 7.95) and fewer VLS laryngoscopies achieving CL grade 3 or 4 (M‐H OR, random‐effects 0.18, 95% CI.013 to 0.27; I2 = 5%; 2240 participants). See Analysis 12.1.
Only five studies used the POGO scoring method (percentage of glottic opening) (Choi 2011; Hindman 2014; Peck 2009; Sandhu 2014; Woo 2012). Hindman 2014 did not report mean scores and was not included in the meta‐analysis. Combined results for the other studies showed an extremely high level of heterogeneity (I2 = 96%); therefore, we did not pool the data. See Analysis 13.1.
Subgroup analysis
Different designs of VLS
We included nine different types of VLS in our analysis; most comparisons included GlideScope (29 studies), Pentax AWS (20 studies), C‐MAC (10 studies) and McGrath (eight studies). Remaining VLS comparisons were reported by only two studies (X‐lite) or by individual studies (C‐MAC D‐blade, Airtraq (with video), Truview EVO2 and CEL‐100).
We carried out subgroup analysis on four VLS designs (GlideScope, Pentax AWS, McGrath and C‐MAC) for the outcome of failed intubation. Results showed no statistically significant differences when GlideScope, Pentax or McGrath was compared with the Macintosh blade (GlideScope: M‐H OR, random‐effects 0.57, 95% CI 0.25 to 1.32; 1306 participants; Pentax: M‐H OR, random‐effects 0.24, 0.05 to 1.20; 1086 participants; and McGrath: M‐H OR, random‐effects 1.18, 95% CI 0.06 to 23.92; 466 participants). Separation of GlideScope studies from studies of the other VLS devices revealed a lower level of statistical heterogeneity for this result (I2 = 24%), whereas heterogeneity for the Pentax and McGrath comparisons remained moderate to high (I2 = 59%, I2 = 78%, respectively). The comparison for the C‐MAC device demonstrated statistically significant differences and fewer failures with the C‐MAC (M‐H OR, random‐effects 0.32, 95% CI 0.15 to 0.68; 1058 participants). We found no heterogeneity (I2 = 0%) for this result. See Analysis 14.1.
We did not carry out subgroup analysis on hyoxia by design of VLS because only three studies reported event data for this outcome.
Obese or non‐obese patients
Only two studies with 199 participants included individuals who were obese (Abdallah 2011; Andersen 2011). It was not possible for review authors to carry out meaningful subgroup analysis for this patient group for our prespecified outcomes of failed intubation, time for tracheal intubation and hypoxia, as Abdallah 2011 reported on none of these outcomes, and Andersen 2011 reported only failed intubation and hypoxia.
Anticipated or known difficult airways
A total of 19 studies that included only participants without a predicted difficult airway reported data on failed intubation (Andersen 2011; Arici 2014; Bensghir 2010; Bensghir 2013; Bilehjani 2009; Carassiti 2013; Ilyas 2014; Kill 2013; Lee 2012; Lin 2012; Nishikawa 2009; Pournajafian 2014; Russell 2013; Siddiqui 2009; Sun 2005; Takenaka 2011; Walker 2009; Woo 2012; Xue 2007). Six studies included only participants with a predicted difficult airway (Aziz 2012; Cordovani 2013; Jungbauer 2009; Malik 2009b; Serocki 2010; Serocki 2013), and nine studies included participants whose airway was manipulated to simulate a difficult laryngoscopy (Aoi 2010; Enomoto 2008; Komatsu 2010; Lim 2005; Malik 2008; Malik 2009a; McElwain 2011; Peck 2009; Taylor 2013). Subgroup analysis for the failed intubation outcome showed fewer failures when a VLS was used with participants who had a predicted difficult airway (M‐H OR, random‐effects 0.28, 95% CI 0.15 to 0.55; I2 = 0%; 830 participants). This effect was also evident for those with a simulated difficult airway (M‐H OR, random‐effects 0.18, 95% CI 0.04 to 0.77; I2 = 53%; 810 participants). However, studies with no predicted difficult airway reported no difference in failed intubation by type of device (M‐H OR, random‐effects 0.61, 95% CI 0.22 to 1.67; I2 = 56%; 1743 participants). See Analysis 15.1.
Different sites of intubation
Three studies with 772 participants did not include elective surgical patients (Arima 2014 ‐ prehospital setting; Griesdale 2012 ‐ urgent tracheal intubation by critical care team; Yeatts 2013 ‐ emergency airway management in trauma resuscitation unit).
Only one of these studies reported on the outcome of failed intubation (Arima 2014); therefore it was not possible for review authors to carry out subgroup analysis, although this study described a greater number of failures in the VLS group than in the Macintosh group. None of these studies reported on hypoxia.
Experienced or inexperienced intubator
We compared studies that included personnel with equivalent experience in the clinical setting (≥ 20 intubations) with the VLS and Macintosh devices against studies in which investigators stated that included personnel had less experience in the clinical setting with the VLS device (fewer than 20 intubations; or unfamiliar with using double‐lumen tubes for intubation). We found no statistical differences between subgroups (P = 0.75) for the outcome of failed intubation. However, whilst studies with personnel experienced in both devices reported fewer failed intubations when a VLS was used (M‐H OR, random‐effects 0.32, 95% CI 0.13 to 0.75; I2 = 47%; 1927 participants), there was no evidence of a difference in the number of failed intubations when personnel were less experienced with a VLS (M‐H OR, random‐effects 0.20, 95% CI 0.02 to 2.56; I2 = 75%; 346 participants). See Analysis 16.1.
Sensitivity analysis
Missing data
We considered the effect of missing data on our results. We excluded studies for which we had been unable to judge whether data were complete because only abstracts were available, as well as studies that had high or unexplained participant loss for all outcomes in which these studies were included. For the analysis of sore throat on postoperative day 1, we removed one study (Woo 2012), and results demonstrated fewer sore throats when a VLS was used (M‐H OR, random‐effects 0.45, 95% CI 0.22 to 0.90). Other analyses remained unchanged.
Cross‐over studies
The inclusion of cross‐over studies in our review had the potential to introduce bias, and in sensitivity analysis we reconsidered the results for each of our outcomes, eliminating these studies when relevant. For the outcomes failed intubation, sore throat (in PACU), hoarseness, successful first attempt and number of attempts, results showed no differences. For the outcomes hypoxia, sore throat (postoperative day 1) and intubation difficulty scores, either no cross‐over studies were included in the analysis, or study results revealed no events in either group. However, for laryngeal/airway trauma, although fewer traumas were reported in the VLS group, results were no longer statistically significant (M‐H OR, random‐effects 0.75, 95% CI 0.51 to 1.11; I2 = 26%; 22 studies; 2369 participants).
Multi‐arm studies
To avoid unit of analysis errors, we made decisions regarding the inclusion or exclusion of data for our multi‐arm studies. In sensitivity analysis, we re‐considered these decisions. We altered the data by including only the lowest event scores for each of our multi‐arm studies, and then only the highest event scores for each of these studies. For our primary outcome of failed intubation, this revealed no differences in results. Similarly, this sensitivity analysis revealed no differences in patient‐reported sore throat and successful first attempt. We deemed it unnecessary to perform multi‐arm sensitivity analysis for hypoxia, as included relevant studies provided no event data. For laryngeal trauma, we found no significant differences in results between VLS and Macintosh groups when we included the highest event scores for each of these studies (M‐H OR, random‐effects 0.73, 95% CI 0.52 to 1.03; I2 = 20%; 29 studies; 3110 participants). We did not carry out any further analysis on this result.
Risk of bias
For sensitivity analysis of our risk of bias assessments, we considered only our primary outcome of failed intubation.
We removed studies with unclear or high risk of selection bias (Aoi 2010; Arima 2014; Kill 2013; Lee 2009; Lee 2012; Lim 2005; Peck 2009; Pournajafian 2014; Serocki 2010; Serocki 2013; Takenaka 2011; Taylor 2013; Walker 2009; Woo 2012; Xue 2007). A statistically significant effect remained, with fewer failed intubations when a videolaryngoscope was used (M‐H OR, fixed‐effect 0.41, 95% CI 0.26 to 0.63; 23 studies; 2811 participants). Similarly, we noted no differences in results when we removed those with a high level of attrition bias (Arima 2014; Cavus 2011; Lee 2009; Woo 2012) (M‐H OR, fixed‐effect 0.36, 95% CI 0.26 to 0.51; 34 studies; 3624 participants).
We removed studies that we had judged to be at high risk of bias regarding reporting of intubator experience (Aziz 2012; Bensghir 2010; Kill 2013; Lim 2005; Russell 2013); we found no difference in results when we removed these studies, nor when we combined removal of those that we had recorded as having unclear risk of bias for this domain (Arici 2014; Arima 2014; Bilehjani 2009; Cavus 2011; Enomoto 2008; Ilyas 2014; Jungbauer 2009; Komatsu 2010; Peck 2009; Takenaka 2011; Walker 2009).
Similarly, we noted no differences in results when we removed from analysis those with high risk of funding bias (Aziz 2012; Cavus 2011; Enomoto 2008; Kill 2013; Serocki 2013; Taylor 2013).
Discussion
Summary of main results
We included 64 studies comparing videolaryngoscopy with direct laryngoscopy in patients requiring tracheal intubation for general anaesthesia. In addition, we identified 38 studies awaiting classification and seven ongoing studies.
Nine types of videolaryngoscope (VLS) design were used in the 64 included studies: GlideScope, Pentax AWS, C‐MAC (to include DCI laryngoscope), McGrath, X‐lite, C‐MAC D‐blade, Airtraq, Truview EVO2 and CEL‐100. Most studies compared the use of GlideScope, Pentax AWS, C‐MAC and McGrath. Some designs of Airtraq and Truview EVO2 could be used with and without a camera attachment, and we included only those studies in which it was clear from the report that the devices had been used with a camera. Forty‐eight studies included participants without a predicted difficult airway, and 15 of these used techniques to simulate a difficult airway for the purpose of the study. Six studies recruited participants with a known or predicted difficult airway, but others did not specify or included both predicted and not predicted difficult airways.
Most studies used an experienced anaesthetist to perform laryngoscopies. However, it was not always clear from the paper whether anaesthetists had equivalent experience with both devices.
Studies measured our primary outcomes of failed intubation and hypoxia, as well as our secondary outcomes of mortality, serious respiratory complications, laryngeal or airway trauma, patient‐reported sore throat or hoarseness, number of successful first attempts, number of attempts, time for tracheal intubation, difficulty of tracheal intubation and improved visualization of the larynx.
Analysis of 38 studies, which included all types of VLS, revealed statistically significantly fewer failed intubations when a VLS was used. However, when analysis was carried out by type of scope, we noted no significant difference in the number of failed intubations when the GlideScope, Pentax or McGrath was compared with the Macintosh blade. The result for failed intubation remained statistically significantly in favour of the C‐MAC device in this analysis. We also carried out analysis according to assessed difficulty of the participant airway. We found statistically fewer failed intubations when a VLS was used in participants who presented with an anticipated difficult airway or a simulated difficult airway, but no difference in the number of failed intubations for participants who presented without an anticipated difficult airway. We also considered whether the experience of the intubator with the VLS device affected the number of failed intubations. We found fewer failed intubations with a VLS when the intubator had equivalent experience with both devices (we defined this as having used a VLS on at least 20 occasions in the clinical setting, with at least equivalent experience with a Macintosh, although the Macintosh experience was often substantially greater). However, when the intubator was experienced with the Macintosh but had used the VLS device on fewer than 20 occasions in the clinical setting, we found no evidence of a difference in the number of failed intubations.
Analysis of other outcomes demonstrated statistically significantly fewer laryngeal/airway traumas (in 22 studies) and fewer incidences of postoperative hoarseness (in six studies) when a VLS device was used. However, the result for laryngeal/airway trauma was dependent on our decision regarding inclusion of cross‐over designs and which data to use for included multi‐arm studies. A statistically significantly higher number of laryngoscopies achieved a CL grade 1 view, with most of the cords visible, when a VLS was used (in 22 studies), and statistically significantly fewer laryngoscopies with a VLS achieving a grade 3 or 4 CL view (in 22 studies); also, the VLS was easier to use than the Macintosh (in seven studies). Only three studies reported results that we were able to combine for hypoxia, and for this outcome, we noted no differences between types of scopes used. Similarly, few studies reported on mortality and respiratory complications. We found no statistically significant difference in the incidence of sore throat in the postanaesthesia care unit (PACU) nor at 24 hours postoperatively, and no statistically significant differences between scopes in the proportion of successful first attempts nor in the proportion of those needing more than one attempt.
We noted an extremely high level of heterogeneity when studies reporting time for tracheal intubation were combined, possibly explained by the various time points used to measure this outcome. We did not present an effects estimate for this outcome.
Overall completeness and applicability of evidence
We carried out a thorough search and identified 7044 participants in a large number of studies. We included comparisons of currently available videolaryngoscopes with a Macintosh blade. Included studies were published from 2005 to 2014; most were published since 2010, reflecting the introduction and potential availability of such devices. Many of our included studies measured our primary outcome of failed intubation, as well as our secondary outcomes.
We included studies that enrolled both participants who were anticipated to have a difficult intubation and participants who were not. We included studies with both experienced and inexperienced personnel performed in different settings, both in‐hospital and out‐of‐hospital.
Quality of the evidence
It was not possible to blind personnel to the type of laryngoscope used with each participant; because of the likely potential for user preference, we believed that all studies were subject to a high level of performance bias. However, we considered other types of bias in our sensitivity analysis, and despite varied levels of bias across studies, results for our primary outcome of failed intubation were not affected by the quality of the evidence when combined in meta‐analysis. When using GRADE to assess quality across the included studies, we believed that the unavoidable high level of performance bias in all studies should take preference when the risk of bias for this review was summarized. As a result, we downgraded evidence for each of our outcomes by one level for study limitations. We assessed the outcomes failed intubation, proportion of successful first attempts, and sore throat, to be moderate quality evidence. We included few studies that reported hypoxia, serious respiratory complications, or mortality, which introduced imprecision and downgraded these outcomes to very low quality evidence. There was a large number of studies with substantial heterogeneity that reported time for tracheal intubation and we graded the evidence for this outcome to be very low quality. summary of findings Table 1.
Potential biases in the review process
We made the decision to exclude studies that had used particular devices (Airtraq, Truview EVO2, Bullard, Wuscope and Optiscope) and had not described whether these were used with a video/camera attachment. We did not contact any of the study authors to clarify the intervention, leading to exclusion of 38 studies from this review.
We encountered difficulty establishing the actual level of experience of personnel, either by the number of years of anaesthetic experience or by the number of experiences with each device. Although we attempted to measure our outcomes by level of experience, our results are applicable only according to our own interpretation of this.
Agreements and disagreements with other studies or reviews
The review of Mihai et al (Mihai 2008) concluded that evidence obtained by examination of rigid videolaryngoscopes was of poor quality, and review authors did not provide strong evidence that use of these devices should supersede direct laryngoscopy for straightforward or difficult intubation. The Mihai review included many observational studies, as well as randomized controlled trials (RCTs). Other more recent reviews concluded that videolaryngoscopes can improve the glottic view as measured on a Cormack and Lehane scale (Griesdale 2012b; Hoshijima 2014; Su 2011). Review authors indicated that this improvement is more pronounced in patients with a difficult airway (Griesdale 2012) and recommended the use of videolaryngoscopes to achieve successful intubation in patients with higher risk of a difficult laryngoscopy (Healy 2012). Our findings in this systematic review are consistent with the findings of these recent reviews, and whilst these reviews considered many of the same studies that we have included, none were as large and none included all of our review outcomes.
Risk of bias graph: review authors' judgements about each risk of bias item presented as percentages across all included studies.
Risk of bias summary: review authors' judgements about each risk of bias item for each included study.
Funnel plot of comparison: 1 Failed intubation, outcome: 1.1 Failed intubation.

Comparison 1: VLS versus Macintosh, Outcome 1: Failed intubation

Comparison 2: VLS versus Macintosh, Outcome 1: Hypoxia

Comparison 3: VLS versus Macintosh, Outcome 1: Mortality

Comparison 4: VLS versus Macintosh, Outcome 1: Laryngeal/airway trauma

Comparison 5: VLS versus Macintosh, Outcome 1: Patient‐reported sore throat

Comparison 6: VLS versus Macintosh, Outcome 1: Hoarseness

Comparison 7: VLS versus Macintosh, Outcome 1: Successful first attempt

Comparison 8: VLS versus Macintosh, Outcome 1: Number of attempts

Comparison 9: VLS versus Macintosh, Outcome 1: Time for tracheal intubation

Comparison 10: VLS versus Macintosh, Outcome 1: Intubation difficult score (IDS)

Comparison 11: VLS versus Macintosh, Outcome 1: Improved visualization Cormack & Lehane (CL) 1

Comparison 12: VLS versus Macintosh, Outcome 1: Improved visualization Cormack & Lehane (CL) 1 to 4

Comparison 13: VLS versus Macintosh, Outcome 1: Improved visualization POGO

Comparison 14: VLS versus Macintosh, Outcome 1: Failed intubation by scope

Comparison 15: VLS versus Macintosh, Outcome 1: Failed intubation by airway difficulty

Comparison 16: VLS versus Macintosh, Outcome 1: Failed intubation by experience of personnel
| Videolaryngoscopy compared with direct laryngoscopy for tracheal intubation | ||||||
| Patient or population: patients requiring tracheal intubation | ||||||
| Outcomes | Illustrative comparative risks* (95% CI) | Relative effect | Number of participants | Quality of the evidence | Comments | |
|---|---|---|---|---|---|---|
| Assumed risk | Corresponding risk | |||||
| Direct laryngoscopy | Videolaryngoscopy | |||||
| Failed intubation | Study population | OR 0.35 | 4127 | ⊕⊕⊕⊝ | Downgraded by 1 level. See footnote. | |
| 94 per 1000 | 35 per 1000 | |||||
| Moderate | ||||||
| Hypoxia | Study population | OR 0.39 | 1319 | ⊕⊝⊝⊝ | Downgraded by 3 levels. See footnotes. | |
| 58 per 1000 | 23 per 1000 | |||||
| Moderate | ||||||
| Serious respiratory complications | See comment | See comment | Not estimable | 78 | ⊕⊝⊝⊝ | Insufficient data to complete meta‐analysis. Downgraded by 2 levels. See footnotes. |
| Mortality | Study population | OR 1.09 | 663 | ⊕⊝⊝⊝ | Downgraded by 3 levels. See footnotes. | |
| 106 per 1000 | 114 per 1000 | |||||
| Very low | ||||||
| Proportion of successful first attempts | Study population | OR 0.79 | 4731 | ⊕⊕⊕⊝ | Downgraded by 1 level. See footnotes. | |
| 831 per 1000 | 795 per 1000 | |||||
| Moderate | ||||||
| Sore throat | Study population | OR 1.00 | 1548 | ⊕⊕⊕⊝ | Downgraded by 1 level. See footnotes. | |
| 250 per 1000 | 289 per 1000 | |||||
| Moderate | ||||||
| Time for tracheal intubation | See comment | See comment | Not estimable | 4488 | ⊕⊝⊝⊝ | High level of statistical heterogeneity between studies; therefore meta‐analysis not completed. Downgraded by 3 levels. See footnotes. |
| *The basis for the assumed risk (e.g. median control group risk across studies) is provided in footnotes. The corresponding risk (and its 95% confidence interval) is based on the assumed risk in the comparison group and the relative effect of the intervention (and its 95% CI). | ||||||
| GRADE Working Group grades of evidence | ||||||
| aNot possible to blind intubator to device. Downgraded for study limitations. | ||||||
| Outcome or subgroup title | No. of studies | No. of participants | Statistical method | Effect size |
| 1.1 Failed intubation Show forest plot | 38 | 4127 | Odds Ratio (M‐H, Random, 95% CI) | 0.35 [0.19, 0.65] |
| Outcome or subgroup title | No. of studies | No. of participants | Statistical method | Effect size |
| 2.1 Hypoxia Show forest plot | 8 | 1319 | Odds Ratio (M‐H, Random, 95% CI) | 0.39 [0.10, 1.44] |
| Outcome or subgroup title | No. of studies | No. of participants | Statistical method | Effect size |
| 3.1 Mortality Show forest plot | 2 | 663 | Odds Ratio (M‐H, Fixed, 95% CI) | 1.09 [0.65, 1.82] |
| Outcome or subgroup title | No. of studies | No. of participants | Statistical method | Effect size |
| 4.1 Laryngeal/airway trauma Show forest plot | 29 | 3110 | Odds Ratio (M‐H, Random, 95% CI) | 0.68 [0.48, 0.96] |
| Outcome or subgroup title | No. of studies | No. of participants | Statistical method | Effect size |
| 5.1 Patient‐reported sore throat Show forest plot | 17 | 2392 | Odds Ratio (M‐H, Random, 95% CI) | 0.82 [0.56, 1.19] |
| 5.1.1 Postanaesthesia care unit | 10 | 1548 | Odds Ratio (M‐H, Random, 95% CI) | 1.00 [0.73, 1.38] |
| 5.1.2 Postoperative day 1 | 8 | 844 | Odds Ratio (M‐H, Random, 95% CI) | 0.54 [0.27, 1.07] |
| Outcome or subgroup title | No. of studies | No. of participants | Statistical method | Effect size |
| 6.1 Hoarseness Show forest plot | 6 | 527 | Odds Ratio (M‐H, Fixed, 95% CI) | 0.57 [0.36, 0.88] |
| Outcome or subgroup title | No. of studies | No. of participants | Statistical method | Effect size |
| 7.1 Successful first attempt Show forest plot | 36 | 4731 | Odds Ratio (M‐H, Random, 95% CI) | 1.27 [0.77, 2.09] |
| Outcome or subgroup title | No. of studies | No. of participants | Statistical method | Effect size |
| 8.1 Number of attempts Show forest plot | 28 | 6692 | Odds Ratio (M‐H, Random, 95% CI) | 1.06 [0.68, 1.66] |
| 8.1.1 1 attempt | 28 | 3346 | Odds Ratio (M‐H, Random, 95% CI) | 1.25 [0.68, 2.31] |
| 8.1.2 2 to 4 attempts | 28 | 3346 | Odds Ratio (M‐H, Random, 95% CI) | 0.89 [0.47, 1.70] |
| Outcome or subgroup title | No. of studies | No. of participants | Statistical method | Effect size |
| 9.1 Time for tracheal intubation Show forest plot | 37 | Mean Difference (IV, Random, 95% CI) | Subtotals only | |
| Outcome or subgroup title | No. of studies | No. of participants | Statistical method | Effect size |
| 10.1 Intubation difficult score (IDS) Show forest plot | 7 | 568 | Odds Ratio (M‐H, Random, 95% CI) | 7.13 [3.12, 16.31] |
| Outcome or subgroup title | No. of studies | No. of participants | Statistical method | Effect size |
| 11.1 Improved visualization Cormack & Lehane (CL) 1 Show forest plot | 22 | 2240 | Odds Ratio (M‐H, Random, 95% CI) | 6.77 [4.17, 10.98] |
| Outcome or subgroup title | No. of studies | No. of participants | Statistical method | Effect size |
| 12.1 Improved visualization Cormack & Lehane (CL) 1 to 4 Show forest plot | 22 | 4480 | Odds Ratio (M‐H, Random, 95% CI) | 1.00 [0.54, 1.87] |
| 12.1.1 CL 1 to 2 | 22 | 2240 | Odds Ratio (M‐H, Random, 95% CI) | 5.42 [3.70, 7.95] |
| 12.1.2 CL 3 to 4 | 22 | 2240 | Odds Ratio (M‐H, Random, 95% CI) | 0.18 [0.13, 0.27] |
| Outcome or subgroup title | No. of studies | No. of participants | Statistical method | Effect size |
| 13.1 Improved visualization POGO Show forest plot | 4 | Mean Difference (IV, Random, 95% CI) | Totals not selected | |
| Outcome or subgroup title | No. of studies | No. of participants | Statistical method | Effect size |
| 14.1 Failed intubation by scope Show forest plot | 33 | 3916 | Odds Ratio (M‐H, Random, 95% CI) | 0.40 [0.21, 0.75] |
| 14.1.1 GlideScope | 16 | 1306 | Odds Ratio (M‐H, Random, 95% CI) | 0.57 [0.25, 1.32] |
| 14.1.2 Pentax AWS | 11 | 1086 | Odds Ratio (M‐H, Random, 95% CI) | 0.24 [0.05, 1.20] |
| 14.1.3 McGrath | 5 | 466 | Odds Ratio (M‐H, Random, 95% CI) | 1.18 [0.06, 23.92] |
| 14.1.4 C‐MAC | 8 | 1058 | Odds Ratio (M‐H, Random, 95% CI) | 0.32 [0.15, 0.68] |
| Outcome or subgroup title | No. of studies | No. of participants | Statistical method | Effect size |
| 15.1 Failed intubation by airway difficulty Show forest plot | 34 | 3383 | Odds Ratio (M‐H, Random, 95% CI) | 0.35 [0.18, 0.65] |
| 15.1.1 Predicted not difficult | 19 | 1743 | Odds Ratio (M‐H, Random, 95% CI) | 0.61 [0.22, 1.67] |
| 15.1.2 Predicted difficult | 6 | 830 | Odds Ratio (M‐H, Random, 95% CI) | 0.28 [0.15, 0.55] |
| 15.1.3 Simulated difficult | 9 | 810 | Odds Ratio (M‐H, Random, 95% CI) | 0.18 [0.04, 0.77] |
| Outcome or subgroup title | No. of studies | No. of participants | Statistical method | Effect size |
| 16.1 Failed intubation by experience of personnel Show forest plot | 22 | 2273 | Odds Ratio (M‐H, Random, 95% CI) | 0.29 [0.13, 0.67] |
| 16.1.1 Personnel experienced with both devices | 17 | 1927 | Odds Ratio (M‐H, Random, 95% CI) | 0.32 [0.13, 0.75] |
| 16.1.2 Personnel less experienced with VLS | 5 | 346 | Odds Ratio (M‐H, Random, 95% CI) | 0.20 [0.02, 2.56] |