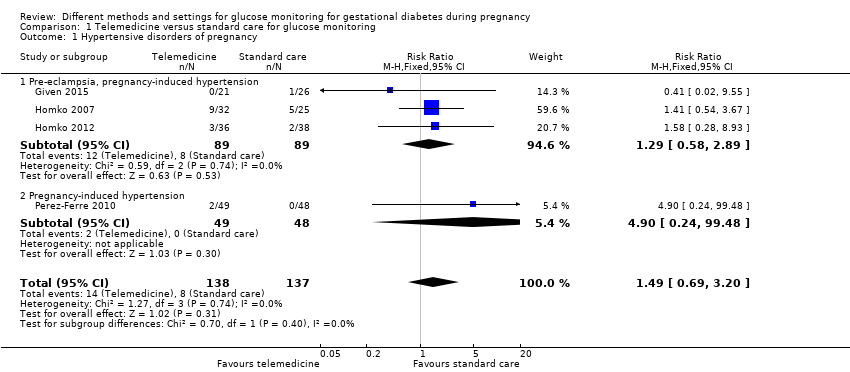
| 1 Hypertensive disorders of pregnancy Show forest plot | 4 | 275 | Risk Ratio (M‐H, Fixed, 95% CI) | 1.49 [0.69, 3.20] |
|
| 1.1 Pre‐eclampsia, pregnancy‐induced hypertension | 3 | 178 | Risk Ratio (M‐H, Fixed, 95% CI) | 1.29 [0.58, 2.89] |
| 1.2 Pregnancy‐induced hypertension | 1 | 97 | Risk Ratio (M‐H, Fixed, 95% CI) | 4.9 [0.24, 99.48] |
| 2 Caesarean section Show forest plot | 5 | 478 | Risk Ratio (M‐H, Random, 95% CI) | 1.05 [0.72, 1.53] |
|
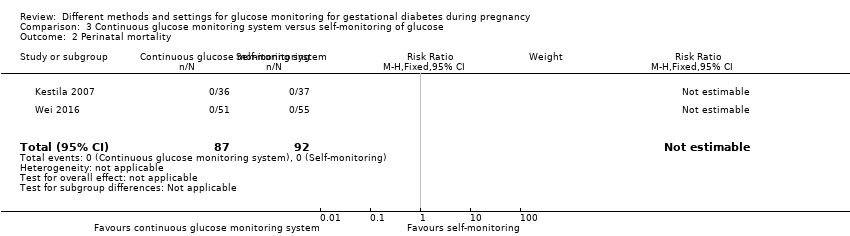
| 3 Perinatal mortality Show forest plot | 2 | 131 | Risk Ratio (M‐H, Fixed, 95% CI) | 0.0 [0.0, 0.0] |
|
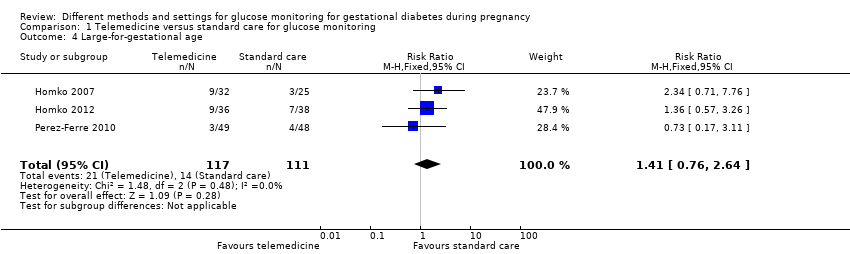
| 4 Large‐for‐gestational age Show forest plot | 3 | 228 | Risk Ratio (M‐H, Fixed, 95% CI) | 1.41 [0.76, 2.64] |
|
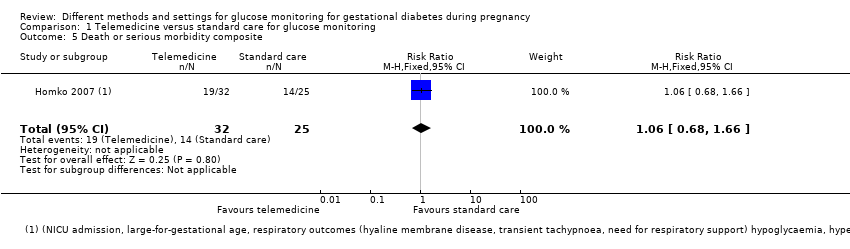
| 5 Death or serious morbidity composite Show forest plot | 1 | 57 | Risk Ratio (M‐H, Fixed, 95% CI) | 1.06 [0.68, 1.66] |
|
| 6 Operative vaginal birth (not a prespecified outcome) Show forest plot | 1 | 47 | Risk Ratio (M‐H, Fixed, 95% CI) | 0.50 [0.11, 2.30] |
|
| 7 Induction of labour Show forest plot | 1 | 47 | Risk Ratio (M‐H, Fixed, 95% CI) | 1.06 [0.63, 1.77] |
|
| 8 Placental abruption Show forest plot | 2 | 154 | Risk Ratio (M‐H, Fixed, 95% CI) | 0.88 [0.12, 6.42] |
|
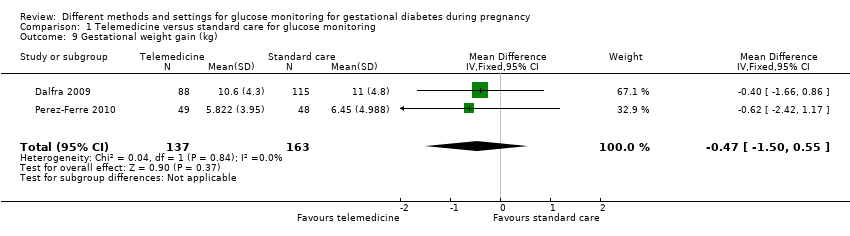
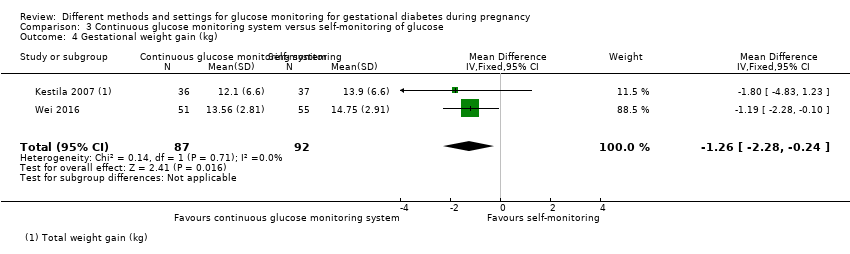
| 9 Gestational weight gain (kg) Show forest plot | 2 | 300 | Mean Difference (IV, Fixed, 95% CI) | ‐0.47 [‐1.50, 0.55] |
|
| 10 Weight at 36 weeks (kg) Show forest plot | 1 | 44 | Mean Difference (IV, Fixed, 95% CI) | 5.5 [‐5.69, 16.69] |
|
| 11 Adherence to the intervention Show forest plot | 3 | | Mean Difference (IV, Fixed, 95% CI) | Subtotals only |
|
| 11.1 Appointments attended (%) | 1 | 47 | Mean Difference (IV, Fixed, 95% CI) | 5.20 [‐2.27, 12.67] |
| 11.2 Average daily self‐monitoring of blood glucose frequency: meter memory | 1 | 44 | Mean Difference (IV, Fixed, 95% CI) | 0.5 [‐0.42, 1.42] |
| 11.3 Average daily self‐monitoring of blood glucose frequency: diary | 1 | 45 | Mean Difference (IV, Fixed, 95% CI) | 0.10 [‐0.66, 0.86] |
| 11.4 Frequency of monitoring (number of data points) | 1 | 57 | Mean Difference (IV, Fixed, 95% CI) | 21.10 [‐9.33, 51.53] |
| 11.5 Frequency of monitoring (number of data sets) | 1 | 74 | Mean Difference (IV, Fixed, 95% CI) | 1.20 [‐12.32, 14.72] |
| 12 Sense of well‐being and quality of life: DES: Diabetes Empowerment Scale Show forest plot | 1 | | Mean Difference (IV, Fixed, 95% CI) | Subtotals only |
|
| 12.1 Total | 1 | 57 | Mean Difference (IV, Fixed, 95% CI) | 0.40 [0.14, 0.66] |
| 12.2 Subscale 1: managing the psychosocial aspects of diabetes | 1 | 57 | Mean Difference (IV, Fixed, 95% CI) | 0.5 [0.21, 0.79] |
| 12.3 Subscale 2: assessing dissatisfaction and readiness to change | 1 | 57 | Mean Difference (IV, Fixed, 95% CI) | 0.40 [0.14, 0.66] |
| 12.4 Subscale 3: setting and achieving diabetes goals | 1 | 57 | Mean Difference (IV, Fixed, 95% CI) | 0.30 [‐0.04, 0.64] |
| 13 Use of additional pharmacotherapy Show forest plot | 5 | | Risk Ratio (M‐H, Fixed, 95% CI) | Subtotals only |
|
| 13.1 Insulin | 5 | 484 | Risk Ratio (M‐H, Fixed, 95% CI) | 1.52 [1.18, 1.96] |
| 13.2 Oral agents | 3 | 184 | Risk Ratio (M‐H, Fixed, 95% CI) | 0.85 [0.50, 1.42] |
| 13.3 Insulin and oral agents | 1 | 47 | Risk Ratio (M‐H, Fixed, 95% CI) | 1.24 [0.19, 8.06] |
| 14 Maternal hypoglycaemia Show forest plot | 1 | 203 | Risk Ratio (M‐H, Fixed, 95% CI) | 0.0 [0.0, 0.0] |
|
| 15 Maternal hypoglycaemia: self‐monitored blood glucose episodes hypoglycaemic (< 3.9 mmol/L) (%) Show forest plot | 1 | 44 | Mean Difference (IV, Fixed, 95% CI) | ‐0.10 [‐1.64, 1.44] |
|
| 16 Glycaemic control: HbA1c (%) Show forest plot | 3 | 357 | Mean Difference (IV, Fixed, 95% CI) | ‐0.15 [‐0.26, ‐0.04] |
|
| 17 Glycaemic control: HbA1c < 5.8% Show forest plot | 1 | 97 | Risk Ratio (M‐H, Fixed, 95% CI) | 1.0 [0.96, 1.04] |
|
| 18 Glycaemic control: HbA1c at 36 weeks (mmol/mol) Show forest plot | 1 | 30 | Mean Difference (IV, Fixed, 95% CI) | 0.20 [‐2.03, 2.43] |
|
| 19 Glycaemic control: self‐monitored blood glucose (mmol/L) Show forest plot | 1 | 44 | Mean Difference (IV, Fixed, 95% CI) | 0.0 [‐0.30, 0.30] |
|
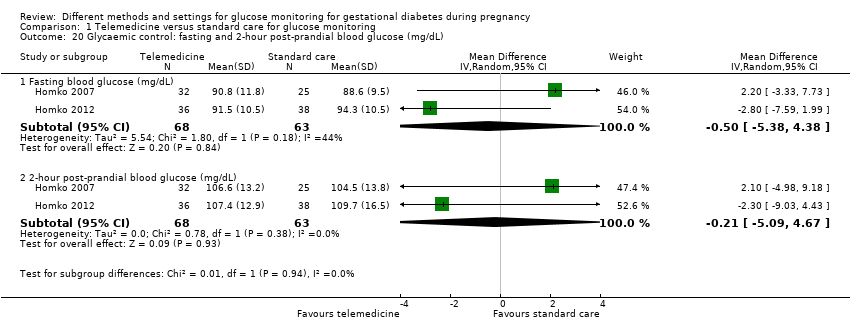
| 20 Glycaemic control: fasting and 2‐hour post‐prandial blood glucose (mg/dL) Show forest plot | 2 | | Mean Difference (IV, Random, 95% CI) | Subtotals only |
|
| 20.1 Fasting blood glucose (mg/dL) | 2 | 131 | Mean Difference (IV, Random, 95% CI) | ‐0.50 [‐5.38, 4.38] |
| 20.2 2‐hour post‐prandial blood glucose (mg/dL) | 2 | 131 | Mean Difference (IV, Random, 95% CI) | ‐0.21 [‐5.09, 4.67] |
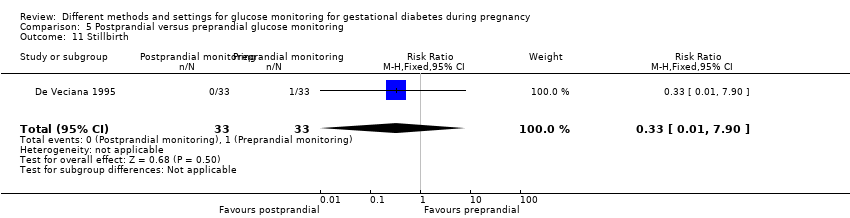
| 21 Stillbirth Show forest plot | 3 | 178 | Risk Ratio (M‐H, Fixed, 95% CI) | 0.41 [0.02, 9.55] |
|
| 22 Neonatal death Show forest plot | 2 | 131 | Risk Ratio (M‐H, Fixed, 95% CI) | 0.0 [0.0, 0.0] |
|
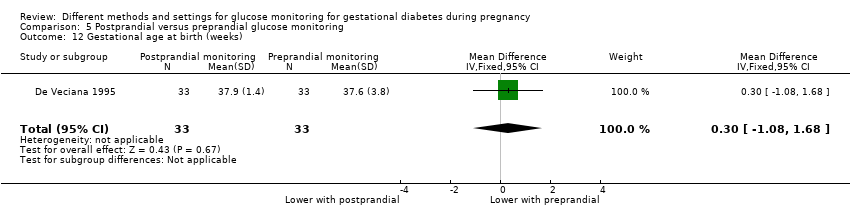
| 23 Gestational age at birth (weeks) Show forest plot | 5 | 478 | Mean Difference (IV, Fixed, 95% CI) | 0.10 [‐0.18, 0.37] |
|
| 24 Preterm birth < 37 weeks Show forest plot | 4 | 275 | Risk Ratio (M‐H, Fixed, 95% CI) | 0.66 [0.31, 1.39] |
|
| 25 Macrosomia Show forest plot | 2 | 249 | Risk Ratio (M‐H, Random, 95% CI) | 1.43 [0.27, 7.52] |
|
| 26 Small‐for‐gestational age Show forest plot | 1 | 97 | Risk Ratio (M‐H, Fixed, 95% CI) | 0.0 [0.0, 0.0] |
|
| 27 Birthweight (g) Show forest plot | 5 | 477 | Mean Difference (IV, Fixed, 95% CI) | 63.13 [‐32.32, 158.59] |
|
| 28 Head circumference (cm) Show forest plot | 1 | 45 | Mean Difference (IV, Fixed, 95% CI) | 0.70 [0.02, 1.38] |
|
| 29 Length (cm) Show forest plot | 1 | 42 | Mean Difference (IV, Fixed, 95% CI) | 0.20 [‐1.34, 1.74] |
|
| 30 Shoulder dystocia Show forest plot | 2 | 142 | Risk Ratio (M‐H, Fixed, 95% CI) | 0.33 [0.01, 7.83] |
|
| 31 Respiratory distress syndrome Show forest plot | 3 | 176 | Risk Ratio (M‐H, Fixed, 95% CI) | 0.63 [0.26, 1.49] |
|
| 32 Neonatal hypoglycaemia Show forest plot | 3 | 198 | Risk Ratio (M‐H, Fixed, 95% CI) | 1.14 [0.48, 2.72] |
|
| 33 Hyperbilirubinaemia or jaundice Show forest plot | 3 | 176 | Risk Ratio (M‐H, Fixed, 95% CI) | 1.09 [0.59, 2.01] |
|
| 34 Hypocalcaemia Show forest plot | 1 | 97 | Risk Ratio (M‐H, Fixed, 95% CI) | 0.0 [0.0, 0.0] |
|
| 35 Polycythaemia Show forest plot | 1 | 97 | Risk Ratio (M‐H, Fixed, 95% CI) | 0.0 [0.0, 0.0] |
|
| 36 Number of hospital or health professional visits: face‐to‐face visits Show forest plot | 1 | 97 | Mean Difference (IV, Fixed, 95% CI) | ‐0.36 [‐0.92, 0.20] |
|
| 37 Number of hospital or health professional visits: unscheduled face‐to‐face visits Show forest plot | 1 | 97 | Mean Difference (IV, Fixed, 95% CI) | ‐0.62 [‐1.05, ‐0.19] |
|
| 38 Neonatal intensive care unit admission Show forest plot | 3 | 176 | Risk Ratio (M‐H, Fixed, 95% CI) | 1.05 [0.62, 1.79] |
|
| 39 'Neonatal morbidity' (neonatal complications: e.g. hypoglycaemia, hyperbilirubinaemia, respiratory distress syndrome, shoulder dystocia, malformations) (not a prespecified outcome) Show forest plot | 1 | 203 | Risk Ratio (M‐H, Fixed, 95% CI) | 1.52 [0.53, 4.38] |
|
| 40 'Maternal morbidity' (maternal complications: gestational hypertension, pre‐eclampsia, eclampsia, hypoglycaemic episodes) (not a prespecified outcome) Show forest plot | 1 | 203 | Risk Ratio (M‐H, Fixed, 95% CI) | 0.49 [0.13, 1.79] |
|