Différents environnements et méthodes pour le contrôle de la glycémie dans le diabète gestationnel
Résumé scientifique
Contexte
L’incidence de diabète sucré gestationnel (DSG) est en augmentation partout dans le monde. La surveillance de la glycémie joue un rôle crucial pour contrôler la glycémie des femmes atteintes de DSG et elle est généralement recommandée par les professionnels de santé. Il existe différentes méthodes de surveillance de la glycémie, qui peuvent être employées dans différents lieux (par exemple à domicile ou à l’hôpital).
Objectifs
L’objectif de cette revue est de comparer les effets de différentes méthodes et différents environnements de surveillance de la glycémie chez les femmes atteintes de DSG sur la santé de la mère et du fœtus, du nouveau‐né, de l’enfant et de l’adulte et sur l’utilisation et le coût des soins de santé.
Stratégie de recherche documentaire
Nous avons effectué des recherches dans le registre des essais cliniques du groupe Cochrane sur la grossesse et l'accouchement (le 30 septembre 2016), ainsi que dans les références bibliographiques des études trouvées.
Critères de sélection
Essais contrôlés randomisés (ECR) ou essais contrôlés quasi randomisés (ECqR) comparant différentes méthodes (selon le moment et la fréquence, par exemple) ou contextes, ou les deux, pour la surveillance de la glycémie des femmes atteintes de DSG.
Recueil et analyse des données
Deux auteurs ont évalué indépendamment l’éligibilité et le risque de biais et extrait les données. L’exactitude des données a été vérifiée.
Nous avons évalué la qualité des preuves pour les principales comparaisons en utilisant le système GRADE, pour :
‐ les critères de jugement principaux pour les mères : troubles hypertensifs de la grossesse, césariennes, diabète de type 2 ; et
‐ les critères de jugement principaux pour les enfants : poids de naissance élevé, mortalité périnatale, composite mortalité‐morbidité grave, troubles neurosensoriels dans l’enfance et à l’âge adulte,
‐ les critères de jugement secondaires pour les mères : déclenchement du travail, traumatisme périnéal, dépression postnatale, rétention pondérale postpartum ou retour au poids d'avant la grossesse ; et
‐ les critères de jugement secondaires pour les enfants : hypoglycémie néonatale, obésité dans l’enfance et à l’âge adulte, diabète de type 2 dans l’enfance et à l’âge adulte.
Résultats principaux
Nous avons inclus 11 ECR (10 ECR, un ECqR) dans lesquels étaient randomisées 1272 femmes atteintes de DSG dans des pays à revenu moyen ou élevé ; nous avons estimé que ces études présentaient un risque de biais modéré à élevé. Nous avons évalué les ECR de cinq comparaisons. Pour les critères de jugement évalués en utilisant le système GRADE, nous avons rabaissé la valeur probante des données à cause des limites de conception des études, de leur imprécision et de leur manque de cohérence. Trois essais ont été soutenus par des partenaires commerciaux qui ont fourni des glycomètres, un soutien financier ou les deux.
Principales comparaisons
Télémédecine comparée aux soins standard pour la surveillance de la glycémie (cinq ECR) : nous n’avons observé aucune différence claire entre les groupes de télémédecine et de soins standard pour la mère, pour :
‐ la pré‐éclampsie ou l’hypertension induite par la grossesse (risque relatif (RR) 1,49, intervalle de confiance (IC) à 95 % de 0,69 à 3,20 ; 275 participantes, 4 ECR ; données de très mauvaise qualité),
‐ les césariennes (RR moyen 1,05, IC à 95 % de 0,72 à 1,53 ; 478 participantes, 5 ECR; données de très mauvaise qualité) et
‐ le déclenchement du travail (RR 1,06, IC à 95% de 0,63 à 1,77 ; 47 participantes, 1 ECR ; données de très mauvaise qualité) ;
ou pour l'enfant, pour :
‐ un poids de naissance élevé (RR 1,41, IC à 95 % de 0,76 à 2,64 ; 228 participantes, 3 ECR ; données de très mauvaise qualité),
‐ le composite de mortalité et morbidité grave (RR 1,06, IC à 95 % de 0,68 à 1,66 ; 57 participantes, 1 ECR ; données de très mauvaise qualité) et
‐ l’hypoglycémie néonatale (RR 1,14, IC à 95 % de 0,48 à 2,72 ; 198 participantes, 3 ECR ; données de très mauvaise qualité).
Il n’y a eu aucun décès périnatal dans deux ECR (131 participantes ; données de très mauvaise qualité).
Autosurveillance comparée à la surveillance périodique de la glycémie (deux ECR) : nous n’avons observé aucune différence claire entre les groupes de surveillance périodique et d’autosurveillance pour la mère, pour :
‐ la pré‐éclampsie (RR 0,17, IC à 95 % de 0,01 à 3,49 ; 58 participantes, 1 ECR ; données de très mauvaise qualité),
‐ les césariennes (RR moyen 1,18, IC à 95 % de 0,61 à 2,27 ; 400 participantes, 2 ECR; données de très mauvaise qualité),
ou pour l'enfant, pour :
‐ la mortalité périnatale (RR 1,54, IC à 95 % de 0,21 à 11,24 ; 400 participantes, 2 ECR ; données de très mauvaise qualité),
‐ un poids de naissance élevé des enfants (RR 0,82, IC à 95 % de 0,50 à 1,37 ; 400 participantes, 2 ECR ; données de mauvaise qualité) et
‐ l’hypoglycémie néonatale (RR 0,64, IC à 95 % de 0,39 à 1,06 ; 391 participantes, 2 ECR ; données de mauvaise qualité).
Surveillance continue de la glycémie (système SCG) comparée à l’autosurveillance (deux ECR) : nous n’avons observé aucune différence claire entre les groupes de SCG et d’auto‐surveillance pour la mère, pour :
‐ les césariennes (RR moyen 0,91, IC à 95 % de 0,68 à 1,20 ; 179 participantes, 2 ECR; données de très mauvaise qualité),
ou pour l'enfant, pour :
‐ un poids de naissance élevé des enfants (RR 0,67, IC à 95 % de 0,43 à 1,05 ; 106 participantes, 1 ECR ; données de très mauvaise qualité) et
‐ l’hypoglycémie néonatale (RR 0,79, IC à 95 % de 0,35 à 1,78 ; 179 participantes, 2 ECR ; données de très mauvaise qualité).
Il n’y a eu aucun décès périnatal dans les deux ECR (179 participantes, données de très mauvaise qualité).
Autres comparaisons
Transmission des données de glycémie par modem ou par téléphone (un ECR) : aucun des principaux critères de jugement n’a été rapporté dans cet essai.
Surveillance de la glycémie postprandiale ou préprandiale (un ECR) : nous n’avons observé aucune différence claire entre les groupes de contrôle postprandial et préprandial pour la mère, pour :
‐ la pré‐éclampsie (RR 1,00, IC à 95 % de 0,15 à 6,68 ; 66 participantes, 1 ECR),
‐ les césariennes (RR 0,62, IC à 95 % de 0,29 à 1,29 ; 66 participantes, 1 ECR),
‐ les traumatismes périnéaux (RR 0,38, IC à 95 % de 0,11 à 1,29 ; 66 participantes, 1 ECR) et
ou pour l'enfant, pour :
‐ l’hypoglycémie néonatale (RR 0,14, IC à 95 % de 0,02 à 1,10 ; 66 participantes, 1 ECR).
Les mères du groupe de surveillance postprandiale ont eu moins de gros bébés que celles du groupe de surveillance préprandiale (RR 0,29, IC à 95 % de 0,11 à 0,78 ; 66 participantes, 1 ECR).
Conclusions des auteurs
Les données de 11 ECR évaluant différentes méthodes ou différents environnements de contrôle de la glycémie dans le contexte du DSG suggèrent qu’il n’y a aucune différence claire pour les critères de jugement principaux ou d’autres critères de jugement secondaires évalués dans cette revue.
Cependant, les preuves actuelles sont limitées par le petit nombre d'ECR pour les comparaisons évaluées, la petite taille des échantillons, et la qualité méthodologique variable des ECR. Des preuves supplémentaires sont nécessaires pour évaluer les effets de différents environnements et méthodes pour le contrôle de la glycémie dans le DSG sur les résultats pour les mères et leurs enfants, y compris l'utilisation et les coûts des soins de santé. Les futurs ECR peuvent envisager recueillir et fournir des données sur les critères de jugement standard suggérés dans cette revue.
PICOs
Résumé simplifié
Différents environnements et méthodes pour le contrôle de la glycémie chez les femmes atteintes de diabète gestationnel pendant la grossesse
Quelle est la question ?
Le diabète sucré gestationnel (DSG) est une intolérance au glucose (sucre) conduisant à des concentrations élevées de glucose dans le sang (hyperglycémie) et se manifestant pour la première fois pendant la grossesse. Le contrôle de la glycémie est un moyen efficace pour réguler la concentration de sucre dans le sang. Il existe plusieurs méthodes différentes de surveillance de la glycémie, qui peuvent être employées dans différents lieux (par exemple, à domicile ou à l’hôpital). La méthode la mieux à même de limiter les complications de santé pour les futures mères et leurs enfants n’est cependant pas clairement évidente.
Pourquoi est‐ce important ?
Les femmes atteintes de DSG sont plus susceptibles de développer une pré‐éclampsie (une maladie dangereuse caractérisée par une tension artérielle élevée) pendant la grossesse, de nécessiter un déclenchement de l’accouchement, de souffrir de traumatismes du périnée pendant l'accouchement ou d’accoucher par césarienne. Leurs bébés sont plus susceptibles d’avoir un poids de naissance élevé pour leur âge gestationnel, de développer une hypoglycémie (faible taux de sucre dans le sang) et de souffrir de complications potentiellement mortelles. Les mères et leurs bébés sont plus susceptibles de développer des complications à long terme, notamment un diabète de type 2.
Quelles données avons ‐nous trouvées ?
Nous avons effectué des recherches dans la littérature médicale en septembre 2016 et inclus 11 essais contrôlés randomisés (ECR) portant sur 1272 femmes atteintes de DSG et leurs bébés. Trois essais étaient financés par des partenaires commerciaux.
Nous avons inclus cinq comparaisons différentes :
1) télémédecine (transmission des valeurs de glycémie du domicile aux professionnels de santé) et soins standard (examen des données en face à face au cabinet/à l’hôpital) (cinq ECR) ;
2) autosurveillance de la glycémie (à domicile) et surveillance périodique de la glycémie (moins fréquemment, lors des visites en face à face) (deux ECR) ;
3) utilisation d’un système de surveillance continue de la glycémie (SCG) et autosurveillance moins fréquente (deux ECR) ;
4) transmission des valeurs de glycémie par modem (directement du glycomètre au professionnel de santé) et par téléphone (un ECR) ;
5) surveillance de la glycémie postprandiale (après les repas) et préprandiale (avant les repas) (un ECR).
Comparaison de la télémédecine et des soins standard pour la surveillance de la glycémie (cinq ECR) : aucune différence claire entre les groupes télémédecine et soins standard pour la pré‐éclampsie ou l’hypertension, les césariennes ou le déclenchement du travail ou, pour les bébés, un poids de naissance élevé, le développement de morbidités graves ou les hypoglycémies. Il n’y a eu aucun décès dans les deux ECR qui rendaient compte de la mortalité des nourrissons.
Comparaison de l’autosurveillance et de la surveillance périodique de la glycémie (deux ECR) : aucune différence claire entre les groupes d’autosurveillance et de contrôle périodique en termes de pré‐éclampsie ou de césariennes ou, pour les enfants, de mortalité, de poids de naissance élevé ou d’hypoglycémie.
Comparaison de la SCG et de l’autosurveillance de la glycémie (deux ECR) : aucune différence claire entre les groupes de SCG et d’autosurveillance pour les césariennes ni pour le poids de naissance élevé et l’hypoglycémie des enfants. Il n’y a eu aucun décès de nourrissons dans ces deux ECR.
Comparaison de la transmission des données de glycémie par modem ou téléphone (un ECR) : cet ECR n’a rapporté aucun des critères de jugement que nous considérions comme les plus importants.
Comparaison de la surveillance de la glycémie post‐ et préprandiale (un ECR) : aucune différence claire entre les femmes des groupes de surveillance postprandiale et préprandiale pour la pré‐éclampsie, les césariennes ou les traumatismes périnéaux, ni pour les hypoglycémies des enfants. Les bébés nés des femmes du groupe de surveillance de la glycémie postprandiale étaient moins susceptibles d'avoir un poids de naissance élevé que ceux du groupe de surveillance préprandiale.
La qualité des données pour les résultats susmentionnés était mauvaise ou très mauvaise. Aucun des 11 ECR n’a rendu compte de la dépression postnatale, de la rétention pondérale postnatale, du retour au poids d’avant la grossesse ou du développement d’un diabète de type 2 chez les femmes, ni des handicaps, de l’obésité ou du développement d’un diabète de type 2 chez les enfants et jusqu’à l’âge adulte.
Qu'est‐ce que cela signifie ?
La surveillance de la glycémie est une stratégie importante pour la prise en charge du DSG, mais nous n’avons pas déterminé avec certitude quelles sont les meilleures méthodes. Il n’existe pas encore de preuves concluantes issues d’ECR pour orienter la pratique, bien que tout un éventail de méthodes aient été étudiées. Peu d’ECR ont comparé les mêmes interventions ou des interventions similaires, les ECR étaient de petite taille et ont rapporté des résultats limités. D’autres ECR bien conçus et à grande échelle sont nécessaires pour évaluer les effets de différentes méthodes et différents environnements de surveillance de la glycémie chez les femmes atteintes de DSG afin d’améliorer les résultats à court et à long terme pour celles‐ci et leurs enfants.
Authors' conclusions
Summary of findings
| Telemedicine versus standard care for glucose monitoring for gestational diabetes during pregnancy (effect on mother) | ||||||
| Patient or population: women with gestational diabetes mellitus | ||||||
| Outcomes | Anticipated absolute effects* (95% CI) | Relative effect | № of participants | Quality of the evidence | Comments | |
| Risk with standard care | Risk with telemedicine | |||||
| Hypertensive disorders of pregnancy including pre‐eclampsia, gestational hypertension and eclampsia | Study population | RR 1.49 | 275 | ⊕⊝⊝⊝ | ||
| 58 per 1000 | 87 per 1000 | |||||
| Caesarean section | Study population | RR 1.05 | 478 | ⊕⊝⊝⊝ | ||
| 444 per 1000 | 467 per 1000 | |||||
| Development of type 2 diabetes | Study population | not estimable | (0 RCTs) | ‐ | None of the included RCTs reported this outcome | |
| 0 per 1000 | 0 per 1000 | |||||
| Induction of labour | Study population | RR 1.06 | 47 | ⊕⊝⊝⊝ | ||
| 538 per 1000 | 571 per 1000 | |||||
| Perineal trauma | Study population | Not estimable | (0 RCTs) | ‐ | None of the included RCTs reported this outcome | |
| 0 per 1000 | 0 per 1000 | |||||
| Postnatal depression | Study population | Not estimable | (0 RCTs) | ‐ | None of the included RCTs reported this outcome | |
| 0 per 1000 | 0 per 1000 | |||||
| Postnatal weight retention or return to pre‐pregnancy weight | Study population | Not estimable | (0 RCTs) | ‐ | None of the included RCTs reported this outcome | |
| 0 per 1000 | 0 per 1000 | |||||
| *The risk in the intervention group (and its 95% confidence interval) is based on the assumed risk in the comparison group and the relative effect of the intervention (and its 95% CI). | ||||||
| GRADE Working Group grades of evidence | ||||||
| 1Study limitations (downgraded 1 level): 4 RCTs with potentially serious or very serious design limitations | ||||||
| Telemedicine versus standard care for glucose monitoring in gestational diabetes during pregnancy (effect on child) | ||||||
| Patient or population: women with gestational diabetes mellitus | ||||||
| Outcomes | Anticipated absolute effects* (95% CI) | Relative effect | № of participants | Quality of the evidence | Comments | |
| Risk with standard care | Risk with telemedicine | |||||
| Perinatal mortality (including stillbirth or neonatal death) | Study population | ‐ | 131 | ⊕⊝⊝⊝ | There were no perinatal deaths in 2 RCTs | |
| See comment | See comment | |||||
| Large‐for‐gestational age | Study population | RR 1.41 | 228 | ⊕⊝⊝⊝ | ||
| 126 per 1000 | 178 per 1000 | |||||
| Death or serious morbidity composite | Study population | RR 1.06 | 57 | ⊕⊝⊝⊝ | ||
| 560 per 1000 | 594 per 1000 | |||||
| Neurosensory disability | Study population | Not estimable | (0 RCTS) | ‐ | None of the included RCTs reported this outcome | |
| 0 per 100 | 0 per 1000 (0 to 0) | |||||
| Hypoglycaemia | Study population | RR 1.14 | 198 | ⊕⊝⊝⊝ | ||
| 82 per 100 | 94 per 1000 | |||||
| Adiposity (e.g. BMI, skinfold thickness, fat mass) | Study population | Not estimable | (0 RCTs) | ‐ | None of the included RCTs reported this outcome | |
| 0 per 1000 | 0 per 1000 | |||||
| Type 2 diabetes | Study population | Not estimable | (0 RCTs) | ‐ | None of the included RCTs reported this outcome | |
| 0 per 1000 | 0 per 1000 | |||||
| *The risk in the intervention group (and its 95% confidence interval) is based on the assumed risk in the comparison group and the relative effect of the intervention (and its 95% CI). | ||||||
| GRADE Working Group grades of evidence | ||||||
| 1Study limitations (downgraded 1 level): 2 RCTs with potentially serious design limitations | ||||||
| Self‐monitoring versus periodic glucose monitoring for gestational diabetes during pregnancy (effect on mother) | ||||||
| Patient or population: women with gestational diabetes mellitus Intervention: self‐monitoring of glucose | ||||||
| Outcomes | Anticipated absolute effects* (95% CI) | Relative effect | № of participants | Quality of the evidence | Comments | |
| Risk with periodic glucose monitoring | Risk with self‐monitoring of glucose | |||||
| Hypertensive disorders of pregnancy: pre‐eclampsia | Study population | RR 0.17 | 58 | ⊕⊝⊝⊝ | ||
| 74 per 1000 | 13 per 1000 | |||||
| Caesarean section | Study population | RR 1.18 | 400 | ⊕⊕⊝⊝ | ||
| 228 per 1000 | 270 per 1000 | |||||
| Development of type 2 diabetes | Study population | Not estimable | (0 RCTs) | ‐ | Neither of the included RCTs reported this outcome | |
| 0 per 1000 | 0 per 1000 | |||||
| Induction of labour | Study population | Not estimable | (0 RCTs) | ‐ | Neither of the RCTs reported this outcome | |
| 0 per 1000 | 0 per 1000 | |||||
| Perineal trauma | Study population | Not estimable | (0 RCTs) | ‐ | Neither of the included RCTs reported this outcome | |
| 0 per 1000 | 0 per 1000 | |||||
| Postnatal depression | Study population | Not estimable | (0 RCTs) | ‐ | Neither of the included RCTs reported this outcome | |
| 0 per 1000 | 0 per 1000 | |||||
| Postnatal weight retention or return to pre‐pregnancy weight | Study population | Not estimable | (0 RCTs) | ‐ | Neither of the included RCTs reported this outcome | |
| 0 per 1000 | 0 per 1000 | |||||
| *The risk in the intervention group (and its 95% confidence interval) is based on the assumed risk in the comparison group and the relative effect of the intervention (and its 95% CI). | ||||||
| GRADE Working Group grades of evidence | ||||||
| 1Study limitations (downgraded 1 level): 1 RCT with potentially serious design limitations | ||||||
| Self‐monitoring versus periodic for glucose monitoring for gestation diabetes during pregnancy (effect on child) | ||||||
| Patient or population: women with gestational diabetes mellitus Intervention: self‐monitoring of glucose | ||||||
| Outcomes | Anticipated absolute effects* (95% CI) | Relative effect | № of participants | Quality of the evidence | Comments | |
| Risk with periodic glucose monitoring | Risk with self‐monitoring of glucose | |||||
| Perinatal mortality (stillbirth or neonatal death) | Study population | RR 1.54 | 400 | ⊕⊝⊝⊝ | ||
| 5 per 1000 | 8 per 1000 | |||||
| Large‐for‐gestational age | Study population | RR 0.82 | 400 | ⊕⊕⊝⊝ | ||
| 142 per 1000 | 117 per 1000 | |||||
| Death or serious morbidity composite | Study population | Not estimable | (0 RCTs) | ‐ | Neither of the included RCTs reported this outcome | |
| 0 per 1000 | 0 per 1000 | |||||
| Neurosensory disability | Study population | Not estimable | (0 RCTs) | ‐ | Neither of the included RCTs reported this outcome | |
| 0 per 1000 | 0 per 1000 | |||||
| Hypoglycaemia | Study population | RR 0.64 | 391 | ⊕⊕⊝⊝ | ||
| 173 per 1000 | 111 per 1000 | |||||
| Adiposity (e.g. BMI, skinfold thickness, fat mass) | Study population | Not estimable | (0 RCTs) | ‐ | Neither of the included RCTs reported this outcome | |
| 0 per 1000 | 0 per 1000 | |||||
| Type 2 diabetes | Study population | Not estimable | (0 RCTs) | ‐ | Neither of the included RCTs reported this outcome | |
| 0 per 1000 | 0 per 1000 | |||||
| *The risk in the intervention group (and its 95% confidence interval) is based on the assumed risk in the comparison group and the relative effect of the intervention (and its 95% CI). | ||||||
| GRADE Working Group grades of evidence | ||||||
| 1Study limitations (downgraded 1 level): 2 RCTs with potentially serious design limitations | ||||||
| Continuous glucose monitoring system versus self‐monitoring of glucose for gestational diabetes during pregnancy (effect on mother) | ||||||
| Patient or population: women with gestational diabetes mellitus Intervention: continuous glucose monitoring system | ||||||
| Outcomes | Anticipated absolute effects* (95% CI) | Relative effect | № of participants | Quality of the evidence | Comments | |
| Risk with self‐monitoring of glucose | Risk with continuous glucose monitoring system | |||||
| Hypertensive disorders of pregnancy | Study population | Not estimable | (0 RCTs) | ‐ | Neither of the included RCTs reported this outcome | |
| 0 per 1000 | 0 per 1000 | |||||
| Caesarean section | Study population | RR 0.91 | 179 | ⊕⊕⊝⊝ | ||
| 500 per 1000 | 455 per 1000 | |||||
| Development of type 2 diabetes | Study population | Not estimable | (0 RCTs) | ‐ | Neither of the included RCTs reported this outcome | |
| 0 per 1000 | 0 per 1000 | |||||
| Induction of labour | Study population | Not estimable | (0 RCTs) | ‐ | Neither of the included RCTs reported this outcome | |
| 0 per 1000 | 0 per 1000 | |||||
| Perineal trauma | Study population | Not estimable | (0 RCTs) | ‐ | Neither of the included RCTs reported this outcome | |
| 0 per 1000 | 0 per 1000 | |||||
| Postnatal depression | Study population | Not estimable | (0 RCTs) | ‐ | Neither of the included RCTs reported this outcome | |
| 0 per 1000 | 0 per 1000 | |||||
| Postnatal weight retention or return to pre‐pregnancy weight | Study population | Not estimable | (0 RCTs) | ‐ | Neither of the included RCTs reported this outcome | |
| 0 per 1000 | 0 per 1000 | |||||
| *The risk in the intervention group (and its 95% confidence interval) is based on the assumed risk in the comparison group and the relative effect of the intervention (and its 95% CI). | ||||||
| GRADE Working Group grades of evidence | ||||||
| 1Study limitations (downgraded 1 level): 2 RCTs with potentially serious design limitations | ||||||
| Continuous glucose monitoring system versus self‐monitoring of glucose for gestational diabetes during pregnancy (effect on child) | ||||||
| Patient or population: women with gestational diabetes mellitus Intervention: continuous glucose monitoring system | ||||||
| Outcomes | Anticipated absolute effects* (95% CI) | Relative effect | № of participants | Quality of the evidence | Comments | |
| Risk with self‐monitoring of glucose | Risk with continuous glucose monitoring system | |||||
| Perinatal mortality (stillbirth or neonatal death) | Study population | ‐ | 179 | ⊕⊕⊝⊝ | There were no perinatal deaths in the 2 RCTs | |
| See comment | See comment | |||||
| Large‐for‐gestational age | Study population | RR 0.67 | 106 | ⊕⊝⊝⊝ | ||
| 527 per 1000 | 353 per 1000 | |||||
| Death or serious morbidity composite | Study population | Not estimable | (0 RCTs) | ‐ | Neither of the included RCTs reported this outcome | |
| 0 per 1000 | 0 per 1000 | |||||
| Neurosensory disability | Study population | Not estimable | (0 RCTs) | ‐ | Neither of the included RCTs reported this outcome | |
| 0 per 1000 | 0 per 1000 | |||||
| Hypoglycaemia | Study population | RR 0.79 | 179 | ⊕⊝⊝⊝ | ||
| 130 per 1000 | 103 per 1000 | |||||
| Adiposity (e.g. BMI, skinfold thickness, fat mass) | Study population | Not estimable | (0 RCTs) | ‐ | Neither of the included RCTs reported this outcome | |
| 0 per 1000 | 0 per 1000 | |||||
| Type 2 diabetes | Study population | Not estimable | (0 RCTs) | ‐ | Neither of the included RCTs reported this outcome | |
| 0 per 1000 | 0 per 1000 | |||||
| *The risk in the intervention group (and its 95% confidence interval) is based on the assumed risk in the comparison group and the relative effect of the intervention (and its 95% CI). | ||||||
| GRADE Working Group grades of evidence | ||||||
| 1Study limitations (downgraded 1 level): 2 RCTs with potentially serious design limitations | ||||||
Background
Description of the condition
Gestational diabetes mellitus
Gestational diabetes mellitus (GDM) is defined as "carbohydrate intolerance of varying degrees of severity with onset or first recognition during pregnancy" (Metzger 1998). Therefore women with unrecognised pre‐existing type 1 or type 2 diabetes, whose first presentation of the disease is during pregnancy, are included in this definition (Hoffman 1998). Many physiological changes occur as a part of normal pregnancy. For example, maternal metabolic changes include the development of relative insulin resistance and reduced glucose sensitivity, particularly during the second trimester of pregnancy (Kuhl 1998); these physiological changes facilitate the transport of glucose across the placenta to stimulate adequate fetal growth and development (Setji 2005). Some women, however, are predisposed to an excessive maternal insulin resistance and are consequently at risk of hyperglycaemia (high blood glucose) and GDM during their pregnancy.
Diagnostic methods for GDM vary, and there are currently no uniformly accepted international diagnostic criteria. The World Health Organization has recommended a 75 g 2‐hour oral glucose tolerance test (OGTT) at 24 to 28 weeks' gestation (WHO 2013), and in some parts of the world, a 100 g 3‐hour OGTT is used. While universal screening has been encouraged, in some countries screening is only performed for 'high‐risk' women, due to the lack of identifiable risk factors in many women subsequently diagnosed with GDM. The effects of different methods of screening (Tieu 2014), and strategies for diagnosing GDM (Farrar 2015), are the topics of other Cochrane Reviews.
Epidemiology and risk factors
Due to the lack of consistent screening procedures and diagnostic criteria between (and within) countries, different populations of women are diagnosed with GDM in different parts of the world, and reported incidences vary greatly, and can be as high as 28% (Jiwani 2012). There is a general consensus however, that the incidence of GDM is increasing worldwide, in line with the increasing rates of both type 2 diabetes mellitus and maternal obesity (Dabelea 2005; Getahun 2008; Kim 2010; Lawrence 2008).
The HAPO (Hyperglycaemia and Adverse Pregnancy Outcomes) study explored the risks of adverse outcomes associated with different degrees of maternal hyperglycaemia (Coustan 2010; HAPO 2008). Following this, a task force from the International Association of Diabetes in Pregnancy Study Group (IADPSG) developed new consensus‐based criteria for GDM diagnosis using data from the study ‐ suggesting GDM diagnosis after a 75 g OGTT when any three of the following thresholds are met or exceeded: fasting plasma glucose: 5.1 mmol/L (92 mg/dL), 1‐hour plasma glucose: 10.0 mmol/L (180 mg/dL) or 2‐hour plasma glucose: 8.5 mmol/L (153 mg/dL) (IADPSG Consensus Panel 2010). Some studies published since these recommendations were made have revealed substantial increases in the numbers of women diagnosed with GDM when these criteria were applied (Benhalima 2013; Bodmer‐Roy 2012; Lapolla 2011; O'Sullivan 2011; Morikawa 2010). Accordingly, there is much debate surrounding the implications, including potential costs, risks and benefits of widespread use of these criteria.
In addition to obesity (a maternal body mass index of 30 kg/m² or higher), a range of risk factors for GDM have been identified, which include advanced maternal age, increased parity and certain ethnicities (ACOG 2013), with Indigenous Australian, Polynesian and South Asian (Indian) women being regarded as particularly high‐risk groups (Hoffman 1998). Women who have had GDM in a previous pregnancy are also at an increased risk of GDM in their subsequent pregnancies, as are women who have a family history of diabetes (ADA 2004).
Maternal and fetal complications
Hyperglycaemia has many end‐organ adverse effects and the diagnosis of GDM has implications for both mothers and their infants. The potential maternal complications of GDM include polyhydramnios (too much amniotic fluid) due to increased fetal urine production, pre‐eclampsia and caesarean birth (ACOG 2013). Maternal hyperglycaemia may cause accelerated fetal growth, and result in macrosomic (birthweight of at least 4000 g) or large‐for‐gestational‐age infants (Crowther 2005). While caesarean section is often the preferred mode of birth for a macrosomic infant, helping to avoid maternal perineal trauma and infant injury, this mode of birth may also be associated with increased maternal morbidity (Reece 2010).
There are well documented fetal and neonatal complications of GDM. Large‐for‐gestational‐age infants resulting from GDM can lead to shoulder dystocia (obstructed birth) and birth trauma such as nerve palsies and fractures (Crowther 2005; Dodd 2007; Landon 2009; Metzger 1998). Fetal hyperinsulinaemia (raised insulin levels) that occurs in response to maternal hyperglycaemia, may be associated with neonatal hypoglycaemia (HAPO 2008). Other potential complications for infants include neonatal respiratory distress syndrome, hyperbilirubinaemia (jaundice), polycythaemia (an excess of red blood cells) and hypocalcaemia (low blood calcium levels) (ADA 2004; Crowther 2005; Landon 2009; Metzger 1998).
As GDM is a result of physiological metabolic changes during pregnancy, maternal hyperglycaemia should resolve following birth, and does in the majority of cases. A repeat OGTT is recommended in the postpartum period, however, to confirm resolution of hyperglycaemia. Repeat testing is also recommended every one to two years in women with normalised glucose tolerance (ADA 2012; Hoffman 1998), as an obstetric history of GDM confers an increased risk of type 2 diabetes later in life for both mother and infant (Feig 2008; Kim 2002; O'Sullivan 1991; Pettitt 1985; Silverman 1998).
Description of the intervention
Different methods and settings for glucose monitoring for gestational diabetes mellitus
Treatment of GDM including lifestyle advice, monitoring of blood glucose, insulin therapy and oral hypoglycaemics, has been shown to significantly reduce the risk of maternal and perinatal complications (including perinatal mortality, shoulder dystocia, bone fracture, and nerve palsy) without increasing the risk of caesarean section (Crowther 2005; Landon 2009). Cochrane Reviews have assessed (or plan to assess) alternative management strategies for GDM (Alwan 2009), including lifestyle interventions (Brown 2017), insulin (Brown 2016), oral anti‐diabetic pharmacological therapies (Brown 2017b), exercise (Ceysens 2016), dietary supplementation with myo‐inositol (Brown 2016b), and different intensities of glycaemic control (Martis 2016).
Management of GDM relies on a multi‐disciplinary team approach to inform and educate the woman and to establish glycaemic control. Blood glucose monitoring is a crucial part in maintaining this control and is generally recommended by obstetric healthcare professionals (Gabbe 2004; NICE 2008). The decision to initiate active treatments for the management of GDM, including insulin therapy and oral hypoglycaemic agents, relies on the adequate monitoring of blood glucose. Consensus on the ideal methods (including frequency or timing) and settings for monitoring, however, has yet to be established.
Methods (including frequency and timing) of blood glucose monitoring
There is some evidence that more frequent blood glucose monitoring is associated with improved outcomes (Goldberg 1986: Langer 1994), although the optimal timing and frequency of testing is not known. Guidelines in different countries suggest monitoring three or four times daily (with both fasting and postprandial measurements recorded) (ACOG 2013; Nankervis 2013).
Debate continues about the best time to measure blood glucose concentrations, including whether postprandial monitoring, preprandial monitoring, or both should be conducted. Insulin peaks two to three hours after a meal, although this is likely to vary according to what is eaten and when. If carried out, it is not clear whether postprandial monitoring should take place one, or two, hours after meals (Weisz 2005). Similarly, if carried out, it is not clear when fasting or preprandial monitoring should be conducted (Ben‐Haroush 2004).
The benefits of continuous monitoring are also still in question; glucose monitoring systems can record concentrations at regular intervals over several days and this can give a full picture of changes throughout the day. There have been studies that suggested that such supplementary monitoring improves glycaemic control, which can have an impact on clinical outcomes (Murphy 2008; Yu 2014). As yet, there is insufficient evidence about the harms and benefits for women or babies for it to be generally recommended for GDM, although it may be a component of care for pregnant women with type 1 or 2 diabetes (ADA 2012). There is also a paucity of evidence about the optimal duration of continuous monitoring and the best time in pregnancy for it to be conducted, along with the cost‐effectiveness of such intensive monitoring (Voormolen 2013).
Settings for blood glucose monitoring
With the introduction of home reflectance monitors in the late 1970s, self‐monitoring of blood glucose became possible (Espersen 1985). Some early benefits of self‐monitoring for pregnant women with insulin‐dependent diabetes were observed, including declines in mean blood glucose concentrations and in the numbers of diabetes‐related hospitalisations (Espersen 1985). Self‐monitoring of blood glucose in the management of GDM has since become more widely practised (Gabbe 2004). Much debate, however, still exists surrounding its usefulness (Buchanan 2003; Jovanovic 2003), and particularly regarding the optimal timing and frequency of such self‐monitoring (Buchanan 2003; Gabbe 2004; Jovanovic 2003). Trials investigating treatments for GDM have generally used regular capillary blood glucose testing for monitoring, both in a hospital setting (with weekly testing) and home setting (with frequencies of testing ranging from seven times per day, to five days per week), with monthly glycated haemoglobin (HbA1c) concentrations also monitored in some trials (Alwan 2009).
More recent developments of digital technologies for self‐monitoring allow real‐time transfer of measurements to healthcare providers. Such devices mean that women are able to monitor their blood glucose from home; the results are relayed directly to healthcare providers, who in turn can offer advice or recommend changes in treatment without the women needing to attend a healthcare facility (Mackillop 2014). Electronic monitoring with direct transfer of results reduces the need for women to maintain diaries, and may reduce recording errors (Given 2013). As well as improving monitoring, such devices may enable timely intervention that could improve outcomes. Remote monitoring and feedback may also reduce the need for costly and inconvenient clinic visits, and many women are comfortable using smart‐phone and other interactive internet based technologies (Hirst 2015). However, some women may lack resources (such as internet access) or the confidence to use such devices, and may prefer monitoring to take place at regular clinic visits.
How the intervention might work
A consensus on the ideal method (including frequency and timing) and setting of monitoring is yet to be established. As the number of women affected by GDM increases there is an urgent need to identify the most cost‐effective means of monitoring blood glucose that achieves the best outcomes for women and their infants.
Glucose monitoring at both home and hospital, using a variety of methods, is currently part of the management of GDM, and trials investigating interventions for treating GDM have included testing in both locations (Alwan 2009). Home monitoring may be more likely to be well accepted or tolerated, and may allow more frequent and intensive monitoring. Barriers to home monitoring may include the reliance on women's adherence to the daily regimen, and their ability to use the self‐monitoring equipment appropriately. Glucose monitoring in the hospital setting may be less frequent (for example, weekly or fortnightly), but may encourage increased clinical contact and improved surveillance of measurements.
Non‐randomised studies have provided some support for home care in GDM and the more intensive self‐monitoring of blood glucose concentrations that it allows. In a non‐randomised study of 58 women with GDM, infants born to women who had undertaken home self‐monitoring were found to have lower rates of macrosomia than those born to women who had weekly in‐hospital 2‐hour postprandial capillary glucose monitoring (Goldberg 1986). The reduction of macrosomia was attributed, by the study authors, to the earlier detection of the need for insulin with home monitoring (Goldberg 1986). In a further prospective study of over 2000 women with GDM, intensive glucose self‐monitoring (seven times a day) using memory‐based reflectance meters was found to be associated with lower rates of macrosomia, caesarean birth, shoulder dystocia, stillbirth and neonatal intensive care unit days, when compared with conventional management (Langer 1994).
In addition to the potential health benefits of home care in the management of GDM, home glucose monitoring for women may prove to be more cost‐effective than hospital monitoring, which is an important public health consideration, given the increasing incidence of GDM.
Why it is important to do this review
GDM may be diagnosed through screening processes and potentially managed with adequate monitoring and appropriate initiation of active treatments, so it is vitally important that the most effective and safe monitoring strategies are identified. While blood glucose monitoring for women with GDM is commonly recommended, there is currently no consensus on whether self‐monitoring (which can be carried out at home) has benefits when compared with hospital glucose monitoring. With the increasing incidence of GDM, the optimal method and setting for blood glucose monitoring should be determined, with consideration of the public health and resource implications.
Objectives
The objective of this review is to compare the effects of different methods and settings for glucose monitoring for women with GDM on maternal and fetal, neonatal, child and adult outcomes, and use and costs of health care.
Methods
Criteria for considering studies for this review
Types of studies
We planned to include published, unpublished and ongoing randomised or quasi‐randomised controlled trials, however we only identified published trials for inclusion. We planned to include cluster‐randomised trials, however we did not identify any. Cross‐over trials are not eligible for inclusion in this review.
We classified trials that are currently available only as abstracts ‐ for which we could not obtain information about risk of bias and primary or secondary outcomes ‐ as 'awaiting classification'; we will reconsider these trials for inclusion once the full publications are available.
Types of participants
We included women diagnosed with GDM during their current pregnancy, as defined by individual trialists. We included women of any age, gestation and parity, but excluded women with previously diagnosed type 1 or type 2 diabetes.
Types of interventions
We included trials that compared different methods (including timings and frequencies) or settings, or both, for blood glucose monitoring.
This could include, for example, comparisons of ‘home’ (ambulatory or outpatient care) glucose monitoring with ‘hospital’ (acute care) glucose monitoring. ‘Home’ care could include studies where blood glucose self‐monitoring was performed predominately at home by the women (using a variety of methods, frequencies and timings). ‘Hospital’ care could include studies where blood glucose monitoring was performed predominately in the hospital (i.e. at antenatal hospital visits or as an inpatient) using a variety of methods, frequencies and timings. This could also include comparing different methods, frequencies or timings of glucose monitoring in the same setting (e.g. 'home').
Types of outcome measures
Primary outcomes
For the mother
-
Hypertensive disorders of pregnancy (including pre‐eclampsia, pregnancy‐induced hypertension, eclampsia)
-
Caesarean section
-
Development of type 2 diabetes
For the child
-
Perinatal mortality (stillbirth or neonatal mortality)
-
Large‐for‐gestational age
-
Death or serious morbidity composite
-
Neurosensory disability
Secondary outcomes
For the mother
Perinatal
-
Induction of labour
-
Perineal trauma
-
Placental abruption
-
Postpartum haemorrhage
-
Postpartum infection
-
Gestational weight gain
-
Adherence to the intervention
-
Behavioural changes associated with the intervention
-
Sense of well‐being and quality of life
-
Views of the intervention
-
Breastfeeding (e.g. at discharge, six weeks postpartum)
-
Use of additional pharmacotherapy
-
Maternal hypoglycaemia
-
Glycaemic control during or at end of treatment
-
Mortality
Long‐term
-
Postnatal depression
-
Postnatal weight retention or return to pre‐pregnancy weight
-
Body mass index (BMI)
-
GDM in a subsequent pregnancy
-
Type 1 diabetes
-
Impaired glucose tolerance
-
Cardiovascular health (e.g. blood pressure, hypertension, cardiovascular disease, metabolic syndrome)
For the child
Fetus/neonate
-
Stillbirth
-
Neonatal death
-
Gestational age at birth
-
Preterm birth (before 37 weeks' gestation; before 32 weeks' gestation)
-
Apgar score < 7 at five minutes
-
Macrosomia
-
Small‐for‐gestational age
-
Birthweight and z score
-
Head circumference and z score
-
Length and z score
-
Ponderal index
-
Adiposity
-
Shoulder dystocia
-
Nerve palsies
-
Bone fractures
-
Respiratory distress syndrome
-
Hypoglycaemia
-
Hyperbilirubinemia or jaundice
-
Hypocalcaemia
-
Polycythaemia
Child/adult
-
Weight and z score
-
Height and z score
-
Head circumference and z score
-
Adiposity (e.g. BMI, skinfold thickness, fat mass)
-
Cardiovascular health (e.g. blood pressure, hypertension, cardiovascular disease, metabolic syndrome)
-
Type 1 diabetes
-
Type 2 diabetes
-
Impaired glucose tolerance
-
Employment, education and social status or achievement
Use and costs of health services
-
Number of antenatal visits or admissions
-
Number of hospital or health professional visits (e.g. midwife, obstetrician, physician, dietician, diabetic nurse) (unscheduled and scheduled)
-
Admission to neonatal intensive care unit
-
Length of antenatal stay
-
Length of postnatal stay (mother)
-
Length of postnatal stay (baby)
-
Cost of maternal care
-
Cost of offspring care
-
Costs associated with the intervention
-
Costs to families associated with the management provided
(We used the standard outcome set agreed by consensus between review authors of Cochrane Pregnancy and Childbirth reviews for prevention and treatment of GDM and pre‐existing diabetes.)
Search methods for identification of studies
The following methods section of this review is based on a standard template used by Cochrane Pregnancy and Childbirth.
Electronic searches
We searched the Cochrane Pregnancy and Childbirth Trials Register by contacting their Information Specialist (30 September 2016).
The Register is a database containing over 21,000 reports of controlled trials in the field of pregnancy and childbirth. For full search methods used to populate the Pregnancy and Childbirth Group Trials Register including the detailed search strategies for CENTRAL, MEDLINE, Embase and CINAHL; the list of handsearched journals and conference proceedings, and the list of journals reviewed via the current awareness service, please follow this link to the editorial information about Cochrane Pregnancy and Childbirth in the Cochrane Library and select the ‘Specialized Register ’ section from the options on the left side of the screen.
Briefly, the Cochrane Pregnancy and Childbirth Trials Register is maintained by their Information Specialist and contains trials identified from:
-
monthly searches of the Cochrane Central Register of Controlled Trials (CENTRAL);
-
weekly searches of MEDLINE (Ovid);
-
weekly searches of Embase (Ovid);
-
monthly searches of CINAHL (EBSCO);
-
handsearches of 30 journals and the proceedings of major conferences;
-
weekly current awareness alerts for a further 44 journals plus monthly BioMed Central email alerts.
-
scoping searches of ClinicalTrials.gov and the WHO International Clinical Trials Registry Platform (ICTRP).
Search results are screened by two people from Cochrane Pregnancy and Childbirth, and the full text of all relevant trial reports identified through the searching activities described above is reviewed. Based on the intervention described, each trial report is assigned a number that corresponds to a specific Pregnancy and Childbirth review topic (or topics), and is then added to the Register. The Information Specialist searches the Register for each review using this topic number rather than keywords. This results in a more specific search set which has been fully accounted for in the relevant review sections (Included studies; Excluded studies; Studies awaiting classification; Ongoing studies).
Searching other resources
We searched reference lists of retrieved articles.
We did not apply any language or date restrictions.
Data collection and analysis
The following methods section of this review is based on a standard template used by Cochrane Pregnancy and Childbirth.
Selection of studies
Independently, two review authors assessed all the potential studies identified as a result of the search strategy for inclusion. We resolved any disagreement through discussion or, if required, we consulted the third review author.
Data extraction and management
At least two review authors extracted the data using the agreed form. We resolved discrepancies through discussion or, if required, we consulted the third review author. Data were entered into Review Manager 5 software (Review Manager 2014), and checked for accuracy.
When information regarding any of the above was unclear, we contacted authors of the original reports to provide further details.
Assessment of risk of bias in included studies
Two review authors independently assessed risk of bias for each study using the criteria outlined in the Cochrane Handbook for Systematic Reviews of Interventions (Higgins 2011). Any disagreement was resolved by discussion or by involving a third assessor.
(1) Random sequence generation (checking for possible selection bias)
For each included study we described the method used to generate the allocation sequence in sufficient detail to allow an assessment of whether it should produce comparable groups.
We assessed the method as being at:
-
low risk of bias (any truly random process, e.g. random number table; computer random number generator);
-
high risk of bias (any non‐random process, e.g. odd or even date of birth; hospital or clinic record number);
-
unclear risk of bias.
(2) Allocation concealment (checking for possible selection bias)
For each included study we described the method used to conceal allocation to interventions prior to assignment and assessed whether intervention allocation could have been foreseen in advance of, or during recruitment, or changed after assignment.
We assessed the methods as being at:
-
low risk of bias (e.g. telephone or central randomisation; consecutively numbered sealed opaque envelopes);
-
high risk of bias (open random allocation; unsealed or non‐opaque envelopes, alternation; date of birth);
-
unclear risk of bias.
(3.1) Blinding of participants and personnel (checking for possible performance bias)
For each included study we described the methods used, if any, to blind study participants and personnel from knowledge of which intervention a participant received. We considered that studies were at low risk of bias if they were blinded, or if we judged that the lack of blinding unlikely to affect results. We assessed blinding separately for different outcomes or classes of outcomes.
We assessed the methods as being at:
-
low, high or unclear risk of bias for participants;
-
low, high or unclear risk of bias for personnel.
(3.2) Blinding of outcome assessment (checking for possible detection bias)
For each included study we described the methods used, if any, to blind outcome assessors from knowledge of which intervention a participant received. We assessed blinding separately for different outcomes or classes of outcomes.
We assessed methods used to blind outcome assessment as being at:
-
low, high or unclear risk of bias.
(4) Incomplete outcome data (checking for possible attrition bias due to the amount, nature and handling of incomplete outcome data)
For each included study, and for each outcome or class of outcomes, we described the completeness of data including attrition and exclusions from the analysis. We stated whether attrition and exclusions were reported and the numbers included in the analysis at each stage (compared with the total randomised participants), reasons for attrition or exclusion where reported, and whether missing data were balanced across groups or were related to outcomes. Where sufficient information was reported, or could be supplied by the study authors, we planned to re‐include missing data in the analyses which we undertook.
We assessed methods as being at:
-
low risk of bias (e.g. no missing outcome data; missing outcome data balanced across groups);
-
high risk of bias (e.g. numbers or reasons for missing data imbalanced across groups; ‘as treated’ analysis done with substantial departure of intervention received from that assigned at randomisation);
-
unclear risk of bias.
(5) Selective reporting (checking for reporting bias)
For each included study we described how we investigated the possibility of selective outcome reporting bias and what we found.
We assessed the methods as being at:
-
low risk of bias (where it was clear that all of the study’s prespecified outcomes and all expected outcomes of interest to the review were reported);
-
high risk of bias (where not all the study’s prespecified outcomes were reported; one or more reported primary outcomes were not prespecified; outcomes of interest were reported incompletely and so could not be used; study failed to include results of a key outcome that would have been expected to have been reported);
-
unclear risk of bias.
(6) Other bias (checking for bias due to problems not covered by (1) to (6) above)
For each included study we described any important concerns we had about other possible sources of bias.
(7) Overall risk of bias
We made explicit judgements about whether studies were at high risk of bias, according to the criteria given in the Cochrane Handbook for Systematic Reviews of Interventions (Higgins 2011). With reference to (1) to (6) above, we assessed the likely magnitude and direction of the bias and whether we considered it was likely to have an impact on the findings. We explored the impact of the level of bias through undertaking sensitivity analyses ‐ seeSensitivity analysis.
Assessment of the quality of the evidence using the GRADE approach
We evaluated the quality of the evidence using the GRADE approach as outlined in the GRADE handbook for our three main comparisons.
-
Telemedicine versus standard care for glucose monitoring
-
Self‐monitoring versus periodic glucose monitoring
-
Continuous glucose monitoring system versus self‐monitoring of glucose
The GRADE approach uses five considerations (study limitations, consistency of effect, imprecision, indirectness and publication bias) to assess the quality of the body of evidence for specific outcomes. The evidence can be downgraded from 'high quality' by one level for serious (or by two levels for very serious) limitations, depending on assessments for risk of bias, indirectness of evidence, inconsistency, imprecision of effect estimates or publication bias. In this review we used the GRADE approach to assess the following outcomes, and reported them in 'Summary of findings' tables.
For the mother
-
Hypertensive disorders of pregnancy (including pre‐eclampsia, pregnancy‐induced hypertension, eclampsia)
-
Caesarean section
-
Development of type 2 diabetes
-
Induction of labour
-
Perineal trauma
-
Postnatal depression
-
Postnatal weight retention or return to pre‐pregnancy weight
For the child
-
Perinatal mortality (stillbirth or neonatal death)
-
Large‐for‐gestational age
-
Death or serious morbidity composite
-
Neurosensory disability
-
Hypoglycaemia
-
Adiposity (e.g. BMI, skinfold thickness, fat mass)
-
Type 2 diabetes
We used the GRADEpro Guideline Development Tool, GRADEpro 2014, to import data from Review Manager 5 in order to create ’Summary of findings’ tables (Review Manager 2014). A summary of the intervention effect and a measure of quality according to the GRADE approach is presented in the 'Summary of findings' tables for the outcomes listed above.
Measures of treatment effect
Dichotomous data
For dichotomous data, we presented results as summary risk ratios with 95% confidence intervals.
Continuous data
For continuous data, we used the mean difference. We planned to use the standardised mean difference to combine trials that measured the same outcome, but used different methods.
Unit of analysis issues
Cluster‐randomised trials
We did not identify any cluster‐randomised trials for inclusion in this review.
If cluster‐randomised trials are included in future updates of the review, we plan to include them in the analyses along with individually‐randomised trials. Their sample sizes will be adjusted using the methods described in the Cochrane Handbook for Systematic Reviews of Interventions (Higgins 2011), using an estimate of the intra‐cluster correlation co‐efficient (ICC) derived from the trial (if possible), or from another source. If ICCs from other sources are used, we will report this and conduct sensitivity analyses to investigate the effect of variation in the ICC. If we identify both cluster‐randomised trials and individually‐randomised trials, we plan to synthesise the relevant information. We plan to consider it reasonable to combine the results from both, if there is little heterogeneity between the study designs, and the interaction between the effect of intervention and the choice of randomisation unit is considered to be unlikely. We plan to also acknowledge heterogeneity in the randomisation unit and perform a sensitivity analysis to investigate the effects of the randomisation units.
Cross‐over trials
We excluded trials with cross‐over designs.
Multi‐armed trials
If we had included multi‐armed trials, we planned to record and include all outcome data in the review as two‐arm comparisons. We planned to include the data for the different arms in independent two‐arm comparisons in separate meta‐analyses. In instances where we could not include the data in separate comparisons, we planned to combine them to create a single pair‐wise comparison (Higgins 2011). If the control group was shared by two or more study arms, we planned to divide it between relevant subgroup categories to avoid double‐counting the participants (for dichotomous data, we planned to divide the events and the total population, while for continuous data, we planned to assume the same mean and standard deviation (SD) but planned to divide the total population). We planned to describe the details in the 'Characteristics of included studies' tables.
Other unit of analysis issues
As infants from multiple pregnancies are not independent, we planned to use cluster‐trial methods in the analysis, where the data allowed, and where multiples made up a substantial proportion of the trial population, to account for non‐independence of variables (Gates 2004).
Dealing with missing data
For included studies, we noted levels of attrition. In future updates, if more eligible studies are included, we will explore the impact of including studies with high levels of missing data in the overall assessment of treatment effect by using sensitivity analyses.
For all outcomes, we carried out analyses, as far as possible, on an intention‐to‐treat basis, i.e. we attempted to include all participants randomised to each group in the analyses. The denominator for each outcome in each trial was the number randomised minus any participants whose outcomes were known to be missing.
Assessment of heterogeneity
We assessed statistical heterogeneity in each meta‐analysis using the Tau², I² and Chi² statistics. We regarded heterogeneity as substantial if an I² was greater than 30% and either the Tau² was greater than zero, or there was a low P value (less than 0.10) in the Chi² test for heterogeneity. If we identified substantial heterogeneity (above 30%), we planned to explore it using prespecified subgroup analyses.
Assessment of reporting biases
If there were 10 or more studies in the meta‐analysis, we planned to investigate reporting biases (such as publication bias) using funnel plots. We planned to assess funnel plot asymmetry visually. If asymmetry was suggested by a visual assessment, we planned to perform exploratory analyses to investigate it.
Data synthesis
We carried out statistical analysis using Review Manager 5 software (Review Manager 2014). We used fixed‐effect meta‐analysis for combining data where it was reasonable to assume that studies were estimating the same underlying treatment effect, that is, where studies examined the same intervention, and we judged the studies' populations and methods to be sufficiently similar.
Where there was clinical heterogeneity sufficient to expect that the underlying treatment effects differed between trials, or where substantial statistical heterogeneity was detected, we used random‐effects meta‐analysis to produce an overall summary, if an average treatment effect across trials was considered clinically meaningful. The random‐effects summary has been treated as the average range of possible treatment effects and we have discussed the clinical implications of treatment effects differing between trials. If the average treatment effect was not clinically meaningful, we planned not to combine trials. Where we used random‐effects analyses, the results have been presented as the average treatment effect with 95% confidence intervals, and the estimates of Tau² and I².
Subgroup analysis and investigation of heterogeneity
If we identified substantial heterogeneity, we planned to investigate it using subgroup analyses or sensitivity analyses. We planned to consider whether an overall summary is meaningful, and if it was, to use random‐effects analysis to produce it.
We planned to carry out the following subgroup analyses.
-
Timing of monitoring (i.e. postprandial versus preprandial)
-
Frequency of monitoring (i.e. multiple times per day versus daily)
-
Method of monitoring (i.e. use of glucose meter versus use of continuous glucose monitoring system)
-
Gestational age at randomisation, and at diagnosis (i.e. first trimester versus second trimester versus third trimester)
We planned to restrict subgroup analyses to the review's primary outcomes.
We planned to assess subgroup differences by interaction tests available within Review Manager 5 (Review Manager 2014). We planned to report the results of subgroup analyses quoting the Chi² statistic and P value, and the interaction test I² value.
Due to paucity of data in the review, however, we were not able to conduct planned subgroup analyses.
Sensitivity analysis
We planned to carry out a sensitivity analysis to explore the effects of trial quality assessed by omitting studies rated as 'high risk of bias' and 'unclear' when considering allocation concealment (selection bias) and incomplete outcome data (attrition bias). We planned to restrict this to the primary outcomes.
Due to paucity of data in the review, however, we were not able to conduct our planned sensitivity analyses.
Results
Description of studies
Results of the search
The search of the Cochrane Pregnancy and Childbirth Trials Register retrieved 39 reports, relating to 27 studies. We included 11 studies and excluded five.
Four studies are awaiting further classification (Ding 2012; Paramasivam 2014; Puricel 2014; Rigla 2015), and seven studies are ongoing (Evers 2016; Hanafusa 2015; Kim 2014; Mackillop 2016; Mendez‐Figueroa 2013; Rasekaba 2015a; Rudge 2013) (See Characteristics of studies awaiting classification; Characteristics of ongoing studies).
See Figure 1.

Study flow diagram
Included studies
We identified 11 trials that met the inclusion criteria for this review (Dalfra 2009; De Veciana 1995; Given 2015; Homko 2002; Homko 2007; Homko 2012; Kestila 2007; Kruger 2003; Perez‐Ferre 2010; Rey 1997; Wei 2016).
Design
One of the 11 included trials was a quasi‐randomised controlled trial (Dalfra 2009), and the other 10 were randomised controlled trials (De Veciana 1995; Given 2015; Homko 2002; Homko 2007; Homko 2012; Kestila 2007; Kruger 2003; Perez‐Ferre 2010; Rey 1997; Wei 2016).
Sample sizes
The 11 included trials randomised a total of 1272 pregnant women with GDM. Sample sizes ranged from 50 women in Given 2015, to 347 women in Rey 1997.
Settings and dates of trials
Five trials were conducted in the USA (De Veciana 1995; Homko 2002; Homko 2007; Homko 2012; Kruger 2003), and one trial was conducted in each of the following countries: Canada (Rey 1997), China (Wei 2016), Finland (Kestila 2007), Ireland (Given 2015), Italy (Dalfra 2009), and Spain (Perez‐Ferre 2010).
Trials ran between 1993 and 2013: Given 2015 took place between January 2012 and May 2013; Homko 2002 between March 1998 and November 1999; Homko 2007 between September 2004 and May 2006; Homko 2012 between September 2007 and November 2009; Perez‐Ferre 2010 between June and December 2007; Rey 1997 between June 1993 and May 1994; and Wei 2016 between September 2011 and December 2012. Four trials did not specify trial dates (Dalfra 2009; De Veciana 1995; Kestila 2007; Kruger 2003).
Participants
All 11 trials included women with gestational diabetes mellitus (GDM). One trial also included women with type 1 diabetes (Dalfra 2009), however, we have only included data related to the women with GDM in the review.
One trial (De Veciana 1995) diagnosed women with GDM according to the O'Sullivan and Mahan 1964 criteria (O'Sullivan 1964), four trials (Dalfra 2009; Homko 2007; Homko 2012; Perez‐Ferre 2010) used the Carpenter and Coustan 1982 criteria (Carpenter 1982), one trial (Given 2015) referenced the National Institute of Clinical Excellence: Diabetes in Pregnancy 2008 guidelines (NICE 2008) (however it did not specify the criteria used), and one trial (Wei 2016) reported that women were diagnosed according to criteria recommended by the American Diabetes Association 2011 (ADA 2012) and IADPSG 2010 (IADPSG Consensus Panel 2010). The Kestila 2007 trial used at least two abnormal values in a 2‐hour 75 g OGTT (fasting > 5.1 mmol/L, 1‐hour > 10 mmol/L, 2‐hour > 8.7 mmol/L). Rey 1997 (using plasma capillary blood) used a 1‐hour 50 g OGCT of ≥ 11.1 mmol/L, or between 8.9 and 11.0 mmol/L plus at least two abnormal values on a three‐hour 100 g OGTT. Abnormal values were dependent on gestation; before 26 weeks (fasting > 5.3 mmol/L, one‐hour > 10 mmol/L, two‐hour > 8.9 mmol/L; 3 hours > 7.8 mmol/L) or during and after 26 weeks (fasting > 5.6 mmol/L, one‐hour > 11.1 mmol/L; two‐hour > 9.2 mmol/L, three‐hour > 8.3 mmol/L). Two trials did not state diagnostic criteria used (Homko 2002; Kruger 2003).
After diagnosis of GDM, inclusion of women with varying gestational ages was reported: between 24 and 28 weeks' gestation (Given 2015; Wei 2016), within a week from diagnosis (mean of 28 weeks' gestation) (Dalfra 2009), before 28 weeks' gestation (Perez‐Ferre 2010), at or before 30 weeks' gestation (De Veciana 1995), at or before 33 weeks' gestation (Homko 2002; Homko 2007; Homko 2012), between 22 and 34 weeks' gestation (Kestila 2007), between 22 and 38 weeks' gestation (Rey 1997); Kruger 2003 did not specify gestational age.
Additional eligibility criteria varied across the trials, with Given 2015 also including women with impaired glucose tolerance (and referencing the National Institute of Clinical Excellence: Diabetes in Pregnancy 2008 guidelines (NICE 2008), however not specifying the criteria used); Homko 2002 required women to have a fasting glucose value of ≤ 5.3 mmol/L at the OGTT; and De Veciana 1995 included only women who required insulin (i.e. those with elevated fasting blood glucose values at the time of a 3‐hour OGTT or with weekly fasting and 1‐hour postprandial blood glucose values exceeding 5.8 mmol/L or 7.8 mmol/L respectively).
Six trials specified that only women with singleton pregnancies were included (De Veciana 1995; Kestila 2007; Wei 2016), or that women with multiple pregnancies were excluded (Homko 2007; Homko 2012; Rey 1997). Six trials detailed exclusion of women with a history of diabetes (type 1 or 2) (De Veciana 1995; Given 2015; Kruger 2003; Wei 2016) and/or prior glucose intolerance (Homko 2007; Homko 2012). Additional exclusion criteria reported included: pre‐existing hypertension, renal disease or autoimmune disorders (De Veciana 1995), receipt of oral steroid therapy (Given 2015), congential malformations, or current diet or insulin therapy (Rey 1997), and previous treatment for GDM, presence of infection, or other severe metabolic, endocrine, medical or psychological co‐morbidities (Wei 2016). Four trials did not specify exclusion criteria (Dalfra 2009; Homko 2002; Kestila 2007; Perez‐Ferre 2010).
Interventions and comparisons
We assessed the 11 included trials under five different comparisons.
Telemedicine versus standard care for glucose monitoring
Five trials compared the use of telemedicine versus standard care in glucose monitoring (Dalfra 2009; Given 2015; Homko 2007; Homko 2012; Perez‐Ferre 2010). Women in the telemedicine groups of these trials transmitted their blood glucose measurements weekly (Dalfra 2009; Given 2015; Homko 2012; Perez‐Ferre 2010), or at least three times per week (Homko 2007). The blood glucose measurements were sent to healthcare practitioners for review, using varying technologies, including: an interfacing device that converted values recorded by a blood glucose meter into audio tones which were sent via a normal telephone receiver to an Internet‐based server (Dalfra 2009); a cellular telephone (with an interfacing device) that converted values recorded by a blood glucose meter to messages sent via a short message service (SMS) to an Internet‐based application (Perez‐Ferre 2010); a telemedicine hub (with a small screen and three buttons to collect and transmit data) which sent stored values recorded by a blood glucose meter to a central server (Given 2015); and a computer using a web‐based disease management interactive healthcare delivery system composed of a secure Internet server and a database (Homko 2007; Homko 2012 (with the option of telephone communication (Homko 2012)). Following review of the information, women received feedback from the healthcare practitioners via telephone voice messages (Dalfra 2009), cellular telephone text messages (Rey 1997), telephone calls (Given 2015), or written messages on a web‐based system (Homko 2007; Homko 2012).
Regimens varied between trials: in the Perez‐Ferre 2010 trial, women in both groups were asked to self‐monitor their blood glucose six times daily during the first week, and then (if glycaemic control was achieved) three times daily or every other day. The Dalfra 2009, Homko 2007, and Homko 2012 trials requested self‐monitoring four times daily, while in Given 2015 it was required up to seven times a day. Medical examinations or specialist diabetes clinic visits occurred at least every two weeks in the Given 2015, Homko 2007 and Homko 2012 trials, and once a month in the Perez‐Ferre 2010 trial. In Dalfra 2009, women in the standard care group had visits every two weeks, while women in the telemedicine group had monthly visits.
Self‐monitoring versus periodic glucose monitoring
Two trials compared self‐monitoring of blood glucose with periodic (outpatient) monitoring (Homko 2002; Rey 1997). Women in the self‐monitoring groups were instructed to measure their blood glucose every day, alternating between three times daily (one hour after each meal) and four times daily (before each meal and at bed time) (Rey 1997); or four times daily (fasting and one hour after each meal) four times per week (Homko 2002). Women in the periodic monitoring groups had their blood glucose (fasting or one hour post breakfast, or both (Rey 1997), or fasting and one hour post meal (Homko 2002)) measured at each antenatal visit (Homko 2002) or at outpatient clinic visits every two weeks (Rey 1997).
Continuous glucose monitoring system versus self‐monitoring of glucose
Two trials compared the use of continuous glucose monitoring system (CGMS) with self‐monitoring of blood glucose, to determine subsequent management (i.e. need for anti‐diabetic drug therapy) within a week after initiating monitoring (Kestila 2007; Wei 2016). One of the trials assessed both early (24 to 28 weeks' gestation) and late (28 to 36 weeks' gestation) CGMS (Wei 2016). All women in both groups were taught to perform self‐monitoring of blood glucose, and were instructed to measure their blood glucose four times (Wei 2016), or five times (Kestila 2007), daily.
Modem versus telephone transmission for glucose monitoring
One trial compared the transmission of blood glucose data from a meter to an Endocrinology and Metabolism Clinic via a modem, with the transmission of data via telephone calls directly to clinic personnel (Kruger 2003). In both groups, women were instructed to measure their blood glucose five times daily (before breakfast, one hour after each meal (three meals), and before bed), and to report their concentrations daily for the first two weeks, and then weekly thereafter; the data were reviewed by clinic personnel who provided feedback and guidance to the women via the telephone (Kruger 2003).
Postprandial versus preprandial glucose monitoring
One trial compared daily monitoring of blood glucose before breakfast (fasting) and one hour after each meal (postprandial monitoring), with daily monitoring of fasting, before meal and bed time blood glucose (preprandial monitoring) (De Veciana 1995).
Funding and declarations of interest
Seven trials received funding support from non‐commercial organisations:
-
Given 2015: the Department for Employment and Learning for Northern Ireland and the Derry City Council, Ireland;
-
Homko 2002: the General Clinical Research Center Branch of the National Center for Research Resources, USA;
-
Homko 2007: the National Institute of Nursing Research, National Institutes of Health, USA;
-
Homko 2012: the National Institute of Diabetes and Digestive and Kidney Diseases, National Institutes of Health USA;
-
Kestila 2007 the Turku University Central Hospital Research Fund and the Foundation of Gynaecologists and Obstetricians, Finland;
-
Perez‐Ferre 2010: 'Fundacion para Estudios Metabolicos'; and
-
Wei 2016: the Social Development Project of JiangSu Province, China.
Three trials received some support from commercial partners: Homko 2002 was provided with glucose meters by LifeScan Inc; Kruger 2003 was provided with a grant, and glucose meters from Roche Diagnostics; and Rey 1997 was supported by Lilly Canada.
Two trials did not report any funding sources (Dalfra 2009; De Veciana 1995).
Given 2015 reported that one author had received research funding from Nova Biomedical (a manufacturer of glucose meters); and Homko 2012 reported that one author had stock ownership in, and another was a consultant for, Insight Telehealth Systems. Perez‐Ferre 2010 and Wei 2016 reported that the authors had no conflicts of interest. The other seven trials did not report on declarations of interest (Dalfra 2009; De Veciana 1995; Homko 2002; Homko 2007; Kestila 2007; Kruger 2003; Perez‐Ferre 2010).
For further details, see Characteristics of included studies.
Excluded studies
We excluded five studies (Bancroft 2000; Bartholomew 2015; Clarke 2005; Elnour 2008; Fung 1996). Two assessed treatment strategies for women with GDM (Bancroft 2000; Elnour 2008), two were cross‐over trials (Bartholomew 2015; Clarke 2005), and one included pregnant women (but not specifically women with GDM) (Fung 1996).
For further details, see Characteristics of excluded studies.
Risk of bias in included studies
Overall, we judged the trials to be at moderate to high risk of bias; lack of methodological detail led to 'unclear' risk of bias judgements across many of the domains (See Figure 2; Figure 3).

Risk of bias graph: review authors' judgements about each risk of bias item presented as percentages across all included studies

Risk of bias summary: review authors' judgements about each risk of bias item for each included study
Allocation
We judged one of the trials to be at low risk of selection bias, because it used an adequate method for sequence generation (random allocation software) and allocation concealment (an independent research secretary) (Given 2015). While two further trials detailed adequate methods for sequence generation (use of computer‐generated tables of random numbers), they did not detail methods for concealment of allocation, and thus we judged them to be at an unclear risk of selection bias (Rey 1997; Wei 2016).
Six of the trials did not provide sufficient detail regarding sequence generation or allocation concealment and therefore we judged them to be at an unclear risk of selection bias (De Veciana 1995; Homko 2002; Homko 2007; Homko 2012; Kestila 2007; Kruger 2003). The final two trials were judged to be at high risk of selection bias, with one trial using alternate allocation (Dalfra 2009), and another allocating a subgroup of women (those most likely to require treatment) to the intervention group (Perez‐Ferre 2010).
Blinding
We considered all of the 11 trials to be at a high risk of performance bias as, due to the nature of the interventions, it was not considered feasible for women or study personnel to be blinded (Dalfra 2009; De Veciana 1995; Given 2015; Homko 2002; Homko 2007; Homko 2012; Kestila 2007; Kruger 2003; Perez‐Ferre 2010; Rey 1997; Wei 2016).
Only one of the trials specifically detailed that it was unblinded, and this was also judged to be at high risk of detection bias (De Veciana 1995). In the other 10 trials, risk of detection bias was considered unclear, as no details were provided regarding whether outcome assessors could be blinded (Dalfra 2009; Given 2015; Homko 2002; Homko 2007; Homko 2012; Kestila 2007; Kruger 2003; Perez‐Ferre 2010; Rey 1997; Wei 2016).
Incomplete outcome data
We judged six of the trials to be at low risk of attrition bias, with either no missing outcome data (De Veciana 1995), or missing outcome data balanced in numbers across groups and/or similar reasons for missing data across groups (Homko 2007; Homko 2012; Perez‐Ferre 2010; Rey 1997; Wei 2016). We judged three trials to be at unclear risk of attrition bias, with insufficient reporting of attrition or exclusions to permit clear judgements (Given 2015; Homko 2002; Kestila 2007). We judged the other two trials to be at a high risk of attrition bias, with an imbalance in numbers or reasons for missing data across groups (Dalfra 2009), or a high proportion of missing outcome data (Kruger 2003).
Selective reporting
We judged nine of the trials to be at an unclear risk of reporting bias (Dalfra 2009; De Veciana 1995; Given 2015; Homko 2002; Homko 2007; Homko 2012; Perez‐Ferre 2010; Rey 1997; Wei 2016), as no trial protocols were available to help us assess whether the published reports included all prespecified outcomes. We judged the other two trials to be at a high risk of reporting bias, as they reported outcomes of interest incompletely (providing only narrative summaries in text; or P values), which meant they could not be entered in meta‐analyses (Kestila 2007; Kruger 2003), or did not present all of the prespecified outcomes (as per the 'Methods' section of the published report) (Kestila 2007).
Other potential sources of bias
In eight of the trials, there were no obvious sources of other bias (De Veciana 1995; Given 2015; Homko 2002; Homko 2007; Homko 2012; Perez‐Ferre 2010; Rey 1997; Wei 2016). We judged risk of other bias to be unclear in three of the trials, due to the lack of methodological detail provided (Dalfra 2009; Kestila 2007), or lack of information provided regarding the baseline characteristics of the women (Kruger 2003), or both.
Effects of interventions
See: Summary of findings for the main comparison Telemedicine versus standard care for glucose monitoring for gestational diabetes during pregnancy (effect on mother); Summary of findings 2 Telemedicine versus standard care for glucose monitoring in gestational diabetes during pregnancy (effect on child); Summary of findings 3 Self‐monitoring versus periodic glucose monitoring for gestational diabetes during pregnancy (effect on mother); Summary of findings 4 Self‐monitoring versus periodic for glucose monitoring for gestation diabetes during pregnancy (effect on child); Summary of findings 5 Continuous glucose monitoring system versus self‐monitoring of glucose for gestational diabetes during pregnancy (effect on mother); Summary of findings 6 Continuous glucose monitoring system versus self‐monitoring of glucose for gestational diabetes during pregnancy (effect on child)
Telemedicine versus standard care for glucose monitoring
Five trials were included in this comparison (Dalfra 2009; Given 2015; Homko 2007; Homko 2012; Perez‐Ferre 2010).
Primary outcomes
For the mother
No clear differences between the telemedicine and standard care groups were observed for:
-
pre‐eclampsia or pregnancy‐induced hypertension (risk ratio (RR) 1.49, 95% confidence interval (CI) 0.69 to 3.20; 275 participants, 4 RCTs; very low quality evidence; Analysis 1.1); or
-
caesarean section (average RR 1.05, 95% CI 0.72 to 1.53; 478 participants, 5 RCTs; Tau² = 0.11; Chi² = 10.51; I² = 62%; very low quality evidence; Analysis 1.2).
None of the trials reported on the development of type 2 diabetes.
For the child
There were no perinatal deaths in the two trials that reported on this outcome (131 participants, 2 RCTs; very low quality evidence; Analysis 1.3).
There were no clear differences between the telemedicine and standard care groups for:
-
large‐for‐gestational age (RR 1.41, 95% CI 0.76 to 2.64; 228 participants, 3 RCTs; very low quality evidence; Analysis 1.4); or
-
death or serious morbidity composite outcome (of neonatal intensive care unit admission, large‐for‐gestational age, respiratory outcomes (hyaline membrane disease, transient tachypnoea, need for respiratory support) hypoglycaemia, and hyperbilirubinaemia) (RR 1.06, 95% CI 0.68 to 1.66; 57 participants, 1 RCT; very low quality evidence; Analysis 1.5).
None of the trials reported on neurosensory disability.
Secondary outcomes
For the mother
No clear differences between the telemedicine and standard care groups were observed for:
-
operative vaginal birth (RR 0.50, 95% CI 0.11 to 2.30; 47 participants, 1 RCT; Analysis 1.6) ‐ this outcome was not prespecified;
-
induction of labour (RR 1.06, 95% CI 0.63 to 1.77; 47 participants, 1 RCT; very low quality evidence;Analysis 1.7);
-
placental abruption (RR 0.88, 95% CI 0.12 to 6.42; 154 participants, 2 RCTs; Analysis 1.8);
-
gestational weight gain (mean difference (MD) ‐0.47 kg, 95% CI ‐1.50 to 0.55; 300 participants, 2 RCTs; Analysis 1.9);
-
weight at 36 weeks (MD 5.50 kg, 95% CI ‐5.69 to 16.69; 44 participants, 1 RCT; Analysis 1.10);
-
-
adherence to the intervention (Analysis 1.11): appointments attended (MD 5.20, 95% CI ‐2.27 to 12.67; 47 participants, 1 RCT), average daily self‐monitoring of blood glucose frequency (as measured by meter memory (MD 0.50, 95% CI ‐0.42 to 1.42; 44 participants, 1 RCT) or diary (MD 0.10, 95% CI ‐0.66 to 0.86; 45 participants, 1 RCT), or frequency of monitoring as measured by number of data points (MD 21.10, 95% CI ‐9.33 to 51.53; 57 participants, 1 RCT), or number of data sets (MD 1.20, 95% CI ‐12.32 to 14.72; 74 participants, 1 RCT);
-
use of additional pharmacotherapy:
-
the use of oral anti‐diabetic agents (RR 0.85, 95% CI 0.50 to 1.42; 184 participants, 3 RCTs; Analysis 1.13);
-
the combined use of insulin and oral anti‐diabetic agents (RR 1.24, 95% CI 0.19 to 8.06; 47 participants, 1 RCT; Analysis 1.13);
-
-
maternal hypoglycaemia (no events; 203 participants, 1 RCT; Analysis 1.14);
-
self‐monitored glucose episodes < 3.9 mmol/L (MD ‐0.10%, 95% CI ‐1.64 to 1.44; 44 participants, 1 RCT; Analysis 1.15);
-
HbA1c less than 5.8% (RR 1.00, 95% CI 0.96 to 1.04; 97 participants, 1 RCT; Analysis 1.17);
-
HbA1c at 36 weeks (MD 0.20%, 95% CI ‐2.03 to 2.43; 30 participants, 1 RCT; Analysis 1.18);
-
self‐monitored blood glucose (MD 0.00 mmol/L, 95% CI ‐0.30 to 0.30; 44 participants, 1 RCT; Analysis 1.19);
-
fasting blood glucose (MD ‐0.50 mg/dL, 95% CI ‐5.38 to 4.38; 131 participants, 2 RCTs; Tau² = 5.54; Chi² = 1.80; I² = 44%; Analysis 1.20); and
-
2‐hour postprandial blood glucose (MD ‐0.21 mg/dL, 95% CI ‐5.09 to 4.67; 131 participants, 2 RCTs; Analysis 1.20).
-
Women in the telemedicine group had an improved sense of well‐being and quality of life, as measured by the Diabetes Empowerment Scale (DES), compared with women in the standard care group:
-
for total score (MD 0.40, 95% CI 0.14 to 0.66; 57 participants, 1 RCT; Analysis 1.12), and
-
for subscale scores:
-
managing the psychosocial aspects of diabetes (MD 0.50, 95% CI 0.21 to 0.79; 57 participants, 1 RCT; Analysis 1.12),
-
assessing dissatisfaction and readiness to change (MD 0.40, 95% CI 0.14 to 0.66; 57 participants, 1 RCT; Analysis 1.12), and
-
setting and achieving diabetes goals (MD 0.30, 95% CI ‐0.04 to 0.64; 57 participants, 1 RCT; Analysis 1.12).
-
There was an approximate 50% relative increase in additional pharmacotherapy in the form of insulin use for women in the telemedicine group, compared with those in the standard care group (RR 1.52, 95% CI 1.18 to 1.96; 484 participants, 5 RCTs; Analysis 1.13), and improved glycaemic control with lower HbA1c levels were observed among women in the telemedicine group compared with those in the standard care group (MD ‐0.15%, 95% CI ‐0.26 to ‐0.04; 357 participants, 3 RCTs; Analysis 1.16).
With regard to adherence, Dalfra 2009 reported that "Most of the women with diabetes sent their glycaemic profile weekly (76%), while 24% did so more frequently (2–4 times a week);" (this included women in the trial with type 1 diabetes). Homko 2007 noted that "Seven women (22%) in the intervention group never accessed the system," and that "Rates of appointment adherence were similar between the two groups (94% for women in the control group and 90% for women in the telemedicine group)". Homko 2012 reported that "Of the 36 women in the intervention group available for follow‐up until delivery, two women (6%) never used the system, and an additional five women (14%) used the system infrequently (< 10 transmissions)".
With regard to quality of life, although Dalfra 2009 also assessed women using the following questionnaires: CES‐D for depression, SF‐36 for health‐related quality of life, and Stress and Distress for the impact of diabetes, the trial authors did not report the data separately for the women in the trial with GDM.
With regard to the women's views of the intervention, Dalfra 2009 did not report this information separately for the women with GDM, while Perez‐Ferre 2010 reported in the Discussion: "When the Telemedicine system was offered, patients accepted the proposal in a positive way and showed their satisfaction at the end of the follow‐up. They highly appreciated the possibility to communicate with the healthcare team as required".
None of the trials reported on the other secondary outcomes for the mother (perineal trauma; postpartum haemorrhage; postpartum infection; behaviour changes associated with the intervention; breastfeeding; mortality).
For the mother in the longer term
None of the trials reported on any secondary outcomes for the mother in the longer term.
For the fetus/neonate
No clear differences between the telemedicine and standard care groups were observed for:
-
stillbirth (RR 0.41, 95% CI 0.02 to 9.55; 178 participants, 3 RCTs; Analysis 1.21);
-
neonatal death (no events; 131 participants, 2 RCTs; Analysis 1.22);
-
gestational age at birth (MD 0.10 weeks, 95% CI ‐0.18 to 0.37; 478 participants, 5 RCTs; Analysis 1.23);
-
preterm birth (RR 0.66, 95% CI 0.31 to 1.39; 275 participants, 4 RCTs; Analysis 1.24);
-
macrosomia (average RR 1.43, 95% CI 0.27 to 7.52; 249 participants, 2 RCTs; Tau² = 0.98; Chi² = 3.09; I² = 68%; Analysis 1.25);
-
small‐for‐gestational age (no events; 91 participants, 1 RCT; Analysis 1.26);
-
birthweight (MD 63.13 g, 95% CI ‐32.32 to 158.59; 477 participants, 5 RCTs; Analysis 1.27);
-
head circumference (MD 0.70 cm, 95% CI 0.02 to 1.38; 45 participants, 1 RCT; Analysis 1.28);
-
length (MD 0.20 cm, 95% CI ‐1.34 to 1.74; 42 participants, 1 RCT; Analysis 1.29);
-
shoulder dystocia (RR 0.33, 95% CI 0.01 to 7.83; 142 participants, 2 RCTs; Analysis 1.30);
-
respiratory distress syndrome (RR 0.63, 95% CI 0.26 to 1.49; 176 participants, 3 RCTs) (Analysis 1.31);
-
neonatal hypoglycaemia (RR 1.14, 95% CI 0.48 to 2.72; 198 participants, 3 RCTs; very low quality evidence; Analysis 1.32);
-
neonatal hyperbilirubinaemia or jaundice (RR 1.09, 95% CI 0.59 to 2.01; 176 participants, 3 RCTs; Analysis 1.33);
-
neonatal hypocalcaemia (no events; 97 participants, 1 RCT; Analysis 1.34); or
-
polycythaemia (no events; 97 participants, 1 RCT; Analysis 1.35).
None of the trials reported on the other secondary outcomes for the fetus/neonate (Apgar score < 7 at five minutes; ponderal index; adiposity; nerve palsies; bone fractures).
For the child and adult
None of the trials reported on any secondary outcomes for the child and adult.
Use and costs of health services
No clear differences between the telemedicine and standard care groups were observed for:
-
number of hospital or health professional visits: face‐to‐face visits (MD ‐0.36 visits, 95% CI ‐0.92 to 0.20; 97 participants, 1 RCT; Analysis 1.36); or neonatal intensive care unit admission (RR 1.05, 95% CI 0.62 to 1.79; 176 participants, 3 RCTs; Analysis 1.38).
-
-
There was a reduction in unscheduled face‐to‐face visits among women in the telemedicine group, compared with those in the standard care group (MD ‐0.62 visits, 95% CI ‐1.05 to ‐0.19; 97 participants, 1 RCT; Analysis 1.37).
-
-
-
With regard to the number of hospital or health professional visits, Dalfra 2009 reported that "Only 23% of the patients with gestational diabetes required extra medical examinations. The control group had a medical examination every two weeks, each visit taking about 30 minutes. In all, the control women with gestational diabetes visited the diabetes clinic 44% more often than the women followed up with telemedicine".
-
For length of postnatal stay (baby), Homko 2012 reported that the neonates from the intervention group (N = 4) admitted to the neonatal intensive care unit had a shorter length of stay than those from the control group (N = 7) "(5.5 days vs. 9.7 days), but none of these differences was statistically significant".
With regard to costs associated with the intervention, Perez‐Ferre 2010 reported that "In our study, the telemedicine system not only made attention more convenient for the patient, it was also less expensive for the health system in terms of use of health professionals’ time".
None of the trials reported on the other secondary outcomes for the use and costs of health services (number of antenatal visits or admissions; length of antenatal stay; length of postnatal stay (mother); cost of maternal care; cost of offspring care; costs to families associated with the management provided).
Non prespecified outcomes
Dalfra 2009 also reported on composite outcomes 'neonatal morbidity' and 'maternal morbidity' and observed no clear difference between the telemedicine and standard care groups for either outcome (RR 1.52, 95% CI 0.53 to 4.38; 203 participants, 1 RCT; Analysis 1.39); (RR 0.49, 95% CI 0.13 to 1.79; 203 participants, 1 RCT; Analysis 1.40).
Self‐monitoring versus periodic glucose monitoring
Two trials were included in this comparison (Homko 2002; Rey 1997).
Primary outcomes
For the mother
We observed no clear differences between the self‐monitoring and periodic glucose monitoring groups for:
-
pre‐eclampsia (RR 0.17, 95% CI 0.01 to 3.49; 58 participants, 1 RCT; very low quality evidence; Analysis 2.1); or
-
caesarean section (average RR 1.18, 95% CI 0.61 to 2.27; 400 participants, 2 RCTs; Tau² = 0.12; Chi² = 1.95; I² = 49%; low quality evidence; Analysis 2.2).
Neither of the trials reported on the development of type 2 diabetes.
For the child
No clear differences between the self‐monitoring and period glucose monitoring groups were observed for:
-
perinatal mortality (RR 1.54, 95% CI 0.21 to 11.24; 400 participants, 2 RCTs; very low quality evidence; Analysis 2.3); or
-
large‐for‐gestational age (RR 0.82, 95% CI 0.50 to 1.37; 400 participants, 2 RCTs; low quality evidence; Analysis 2.4).
Neither of the trials reported on death or serious morbidity composite, or neurosensory disability.
Secondary outcomes
For the mother
No clear differences between the self‐monitoring and periodic glucose monitoring groups were observed for:
-
placental abruption (RR 2.63, 95% CI 0.11 to 61.88; 58 participants, 1 RCT; Analysis 2.5);
-
postpartum haemorrhage (RR 2.63, 95% CI 0.11 to 61.88; 58 participants, 1 RCT; Analysis 2.6);
-
gestational weight gain (MD ‐5.50 lb, 95% CI ‐13.57 to 2.57; 58 participants, 1 RCT; Analysis 2.8);
-
adherence to the intervention (less than 70% adherence to home blood glucose measurements or diabetes outpatient clinic appointments) (RR 0.74, 95% CI 0.32 to 1.71; 342 participants, 1 RCT; Analysis 2.9);
-
Dietary Compliance Questionnaire total compliance score (MD 1.50, 95% CI ‐0.47 to 3.47; 58 participants, 1 RCT)
-
mean compliance score (MD 0.00, 95% CI ‐0.40 to 0.40; 58 participants, 1 RCT; Analysis 2.10);
-
-
sense of wellbeing and quality of life:
-
Diabetes Empowerment Scale (DES) scores overall (MD 3.70, 95% CI ‐2.08 to 9.48; 47 participants, 1 RCT);
-
scores for setting goals (MD 0.65, 95% CI ‐1.10 to 2.40; 47 participants, 1 RCT); problem solving (MD 1.35, 95% CI ‐0.37 to 3.07; 47 participants, 1 RCT); motivating oneself (MD 0.63, 95% CI ‐0.89 to 2.15; 47 participants, 1 RCT); obtaining support (MD 0.94, 95% CI ‐0.09 to 1.97; 47 participants, 1 RCT); and making decisions (MD 0.01, 95% CI ‐1.39 to 1.41; 47 participants, 1 RCT; Analysis 2.11);
-
appraisal of Diabetes Scale delta scores (emotional adjustment) (MD 1.20, 95% CI ‐0.88 to 3.28; 47 participants, 1 RCT; Analysis 2.12);
-
-
use of additional pharmacotherapy: use of insulin (RR 1.31, 95% CI 0.69 to 2.48; 400 participants, 2 RCTs; Analysis 2.13);
-
Glycaemic control during or at end of treatment:
-
preprandial blood glucose (MD 0.06 mmol/L, 95% CI ‐0.08 to 0.19; 360 participants, 2 RCTs; Tau² = 0.01; Chi² = 3.12; I² = 36%; Analysis 2.14); or
-
postprandial blood glucose (MD ‐0.09 mmol/L, 95% CI ‐0.60 to 0.42; 395 participants, 2 RCTs; Tau² = 0.17; Chi² = 15.03; I² = 87%; Analysis 2.15).
-
Weekly weight gain was, on average, 100 g less for women in the self‐monitoring group compared with those in the periodic glucose monitoring group (MD ‐0.10 kg/week, 95% CI ‐0.15 to ‐0.05; 342 participants, 1 RCT; (Analysis 2.7).
Neither trial reported on the other secondary outcomes for the mother (induction of labour; perineal trauma; postpartum infection; behavioural changes associated with the intervention; views of the intervention; breastfeeding; maternal hypoglycaemia; mortality).
For the mother in the longer term
Neither trial reported on any of the secondary outcomes for the mother in the longer term.
For the fetus/neonate
No clear differences between the self‐monitoring and periodic glucose monitoring groups were observed for:
-
stillbirth (RR 1.54, 95% CI 0.21 to 11.24; 400 participants, 2 RCTs; Analysis 2.16);
-
neonatal death (no events; 58 participants, 1 RCT; Analysis 2.17);
-
gestational age at birth (MD ‐0.03 weeks, 95% CI ‐0.32 to 0.27; 400 participants, 2 RCTs; Analysis 2.18);
-
macrosomia (RR 0.94, 95% CI 0.53 to 1.67; 342 participants, 1 RCT; Analysis 2.19);
-
small‐for‐gestational age (RR 1.19, 95% CI 0.53 to 2.67; 342 participants, 1 RCT; Analysis 2.20);
-
birthweight (MD ‐40.22 g, 95% CI ‐148.37 to 67.93; 400 participants, 2 RCTs; Analysis 2.21);
-
birthweight percentile (MD ‐0.67, 95% CI ‐6.75 to 5.42; 342 participants, 1 RCT; Analysis 2.22);
-
shoulder dystocia (RR 0.25, 95% CI 0.03 to 2.19; 342 participants, 1 RCT; Analysis 2.23);
-
hypoglycaemia (RR 0.64, 95% CI 0.39 to 1.06; 391 participants, 2 RCTs; low quality evidence; Analysis 2.24) or
-
hyperbilirubinaemia or jaundice (RR 0.63, 95% CI 0.39 to 1.04; 370 participants, 2 RCTs; Analysis 2.25).
Neither trial reported on the other secondary outcomes for the fetus/neonate (preterm birth; Apgar score < 7 at five minutes; head circumference; length; ponderal index; adiposity; nerve palsies; bone fractures; respiratory distress syndrome; hypocalcaemia; polycythaemia).
For the child and adult
Neither trial reported on the other secondary outcomes for the child and adult.
Use and costs of health services
No clear differences between the self‐monitoring and periodic glucose monitoring groups were observed for number of antenatal visits with the diabetes team (MD 0.20, 95% CI ‐1.09 to 1.49; 58 participants, 1 RCT; Analysis 2.26); or neonatal intensive care unit admissions (RR 0.87, 95% CI 0.13 to 5.77; 58 participants, 1 RCT; Analysis 2.27).
With regard to costs associated with the intervention, Rey 1997 reported "the direct management costs (meter rental, equipment purchase, and clinic reagent strip) of the two follow‐ups in considering the transfer to home monitoring. On a weekly basis the expense was (US dollars): $10.80/woman on home monitoring, $0.50/woman with a breakfast result below 7.8 mmol/L on clinic follow up, and $6.80/woman with a breakfast result at or above 7.8 mmol/L on clinic follow up".
Neither trial reported on the other secondary outcomes related to the use and costs of health services (number of hospital or health professional visits; length of antenatal stay; length of postnatal stay (mother); length of postnatal stay (baby); cost of maternal care; cost of offspring care; costs to families associated with the management provided).
Non prespecified outcomes
No clear differences between the self‐monitoring and period glucose monitoring groups were observed for 'birth trauma' (RR 0.87, 95% CI 0.06 to 13.27; 58 participants, 1 RCT; Analysis 2.28); or 'respiratory complications' (RR 0.87, 95% CI 0.06 to 13.27; 58 participants, 1 RCT; Analysis 2.29).
Continuous glucose monitoring system versus self‐monitoring of glucose
Two trials compared the use of continuous glucose monitoring system (CGMS) with self‐monitoring of glucose (Kestila 2007; Wei 2016).
Primary outcomes
For the mother
We observed no clear difference between the CGMS and self‐monitoring groups forcaesarean section (RR 0.91, 95% CI 0.68 to 1.20; 179 participants, 2 RCTs; very low quality evidence; Analysis 3.1). Kestila 2007 reported "There were no statistically significant differences between the two groups in … frequency of pre‐eclampsia, pregnancy‐induced hypertension".
Neither of the trials reported on the development of type 2 diabetes.
For the child
There were no perinatal deaths in the two trials (179 participants, very low quality evidence; Analysis 3.2).
We observed no clear difference between the CGMS and self‐monitoring groups for large‐for‐gestational age (RR 0.67, 95% CI 0.43 to 1.05; 106 participants, 1 RCT; very low quality evidence; Analysis 3.3).
Neither of the trials reported on death or serious morbidity composite or neurosensory disability.
Secondary outcomes
For the mother
There was, on average, 1.26 kg less gestational weight gain among women in the CGMS group compared with those in the self‐monitoring group (MD ‐1.26 kg, 95% CI ‐2.28 to ‐0.24; 179 participants, 2 RCTs; Analysis 3.4). There was also an almost three‐fold increase in use of additional pharmacotherapy among women in the CGMS group compared with those in the self‐monitoring group (RR 2.86, 95% CI 1.47 to 5.56; 179 participants, 2 RCTs; Analysis 3.5).
We observed no clear difference between the CGMS and self‐monitoring groups for glycaemic control: HbA1c at 32 to 36 weeks (MD ‐0.10%, 95% CI ‐0.24 to 0.04; 106 participants, 1 RCT; Analysis 3.6).
With regard to perineal trauma, Kestila 2007 reported that "There were no statistically significant differences between the two groups in … maternal lacerations".
With regard to women's views of the intervention, Wei 2016 reported "The continuous glucose monitor was commonly well tolerated by the pregnant women in the CGMS group. No skin infections occurred at the sensor insertion site, but mild erythema, itchiness, and inflammation often occurred".
With regard to maternal hypoglycaemia, Wei 2016 reported that "The continuous glucose monitor was commonly well tolerated by the pregnant women in the CGMS group … An average of 568 ± 30 glucose measurements were recorded, and the reported hypoglycaemic episodes occurred primarily during early morning and early evening".
Neither trial reported on the other secondary outcomes for the mother (induction of labour, placental abruption, postpartum haemorrhage, postpartum infection, adherence to the intervention, behavioural changes associated with the intervention, sense of well‐being and quality of life, breastfeeding, or mortality).
For the mother in the longer term
Neither trial reported on any secondary outcomes for the mother in the longer term.
For the fetus/neonate
There were no stillbirths (Analysis 3.7) or neonatal deaths (Analysis 3.8) in either trial (179 participants).
No clear differences between the CGMS and self‐monitoring groups were observed for:
-
gestational age at birth (MD ‐0.17 weeks, 95% CI ‐0.52 to 0.19; 179 participants, 2 RCTs; Analysis 3.9);
-
preterm birth at less than 37 weeks' gestation (RR 1.03, 95% CI 0.15 to 6.91; 73 participants, 1 RCT; Analysis 3.10);
-
macrosomia (RR 0.85, 95% CI 0.35 to 2.05; 179 participants, 2 RCTs; Analysis 3.11);
-
small‐for‐gestational age (RR 1.08, 95% CI 0.16 to 7.37; 106 participants, 1 RCT; Analysis 3.12);
-
birthweight (MD ‐110.17 g, 95% CI ‐264.73 to 44.39; 179 participants, 2 RCTs; Analysis 3.13);
-
neonatal hypoglycaemia (RR 0.79, 95% CI 0.35 to 1.78; 179 participants, 2 RCTs; very low quality evidence; Analysis 3.14); or
-
hyperbilirubinaemia or jaundice (RR 1.03, 95% CI 0.28 to 3.80; 73 participants, 1 RCT; Analysis 3.15).
Neither trial reported on the other secondary outcomes for the fetus/neonate (Apgar score < 7 at five minutes, macrosomia, head circumference, length, ponderal index, adiposity, shoulder dystocia, nerve palsies, bone fractures, respiratory distress syndrome, hypocalcaemia, polycythaemia).
For the child and adult
Neither trial reported on any secondary outcomes for the child and adult.
Use and costs of health services
No clear differences between the CGMS and self‐monitoring groups were observed for:
-
neonatal intensive care unit admission (RR 0.65, 95% CI 0.29 to 1.50; 73 participants, 1 RCT; Analysis 3.16); or
-
length of postnatal stay (baby; length of stay in neonatal intensive care) (MD ‐0.83 days, 95% CI ‐2.35 to 0.69; 18 participants, 1 RCT; Analysis 3.17).
Neither trial reported on the other secondary outcomes for the use and costs of health services (number of antenatal visits or admissions; number of hospital or health professional visits; length of antenatal stay; length of postnatal stay (mother); cost of maternal care; cost of offspring care; costs associated with the intervention; costs to families associated with the management provided).
Modem versus telephone transmission for glucose monitoring
One trial was included in this comparison (Kruger 2003).
Primary outcomes
For the mother
Kruger 2003 did not report on any of our primary outcomes for the mother: hypertensive disorders of pregnancy, caesarean section, or development of type 2 diabetes.
For the child
Kruger 2003 did not report on any of our primary outcomes for the child: perinatal mortality, large‐for‐gestational age, death or serious morbidity composite, or neurosensory disability.
Secondary outcomes
For the mother
With regard to women's views of the intervention, no clear differences between the modem and telephone transmission groups were observed in response to the following statements:
-
'Overall, I am satisfied with how easy it is to use the Accu‐Check Complete, Acculink' (RR 1.11, 95% CI 0.90 to 1.38; 38 participants, 1 RCT);
-
'I feel comfortable using the Accu‐Chek Complete, Acculink' (RR 0.96, 95% CI 0.66 to 1.41; 38 participants, 1 RCT);
-
'Whenever I made a mistake using the Accu‐Chek Complete, Acculink, I could recover easily and quickly' (RR 0.92, 95% CI 0.67 to 1.25; 38 participants, 1 RCT);
-
'It was easy to learn to use the Accu‐Chek Complete, Acculink' (RR 1.05, 95% CI 0.82 to 1.34; 38 participants, 1 RCT); and
-
'The written material provided for the Accu‐Chek Complete was easy to understand' (RR 1.18, 95% CI 0.92 to 1.51; 38 participants, 1 RCT; Analysis 4.1).
Kruger 2003 reported on the results of a survey of women's views, noting that "The results of this survey demonstrated that both groups of participants were very satisfied with the blood glucose meter. Participants in both groups stated they understood the written material provided by the meter’s manufacturer and felt confident in their blood glucose results. Participants in the modem group reported that they liked the convenience of transmitting their blood glucose results to the clinic by modem, that the modem saved them time, and that it resulted in more accurate data transmission".
Kruger 2003 did not report on any of the other secondary outcomes for the mother.
For the mother in the longer term
Kruger 2003 did not report on any of the secondary outcomes for the mother in the longer term.
For the fetus/neonate
Kruger 2003 reported that "No statistically significant differences between the modem group and control group were found for ... weeks of gestation (p = 0.24)."
Kruger 2003 did not report on any of the other secondary outcomes for the fetus/neonate.
For the child and adult
Kruger 2003 did not report on any secondary outcomes for the child and adult.
Use and costs of health services
Kruger 2003 did not report on any of the secondary outcomes related to the use and costs of health services.
Non‐prespecified outcomes
Kruger 2003 reported that there was "No statistically significant differences between the modem group and the control group were found for mean telephone consultation time (p = 0.71), length of clinic visit (p = 0.83)".
Postprandial versus preprandial glucose monitoring
One trial compared postprandial and preprandial glucose monitoring (De Veciana 1995).
Primary outcomes
For the mother
We observed no clear differences between the postprandial and preprandial glucose monitoring groups for:
-
pre‐eclampsia (RR 1.00, 95% CI 0.15 to 6.68; 66 participants, 1 RCT; Analysis 5.1); or
-
caesarean section (RR 0.62, 95% CI 0.29 to 1.29; 66 participants, 1 RCT; Analysis 5.2).
De Veciana 1995 did not report on the development of type 2 diabetes.
For the child
There was an approximate 71% relative reduction in large‐for‐gestational‐age infants born to mothers in the postprandial compared with the preprandial glucose monitoring group (RR 0.29, 95% CI 0.11 to 0.78; 66 participants, 1 RCT; Analysis 5.3).
De Veciana 1995 did not report on: perinatal mortality, death or serious morbidity composite, or neurosensory disability.
Secondary outcomes
For the mother
We observed no clear differences between the postprandial and preprandial glucose monitoring groups for:
-
perineal trauma (RR 0.38, 95% CI 0.11 to 1.29; 66 participants, 1 RCT; Analysis 5.4);
-
gestational weight gain (MD ‐0.20 kg, 95% CI ‐2.81 to 2.41; 66 participants, 1 RCT; Analysis 5.5);
-
glycaemic control:
-
hospitalisation for glycaemic control (RR 1.33, 95% CI 0.32 to 5.50; 66 participants, 1 RCT; Analysis 5.9); or
-
success in glycaemic control (MD 2.00%, 95% CI ‐0.26 to 4.26; 66 participants, 1 RCT; Analysis 5.10).
-
There was reduced compliance with the schedule (as a percentage) (adherence to the intervention) among women in the postprandial compared with the preprandial glucose monitoring group (MD ‐3.00%, 95% CI ‐3.99 to ‐2.01; 66 participants, 1 RCT; Analysis 5.6).
For use of additional pharmacotherapy, women in the postprandial glucose monitoring group used, on average, a 23.60 units/day higher insulin dose (MD 23.60 units/day, 95% CI 11.17 to 36.03; 66 participants, 1 RCT) and a 0.20 units/kg higher insulin dose during the last four weeks of pregnancy (MD 0.20 units/kg, 95% CI 0.12 to 0.28; 66 participants, 1 RCT; Analysis 5.7).
Women in the postprandial group also had, on average, a 2.4% greater glycaemic control with a reduction in HbA1c compared with women in the preprandial glucose monitoring group (MD ‐2.40%, 95% CI ‐3.33 to ‐1.47; 66 participants, 1 RCT; Analysis 5.8).
De Veciana 1995 did not report on the other secondary outcomes for the mother (induction of labour, placental abruption, postpartum haemorrhage, postpartum infection, behavioural changes associated with the intervention, sense of well‐being and quality of life, views of the intervention, breastfeeding (e.g. at discharge, six weeks postpartum), maternal hypoglycaemia, mortality).
For the mother in the longer term
De Veciana 1995 did not report on any secondary outcomes for the mother in the longer term.
For the fetus/neonate
We observed no clear differences between the postprandial and preprandial glucose monitoring groups for:
-
stillbirth (RR 0.33, 95% CI 0.01 to 7.90; 66 participants, 1 RCT; Analysis 5.11);
-
gestational age at birth (MD 0.30 weeks, 95% CI ‐1.08 to 1.68; 66 participants, 1 RCT; Analysis 5.12);
-
Apgar score < 7 at five minutes (RR 0.33, 95% CI 0.04 to 3.04; 66 participants, 1 RCT; Analysis 5.13);
-
small‐for‐gestational age (RR 3.00, 95% CI 0.13 to 71.07; 66 participants, 1 RCT; Analysis 5.15);
-
shoulder dystocia (RR 0.17, 95% CI 0.02 to 1.31; 66 participants, 1 RCT; Analysis 5.17);
-
nerve palsies (RR 0.50, 95% CI 0.05 to 5.25; 66 participants, 1 RCT; Analysis 5.18);
-
bone fractures (RR 1.00, 95% CI 0.07 to 15.33; 66 participants, 1 RCT; Analysis 5.19);
-
hypoglycaemia (RR 0.14, 95% CI 0.02 to 1.10; 66 participants, 1 RCT; Analysis 5.20); or
-
hyperbilirubinaemia or jaundice (RR 0.75, 95% CI 0.18 to 3.09; 66 participants, 1 RCT; Analysis 5.21).
There was an approximate 75% relative reduction in the risk of macrosomia for infants born to mothers in the postprandial compared with the preprandial glucose monitoring group (RR 0.25, 95% CI 0.08 to 0.81; 66 participants, 1 RCT; Analysis 5.14), and babies born to mothers in the postprandial monitoring group had, on average, 379 g lower birthweights than those born to mothers in the preprandial glucose monitoring group (MD ‐379.00 g, 95% CI ‐650.79 to ‐107.21; 66 participants, 1 RCT; Analysis 5.16).
De Veciana 1995 did not report on the other secondary outcomes for the fetus/neonate (neonatal death, preterm birth, head circumference, length, ponderal index, adiposity, respiratory distress syndrome, hypocalcaemia, polycythaemia).
For the child and adult
De Veciana 1995 did not report on any secondary outcomes for the child and adult.
Use and costs of health services
De Veciana 1995 did not report on any secondary outcomes for the use and costs of health services.
Discussion
Summary of main results
We included 11 trials in the review (Dalfra 2009; De Veciana 1995; Given 2015; Homko 2002; Homko 2007; Homko 2012; Kestila 2007; Kruger 2003; Perez‐Ferre 2010; Rey 1997; Wei 2016); these randomised a total of 1272 pregnant women with GDM. We assessed the 11 trials under five comparisons.
Telemedicine versus standard care for glucose monitoring
Five trials investigated this comparison (Dalfra 2009; Given 2015; Homko 2007; Homko 2012; Perez‐Ferre 2010). For the primary outcomes of pre‐eclampsia or pregnancy‐induced hypertension, caesarean section, perinatal mortality (no events), large‐for‐gestational age, or a morbidity composite outcome there were no clear differences between the telemedicine and standard care groups (all very low quality evidence). Similarly, for the other important secondary outcomes of induction of labour or neonatal hypoglycaemia ‐ that we assessed using the GRADE approach ‐ we saw no clear differences between the telemedicine and standard care groups (both very low quality evidence). Very few other differences were observed between groups for secondary outcomes, except for an improved sense of well‐being and quality of life (one trial), increased insulin use (across five trials), lower HbA1c levels (across three trials), and fewer unscheduled face‐to‐face visits among women in the telemedicine group, compared with the standard care group (one trial).
Self‐monitoring versus periodic glucose monitoring
Two trials investigated this comparison (Homko 2002; Rey 1997). For the primary outcomes of pre‐eclampsia, caesarean section, perinatal mortality or large‐for‐gestational age, we observed no clear differences between the self‐monitoring and periodic glucose monitoring groups (all low or very low quality evidence). No clear difference was observed for another important secondary outcome, neonatal hypoglycaemia, assessed using the GRADE approach (low quality evidence). No other differences between groups were observed for secondary outcomes, except for a smaller weekly weight gain for women (one trial) in the self‐monitoring group compared with those in the periodic glucose monitoring group.
Continuous glucose monitoring system (CGMS) versus self‐monitoring of glucose
Two trials investigated this comparison (Kestila 2007; Wei 2016). For the primary outcomes of caesarean section, perinatal mortality (no events), or large‐for‐gestational age (all very low quality evidence) we observed no clear differences between the CGMS and self‐monitoring groups. We observed no clear difference for the important secondary outcome of neonatal hypoglycaemia (very low quality evidence), which we assessed using the GRADE approach. Very few other differences were observed between groups for secondary outcomes, except for less gestational weight gain (two trials), and increased use of additional pharmacotherapy (two trials) among women in the CGMS group compared with those in the self‐monitoring group.
Modem versus telephone transmission for glucose monitoring
One trial investigated this comparison (Kruger 2003). It reported none of our primary outcomes and we observed no clear difference between groups for the secondary outcomes reported.
Postprandial versus preprandial glucose monitoring
One trial investigated this comparison (De Veciana 1995). For the primary outcomes of pre‐eclampsia or caesarean section, we observed no clear differences between the post‐prandial and preprandial glucose monitoring groups, although a reduction in large‐for‐gestational‐age infants was observed for infants born to mothers in the post‐prandial monitoring group. Few other differences were observed between groups for the secondary outcomes, except for reduced compliance with the schedule, higher insulin dose across the last four weeks of pregnancy, greater change (reduction) in HbA1c levels, a reduced risk of macrosomia, and lower birthweights for mothers/infants in the post‐prandial glucose monitoring group.
Overall completeness and applicability of evidence
All of the 11 included trials, except Wei 2016, from China, were conducted in high‐income countries, with five from the USA, and one each from Canada, Finland, Ireland, Italy and Spain, which probably limits the generalisability of the findings. The trials used specific screening tests, diagnostic criteria, and subsequent management strategies for GDM, which may also limit applicability of their results for countries/settings that use different approaches, and with different practicality and feasibility considerations.
With regard to the important outcomes we selected for quality assessment using the GRADE approach: only five trials reported on hypertensive disorders of pregnancy, nine on caesarean section, one on induction of labour, six on perinatal mortality, six on large‐for‐gestational age, one on death or serious morbidity composite, and seven on neonatal hypoglycaemia. There were no data for the following outcomes for the mother: perineal trauma, type 2 diabetes, postnatal depression, and postnatal weight retention, or return to pre‐pregnancy weight, and no data for the child for: childhood/adulthood neurosensory disability, adiposity, or type 2 diabetes.
With regard to our secondary outcomes, none of the 11 trials reported on any longer‐term outcomes for the mother, or the infant, in childhood or adulthood.
Quality of the evidence
The risk of bias of the 11 included trials was mixed. Generally, the lack of methodological detail provided in the trial reports did not allow us to assess risk of bias across the trials, and led to many unclear 'Risk of bias' ratings across the various domains. We judged only one trial to be at a low risk of selection bias, and two at a high risk of selection bias. It was not possible to blind women or trial personnel (due to the nature of the interventions) in any of the trials; thus we considered all trials to be at a high risk of performance bias. It was not clear in the trials whether there were attempts to blind outcome assessors; therefore, we judged 10 trials to be at an unclear risk of detection bias. Due to lack of access to trial registrations and protocols, or limited reporting of important review outcomes, or both, we judged none of the trials to be at a low risk of reporting bias. Overall the risk of bias was moderate to high.
For outcomes assessed across the three main comparisons (telemedicine versus standard care; self‐monitoring versus periodic monitoring; CGMS versus self‐monitoring) using the GRADE approach, we determined the evidence to be low quality or very low quality. Evidence was predominately downgraded due to design limitations (risk of bias), and imprecision and inconsistencies (uncertain effect estimates, and at times, small sample sizes and low event rates).
Potential biases in the review process
We took steps to minimise bias in the review process. Data extraction was carried out by two researchers, independently, and all data were checked. The GRADE approach assessments were made by two people, independently, and discrepancies resolved by discussion.
Agreements and disagreements with other studies or reviews
This current review found no clear differences between the various methods or settings for glucose monitoring for women with GDM for our primary review outcomes, or the majority of our secondary review outcomes.
The Moy 2014 Cochrane Review also assessed different techniques of blood glucose monitoring during pregnancy, but specifically for women with pre‐existing diabetes (type 1 or 2 diabetes). Moy 2014 was able to include nine trials, with 506 women (the majority with type 1 diabetes), and included six comparisons, many of which were similar to those assessed in our review, namely:
-
self‐monitoring versus standard care;
-
self‐monitoring versus hospitalisation;
-
preprandial versus post‐prandial monitoring;
-
automated telemedicine monitoring versus conventional system;
-
CGMS versus intermittent monitoring;
-
constant CGMS versus intermittent CGMS.
The review found no clear differences between monitoring techniques for the primary or secondary outcomes assessed, and thus concluded that there was no clear evidence that any glucose monitoring technique was superior to any other technique, and that additional evidence from large well‐designed randomised trials was required to inform choices (Moy 2014).
We identified two further systematic reviews that specifically assessed the effects of telemedicine interventions for women with GDM (Rasekaba 2015b), or with diabetes in pregnancy (including GDM and pre‐existing type 1 or 2 diabetes) (Ming 2016). Rasekaba 2015b included three trials from our telemedicine versus standard care comparison (Homko 2007; Homko 2012; Perez‐Ferre 2010), but did not include Dalfra 2009 (as it was quasi‐randomised), or Given 2015 (as the search for the review was conducted in 2013). Ming 2016 included the same five trials that were included in our telemedicine versus standard care comparison, along with two additional trials in women with type 1 diabetes. In agreement with our review, Rasekaba 2015b showed no clear differences between groups for outcomes assessed, except for (as was observed in our review) positive findings of improved quality of life (measured with the Diabetes Empowerment Scale) (from Homko 2007), and reduced unscheduled face‐to‐face visits (from Perez‐Ferre 2010) with telemedicine. Rasekaba 2015b concluded that currently "Studies are limited and more trials that include cost evaluation are required". Ming 2016 also showed no clear differences between groups for clinical outcomes assessed for the mother and infant, though, in agreement with our review, did demonstrate an improvement in glycaemic control (as measured by HbA1c) with telemedicine. Ming 2016 thus concluded "There is currently insufficient evidence that telemedicine technology is superior to standard care for women with diabetes in pregnancy; however, there was no evidence of harm", which is in keeping with our review's findings.
Risk of bias graph: review authors' judgements about each risk of bias item presented as percentages across all included studies
Risk of bias summary: review authors' judgements about each risk of bias item for each included study

Comparison 1 Telemedicine versus standard care for glucose monitoring, Outcome 1 Hypertensive disorders of pregnancy.

Comparison 1 Telemedicine versus standard care for glucose monitoring, Outcome 2 Caesarean section.

Comparison 1 Telemedicine versus standard care for glucose monitoring, Outcome 3 Perinatal mortality.

Comparison 1 Telemedicine versus standard care for glucose monitoring, Outcome 4 Large‐for‐gestational age.

Comparison 1 Telemedicine versus standard care for glucose monitoring, Outcome 5 Death or serious morbidity composite.

Comparison 1 Telemedicine versus standard care for glucose monitoring, Outcome 6 Operative vaginal birth (not a prespecified outcome).

Comparison 1 Telemedicine versus standard care for glucose monitoring, Outcome 7 Induction of labour.
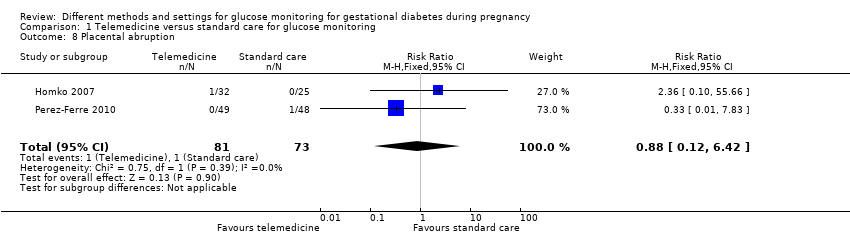
Comparison 1 Telemedicine versus standard care for glucose monitoring, Outcome 8 Placental abruption.

Comparison 1 Telemedicine versus standard care for glucose monitoring, Outcome 9 Gestational weight gain (kg).

Comparison 1 Telemedicine versus standard care for glucose monitoring, Outcome 10 Weight at 36 weeks (kg).

Comparison 1 Telemedicine versus standard care for glucose monitoring, Outcome 11 Adherence to the intervention.

Comparison 1 Telemedicine versus standard care for glucose monitoring, Outcome 12 Sense of well‐being and quality of life: DES: Diabetes Empowerment Scale.
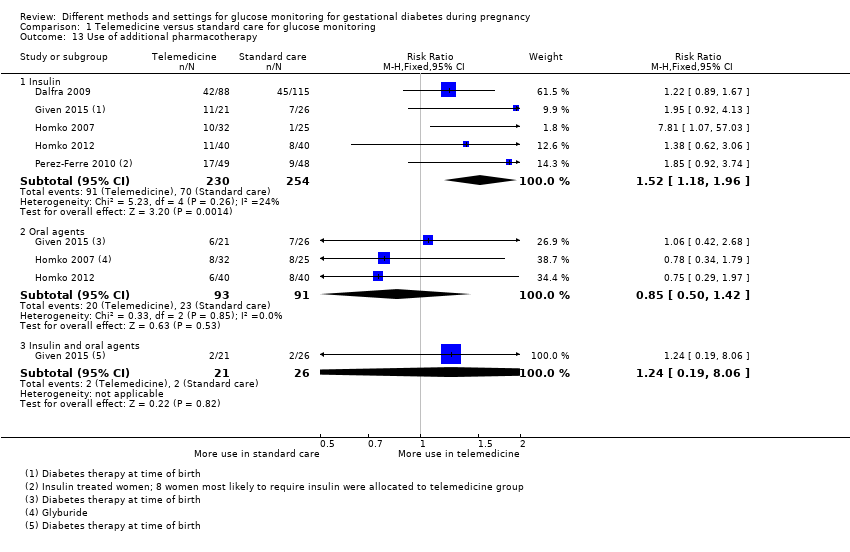
Comparison 1 Telemedicine versus standard care for glucose monitoring, Outcome 13 Use of additional pharmacotherapy.
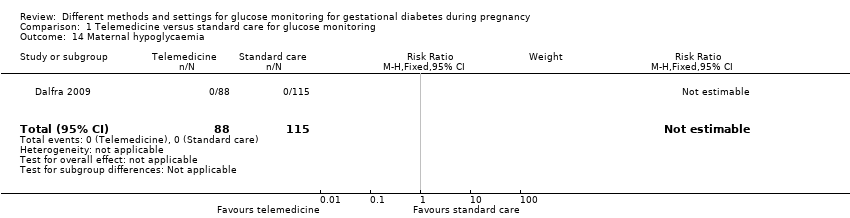
Comparison 1 Telemedicine versus standard care for glucose monitoring, Outcome 14 Maternal hypoglycaemia.

Comparison 1 Telemedicine versus standard care for glucose monitoring, Outcome 15 Maternal hypoglycaemia: self‐monitored blood glucose episodes hypoglycaemic (< 3.9 mmol/L) (%).
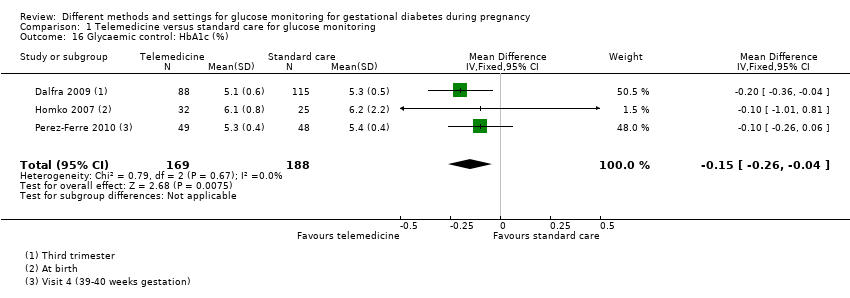
Comparison 1 Telemedicine versus standard care for glucose monitoring, Outcome 16 Glycaemic control: HbA1c (%).

Comparison 1 Telemedicine versus standard care for glucose monitoring, Outcome 17 Glycaemic control: HbA1c < 5.8%.

Comparison 1 Telemedicine versus standard care for glucose monitoring, Outcome 18 Glycaemic control: HbA1c at 36 weeks (mmol/mol).

Comparison 1 Telemedicine versus standard care for glucose monitoring, Outcome 19 Glycaemic control: self‐monitored blood glucose (mmol/L).

Comparison 1 Telemedicine versus standard care for glucose monitoring, Outcome 20 Glycaemic control: fasting and 2‐hour post‐prandial blood glucose (mg/dL).

Comparison 1 Telemedicine versus standard care for glucose monitoring, Outcome 21 Stillbirth.
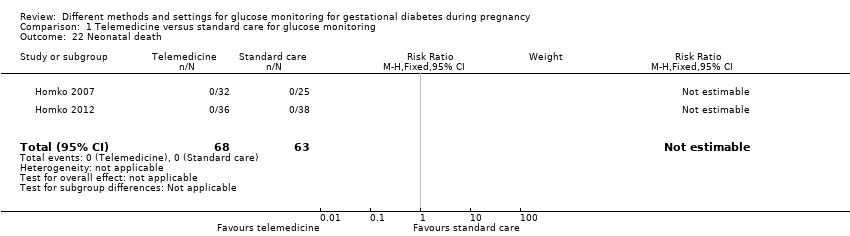
Comparison 1 Telemedicine versus standard care for glucose monitoring, Outcome 22 Neonatal death.

Comparison 1 Telemedicine versus standard care for glucose monitoring, Outcome 23 Gestational age at birth (weeks).
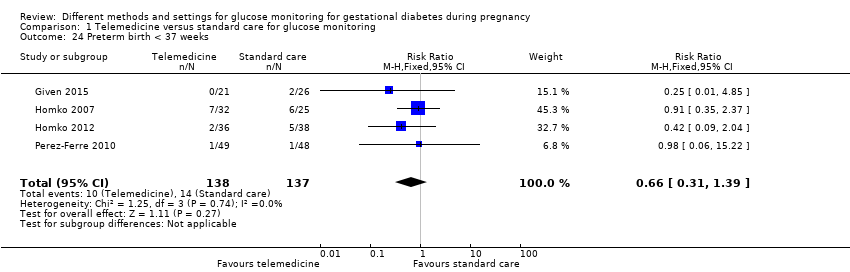
Comparison 1 Telemedicine versus standard care for glucose monitoring, Outcome 24 Preterm birth < 37 weeks.

Comparison 1 Telemedicine versus standard care for glucose monitoring, Outcome 25 Macrosomia.

Comparison 1 Telemedicine versus standard care for glucose monitoring, Outcome 26 Small‐for‐gestational age.
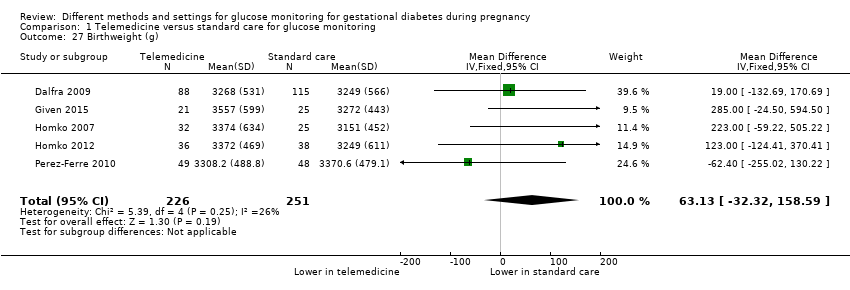
Comparison 1 Telemedicine versus standard care for glucose monitoring, Outcome 27 Birthweight (g).

Comparison 1 Telemedicine versus standard care for glucose monitoring, Outcome 28 Head circumference (cm).
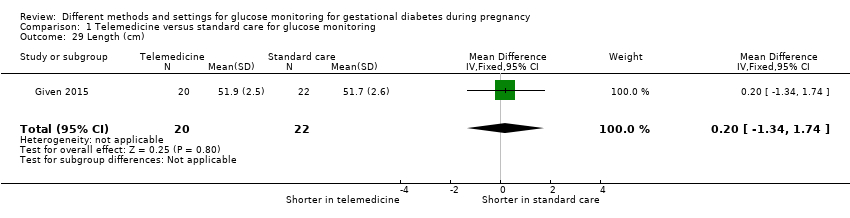
Comparison 1 Telemedicine versus standard care for glucose monitoring, Outcome 29 Length (cm).

Comparison 1 Telemedicine versus standard care for glucose monitoring, Outcome 30 Shoulder dystocia.

Comparison 1 Telemedicine versus standard care for glucose monitoring, Outcome 31 Respiratory distress syndrome.

Comparison 1 Telemedicine versus standard care for glucose monitoring, Outcome 32 Neonatal hypoglycaemia.
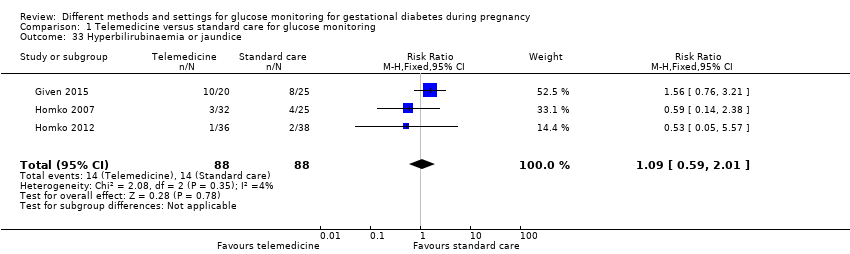
Comparison 1 Telemedicine versus standard care for glucose monitoring, Outcome 33 Hyperbilirubinaemia or jaundice.
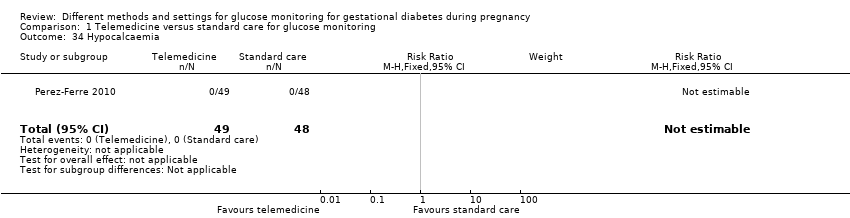
Comparison 1 Telemedicine versus standard care for glucose monitoring, Outcome 34 Hypocalcaemia.

Comparison 1 Telemedicine versus standard care for glucose monitoring, Outcome 35 Polycythaemia.

Comparison 1 Telemedicine versus standard care for glucose monitoring, Outcome 36 Number of hospital or health professional visits: face‐to‐face visits.

Comparison 1 Telemedicine versus standard care for glucose monitoring, Outcome 37 Number of hospital or health professional visits: unscheduled face‐to‐face visits.

Comparison 1 Telemedicine versus standard care for glucose monitoring, Outcome 38 Neonatal intensive care unit admission.

Comparison 1 Telemedicine versus standard care for glucose monitoring, Outcome 39 'Neonatal morbidity' (neonatal complications: e.g. hypoglycaemia, hyperbilirubinaemia, respiratory distress syndrome, shoulder dystocia, malformations) (not a prespecified outcome).
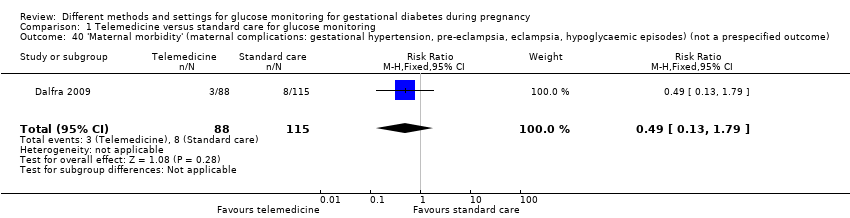
Comparison 1 Telemedicine versus standard care for glucose monitoring, Outcome 40 'Maternal morbidity' (maternal complications: gestational hypertension, pre‐eclampsia, eclampsia, hypoglycaemic episodes) (not a prespecified outcome).

Comparison 2 Self‐monitoring versus periodic glucose monitoring, Outcome 1 Hypertensive disorders of pregnancy: pre‐eclampsia.

Comparison 2 Self‐monitoring versus periodic glucose monitoring, Outcome 2 Caesarean section.

Comparison 2 Self‐monitoring versus periodic glucose monitoring, Outcome 3 Perinatal mortality.

Comparison 2 Self‐monitoring versus periodic glucose monitoring, Outcome 4 Large‐for‐gestational age.

Comparison 2 Self‐monitoring versus periodic glucose monitoring, Outcome 5 Placental abruption.
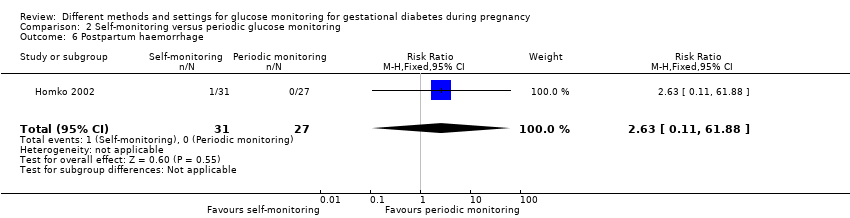
Comparison 2 Self‐monitoring versus periodic glucose monitoring, Outcome 6 Postpartum haemorrhage.

Comparison 2 Self‐monitoring versus periodic glucose monitoring, Outcome 7 Gestational weight gain (kg/week).
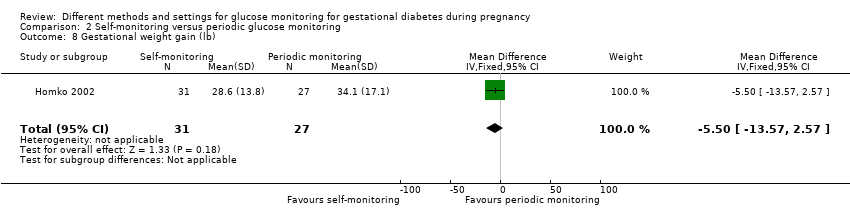
Comparison 2 Self‐monitoring versus periodic glucose monitoring, Outcome 8 Gestational weight gain (lb).
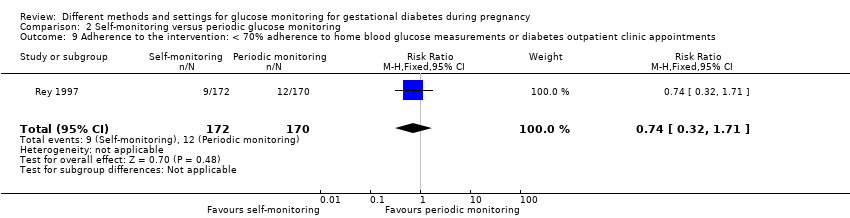
Comparison 2 Self‐monitoring versus periodic glucose monitoring, Outcome 9 Adherence to the intervention: < 70% adherence to home blood glucose measurements or diabetes outpatient clinic appointments.

Comparison 2 Self‐monitoring versus periodic glucose monitoring, Outcome 10 Adherence to the intervention: Dietary Compliance Questionnaire.

Comparison 2 Self‐monitoring versus periodic glucose monitoring, Outcome 11 Sense of well‐being and quality of life: Diabetes Empowerment Scale delta scores.

Comparison 2 Self‐monitoring versus periodic glucose monitoring, Outcome 12 Sense of well‐being and quality of life: emotional adjustment: Appraisal of Diabetes Scale delta scores.

Comparison 2 Self‐monitoring versus periodic glucose monitoring, Outcome 13 Use of additional pharmacotherapy: insulin.

Comparison 2 Self‐monitoring versus periodic glucose monitoring, Outcome 14 Glycaemic control: pre‐prandial blood glucose (mmol/L).

Comparison 2 Self‐monitoring versus periodic glucose monitoring, Outcome 15 Glycaemic control: 1‐hour post‐prandial blood glucose (mmol/L).

Comparison 2 Self‐monitoring versus periodic glucose monitoring, Outcome 16 Stillbirth.

Comparison 2 Self‐monitoring versus periodic glucose monitoring, Outcome 17 Neonatal death.

Comparison 2 Self‐monitoring versus periodic glucose monitoring, Outcome 18 Gestational age at birth (weeks).

Comparison 2 Self‐monitoring versus periodic glucose monitoring, Outcome 19 Macrosomia.

Comparison 2 Self‐monitoring versus periodic glucose monitoring, Outcome 20 Small‐for‐gestational age.

Comparison 2 Self‐monitoring versus periodic glucose monitoring, Outcome 21 Birthweight (kg).

Comparison 2 Self‐monitoring versus periodic glucose monitoring, Outcome 22 Birthweight (percentile).

Comparison 2 Self‐monitoring versus periodic glucose monitoring, Outcome 23 Shoulder dystocia.

Comparison 2 Self‐monitoring versus periodic glucose monitoring, Outcome 24 Neonatal hypoglycaemia.

Comparison 2 Self‐monitoring versus periodic glucose monitoring, Outcome 25 Hyperbilirubinaemia or jaundice.

Comparison 2 Self‐monitoring versus periodic glucose monitoring, Outcome 26 Number of antenatal visits or admissions: prenatal visits with the diabetes team.

Comparison 2 Self‐monitoring versus periodic glucose monitoring, Outcome 27 Neonatal intensive care unit admission.
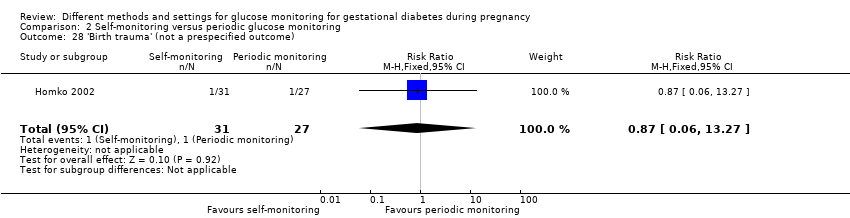
Comparison 2 Self‐monitoring versus periodic glucose monitoring, Outcome 28 'Birth trauma' (not a prespecified outcome).

Comparison 2 Self‐monitoring versus periodic glucose monitoring, Outcome 29 'Respiratory complications' (not a prespecified outcome).

Comparison 3 Continuous glucose monitoring system versus self‐monitoring of glucose, Outcome 1 Caesarean section.

Comparison 3 Continuous glucose monitoring system versus self‐monitoring of glucose, Outcome 2 Perinatal mortality.

Comparison 3 Continuous glucose monitoring system versus self‐monitoring of glucose, Outcome 3 Large‐for‐gestational age.
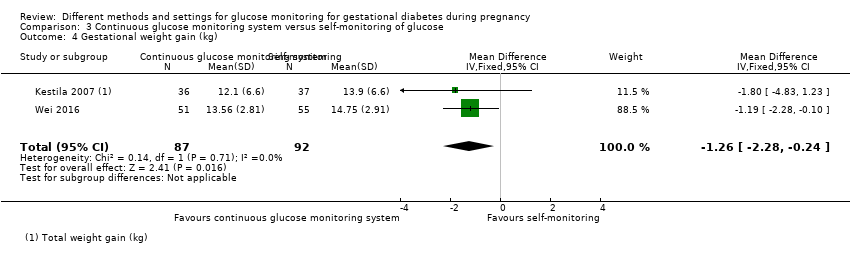
Comparison 3 Continuous glucose monitoring system versus self‐monitoring of glucose, Outcome 4 Gestational weight gain (kg).

Comparison 3 Continuous glucose monitoring system versus self‐monitoring of glucose, Outcome 5 Use of additional pharmacotherapy.

Comparison 3 Continuous glucose monitoring system versus self‐monitoring of glucose, Outcome 6 Glycaemic control: HbA1c at 32 to 36 weeks (%).

Comparison 3 Continuous glucose monitoring system versus self‐monitoring of glucose, Outcome 7 Stillbirth.

Comparison 3 Continuous glucose monitoring system versus self‐monitoring of glucose, Outcome 8 Neonatal death.

Comparison 3 Continuous glucose monitoring system versus self‐monitoring of glucose, Outcome 9 Gestational age at birth (weeks).

Comparison 3 Continuous glucose monitoring system versus self‐monitoring of glucose, Outcome 10 Preterm birth < 37 weeks.

Comparison 3 Continuous glucose monitoring system versus self‐monitoring of glucose, Outcome 11 Macrosomia.

Comparison 3 Continuous glucose monitoring system versus self‐monitoring of glucose, Outcome 12 Small‐for‐gestational age.
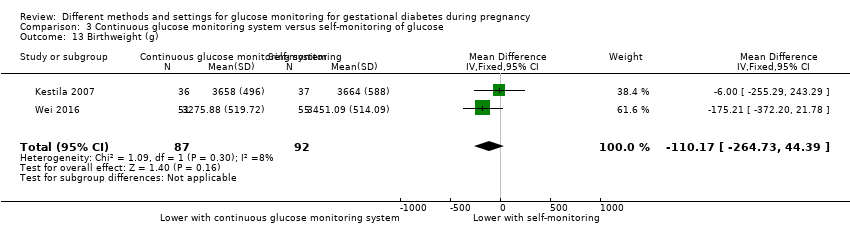
Comparison 3 Continuous glucose monitoring system versus self‐monitoring of glucose, Outcome 13 Birthweight (g).

Comparison 3 Continuous glucose monitoring system versus self‐monitoring of glucose, Outcome 14 Neonatal hypoglycaemia.

Comparison 3 Continuous glucose monitoring system versus self‐monitoring of glucose, Outcome 15 Hyperbilirubinaemia or jaundice.

Comparison 3 Continuous glucose monitoring system versus self‐monitoring of glucose, Outcome 16 Neonatal intensive care unit admission.

Comparison 3 Continuous glucose monitoring system versus self‐monitoring of glucose, Outcome 17 Length of postnatal stay (baby): length of stay in neonatal intensive care unit (days).

Comparison 4 Modem versus telephone transmission for glucose monitoring, Outcome 1 Views of the intervention.

Comparison 5 Postprandial versus preprandial glucose monitoring, Outcome 1 Hypertensive disorders of pregnancy: pre‐eclampsia.

Comparison 5 Postprandial versus preprandial glucose monitoring, Outcome 2 Caesarean section.

Comparison 5 Postprandial versus preprandial glucose monitoring, Outcome 3 Large‐for‐gestational age.

Comparison 5 Postprandial versus preprandial glucose monitoring, Outcome 4 Perineal trauma.
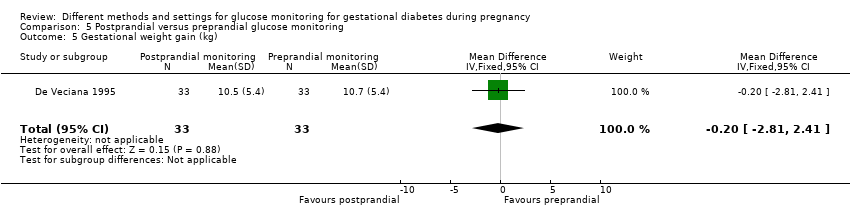
Comparison 5 Postprandial versus preprandial glucose monitoring, Outcome 5 Gestational weight gain (kg).

Comparison 5 Postprandial versus preprandial glucose monitoring, Outcome 6 Adherence to the intervention: compliance with schedule (%).
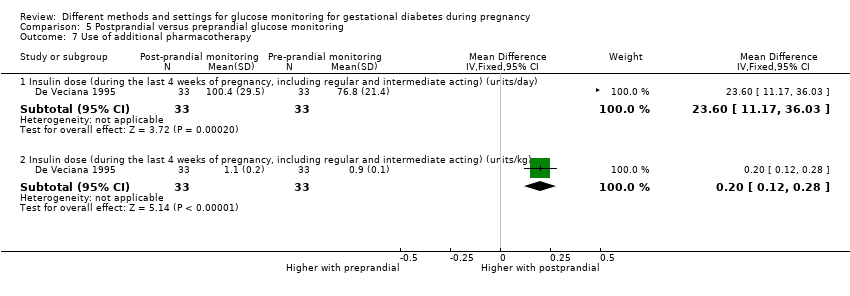
Comparison 5 Postprandial versus preprandial glucose monitoring, Outcome 7 Use of additional pharmacotherapy.

Comparison 5 Postprandial versus preprandial glucose monitoring, Outcome 8 Glycaemic control: change in HbA1c (%).

Comparison 5 Postprandial versus preprandial glucose monitoring, Outcome 9 Glycaemic control: hospitalisation for glycaemic control.

Comparison 5 Postprandial versus preprandial glucose monitoring, Outcome 10 Glycaemic control: success in glycaemic control (%).

Comparison 5 Postprandial versus preprandial glucose monitoring, Outcome 11 Stillbirth.
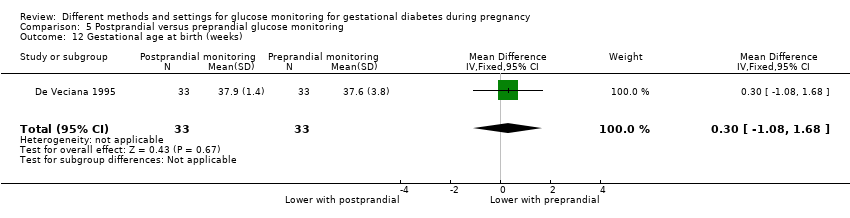
Comparison 5 Postprandial versus preprandial glucose monitoring, Outcome 12 Gestational age at birth (weeks).

Comparison 5 Postprandial versus preprandial glucose monitoring, Outcome 13 Apgar score < 7 at 5 minutes.

Comparison 5 Postprandial versus preprandial glucose monitoring, Outcome 14 Macrosomia.

Comparison 5 Postprandial versus preprandial glucose monitoring, Outcome 15 Small‐for‐gestational age.
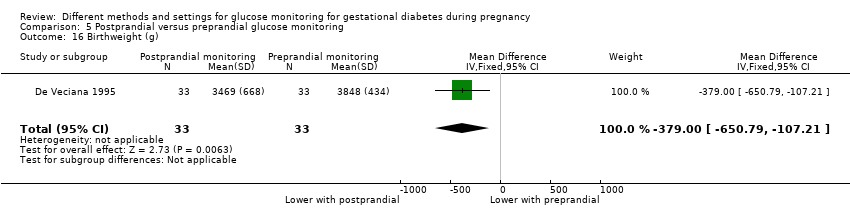
Comparison 5 Postprandial versus preprandial glucose monitoring, Outcome 16 Birthweight (g).

Comparison 5 Postprandial versus preprandial glucose monitoring, Outcome 17 Shoulder dystocia.

Comparison 5 Postprandial versus preprandial glucose monitoring, Outcome 18 Nerve palsies.
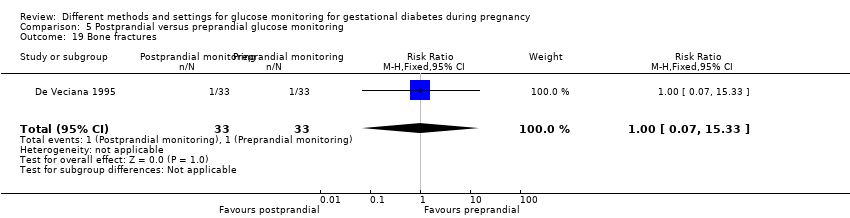
Comparison 5 Postprandial versus preprandial glucose monitoring, Outcome 19 Bone fractures.
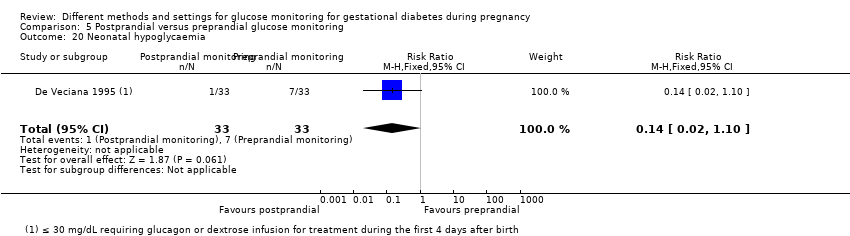
Comparison 5 Postprandial versus preprandial glucose monitoring, Outcome 20 Neonatal hypoglycaemia.

Comparison 5 Postprandial versus preprandial glucose monitoring, Outcome 21 Hyperbilirubinaemia or jaundice.
| Telemedicine versus standard care for glucose monitoring for gestational diabetes during pregnancy (effect on mother) | ||||||
| Patient or population: women with gestational diabetes mellitus | ||||||
| Outcomes | Anticipated absolute effects* (95% CI) | Relative effect | № of participants | Quality of the evidence | Comments | |
| Risk with standard care | Risk with telemedicine | |||||
| Hypertensive disorders of pregnancy including pre‐eclampsia, gestational hypertension and eclampsia | Study population | RR 1.49 | 275 | ⊕⊝⊝⊝ | ||
| 58 per 1000 | 87 per 1000 | |||||
| Caesarean section | Study population | RR 1.05 | 478 | ⊕⊝⊝⊝ | ||
| 444 per 1000 | 467 per 1000 | |||||
| Development of type 2 diabetes | Study population | not estimable | (0 RCTs) | ‐ | None of the included RCTs reported this outcome | |
| 0 per 1000 | 0 per 1000 | |||||
| Induction of labour | Study population | RR 1.06 | 47 | ⊕⊝⊝⊝ | ||
| 538 per 1000 | 571 per 1000 | |||||
| Perineal trauma | Study population | Not estimable | (0 RCTs) | ‐ | None of the included RCTs reported this outcome | |
| 0 per 1000 | 0 per 1000 | |||||
| Postnatal depression | Study population | Not estimable | (0 RCTs) | ‐ | None of the included RCTs reported this outcome | |
| 0 per 1000 | 0 per 1000 | |||||
| Postnatal weight retention or return to pre‐pregnancy weight | Study population | Not estimable | (0 RCTs) | ‐ | None of the included RCTs reported this outcome | |
| 0 per 1000 | 0 per 1000 | |||||
| *The risk in the intervention group (and its 95% confidence interval) is based on the assumed risk in the comparison group and the relative effect of the intervention (and its 95% CI). | ||||||
| GRADE Working Group grades of evidence | ||||||
| 1Study limitations (downgraded 1 level): 4 RCTs with potentially serious or very serious design limitations | ||||||
| Telemedicine versus standard care for glucose monitoring in gestational diabetes during pregnancy (effect on child) | ||||||
| Patient or population: women with gestational diabetes mellitus | ||||||
| Outcomes | Anticipated absolute effects* (95% CI) | Relative effect | № of participants | Quality of the evidence | Comments | |
| Risk with standard care | Risk with telemedicine | |||||
| Perinatal mortality (including stillbirth or neonatal death) | Study population | ‐ | 131 | ⊕⊝⊝⊝ | There were no perinatal deaths in 2 RCTs | |
| See comment | See comment | |||||
| Large‐for‐gestational age | Study population | RR 1.41 | 228 | ⊕⊝⊝⊝ | ||
| 126 per 1000 | 178 per 1000 | |||||
| Death or serious morbidity composite | Study population | RR 1.06 | 57 | ⊕⊝⊝⊝ | ||
| 560 per 1000 | 594 per 1000 | |||||
| Neurosensory disability | Study population | Not estimable | (0 RCTS) | ‐ | None of the included RCTs reported this outcome | |
| 0 per 100 | 0 per 1000 (0 to 0) | |||||
| Hypoglycaemia | Study population | RR 1.14 | 198 | ⊕⊝⊝⊝ | ||
| 82 per 100 | 94 per 1000 | |||||
| Adiposity (e.g. BMI, skinfold thickness, fat mass) | Study population | Not estimable | (0 RCTs) | ‐ | None of the included RCTs reported this outcome | |
| 0 per 1000 | 0 per 1000 | |||||
| Type 2 diabetes | Study population | Not estimable | (0 RCTs) | ‐ | None of the included RCTs reported this outcome | |
| 0 per 1000 | 0 per 1000 | |||||
| *The risk in the intervention group (and its 95% confidence interval) is based on the assumed risk in the comparison group and the relative effect of the intervention (and its 95% CI). | ||||||
| GRADE Working Group grades of evidence | ||||||
| 1Study limitations (downgraded 1 level): 2 RCTs with potentially serious design limitations | ||||||
| Self‐monitoring versus periodic glucose monitoring for gestational diabetes during pregnancy (effect on mother) | ||||||
| Patient or population: women with gestational diabetes mellitus Intervention: self‐monitoring of glucose | ||||||
| Outcomes | Anticipated absolute effects* (95% CI) | Relative effect | № of participants | Quality of the evidence | Comments | |
| Risk with periodic glucose monitoring | Risk with self‐monitoring of glucose | |||||
| Hypertensive disorders of pregnancy: pre‐eclampsia | Study population | RR 0.17 | 58 | ⊕⊝⊝⊝ | ||
| 74 per 1000 | 13 per 1000 | |||||
| Caesarean section | Study population | RR 1.18 | 400 | ⊕⊕⊝⊝ | ||
| 228 per 1000 | 270 per 1000 | |||||
| Development of type 2 diabetes | Study population | Not estimable | (0 RCTs) | ‐ | Neither of the included RCTs reported this outcome | |
| 0 per 1000 | 0 per 1000 | |||||
| Induction of labour | Study population | Not estimable | (0 RCTs) | ‐ | Neither of the RCTs reported this outcome | |
| 0 per 1000 | 0 per 1000 | |||||
| Perineal trauma | Study population | Not estimable | (0 RCTs) | ‐ | Neither of the included RCTs reported this outcome | |
| 0 per 1000 | 0 per 1000 | |||||
| Postnatal depression | Study population | Not estimable | (0 RCTs) | ‐ | Neither of the included RCTs reported this outcome | |
| 0 per 1000 | 0 per 1000 | |||||
| Postnatal weight retention or return to pre‐pregnancy weight | Study population | Not estimable | (0 RCTs) | ‐ | Neither of the included RCTs reported this outcome | |
| 0 per 1000 | 0 per 1000 | |||||
| *The risk in the intervention group (and its 95% confidence interval) is based on the assumed risk in the comparison group and the relative effect of the intervention (and its 95% CI). | ||||||
| GRADE Working Group grades of evidence | ||||||
| 1Study limitations (downgraded 1 level): 1 RCT with potentially serious design limitations | ||||||
| Self‐monitoring versus periodic for glucose monitoring for gestation diabetes during pregnancy (effect on child) | ||||||
| Patient or population: women with gestational diabetes mellitus Intervention: self‐monitoring of glucose | ||||||
| Outcomes | Anticipated absolute effects* (95% CI) | Relative effect | № of participants | Quality of the evidence | Comments | |
| Risk with periodic glucose monitoring | Risk with self‐monitoring of glucose | |||||
| Perinatal mortality (stillbirth or neonatal death) | Study population | RR 1.54 | 400 | ⊕⊝⊝⊝ | ||
| 5 per 1000 | 8 per 1000 | |||||
| Large‐for‐gestational age | Study population | RR 0.82 | 400 | ⊕⊕⊝⊝ | ||
| 142 per 1000 | 117 per 1000 | |||||
| Death or serious morbidity composite | Study population | Not estimable | (0 RCTs) | ‐ | Neither of the included RCTs reported this outcome | |
| 0 per 1000 | 0 per 1000 | |||||
| Neurosensory disability | Study population | Not estimable | (0 RCTs) | ‐ | Neither of the included RCTs reported this outcome | |
| 0 per 1000 | 0 per 1000 | |||||
| Hypoglycaemia | Study population | RR 0.64 | 391 | ⊕⊕⊝⊝ | ||
| 173 per 1000 | 111 per 1000 | |||||
| Adiposity (e.g. BMI, skinfold thickness, fat mass) | Study population | Not estimable | (0 RCTs) | ‐ | Neither of the included RCTs reported this outcome | |
| 0 per 1000 | 0 per 1000 | |||||
| Type 2 diabetes | Study population | Not estimable | (0 RCTs) | ‐ | Neither of the included RCTs reported this outcome | |
| 0 per 1000 | 0 per 1000 | |||||
| *The risk in the intervention group (and its 95% confidence interval) is based on the assumed risk in the comparison group and the relative effect of the intervention (and its 95% CI). | ||||||
| GRADE Working Group grades of evidence | ||||||
| 1Study limitations (downgraded 1 level): 2 RCTs with potentially serious design limitations | ||||||
| Continuous glucose monitoring system versus self‐monitoring of glucose for gestational diabetes during pregnancy (effect on mother) | ||||||
| Patient or population: women with gestational diabetes mellitus Intervention: continuous glucose monitoring system | ||||||
| Outcomes | Anticipated absolute effects* (95% CI) | Relative effect | № of participants | Quality of the evidence | Comments | |
| Risk with self‐monitoring of glucose | Risk with continuous glucose monitoring system | |||||
| Hypertensive disorders of pregnancy | Study population | Not estimable | (0 RCTs) | ‐ | Neither of the included RCTs reported this outcome | |
| 0 per 1000 | 0 per 1000 | |||||
| Caesarean section | Study population | RR 0.91 | 179 | ⊕⊕⊝⊝ | ||
| 500 per 1000 | 455 per 1000 | |||||
| Development of type 2 diabetes | Study population | Not estimable | (0 RCTs) | ‐ | Neither of the included RCTs reported this outcome | |
| 0 per 1000 | 0 per 1000 | |||||
| Induction of labour | Study population | Not estimable | (0 RCTs) | ‐ | Neither of the included RCTs reported this outcome | |
| 0 per 1000 | 0 per 1000 | |||||
| Perineal trauma | Study population | Not estimable | (0 RCTs) | ‐ | Neither of the included RCTs reported this outcome | |
| 0 per 1000 | 0 per 1000 | |||||
| Postnatal depression | Study population | Not estimable | (0 RCTs) | ‐ | Neither of the included RCTs reported this outcome | |
| 0 per 1000 | 0 per 1000 | |||||
| Postnatal weight retention or return to pre‐pregnancy weight | Study population | Not estimable | (0 RCTs) | ‐ | Neither of the included RCTs reported this outcome | |
| 0 per 1000 | 0 per 1000 | |||||
| *The risk in the intervention group (and its 95% confidence interval) is based on the assumed risk in the comparison group and the relative effect of the intervention (and its 95% CI). | ||||||
| GRADE Working Group grades of evidence | ||||||
| 1Study limitations (downgraded 1 level): 2 RCTs with potentially serious design limitations | ||||||
| Continuous glucose monitoring system versus self‐monitoring of glucose for gestational diabetes during pregnancy (effect on child) | ||||||
| Patient or population: women with gestational diabetes mellitus Intervention: continuous glucose monitoring system | ||||||
| Outcomes | Anticipated absolute effects* (95% CI) | Relative effect | № of participants | Quality of the evidence | Comments | |
| Risk with self‐monitoring of glucose | Risk with continuous glucose monitoring system | |||||
| Perinatal mortality (stillbirth or neonatal death) | Study population | ‐ | 179 | ⊕⊕⊝⊝ | There were no perinatal deaths in the 2 RCTs | |
| See comment | See comment | |||||
| Large‐for‐gestational age | Study population | RR 0.67 | 106 | ⊕⊝⊝⊝ | ||
| 527 per 1000 | 353 per 1000 | |||||
| Death or serious morbidity composite | Study population | Not estimable | (0 RCTs) | ‐ | Neither of the included RCTs reported this outcome | |
| 0 per 1000 | 0 per 1000 | |||||
| Neurosensory disability | Study population | Not estimable | (0 RCTs) | ‐ | Neither of the included RCTs reported this outcome | |
| 0 per 1000 | 0 per 1000 | |||||
| Hypoglycaemia | Study population | RR 0.79 | 179 | ⊕⊝⊝⊝ | ||
| 130 per 1000 | 103 per 1000 | |||||
| Adiposity (e.g. BMI, skinfold thickness, fat mass) | Study population | Not estimable | (0 RCTs) | ‐ | Neither of the included RCTs reported this outcome | |
| 0 per 1000 | 0 per 1000 | |||||
| Type 2 diabetes | Study population | Not estimable | (0 RCTs) | ‐ | Neither of the included RCTs reported this outcome | |
| 0 per 1000 | 0 per 1000 | |||||
| *The risk in the intervention group (and its 95% confidence interval) is based on the assumed risk in the comparison group and the relative effect of the intervention (and its 95% CI). | ||||||
| GRADE Working Group grades of evidence | ||||||
| 1Study limitations (downgraded 1 level): 2 RCTs with potentially serious design limitations | ||||||
| Outcome or subgroup title | No. of studies | No. of participants | Statistical method | Effect size |
| 1 Hypertensive disorders of pregnancy Show forest plot | 4 | 275 | Risk Ratio (M‐H, Fixed, 95% CI) | 1.49 [0.69, 3.20] |
| 1.1 Pre‐eclampsia, pregnancy‐induced hypertension | 3 | 178 | Risk Ratio (M‐H, Fixed, 95% CI) | 1.29 [0.58, 2.89] |
| 1.2 Pregnancy‐induced hypertension | 1 | 97 | Risk Ratio (M‐H, Fixed, 95% CI) | 4.9 [0.24, 99.48] |
| 2 Caesarean section Show forest plot | 5 | 478 | Risk Ratio (M‐H, Random, 95% CI) | 1.05 [0.72, 1.53] |
| 3 Perinatal mortality Show forest plot | 2 | 131 | Risk Ratio (M‐H, Fixed, 95% CI) | 0.0 [0.0, 0.0] |
| 4 Large‐for‐gestational age Show forest plot | 3 | 228 | Risk Ratio (M‐H, Fixed, 95% CI) | 1.41 [0.76, 2.64] |
| 5 Death or serious morbidity composite Show forest plot | 1 | 57 | Risk Ratio (M‐H, Fixed, 95% CI) | 1.06 [0.68, 1.66] |
| 6 Operative vaginal birth (not a prespecified outcome) Show forest plot | 1 | 47 | Risk Ratio (M‐H, Fixed, 95% CI) | 0.50 [0.11, 2.30] |
| 7 Induction of labour Show forest plot | 1 | 47 | Risk Ratio (M‐H, Fixed, 95% CI) | 1.06 [0.63, 1.77] |
| 8 Placental abruption Show forest plot | 2 | 154 | Risk Ratio (M‐H, Fixed, 95% CI) | 0.88 [0.12, 6.42] |
| 9 Gestational weight gain (kg) Show forest plot | 2 | 300 | Mean Difference (IV, Fixed, 95% CI) | ‐0.47 [‐1.50, 0.55] |
| 10 Weight at 36 weeks (kg) Show forest plot | 1 | 44 | Mean Difference (IV, Fixed, 95% CI) | 5.5 [‐5.69, 16.69] |
| 11 Adherence to the intervention Show forest plot | 3 | Mean Difference (IV, Fixed, 95% CI) | Subtotals only | |
| 11.1 Appointments attended (%) | 1 | 47 | Mean Difference (IV, Fixed, 95% CI) | 5.20 [‐2.27, 12.67] |
| 11.2 Average daily self‐monitoring of blood glucose frequency: meter memory | 1 | 44 | Mean Difference (IV, Fixed, 95% CI) | 0.5 [‐0.42, 1.42] |
| 11.3 Average daily self‐monitoring of blood glucose frequency: diary | 1 | 45 | Mean Difference (IV, Fixed, 95% CI) | 0.10 [‐0.66, 0.86] |
| 11.4 Frequency of monitoring (number of data points) | 1 | 57 | Mean Difference (IV, Fixed, 95% CI) | 21.10 [‐9.33, 51.53] |
| 11.5 Frequency of monitoring (number of data sets) | 1 | 74 | Mean Difference (IV, Fixed, 95% CI) | 1.20 [‐12.32, 14.72] |
| 12 Sense of well‐being and quality of life: DES: Diabetes Empowerment Scale Show forest plot | 1 | Mean Difference (IV, Fixed, 95% CI) | Subtotals only | |
| 12.1 Total | 1 | 57 | Mean Difference (IV, Fixed, 95% CI) | 0.40 [0.14, 0.66] |
| 12.2 Subscale 1: managing the psychosocial aspects of diabetes | 1 | 57 | Mean Difference (IV, Fixed, 95% CI) | 0.5 [0.21, 0.79] |
| 12.3 Subscale 2: assessing dissatisfaction and readiness to change | 1 | 57 | Mean Difference (IV, Fixed, 95% CI) | 0.40 [0.14, 0.66] |
| 12.4 Subscale 3: setting and achieving diabetes goals | 1 | 57 | Mean Difference (IV, Fixed, 95% CI) | 0.30 [‐0.04, 0.64] |
| 13 Use of additional pharmacotherapy Show forest plot | 5 | Risk Ratio (M‐H, Fixed, 95% CI) | Subtotals only | |
| 13.1 Insulin | 5 | 484 | Risk Ratio (M‐H, Fixed, 95% CI) | 1.52 [1.18, 1.96] |
| 13.2 Oral agents | 3 | 184 | Risk Ratio (M‐H, Fixed, 95% CI) | 0.85 [0.50, 1.42] |
| 13.3 Insulin and oral agents | 1 | 47 | Risk Ratio (M‐H, Fixed, 95% CI) | 1.24 [0.19, 8.06] |
| 14 Maternal hypoglycaemia Show forest plot | 1 | 203 | Risk Ratio (M‐H, Fixed, 95% CI) | 0.0 [0.0, 0.0] |
| 15 Maternal hypoglycaemia: self‐monitored blood glucose episodes hypoglycaemic (< 3.9 mmol/L) (%) Show forest plot | 1 | 44 | Mean Difference (IV, Fixed, 95% CI) | ‐0.10 [‐1.64, 1.44] |
| 16 Glycaemic control: HbA1c (%) Show forest plot | 3 | 357 | Mean Difference (IV, Fixed, 95% CI) | ‐0.15 [‐0.26, ‐0.04] |
| 17 Glycaemic control: HbA1c < 5.8% Show forest plot | 1 | 97 | Risk Ratio (M‐H, Fixed, 95% CI) | 1.0 [0.96, 1.04] |
| 18 Glycaemic control: HbA1c at 36 weeks (mmol/mol) Show forest plot | 1 | 30 | Mean Difference (IV, Fixed, 95% CI) | 0.20 [‐2.03, 2.43] |
| 19 Glycaemic control: self‐monitored blood glucose (mmol/L) Show forest plot | 1 | 44 | Mean Difference (IV, Fixed, 95% CI) | 0.0 [‐0.30, 0.30] |
| 20 Glycaemic control: fasting and 2‐hour post‐prandial blood glucose (mg/dL) Show forest plot | 2 | Mean Difference (IV, Random, 95% CI) | Subtotals only | |
| 20.1 Fasting blood glucose (mg/dL) | 2 | 131 | Mean Difference (IV, Random, 95% CI) | ‐0.50 [‐5.38, 4.38] |
| 20.2 2‐hour post‐prandial blood glucose (mg/dL) | 2 | 131 | Mean Difference (IV, Random, 95% CI) | ‐0.21 [‐5.09, 4.67] |
| 21 Stillbirth Show forest plot | 3 | 178 | Risk Ratio (M‐H, Fixed, 95% CI) | 0.41 [0.02, 9.55] |
| 22 Neonatal death Show forest plot | 2 | 131 | Risk Ratio (M‐H, Fixed, 95% CI) | 0.0 [0.0, 0.0] |
| 23 Gestational age at birth (weeks) Show forest plot | 5 | 478 | Mean Difference (IV, Fixed, 95% CI) | 0.10 [‐0.18, 0.37] |
| 24 Preterm birth < 37 weeks Show forest plot | 4 | 275 | Risk Ratio (M‐H, Fixed, 95% CI) | 0.66 [0.31, 1.39] |
| 25 Macrosomia Show forest plot | 2 | 249 | Risk Ratio (M‐H, Random, 95% CI) | 1.43 [0.27, 7.52] |
| 26 Small‐for‐gestational age Show forest plot | 1 | 97 | Risk Ratio (M‐H, Fixed, 95% CI) | 0.0 [0.0, 0.0] |
| 27 Birthweight (g) Show forest plot | 5 | 477 | Mean Difference (IV, Fixed, 95% CI) | 63.13 [‐32.32, 158.59] |
| 28 Head circumference (cm) Show forest plot | 1 | 45 | Mean Difference (IV, Fixed, 95% CI) | 0.70 [0.02, 1.38] |
| 29 Length (cm) Show forest plot | 1 | 42 | Mean Difference (IV, Fixed, 95% CI) | 0.20 [‐1.34, 1.74] |
| 30 Shoulder dystocia Show forest plot | 2 | 142 | Risk Ratio (M‐H, Fixed, 95% CI) | 0.33 [0.01, 7.83] |
| 31 Respiratory distress syndrome Show forest plot | 3 | 176 | Risk Ratio (M‐H, Fixed, 95% CI) | 0.63 [0.26, 1.49] |
| 32 Neonatal hypoglycaemia Show forest plot | 3 | 198 | Risk Ratio (M‐H, Fixed, 95% CI) | 1.14 [0.48, 2.72] |
| 33 Hyperbilirubinaemia or jaundice Show forest plot | 3 | 176 | Risk Ratio (M‐H, Fixed, 95% CI) | 1.09 [0.59, 2.01] |
| 34 Hypocalcaemia Show forest plot | 1 | 97 | Risk Ratio (M‐H, Fixed, 95% CI) | 0.0 [0.0, 0.0] |
| 35 Polycythaemia Show forest plot | 1 | 97 | Risk Ratio (M‐H, Fixed, 95% CI) | 0.0 [0.0, 0.0] |
| 36 Number of hospital or health professional visits: face‐to‐face visits Show forest plot | 1 | 97 | Mean Difference (IV, Fixed, 95% CI) | ‐0.36 [‐0.92, 0.20] |
| 37 Number of hospital or health professional visits: unscheduled face‐to‐face visits Show forest plot | 1 | 97 | Mean Difference (IV, Fixed, 95% CI) | ‐0.62 [‐1.05, ‐0.19] |
| 38 Neonatal intensive care unit admission Show forest plot | 3 | 176 | Risk Ratio (M‐H, Fixed, 95% CI) | 1.05 [0.62, 1.79] |
| 39 'Neonatal morbidity' (neonatal complications: e.g. hypoglycaemia, hyperbilirubinaemia, respiratory distress syndrome, shoulder dystocia, malformations) (not a prespecified outcome) Show forest plot | 1 | 203 | Risk Ratio (M‐H, Fixed, 95% CI) | 1.52 [0.53, 4.38] |
| 40 'Maternal morbidity' (maternal complications: gestational hypertension, pre‐eclampsia, eclampsia, hypoglycaemic episodes) (not a prespecified outcome) Show forest plot | 1 | 203 | Risk Ratio (M‐H, Fixed, 95% CI) | 0.49 [0.13, 1.79] |
| Outcome or subgroup title | No. of studies | No. of participants | Statistical method | Effect size |
| 1 Hypertensive disorders of pregnancy: pre‐eclampsia Show forest plot | 1 | 58 | Risk Ratio (M‐H, Fixed, 95% CI) | 0.18 [0.01, 3.49] |
| 2 Caesarean section Show forest plot | 2 | 400 | Risk Ratio (M‐H, Random, 95% CI) | 1.18 [0.61, 2.27] |
| 3 Perinatal mortality Show forest plot | 2 | 400 | Risk Ratio (M‐H, Fixed, 95% CI) | 1.54 [0.21, 11.24] |
| 4 Large‐for‐gestational age Show forest plot | 2 | 400 | Risk Ratio (M‐H, Fixed, 95% CI) | 0.82 [0.50, 1.37] |
| 5 Placental abruption Show forest plot | 1 | 58 | Risk Ratio (M‐H, Fixed, 95% CI) | 2.63 [0.11, 61.88] |
| 6 Postpartum haemorrhage Show forest plot | 1 | 58 | Risk Ratio (M‐H, Fixed, 95% CI) | 2.63 [0.11, 61.88] |
| 7 Gestational weight gain (kg/week) Show forest plot | 1 | 342 | Mean Difference (IV, Fixed, 95% CI) | ‐0.1 [‐0.15, ‐0.05] |
| 7.1 1‐hour post‐breakfast glucose < 7.8 mmol/L | 1 | 227 | Mean Difference (IV, Fixed, 95% CI) | ‐0.10 [‐0.17, ‐0.03] |
| 7.2 1‐hour post‐breakfast glucose ≥ 7.8 mmol/L | 1 | 115 | Mean Difference (IV, Fixed, 95% CI) | ‐0.10 [‐0.17, ‐0.03] |
| 8 Gestational weight gain (lb) Show forest plot | 1 | 58 | Mean Difference (IV, Fixed, 95% CI) | ‐5.5 [‐13.57, 2.57] |
| 9 Adherence to the intervention: < 70% adherence to home blood glucose measurements or diabetes outpatient clinic appointments Show forest plot | 1 | 342 | Risk Ratio (M‐H, Fixed, 95% CI) | 0.74 [0.32, 1.71] |
| 10 Adherence to the intervention: Dietary Compliance Questionnaire Show forest plot | 1 | Mean Difference (IV, Fixed, 95% CI) | Subtotals only | |
| 10.1 Total compliance score | 1 | 58 | Mean Difference (IV, Fixed, 95% CI) | 1.5 [‐0.47, 3.47] |
| 10.2 Mean compliance score | 1 | 58 | Mean Difference (IV, Fixed, 95% CI) | 0.0 [‐0.40, 0.40] |
| 11 Sense of well‐being and quality of life: Diabetes Empowerment Scale delta scores Show forest plot | 1 | Mean Difference (IV, Fixed, 95% CI) | Subtotals only | |
| 11.1 Overall | 1 | 47 | Mean Difference (IV, Fixed, 95% CI) | 3.70 [‐2.08, 9.48] |
| 11.2 Setting goals | 1 | 47 | Mean Difference (IV, Fixed, 95% CI) | 0.65 [‐1.10, 2.40] |
| 11.3 Solving problems | 1 | 47 | Mean Difference (IV, Fixed, 95% CI) | 1.35 [‐0.37, 3.07] |
| 11.4 Motivating oneself | 1 | 47 | Mean Difference (IV, Fixed, 95% CI) | 0.63 [‐0.89, 2.15] |
| 11.5 Obtaining support | 1 | 47 | Mean Difference (IV, Fixed, 95% CI) | 0.94 [‐0.09, 1.97] |
| 11.6 Making decisions | 1 | 47 | Mean Difference (IV, Fixed, 95% CI) | 0.01 [‐1.39, 1.41] |
| 12 Sense of well‐being and quality of life: emotional adjustment: Appraisal of Diabetes Scale delta scores Show forest plot | 1 | 47 | Mean Difference (IV, Fixed, 95% CI) | 1.20 [‐0.88, 3.28] |
| 13 Use of additional pharmacotherapy: insulin Show forest plot | 2 | 400 | Risk Ratio (M‐H, Fixed, 95% CI) | 1.31 [0.69, 2.48] |
| 14 Glycaemic control: pre‐prandial blood glucose (mmol/L) Show forest plot | 2 | 360 | Mean Difference (IV, Random, 95% CI) | 0.06 [‐0.08, 0.19] |
| 14.1 Breakfast glucose < 7.8 mmol/L | 1 | 192 | Mean Difference (IV, Random, 95% CI) | 0.10 [‐0.03, 0.23] |
| 14.2 Breakfast glucose ≥ 7.8 mmol/L | 1 | 110 | Mean Difference (IV, Random, 95% CI) | 0.10 [‐0.07, 0.27] |
| 14.3 All women | 1 | 58 | Mean Difference (IV, Random, 95% CI) | ‐0.21 [‐0.54, 0.12] |
| 15 Glycaemic control: 1‐hour post‐prandial blood glucose (mmol/L) Show forest plot | 2 | 395 | Mean Difference (IV, Random, 95% CI) | ‐0.09 [‐0.60, 0.42] |
| 15.1 1‐hour post‐breakfast glucose > 7.8 mmol/L | 1 | 222 | Mean Difference (IV, Random, 95% CI) | 0.0 [‐0.19, 0.19] |
| 15.2 1‐hour post‐breakfast glucose ≥ 7.8 mmol/L | 1 | 115 | Mean Difference (IV, Random, 95% CI) | ‐0.60 [‐0.90, ‐0.30] |
| 15.3 All women | 1 | 58 | Mean Difference (IV, Random, 95% CI) | 0.47 [‐0.12, 1.06] |
| 16 Stillbirth Show forest plot | 2 | 400 | Risk Ratio (M‐H, Fixed, 95% CI) | 1.54 [0.21, 11.24] |
| 17 Neonatal death Show forest plot | 1 | 58 | Risk Ratio (M‐H, Fixed, 95% CI) | 0.0 [0.0, 0.0] |
| 18 Gestational age at birth (weeks) Show forest plot | 2 | 400 | Mean Difference (IV, Fixed, 95% CI) | ‐0.03 [‐0.32, 0.27] |
| 18.1 1‐hour post‐breakfast glucose < 7.8 mmol/L | 1 | 227 | Mean Difference (IV, Fixed, 95% CI) | ‐0.20 [‐0.59, 0.19] |
| 18.2 1‐hour post‐breakfast glucose ≥ 7.8 mmol/L | 1 | 115 | Mean Difference (IV, Fixed, 95% CI) | 0.20 [‐0.31, 0.71] |
| 18.3 All neonates | 1 | 58 | Mean Difference (IV, Fixed, 95% CI) | 0.30 [‐0.78, 1.38] |
| 19 Macrosomia Show forest plot | 1 | 342 | Risk Ratio (M‐H, Fixed, 95% CI) | 0.94 [0.53, 1.67] |
| 20 Small‐for‐gestational age Show forest plot | 1 | 342 | Risk Ratio (M‐H, Fixed, 95% CI) | 1.19 [0.53, 2.67] |
| 21 Birthweight (kg) Show forest plot | 2 | 400 | Mean Difference (IV, Fixed, 95% CI) | ‐40.22 [‐148.37, 67.93] |
| 21.1 1‐hour post‐breakfast glucose < 7.8 mmol/L | 1 | 227 | Mean Difference (IV, Fixed, 95% CI) | ‐10.0 [‐145.47, 125.47] |
| 21.2 1‐hour post‐breakfast glucose ≥ 7.8 mmol/L | 1 | 115 | Mean Difference (IV, Fixed, 95% CI) | ‐70.0 [‐283.34, 143.34] |
| 21.3 All neonates | 1 | 58 | Mean Difference (IV, Fixed, 95% CI) | ‐150.0 [‐482.61, 182.61] |
| 22 Birthweight (percentile) Show forest plot | 1 | 342 | Mean Difference (IV, Fixed, 95% CI) | ‐0.67 [‐6.75, 5.42] |
| 22.1 1‐hour post‐breakfast glucose < 7.8 mmol/L | 1 | 227 | Mean Difference (IV, Fixed, 95% CI) | 1.5 [‐5.71, 8.71] |
| 22.2 1‐hour post‐breakfast glucose ≥ 7.8 mmol/L | 1 | 115 | Mean Difference (IV, Fixed, 95% CI) | ‐6.00 [‐17.32, 5.32] |
| 23 Shoulder dystocia Show forest plot | 1 | 342 | Risk Ratio (M‐H, Fixed, 95% CI) | 0.25 [0.03, 2.19] |
| 24 Neonatal hypoglycaemia Show forest plot | 2 | 391 | Risk Ratio (M‐H, Fixed, 95% CI) | 0.64 [0.39, 1.06] |
| 25 Hyperbilirubinaemia or jaundice Show forest plot | 2 | 370 | Risk Ratio (M‐H, Fixed, 95% CI) | 0.63 [0.39, 1.04] |
| 26 Number of antenatal visits or admissions: prenatal visits with the diabetes team Show forest plot | 1 | 58 | Mean Difference (IV, Fixed, 95% CI) | 0.20 [‐1.09, 1.49] |
| 27 Neonatal intensive care unit admission Show forest plot | 1 | 58 | Risk Ratio (M‐H, Fixed, 95% CI) | 0.87 [0.13, 5.77] |
| 28 'Birth trauma' (not a prespecified outcome) Show forest plot | 1 | 58 | Risk Ratio (M‐H, Fixed, 95% CI) | 0.87 [0.06, 13.27] |
| 29 'Respiratory complications' (not a prespecified outcome) Show forest plot | 1 | 58 | Risk Ratio (M‐H, Fixed, 95% CI) | 0.87 [0.06, 13.27] |
| Outcome or subgroup title | No. of studies | No. of participants | Statistical method | Effect size |
| 1 Caesarean section Show forest plot | 2 | 179 | Risk Ratio (M‐H, Fixed, 95% CI) | 0.91 [0.68, 1.20] |
| 2 Perinatal mortality Show forest plot | 2 | 179 | Risk Ratio (M‐H, Fixed, 95% CI) | 0.0 [0.0, 0.0] |
| 3 Large‐for‐gestational age Show forest plot | 1 | 106 | Risk Ratio (M‐H, Fixed, 95% CI) | 0.67 [0.43, 1.05] |
| 4 Gestational weight gain (kg) Show forest plot | 2 | 179 | Mean Difference (IV, Fixed, 95% CI) | ‐1.26 [‐2.28, ‐0.24] |
| 5 Use of additional pharmacotherapy Show forest plot | 2 | 179 | Risk Ratio (M‐H, Fixed, 95% CI) | 2.86 [1.47, 5.56] |
| 6 Glycaemic control: HbA1c at 32 to 36 weeks (%) Show forest plot | 1 | 106 | Mean Difference (IV, Fixed, 95% CI) | ‐0.10 [‐0.24, 0.04] |
| 7 Stillbirth Show forest plot | 2 | 179 | Risk Ratio (M‐H, Fixed, 95% CI) | 0.0 [0.0, 0.0] |
| 8 Neonatal death Show forest plot | 2 | 179 | Risk Ratio (M‐H, Fixed, 95% CI) | 0.0 [0.0, 0.0] |
| 9 Gestational age at birth (weeks) Show forest plot | 2 | 179 | Mean Difference (IV, Fixed, 95% CI) | ‐0.17 [‐0.52, 0.19] |
| 10 Preterm birth < 37 weeks Show forest plot | 1 | Risk Ratio (M‐H, Fixed, 95% CI) | Subtotals only | |
| 11 Macrosomia Show forest plot | 2 | 179 | Risk Ratio (M‐H, Fixed, 95% CI) | 0.85 [0.35, 2.05] |
| 12 Small‐for‐gestational age Show forest plot | 1 | 106 | Risk Ratio (M‐H, Fixed, 95% CI) | 1.08 [0.16, 7.37] |
| 13 Birthweight (g) Show forest plot | 2 | 179 | Mean Difference (IV, Fixed, 95% CI) | ‐110.17 [‐264.73, 44.39] |
| 14 Neonatal hypoglycaemia Show forest plot | 2 | 179 | Risk Ratio (M‐H, Fixed, 95% CI) | 0.79 [0.35, 1.78] |
| 15 Hyperbilirubinaemia or jaundice Show forest plot | 1 | 73 | Risk Ratio (M‐H, Fixed, 95% CI) | 1.03 [0.28, 3.80] |
| 16 Neonatal intensive care unit admission Show forest plot | 1 | 73 | Risk Ratio (M‐H, Fixed, 95% CI) | 0.65 [0.29, 1.50] |
| 17 Length of postnatal stay (baby): length of stay in neonatal intensive care unit (days) Show forest plot | 1 | 18 | Mean Difference (IV, Fixed, 95% CI) | ‐0.83 [‐2.35, 0.69] |
| Outcome or subgroup title | No. of studies | No. of participants | Statistical method | Effect size |
| 1 Views of the intervention Show forest plot | 1 | Risk Ratio (M‐H, Fixed, 95% CI) | Subtotals only | |
| 1.1 Overall, I am satisfied with how easy it is to use Accu‐Chek Complete, Acculink | 1 | 38 | Risk Ratio (M‐H, Fixed, 95% CI) | 1.11 [0.90, 1.38] |
| 1.2 I feel comfortable using the Accu‐Chek Complete, Acculink | 1 | 38 | Risk Ratio (M‐H, Fixed, 95% CI) | 0.96 [0.66, 1.41] |
| 1.3 Whenever I made a mistake using the Accu‐Chek Complete, Acculink, I could recover easily and quickly | 1 | 38 | Risk Ratio (M‐H, Fixed, 95% CI) | 0.92 [0.67, 1.25] |
| 1.4 It was easy to learn to use the Accu‐Chek Complete, Acculink | 1 | 38 | Risk Ratio (M‐H, Fixed, 95% CI) | 1.05 [0.82, 1.34] |
| 1.5 The written material provided for the Accu‐Chek Complete was easy to understand | 1 | 38 | Risk Ratio (M‐H, Fixed, 95% CI) | 1.18 [0.92, 1.51] |
| Outcome or subgroup title | No. of studies | No. of participants | Statistical method | Effect size |
| 1 Hypertensive disorders of pregnancy: pre‐eclampsia Show forest plot | 1 | 66 | Risk Ratio (M‐H, Fixed, 95% CI) | 1.0 [0.15, 6.68] |
| 2 Caesarean section Show forest plot | 1 | 66 | Risk Ratio (M‐H, Fixed, 95% CI) | 0.62 [0.29, 1.29] |
| 3 Large‐for‐gestational age Show forest plot | 1 | 66 | Risk Ratio (M‐H, Fixed, 95% CI) | 0.29 [0.11, 0.78] |
| 4 Perineal trauma Show forest plot | 1 | 66 | Risk Ratio (M‐H, Fixed, 95% CI) | 0.38 [0.11, 1.29] |
| 5 Gestational weight gain (kg) Show forest plot | 1 | 66 | Mean Difference (IV, Fixed, 95% CI) | ‐0.20 [‐2.81, 2.41] |
| 6 Adherence to the intervention: compliance with schedule (%) Show forest plot | 1 | 66 | Mean Difference (IV, Fixed, 95% CI) | ‐3.0 [‐3.99, ‐2.01] |
| 7 Use of additional pharmacotherapy Show forest plot | 1 | Mean Difference (IV, Fixed, 95% CI) | Subtotals only | |
| 7.1 Insulin dose (during the last 4 weeks of pregnancy, including regular and intermediate acting) (units/day) | 1 | 66 | Mean Difference (IV, Fixed, 95% CI) | 23.60 [11.17, 36.03] |
| 7.2 Insulin dose (during the last 4 weeks of pregnancy, including regular and intermediate acting) (units/kg) | 1 | 66 | Mean Difference (IV, Fixed, 95% CI) | 0.20 [0.12, 0.28] |
| 8 Glycaemic control: change in HbA1c (%) Show forest plot | 1 | 66 | Mean Difference (IV, Fixed, 95% CI) | ‐2.4 [‐3.33, ‐1.47] |
| 9 Glycaemic control: hospitalisation for glycaemic control Show forest plot | 1 | 66 | Risk Ratio (M‐H, Fixed, 95% CI) | 1.33 [0.32, 5.50] |
| 10 Glycaemic control: success in glycaemic control (%) Show forest plot | 1 | 66 | Mean Difference (IV, Fixed, 95% CI) | 2.0 [‐0.26, 4.26] |
| 11 Stillbirth Show forest plot | 1 | 66 | Risk Ratio (M‐H, Fixed, 95% CI) | 0.33 [0.01, 7.90] |
| 12 Gestational age at birth (weeks) Show forest plot | 1 | 66 | Mean Difference (IV, Fixed, 95% CI) | 0.30 [‐1.08, 1.68] |
| 13 Apgar score < 7 at 5 minutes Show forest plot | 1 | 66 | Risk Ratio (M‐H, Fixed, 95% CI) | 0.33 [0.04, 3.04] |
| 14 Macrosomia Show forest plot | 1 | 66 | Risk Ratio (M‐H, Fixed, 95% CI) | 0.25 [0.08, 0.81] |
| 15 Small‐for‐gestational age Show forest plot | 1 | 66 | Risk Ratio (M‐H, Fixed, 95% CI) | 3.0 [0.13, 71.07] |
| 16 Birthweight (g) Show forest plot | 1 | 66 | Mean Difference (IV, Fixed, 95% CI) | ‐379.0 [‐650.79, ‐107.21] |
| 17 Shoulder dystocia Show forest plot | 1 | 66 | Risk Ratio (M‐H, Fixed, 95% CI) | 0.17 [0.02, 1.31] |
| 18 Nerve palsies Show forest plot | 1 | 66 | Risk Ratio (M‐H, Fixed, 95% CI) | 0.5 [0.05, 5.25] |
| 19 Bone fractures Show forest plot | 1 | 66 | Risk Ratio (M‐H, Fixed, 95% CI) | 1.0 [0.07, 15.33] |
| 20 Neonatal hypoglycaemia Show forest plot | 1 | 66 | Risk Ratio (M‐H, Fixed, 95% CI) | 0.14 [0.02, 1.10] |
| 21 Hyperbilirubinaemia or jaundice Show forest plot | 1 | 66 | Risk Ratio (M‐H, Fixed, 95% CI) | 0.75 [0.18, 3.09] |