| 1 Death at 6 months Show forest plot | 15 | 2330 | Risk Ratio (M‐H, Random, 95% CI) | 1.11 [0.92, 1.33] |
|
| 1.1 Conivaptan | 4 | 222 | Risk Ratio (M‐H, Random, 95% CI) | 0.39 [0.13, 1.17] |
| 1.2 Lixivaptan | 3 | 950 | Risk Ratio (M‐H, Random, 95% CI) | 1.23 [0.85, 1.80] |
| 1.3 Tolvaptan | 8 | 1158 | Risk Ratio (M‐H, Random, 95% CI) | 1.11 [0.89, 1.39] |
| 2 Health‐related quality of life Show forest plot | 2 | | Mean Difference (IV, Random, 95% CI) | Subtotals only |
|
| 2.1 Mental component SF‐12 | 2 | 297 | Mean Difference (IV, Random, 95% CI) | 4.76 [0.11, 9.41] |
| 2.2 Physical component SF‐12 | 2 | 300 | Mean Difference (IV, Random, 95% CI) | 1.04 [‐1.81, 3.90] |
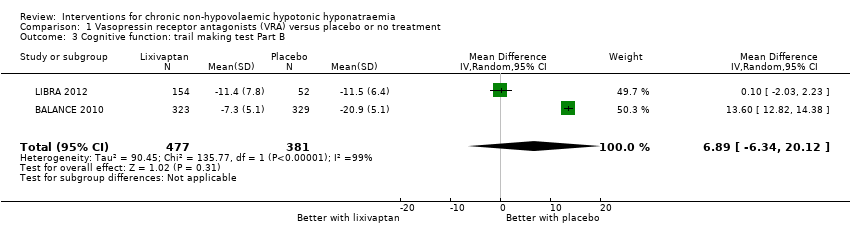
| 3 Cognitive function: trail making test Part B Show forest plot | 2 | 858 | Mean Difference (IV, Random, 95% CI) | 6.89 [‐6.34, 20.12] |
|
| 4 Length of hospital stay Show forest plot | 3 | 610 | Mean Difference (IV, Random, 95% CI) | ‐1.63 [‐2.96, ‐0.30] |
|
| 4.1 Satavaptan | 1 | 139 | Mean Difference (IV, Random, 95% CI) | ‐1.80 [‐3.80, 0.20] |
| 4.2 Tolvaptan | 2 | 471 | Mean Difference (IV, Random, 95% CI) | ‐1.50 [‐3.28, 0.29] |
| 5 Change from baseline serum sodium concentration Show forest plot | 21 | 2641 | Mean Difference (IV, Random, 95% CI) | 4.17 [3.18, 5.16] |
|
| 5.1 Conivaptan | 5 | 292 | Mean Difference (IV, Random, 95% CI) | 5.17 [2.65, 7.69] |
| 5.2 Lixivaptan | 4 | 1070 | Mean Difference (IV, Random, 95% CI) | 2.24 [0.78, 3.70] |
| 5.3 Satavaptan | 3 | 257 | Mean Difference (IV, Random, 95% CI) | 4.91 [2.88, 6.94] |
| 5.4 Tolvaptan | 9 | 1022 | Mean Difference (IV, Random, 95% CI) | 4.22 [3.55, 4.89] |
| 6 Response in serum sodium concentration Show forest plot | 18 | 2104 | Risk Ratio (M‐H, Random, 95% CI) | 2.49 [1.95, 3.18] |
|
| 6.1 Conivaptan | 4 | 282 | Risk Ratio (M‐H, Random, 95% CI) | 2.48 [1.54, 4.01] |
| 6.2 Lixivaptan | 4 | 1024 | Risk Ratio (M‐H, Random, 95% CI) | 2.21 [1.19, 4.10] |
| 6.3 Satavaptan | 4 | 331 | Risk Ratio (M‐H, Random, 95% CI) | 3.33 [1.88, 5.89] |
| 6.4 Tolvaptan | 6 | 467 | Risk Ratio (M‐H, Random, 95% CI) | 2.36 [1.75, 3.18] |
| 7 Rapid increase in serum sodium concentration Show forest plot | 14 | 2058 | Risk Ratio (M‐H, Random, 95% CI) | 1.67 [1.16, 2.40] |
|
| 7.1 Conivaptan | 4 | 290 | Risk Ratio (M‐H, Random, 95% CI) | 3.77 [0.89, 15.98] |
| 7.2 Lixivaptan | 4 | 994 | Risk Ratio (M‐H, Random, 95% CI) | 1.39 [0.90, 2.17] |
| 7.3 Satavaptan | 4 | 331 | Risk Ratio (M‐H, Random, 95% CI) | 2.61 [0.73, 9.30] |
| 7.4 Tolvaptan | 2 | 443 | Risk Ratio (M‐H, Random, 95% CI) | 6.70 [0.82, 54.56] |
| 8 Hypernatraemia during treatment Show forest plot | 10 | 1592 | Risk Ratio (M‐H, Random, 95% CI) | 1.37 [0.63, 3.01] |
|
| 8.1 Conivaptan | 1 | 83 | Risk Ratio (M‐H, Random, 95% CI) | 2.87 [0.14, 57.89] |
| 8.2 Lixivaptan | 2 | 306 | Risk Ratio (M‐H, Random, 95% CI) | 0.51 [0.04, 5.78] |
| 8.3 Satavaptan | 3 | 262 | Risk Ratio (M‐H, Random, 95% CI) | 1.98 [0.35, 11.11] |
| 8.4 Tolvaptan | 4 | 941 | Risk Ratio (M‐H, Random, 95% CI) | 2.73 [0.81, 9.22] |
| 9 Thirst Show forest plot | 13 | | Odds Ratio (Random, 95% CI) | 2.77 [1.80, 4.27] |
|
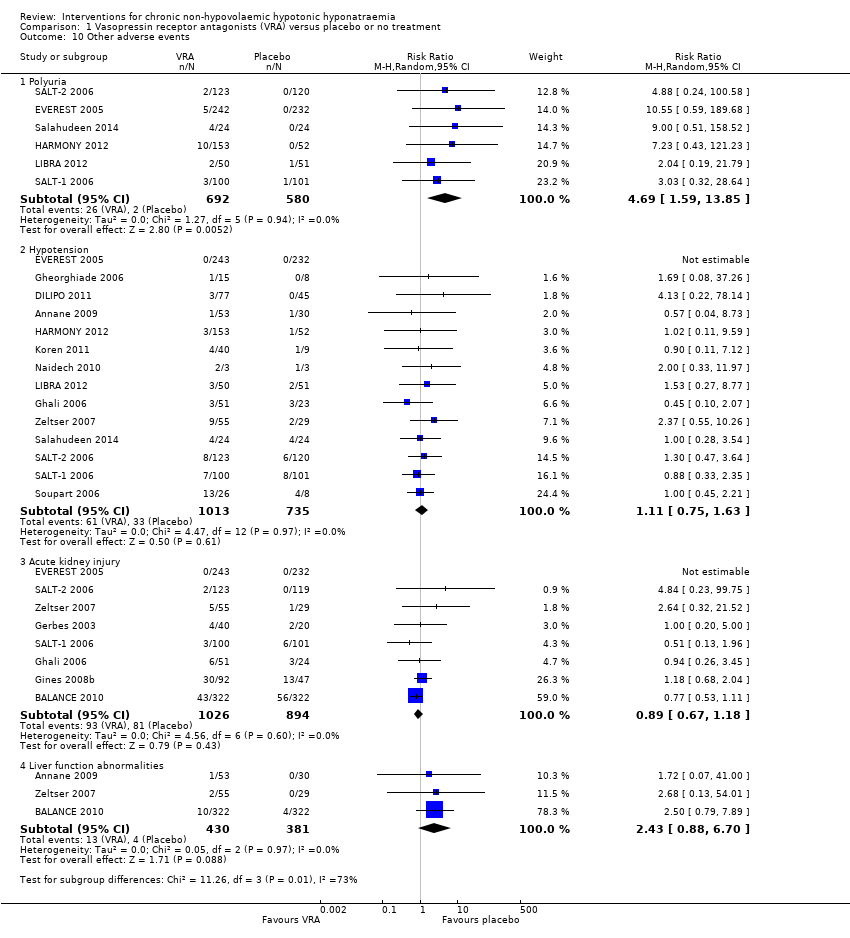
| 10 Other adverse events Show forest plot | 17 | | Risk Ratio (M‐H, Random, 95% CI) | Subtotals only |
|
| 10.1 Polyuria | 6 | 1272 | Risk Ratio (M‐H, Random, 95% CI) | 4.69 [1.59, 13.85] |
| 10.2 Hypotension | 14 | 1748 | Risk Ratio (M‐H, Random, 95% CI) | 1.11 [0.75, 1.63] |
| 10.3 Acute kidney injury | 8 | 1920 | Risk Ratio (M‐H, Random, 95% CI) | 0.89 [0.67, 1.18] |
| 10.4 Liver function abnormalities | 3 | 811 | Risk Ratio (M‐H, Random, 95% CI) | 2.43 [0.88, 6.70] |
| 11 Injection‐site complications at 2 to 7 days Show forest plot | 2 | | Risk Ratio (M‐H, Random, 95% CI) | Subtotals only |
|
| 11.1 Reactions | 1 | 49 | Risk Ratio (M‐H, Random, 95% CI) | 7.56 [0.49, 115.93] |
| 11.2 Phlebitis | 2 | 133 | Risk Ratio (M‐H, Random, 95% CI) | 3.52 [1.00, 12.41] |
| 11.3 Thrombosis | 2 | 133 | Risk Ratio (M‐H, Random, 95% CI) | 1.75 [0.21, 14.80] |
| 12 Treatment discontinuation Show forest plot | 14 | 2429 | Risk Ratio (M‐H, Random, 95% CI) | 0.93 [0.85, 1.00] |
|
| 12.1 Conivaptan | 4 | 288 | Risk Ratio (M‐H, Random, 95% CI) | 0.71 [0.39, 1.30] |
| 12.2 Lixivaptan | 4 | 1008 | Risk Ratio (M‐H, Random, 95% CI) | 0.93 [0.84, 1.03] |
| 12.3 Satavaptan | 2 | 145 | Risk Ratio (M‐H, Random, 95% CI) | 0.49 [0.17, 1.46] |
| 12.4 Tolvaptan | 4 | 988 | Risk Ratio (M‐H, Random, 95% CI) | 0.86 [0.66, 1.13] |
| 13 Death during follow‐up: sensitivity analysis Show forest plot | 16 | 2404 | Risk Ratio (M‐H, Random, 95% CI) | 1.10 [0.91, 1.32] |
|
| 13.1 Conivaptan | 5 | 296 | Risk Ratio (M‐H, Random, 95% CI) | 0.46 [0.19, 1.15] |
| 13.2 Lixivaptan | 3 | 950 | Risk Ratio (M‐H, Random, 95% CI) | 1.07 [0.37, 3.15] |
| 13.3 Tolvaptan | 8 | 1158 | Risk Ratio (M‐H, Random, 95% CI) | 1.11 [0.89, 1.39] |
| 14 Rapid increase in serum sodium concentration: sensitivity analysis Show forest plot | 14 | 2058 | Risk Ratio (M‐H, Random, 95% CI) | 1.67 [1.16, 2.40] |
|
| 14.1 > 8 mmol/L/d | 4 | 257 | Risk Ratio (M‐H, Random, 95% CI) | 3.22 [0.65, 15.94] |
| 14.2 > 12 mmol/L/d | 10 | 1801 | Risk Ratio (M‐H, Random, 95% CI) | 1.63 [1.09, 2.43] |