| Author year (country) | Target population | Study size (number analysed in review) | Sampling procedure | Number of cases (FTD) identified by reference standard | Index test/camera/interpretation/brain hypoperfusion | Reference standard/target condition | Sensitivity | Specificity |
| Prospective cohort studies |
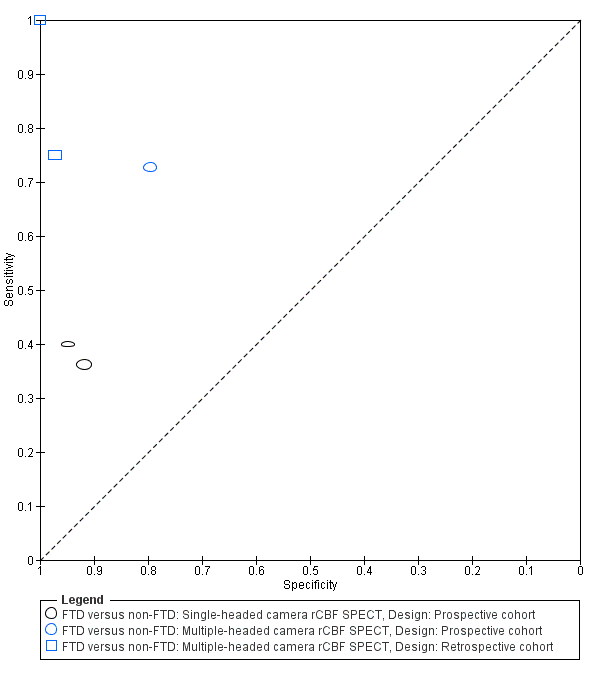
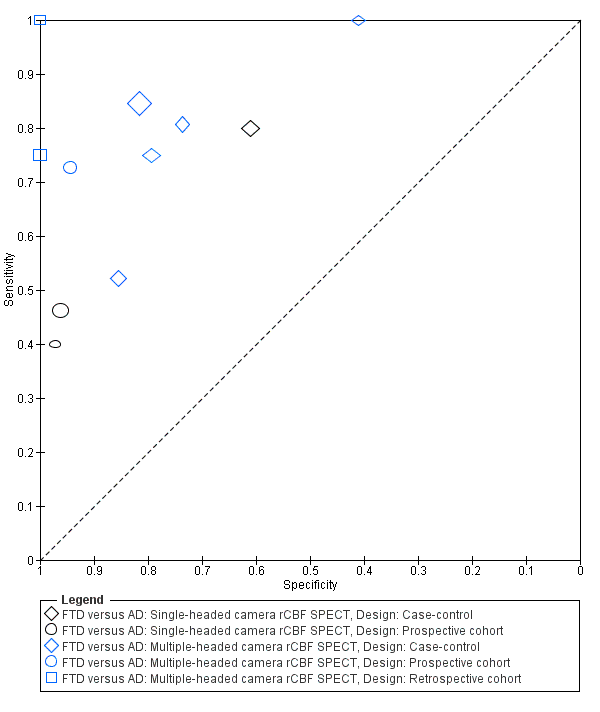
| Boutoleau‐ Bretonniere 2012 (France) | Neurological Memory Center attendees with clinically ambiguous dementias | 69 (19, 29 or 60) | Not reported | 11/60 | 99mTc‐HMPAO SPECT/multiple camera visual/frontal ± temporal | Clinical diagnosis FTD vs non‐FTD | 8/11 0.73 [0.39.0.94] | 39/49 0.80 [0.66‐0.90] |
| FTD vs AD | 8/11 0.73 [0.39, 0.94] | 17/18 0.94 [0.73, 1.00] |
| FTD vs VD | 8/11 0.73 [0.39, 0.94] | 6/8 0.75 [0.35, 0.97] |
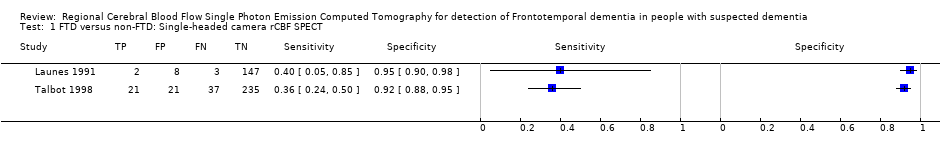
| Talbot 1998* (UK) | Memory clinic attendees with suspected dementia | 363 (158, 212 or 314) | Consecutive | 58 (FTD)/363 80 (FTD & PPA)/363 | 99mTc‐HMPAO SPECT*/single camera/visual/bilateral anterior+ and bilateral anterior & unilateral posterior++ | Clinical diagnosis FTD vs non‐FTD | 21/58 0.36+ [0.24,0.50] | 235/256 0.92+ [0.88, 0.95] |
| FTD vs AD | 37/80 0.46++ [0.35; 0.58] | 127/132 0.96++ [0.91; 0.99] |
| FTD vs VD | 37/80 0.46++ [0.35, 0.58] | 57/78 0.73++ [0.73, 0.62] |
| Launes 1991* (Finland) | Memory clinic attendees with suspected dementia | 160 (41 or 160) | Consecutive | 5/160 | 99mTc‐HMPAO* SPECT/single camera/visual/frontal bilateral or frontal‐temporal | Clinical diagnosis FTD vs non‐FTD | 2/5 0.40 [0.05,0.85] | 147/155 0.95 [0.90, 0.98] |
| FTD vs AD | 2/5 0.40 [0.05, 0.85] | 35/36 0.97 [0.85, 1.00] |
| FTD vs VD | 2/5 0.40 [0.05, 0.58] | 31/33 0.94 [0.80, 0.99] |
| Retrospective cohort studies with post‐mortem diagnosis |
| Read 1995** (USA) | AD/FTD/JCD/MID/LBD/hydrocephalus recruited from a chart review of the University‐based speciality dementia clinic | 27 (20 or 27) | Not reported | 7/27 | 99mTc‐HMPAO SPECT/double camera/visual/bilateral frontal | Pathological diagnosis FTD vs non‐FTD | 7/7 1.0 [0.59, 1.00] | 20/20 1.0 [0.83, 1.00] |
| FTD vs AD | 7/7 1.0 [0.59, 1.00] | 13/13 1.0 [0.75, 1.00] |
| Rollin‐Sillaire 2012 (France) | AD/DLB/FTD/VD/FTLD/bvFTD/SD/PPA/PSP/ CBD recruited from the caseload database of the University memory clinic | 48 (35 or 48) | Selected from initially consecutive sample | 12/48 | 99mTc‐HMPAO SPECT/multiple camera combined visual and semi‐quantitative/frontal | Pathological diagnosis FTD vs non‐FTD | 9/12 0.75 0.43, 0.95] | 35/36 0.97 [0.85,1.00] |
| FTD vs AD | 9/12 0.75 [0.43, 0.95] | 23/23 1.0 [0.85, 1.00] |
| Case‐control studies |
| Horn 2007 (France) | FTD/AD recruited from a number of hospitals | 173 (173) | Not consecutive or random | 91/173 | Tc‐99m ECD SPECT/multiple camera/visual/automatic classifier for whole brain | Clinical diagnosis FTD vs AD | 77/91 0.85 [0.76, 0.91] | 67/82 0.82 [0.72, 0.89] |
| Lipton 2004 (USA) | FTD/AD. Sources of recruitment not reported | 27 (23) | Not consecutive or random | 6/23 | Xenon or 99mTc‐HMPAO SPECT/multiple camera/combined visual and semiquantitative/global lateralisation | Pathological diagnosis FTD vs AD | 6/6 1.00 [0.54, 1.00] | 7/17 0.41 [0.18, 0.67] |
| McNeill 2007* (UK) | AD /FTD recruited from a tertiary care centre | 56 (56) | Not consecutive or random | 25/56 | 99mTc‐HMPAO SPECT*/single camera/combined visual and semiquantitative/bifrontal | Pathological diagnosis FTD vs AD | 20/25 0.80 [0.59, 0.93] | 19/31 0.61 [0.42, 0.78] |
| Nagao 2003 (Japan) | FTD/AD recruited from the Higher Brain Function Clinic for outpatients of the University Hospital + healthy controls (not included in the analysis) | 42 (42) | From data file of initially consecutive sample | 21/42 | 99mTc‐HMPAO SPECT multiple camera semiquantitative/Bifrontal+++ or bifrontal & posterior++++ | Clinical diagnosis FTD vs AD | 11/21 0.52+++ [0.30; 0.74] | 18/21 0.86+++ [0.64, 0.97] |
| FTD vs AD | 11/21 0.52++++ [0.30, 0.74] | 21/21 1.0++++ [0.62, 0.82] |
| Pickut 1996 (Belgium) | FTD/AD recruited from a memory clinic | 40 (40) | Not consecutive or random | 21/40 | 99mTc‐HMPAO SPECT multiple camera combined visual and semiquantitative/frontal and temporal | Clinical diagnosis FTD vs AD | 17/21 0.81 [0.58, 0.95] | 14/19 0.74 [0.49, 0.91] |
| Valotassiou 2012 (Greece) | FTLD (bvFTD; lvFTD; PNFA; CBD+PSP)/AD recruited from an outpatient memory clinic of the General Hospital 21 CBD+PSP participants not included in the analysis; they are not the patients with the target condition considered in the review | 112 (59 or 60 or 50) | Consecutive | 20 (bvFTLD)/59 21 (SD)/60 11 (PNFA)/50 | 99mTc‐HMPAO SPECT/multiple camera semiquantitative/brain Broadmann areas | Clinical diagnosis bvFTD vs AD | 15/20 0.75 [0.51, 0.91] | 31/39 0.79 0.64, 0.91] |
| SD vs AD | 17/21 0.81 [0.58, 0.95] | 20/39 0.51 [0.35, 0.68] |
| PNFA vs AD | 8/11 0.73 [0.39, 0.94] | 25/39 0.64 0.47, 0.79] |