Капнография в сравнении со стандартным мониторингом процедурной седации и анальгезии в отделениях неотложной помощи
Appendices
Appendix 1. CENTRAL (2016, Issue 8)
#1 MeSH descriptor: [Anesthesia, Intravenous] explode all trees
#2 MeSH descriptor: [Conscious Sedation] explode all trees
#3 MeSH descriptor: [Hypnotics and Sedatives] explode all trees
#4 anesthes* or ANAESTHES* or SEDATE* or SEDATION* or SEDATIVE* or HYPNOTIC*
#5 MeSH descriptor: [Capnography] explode all trees
#6 MeSH descriptor: [Respiratory Insufficiency] explode all trees
#7 MeSH descriptor: [Monitoring, Physiologic] explode all trees
#8 MeSH descriptor: [Anoxia] explode all trees
#9 MeSH descriptor: [Carbon Dioxide] explode all trees
#10 CAPNOGRAPH* or "Respiratory Insufficiency" or "respiratory failure" or ANOXIA* or HYPOXI* or "CARBON DIOXIDE"
#11 MeSH descriptor: [Emergency Medical Services] explode all trees
#12 MeSH descriptor: [Emergency Service, Hospital] explode all trees
#13 EMERGENC* or casualt*
#14 (#1 or #2 or #3 or #4)
#15 (#5 or #6 or #7 or #8 or #9 or #10)
#16 (#11 or #12 or #13)
#17 (#14 and #15 and #16)
Appendix 2. MEDLINE (via PubMed) (1980 to 9 August 2016)
1. "Anesthesia, Intravenous"[Mesh]
2. "Conscious Sedation"[Mesh]
3. "Hypnotics and Sedatives"[Mesh]
4. (anesthes*[TIAB] OR ANAESTHES*[TIAB] OR SEDATE*[TIAB] OR SEDATION*[TIAB] OR SEDATIVE*[TIAB] OR HYPNOTIC*[TIAB])
5. "Capnography"[Mesh]
6. "Respiratory Insufficiency"[Mesh]
7. "Monitoring, Physiologic"[Mesh]
8. "Anoxia"[Mesh]
9. "Carbon Dioxide"[Mesh])
10. (CAPNOGRAPH*[TIAB] OR "Respiratory Insufficiency"[TIAB] OR "respiratory failure"[tiab] OR ANOXIA*[TIAB] OR HYPOXI*[TIAB] OR "CARBON DIOXIDE"[TIAB])
11. "Emergency Medical Services"[Mesh]
12. "Emergency Service, Hospital"[Mesh]
13. (EMERGENC*[TIAB]) OR (casualt*[TIAB])
14. 1 or 2 or 3 or 4
15. 5 or 6 or 7 or 8 or 9 or 10
16. 11 or 12 or 13
17. 14 and 15 and 16
Appendix 3. Embase (via Ovid) (1980 to 9 August 2016)
1. exp intravenous anesthesia/
2. exp conscious sedation/
3. exp hypnotic sedative agent/
4. (anesthes* or anaesthes* or sedate* or sedation* or sedative* or hypnotic*).ab,ti.
5. exp capnography/
6. exp respiratory failure/
7. exp patient monitoring/
8. exp anoxia/
9. exp carbon dioxide/
10. (capnograph* or 'respiratory insufficiency' or anoxia* or hypoxi* or 'carbon dioxide' or 'respiratory failure').ab,ti.
11. exp emergency health service/ or (emergenc* or casualt*).ab,ti.
12. 1 or 2 or 3 or 4
13. 5 or 6 or 7 or 8 or 9 or 10
14. 11 and 12 and 13
Appendix 4. CINAHL (via EBSCOhost) (1980 to August 2016)
S1. (MH "Anesthesia, Intravenous")
S2. (MH "Hypnotics and Sedatives+")
S3. (MH "Conscious Sedation")
S4. (AB anesthes* OR TI anesthes* OR AB ANAESTHES* OR TI ANAESTHES* OR AB SEDATE* OR TI SEDATE* OR AB SEDATION* OR TI SEDATION* OR AB SEDATIVE* OR TI SEDATIVE* OR AB HYPNOTIC* OR TI HYPNOTIC*)
S5. (MH "Capnography")
S6. (MH "Respiratory Failure+")
S7. (MH "Monitoring, Physiologic+")
S8. (MH "Anoxia+")
S9. (MH "Carbon Dioxide")
S10. (TI CAPNOGRAPH* OR AB CAPNOGRAPH* OR TI "Respiratory Insufficiency" OR AB "Respiratory Insufficiency" OR TI "respiratory failure" OR AB "respiratory failure" OR TI ANOXIA* OR AB ANOXIA* OR TI HYPOXI* OR AB HYPOXI* OR TI "CARBON DIOXIDE" OR AB "CARBON DIOXIDE")
S11. (MH "Emergency Medical Services+")
S12. (MH "Emergency Service+")
S13. (TI casualt* OR AB casualt* OR TI EMERGENC* OR AB EMERGENC*)
S14. (S1 or S2 or S3 or S4)
S15. (S5 or S6 or S7 or S8 or S9 or S10)
S16. (S11 or S12 or S13)
S17. (S14 and S15 and S16)
Appendix 5. Article inclusion criteria form
THE USE OF CAPNOGRAPHY IN EMERGENCY DEPARTMENT PROCEDURAL SEDATION AND ANALGESIA: A SYSTEMATIC REVIEW CRITERIA FOR INCLUSION
Citation # ____________
Reviewer: BFW KDM
Please assess the following questions for each paper. WHEN YOU OBTAIN ONE X (NOT INCLUDED) STOP. The inclusion criteria are:
[1] DESIGN
-
[ ] Randomized controlled clinical trial OR Quazi randomized controlled clinical trial
-
[ ] Exclude all studies which are non‐experimental (cohort study, case‐control study, before‐after studies, case series, letters, reviews, etc.).
[2] POPULATIONS
-
[ ] Include if patients were selected due to undergoing PSA in an Emergency Department.
-
[ ] Exclude papers where the patients were classified as: inpatients, day surgery patients, or endoscopy suite patients.
[3] INTERVENTIONS
-
[ ] Include all primary research in which patients were monitored with capnography and standard monitoring (BP cuff, oxygen saturation, cardiac monitoring) versus standard monitoring only.
-
[ ] Exclude if capnography was not the primary research question.
[4] OUTCOMES
-
[ ] Must have clinically relative outcomes (i.e. airway intervention required, hypotension, oxygen desaturation, CO2 levels).
-
[ ] Exclude all studies that do not report clinically relevant outcomes.
[5] FINAL DECISION
-
[ ] INCLUDED (meets inclusion criteria above)
-
[ ] NOT INCLUDED
-
[ ] CAN'T TELL (need more information from authors to make decision
Appendix 6. Studies meeting inclusion criteria
| Unique ID | Study ID (Lead Author, year) | PMID | Source (Journal, conference, etc) |
| 1 | |||
| 2 | |||
| 3 |
Appendix 7. Data extraction form
| Review title or ID |
|
|
| Study ID(surname of first author and year first full report of study was published e.g. Smith 2001) |
|
|
| Report IDs of other reports of this study(e.g. duplicate publications, follow‐up studies) |
|
|
| Notes:
|
1. General Information
| Date form completed(dd/mm/yyyy) |
|
| Name/ID of person extracting data |
|
| Report title (title of paper/ abstract/ report that data are extracted from) |
|
| Report ID (ID for this paper/ abstract/ report) |
|
| Reference details |
|
| Report author contact details |
|
| Publication type (e.g. full report, abstract, letter) |
|
| Study funding sources (including role of funders) |
|
| Possible conflicts of interest (for study authors) |
|
| Notes: | |
3. Population and setting
|
| Description Include comparative information for each group (i.e. intervention and controls) if available | Location in text (pg/fig/table) | |
| Population description (from which study participants are drawn) |
|
| |
| Setting (including location and social context) |
|
| |
| Inclusion criteria |
|
| |
| Exclusion criteria |
|
| |
| Method of recruitment of participants |
|
| |
| Informed consent obtained | Yes No Unclear |
|
|
| Notes: | |||
4. Methods
| Descriptions as stated in report/paper
| Location in text (pg/fig/table) | ||
| Aim of study |
|
| |
| Design(e.g. parallel, crossover, cluster) |
|
| |
| Unit of allocation (by individuals, cluster/ groups or body parts) |
|
| |
| Start date |
| ||
| End date |
| ||
| Total study duration |
|
| |
| Ethical approval needed/ obtained for study | Yes No Unclear |
|
|
| Notes: | |||
6. Participants
Provide overall data and, if available, comparative data for each intervention or comparison group.
|
| Description as stated in report/paper
| Location in text (pg/fig/table) |
| Total no. randomized (or total pop. at start of study for NRCTs) |
|
|
| Clusters (if applicable, no., type, no. people per cluster) |
|
|
| Baseline imbalances |
|
|
| Withdrawals and exclusions (if not provided below by outcome) |
|
|
| Age |
|
|
| Sex |
|
|
| Race/Ethnicity |
|
|
| Severity of illness |
|
|
| Co‐morbidities |
|
|
| Other treatment received(additional to study intervention) |
|
|
| Other relevant sociodemographics |
|
|
| Subgroups measured |
|
|
| Subgroups reported |
|
|
| Notes: | ||
7. Intervention groups
Copy and paste table for each intervention and comparison group
Intervention Group 1
|
| Description as stated in report/paper
| Location in text (pg/fig/table) |
| Group name |
|
|
| No. randomized to group (specify whether no. people or clusters) |
|
|
| Theoretical basis(include key references) |
|
|
| Description(include sufficient detail for replication, e.g. content, dose, components) |
|
|
| Duration of treatment period |
|
|
| Timing(e.g. frequency, duration of each episode) |
|
|
| Delivery(e.g. mechanism, medium, intensity, fidelity) |
|
|
| Providers (e.g. no., profession, training, ethnicity etc. if relevant) |
|
|
| Co‐interventions |
|
|
| Economic variables |
|
|
| Resource requirements to replicate intervention (e.g. staff numbers, cold chain, equipment) |
|
|
| Notes: | ||
8. Outcomes
Oxygen Desaturation
|
| Description as stated in report/paper
| Location in text (pg/fig/table) | |
| Outcome name |
|
| |
| Time points measured |
|
| |
| Time points reported |
|
| |
| Outcome definition(with diagnostic criteria if relevant) |
|
| |
| Person measuring/reporting |
|
| |
| Unit of measurement (if relevant) |
|
| |
| Scales: upper and lower limits(indicate whether high or low score is good) |
|
| |
| Is outcome/tool validated? | Yes No Unclear |
|
|
| Imputation of missing data |
|
| |
| Assumed risk estimate (e.g. baseline or population risk noted in Background) |
|
| |
| Power |
|
| |
| Notes: | |||
Hypotension
|
| Description as stated in report/paper
| Location in text (pg/fig/table) | |
| Outcome name |
|
| |
| Time points measured |
|
| |
| Time points reported |
|
| |
| Outcome definition(with diagnostic criteria if relevant) |
|
| |
| Person measuring/reporting |
|
| |
| Unit of measurement (if relevant) |
|
| |
| Scales: upper and lower limits(indicate whether high or low score is good) |
|
| |
| Is outcome/tool validated? | Yes No Unclear |
|
|
| Imputation of missing data |
|
| |
| Assumed risk estimate (e.g. baseline or population risk noted in Background) |
|
| |
| Power |
|
| |
| Notes: | |||
Airway Intervention Performed
|
| Description as stated in report/paper
| Location in text (pg/fig/table) | |
| Outcome name |
|
| |
| Time points measured |
|
| |
| Time points reported |
|
| |
| Outcome definition(with diagnostic criteria if relevant) |
|
| |
| Person measuring/reporting |
|
| |
| Unit of measurement (if relevant) |
|
| |
| Scales: upper and lower limits(indicate whether high or low score is good) |
|
| |
| Is outcome/tool validated? | Yes No Unclear |
|
|
| Imputation of missing data |
|
| |
| Assumed risk estimate (e.g. baseline or population risk noted in Background) |
|
| |
| Power |
|
| |
| Notes: | |||
Emesis/Aspiration
|
| Description as stated in report/paper
| Location in text (pg/fig/table) | |
| Outcome name |
|
| |
| Time points measured |
|
| |
| Time points reported |
|
| |
| Outcome definition(with diagnostic criteria if relevant) |
|
| |
| Person measuring/reporting |
|
| |
| Unit of measurement (if relevant)
|
|
| |
| Scales: upper and lower limits(indicate whether high or low score is good) |
|
| |
| Is outcome/tool validated? | Yes No Unclear |
|
|
| Imputation of missing data |
|
| |
| Assumed risk estimate (e.g. baseline or population risk noted in Background) |
|
| |
| Power |
|
| |
| Notes: | |||
Recovery Time
|
| Description as stated in report/paper
| Location in text (pg/fig/table) | |
| Outcome name |
|
| |
| Time points measured |
|
| |
| Time points reported |
|
| |
| Outcome definition(with diagnostic criteria if relevant) |
|
| |
| Person measuring/reporting |
|
| |
| Unit of measurement (if relevant)
|
|
| |
| Scales: upper and lower limits(indicate whether high or low score is good) |
|
| |
| Is outcome/tool validated? | Yes No Unclear |
|
|
| Imputation of missing data |
|
| |
| Assumed risk estimate (e.g. baseline or population risk noted in Background) |
|
| |
| Power |
|
| |
| Notes: | |||
9. Results
Copy and paste the appropriate table for each outcome, including additional tables for each time point and subgroup as required.
Dichotomous outcome
|
| Description as stated in report/paper
| Location in text (pg/fig/table) | ||||
| Comparison |
|
| ||||
| Outcome |
|
| ||||
| Subgroup |
|
| ||||
| Timepoint |
|
| ||||
| Results | Intervention | Comparison |
| |||
| No. events | No. participants | No. events | No. participants | |||
|
|
|
|
| |||
| No. missing participants and reasons |
|
|
| |||
| No. participants moved from other group and reasons |
|
|
| |||
| Any other results reported |
|
| ||||
| Unit of analysis(by individuals, cluster/groups or body parts) |
|
| ||||
| Statistical methods used and appropriateness of these methods(e.g. adjustment for correlation) |
|
| ||||
| Reanalysis required?(specify) | Yes No Unclear |
|
| |||
| Reanalysis possible? | Yes No Unclear |
|
| |||
| Reanalysed results |
|
| ||||
| Notes: | ||||||
Continuous outcome
|
| Description as stated in report/paper
| Location in text (pg/fig/table) | ||||||||
| Comparison |
|
| ||||||||
| Outcome |
|
| ||||||||
| Subgroup |
|
| ||||||||
| Timepoint |
|
| ||||||||
| Post‐intervention or change from baseline? |
|
| ||||||||
| Result | Intervention | Comparison |
| |||||||
| Mean | SD (or other variance) | No. participants | Mean | SD (or other variance) | No. participants |
| ||||
|
|
|
|
|
|
| |||||
| No. missing participants and reasons |
|
|
| |||||||
| No. participants moved from other group and reasons |
|
|
| |||||||
| Any other results reported |
|
| ||||||||
| Unit of analysis (individuals, cluster/ groups or body parts) |
|
| ||||||||
| Statistical methods used and appropriateness of these methods(e.g. adjustment for correlation) |
|
| ||||||||
| Reanalysis required?(specify) | Yes No Unclear |
|
| |||||||
| Reanalysis possible? | Yes No Unclear |
|
| |||||||
| Reanalysed results |
|
| ||||||||
| Notes: |
| |||||||||
Other outcome
|
| Description as stated in report/paper
| Location in text (pg/fig/table) | ||||
| Comparison |
|
| ||||
| Outcome |
|
| ||||
| Subgroup |
|
| ||||
| Timepoint |
|
| ||||
| Results | Intervention result | SD (or other variance) | Control result | SD (or other variance) |
| |
|
|
|
|
| |||
| Overall results | SE (or other variance) | |||||
|
|
| |||||
| No. participants | Intervention | Control |
| |||
|
|
| |||||
| No. missing participants and reasons |
|
|
| |||
| No. participants moved from other group and reasons |
|
|
| |||
| Any other results reported |
|
| ||||
| Unit of analysis(by individuals, cluster/groups or body parts) |
|
| ||||
| Statistical methods used and appropriateness of these methods |
|
| ||||
| Reanalysis required?(specify) | Yes No Unclear |
|
| |||
| Reanalysis possible? | Yes No Unclear |
|
| |||
| Reanalysed results |
|
| ||||
| Notes: | ||||||
10. Applicability
| Have important populations been excluded from the study?(consider disadvantaged populations, and possible differences in the intervention effect) |
Yes No Unclear |
|
| Is the intervention likely to be aimed at disadvantaged groups?(e.g. lower socioeconomic groups) |
Yes No Unclear |
|
| Does the study directly address the review question? (any issues of partial or indirect applicability) |
Yes No Unclear |
|
| Notes: | ||
11. Other information
|
| Description as stated in report/paper
| Location in text (pg/fig/table) |
| Key conclusions of study authors |
|
|
| References to other relevant studies |
|
|
| Correspondence required for further study information(from whom, what and when) |
| |
| Notes: | ||
Appendix 8. Risk of bias assessment
| Domain | Risk of bias | Support for judgement
| Location in text (pg/fig/table) | ||
| Low risk | High risk | Unclear | |||
| Random sequence generation (selection bias) |
|
| |||
| Allocation concealment (selection bias) |
|
| |||
| Blinding of participants and personnel (performance bias) | Outcome group: All/
|
| |||
| Blinding of outcome assessment (detection bias) | Outcome group: All/
|
| |||
| Incomplete outcome data (attrition bias) |
|
| |||
| Selective outcome reporting? (reporting bias) |
|
| |||
| Other bias |
|
| |||
| Notes: | |||||

Search flow diagram.

Risk of bias summary: review authors' judgements about each risk of bias item for each included study.

Risk of bias graph: review authors' judgements about each risk of bias item presented as percentages across all included studies.
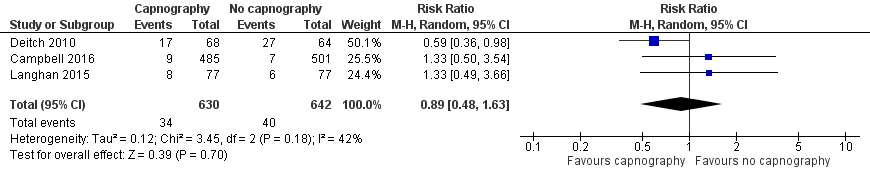
Forest plot of comparison: capnography plus standard monitoring versus standard monitoring, outcome: 1.1 oxygen desaturation.
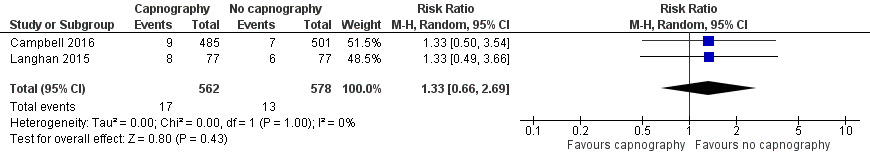
Forest plot of comparison: capnography plus standard monitoring) versus standard monitoring, outcome: 1.6 oxygen desaturation (sensitivity analysis based on definition of oxygen desaturation. Deitch 2010 excluded).

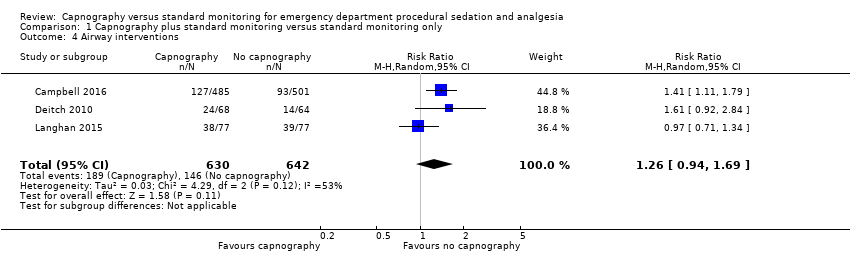
Forest plot of comparison: capnography plus standard monitoring versus standard monitoring, outcome: 1.7 airway interventions (subgroup analysis based on participant age).

Comparison 1 Capnography plus standard monitoring versus standard monitoring only, Outcome 1 Oxygen desaturation.

Comparison 1 Capnography plus standard monitoring versus standard monitoring only, Outcome 2 Hypotension.
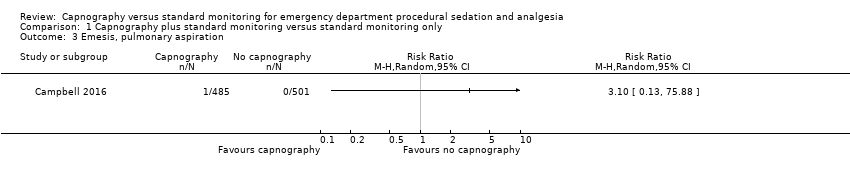
Comparison 1 Capnography plus standard monitoring versus standard monitoring only, Outcome 3 Emesis, pulmonary aspiration.
Comparison 1 Capnography plus standard monitoring versus standard monitoring only, Outcome 4 Airway interventions.
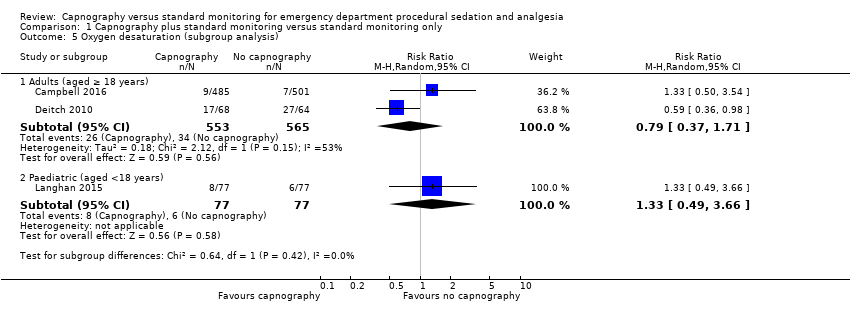
Comparison 1 Capnography plus standard monitoring versus standard monitoring only, Outcome 5 Oxygen desaturation (subgroup analysis).

Comparison 1 Capnography plus standard monitoring versus standard monitoring only, Outcome 6 Oxygen desaturation (sensitivity analysis), Deitch 2010 excluded.
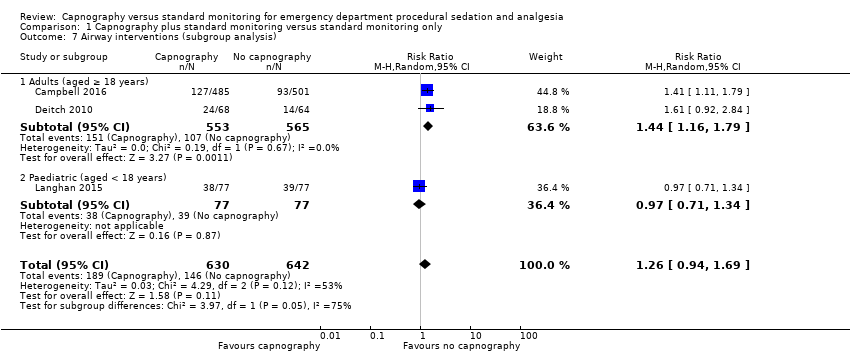
Comparison 1 Capnography plus standard monitoring versus standard monitoring only, Outcome 7 Airway interventions (subgroup analysis).
| Capnography and standard monitoring compared with standard monitoring for emergency department patients undergoing procedural sedation and analgesia | ||||||
| Patient or population: patients undergoing PSA Settings: emergency departments in North America Intervention: capnography and standard monitoring Comparison: standard monitoring | ||||||
| Outcomes | Illustrative comparative risks* (95% CI) | Relative effect | No of Participants | Quality of the evidence | Comments | |
| Assumed risk | Corresponding risk | |||||
| Standard monitoring | Capnography and standard monitoring | |||||
| Oxygen desaturation | Medium risk population | RR 0.89 (0.48 to 1.63) | 1272 participants (3 studies) | ⊕⊕⊕⊝ | ‐ | |
| 8 per 1000a | 7 per 1000 | |||||
| Hypotension | Medium risk population | RR 2.36 (0.98 to 5.69) | 986 participants (1 study) | ⊕⊕⊕⊝ | ‐ | |
| 6 per 1000c | 14 per 1000 | |||||
| Emesis, pulmonary aspiration | Medium risk population | RR 3.10 (0.13 to 75.88) | 986 participants (1 study) | ⊕⊕⊕⊝ | None of the studies recorded pulmonary aspiration events. | |
| 4 per 1000e | 4 per 1000 (1 to 304) | |||||
| Airway interventions | Medium risk population | RR 1.26 (0.94 to 1.69) | 1272 participants (3 studies) | ⊕⊕⊕⊝ | 2 studies included verbal/physical stimulation and supplemental oxygen as airway interventions (not consistent with our definition) but only reported total airway interventions (as dichotomous outcomes). | |
| 150 per 1000f | 189 per 1000 | |||||
| Airway interventions adult subgroup analysis (aged ≥ 18 years)h | Medium risk population | RR 1.44 (1.16 to 1.79) | 1118 participants (2 studies) | ⊕⊕⊕⊝ | ‐ | |
| 190 per 1000i | 274 per 1000 | |||||
| Recovery time | None of the studies reported recovery time. | |||||
| *The basis for the assumed risk (e.g. the median control group risk across studies) is provided in footnotes. The corresponding risk (and its 95% confidence interval) is based on the assumed risk in the comparison group and the relative effect of the intervention (and its 95% CI). CI: confidence interval; PSA: procedural sedation and analgesia; RR: risk ratio. | ||||||
| GRADE Working Group grades of evidence | ||||||
| aCampbell 2006; Cudny 2013. No study found to determine assumed risk for all‐age population, combined incidence of these studies used as a surrogate. Hypoxia defined as oxygen saturation < 90% at any time with baseline oxygen saturation ≥ 95% for Campbell 2006. Unknown definition of hypoxia for Cudny 2013. b Although statistics show low to moderate heterogeneity (I2 = 42%, P = 0.18), quality downgraded due to heterogeneity in study designs. cCampbell 2006. Hypotension defined as systolic blood pressure < 85 mmHg at any time with baseline systolic blood pressure ≥ 100 mmHg. d Downgraded for reporting bias in one study. eLanghan 2012. Used this paediatric study as surrogate for all ages population. g Downgraded due to significant heterogeneity (I2 = 53%). h The study by Campbell 2016 reported adults aged 16 years or greater whereas the study by Deitch 2010 reported adults aged greater than 18 years. j Downgraded due to heterogeneity in outcome definitions as well as small number of studies. | ||||||
| Outcome or subgroup title | No. of studies | No. of participants | Statistical method | Effect size |
| 1 Oxygen desaturation Show forest plot | 3 | 1272 | Risk Ratio (M‐H, Random, 95% CI) | 0.89 [0.48, 1.63] |
| 2 Hypotension Show forest plot | 1 | Risk Ratio (M‐H, Random, 95% CI) | Totals not selected | |
| 3 Emesis, pulmonary aspiration Show forest plot | 1 | Risk Ratio (M‐H, Random, 95% CI) | Totals not selected | |
| 4 Airway interventions Show forest plot | 3 | 1272 | Risk Ratio (M‐H, Random, 95% CI) | 1.26 [0.94, 1.69] |
| 5 Oxygen desaturation (subgroup analysis) Show forest plot | 3 | Risk Ratio (M‐H, Random, 95% CI) | Subtotals only | |
| 5.1 Adults (aged ≥ 18 years) | 2 | 1118 | Risk Ratio (M‐H, Random, 95% CI) | 0.79 [0.37, 1.71] |
| 5.2 Paediatric (aged <18 years) | 1 | 154 | Risk Ratio (M‐H, Random, 95% CI) | 1.33 [0.49, 3.66] |
| 6 Oxygen desaturation (sensitivity analysis), Deitch 2010 excluded Show forest plot | 2 | 1140 | Risk Ratio (M‐H, Random, 95% CI) | 1.33 [0.66, 2.69] |
| 7 Airway interventions (subgroup analysis) Show forest plot | 3 | 1272 | Risk Ratio (M‐H, Random, 95% CI) | 1.26 [0.94, 1.69] |
| 7.1 Adults (aged ≥ 18 years) | 2 | 1118 | Risk Ratio (M‐H, Random, 95% CI) | 1.44 [1.16, 1.79] |
| 7.2 Paediatric (aged < 18 years) | 1 | 154 | Risk Ratio (M‐H, Random, 95% CI) | 0.97 [0.71, 1.34] |