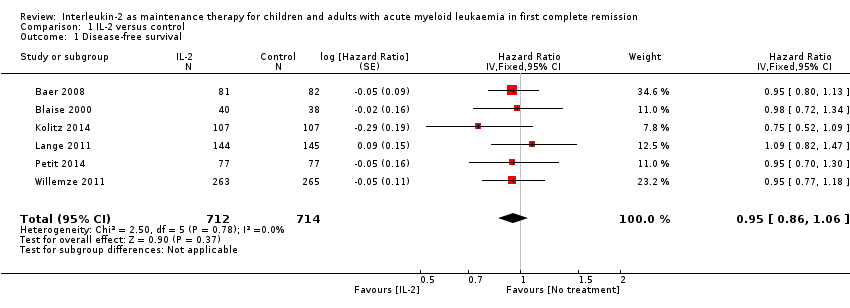
| 1 Disease‐free survival Show forest plot | 6 | 1426 | Hazard Ratio (Fixed, 95% CI) | 0.95 [0.86, 1.06] |
|
| 2 Overall survival Show forest plot | 5 | 1355 | Hazard Ratio (Fixed, 95% CI) | 1.05 [0.95, 1.16] |
|
| 3 Adverse events Show forest plot | 1 | | Risk Ratio (M‐H, Fixed, 95% CI) | Subtotals only |
|
| 3.1 Hypersensitivity | 1 | 528 | Risk Ratio (M‐H, Fixed, 95% CI) | 17.13 [0.99, 295.26] |
| 3.2 Fatigue | 1 | 528 | Risk Ratio (M‐H, Fixed, 95% CI) | 7.05 [2.13, 23.36] |
| 3.3 Rigor/Chills | 1 | 528 | Risk Ratio (M‐H, Fixed, 95% CI) | 33.25 [2.01, 551.36] |
| 3.4 Arthralgia/Myalgia | 1 | 528 | Risk Ratio (M‐H, Fixed, 95% CI) | 19.14 [1.12, 327.24] |
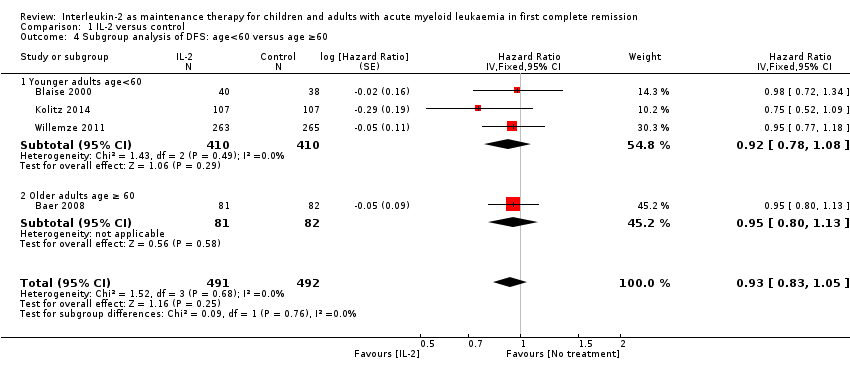
| 4 Subgroup analysis of DFS: age<60 versus age ≥60 Show forest plot | 4 | 983 | Hazard Ratio (Fixed, 95% CI) | 0.93 [0.83, 1.05] |
|
| 4.1 Younger adults age<60 | 3 | 820 | Hazard Ratio (Fixed, 95% CI) | 0.92 [0.78, 1.08] |
| 4.2 Older adults age ≥ 60 | 1 | 163 | Hazard Ratio (Fixed, 95% CI) | 0.95 [0.80, 1.13] |
| 5 Subgroup analysis of DFS: >20% blasts versus ≥30% blasts Show forest plot | 5 | 1348 | Hazard Ratio (Fixed, 95% CI) | 0.95 [0.85, 1.06] |
|
| 5.1 >20% blasts | 2 | 368 | Hazard Ratio (Fixed, 95% CI) | 0.86 [0.68, 1.09] |
| 5.2 ≥30% blasts | 3 | 980 | Hazard Ratio (Fixed, 95% CI) | 0.98 [0.86, 1.10] |
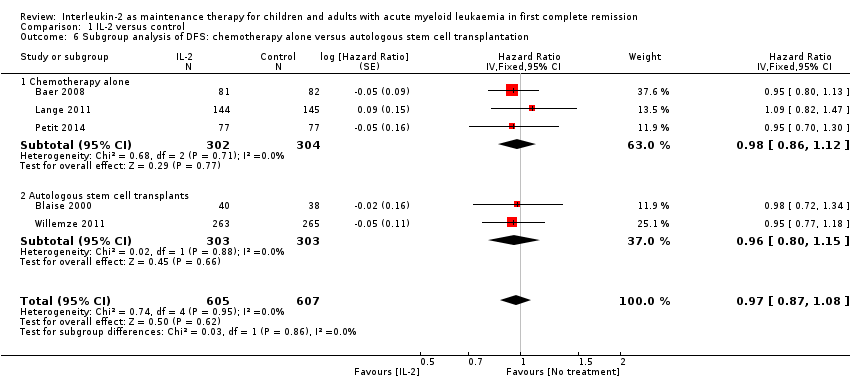
| 6 Subgroup analysis of DFS: chemotherapy alone versus autologous stem cell transplantation Show forest plot | 5 | 1212 | Hazard Ratio (Fixed, 95% CI) | 0.97 [0.87, 1.08] |
|
| 6.1 Chemotherapy alone | 3 | 606 | Hazard Ratio (Fixed, 95% CI) | 0.98 [0.86, 1.12] |
| 6.2 Autologous stem cell transplants | 2 | 606 | Hazard Ratio (Fixed, 95% CI) | 0.96 [0.80, 1.15] |
| 7 Subgroup analysis of DFS: IL‐duration ≤3months versus >3 months Show forest plot | 6 | 1426 | Hazard Ratio (Fixed, 95% CI) | 0.95 [0.86, 1.06] |
|
| 7.1 IL‐2 duration ≤3 months | 4 | 744 | Hazard Ratio (Fixed, 95% CI) | 0.95 [0.84, 1.08] |
| 7.2 IL‐2 duration >3 months | 2 | 682 | Hazard Ratio (Fixed, 95% CI) | 0.95 [0.80, 1.14] |
| 8 Subgroup analysis of OS: age<60 versus age ≥60 Show forest plot | 3 | 905 | Hazard Ratio (Fixed, 95% CI) | 0.99 [0.86, 1.14] |
|
| 8.1 Younger adults age <60 | 2 | 742 | Hazard Ratio (Fixed, 95% CI) | 0.93 [0.77, 1.11] |
| 8.2 Older adults age ≥ 60 | 1 | 163 | Hazard Ratio (Fixed, 95% CI) | 1.11 [0.87, 1.40] |
| 9 Subgroup analysis of OS: >20% blasts versus ≥30% blasts Show forest plot | 5 | 1355 | Hazard Ratio (Fixed, 95% CI) | 1.05 [0.95, 1.16] |
|
| 9.1 >20% blasts | 1 | 214 | Hazard Ratio (Fixed, 95% CI) | 0.88 [0.68, 1.13] |
| 9.2 ≥30% blasts | 4 | 1141 | Hazard Ratio (Fixed, 95% CI) | 1.09 [0.97, 1.22] |
| 10 Subgroup analysis of OS: IL‐duration ≤3months versus 12 months Show forest plot | 5 | 1355 | Hazard Ratio (Fixed, 95% CI) | 1.05 [0.95, 1.16] |
|
| 10.1 IL‐duration ≤3months | 3 | 666 | Hazard Ratio (Fixed, 95% CI) | 1.00 [0.85, 1.18] |
| 10.2 IL‐duration 12 months | 2 | 689 | Hazard Ratio (Fixed, 95% CI) | 1.08 [0.95, 1.24] |
| 11 Subgroup analysis of OS: chemotherapy alone versus autologous stem cell transplantation Show forest plot | 4 | 1141 | Hazard Ratio (Fixed, 95% CI) | 1.09 [0.97, 1.22] |
|
| 11.1 Chemotherapy alone | 3 | 613 | Hazard Ratio (Fixed, 95% CI) | 1.11 [0.98, 1.26] |
| 11.2 Autologous stem cell transplants | 1 | 528 | Hazard Ratio (Fixed, 95% CI) | 0.98 [0.76, 1.26] |
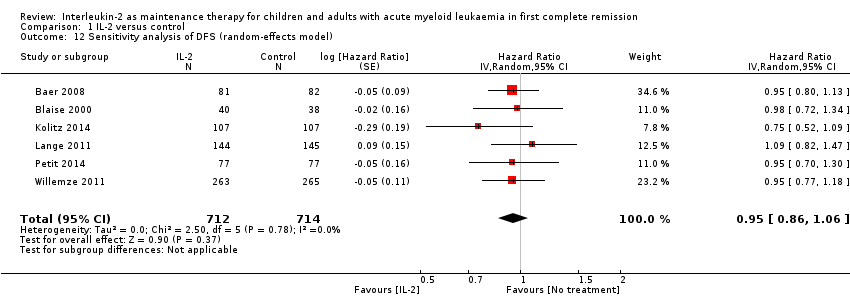
| 12 Sensitivity analysis of DFS (random‐effects model) Show forest plot | 6 | 1426 | Hazard Ratio (Random, 95% CI) | 0.95 [0.86, 1.06] |
|
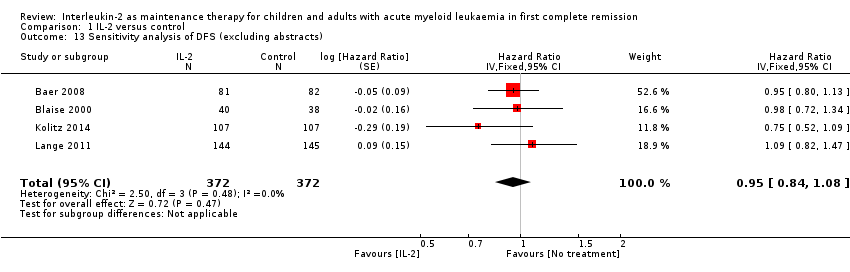
| 13 Sensitivity analysis of DFS (excluding abstracts) Show forest plot | 4 | 744 | Hazard Ratio (Fixed, 95% CI) | 0.95 [0.84, 1.08] |
|
| 14 Sensitivity analysis of OS (excluding abstracts) Show forest plot | 4 | 821 | Hazard Ratio (Fixed, 95% CI) | 1.06 [0.95, 1.19] |
|
| 15 Sensitivity analysis of OS (random‐effects model) Show forest plot | 5 | 1355 | Hazard Ratio (Random, 95% CI) | 1.05 [0.95, 1.16] |
|
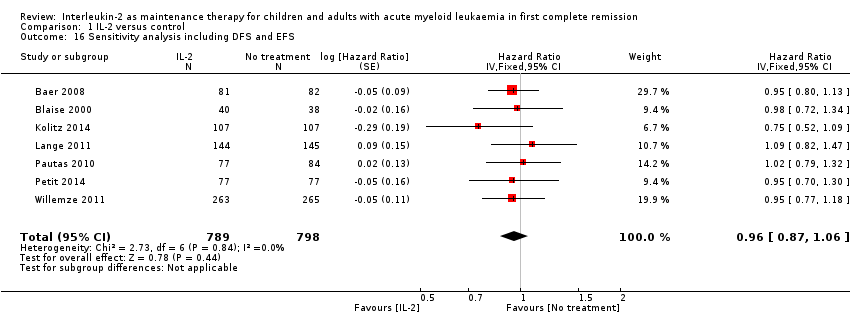
| 16 Sensitivity analysis including DFS and EFS Show forest plot | 7 | 1587 | Hazard Ratio (Fixed, 95% CI) | 0.96 [0.87, 1.06] |
|