School‐based education programmes for the prevention of unintentional injuries in children and young people
Abstract
Background
Unintentional injuries are the leading cause of death in children aged four to 18 years and are a major cause of ill health. The school setting offers the opportunity to deliver preventive interventions to a large number of children and has been used to address a range of public health problems. However, the effectiveness of the school setting for the prevention of different injury mechanisms in school‐aged children is not well understood.
Objectives
To assess the effects of school‐based educational programmes for the prevention of injuries in children and evaluate their impact on improving children's safety skills, behaviour and practices, and knowledge, and assess their cost‐effectiveness.
Search methods
We ran searches on the following electronic databases to 26 June 2015: PsycINFO, British Education Index (BEI), Education Resources Information Center (ERIC), Applied Social Sciences Index and Abstracts (ASSIA), International Bibliography of the Social Sciences (IBSS), Sociological Abstracts; Latin America and the Caribbean database (LILACS), together with several sources of grey literature. The Cochrane Injuries Information Specialist ran searches, to August 2013, on the Groups Specialised Register (SR‐INJ), the Cochrane Central Register of Controlled Trials (CENTRAL) and other Cochrane Library databases, Ovid MEDLINE, Embase, CINAHL and the ISI Web of Science. In keeping with Cochrane standards, along with Cochrane Injuries' Information Specialist we ran an update search prior to publication (September and October 2016). We have screened the results and placed any relevant studies in the Characteristics of studies awaiting classification section of this review.These will be incorporated in the next version of this review, as appropriate.
Selection criteria
We included randomised controlled trials (RCTs), non‐randomised controlled trials (non‐RCTs), and controlled before‐and‐after (CBA) studies that evaluated school‐based educational programmes aimed at preventing a range of injury mechanisms. The primary outcome was self‐reported or medically attended unintentional (or unspecified intent) injuries and secondary outcomes were observed safety skills, observed behaviour, self‐reported behaviour and safety practices, safety knowledge, and health economic outcomes. The control groups received no intervention, a delayed injury‐prevention intervention or alternative school‐based curricular activities. We included studies that aimed interventions at primary or secondary prevention of injuries from more than one injury mechanism and were delivered, in part or in full, in schools catering for children aged four to 18 years.
Data collection and analysis
We used standard methodological procedures expected by Cochrane. Two review authors identified relevant trials from title and abstracts of studies identified in searches and two review authors extracted data from the included studies and assessed risk of bias. We grouped different types of interventions according to the outcome assessed and the injury mechanism targeted. Where data permitted, we performed random‐effects meta‐analyses to provide a summary of results across studies.
Main results
The review included 27 studies reported in 30 articles. The studies had 73,557 participants with 12 studies from the US; four from China; two from each of Australia, Canada, the Netherlands and the UK; and one from each of Israel, Greece and Brazil. Thirteen studies were RCTs, six were non‐RCTs and eight were CBAs. Of the included studies, 18 provided some element of the intervention in children aged four to 11 years, 17 studies included children aged 11 to 14 years and nine studies included children aged 14 to 18 years.
The overall quality of the results was poor, with the all studies assessed as being at high or unclear risks of bias across multiple domains, and varied interventions and data collection methods employed. Interventions comprised information‐giving, peer education or were multi‐component.
Seven studies reported the primary outcome of injury occurrence and only three of these were similar enough to combine in a meta‐analysis, with a pooled incidence rate ratio of 0.73 (95% confidence interval (CI) 0.49 to 1.08; 2073 children) and substantial statistical heterogeneity (I2 = 63%). However, this body of evidence was low certainty, due to concerns over this heterogeneity (inconsistency) and imprecision. This heterogeneity may be explained by the non‐RCT study design of one of the studies, as a sensitivity analysis with this study removed found stronger evidence of an effect and no heterogeneity (I2 = 0%).
Two studies report an improvement in safety skills in the intervention group. Likewise, the four studies measuring observed safety behaviour reported an improvement in the intervention group relative to the control. Thirteen out of 19 studies describing self‐reported behaviour and safety practices showed improvements, and of the 21 studies assessing changes in safety knowledge, 19 reported an improvement in at least one question domain in the intervention compared to the control group. However, we were unable to pool data for our secondary outcomes, so our conclusions were limited, as they were drawn from highly diverse single studies and the body of evidence was low (safety skills) or very low (behaviour, safety knowledge) certainty. Only one study reported intervention costs but did not undertake a full economic evaluation (very low certainty evidence).
Authors' conclusions
There is insufficient evidence to determine whether school‐based educational programmes can prevent unintentional injuries. More high‐quality studies are needed to evaluate the impact of educational programmes on injury occurrence. There is some weak evidence that such programmes improve safety skills, behaviour/practices and knowledge, although the evidence was of low or very low quality certainty. We found insufficient economic studies to assess cost‐effectiveness.
PICO
Plain language summary
School‐based education programmes for the prevention of unintentional injuries in children and young people
About the review question
We looked at the evidence on the effects of programmes in schools that aimed to prevent accidental injuries in children and young people. Preventing injuries in children is important because injuries are common in this age group and the effects on the child and the family can be severe and long‐lasting. Schools are potentially a good setting within which to provide education programmes aimed at preventing such injuries occurring. However, it has not been examined in detail whether this works or not. We found 27 studies to help us address this question.
Background
We wanted to discover whether teaching children in school education about injury prevention resulted in them having fewer injuries, improved their knowledge about injury prevention and improved their behaviours in relation to safety. We also wanted to assess whether this type of approach was good value for money.
Study characteristics
The evidence is current to June 2015. It includes the results from 27 studies of 73,557 children. It included boys and girls aged four to 18. The studies compared injury prevention education with either the usual curriculum or an alternative programme unrelated to injuries. The studies we included were aimed at preventing a range of injuries. We excluded programmes that focused on just one cause of injury. The review measured the effects of the educational programmes on the occurrence of injuries in children, their safety skills, behaviour and knowledge. The review also looked at whether school‐based approaches are good value for money.
Key results
Only a few studies reported the effect on injury occurrence in children and so these effects were inconclusive. This does not mean that school‐based programmes are ineffective but rather that more evidence is needed. The review did find evidence that school‐based injury prevention education programmes can improve children's safety skills, safety behaviours and safety knowledge. However, the evidence was inconsistent, with some studies showing a positive effect and others showing no effect. Only one study reported on how cost‐effective school‐based programmes were and so again it is difficult to draw conclusions from this evidence alone.
Quality of the evidence
The studies were generally of poor quality for all the measurements of effectiveness of the programmes but particularly for behaviour and knowledge. This is because information about how the study was conducted was not usually reported very clearly in the study reports or there were major flaws in the way that the studies were undertaken. More research is needed that is of higher quality.
Authors' conclusions
Summary of findings
| School injury prevention programmes compared to controls for the prevention of unintentional injuries in children and young people | ||||||
| Patient or population: children and young people | ||||||
| Outcomes | Anticipated absolute effects* (95% CI) | Relative effect | No of participants | Quality of the evidence | Comments | |
| Injury rate, adjusted for clustering, with control | Injury rate, adjusted for clustering, with School injury prevention programmes | |||||
| Self‐reported medically or non‐medically attended unintentional injuries or injuries with an unspecified intent (injury rates adjusted for clustering) | 367 per 1000 person‐years | 243 per 1000 person‐years | Rate ratio 0.76 | 12,977 (2073 person‐years adjusted for clustering) | ⊕⊕⊝⊝ | We excluded 4 studies from the meta‐analysis due to varied interventions (e.g. sports, agriculture or risk‐taking injury prevention). Their findings were consistent with the meta‐analysis studies. |
| Safety skills | Both studies found an improvement in observed safety skills (Kendrick 2007 ‐ fire and burn prevention skills: odds ratio 8.93 (95% CI 1.67 to 47.78, P = 0.01); Frederick 2000 ‐ basic life support skills, P < 0.005 for assessment of danger, responsiveness and circulation). | ‐ | 1751 | ⊕⊕⊝⊝ | Interventions and safety skills observed were varied in these 2 studies. | |
| Behaviour | All 4 studies (5 articles) reported that observed safety behaviour showed evidence of improved practices and 13/19 studies describing self‐reported behaviour reported improved practices. | ‐ | 52,950 | ⊕⊝⊝⊝ | Behaviours included safety equipment wearing, road risk‐taking behaviour, agriculture and sports‐related injury behaviours. | |
| Safety knowledge | Of the 21 studies assessing changes in safety knowledge, 19 reported an improvement in at least 1 question domain in the intervention compared to the control group. | ‐ | 55,732 (9 RCTs, 5 non‐RCTs, 7 CBA) | ⊕⊝⊝⊝ | Outcomes included a wide range of knowledge testing instruments and topics. | |
| Cost‐effectiveness | For every 1 Chinese Yuan spent, 13.90 was saved (cost:benefit ratio 1:13.9) | ‐ | 4639 | ⊕⊝⊝⊝ | Only 1 study reported economic outcomes and should, therefore, be interpreted with caution. | |
| CI: confidence interval; CBA: controlled before‐and‐after study; RCT: randomised controlled trial; non‐RCT: non‐randomised controlled trial. | ||||||
| GRADE Working Group grades of evidence | ||||||
| 1 Downgraded twice because of inconsistency as the I2 = 63%, indicating substantial heterogeneity and because there was imprecision in the results (the rate ratio was 0.76 but the confidence intervals spanned 1). Two of the studies were RCTs with a low risk of bias. 2 Downgraded twice because of a serious risk of bias (one of the two studies was a CBA resulting in selection biases relating to which schools participated in studies) and inconsistency, which was rated as serious because the two studies had different intervention types with different outcome measures. Imprecision was serious as there were wide confidence intervals in one of the two included studies, as well as a paucity of data. However, the effect sizes were classed as large as there was a nearly nine times greater odds of fire and burn prevention skills in the Risk Watch programme (Kendrick 2007), and 33% greater skills assessment in the Injury Minimisation Programme for Schools (IMPS) relating to assessment of danger (Frederick 2000). 3 Downgraded three times because 10 studies were CBA or non‐RCT design with high risk of selection bias of included schools, there was serious inconsistency in methods of collecting data and intervention types, and this may have contributed to the wide range of effect sizes and directions seen (no effect or some effect), There was often wide confidence intervals in results presented. 4 Downgraded three times because 11 studies were CBA or non‐RCT design with high risk of selection bias of included schools; there was serious inconsistency in knowledge tested, questionnaire designs and methods of collecting data, a wide range of intervention types and pedagogical approaches and this may have contributed to the wide range of effect sizes and directions seen (no effect or some effect). Results were presented in a way that often made precision difficult to compare. 5 Downgraded three times because this was one study, limited in applicability with high or unclear risk of bias across multiple domains. | ||||||
Background
Description of the condition
Unintentional injuries are the leading cause of death in children aged four to 18 years in the European region (Sethi 2008), and are a major cause of ill health. In 2013, injuries accounted for 13% of all disability‐adjusted life years globally and 4.9% in the UK among children aged four to 14 years (Haagsma 2016). The financial costs associated with treating injuries in children are also significant. Injuries from road traffic crashes alone are estimated to cost between 0.3% and 5% of Gross National Product (ranging from USD72 million in Vietnam to USD358 million in the US (Jacobs 2008)). Therefore, understanding the clinical and cost‐effectiveness of preventive interventions is an important issue.
The risk of harm from unintentional injuries varies by socioeconomic group, age, gender, culture and ethnicity, and location (Grossman 2000; Laflamme 2010; Mulvaney 2012). Child‐ and family‐related risk factors for injury in school‐aged children include male sex (Cooper 2004; Laing 1999; Lalloo 2003); psychological, behavioural and risk‐taking behaviour problems (Sindelar 2004; Wazana 1997); having a large number of siblings (Bijur 1988; Mytton 2009); and having a young mother (Ekeus 2004; Mytton 2009). Falls are consistently the most common mechanism of injury, but injury mechanisms change with age (Grossman 2000; Mytton 2009).
Injuries can be classified according to intent (i.e. intentional or unintentional), injury type (e.g. head injury, burn injury), mechanism (e.g. burns due to fire, hot liquid scald or chemicals), location (e.g. playground, home, road), activity (e.g. sports or occupational injury) and risk factors (e.g. age, sex, risk‐taking behaviour). This review set out to explore interventions aimed at preventing a range of injury mechanisms, defined as two or more mechanisms aligned to International Classification of Disease codes (ICD10). We excluded studies of single injury mechanisms because there are already existing reviews on, for example, cycle helmet wearing (Owen 2011), and we did not want to duplicate these results. In addition, there are a range of school‐based programmes provided in different countries that address preventing injuries from a range of mechanisms, such as Think First For Kids, Risk Watch, Injury Minimization Programme for Schools (IMPS), Skills for Preventing Injury in Youth (SPIY), Injury Prevention Through Physical Education (I‐Play), Learn Not To Burn, Gearing Everyone to Act Health Each Day (Go AHEAD) and Agricultural Disability Awareness and Risk Education programme (AgDARE) etc. and there is a lack of systematic review evidence on how effective they are. Given that these programmes may be more complex and time and resource intensive than programmes aimed at preventing injuries from single injury mechanisms, it is important to review their effectiveness.
Description of the intervention
Schools provide a unique setting in which to deliver health improvement interventions (Poland 2000). They have been used to help reduce smoking (Thomas 2006) and violence (Mytton 2006) and increase positive behaviours such as cycle helmet wearing (Owen 2011). Community‐based injury prevention interventions aimed at children and young people often include a school component (Klassen 2000; Towner 2002).
School‐based programmes may include primary, secondary or tertiary injury prevention education. Primary prevention is aimed at preventing the situation in which the injury can occur, while secondary prevention aims to minimise the risk of injury should an event occur with the potential to cause injury. Examples of secondary prevention include implementing a fire evacuation plan in the event of a house fire or wearing a cycle helmet to minimise head trauma in the event of a collision. Tertiary prevention minimises the harm incurred from an injury that has happened, for example, through first aid treatment. This review focusses on primary and secondary prevention programmes aimed at preventing a range of unintentional injury mechanisms. Therefore, we excluded studies evaluating programmes aimed at preventing single injury mechanisms. It includes interventions delivered in full or in part in a school as part of the curriculum, by a teacher or other people with an injury prevention role and both single component or multi‐component interventions.
How the intervention might work
Behaviour change theory may help us understand how injury prevention interventions could work. Behaviours related to injury prevention include risk‐taking behaviour (e.g. diving into water of unknown depth), adoption of safety practices (e.g. storage of medicines out of reach of children) and efforts to improve safety skills (e.g. safe cycling or road crossing), Glanz and Rimer described three levels of influence on injury prevention which may each lend themselves to different prevention approaches (Glanz 1997). The three levels are: intrapersonal level, whereby interventions may target self‐efficacy, knowledge, skills and beliefs; interpersonal level, where prevention may target social/peer influences and norms and community level which may include interventions involving the environment or settings and policies (Glanz 1997). Theories of behaviour change that relate to the individual level (intrapersonal and interpersonal) that have been most widely applied to injury prevention include the health belief model (Janz 1984), the theory of reasoned action/planned behaviour (Fishbein 1975), the stages of change/trans‐theoretic model (Prochaska 1983), and applied behavioural analysis (Hovell 1986). For injury prevention, the health belief model might relate to belief about susceptibility to injury occurrence, severity of injury outcomes and competence to intervene. The theory of reasoned action could be used to describe prevention activity in relation to the intention to undertake action and how this and consequences relate to subjective norms. The stages of change model described how people move through a dynamic process of pre‐contemplation through to contemplation, action and maintenance and might, for example, inform strategies such as education to move people into contemplation and then skill development as people move into the action stage. Finally, applied behavioural theories describe how behaviours are learned and influenced by reinforcement activity, feedback and punishment.
However, no one theory of behaviour change underpins injury prevention and not all studies used theory‐based interventions. Tobler provided a useful classification scheme for different types of school‐based drug prevention programmes that might also be usefully applied to safety interventions (Tobler 1986). Components of this classification were: imparting knowledge about the topic; developing self‐esteem, attitudes and beliefs; developing generic skills, for example, communication and assertiveness skills that then help to establish desirable behaviours; developing specific skills; diversionary activities, for example, organised sports; and finally, 'other' types of programmes, such as those that involve parents. School‐based educational programmes aimed at preventing unintentional injuries may work in a similar way to those described by Tobler. For example, they may help to improve knowledge and awareness of high‐risk activities, or help children choose play and leisure activities that are within their physical abilities and competence. In addition, such programmes may provide participants with the skills to identify and avoid high‐risk situations or behaviours. Targeting children's attitudes and behaviour as a mechanism for changing family behaviour has also been used successfully, for example, in the use of motor vehicle restraints (Klassen 2000).
Injury prevention interventions, targeting the individual level factors, may be delivered using different learning approaches and theories. These may utilise different formats, such as during classes, via homework or correspondence with parents, or making use of larger‐scale approaches such as campaigns. One systematic review by Bruce found successful school‐based programmes to include group sessions with multiple interactive learning tools, for example, group activities and opportunities for the children to develop and practice problem‐solving skills rather than content‐specific knowledge alone (Bruce 2005). There is also good evidence that whole‐school approaches to health improvement are effective. In one Cochrane Review of the effectiveness of the World Health Organization's Health Promoting school framework for improving health and well‐being of students, Langford found that school‐based educational interventions can have a positive impact on improving some health outcomes such as body mass index, physical activity, fruit and vegetable intake, and likelihood of being bullied (Langford 2014). The framework includes activities relating to the school curriculum, ethos or environment of the school (or both), and engagement with families or communities (or both). Not all health outcomes were improved but the review was unable to determine whether certain components of the framework were more important than others due to the designs of the included studies. Although not specifically included in this review, injury prevention may work well in the context of a whole‐school approach to health and well‐being.
To pull together the theory of how injury prevention education interventions might work and the outcomes we chose to review, we have developed a logic model as seen in Figure 1.

Why it is important to do this review
A previous review of safety education, showed that education delivered in a range of settings including, but not limited to schools, can improve children’s knowledge, risk‐taking behaviour and skills (Mulvaney 2012). However, an assessment of impact on injury rates was not possible owing to the lack of relevant studies identified in the searches. In addition, this review was restricted to English language only and a limited number of databases were searched. We sought to re‐assess the current evidence of effectiveness of school‐based injury prevention programmes, building upon this previous review by updating and expanding the literature searches. In doing this we sought to provide evidence for those working with children in schools and those commissioning preventative interventions to make informed decisions about the effectiveness of school‐based injury prevention programmes. This is important to ensure appropriate resource allocation because schools have to prioritise health‐promoting activities, given restrictions on time and resources.
Objectives
To assess the effects of school‐based educational programmes for the prevention of injuries in children and evaluate their impact on improving children's safety skills, behaviour and practices, and knowledge, and assess their cost‐effectiveness.
Methods
Criteria for considering studies for this review
Types of studies
We included individually and cluster randomised controlled trials (RCTs), non‐randomised controlled trials (non‐RCTs) and controlled before‐and‐after studies (CBAs) (prospective studies with a concurrent control group allocated using a non‐random method and with a baseline period of assessment of outcomes). The control groups received no intervention, a delayed injury‐prevention intervention or alternative school‐based curricular activities.
For the economic analysis, we used any health economic data that was reported as part of an included study to undertake an economic analysis of the cost‐effectiveness of that programme.
Types of participants
The provision of state‐based preschool education and the age of compulsory school entry (normally four to seven years of age), varies across the world. For this review, we included interventions for non‐institutionalised children aged four to 18 years who are enrolled in a formal state‐based or independent/private school.
Types of interventions
Interventions included in the review were primary and secondary injury prevention interventions aimed at reducing a range of unintentional injury mechanisms. We excluded studies of a single injury type, such as burns, but included prevention aimed a range of mechanisms (e.g. burns from flames, chemical burns, electrical burns or scalds). We excluded studies that only focused on one these, for example chemical burns. Similarly, we included studies aimed at preventing spinal cord injuries by addressing issues such as driving fast in a car, diving into shallow water or not wearing protective equipment, but excluded studies preventing spinal cord injury through just one cause (e.g. a sport such as horse riding or rugby). Interventions had to be delivered in full or in part in schools catering for children aged four to 18 years and delivered by a teacher or other people with an injury prevention role. The latter included children trained to deliver injury prevention interventions to their peers in a school setting. We chose schools as the primary setting as many programmes are currently delivered in schools (e.g. Think First For Kids, Risk Watch, IMPS, etc.) and we wanted to evaluate the evidence to inform decisions about provision of such programmes in schools.
We excluded the following types of interventions:
-
tertiary prevention interventions aimed at minimising the harm associated with injury occurrence (e.g. first aid interventions);
-
quaternary prevention interventions aimed at preventing repeat injuries;
-
interventions to prevent intentional injuries (e.g. violence in the home and weapon safety);
-
any intervention where the prevention of a range of injury mechanisms was not stated in the aims or objectives or that involved a multiple intervention programme in which it was not possible to isolate the relative effects of the injury prevention component;
-
interventions aimed at preventing a single injury mechanism (e.g. cycling injury or drowning);
-
community or national campaigns supported by classroom or school activities but where the school was not the primary delivery setting (e.g. community‐based media campaigns);
-
interventions delivered in youth clubs, social clubs or parenting groups;
-
interventions delivered without a school‐based component (e.g. the Lifeskills "Learning for Living" (Lamb 2006) intervention which was delivered in a safety education 'village' outside the school setting).
Types of outcome measures
Primary outcomes
-
Self‐reported medically or non‐medically attended unintentional injuries or injuries with an unspecified intent. In addition, included self‐reports ascertained from parents/carers, teachers or other people considered to be in loco parentis. Medically attended injuries were those in which the participants sought healthcare advice by attendance at either a primary or secondary healthcare setting.
Secondary outcomes
-
Observed safety skills (e.g. exiting a building during a fire drill).
-
Observed behaviour (e.g. number of children observed wearing seat belts on journeys to and from school).
-
Self‐reported behaviour and safety practices (e.g. self‐reported wearing of helmet when cycling).
-
Safety knowledge (e.g. knowing to check water depth before diving into a pool).
-
Health economic outcomes, including cost per unit of utility gained (e.g. incremental cost per quality‐adjusted life year), cost per unit of effect (e.g. cost per injury prevented), cost as measured in inputs and benefits (e.g. costs not incurred by preventing injuries or cost:benefit ratios) or resource costs.
Search methods for identification of studies
We did not restrict the search by date, language, geographical location or publication status. However, we limited the population group to children aged four to 18 years.
Electronic searches
We ran searches in August 2013 and updated these to the end of June 2015. We conducted a final pre‐publication search in September and October 2016, and placed potential studies for this search in the Characteristics of studies awaiting classification section of this review.
The search strategies were devised using terms to identify injuries, safety skills, behaviour and practices, safety knowledge and health economic outcomes in RCTs, non‐RCTs and CBAs.
Early search (August 2013)
The Cochrane Injuries Group's Information Specialist searched the following databases (to August 2013, in the first instance):
-
Cochrane Injuries Group Specialised Register (SR‐INJ) (29 August 2013);
-
Cochrane Central Register of Controlled Trials (CENTRAL) (2013, Issue 7);
-
Health Economics Evaluations Database (HEED) (29 August 2013);
-
Health Technology Assessment Database (HTA) (the Cochrane Library) (2013, Issue 7);
-
Ovid MEDLINE(R), Ovid MEDLINE(R) In‐Process & Other Non‐Indexed Citations, Ovid MEDLINE(R) Daily and Ovid OLDMEDLINE(R) 1946 to 29 August 2013;
-
Embase and Embase Classic (Ovid) (1947 to 28 August 2013);
-
CINAHL Plus (EBSCO) (1939 to 29 August 2013);
-
ISI Web of Science: Science Citation Index Expanded (1970 to 29 August 2013);
-
ISI Web of Science: Conference Proceedings Citation Index‐Science (1990 to 29 August 2013);
-
ISI Web of Science: Social Sciences Citation Index (1970 to 29 August 2013);
-
ISI Web of Science: Conference Proceedings Citation Index ‐ Social Sciences & Humanities (1990 to 29 August 2013);
-
ZETOC (1993 to 29 August 2013).
Update search (September 2016): CENTRAL, MEDLINE, Embase and SR‐INJ
The earlier search strategies (to August 2013) were designed to favour specificity (precision) over sensitivity (recall of all potentially relevant reports) to reduce screening vast numbers of irrelevant records. This is an appropriate strategy when designing a search based on population and intervention alone (i.e. without applying a controlled trials filter). When searches were re‐run in September 2016, the Cochrane Injuries Group's Information Specialist validated these earlier searches by checking the provenance of included studies (to date) and information contained in the title, abstract and subject heading fields, of study reports in CENTRAL, MEDLINE and Embase. This exercise revealed that less than 65% of the included studies were retrieved using the earlier search strategies (figure adjusted for three included studies not indexed on these databases). As a consequence of this validation exercise, searches of the Cochrane Injuries Group's Specialised Register, CENTRAL, MEDLINE and Embase were appended as appropriate. Searches were also back‐dated where necessary.
A further citation search on the Web of Science Core Collection was also conducted on 16 September 2016.
Searches performed by the Cochrane Injuries Group's Information Specialist (all years) are presented in Appendix 1.
The review authors also conducted their own, extensive searches on a host of other social science and educational resources to compliment Cochrane Methodological Expectations of Cochrane Intervention Reviews (MECIR) conduct standard (c24). For further details of MECIR, see editorial‐unit.cochrane.org/mecir.
Complimentary searches conducted by the review author team
We ran additional searches on the following databases and websites, with prepublication searches run on the 14 October 2016 (Appendix 2).
Databases:
-
LILACS (Latin American and Caribbean Health Sciences Literature database) (1982 to June 2015 and then updated to 14 October 2016);
-
PsycINFO (Ovid) (1806 to June 2015 and then updated to 14 October 2016);
-
ERIC (Educational Resources Information Centre) (1966 to June 2015 and then updated to 14 October 2016);
-
Dissertation Abstracts Online (1988 to June 2015 and then updated to September 2016);
-
IBSS (International Bibliography of Social Sciences) (1951 to June 2015 and then updated to 14 October 2016);
-
BEI (British Education Index) (1975 to June 2015 and then updated to 14 October 2016);
-
ASSIA (1987 to June 2015 and then updated to 14 October 2016);
-
CSA Sociological Abstracts (1952 to June 2015 and then updated to 14 October 2016);
-
Injury Prevention Web (up to June 2015 and then updated to 14 October 2016);
-
SafetyLit (US) (1998 to June 2015 and then updated to 14 October 2016);
-
EconLit (US) (1886 to June 2015 and then updated to 14 October 2016);
-
Public Affairs Information Service (PAIS) International (1972 to June 2015 and then updated to 14 October 2016).
Websites:
-
UK Clinical Research Network Study Portfolio (public.ukcrn.org.uk/search/; searched June 2015 and then updated to 14 October 2016);
-
Open Grey (System for Information on Grey Literature in Europe) (1980 to June 2015 and then updated to 14 October 2016);
-
Index to Theses in the UK and Ireland (up to June 2015 and then updated to 14 October 2016);
-
Bibliomap EPPI‐Centre database of health promotion research (to June 2015 and then updated to 14 October 2016);
-
TRoPHI (The Trials Register of Promoting Health Interventions) (2004 to June 2015 and then updated to 14 October 2016);
-
International Trial registries (to 14 October 2016);
-
WHO International Clinical Trials Registry Platform (ICTRP) (to 14 October 2016).
Searching other resources
We handsearched the reference lists of all included studies as well as published reviews. We searched the Internet for grey literature using the search engines Google Scholar (scholar.google.co.uk/).
We also handsearched the following sources:
-
abstracts from the first to the eleventh World Conference on Injury Prevention and Safety Promotion (1989 to 2012);
-
Table of contents of the journal Injury Prevention from 1995 to August 2016.
Data collection and analysis
Selection of studies
For the results of the electronic database searches, two review authors (shared between EO, MC, JMM, JW and MB) independently judged the eligibility of studies by assessing the titles and abstracts. We obtained full‐text reports of all potentially relevant studies and independently assessed whether each met the predefined inclusion criteria. For those articles where no abstract was available and it was unclear from the title alone whether they met the eligibility criteria, we retrieved full‐text reports. If there was disagreement between review authors, then they consulted a third review author (shared between EO, MC, MW and JMM). Where English translations for studies published in another language were not available at the screening stage, we obtained full‐text reports and a native speaker translated the manuscript into English. Reasons for excluding full text reports are detailed in the Characteristics of excluded studies table. Two review authors conducted handsearches separately (shared between BB, CM, MC and EO) and identified potentially relevant abstracts. They resolved any disagreements through discussions with a third review author (MW).
Data extraction and management
Two review authors (shared between DK, MW, CM, EO, MC, JS, JMM and JW) independently extracted data from studies meeting the inclusion criteria and entered them onto a piloted data extraction form, after which they compared results. The two review authors agreed any discrepancies through discussion and if necessary referred the issue to a third review author (shared between MW and EO).
We extracted the following data:
-
details of participants (e.g. age, gender, school setting (type, level and location of the school));
-
details of intervention (e.g. types of injury mechanisms targeted, the setting of the intervention (i.e. if there was also a non‐school component)), who delivered the intervention and the nature of the comparison group;
-
details of the primary and secondary outcomes and the time over which outcomes were measured. For the primary outcome, we extracted the number of injury events and person time at risk at baseline and after the intervention.
Where necessary, we requested missing data from study authors. We were alert to multiple reports relating to the same individual studies to avoid duplication of results when extracting the data. We translated studies published in a language other than English prior to data extraction and assessment of bias.
Assessment of risk of bias in included studies
Two review authors independently assessed the quality of included studies using Cochrane's tool for assessing the risk of bias (shared between DK, MW, CM, EO, MC, JS, JMM and JW). For RCTs, we assessed the risk of bias for: random sequence generation, allocation concealment, blinding of participants and personnel, blinding of outcome assessment, completeness of data, selective reporting and other sources of bias. For non‐RCTs, we omitted random sequence generation and allocation concealment, but included an assessment of allocation to intervention/control (selection bias), and risk of bias due to confounding. We categorised studies as high risk of bias due to insufficient blinding if they did not describe the blinding (because participants were likely to know whether they received the intervention or not) or if they explicitly stated that they did not blind. We categorised studies at high risk of bias due to confounding if they did not adjust for confounding in the analysis. The review authors completed 'risk of bias' tables based on these criteria, incorporating a judgement of low risk, high risk or unclear risk with explanations provided for each judgement made. We compared our assessments, and if the review pair was unable to reach a consensus, they consulted a third review author.
Measures of treatment effect
We entered details of included papers into Review Manager 5 for analysis (RevMan 2014). We described self‐reported medically or non‐medically attended injuries in terms of injury incidence rates or as the percentage of children reporting at least one injury, depending on how injuries were measured and reported in the included studies. Dichotomous outcomes (e.g. observed safety skills) were described in terms of the proportion or differences in proportions exhibiting that outcome. We described observed or self‐report safety knowledge in terms of test scores, percentages or differences in percentages with 95% confidence intervals (CI). We presented continuous outcomes as means or standardised means or differences in means with standard deviations (SD).
Unit of analysis issues
Where studies were allocated by cluster (e.g. by school or by class), we adjusted the number of injury events and the number of person‐years for clustering by dividing by the inflation factor. We calculated the inflation factor using the formula described by Donner and Klar (equation 5.6) (Donner 2000), with a coefficient of variation of 0.25 as described by Hayes and Bennett (Hayes 1999). For studies with more than two arms, we only included those arms that met inclusion criteria in the review. None of the studies included in the meta‐analysis had more than two arms.
Dealing with missing data
We based meta‐analyses on complete‐case data. Primary outcome data were missing for 2.3% of intervention group participants, but the percentage of participants missing data in the control group was unreported in the study by Lu 2000. Primary outcome data were missing for 13% of the intervention group and 4% of the control group in the study by Wang 2009. Zhao 2006 presented data on the number of students in the academic year and the number of injuries before and after the intervention and there did not appear to be any missing data for the intervention or control group. None of the three studies included in the meta‐analysis presented any analyses to allow assessment of whether data were missing at random or not.
Assessment of heterogeneity
We assessed heterogeneity by using the I2 statistic and the Chi2 test for heterogeneity where a P value of less than 0.1 indicated statistically significant heterogeneity. We explored heterogeneity in effect sizes by a sensitivity analysis excluding one non‐RCT from the meta‐analysis. We based our interpretation of the I2 statistic on categories outlined in the Cochrane Handbook for Systematic Reviews of Interventions.
Assessment of reporting biases
We did not assess reporting bias using funnel plots or Egger's test as there were only three studies in the meta‐analysis.
Data synthesis
We estimated a pooled incidence rate ratio (IRR) for studies reporting injury incidence rates using a random‐effects model, and included both RCTs (Wang 2009; Zhao 2006) and non‐RCTs (Lu 2000) in the meta‐analysis. We considered the non‐RCT similar enough to the RCTs in terms of populations, interventions and outcomes to combine in a meta‐analysis. There was no information provided about how the intervention and control groups were selected in the non‐RCT, but baseline injury incidence rates were similar (517/1000 person‐years in intervention group and 527/1000 person‐years in control group). Use of adjusted effect sizes and standard errors (SE) is recommended for non‐RCTs (Higgins 2011), therefore, we included in the meta‐analysis follow‐up injury incidence rates adjusted for baseline injury incidence rates, for the non‐RCT. We performed this adjustment using Poisson regression with a time by treatment arm interaction term. This represented the ratio of:
(intervention arm follow‐up injury incidence rate/intervention arm baseline injury incidence rate)/(control arm follow‐up injury incidence rate/control arm baseline injury incidence rate).
We used the regression coefficient (and the SE) for this ratio of rates as the effect size (and the SE) in the meta‐analysis adjusted for baseline injury incidence rates. Therefore, this analysis required the use of the generic inverse variance method,
In one study the control group received education on the prevention of pneumonia, iron‐deficiency anaemia, rickets and common communicable diseases (Zhao 2006). The other two studies had control groups which did not receive any intervention (Lu 2000; Wang 2009). As it is unlikely that the disease prevention education provided in the study by Zhao would impact on injury incidence, we considered it appropriate to include this study in the meta‐analysis.
We synthesised the remaining studies in a narrative review. We grouped studies by outcome, and subdivided into different injury mechanisms.
Subgroup analysis and investigation of heterogeneity
We planned to undertake three subgroup analyses if numbers allowed. These would have been: child age/school setting and type of intervention such as information giving, skills training, multi‐component and duration of the intervention. However, we did not undertake these subgroup analyses due to the small number of studies included in the meta‐analysis.
Sensitivity analysis
We performed sensitivity analysis by excluding the single non‐RCT from the meta‐analysis.
Presentation of main results
We developed a 'Summary of findings' tables for all outcomes of this review (medically or non‐medically attended injury rates, observed safety skills, observed behaviour and self‐reported behaviour and safety practices, safety knowledge and cost‐effectiveness) following GRADE methods (GRADE 2004), and using GRADEpro GDT software. We assessed the quality of the body of evidence with reference to the overall risk of bias of the included studies, inconsistency of the results (heterogeneity), indirectness of the evidence (generalisability), precision of the estimates, risk of publication bias, whether the effect size was large, whether there was plausible confounding and dose response effects. We assessed the quality of the body of evidence for each comparison and main outcome as high, moderate, low or very low.
Results
Description of studies
Results of the search
We retrieved 8180 articles from the electronic searches and 247 from other sources (to 26 June 2015). After duplicates were removed, we screened 6930 articles for inclusion in the review. We assessed 265 full‐text articles for eligibility and retrieved 218 in full (47 were unobtainable). Of these 265, we excluded 188 because the study design (70 articles), participants (two articles), intervention (115 articles) or outcomes measured (one article) did not meet the inclusion criteria of the review (see Characteristics of excluded studies table). We included 27 studies reported in 30 articles in the review and described these in the Characteristics of included studies table. We contacted 22 authors for further information and included seven of these reports in the review. Of the seven included in the review, four authors responded. We have included a table of all authors that responded in the Acknowledgements.
Results are summarised in summary of findings Table for the main comparison. Three articles report the same agriculture injury prevention study outcomes (Reed 2001). Two further articles reported the same study but different outcomes (Collard 2010). Three studies were translated from Chinese by a native speaker who is also an epidemiologist (Lu 2000; Wang 2009; Zhao 2006). The 27 studies included approximately 73,557 participants (range from 63 to 18,876 participants).
Along with Cochrane Injuries' Information Specialist, we ran a pre‐publication search in September and October 2016, retrieving a further 3834 records (making 12,014 in total). We have screened these and placed any relevant studies in the Characteristics of studies awaiting classification table (n=48). These studies will be incorporated into the next version of this review as appropriate.
The process of study selection is documented in Figure 2.
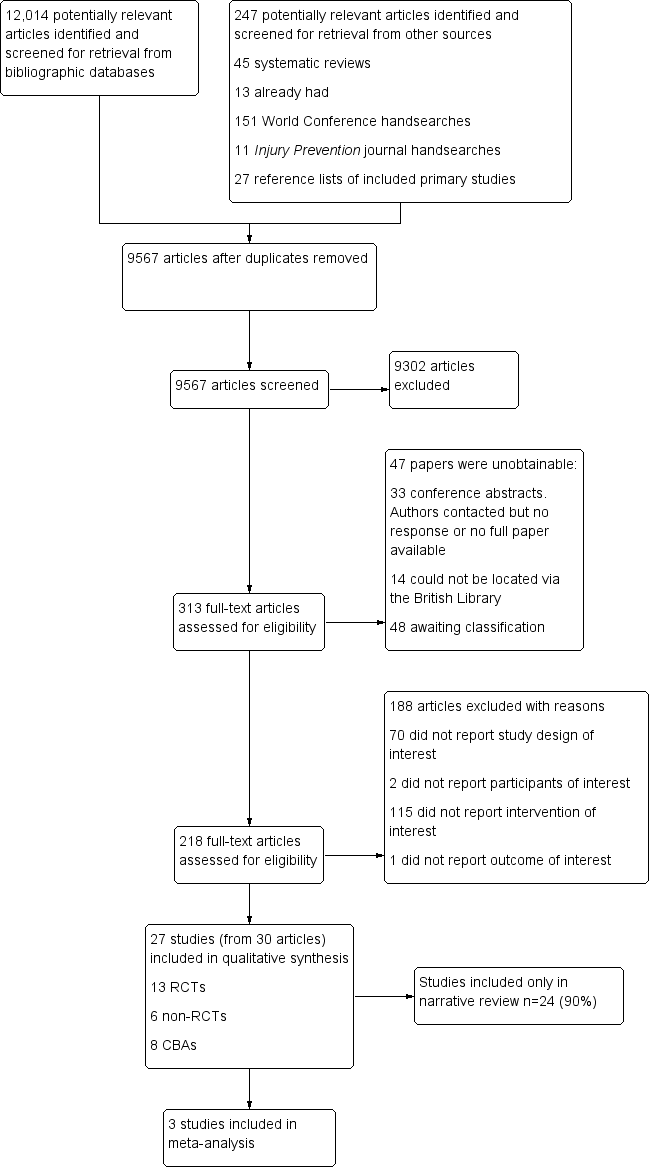
PRISMA flow chart detailing the process of study selection for all studies included in the review. CBA: controlled before‐and‐after study; RCT: randomised controlled trial.
Included studies
See Characteristics of included studies table.
Types of studies
Thirteen studies (48%) were RCTs (Campbell 2001; Carmel 1991; Chapman 2013; Collard 2010; Falavigna 2012; Grant 1992; Gresham 2001; Kendrick 2007; Lee 2004; Reed 2001; Sun 2004; Wang 2009; Zhao 2006), six (22%) were non‐RCTs (Cook 2006; Martinez 1996; Morrongiello 1998; Richards 1991; Terzidis 2007; Twisk 2013), and eight (30%) were CBAs (Azeredo 2003; Buckley 2010; Frederick 2000; Greene 2002; Lu 2000; Wesner 2003; Wright 1995; Zirkle 2005). Twelve studies (41%) were from the US (Azeredo 2003; Campbell 2001; Cook 2006; Grant 1992; Greene 2002; Gresham 2001; Lee 2004; Martinez 1996; Reed 2001; Richards 1991; Wright 1995; Zirkle 2005); four (14%) were from China (Lu 2000; Sun 2004; Wang 2009; Zhao 2006); two (7%) were from each of Australia (Buckley 2010; Chapman 2013), Canada (Morrongiello 1998; Wesner 2003), the Netherlands (Collard 2010; Twisk 2013), and the UK (Frederick 2000; Kendrick 2007); and one from each of Israel (Carmel 1991), Greece (Terzidis 2007), and Brazil (Falavigna 2012).
Types of participants and settings
The school year/age nomenclature varied across studies from different countries. Some studies provided the exact ages of participants, age ranges or mean ages. However, other studies referred only to the year group or grade (e.g. year one to 13 in the UK or grade one to 12 in Australia, Canada, China and the US, with some systems also having a foundation or kindergarten stage) or else they referred to the type of school (e.g. primary, middle and high).
Eighteen studies (67%) provided some element of the intervention in children aged four to 11 years (Azeredo 2003; Carmel 1991; Collard 2010; Cook 2006; Frederick 2000; Grant 1992; Greene 2002; Gresham 2001; Kendrick 2007; Lu 2000; Morrongiello 1998; Richards 1991; Sun 2004; Terzidis 2007; Twisk 2013; Wesner 2003; Zhao 2006; Zirkle 2005), 17 (63%) included children aged 11 to 14 years (Buckley 2010; Campbell 2001; Carmel 1991; Chapman 2013; Collard 2010; Cook 2006; Falavigna 2012; Lee 2004; Lu 2000; Martinez 1996; Reed 2001; Sun 2004; Terzidis 2007; Twisk 2013; Wang 2009; Wright 1995; Zhao 2006), and nine (33%) included children aged 14 to 18 years (Buckley 2010; Campbell 2001; Lee 2004; Lu 2000; Martinez 1996; Reed 2001; Terzidis 2007; Wang 2009; Wright 1995) (see Table 1). Some studies included children in more than one of these groups. Only three (11%) studies included children from all age groups (Lu 2000; Sun 2004; Terzidis 2007).
| Study ID | Age (years) | |||||||||||||
| 4/5 | 5/6 | 6/7 | 7/8 | 8/9 | 9/10 | 10/11 | 11/12 | 12/13 | 13/14 | 14/15 | 15/16 | 16/17 | 17/18 | |
| ‐ | ● | ● | ● | ● | ● | ● | ‐ | ‐ | ‐ | ‐ | ‐ | ‐ | ‐ | |
| ‐ | ‐ | ‐ | ‐ | ‐ | ‐ | ‐ | ‐ | ‐ | ‐ | ● | ‐ | ‐ | ‐ | |
| ‐ | ‐ | ‐ | ‐ | ‐ | ‐ | ‐ | ● | ● | ● | ● | ● | ‐ | ‐ | |
| ‐ | ‐ | ‐ | ‐ | ‐ | ‐ | ● | ● | ● | ● | ‐ | ‐ | ‐ | ‐ | |
| ‐ | ‐ | ‐ | ‐ | ‐ | ‐ | ‐ | ‐ | ‐ | ● | ‐ | ‐ | ‐ | ‐ | |
| ‐ | ‐ | ‐ | ‐ | ‐ | ‐ | ● | ● | ‐ | ‐ | ‐ | ‐ | ‐ | ‐ | |
| ‐ | ‐ | ‐ | ‐ | ● | ● | ● | ● | ‐ | ‐ | ‐ | ‐ | ‐ | ‐ | |
| ‐ | ‐ | ‐ | ‐ | ‐ | ‐ | ‐ | ‐ | ‐ | ‐ | ‐ | ● | ‐ | ‐ | |
| ‐ | ‐ | ‐ | ‐ | ‐ | ‐ | ● | ‐ | ‐ | ‐ | ‐ | ‐ | ‐ | ‐ | |
| ‐ | ‐ | ‐ | ‐ | ● | ● | ‐ | ‐ | ‐ | ‐ | ‐ | ‐ | ‐ | ‐ | |
| ‐ | ‐ | ● | ● | ● | ‐ | ‐ | ‐ | ‐ | ‐ | ‐ | ‐ | ‐ | ‐ | |
| ‐ | ‐ | ● | ● | ● | ‐ | ‐ | ‐ | ‐ | ‐ | ‐ | ‐ | ‐ | ‐ | |
| ‐ | ‐ | ● | ● | ● | ● | ‐ | ‐ | ‐ | ‐ | ‐ | ‐ | ‐ | ‐ | |
| ‐ | ‐ | ‐ | ‐ | ‐ | ‐ | ‐ | ‐ | ‐ | ‐ | ● | ● | ● | ‐ | |
| ‐ | ‐ | ● | ● | ● | ● | ● | ● | ● | ● | ● | ● | ‐ | ‐ | |
| ‐ | ‐ | ‐ | ‐ | ‐ | ‐ | ‐ | ‐ | ‐ | ‐ | ‐ | ● | ● | ● | |
| ‐ | ‐ | ‐ | ● | ● | ● | ‐ | ‐ | ‐ | ‐ | ‐ | ‐ | ‐ | ‐ | |
| ‐ | ‐ | ‐ | ‐ | ‐ | ‐ | ‐ | ‐ | ‐ | ‐ | ● | ● | ‐ | ‐ | |
| ● | ● | ● | ● | ● | ‐ | ‐ | ‐ | ‐ | ‐ | ‐ | ‐ | ‐ | ‐ | |
| ‐ | ‐ | ● | ● | ● | ● | ● | ● | ● | ● | ‐ | ‐ | ‐ | ‐ | |
| ‐ | ● | ● | ● | ● | ● | ● | ● | ● | ● | ● | ● | ● | ‐ | |
| ‐ | ‐ | ‐ | ‐ | ‐ | ‐ | ● | ● | ● | ‐ | ‐ | ‐ | ‐ | ‐ | |
| ‐ | ‐ | ‐ | ‐ | ‐ | ‐ | ‐ | ‐ | ● | ● | ● | ‐ | ‐ | ‐ | |
| ‐ | ● | ● | ● | ● | ● | ● | ‐ | ‐ | ‐ | ‐ | ‐ | ‐ | ‐ | |
| ‐ | ‐ | ‐ | ‐ | ‐ | ‐ | ‐ | ● | ● | ● | ● | ‐ | ‐ | ‐ | |
| ‐ | ‐ | ‐ | ● | ● | ● | ● | ● | ● | ‐ | ‐ | ‐ | ‐ | ‐ | |
| ‐ | ‐ | ● | ● | ● | ● | ● | ‐ | ‐ | ‐ | ‐ | ‐ | ‐ | ‐ | |
‐: not applicable; ●: age range covered.
Nineteen (70%) studies specified that boys and girls were included in the analysis (Buckley 2010; Campbell 2001; Carmel 1991; Chapman 2013; Collard 2010; Cook 2006; Falavigna 2012; Gresham 2001; Kendrick 2007; Lee 2004; Martinez 1996; Morrongiello 1998; Reed 2001; Terzidis 2007; Twisk 2013; Wang 2009; Wesner 2003; Wright 1995; Zirkle 2005), but the remaining eight (30%) did not make this clear (Azeredo 2003; Frederick 2000; Grant 1992; Greene 2002; Lu 2000; Richards 1991; Sun 2004; Zhao 2006). A total of 13 (48%) studies specified that the intervention was delivered in state‐funded schools (Buckley 2010; Campbell 2001; Carmel 1991; Collard 2010; Grant 1992; Kendrick 2007; Lee 2004; Morrongiello 1998; Richards 1991; Sun 2004; Wang 2009; Wesner 2003; Wright 1995), three (11%) were in both state and independent schools (Azeredo 2003; Cook 2006; Falavigna 2012), and 11 (41%) did not specify the type of school (Chapman 2013; Frederick 2000; Greene 2002; Gresham 2001; Lu 2000; Martinez 1996; Reed 2001; Terzidis 2007; Twisk 2013; Zhao 2006; Zirkle 2005). Five (5%) programmes were only in urban schools (Carmel 1991; Falavigna 2012; Gresham 2001; Kendrick 2007; Sun 2004) and three (9%) were only in a rural school (Grant 1992; Lee 2004; Reed 2001). For the others, three (9%) were based in a rural and urban setting (Azeredo 2003; Richards 1991; Zhao 2006); one (4%) was in urban and suburban areas (Collard 2010); one (4%) was in urban, suburban and rural areas (Wright 1995); and for 14 (52%) studies details of the setting were not provided (Buckley 2010; Campbell 2001; Chapman 2013; Cook 2006; Frederick 2000; Greene 2002; Lu 2000; Martinez 1996; Morrongiello 1998; Terzidis 2007; Twisk 2013; Wang 2009; Wesner 2003; Zirkle 2005).
Types of interventions
All studies included primary prevention in the intervention. In addition, 16 (59%) studies also had secondary prevention components (Azeredo 2003; Cook 2006; Falavigna 2012; Grant 1992; Greene 2002; Gresham 2001; Kendrick 2007; Lee 2004; Martinez 1996; Morrongiello 1998; Reed 2001, Richards 1991; Wesner 2003; Wright 1995; Zhao 2006; Zirkle 2005), and three (11%) had elements of tertiary prevention (e.g. first aid) but these components were not included in the analysis (Buckley 2010; Campbell 2001; Zhao 2006). The injury mechanisms that each intervention was aimed at are described in Table 2.
| Study ID | Injury mechanism | ||||||||||||
| Pedestrian | Cycle | Motorcycle | Vehicle (non‐specific) | Falls | Swimming/ drowning/ diving | Smoke/ fire/ flames | Heat and hot surfaces | Sport/ physical activity | Sun | Household safety | Agricultural injuries | Poisoning | |
| ‐ | ● | ‐ | ● | ‐ | ● | ● | ‐ | ‐ | ‐ | ‐ | ‐ | ‐ | |
| ● | ● | ● | ● | ‐ | ‐ | ‐ | ‐ | ‐ | ‐ | ‐ | ‐ | ● | |
| ‐ | ‐ | ‐ | ‐ | ‐ | ‐ | ● | ● | ● | ‐ | ● | ‐ | ● | |
| ‐ | ‐ | ‐ | ‐ | ‐ | ‐ | ● | ● | ‐ | ‐ | ‐ | ‐ | ‐ | |
| ‐ | ● | ● | ● | ‐ | ‐ | ‐ | ‐ | ‐ | ‐ | ‐ | ‐ | ‐ | |
| ‐ | ‐ | ‐ | ‐ | ‐ | ‐ | ‐ | ‐ | ● | ‐ | ‐ | ‐ | ‐ | |
| ● | ● | ‐ | ● | ‐ | ‐ | ‐ | ‐ | ‐ | ‐ | ‐ | ‐ | ‐ | |
| ‐ | ● | ● | ● | ● | ● | ‐ | ‐ | ‐ | ‐ | ‐ | ‐ | ‐ | |
| ● | ● | ● | ● | ‐ | ● | ● | ● | ‐ | ‐ | ● | ‐ | ● | |
| ‐ | ‐ | ‐ | ‐ | ‐ | ‐ | ● | ● | ‐ | ‐ | ‐ | ‐ | ‐ | |
| ● | ● | ‐ | ● | ‐ | ● | ‐ | ‐ | ● | ‐ | ‐ | ‐ | ‐ | |
| ‐ | ● | ‐ | ● | ‐ | ● | ‐ | ‐ | ● | ‐ | ‐ | ‐ | ‐ | |
| ● | ● | ‐ | ‐ | ● | ‐ | ● | ● | ‐ | ‐ | ‐ | ‐ | ● | |
| ‐ | ‐ | ‐ | ‐ | ‐ | ‐ | ‐ | ‐ | ‐ | ‐ | ‐ | ● | ‐ | |
| ● | ● | ● | ● | ● | ‐ | ‐ | ● | ● | ‐ | ‐ | ‐ | ‐ | |
| ● | ● | ● | ● | ‐ | ‐ | ‐ | ‐ | ‐ | ‐ | ‐ | ‐ | ‐ | |
| ‐ | ● | ‐ | ● | ‐ | ● | ‐ | ‐ | ● | ● | ‐ | ‐ | ‐ | |
| ‐ | ‐ | ‐ | ‐ | ‐ | ‐ | ‐ | ‐ | ‐ | ‐ | ‐ | ● | ‐ | |
| ● | ● | ● | ● | ● | ‐ | ‐ | ● | ‐ | ‐ | ‐ | ‐ | ||
| ‐ | ‐ | ‐ | ‐ | ● | ‐ | ‐ | ‐ | ‐ | ‐ | ‐ | ‐ | ‐ | |
| ‐ | ‐ | ‐ | ‐ | ‐ | ● | ‐ | ‐ | ‐ | ‐ | ‐ | ‐ | ‐ | |
| ● | ● | ‐ | ‐ | ‐ | ‐ | ‐ | ‐ | ‐ | ‐ | ‐ | ‐ | ‐ | |
| ‐ | ‐ | ‐ | ‐ | ‐ | ‐ | ‐ | ‐ | ‐ | ‐ | ‐ | ‐ | ‐ | |
| ‐ | ● | ‐ | ● | ‐ | ● | ‐ | ‐ | ‐ | ‐ | ‐ | ‐ | ‐ | |
| ● | ● | ● | ● | ‐ | ‐ | ‐ | ‐ | ‐ | ‐ | ‐ | ‐ | ‐ | |
| ● | ‐ | ● | ● | ‐ | ● | ‐ | ‐ | ‐ | ‐ | ● | ‐ | ● | |
| ● | ● | ● | ● | ‐ | ‐ | ‐ | ‐ | ‐ | ‐ | ‐ | ‐ | ‐ | |
‐: outcome not measured; ●: outcome measured.
Eighteen (66%) interventions were targeted at children alone (Carmel 1991; Chapman 2013; Cook 2006; Falavigna 2012; Frederick 2000; Grant 1992; Greene 2002; Lee 2004; Martinez 1996; Morrongiello 1998; Reed 2001; Richards 1991; Terzidis 2007; Twisk 2013; Wang 2009; Wesner 2003; Wright 1995; Zirkle 2005), and nine (34%) were targeted at children and families (Azeredo 2003; Buckley 2010; Campbell 2001; Collard 2010; Gresham 2001; Kendrick 2007; Lu 2000; Sun 2004; Zhao 2006). While the major component of all interventions was based in the school setting, three (11%) also had a component in the family home (Campbell 2001; Lu 2000; Terzidis 2007), two (7%) in the community (Lee 2004; Lu 2000), and one (4%) in a hospital (Frederick 2000). Sixteen (59%) studies were delivered in whole or part by a teacher (Azeredo 2003; Buckley 2010; Carmel 1991; Chapman 2013; Collard 2010; Frederick 2000; Grant 1992; Greene 2002; Gresham 2001; Kendrick 2007; Lu 2000; Morrongiello 1998; Richards 1991; Terzidis 2007; Wesner 2003; Zhao 2006), and nine (33%) were delivered by professionals with an injury prevention role (Campbell 2001; Cook 2006; Falavigna 2012; Lee 2004; Martinez 1996; Reed 2001; Wang 2009; Wright 1995; Zirkle 2005). One (4%) study trained students to be peer educators (Wang 2009), and two (7%) studies did not explicitly report who delivered the intervention in the school (Sun 2004; Twisk 2013).
Studies used a variety of components as part of their education programmes: nine (33%) interventions utilised information giving (Carmel 1991; Falavigna 2012; Greene 2002; Richards 1991; Terzidis 2007; Twisk 2013; Wesner 2003; Wright 1995; Zirkle 2005), one (4%) used peer education (Wang 2009), and the other 17 studies (63%) had multi‐component programmes (Azeredo 2003; Buckley 2010; Campbell 2001; Chapman 2013; Collard 2010; Cook 2006; Frederick 2000; Grant 1992; Gresham 2001; Kendrick 2007; Lee 2004; Lu 2000; Martinez 1996; Morrongiello 1998; Reed 2001; Sun 2004; Zhao 2006). Multi‐component programmes included combinations of elements such as information giving, safety equipment provision, skills training and testing, physical training, cognitive behaviour change methods, telling of 'real life' stories by or about injured individuals and interactive learning (e.g. developing campaign materials).
Seven (26%) studies involved single education sessions (Cook 2006; Falavigna 2012; Morrongiello 1998; Terzidis 2007; Twisk 2013; Wesner 2003; Wright 1995); nine (33%) involved between three and eight sessions (Buckley 2010; Campbell 2001; Chapman 2013; Greene 2002; Gresham 2001; Lu 2000; Martinez 1996; Richards 1991; Zhao 2006); one (4%) involved 18 to 27 sessions (Azeredo 2003), and one (4%) involved over 50 sessions (Collard 2010). Nine (33%) studies did not document the number of sessions (Carmel 1991; Frederick 2000; Grant 1992; Kendrick 2007; Lee 2004; Reed 2001; Sun 2004; Wang 2009; Zirkle 2005).
Interventions were varied in terms of the duration of individual sessions, the frequency of these sessions and the overall duration of the intervention. Seven (26%) interventions were of very short duration, lasting only one day or one or two sessions (Cook 2006; Falavigna 2012; Morrongiello 1998; Terzidis 2007; Twisk 2013; Wesner 2003; Wright 1995). Two (7%) interventions lasted for between one and four weeks (Campbell 2001; Martinez 1996), seven (26%) lasted between one and six months (Azeredo 2003; Buckley 2010; Campbell 2001; Chapman 2013; Greene 2002; Gresham 2001; Richards 1991), and six (22%) lasted longer than six months (Collard 2010; Lu 2000; Sun 2004; Wang 2009; Zhao 2006; Zirkle 2005). Five (19%) studies did not document the length of the intervention (Frederick 2000; Grant 1992; Kendrick 2007; Lee 2004; Reed 2001).
Thirteen (48%) studies described 'branded' programmes including Think First and Think Well (brain and spinal cord injury prevention programmes: Falavigna 2012; Greene 2002; Gresham 2001; Wesner 2003; Wright 1995; Zirkle 2005), SPIY (Buckley 2010), I‐Play (Collard 2010), IMPS (Frederick 2000) based in schools and emergency departments, Learn Not To Burn (Grant 1992), Risk Watch (delivered by the fire service but covering a range of injury mechanisms: Kendrick 2007), Go AHEAD, including a range of road safety and sports injury prevention (Morrongiello 1998), and AgDARE, aimed at young people working on farms (Reed 2001).
The studies covered a range of injury mechanisms: 18 (67%) reported transport safety (including 12 (44%) pedestrian (Buckley 2010; Cook 2006; Frederick 2000; Greene 2002; Kendrick 2007; Lu 2000; Martinez 1996; Richards 1991; Twisk 2013; Wright 1995; Zhao 2006; Zirkle 2005), 17 (63%) cycling (Azeredo 2003; Buckley 2010; Chapman 2013; Cook 2006; Falavigna 2012; Frederick 2000; Greene 2002; Gresham 2001; Kendrick 2007; Lu 2000; Martinez 1996; Morrongiello 1998; Richards 1991; Twisk 2013; Wesner 2003; Wright 1995; Zirkle 2005), nine (33%) motor cycle (Buckley 2010; Chapman 2013; Falavigna 2012; Frederick 2000; Lu 2000; Martinez 1996; Wright 1995; Zhao 2006; Zirkle 2005), and 17 (63%) non‐specific vehicle injuries (Azeredo 2003; Buckley 2010; Chapman 2013; Cook 2006; Falavigna 2012; Frederick 2000; Greene 2002; Gresham 2001; Lu 2000; Martinez 1996; Morrongiello 1998; Richards 1991; Wesner 2003; Wright 1995; Zhao 2006; Zirkle 2005)), five (19%) reported falls safety (Falavigna 2012; Kendrick 2007; Lu 2000; Richards 1991; Sun 2004), 10 (37%) reported water/drowning safety (Azeredo 2003; Falavigna 2012; Frederick 2000; Greene 2002; Gresham 2001; Morrongiello 1998; Richards 1991; Terzidis 2007; Wesner 2003; Zhao 2006), seven (26%) reported smoke/fire safety (Azeredo 2003; Campbell 2001; Carmel 1991; Frederick 2000; Grant 1992; Kendrick 2007; Lu 2000), seven (26%) reported sports safety (Campbell 2001; Collard 2010; Greene 2002; Gresham 2001; Lu 2000; Morrongiello 1998; Richards 1991), three (11%) reported household safety (Campbell 2001; Frederick 2000; Zhao 2006), two (7%) reported agricultural safety (Lee 2004; Reed 2001), and five (19%) reported poisoning safety (Buckley 2010; Campbell 2001; Frederick 2000; Kendrick 2007; Zhao 2006). Table 2 shows the injury mechanisms targeted by each study.
Twenty‐one (78%) studies documented that the control groups had no intervention or the usual curriculum (not related to injury prevention) with either no access to the intervention or delayed until the end of the study (Azeredo 2003; Buckley 2010; Carmel 1991; Chapman 2013; Collard 2010; Cook 2006; Falavigna 2012; Frederick 2000; Grant 1992; Greene 2002; Kendrick 2007; Lee 2004; Lu 2000; Martinez 1996; Morrongiello 1998; Reed 2001; Terzidis 2007; Twisk 2013; Wang 2009; Wesner 2003; Wright 1995). In three studies (11%), the control groups received an alternative educational programme (e.g. tobacco and alcohol prevention programmes or general information on food hygiene and disease prevention) (Campbell 2001; Sun 2004; Zhao 2006), and in the remaining three (11%), it was unclear what the control group received (Gresham 2001; Richards 1991; Zirkle 2005).
Types of outcome measures
For the primary outcomes, five studies (19%) included non‐medically attended injury occurrence (Chapman 2013; Collard 2010; Lee 2004; Sun 2004; Wang 2009), one (4%) included medically attended injury occurrence (Zhao 2006), and one (4%) included both medically and non‐medically attended injuries (Lu 2000). Of these, five studies reported injury incidence rates (Collard 2010; Lu 2000; Sun 2004; Wang 2009; Zhao 2006), and two reported injury incidence proportion (Chapman 2013; Lee 2004).
For the secondary outcome measures, two studies (7%) reported observed safety skills (Frederick 2000; Kendrick 2007), four (15%) reported observed safety behaviours (Azeredo 2003; Reed 2001; Wright 1995; Zirkle 2005), 19 (70%) reported self‐reported behaviour and practices (Azeredo 2003; Buckley 2010; Campbell 2001; Chapman 2013; Collard 2010; Falavigna 2012; Frederick 2000; Gresham 2001; Kendrick 2007; Lee 2004; Martinez 1996; Morrongiello 1998; Reed 2001; Richards 1991; Sun 2004; Twisk 2013; Wesner 2003; Wright 1995; Zirkle 2005), and 21 (78%) reported safety knowledge (Azeredo 2003; Campbell 2001; Carmel 1991; Collard 2010; Cook 2006; Falavigna 2012; Frederick 2000; Grant 1992; Greene 2002; Gresham 2001; Kendrick 2007; Lee 2004; Lu 2000; Martinez 1996; Morrongiello 1998; Richards 1991; Terzidis 2007; Wang 2009; Wesner 2003; Wright 1995; Zirkle 2005). One study reported health economic outcomes (Lu 2000).
Excluded studies
See Characteristics of excluded studies table.
Risk of bias in included studies
The risk of bias across all included studies is summarised in Figure 3 and Figure 4 and is included in the Characteristics of included studies table. Many of the risks of bias across all studies were unclear due to inadequate reporting. Major sources of bias within included studies were from inadequate blinding of both participants and personnel: in most studies, it was not possible to blind participants to allocation, and teachers delivering the intervention were responsible for administering and marking outcome assessments.

Risk of bias graph: review authors' judgements about each risk of bias item presented as percentages across all included studies.

Risk of bias summary: review authors' judgements about each risk of bias item for each included study.
Allocation
Out of the 27 included studies, 13 were RCTs and 14 were non‐RCTs and CBAs. We only assessed random sequence generation and allocation concealment for the RCTs. Of the RCTs, we judged 11 (85%) to have an unclear risk of adequate random sequence generation (Campbell 2001; Carmel 1991; Chapman 2013; Collard 2010; Falavigna 2012; Gresham 2001; Lee 2004; Reed 2001; Sun 2004; Wang 2009; Zhao 2006), and two (15%) a high risk (Grant 1992; Kendrick 2007). For allocation concealment, we concluded that all 13 RCTs had an unclear risk of bias, mostly due to inadequate reporting.
For the 14 non‐RCTs, we judged that seven (50%) had a high risk of allocation bias (selection bias), mostly due to schools selecting themselves to be part of the study (Azeredo 2003; Buckley 2010; Cook 2006; Frederick 2000; Twisk 2013; Wesner 2003; Wright 1995), and seven (50%) had an unclear risk of allocation bias, again largely due to inadequate reporting (Greene 2002; Lu 2000; Martinez 1996; Morrongiello 1998; Richards 1991; Terzidis 2007; Zirkle 2005).
Blinding
We judged 18 (67%) studies to be at high risk of performance bias due to inadequate blinding of participants and personnel. Of these, eight were RCTs (Campbell 2001; Chapman 2013; Collard 2010; Falavigna 2012; Grant 1992; Kendrick 2007; Lee 2004; Wang 2009), and 10 were non‐RCTs (Azeredo 2003; Buckley 2010; Cook 2006; Frederick 2000; Martinez 1996; Morrongiello 1998; Richards 1991; Twisk 2013; Wesner 2003; Wright 1995). We judged that a further eight (30%) had an unclear risk, and of these four were randomised (Carmel 1991; Gresham 2001; Reed 2001; Sun 2004), and four were non‐randomised (Greene 2002; Lu 2000; Terzidis 2007; Zirkle 2005). We considered only one study (3%), an RCT, to be at low risk of bias (Zhao 2006).
Regarding blinding of those assessing study outcomes, we judged 12 (44%) to be at high risk of bias due to non‐blinding, 14 (52%) had an unclear risk of bias and only one (randomised) study (Campbell 2001) had a low risk of bias. For the high risk of bias, four were randomised (Grant 1992; Kendrick 2007; Lee 2004; Reed 2001), and eight were non‐randomised (Azeredo 2003; Buckley 2010; Cook 2006; Frederick 2000; Richards 1991; Twisk 2013; Wesner 2003; Zirkle 2005). For the studies at unclear risk of bias (again mostly due to non‐reporting) eight were randomised (Carmel 1991; Chapman 2013; Collard 2010; Falavigna 2012; Gresham 2001; Sun 2004; Wang 2009; Zhao 2006) and six were non‐randomised (Greene 2002; Lu 2000; Martinez 1996; Morrongiello 1998; Terzidis 2007; Wright 1995). We assessed all studies measuring self‐reported outcomes to be at high risk of bias.
Incomplete outcome data
The risk of bias due to incomplete outcome data varied across studies. We assessed 10 (36%) studies at unclear risk (three randomised (Chapman 2013; Gresham 2001; Sun 2004) and seven non‐randomised (Azeredo 2003; Cook 2006; Greene 2002; Lu 2000; Morrongiello 1998; Richards 1991; Zirkle 2005)), we judged eight (30%) at low risk (four randomised (Collard 2010; Kendrick 2007; Wang 2009; Zhao 2006) and four non‐randomised (Buckley 2010; Frederick 2000; Terzidis 2007; Twisk 2013)), and we assessed nine (33%) at high risk (six randomised (Campbell 2001; Carmel 1991; Falavigna 2012; Grant 1992; Lee 2004; Reed 2001) and three non‐randomised (Martinez 1996; Wesner 2003; Wright 1995)). Often, our assessment of unclear risk was due to the number of participants allocated at baseline not being clearly defined. We made judgements of high risk when less than 80% of the baseline sample provided outcome data at follow‐up (Wesner 2003; Wright 1995), when the studies lacked matched data (Lee 2004; Martinez 1996; Reed 2001), contained incomplete data returns from schools (Grant 1992), or when studies contained participants that had not received parental consent (Falavigna 2012).
Selective reporting
We considered the risk of selective outcome reporting to be unclear in 12 (44%) studies; four were randomised (Campbell 2001; Chapman 2013; Lee 2004; Zhao 2006) and eight were non‐randomised (Buckley 2010; Cook 2006; Frederick 2000; Greene 2002; Martinez 1996; Morrongiello 1998; Richards 1991; Zirkle 2005). We assessed the risk to be high in seven (26%) studies, of which five were randomised (Carmel 1991; Falavigna 2012; Grant 1992; Gresham 2001; Reed 2001) and two were non‐randomised (Azeredo 2003; Wright 1995). The risk of selective outcome reporting was low in eight studies (30%) (four randomised (Collard 2010; Kendrick 2007; Sun 2004; Wang 2009) and four non‐randomised (Lu 2000; Terzidis 2007; Twisk 2013; Wesner 2003)). The reasons for our 'high risk' assessment included incomplete reporting for some outcomes of interest (Azeredo 2003; Carmel 1991; Falavigna 2012; Grant 1992), no clear description of method of scoring for assessment tools used (Reed 2001), and only selected items being reported in tables (Wright 1995).
Other potential sources of bias
We judged five (18%) studies to be at high risk of other bias, for reasons including: failure to adjust for clustering effects (Buckley 2010 (non‐randomised); Lee 2004 (randomised)), misclassification bias (Grant 1992 (randomised)), lack of signed parental consent (Chapman 2013 (randomised)) and differences in test instrument used between intervention and control group (Wright 1995 (non‐randomised)). We judged 14 (52%) studies at unclear risk: five were randomised (Carmel 1991; Kendrick 2007; Reed 2001; Sun 2004; Wang 2009) and nine were non‐randomised (Azeredo 2003; Cook 2006; Frederick 2000; Greene 2002; Lu 2000; Martinez 1996; Morrongiello 1998; Richards 1991; Zirkle 2005). We judged eight (29%) to be at low risk of other bias, five being randomised (Campbell 2001; Collard 2010; Falavigna 2012; Gresham 2001; Zhao 2006) and three being non‐randomised (Terzidis 2007; Twisk 2013; Wesner 2003).
Risk of bias due to confounding (non‐randomised and controlled before‐and‐after studies)
We assessed four (29%) of the non‐RCT/CBA studies at high risk of bias due to confounding (Azeredo 2003; Lu 2000; Martinez 1996; Wright 1995). This was due to a lack of matching in the study design or adjustment in the analysis or statistically significant differences in characteristics between groups of participants. We judged six (43%) to have an unclear risk (Buckley 2010; Greene 2002; Morrongiello 1998; Richards 1991; Terzidis 2007; Twisk 2013) and four (29%) to be at low risk (Falavigna 2012; Frederick 2000; Wesner 2003; Zirkle 2005).
Effects of interventions
Self‐reported or medically attended unintentional injuries or injuries with an unspecified intent
Five (19%) studies reported non‐medically attended injury occurrence (Chapman 2013; Collard 2010; Lee 2004; Sun 2004; Wang 2009); one (4%) study reported medically attended injury occurrence (Zhao 2006), and one (4%) study reported both medically and non‐medically attended injuries (Lu 2000). Five studies reported injury incidence rates (Collard 2010; Lu 2000; Sun 2004; Wang 2009; Zhao 2006), and two reported injury incidence proportions (Chapman 2013; Lee 2004).
Lu 2000 was a clustered CBA, and the remaining six were cluster RCTs. The interventions included: a programme using cognitive behavioural change methods to modify risk‐taking behaviour in young people aged 13 to 14 years (Chapman 2013); an exercise‐based intervention to prevent sport injuries in children aged 10 to 12 years (Collard 2010); an intervention to prevent agricultural injuries in young farmers aged 13 to 18 years (Lee 2004); a teacher‐led health education programme with content designed by participating children to prevent a range of injuries in primary and middle school students in China (age range six to 16 years) (Lu 2000; Sun 2004; Zhao 2006); and a peer‐educator intervention for preventing a range of injuries in middle school children in China (Wang 2009).
Four studies, all conducted in China, were similar in terms of the interventions, adopting a health education approach for primary or middle school‐age children (Lu 2000; Sun 2004; Wang 2009; Zhao 2006, and three of these studies were included in a meta‐analysis of injury incidence rates (Lu 2000; Wang 2009; Zhao 2006; see Figure 5). We were unable to include Sun 2004 as this was a PhD thesis and only the abstract was available. We sought further information from the author but were unsuccessful in obtaining this. For the studies in the meta‐analysis, the participants (12,977 in total, with 2073 person‐years after adjusting for clustering) were aged from six to 16 years (Lu 2000), 12 to 15 years (Wang 2009), and seven to 13 years (Zhao 2006). The interventions comprised providing students with booklets and classes on injury prevention, letters to families encouraging co‐operation with safety education, a mass media campaign and training teachers to enhance safety in physical activity classes and at school drop‐off and pick‐up times (Lu 2000); weekly injury prevention sessions for students provided by peer educators which included activities, presentations, games or themed discussions (Wang 2009); and lectures and leaflets provided to teachers, parents and students, plus safety posters and a safety course provided to children before summer and winter school holidays (Zhao 2006). In two studies, the control arm received no intervention (Lu 2000; Wang 2009), and in one study, they received disease prevention education (pneumonia, iron‐deficiency anaemia, rickets and common communicable diseases) (Zhao 2006). The three studies had 2073 person‐years of follow‐up after adjusting for clustering. The pooled IRR was 0.73 (95% CI 0.49 to 1.08) and there was substantial heterogeneity between effect sizes (Chi2 = 5.46, degrees of freedom (df) = 2, P = 0.07; I2 = 63%) (Analysis 1.1). We assessed the quality of evidence as low, due to the high heterogeneity and wide CIs.

Forest plot of comparison: 1 Injury rates, outcome: 1.1 Injury rates at follow‐up.
We undertook sensitivity analysis and excluded the non‐RCT (Lu 2000). This had the effect of lowering the injury IRR in the intervention versus control groups (IRR 0.59, 95% CI 0.49 to 0.72) and there was no heterogeneity between effect sizes (Chi2 = 0.97, df = 1, P = 0.33; I2 = 0%). This implies that the non‐RCT design may explain the heterogeneity in the pooled analysis.
Sun 2004 reported a reduction in injury in the intervention schools that delivered an injury prevention campaign, including the distributing booklets and information leaflets, helping children with "blackboard bulletins" and offering posters on safety education to schools (adjusted risk ratio 0.65, 95% CI 0.57 to 0.76).
The remaining three studies that were not included in the meta‐analysis described self‐reported (non‐medically attended) injury. Chapman 2013 reported the proportion of students who had at least one transport injury in a three‐month period before and after the intervention for both the control and intervention groups. While the proportions of students who experienced at least one transport injury decreased by 6.0% from baseline in the intervention group and increased by 4.8% from baseline in the control group, the odds ratio (OR) showed no evidence of an effect (using intervention group as a reference, OR 1.42, 95% CI 0.62 to 3.17, P = 0.387). Collard 2010 investigated the I‐Play programme, a physical activity injury prevention scheme. They found weak evidence of a reduction in injury incidence (hazard ratio 0.81, 95% CI 0.41 to 1.59, adjusted for clustering) and this effect was stronger in children with lower initial levels of activity (hazard ratio 0.47, 95% CI 0.21 to 1.06). Lee 2004 described the impact of the Future Farmers of America (FFA) programme, comparing a standard intervention (promotional material, guides, newsletters and training for trainers) and enhanced intervention (with additional national trainer conventions and contact with a programme facilitator) with a control group. The control group received marketing and promotion of the Partners programme only (via newsletters, videos or conferences). In the standard intervention group, at three‐month follow‐up, 22% of children reported an injury in the past three months, as did 24% of children in the enhanced intervention group, and 24% in the control group. No P values were reported.
Observed safety skills
Two studies reported on observed safety skills for 1506 children after the intervention had been delivered (Kendrick 2007; Frederick 2000). While both studies found an improvement in the observed safety skills, we assessed the quality of evidence for this outcome to be low. This was due to the high risk of selection bias of included schools (as one of the two studies was a CBA), inconsistency of interventions and outcome measures, and imprecision as there were wide CIs in one of the two included studies and a paucity of data. However, the effect sizes were large. This rating of the evidence for this outcome was low quality means that our confidence in these effect estimates was limited.
Kendrick 2007 studied the Risk Watch programme targeting cycle and pedestrian injuries, falls, fire and burns, and poisonings. Children's safety skills were observed in scenarios including 'stop, drop and roll', road safety (including cycle helmet wearing) and poisoning secondary prevention. This study found some evidence of improvement in combined scores for all safety skills (mean difference 11.9, SD 1.4 to 22.5, P = 0.03) but only fire and burn prevention skills individually showed an improvement (OR 8.93, 95% CI 1.67 to 47.78, P = 0.01).
Frederick 2000 evaluated the impact of the IMPs programme. This was a multi‐component intervention based in the classroom and in the emergency department at local hospitals and aimed at preventing and minimising the impact of a range of injury mechanisms including road safety, accidents in the home, fire, electricity, poisoning and waterway injuries. They used scenarios to test skills practices and retention, and found a higher percentage of children in the intervention group compared to the control group exhibited correct basic life support skills at the five‐month post‐intervention test (e.g. assessment of danger: 36% in the intervention group versus 3% in the control group, P < 0.0005; assessment of responsiveness: 58% in the intervention group versus 12% in the control group, P < 0.0005; assessment of circulation: 7% in the intervention group versus 1% in the control group, P < 0.0005).
Behaviour
We divided this outcome into observed and self‐reported behaviour. All four studies (five articles) that reported observed safety behaviour showed improved practices, and 13 out of 19 studies describing self‐reported behaviour showed improved practices.
However, we assessed the quality of the evidence for this outcome to be very low, due to the high risk of selection bias of included schools, inconsistency in the methods of collecting data and intervention types, and wide CIs in the results presented. This means we have very little confidence in the effect estimates presented.
Observed behaviour
Four studies reported directly observed behaviour for 7022 children after the intervention had been delivered (Azeredo 2003; Reed 2001; Wright 1995; Zirkle 2005).
Azeredo 2003, studying school children aged five to 11 years and their families, introduced multiple interventions in 18 to 27 lessons, depending on the grade of child. The intervention included smoke‐alarm giveaways, school cycle fairs with helmet giveaways, safety pen‐pal letters, a letter to parents and injury prevention talks at parent‐teacher meetings. The control group had no intervention. Seat‐belt use was observed before, during and two weeks after the intervention. In the intervention group, observed seat‐belt use for passengers increased from 21% before the intervention, to 36% after completion. However, there was noted to be a 1% decrease in observed seat‐belt use within the control group. Among the intervention group, observed cycle helmet use increased from 0% to 10% (no P values given), although it is unclear to what extent this was affected by free helmet giveaways. There were no data given on the control group.
Reed 2001 implemented the AgDARE programme among high‐school agriculture students in the ninth and tenth grades in Kentucky, US. This incorporated two elements; narrative (cognitive) simulations, involving problem‐solving activities and a written component, and physical simulations whereby they could gain a better understanding of the difficulty of performing certain farm jobs with a disability. The control group received no intervention. After one year, researchers and agricultural teachers made a farm visit to 29 students who had received the intervention. Seventy‐six percent of students had made at least one positive safe work behaviour change, although no P values were presented. The control group participants were not visited.
Wright 1995 studied the implementation of the Think First programme aimed at reducing brain and spinal cord injuries, among school children aged between 11 and 15 years. The intervention programme was delivered by project staff and a person who had a brain/spinal cord injury. It included a film, lecture and talk by the injured person describing the traumatic injury. The programme covered areas such as seat‐belt use, use of motorbike and cycle helmets, avoiding drugs and alcohol when driving or participating in sport, and checking the depth of water when swimming or diving. The control group received the same programme after the study had finished. Behaviour was observed at one control school, one intervention middle school, and one intervention high school. Assessment took place before the intervention, two weeks and three months after the intervention for the intervention group, and two weeks before and one day before a Think First assembly for the control group. Statistical comparisons were within‐group only. Among middle‐school children in the intervention group there was very weak evidence of an increase in observed seat‐belt use at two weeks from 31% to 36% (P = 0.03), but decrease to 27% by three months (P < 0.05). There was no evidence of a change in cycle helmet use although the numbers of children observed were small. There was also no evidence of a change in the control group between the first and second observations of helmet or seat‐belt use.
Zirkle 2005 also reported on the Think First programme among primary school children. Behaviour was observed by parents, who noted a range of pedestrian, sport, interpersonal and car safety behaviours and the intervention was reported to have resulted in positive behaviour changes, although there were no data presented.
Self‐reported behaviour and practices
Nineteen studies assessed the impact of interventions on self‐reported behaviour and practices for an approximated 48,000 children following the intervention delivery (Azeredo 2003; Buckley 2010; Campbell 2001; Chapman 2013; Collard 2010; Falavigna 2012; Frederick 2000; Gresham 2001; Kendrick 2007; Lee 2004; Martinez 1996; Morrongiello 1998; Reed 2001; Richards 1991; Sun 2004; Twisk 2013; Wesner 2003; Wright 1995; Zirkle 2005).
Safety equipment wearing
Eight studies reporting on safety equipment wearing (Azeredo 2003; Falavigna 2012; Martinez 1996; Morrongiello 1998; Richards 1991; Wesner 2003; Wright 1995; Zirkle 2005).
Azeredo 2003, in a study incorporating a safety curriculum, smoke‐alarm giveaway, school cycle fairs, safety pen‐pal letters and school letters to parents, found that among the intervention group, self‐reported passenger seat‐belt use increased from 42% at baseline to 65% after the programme in children from grades kindergarten to grade one (P = 0.04). Self‐reported passenger seat‐belt use was not reported in the control group. Driver seat‐belt use increased by 2% in the intervention group, but there was no increase in the control group (no P values given). Among the children in the intervention group, there was some evidence of an increase in cycle helmet use (in children in kindergarten to grade one (P = 0.03) and children in grades two to five (P < 0.01)). The study did not mention the effects of the smoke‐alarm giveaway component of the programme.
Falavigna 2012 reported the Think Well programme, which is similar to the Think First For Kids programme. This involved a 60‐minute session provided by trained researchers, and comprised watching a video of a child describing their injury and its impact, and a brain and spinal cord trauma prevention programme. This study reported weak evidence of an increase in cycle helmet wearing from 8.6% at baseline to 14.5% at one‐week postintervention (P = 0.039) and 17.7% at five months postintervention (P = 0.034). The study reported some evidence of an increase in use of skateboard and rollerblading safety equipment one‐week postintervention (from 28% at baseline to 33.6% at one week, P = 0.460), and the effect was stronger at five months (from 33.6% at one‐week postintervention to 40.4% at five months, P = 0.037). There was no evidence of a decrease in use of skateboarding and rollerblading equipment in the control group (from 28.4% at baseline to 27.3% at one week, P = 0.992, and 22.6% at five months, P = 0.421). They did not report evidence of a change in the proportion of young people using seat belts or motorcycle helmets. However, there was some evidence that the proportion of young people in the intervention group who would sometimes ride in a car when someone had drunk alcohol increased after the intervention (36.9% before intervention to 42.1% after intervention, P = 0.046). No data were presented for the control group.
Martinez 1996 introduced a five‐component course into grades 10, 11 and 12 in a US high school. This consisted of audio‐visual aids, a physical demonstration and a didactic lecture. The sessions covered a basic lesson on types of energy, particularly kinetic energy; safety features of vehicles; occupant kinematics and forces/crash prevention; a demonstration of a rollover, followed by designing and testing of crash vehicles. The control group received their normal physics lesson. Self‐reported behaviour was collected at baseline, two weeks and six months after the end of the intervention. After adjusting for baseline measures, they found evidence of a difference between the control and intervention groups at six months in favour of the intervention for wearing a seat belt as a passenger (P < 0.001) but no evidence of an effect of wearing a seat belt as the driver (P = 0.63).
Morrongiello 1998 looked at several injury mechanisms, particularly focusing on head injuries caused by cycling, sport and vehicles. The intervention covered general safety education, including swimming, sun safety and stranger danger and was delivered by a teacher in the presence of a project co‐ordinator. It consisted of four activity stations. The control group received no intervention. Among the intervention group, there was a higher self‐reported use of helmets when cycling and rollerblading post‐intervention, compared to pre‐intervention (from 62% to 83% when cycling and from 45% to 65% when rollerblading, P < 0.05), but not in the use of a seat belt (from 87% to 95%, no P values given). Outcomes from the control group were not reported.
Richards 1991 implemented an injury prevention curriculum delivered over three months by a teacher. There was an eight‐component curriculum which included spinal cord awareness and water safety. For each component, teachers could choose from a variety of activities. It was not clear what the control group received. There was an increase in seat‐belt use for children in different school grades. Baseline levels of seat‐belt use in the intervention group ranged from 60% to 80%, and rose to between 72% and 86% post‐intervention. In the control group, baseline levels of seat‐belt use were between 74% and 84%, which decreased to between 60% and 82% at the second observation.
Wesner 2003 used the Think First programme, which involved the intervention group receiving a one‐hour session, incorporating a video of teenagers with a spinal cord injury, an educational session with audio‐visual aids, a description of brain anatomy and pathophysiology, and an account from a teenager with a spinal cord injury. This study reported (using within‐group analyses) an increase in self‐reported cycle helmet use among the intervention group from 32.6% before to 40.1% after the intervention (P = 0.05), but a decrease in the control group from 40.9% to 40.0% (no P values given); an increase in protective equipment wearing while rollerblading in the intervention group from 70.6% to 72.8% (P = 0.049) compared to from 66.5% to 68.4% in the control group (no P value given); and an increase in protective equipment wearing while skateboarding in the intervention group from 1.4% to 3.0% (P = 0.01) compared to from 4.8% to 7.4% in the control group (no P value given).
Wright 1995, in an analysis of the Think First programme, found little impact on self‐reported behaviours, with no evidence of an increase in seat‐belt wearing or motorcycle helmet wearing, even though baseline levels of motorcycle helmet wearing were lower than in the Falavigna study at 60% to 80% (Falavigna 2012).
Zirkle 2005 described an increase in self‐reported safety behaviours following the Think First For Kids programme but no data were provided (this was a PhD thesis and only the summary was available).
Risk behaviour relating to the road
Four studies reported self‐reported risky behaviour relating to the road (Chapman 2013; Gresham 2001; Martinez 1996; Twisk 2013).
Chapman 2013 studied the impact of the SPIY programme aimed at reducing transport injuries among 13‐ to 14‐year‐old school children in Australia. The intervention group was presented with risk‐taking injury scenarios, incorporating activities such as role play and discussion. These used cognitive behavioural change principles. The control group received no intervention. The outcome of interest for this review was self‐reported transport risk behaviour. Comparing the control with the intervention (reference) group there was no evidence of a difference in the post‐test reporting of transport risk behaviour (OR 1.37, 95% CI 0.64 to 2.93, P = 0.415).
In the Think First For Kids programme, Gresham 2001 found that both the intervention and control groups showed an improvement in risk behaviour scores (within‐group before‐and‐after comparison), with scores increasing significantly more in the intervention than control groups in all grades. This varied between the different grades. In grade one, there was a score increase of 3.06 (95% CI 2.76 to 3.35, P < 0.01) in the intervention group compared to 1.70 (95% CI 1.35 to 2.06, P < 0.01) in the control group. In grade two, this was 2.80 (95% CI 2.46 to 3.14, P < 0.01) in the intervention group versus 1.10 (95% CI 0.74 to 1.46, P < 0.01) in the control group and in grade three it was 3.27 (95% CI 2.92 to 3.63, P < 0.01) in the intervention group versus 1.55 (95% CI 1.17 to 1.93, P < 0.01) in the control group.
Martinez 1996, incorporating road safety into a physics curriculum, also assessed driving‐related risky behaviour (e.g. speeding and drink driving) with data collected at baseline, two weeks and six months after the end of the intervention. After adjusting for baseline measures, they found some evidence of a difference between the control and intervention groups at six months in favour of the intervention for speeding (P < 0.001) but no evidence of a difference for drink driving (P = 0.7).
Twisk 2013 used a lorry at primary schools to give pedestrian and cyclist safety instruction. Students could visualise the driver's field of view and were given information on safe road behaviour. There were two intervention groups, one targeting awareness of blind spot programmes (addressing carelessness) and the other targeting competency (addressing blind spot hazards). The control group received no intervention. Compared to the control group, there was no evidence of a change in the self‐reported correct positioning of cycle or self as a pedestrian, in either intervention group. For the awareness group, mean scores (for correct positioning) increased from a baseline of 9.5 (SD 1.4) to 9.7 (SD 1.1) in the intervention group compared to a decrease in mean scores from 9.6 (SD 1.2) at baseline to 9.3 (SD 1.5) in the control group (analysis of covariance (ANCOVA) P = 0.84). For the competency group, the mean score increased from 8.2 (SD 2.5) to 9.5 (SD 1.8) in the intervention group compared to a decrease in the mean score from 8.7 (SD 1.4) to 8.5 (SD 1.8) in the control group (ANCOVA P = 0.30).
Agriculture‐related injuries
Two studies (reported in three articles) described self‐reported behaviour related to agriculture‐related injury prevention (Lee 2004; Reed 2001).
Lee 2004 described the impact of the FFA Partners programme, with a standard (promotional material, guides, newsletters and training for trainers) and enhanced intervention (with additional national trainer conventions and contact with a programme facilitator). The control group received marketing and promotion of the Partners programme only (via newsletters, videos or conferences). This study found no evidence of a difference between the intervention and control groups for self‐reported safety consciousness (standard post‐test mean score 2.9 (SD 0.72), enhanced post‐test mean score 3.0 (SD 0.69), control post‐test mean score 3.0 (SD 0.77); P = 0.47)), or dangerous risk taking (standard post‐test mean score 3.2 (SD 0.73), enhanced post‐test mean score 3.2 (SD 0.72), control post‐test mean score 3.2 (SD 0.78); P = 0.38).
Reed 2001 implemented the AgDARE programme among high‐school agriculture students in the ninth and tenth grades in Kentucky. This incorporated two elements; narrative (cognitive) simulations, involving problem‐solving activities and a written component, and physical simulations, whereby they could gain a better understanding of the difficulty of performing certain farm jobs with a disability. This study used a 10‐item Stages of Change instrument to assess the agricultural students' transitions from contemplation to action to make a positive work behaviour change. They found that there was some evidence of a higher mean Stages of Change score in the intervention compared to the control groups (mean: 31.1 (SE 0.6) in the intervention group, 21.4 (SE 0.5) in the control group, F statistic (df) 134.5 (2;604) P < 0.001). A higher Stages of Change score indicates that those participants were more likely to make a behaviour change.
Sports injuries
Collard 2010, in a study from the Netherlands, looked at the impact of the I‐PLAY programme on self‐reported safety behaviours among 10‐ to 12‐year‐old children. This involved two physical exercise (PE) lessons per week, over eight months, delivered by a teacher with monthly newsletters and access to online information. The control group received their normal PE classes. There was no evidence of a difference between the intervention and control group according to self‐reported safety behaviours (measured on a Likert scale). The differences between means were 0.05 (95% CI ‐0.04 to 0.14) for wearing protective equipment during organised sport, 0.01 (95% CI ‐0.21 to 0.19) for wearing protective equipment during leisure activities and 0.07 (95% CI ‐0.13 to 0.27) for wearing appropriate footwear during PE.
Multiple injury types
Five studies, reporting on interventions aimed at preventing multiple injury types, included self‐reported behaviour and practices (Buckley 2010; Campbell 2001; Frederick 2000; Kendrick 2007; Sun 2004).
Buckley 2010 reported on the SPIY programme aimed at 13‐ to 14‐year‐old children in a deprived urban area in Australia. The intervention schools received teacher training, a teacher's manual and a student workbook for eight sessions. These were 50 minutes in duration and included presentations about risk‐taking and injury scenarios, introduction to first aid and cognitive behavioural activities to prevent the risk‐taking behaviour, including protecting friends. The control schools continued with their normal curriculum, but could use the SPIY programme after the end of the study. The intervention group had a greater positive change in their self‐reported risk‐taking score compared to the control group (from 2.39 to 1.93 with intervention versus 1.67 to 1.85 with control, P = 0.014).
Campbell 2001 reported on the impact of a first aid and home safety programme among 11‐ to 18‐year‐old children with a Hispanic background and their parents. The intervention focused on prevention of injuries and responding to emergency situations and included household safety, emergency care, controlling bleeding and treating burns, presented in eight sessions. The control group received an alcohol and tobacco prevention programme. At one‐year follow‐up both the intervention and control groups reported making home safety behaviour changes. For example, 81% of all those surveyed reported removing small objects, 90% reported keeping chemicals and 95% reported keeping medicines out of reach, and 43% had purchased fire extinguishers. The only evidence of difference between intervention and control groups was in the percentage of families who had practised a fire escape plan (47% in the intervention group, 31% in the control group, P < 0.01).
To assess self‐reported behaviour following the IMPs programme, Frederick 2000 used a video showing dangerous scenarios to provide students with the opportunity to describe what they would do in those situations. There appeared to be some weak evidence of a difference between the intervention and control groups in the percentages of children reporting a range of safe practices. These included, for example, situations such as not playing near water (25% in the intervention group versus 17.8% in the control group, P < 0.01) and identifying dangers for electrocution risk (18.1% in the intervention group versus 7.3% in the control group, P < 0.01).
For the Risk Watch programme, Kendrick 2007 found a difference in the adjusted OR between the intervention and control groups in the number of children self‐reporting using matches (83.0% with intervention versus 74.7% with control, adjusted OR 1.84, 95% CI 1.06 to 3.20, P = 0.031). However, on other measures (e.g. having smoke‐alarms, cooking food, getting medicine without an adult present and road safety), there was no evidence of a difference between groups.
Sun 2004 studied the impact of a safety intervention among over 7000 Chinese school pupils. This intervention included distributing booklets and information leaflets, helping children with "blackboard bulletins" and offering posters on safety education to schools. The control group received general information on food hygiene and disease prevention. In the questionnaire follow‐up at one year, there was reported to be a greater decrease in the score of risk‐taking behaviour for the intervention group than the control group (no P values given).
Safety knowledge
Twenty‐one studies reported on changes in safety knowledge for 46,550 children following the intervention (Azeredo 2003; Campbell 2001; Carmel 1991; Collard 2010; Cook 2006; Falavigna 2012; Frederick 2000; Grant 1992; Greene 2002; Gresham 2001; Kendrick 2007; Lee 2004; Lu 2000; Martinez 1996; Morrongiello 1998; Richards 1991; Terzidis 2007; Wang 2009; Wesner 2003; Wright 1995; Zirkle 2005). Of these, 19 reported an improvement in at least one question domain in the intervention compared to the control group.
However, we assessed the quality of this evidence as very low, meaning that we have little confidence these results. This is because 11 studies were CBA or non‐RCT design with a high risk of selection bias of included schools. There was also considerable inconsistency in knowledge tested, questionnaire designs and methods of collecting data, and a wide range of intervention types and pedagogical approaches, which may have contributed to the wide range of effect sizes. In addition, results were presented in a way that often made precision difficult to compare.
Vehicle and road safety knowledge
Four studies reporting on road and vehicle safety included safety knowledge as an outcome (Cook 2006; Martinez 1996; Wright 1995; Zirkle 2005).
Cook 2006 reported the effect on class safety knowledge when an injured classmate participated in safety education sessions. In the intervention group, the child gave a presentation and then interacted with his or her classmates. A nurse gave a presentation on injury occurrence and prevention, which involved discussions, short videos, written materials and a workbook. The first control group received the same information and the injured child's scenario, but without an actual injured child (enhanced control), while the second control group only received some anatomy education (basic control). Six classrooms were in the intervention group, and six in each of the control groups. There was improvement between the pre‐ and post‐test scores in both the intervention and enhanced control group, with five out of six classrooms in each group showing improvement (P < 0.05). At one‐month post‐intervention, 100% of the intervention classes maintained significantly higher test scores (P < 0.05) compared to 66% of the enhanced control group classes.
Martinez 1996 used a seven‐item questionnaire, which included questions about the physics of crashes, demographics of people involved in crashes and characteristics of automobiles. Compared to the control group, the intervention group showed higher safety knowledge scores two weeks' post‐intervention (0.77 with intervention versus 0.94 with control, P < 0.001), and six months' post‐intervention (0.75 with intervention versus 0.89 with control, P < 0.001).
Wright 1995 used a 22‐item questionnaire for the intervention schools, and a five‐item questionnaire for the control schools. For the intervention schools, these were administered before the intervention, at two weeks' post‐intervention, and three months' post‐intervention and for control schools two weeks before, and one day before the assembly where they were given the same curriculum information as the intervention group. From baseline to three months' post‐intervention there was a significant increase in safety knowledge in the middle school (from 15.0/22 to 16.2/22, P < 0.05), but a decrease in scores in the high school (from 16.1/22 to 14.6/22, P < 0.05). There were no significant changes in knowledge scores in the control school from two weeks before to one day before (from 4.6/5 to 4.6/5).
Zirkle 2005 implemented the Think First programme in five control and five intervention schools. There was very limited information on the actual content of the curriculum in the article, but similar Think First programmes include activities or teaching aimed at reducing brain and spinal cord injuries. This study reported a significantly greater improvement in safety knowledge in the intervention versus the control group, although they provided no data or P values.
Multiple injury safety knowledge
Twelve studies involving multiple injury mechanisms reported on safety knowledge (Azeredo 2003; Campbell 2001; Falavigna 2012; Frederick 2000; Greene 2002; Gresham 2001; Kendrick 2007; Lu 2000; Morrongiello 1998; Richards 1991; Wang 2009; Wesner 2003).
Azeredo 2003 used two different instruments to measure children's safety knowledge (a four‐item activity and written questions for children in kindergarten to grade one and a 20‐item multiple choice questionnaire for children in grades two to five). These included questions on emergency telephone numbers, good safety habits, intersection/stop signs, train warnings and good swimming habits for the younger children, and how to handle emergencies, pedestrian rules, cycle rules, water safety rules and home fire safety for the older children. The study showed an increase between the baseline and post‐test scores in the intervention schools (P values all < 0.01). In both age groups, there also was a difference in the post‐test scores between the intervention and control schools (P values between < 0.01 and 0.04).
Campbell 2001 reported that a higher proportion of students in the intervention group could correctly identify more items in a first aid kit than students in the control group. The baseline number of items correctly identified in the control group was 3.8, rising to 4.1 immediately post‐intervention, and 4.3 at the one‐year follow‐up. The baseline number of items correctly identified in the intervention group was slightly lower than the control at 3.7. This rose to 4.6 post‐intervention and remained at 4.6 at the one‐year follow‐up (P < 0.001 immediately post‐intervention and P < 0.01 at one‐year follow‐up).
Among intervention group children, Falavigna 2012 found no evidence of a difference in the effects of traumatic brain injury, occipital lobe function and seat‐belt use knowledge scores between the control and intervention groups at baseline, but there was an improvement in traumatic brain injury (P < 0.001) and occipital lobe function (P < 0001) immediately post‐intervention and at five months in the intervention group. Knowledge about seat‐belt use was similar in both the intervention and control groups at baseline and did not change during the intervention (no P values provided).
Frederick 2000 assessed the impact of the IMPS programme on students' knowledge by a quiz, administered before and five months after the intervention. There was an increase in safety knowledge scores from baseline in both groups (P < 0.01), although the intervention group demonstrated greater knowledge than controls in calling 999 (UK's emergency telephone number), first aid for burns and for choking. Data comparing scores for intervention and control groups were not presented.
Greene 2002 reported on Phase III of the Think First For Kids curriculum. This was a six‐week, six‐subject curriculum which was integrated into the usual school curriculum. The units covered the structure and function of the brain and spinal cord, road traffic safety, conflict resolution, and water, sports, playground and recreational safety. The control group received no intervention. In the post‐intervention questionnaire, administered one week after the six‐week teaching period, all school grades in the intervention group had higher safety knowledge scores related to brain and spinal cord injury than the controls (between the grades, P values ranged from 0.0001 to 0.0037) and there was an indication of increased water safety knowledge (P values between 0.0001 and 0.0489). In cycle safety questions, the intervention group had higher scores than the control groups in two grades (grade three, P = 0.02; grade one, P = 0.07; grade two not significant (no P value given)). Regarding the motor vehicle/pedestrian safety questions, there was no evidence of a difference between the intervention and control groups in grade one. However, among children in grades two and three, the scores for the intervention group were higher than those of the control group (P = 0.0143 for grade two and 0.0134 for grade three). There was no evidence of a difference in safety knowledge regarding playground and sports safety between the intervention and control groups.
Gresham 2001, also using the Think First For Kids programme, reported that the intervention group had a larger increase in their knowledge score than the control group (P < 0.001). In the intervention group, there was an increase from pre‐test scores of between 19% and 23%, measured by individual grades of children. Scores for the control group were not reported.
In the Risk Watch programme, Kendrick 2007 used an age‐appropriate questionnaire to assess knowledge, with questions illustrated pictorially. In the post‐test questionnaire, compared to the control group, the intervention group children answered more fire and burn protection questions correctly (difference between means 7.0%, 95% CI 1.5% to 12.6%, P = 0.01) but there was no evidence of a difference in safety knowledge relating to poisoning prevention (P = 0.57), cycle and pedestrian safety (P = 0.66) or falls prevention (OR 0.48, 95% CI 0.21 to 1.10, P = 0.08). Analysis of specific questions indicated that intervention group children may have been more aware of action to take if clothes caught fire (difference between means 35.3%, 95% CI 22.7% to 47.9%, no P values given), and were more likely to know the correct way to wear a cycle helmet (difference between mean 6.3%, 95% CI 1.4% to 11.1%, no P values given).
Lu 2000 reported on an intervention incorporating classes, letters home and family involvement. There was also teacher training and involvement in supervision of potentially risky behaviour, and a reporting system. This study found a higher post‐test score in students' safety knowledge in the intervention group compared to the control group (Chi2 = 56.63, P < 0.001). The study did not report on the content of the questionnaire, but stated that it comprised 10 questions.
Morrongiello 1998 reported the impact on safety knowledge of the activity‐based sessions in the intervention group. These sessions focused on four safety topics; bicycling and road use, reducing sports injury, creating a safety banner, and vehicle and road safety. Postintervention, Morrongiello found that the intervention group correctly answered 89% of the questions on knowledge of safety facts compared to 55% in the control group. The intervention group also correctly answered 84% of questions about which safety equipment should be worn for which sport, compared to 64% in the control group (no P values given).
Richards 1991 introduced an intervention which was tailored to the different grades of children. The intervention group received an eight‐component curriculum, which included topics such as spinal cord awareness and water safety. The authors did not report whether the control group received an intervention. The study found some evidence of a difference between the intervention group and control group in the post‐test questionnaire (P values ranged from P < 0.0001 and P < 0.05, between different school grades).
Wang 2009 measured safety knowledge with an eight‐point questionnaire, including topics such as the term unintentional injury itself, sports, falls, traffic and burns. The intervention group answered a higher number of questions correctly compared to children in the control group (82.7% in the intervention group versus 57.2% in the control group, P < 0.05).
Wesner 2003 asked a set of 13 questions to test students' knowledge and found an increase in the intervention group compared to baseline in knowledge of motor vehicle accidents being the most common cause of brain and spinal cord injury (from 37.7% to 61.0%, P < 0.001), the severe and permanent nature of brain and spinal cord injuries (from 60.3% to 69.4%, P = 0.022) and that injuries are most common in 15‐ to 24‐year‐old people (from 42.9% to 81.4%, P < 0.001). There was no evidence of a change in their scores relating to the laws about the use of helmets on motorbikes (from 74.9% to 74.5%, P = 0.71) and cycles (from 64.9% to 62.7%, P = 0.54), or that brain injury affects walking, talking and thinking (from 88.3% to 93.2%, P = 0.75). In the control group, there was no evidence of a change from baseline in scores on any of the questions.
Burn safety knowledge
Two studies reported on burns safety knowledge (Carmel 1991; Grant 1992).
Carmel 1991 used multiple methods of teaching to deliver a burns prevention programme, including a presentation, a home checklist, a set of photographs and a colouring book. The aim of this programme was to raise awareness, increase knowledge, and change attitudes and behaviour related to burn prevention. Compared to the control group, who received no intervention, the study authors reported that the intervention group could answer a higher number of safety questions correctly, both immediately at the end of the programme (mean values: 84.74 (SD 12.65) in the intervention group versus 69.85 (SD 14.18) in the control group, P < 0.001), and 10 weeks after the end of the programme (84.46 (SD 12.31) in the intervention group versus 71.73 (SD 13.33) in the control group, P < 0.001).
However, this was not found by Grant 1992, who introduced the "Learn Not To Burn" curriculum to children in grades three and four in US primary schools. This covered 22 key behaviours for burn prevention. The control groups either used "other methods of fire safety education" or "no established fire safety education". There was no evidence of a difference in percentage scores between the intervention and control group (from 81.37 to 90.75 in the intervention group versus from 81.10 to 90.58 in the control group, P = 0.96).
Sports safety knowledge
Collard 2010 investigated the I‐PLAY programme to prevent sport‐related injuries by introducing regular exercises. They used a nine‐item questionnaire to assess safety knowledge and found weak evidence of a difference, with the intervention group scoring higher than the control groups at follow‐up (mean difference 0.49, 95% CI 0.20 to 0.78).
Agricultural safety knowledge
Lee 2004 implemented a school‐based educational programme to reduce unintentional injury rates among youths involved in agricultural work. The standard intervention involved working with big agricultural businesses, marketing and promotion of safety information aimed at reducing agriculture‐related injuries, and working with trainers. For the enhanced intervention group, there was more support for trainers, with regular conferences and access to the public health office. The study did not show evidence of a difference in mean safety knowledge scores between the groups (mean score 2.7 (SD 0.75) in the standard group versus 2.8 (SD 0.88) in the enhanced group versus 2.7 (SD 0.82) in the control group, P = 0.43).
Water safety knowledge
Terzidis 2007 studied prevention of water‐related injuries. The intervention group attended a day event, which consisted of a short audio‐visual presentation, a discussion about pupils' personal experiences, comments on how relevant events could have been averted and drama plays. There were also take‐home materials. The control group received no intervention. Among children in kindergarten and grade one, children in the intervention groups showed higher water safety knowledge postintervention compared to children in the control group (mean difference 17.40%, 95% CI 6.41% to 28.39%, P = 0.005). However, among children in higher grades in elementary school and in high school there was no evidence of a difference (P = 0.08 in elementary school and P = 0.92 in high school).
The quality of the evidence relating to both observed and self‐reported safety behaviours and practices was very low. This was due to studies being highly heterogeneous in their methods and with very poor reporting of methodologies, and many studies with high or unclear risk of bias across domains.
Health economic outcomes
Only one study included an economic analysis (Lu 2000). This was a multi‐component intervention involving classes, a booklet on injury prevention, letter to families, a mass media campaign, training of teachers in being alert to unsafe behaviour and a school injury reporting system. The overall cost of the programme was 9000RMB (Chinese Yuan). Before the intervention, there were 2016 cases of injuries, representing 12,418 lost school days. After the intervention, there were 708 lost school days (a decrease of 1162 from baseline) though this was not described in terms of cost‐effectiveness. The cost of treating injuries reduced from 145,152RMB before the intervention to 11,019RMB after the intervention, resulting in a saving of 134,136RMB. This was a 92.4% decrease from baseline and resulted in a net benefit of 125,136RMB after subtracting programme costs, giving a cost:benefit ratio of 1:13.90, that is, for every 1RMB spent, 13.90RMB was saved.
We assessed the evidence for this outcome to be very low, due to its limited applicability and high or unclear risk of bias across multiple domains.
Discussion
Summary of main results
The review includes 30 articles from 27 studies. Seven studies assessed injury occurrence, of which three were included in a meta‐analysis. This showed no strong evidence of a lower incidence rate in the intervention than control groups, and there was substantial heterogeneity (summary of findings Table for the main comparison). We rated this evidence as low quality because of this heterogeneity (inconsistency) and imprecision in the results. However, when we performed a sensitivity analysis and removed the non‐RCT from the analysis, there was stronger evidence of an effect and no heterogeneity, suggesting study design may explain the heterogeneity that occurred in the meta‐analysis. There was insufficient evidence to determine whether school‐based educational programmes can prevent unintentional injuries.
We were unable to pool data for our secondary outcomes, so our conclusions were limited, as they were drawn from highly diverse single studies and the body of evidence was rated as low (safety skills) or very low (behaviour, safety knowledge, health economic outcomes).
Two studies reported observed safety skills and both showed evidence of an improvement in the intervention group. However, again our confidence in this effect was limited as the evidence was of low quality (serious risk of selection bias, imprecision and inconsistency, but a large effect size countering this to some extent).
All four studies reporting observed safety behaviours and 13 of 19 studies describing self‐reported behaviour presented very low quality evidence in favour of the intervention. There was very low evidence in favour of an improvement in safety knowledge in the intervention group versus the control, with 19 of the 21 studies reporting improvements in all or some of the safety knowledge scores in the intervention groups. Studies which showed stronger evidence of an increase in knowledge comprised broadly similar elements as those which did not, so it was not possible to determine which elements might be most effective. The duration of the intervention did not appear to be associated with effectiveness.
Studies that examined self‐reported behaviour showed greater variation in findings, with over two‐thirds (13 out of 19, 68%) reporting an improvement and the remainder showing no evidence of a difference. The reason for this heterogeneity was not clear, as most incorporated similar elements (interactive sessions and audio‐visual equipment) into their curricula. Only one study reported economic outcomes and estimated a positive return on investment (very low quality evidence).
More high‐quality studies are needed to evaluate the impact of educational programmes on injury occurrence.
Overall completeness and applicability of evidence
We searched multiple large databases, in addition to handsearching, to obtain as many relevant full‐text reports as possible. We also included full‐text reports and abstracts written in languages other than English, and placed no time restrictions on the searches.
The review included studies from several high‐ and middle‐income countries, with rural and urban populations and children aged four to 18 years. This spread of populations and countries is likely to improve the generalisability of the review to similar populations, although there were only five studies from low‐ or middle‐income countries (China, Israel and Brazil). While some studies covered a broad range of mechanisms, others focused on more specific mechanisms or injury types (e.g. burns, pedestrian or agricultural injuries), thus potentially limiting their generalisability to other injury mechanisms.
Seven of the 27 studies reported the primary outcome. Of these, only three studies were similar enough to allow inclusion in the meta‐analysis. All three were based in China and so it is unclear how generalisable the results were to other countries and school systems. There was a wide range of injury mechanisms studied and types of interventions aimed at improving outcomes. These included a range of approaches (e.g. the provision of safety equipment, inclusion of families with letters and homework and in‐school lessons), often with some student involvement (peer teaching) and over differing times and intensities of one session to multiple sessions over one year. Only seven studies in our review referred to having used behavioural change or learning theories (or both) to develop the intervention they evaluated and how they were applied was often not described in detail. Specific examples included using the theory of planned behaviour which was used to develop the SPIY programme (Buckley 2010), social learning theory which was used to develop the i‐Play programme (Collard 2010), and self‐determination theory which capitalised on the 'teachable moment' after an injury to develop a post‐trauma programme (Cook 2006). Other authors referred more generally to having used applied behaviour or social theories, without describing their application in detail (e.g. Azeredo 2003; Greene 2002; Gresham 2001; Reed 2001).
Similarly, very few studies described the educational components of their interventions (e.g. learning theories, learning objectives, teaching methods, techniques or communication vehicles) in sufficient detail to enable us to assess how these impacted on our outcomes. While some studies did report using different pedagogical approaches for different age children, again there was insufficient detail reported to be able to define what worked best for children at different developmental stages.
Quality of the evidence
The quality of evidence was low for our primary outcome and low or very low for the secondary outcomes, indicating that further research is very likely to have an important impact on our confidence in the estimate of the effect. There are several reasons why the quality of the evidence was rated in this way.
Risk of bias has a serious impact on the overall quality of studies. For many of the included studies, it was difficult to assess the risk of bias due to inadequate reporting. Consequently, we judged a large number of studies to have an unclear risk of each source of bias. The majority of relevant studies had an unclear risk of random sequence generation and of allocation bias, with the remaining studies having high risk. The risk of performance and detection bias was high in most studies. The risk of attrition bias and reporting bias was split quite evenly between low, unclear and high risk. This was also true of confounding bias in the relevant studies. Most studies were at unclear risk of other bias, with the remaining studies split evenly between high and low risk. When only RCTs were examined for risk of bias, the findings were very similar to when we included all study designs. Common limitations in study design and reporting included: reporting only the number of participants for whom outcomes were measured rather than defining the selected groups of participants to be followed up, failing to include adequate detail on randomisation and failing to adequately take account of clustering, not undertaking intention‐to‐treat analyses and failing to present participant flow charts. Major sources of bias across most studies arose from an inability to blind participants to their allocation due to the nature of the interventions and a lack of blinding during outcome ascertainment.
Inconsistency was also a major factor in our lack of confidence in these study findings. The quality of the evidence for our primary outcome of medically or non‐medically attended injuries was downgraded for inconsistency, in part due to substantial statistical heterogeneity (I2 = 63%). When we performed sensitivity analysis and restricted the meta‐analysis to only RCTs, this had a substantial impact on the results, with the IRR reducing (from 0.73 (95% CI 0.49 to 1.08) to 0.59 (95% CI 0.49 to 0.72)) and the heterogeneity disappearing (I2 = 0%). This suggests that the non‐random study design of Lu 2000 may have contributed substantially to the heterogeneity we observe in the pooled analysis.
However, this may also be due to other differences between studies; for example, the intervention in the non‐RCT included a mass media campaign which the two RCTs did not, and which could have resulted in contamination between treatment groups (Lu 2000). Outcomes were also measured using different data collection methods, with varying potential for detection bias in the three studies: Lu 2000 collected injury data via weekly student injury events being entered into a central reporting system; Wang 2009 collected injury data via student self‐completed questionnaires administered at baseline and follow‐up and Zhao 2006 used a school injury surveillance system based on hospital and insurance company reports of injuries. In addition, it was unclear when injury data were collected in relation to the end of the intervention and difference in this may have contributed to heterogeneity.
For each of the other outcomes, there was substantial heterogeneity in terms of the size and in some cases, direction of the effect. This may be explained by variation in terms of what was measured and how. For example, there were 21 studies that assessed safety knowledge and 19 of these reported an improvement in at least one knowledge domain. However, the knowledge tested was extremely variable, as were the methods of data collection and instruments used.
Imprecision was also an issue for some of our outcomes, particularly safety skills, where we considered it to be serious due to the wide CIs in one of the two included studies and the paucity of data.
The quality of the evidence was not downgraded due to directness or generalisability, as most studies included all students in the school or class, and schools were mostly state schools which are likely to have children of a broad range of backgrounds, abilities and affluence.
Potential biases in the review process
We undertook a comprehensive search that included 28 bibliographic databases and websites. Although the database searches were conducted in English, LILACS includes studies from Latin American countries, and no language restrictions were placed on the search results. Several potential studies screened were translated from other languages including Russian, French, German and Chinese by native speakers prior to assessment for inclusion. We searched conference abstracts and the grey literature for unpublished studies. We were unable to assess publication bias using a funnel plot as only three studies were included in the meta‐analysis. It is possible that our searches failed to find some studies eligible to be included in our review.
Agreements and disagreements with other studies or reviews
There has been one previous review of school‐based injury prevention programmes (Mulvaney 2012), and several Cochrane and non‐Cochrane reviews of school‐based interventions aimed at changing safety behaviours relating to single injury mechanisms (Duperrex 2009; Mytton 2006; Owen 2011).
Mulvaney 2012 described safety education for a range of injury mechanisms but only one of the included studies in the review (Collard 2010) fulfilled the criteria for inclusion in our review. This was because the other school‐based studies in Mulvaney 2012 either did not have an appropriate control, or were focused on a single injury mechanism. They found no papers reporting the impact of safety education on injury rates but, consistent with our review, found a positive impact on knowledge, behaviour and skills although knowledge did not always translate into behaviour change. The authors highlighted the importance of involving children, families and communities in formulating injury prevention programmes, as well as using a multi‐disciplinary approach to deliver them.
Owen 2011 undertook a Cochrane Review of non‐legislative interventions to increase uptake of cycle helmet use. Although community‐based programmes were most effective in increasing helmet use, the review also reported evidence of an improvement among school‐based interventions (8 studies; OR 1.73, CI 95% 1.03 to 2.91). Free helmet giveaways were most effective in increasing helmet use, while programmes with subsidised helmets or education only had limited impact (3 studies; OR 1.43, 95% CI 1.09 to 1.88). This was echoed in a systematic review by Nauta 2014 of both community‐ and school‐based programmes, which also found that free safety equipment (e.g. cycle helmets) was most effective at increasing use of safety devices. Only one study in our review reported on the effect of free helmet giveaways, but did not find evidence of an impact of that intervention on observed behaviour (Azeredo 2003).
One Cochrane Review of school‐based education initiatives to prevent dog bites by Duperrex 2009 was not able to assess the primary outcome of reduced bites because of a lack of studies reporting this outcome. However, they did report changes in behaviour and found that education involving a 30‐minute session and letters to parents could improve children's knowledge, attitudes and behaviour when around dogs.
Mytton 2006 conducted a systematic review of school‐based initiatives aimed at children who were at risk of aggressive behaviour. The review found that elements (e.g. teaching relationship skills, as well as to a lesser extent, non‐response to provocative situations) could reduce aggressive behaviour in both primary‐ and secondary‐aged children although again, there was no clear evidence that this reduced violence‐related injury. This suggests that school‐based interventions can have a positive impact on behaviour, and mirrors the findings in some of the studies in our review.
There are also systematic reviews of school‐based interventions to reduce pupils' risky behaviour. Thomas 2006, in a Cochrane Review of school‐based programmes for preventing smoking, highlighted the importance of incorporating elements focused on social influences and social competence when designing a programme. This was also a finding by Faggiano 2005, who reported that programmes combining social influences and social competence were most effective at preventing marijuana use. In contrast, one Cochrane Review by Foxcroft 2011 found no conclusive evidence that school‐based interventions to prevent alcohol misuse were effective. In that review, in agreement with our review, some studies showed a positive effect in the intervention group, and others showed no effect.
Our review was unable to identify how useful surrogate measures, such as safety knowledge, were in predicting the impact of the intervention on the primary income of injury rates.
Finally, though not specifically assessing the impact on injury prevention outcomes, the results of one Cochrane Review of the World Health Organization's Health Promoting School framework provided evidence for the effectiveness this approach for some health behaviour interventions but not others, further supporting the school as a suitable setting for health improvement (Langford 2014).


PRISMA flow chart detailing the process of study selection for all studies included in the review. CBA: controlled before‐and‐after study; RCT: randomised controlled trial.

Risk of bias graph: review authors' judgements about each risk of bias item presented as percentages across all included studies.

Risk of bias summary: review authors' judgements about each risk of bias item for each included study.

Forest plot of comparison: 1 Injury rates, outcome: 1.1 Injury rates at follow‐up.

Comparison 1 Medically attended or non‐medically attended injury rates, Outcome 1 Injury rates at follow‐up, adjusted for baseline injury rates in non‐randomised studies.
| School injury prevention programmes compared to controls for the prevention of unintentional injuries in children and young people | ||||||
| Patient or population: children and young people | ||||||
| Outcomes | Anticipated absolute effects* (95% CI) | Relative effect | No of participants | Quality of the evidence | Comments | |
| Injury rate, adjusted for clustering, with control | Injury rate, adjusted for clustering, with School injury prevention programmes | |||||
| Self‐reported medically or non‐medically attended unintentional injuries or injuries with an unspecified intent (injury rates adjusted for clustering) | 367 per 1000 person‐years | 243 per 1000 person‐years | Rate ratio 0.76 | 12,977 (2073 person‐years adjusted for clustering) | ⊕⊕⊝⊝ | We excluded 4 studies from the meta‐analysis due to varied interventions (e.g. sports, agriculture or risk‐taking injury prevention). Their findings were consistent with the meta‐analysis studies. |
| Safety skills | Both studies found an improvement in observed safety skills (Kendrick 2007 ‐ fire and burn prevention skills: odds ratio 8.93 (95% CI 1.67 to 47.78, P = 0.01); Frederick 2000 ‐ basic life support skills, P < 0.005 for assessment of danger, responsiveness and circulation). | ‐ | 1751 | ⊕⊕⊝⊝ | Interventions and safety skills observed were varied in these 2 studies. | |
| Behaviour | All 4 studies (5 articles) reported that observed safety behaviour showed evidence of improved practices and 13/19 studies describing self‐reported behaviour reported improved practices. | ‐ | 52,950 | ⊕⊝⊝⊝ | Behaviours included safety equipment wearing, road risk‐taking behaviour, agriculture and sports‐related injury behaviours. | |
| Safety knowledge | Of the 21 studies assessing changes in safety knowledge, 19 reported an improvement in at least 1 question domain in the intervention compared to the control group. | ‐ | 55,732 (9 RCTs, 5 non‐RCTs, 7 CBA) | ⊕⊝⊝⊝ | Outcomes included a wide range of knowledge testing instruments and topics. | |
| Cost‐effectiveness | For every 1 Chinese Yuan spent, 13.90 was saved (cost:benefit ratio 1:13.9) | ‐ | 4639 | ⊕⊝⊝⊝ | Only 1 study reported economic outcomes and should, therefore, be interpreted with caution. | |
| CI: confidence interval; CBA: controlled before‐and‐after study; RCT: randomised controlled trial; non‐RCT: non‐randomised controlled trial. | ||||||
| GRADE Working Group grades of evidence | ||||||
| 1 Downgraded twice because of inconsistency as the I2 = 63%, indicating substantial heterogeneity and because there was imprecision in the results (the rate ratio was 0.76 but the confidence intervals spanned 1). Two of the studies were RCTs with a low risk of bias. 2 Downgraded twice because of a serious risk of bias (one of the two studies was a CBA resulting in selection biases relating to which schools participated in studies) and inconsistency, which was rated as serious because the two studies had different intervention types with different outcome measures. Imprecision was serious as there were wide confidence intervals in one of the two included studies, as well as a paucity of data. However, the effect sizes were classed as large as there was a nearly nine times greater odds of fire and burn prevention skills in the Risk Watch programme (Kendrick 2007), and 33% greater skills assessment in the Injury Minimisation Programme for Schools (IMPS) relating to assessment of danger (Frederick 2000). 3 Downgraded three times because 10 studies were CBA or non‐RCT design with high risk of selection bias of included schools, there was serious inconsistency in methods of collecting data and intervention types, and this may have contributed to the wide range of effect sizes and directions seen (no effect or some effect), There was often wide confidence intervals in results presented. 4 Downgraded three times because 11 studies were CBA or non‐RCT design with high risk of selection bias of included schools; there was serious inconsistency in knowledge tested, questionnaire designs and methods of collecting data, a wide range of intervention types and pedagogical approaches and this may have contributed to the wide range of effect sizes and directions seen (no effect or some effect). Results were presented in a way that often made precision difficult to compare. 5 Downgraded three times because this was one study, limited in applicability with high or unclear risk of bias across multiple domains. | ||||||
| Study ID | Age (years) | |||||||||||||
| 4/5 | 5/6 | 6/7 | 7/8 | 8/9 | 9/10 | 10/11 | 11/12 | 12/13 | 13/14 | 14/15 | 15/16 | 16/17 | 17/18 | |
| ‐ | ● | ● | ● | ● | ● | ● | ‐ | ‐ | ‐ | ‐ | ‐ | ‐ | ‐ | |
| ‐ | ‐ | ‐ | ‐ | ‐ | ‐ | ‐ | ‐ | ‐ | ‐ | ● | ‐ | ‐ | ‐ | |
| ‐ | ‐ | ‐ | ‐ | ‐ | ‐ | ‐ | ● | ● | ● | ● | ● | ‐ | ‐ | |
| ‐ | ‐ | ‐ | ‐ | ‐ | ‐ | ● | ● | ● | ● | ‐ | ‐ | ‐ | ‐ | |
| ‐ | ‐ | ‐ | ‐ | ‐ | ‐ | ‐ | ‐ | ‐ | ● | ‐ | ‐ | ‐ | ‐ | |
| ‐ | ‐ | ‐ | ‐ | ‐ | ‐ | ● | ● | ‐ | ‐ | ‐ | ‐ | ‐ | ‐ | |
| ‐ | ‐ | ‐ | ‐ | ● | ● | ● | ● | ‐ | ‐ | ‐ | ‐ | ‐ | ‐ | |
| ‐ | ‐ | ‐ | ‐ | ‐ | ‐ | ‐ | ‐ | ‐ | ‐ | ‐ | ● | ‐ | ‐ | |
| ‐ | ‐ | ‐ | ‐ | ‐ | ‐ | ● | ‐ | ‐ | ‐ | ‐ | ‐ | ‐ | ‐ | |
| ‐ | ‐ | ‐ | ‐ | ● | ● | ‐ | ‐ | ‐ | ‐ | ‐ | ‐ | ‐ | ‐ | |
| ‐ | ‐ | ● | ● | ● | ‐ | ‐ | ‐ | ‐ | ‐ | ‐ | ‐ | ‐ | ‐ | |
| ‐ | ‐ | ● | ● | ● | ‐ | ‐ | ‐ | ‐ | ‐ | ‐ | ‐ | ‐ | ‐ | |
| ‐ | ‐ | ● | ● | ● | ● | ‐ | ‐ | ‐ | ‐ | ‐ | ‐ | ‐ | ‐ | |
| ‐ | ‐ | ‐ | ‐ | ‐ | ‐ | ‐ | ‐ | ‐ | ‐ | ● | ● | ● | ‐ | |
| ‐ | ‐ | ● | ● | ● | ● | ● | ● | ● | ● | ● | ● | ‐ | ‐ | |
| ‐ | ‐ | ‐ | ‐ | ‐ | ‐ | ‐ | ‐ | ‐ | ‐ | ‐ | ● | ● | ● | |
| ‐ | ‐ | ‐ | ● | ● | ● | ‐ | ‐ | ‐ | ‐ | ‐ | ‐ | ‐ | ‐ | |
| ‐ | ‐ | ‐ | ‐ | ‐ | ‐ | ‐ | ‐ | ‐ | ‐ | ● | ● | ‐ | ‐ | |
| ● | ● | ● | ● | ● | ‐ | ‐ | ‐ | ‐ | ‐ | ‐ | ‐ | ‐ | ‐ | |
| ‐ | ‐ | ● | ● | ● | ● | ● | ● | ● | ● | ‐ | ‐ | ‐ | ‐ | |
| ‐ | ● | ● | ● | ● | ● | ● | ● | ● | ● | ● | ● | ● | ‐ | |
| ‐ | ‐ | ‐ | ‐ | ‐ | ‐ | ● | ● | ● | ‐ | ‐ | ‐ | ‐ | ‐ | |
| ‐ | ‐ | ‐ | ‐ | ‐ | ‐ | ‐ | ‐ | ● | ● | ● | ‐ | ‐ | ‐ | |
| ‐ | ● | ● | ● | ● | ● | ● | ‐ | ‐ | ‐ | ‐ | ‐ | ‐ | ‐ | |
| ‐ | ‐ | ‐ | ‐ | ‐ | ‐ | ‐ | ● | ● | ● | ● | ‐ | ‐ | ‐ | |
| ‐ | ‐ | ‐ | ● | ● | ● | ● | ● | ● | ‐ | ‐ | ‐ | ‐ | ‐ | |
| ‐ | ‐ | ● | ● | ● | ● | ● | ‐ | ‐ | ‐ | ‐ | ‐ | ‐ | ‐ | |
| ‐: not applicable; ●: age range covered. | ||||||||||||||
| Study ID | Injury mechanism | ||||||||||||
| Pedestrian | Cycle | Motorcycle | Vehicle (non‐specific) | Falls | Swimming/ drowning/ diving | Smoke/ fire/ flames | Heat and hot surfaces | Sport/ physical activity | Sun | Household safety | Agricultural injuries | Poisoning | |
| ‐ | ● | ‐ | ● | ‐ | ● | ● | ‐ | ‐ | ‐ | ‐ | ‐ | ‐ | |
| ● | ● | ● | ● | ‐ | ‐ | ‐ | ‐ | ‐ | ‐ | ‐ | ‐ | ● | |
| ‐ | ‐ | ‐ | ‐ | ‐ | ‐ | ● | ● | ● | ‐ | ● | ‐ | ● | |
| ‐ | ‐ | ‐ | ‐ | ‐ | ‐ | ● | ● | ‐ | ‐ | ‐ | ‐ | ‐ | |
| ‐ | ● | ● | ● | ‐ | ‐ | ‐ | ‐ | ‐ | ‐ | ‐ | ‐ | ‐ | |
| ‐ | ‐ | ‐ | ‐ | ‐ | ‐ | ‐ | ‐ | ● | ‐ | ‐ | ‐ | ‐ | |
| ● | ● | ‐ | ● | ‐ | ‐ | ‐ | ‐ | ‐ | ‐ | ‐ | ‐ | ‐ | |
| ‐ | ● | ● | ● | ● | ● | ‐ | ‐ | ‐ | ‐ | ‐ | ‐ | ‐ | |
| ● | ● | ● | ● | ‐ | ● | ● | ● | ‐ | ‐ | ● | ‐ | ● | |
| ‐ | ‐ | ‐ | ‐ | ‐ | ‐ | ● | ● | ‐ | ‐ | ‐ | ‐ | ‐ | |
| ● | ● | ‐ | ● | ‐ | ● | ‐ | ‐ | ● | ‐ | ‐ | ‐ | ‐ | |
| ‐ | ● | ‐ | ● | ‐ | ● | ‐ | ‐ | ● | ‐ | ‐ | ‐ | ‐ | |
| ● | ● | ‐ | ‐ | ● | ‐ | ● | ● | ‐ | ‐ | ‐ | ‐ | ● | |
| ‐ | ‐ | ‐ | ‐ | ‐ | ‐ | ‐ | ‐ | ‐ | ‐ | ‐ | ● | ‐ | |
| ● | ● | ● | ● | ● | ‐ | ‐ | ● | ● | ‐ | ‐ | ‐ | ‐ | |
| ● | ● | ● | ● | ‐ | ‐ | ‐ | ‐ | ‐ | ‐ | ‐ | ‐ | ‐ | |
| ‐ | ● | ‐ | ● | ‐ | ● | ‐ | ‐ | ● | ● | ‐ | ‐ | ‐ | |
| ‐ | ‐ | ‐ | ‐ | ‐ | ‐ | ‐ | ‐ | ‐ | ‐ | ‐ | ● | ‐ | |
| ● | ● | ● | ● | ● | ‐ | ‐ | ● | ‐ | ‐ | ‐ | ‐ | ||
| ‐ | ‐ | ‐ | ‐ | ● | ‐ | ‐ | ‐ | ‐ | ‐ | ‐ | ‐ | ‐ | |
| ‐ | ‐ | ‐ | ‐ | ‐ | ● | ‐ | ‐ | ‐ | ‐ | ‐ | ‐ | ‐ | |
| ● | ● | ‐ | ‐ | ‐ | ‐ | ‐ | ‐ | ‐ | ‐ | ‐ | ‐ | ‐ | |
| ‐ | ‐ | ‐ | ‐ | ‐ | ‐ | ‐ | ‐ | ‐ | ‐ | ‐ | ‐ | ‐ | |
| ‐ | ● | ‐ | ● | ‐ | ● | ‐ | ‐ | ‐ | ‐ | ‐ | ‐ | ‐ | |
| ● | ● | ● | ● | ‐ | ‐ | ‐ | ‐ | ‐ | ‐ | ‐ | ‐ | ‐ | |
| ● | ‐ | ● | ● | ‐ | ● | ‐ | ‐ | ‐ | ‐ | ● | ‐ | ● | |
| ● | ● | ● | ● | ‐ | ‐ | ‐ | ‐ | ‐ | ‐ | ‐ | ‐ | ‐ | |
| ‐: outcome not measured; ●: outcome measured. | |||||||||||||
| Outcome or subgroup title | No. of studies | No. of participants | Statistical method | Effect size |
| 1 Injury rates at follow‐up, adjusted for baseline injury rates in non‐randomised studies Show forest plot | 3 | 2073 | Rate Ratio (Random, 95% CI) | 0.73 [0.49, 1.08] |