Imaging modalities for characterising focal pancreatic lesions
Abstract
Background
Increasing numbers of incidental pancreatic lesions are being detected each year. Accurate characterisation of pancreatic lesions into benign, precancerous, and cancer masses is crucial in deciding whether to use treatment or surveillance. Distinguishing benign lesions from precancerous and cancerous lesions can prevent patients from undergoing unnecessary major surgery. Despite the importance of accurately classifying pancreatic lesions, there is no clear algorithm for management of focal pancreatic lesions.
Objectives
To determine and compare the diagnostic accuracy of various imaging modalities in detecting cancerous and precancerous lesions in people with focal pancreatic lesions.
Search methods
We searched the CENTRAL, MEDLINE, Embase, and Science Citation Index until 19 July 2016. We searched the references of included studies to identify further studies. We did not restrict studies based on language or publication status, or whether data were collected prospectively or retrospectively.
Selection criteria
We planned to include studies reporting cross‐sectional information on the index test (CT (computed tomography), MRI (magnetic resonance imaging), PET (positron emission tomography), EUS (endoscopic ultrasound), EUS elastography, and EUS‐guided biopsy or FNA (fine‐needle aspiration)) and reference standard (confirmation of the nature of the lesion was obtained by histopathological examination of the entire lesion by surgical excision, or histopathological examination for confirmation of precancer or cancer by biopsy and clinical follow‐up of at least six months in people with negative index tests) in people with pancreatic lesions irrespective of language or publication status or whether the data were collected prospectively or retrospectively.
Data collection and analysis
Two review authors independently searched the references to identify relevant studies and extracted the data. We planned to use the bivariate analysis to calculate the summary sensitivity and specificity with their 95% confidence intervals and the hierarchical summary receiver operating characteristic (HSROC) to compare the tests and assess heterogeneity, but used simpler models (such as univariate random‐effects model and univariate fixed‐effect model) for combining studies when appropriate because of the sparse data. We were unable to compare the diagnostic performance of the tests using formal statistical methods because of sparse data.
Main results
We included 54 studies involving a total of 3,196 participants evaluating the diagnostic accuracy of various index tests. In these 54 studies, eight different target conditions were identified with different final diagnoses constituting benign, precancerous, and cancerous lesions. None of the studies was of high methodological quality. None of the comparisons in which single studies were included was of sufficiently high methodological quality to warrant highlighting of the results. For differentiation of cancerous lesions from benign or precancerous lesions, we identified only one study per index test. The second analysis, of studies differentiating cancerous versus benign lesions, provided three tests in which meta‐analysis could be performed. The sensitivities and specificities for diagnosing cancer were: EUS‐FNA: sensitivity 0.79 (95% confidence interval (CI) 0.07 to 1.00), specificity 1.00 (95% CI 0.91 to 1.00); EUS: sensitivity 0.95 (95% CI 0.84 to 0.99), specificity 0.53 (95% CI 0.31 to 0.74); PET: sensitivity 0.92 (95% CI 0.80 to 0.97), specificity 0.65 (95% CI 0.39 to 0.84). The third analysis, of studies differentiating precancerous or cancerous lesions from benign lesions, only provided one test (EUS‐FNA) in which meta‐analysis was performed. EUS‐FNA had moderate sensitivity for diagnosing precancerous or cancerous lesions (sensitivity 0.73 (95% CI 0.01 to 1.00) and high specificity 0.94 (95% CI 0.15 to 1.00), the extremely wide confidence intervals reflecting the heterogeneity between the studies). The fourth analysis, of studies differentiating cancerous (invasive carcinoma) from precancerous (dysplasia) provided three tests in which meta‐analysis was performed. The sensitivities and specificities for diagnosing invasive carcinoma were: CT: sensitivity 0.72 (95% CI 0.50 to 0.87), specificity 0.92 (95% CI 0.81 to 0.97); EUS: sensitivity 0.78 (95% CI 0.44 to 0.94), specificity 0.91 (95% CI 0.61 to 0.98); EUS‐FNA: sensitivity 0.66 (95% CI 0.03 to 0.99), specificity 0.92 (95% CI 0.73 to 0.98). The fifth analysis, of studies differentiating cancerous (high‐grade dysplasia or invasive carcinoma) versus precancerous (low‐ or intermediate‐grade dysplasia) provided six tests in which meta‐analysis was performed. The sensitivities and specificities for diagnosing cancer (high‐grade dysplasia or invasive carcinoma) were: CT: sensitivity 0.87 (95% CI 0.00 to 1.00), specificity 0.96 (95% CI 0.00 to 1.00); EUS: sensitivity 0.86 (95% CI 0.74 to 0.92), specificity 0.91 (95% CI 0.83 to 0.96); EUS‐FNA: sensitivity 0.47 (95% CI 0.24 to 0.70), specificity 0.91 (95% CI 0.32 to 1.00); EUS‐FNA carcinoembryonic antigen 200 ng/mL: sensitivity 0.58 (95% CI 0.28 to 0.83), specificity 0.51 (95% CI 0.19 to 0.81); MRI: sensitivity 0.69 (95% CI 0.44 to 0.86), specificity 0.93 (95% CI 0.43 to 1.00); PET: sensitivity 0.90 (95% CI 0.79 to 0.96), specificity 0.94 (95% CI 0.81 to 0.99). The sixth analysis, of studies differentiating cancerous (invasive carcinoma) from precancerous (low‐grade dysplasia) provided no tests in which meta‐analysis was performed. The seventh analysis, of studies differentiating precancerous or cancerous (intermediate‐ or high‐grade dysplasia or invasive carcinoma) from precancerous (low‐grade dysplasia) provided two tests in which meta‐analysis was performed. The sensitivity and specificity for diagnosing cancer were: CT: sensitivity 0.83 (95% CI 0.68 to 0.92), specificity 0.83 (95% CI 0.64 to 0.93) and MRI: sensitivity 0.80 (95% CI 0.58 to 0.92), specificity 0.81 (95% CI 0.53 to 0.95), respectively. The eighth analysis, of studies differentiating precancerous or cancerous (intermediate‐ or high‐grade dysplasia or invasive carcinoma) from precancerous (low‐grade dysplasia) or benign lesions provided no test in which meta‐analysis was performed.
There were no major alterations in the subgroup analysis of cystic pancreatic focal lesions (42 studies; 2086 participants). None of the included studies evaluated EUS elastography or sequential testing.
Authors' conclusions
We were unable to arrive at any firm conclusions because of the differences in the way that study authors classified focal pancreatic lesions into cancerous, precancerous, and benign lesions; the inclusion of few studies with wide confidence intervals for each comparison; poor methodological quality in the studies; and heterogeneity in the estimates within comparisons.
Plain language summary
Accuracy of different imaging techniques for determining whether a pancreatic tumour is cancerous
Background
The pancreas is an organ in the abdomen that secretes pancreatic juice, which aids digestion and contains cells that produce important hormones such as insulin. Increasingly, abnormalities in the pancreas are noted in people undergoing routine scans, such as ultrasound or computed tomography (CT) scans, in the form of what are known as 'shadows', which may be described as focal pancreatic lesion, pancreatic mass, pancreatic tumour, pancreatic cyst, or pancreatic nodule. A significant proportion of focal pancreatic lesions are benign (non‐cancerous) lesions requiring no treatment. Surgical removal of the tumour is the main method of treatment for precancerous (i.e. focal pancreatic lesions that are not full‐blown cancer and do not have the ability to spread like cancer, but can turn into cancer) and cancerous focal pancreatic lesions. New methods are being developed for treating precancerous lesions, such as using heat to destroy the tumour. Surgical removal remains the only potentially curative treatment for people with limited pancreatic cancer. It is thus important to characterise whether a focal pancreatic lesion is non‐cancerous, precancerous, or cancerous. A number of scans are available for characterising the nature of the focal pancreatic lesion, which include the following.
• Computed tomography (CT) scan: a series of X‐rays taken from different angles, which are then reconstructed using a computer.
• Magnetic resonance imaging (MRI): the use of a powerful magnet to produce images of different tissues of the body.
• Positron emission tomography (PET): the use of a small amount of radioactive glucose (sugar) to differentiate between different tissues. It takes advantage of the tendency of cancer cells to use more glucose than normal cells.
• Endoscopic ultrasound (also known as endosonography or EUS): the use of an endoscope, a camera introduced into a body cavity to view the inside of the body. An ultrasound (high‐energy sound waves) probe at the end of the endoscope is used to differentiate tissues.
• EUS elastography: this measures the stiffness of the lesion, which is used to identify whether the lesion is cancerous.
• EUS‐guided biopsy: the removal of cells or tissues for examination under a microscope or to perform other tests on the cells or tissue.
At present it is unclear how effective different scans are in characterising focal pancreatic lesions.
Study characteristics
We performed a thorough literature search for studies reporting the accuracy of different scans until 19 July 2016. We identified 54 studies reporting information on 3196 people with focal pancreatic lesions. These studies evaluated one or more of the above tests and compared these test results with the eventual diagnosis provided by surgical removal of the lesion and examination under microscope. There were no diagnostic test accuracy studies of EUS elastography or studies that looked at multiple scans rather than single scans.
Key results
Variations in how studies defined precancerous and cancerous lesions meant that we were not able to combine the data to provide the overall results for many tests. We were unable to arrive at any firm conclusions for the following reasons.
• The way that study authors classified focal pancreatic lesions into cancerous, precancerous, and benign lesions was not consistent in different studies.
• The studies included few participants, leading to significant uncertainty in the results.
• The studies were of poor methodological quality, which introduced additional uncertainty in the results.
• Even among the studies that classified focal pancreatic lesions into cancerous, precancerous, and benign lesions in a similar manner, the results were not consistent.
Quality of evidence
All of the studies were of low methodological quality, which may result in arriving at false conclusions.
Authors' conclusions
Summary of findings
| Name of test | Number of studies (number of participants) | Sensitivity (95% CI) | Specificity (95% CI) | Post‐test probability of positive test* (95% CI) | Post‐test probability of negative test* (95% CI) | Number of false positives per 100 positive index test results (95% CI) | Number of false negatives per 100 negative index test results (95% CI) | Risk of bias | Applicability concerns | Uncertainty (due to inconsistency or inability to assess inconsistency, and random errors because of overall small sample size) |
| Cancerous versus benign or precancerous (median pre‐test probability: 63%) | ||||||||||
| EUS‐FNA (cytology) | 1 (45) | 0.79 (0.60 to 0.91) | 1.00 (0.85 to 1.00) | 98% (79% to 100%) | 26% (14% to 43%) | 2 (0 to 21) | 26 (14 to 43) | Unclear | High | High |
| EUS‐FNA (CEA > 500 ng/mL) | 1 (24) | 0.93 (0.70 to 0.99) | 0.33 (0.12 to 0.65) | 70% (59% to 79%) | 25% (4% to 73%) | 30 (21 to 41) | 25 (4 to 73) | High | High | High |
| PET (criteria unspecified) | 1 (76) | 0.85 (0.73 to 0.92) | 0.91 (0.72 to 0.97) | 94% (81% to 98%) | 21% (12% to 34%) | 6 (2 to 19) | 21 (12 to 34) | Unclear | High | High |
| Cancerous versus benign (median pre‐test probability: 70%) | ||||||||||
| EUS | 2 (133) | 0.95 (0.84 to 0.99) | 0.53 (0.31 to 0.74) | 82% (74% to 88%) | 18% (6% to 45%) | 18 (12 to 26) | 18 (6 to 45) | Unclear or high | High | High |
| EUS‐FNA (cytology) | 3 (147) | 0.79 (0.07 to 1.00) | 1.00 (0.91 to 1.00) | 99% (90% to 100%) | 32% (2% to 92%) | 0 (0 to 9) | 32 (2 to 92) | High | High | High |
| PET (criteria unspecified) | 3 (99) | 0.92 (0.80 to 0.97) | 0.65 (0.39 to 0.85) | 86% (75% to 92%) | 22% (9% to 44%) | 14 (8 to 25) | 22 (9 to 44) | High | High | High |
| PET (SUVmax > 3.5) | 1 (80) | 0.96 (0.87 to 0.99) | 0.62 (0.43 to 0.78) | 85% (78% to 90%) | 12% (3% to 36%) | 15 (10 to 22) | 12 (3 to 36) | High | High | High |
| CT | 2 (123) | 0.98 (0.00 to 1.00) | 0.76 (0.02 to 1.00) | 90% (17% to 100%) | 6% (0% to 100%) | 10 (0 to 83) | 6 (0 to 100) | Unclear or high | High | High |
| MRI | 1 (29) | 0.80 (0.58 to 0.92) | 0.89 (0.57 to 0.98) | 94% (72% to 99%) | 34% (17% to 56%) | 6 (1 to 28) | 34 (17 to 56) | High | High | High |
| Precancerous or cancerous versus benign (median pre‐test probability: 71%) | ||||||||||
| EUS | 1 (34) | 0.92 (0.74 to 0.98) | 0.60 (0.31 to 0.83) | 85% (72% to 92%) | 25% (7% to 58%) | 15 (8 to 28) | 25 (7 to 58) | High | High | High |
| EUS‐FNA (cytology) | 2 (52) | 0.73 (0.01 to 1.00) | 0.94 (0.15 to 1.00) | 97% (25% to 100%) | 41% (1% to 98%) | 3 (0 to 75) | 41 (1 to 98) | Unclear or high | High | High |
| EUS‐FNA (CEA > 50 ng/mL) | 1 (11) | 0.29 (0.08 to 0.64) | 0.25 (0.05 to 0.70) | 48% (20% to 77%) | 87% (54% to 98%) | 52 (23 to 80) | 87 (54 to 98) | High | High | High |
| PET (SUVmax 2.4) | 1 (32) | 0.94 (0.74 to 0.99) | 0.93 (0.69 to 0.99) | 97% (83% to 100%) | 13% (2% to 49%) | 3 (0 to 17) | 13 (2 to 49) | High | High | High |
| CT | 1 (48) | 0.62 (0.45 to 0.76) | 0.64 (0.39 to 0.84) | 81% (66% to 90%) | 59% (44% to 72%) | 19 (10 to 34) | 59 (44 to 72) | Unclear | High | High |
| MRI | 1 (27) | 0.93 (0.69 to 0.99) | 0.85 (0.58 to 0.96) | 94% (80% to 98%) | 17% (3% to 58%) | 6 (2 to 20) | 17 (3 to 58) | High | High | High |
| Cancerous (invasive carcinoma) versus precancerous (dysplasia) (median pre‐test probability: 27%) | ||||||||||
| EUS | 5 (156) | 0.78 (0.45 to 0.94) | 0.91 (0.61 to 0.98) | 75% (37% to 94%) | 8% (3% to 22%) | 25 (6 to 63) | 8 (3 to 22) | Unclear or high | High | High |
| EUS‐FNA (cytology) | 3 (158) | 0.66 (0.03 to 0.99) | 0.92 (0.73 to 0.98) | 75% (29% to 95%) | 12% (1% to 69%) | 25 (5 to 71) | 12 (1 to 69) | Unclear or high | High | High |
| EUS‐FNA (CEA > 200 ng/mL) | 1 (41) | 1.00 (0.57 to 1.00) | 0.64 (0.48 to 0.78) | 51% (40% to 61%) | Not estimable | 49 (39 to 60) | Not estimable | High | High | High |
| CT | 6 (326) | 0.72 (0.50 to 0.87) | 0.92 (0.81 to 0.97) | 78% (57% to 91%) | 10% (5% to 18%) | 22 (9 to 43) | 10 (5 to 18) | Unclear or high | High | High |
| MRI | 1 (32) | 0.75 (0.30 to 0.95) | 0.93 (0.77 to 0.98) | 80% (48% to 94%) | 9% (2% to 35%) | 20 (6 to 52) | 9 (2 to 35) | High | High | High |
| Cancerous (high‐grade dysplasia or invasive carcinoma) versus precancerous (low‐ or intermediate‐grade dysplasia) (median pre‐test probability: 45%) | ||||||||||
| EUS | 4 (196) | 0.86 (0.74 to 0.92) | 0.91 (0.83 to 0.96) | 89% (80% to 94%) | 11% (7% to 19%) | 11 (6 to 20) | 11 (7 to 19) | High | High | High |
| EUS‐FNA (cytology) | 3 (310) | 0.47 (0.24 to 0.70) | 0.91 (0.32 to 1.00) | 81% (19% to 99%) | 32% (22% to 45%) | 19 (1 to 81) | 32 (22 to 45) | Unclear or high | High | High |
| EUS‐FNA (CEA > 200 ng/mL) | 3 (160) | 0.58 (0.28 to 0.83) | 0.51 (0.19 to 0.81) | 49% (28% to 70%) | 40% (19% to 65%) | 51 (30 to 72) | 40 (19 to 65) | High | High | High |
| EUS‐FNA (CA 19‐9 > 1000 U/mL) | 1 (41) | 0.90 (0.60 to 0.98) | 0.42 (0.26 to 0.59) | 56% (47% to 65%) | 16% (3% to 57%) | 44 (35 to 53) | 16 (3 to 57) | High | High | High |
| EUS‐FNA (CEA > 692.8 ng/mL) | 1 (20) | 0.80 (0.49 to 0.94) | 0.90 (0.60 to 0.98) | 87% (50% to 98%) | 15% (5% to 39%) | 13 (2 to 50) | 15 (5 to 39) | Unclear | High | High |
| PET (SUVmax > 2 to 2.5) | 4 (124) | 0.90 (0.79 to 0.96) | 0.94 (0.81 to 0.99) | 93% (78% to 98%) | 8% (4% to 16%) | 7 (2 to 22) | 8 (4 to 16) | High | High | High |
| CT | 3 (139) | 0.87 (0.00 to 1.00) | 0.96 (0.00 to 1.00) | 95% (0% to 100%) | 10% (0% to 100%) | 5 (0 to 100) | 10 (0 to 100) | Unclear or high | High | High |
| MRI | 3 (189) | 0.69 (0.44 to 0.86) | 0.93 (0.43 to 1.00) | 89% (35% to 99%) | 21% (12% to 36%) | 11 (1 to 65) | 21 (12 to 36) | High | High | High |
| Cancerous (invasive carcinoma) versus precancerous (low‐grade dysplasia) (median pre‐test probability: 21%) | ||||||||||
| EUS | 1 (51) | 0.77 (0.50 to 0.92) | 0.89 (0.76 to 0.96) | 67% (43% to 84%) | 7% (3% to 16%) | 33 (16 to 57) | 7 (3 to 16) | Unclear | High | High |
| CT | 1 (46) | 0.50 (0.22 to 0.78) | 0.95 (0.83 to 0.99) | 72% (36% to 92%) | 13% (7% to 22%) | 28 (8 to 64) | 13 (7 to 22) | High | High | High |
| Precancerous or cancerous (intermediate‐ or high‐grade dysplasia or invasive carcinoma) versus precancerous (low‐grade dysplasia) (median pre‐test probability: 59%) | ||||||||||
| CT | 3 (106) | 0.83 (0.68 to 0.92) | 0.83 (0.64 to 0.93) | 89% (56% to 98%) | 33% (18% to 52%) | 11 (2 to 44) | 33 (18 to 52) | High | High | High |
| MRI | 2 (71) | 0.80 (0.58 to 0.92) | 0.81 (0.53 to 0.95) | 86% (67% to 95%) | 27% (13% to 47%) | 14 (5 to 33) | 27 (13 to 47) | High | High | High |
| Precancerous or cancerous (intermediate‐ or high‐grade dysplasia or invasive carcinoma) versus precancerous (low‐grade dysplasia) or benign (median pre‐test probability: 43%) | ||||||||||
| EUS | 1 (70) | 0.97 (0.83 to 0.99) | 0.40 (0.26 to 0.55) | 55% (48% to 61%) | 6% (1% to 31%) | 45 (39 to 52) | 6 (1 to 31) | High | High | High |
| *Post‐test probability was calculated at the median pre‐test probability. Abbreviations: CA 19‐9: carbohydrate antigen 19‐9 | ||||||||||
Background
(Please see the glossary in Appendix 1 for terms that have not been described in the main text.)
A 'shadow’ identified in the pancreas on imaging may be variously described as a focal pancreatic lesion, pancreatic mass, pancreatic tumour, pancreatic cyst, or pancreatic nodule. This phrasing refers to focal lesions, as opposed to diffuse changes of the pancreas, and includes solid and cystic lesions of the pancreas. In the Western world, the prevalence of focal pancreatic lesions is approximately 1.2% and is increasing steadily (by approximately 8%) each year, with smaller and asymptomatic lesions being identified more frequently (Gaujoux 2011; Spinelli 2004). An incidental pancreatic lesion is one that is detected in the pancreas of a patient who undergoes radiological investigations for an unrelated medical condition (Sachs 2009). Such asymptomatic incidental lesions represent 55% to 60% of pancreatic tumours (Gaujoux 2011; Spinelli 2004). Some focal pancreatic lesions may be associated with symptoms, depending upon their size and nature. The symptoms of pancreatic cancer, which generally refers to pancreatic adenocarcinoma, can include obstructive jaundice (yellowish discolouration of the skin and the whites of the eyes with dark urine and pale stool due to blockage of bile duct (National Cancer Institute 2011a), a tube that transports the bile from the liver), loss of appetite, and abdominal pain (Holly 2004). The symptoms of pancreatic neuroendocrine tumours (tumours arising from cells that secrete hormones), some of which may be cancer, are related to the excessive secretion of hormones (by the tumour) such as insulin, glucagon, gastrin, somatostatin, and vasoactive peptide resulting in hypoglycaemia (decreased blood sugar), hyperglycaemia (increased blood sugar, a rare cause of diabetes), and gastrointestinal disturbances such as peptic ulcer and diarrhoea (Batcher 2011). The symptoms of chronic pancreatitis (chronic inflammation of the pancreas that can result in alteration in the structure and function of the pancreas) are abdominal and back pain and those symptoms related to pancreatic insufficiency, which include steatorrhoea, malabsorption, vitamin deficiency, diabetes, or weight loss (Braganza 2011; Nair 2007). About 40% of people with focal pancreatic lesions have chronic pancreatitis (Spinelli 2004). In the remaining 60% of people with focal pancreatic lesions, the remaining pancreas is normal.
Focal pancreatic lesions can be benign (serous pancreatic cystadenoma, acinar cell cystadenoma, papillary cysts, lymphoepithelial cysts, simple cysts), precancerous (intraductal papillary mucinous neoplasm (IPMN) with dysplasia but without invasive cancer, mucinous cystic neoplasm (MCN), benign neuroendocrine tumours), or cancer (ductal adenocarcinoma, acinar cell carcinoma, IPMN with invasive carcinoma, cystadenocarcinoma, pancreatoblastoma, solid pseudo‐papillary neoplasm, cancer neuroendocrine tumours) (Luttges 2011; Sachs 2009; Spinelli 2004; WHO 2016). Dysplasia can be low grade, intermediate grade, or high grade (WHO 2016). About 80% of benign lesions, 50% of precancerous lesions, and 20% of cancerous lesions are asymptomatic (Spinelli 2004). Focal pancreatic lesions can be solid or cystic or mixed solid and cystic tumours (Cho 2011).
Surgical resection is generally considered to be the only curative treatment for pancreatic cancer. Worldwide, only 15% to 20% of people with pancreatic cancer undergo potentially curative resection (Conlon 1996; Engelken 2003; Katz 2009; Michelassi 1989; Shahrudin 1997; Smith 2008). In the remaining patients, the cancers are not resected because of infiltration of local structures or disseminated disease. Early diagnosis of pancreatic cancer might enable resection of the pancreatic cancer before it is too late to resect. Pancreatic resection is a major surgery, with an approximately 1% to 25% risk of perioperative death reported worldwide (Conlon 1996; Katz 2009; Michelassi 1989; Shahrudin 1997; van Oost 2006). High‐volume centres show a lower perioperative mortality of less than 5% compared to low‐volume centres, which are associated with a perioperative mortality of up to 25% (Gurusamy 2013; van Oost 2006). Pancreatic resection is also associated with an about 40% morbidity rate (Gurusamy 2013; van der Gaag 2010). Only 5% to 25% of patients survive for five years (Conlon 1996; Katz 2009; Michelassi 1989; Shahrudin 1997). Surgery is generally offered if there are features suggestive of precancerous or cancerous lesions (Lee 2005c), although some clinicians prefer sequential follow‐up (by imaging) of precancerous lesions to surgical resection (Irie 2004). Surgery is offered when there is an increase in the size or morphology (the way the lesion appears) of the lesion in sequential imaging (Gaujoux 2011). Surgery is also offered when there is considerable uncertainty as to the nature of the lesion. In some ways, surgery can be considered as a diagnostic test for characterisation of the lesion and as a treatment for people with cancerous and precancerous lesions. Histological confirmation of the lesion by percutaneous biopsy is generally not performed because of difficulty in accessing the lesion percutaneously and because of dissemination of cancer cells.
Target condition being diagnosed
-
Cancerous versus benign or precancerous lesions.
-
Precancerous or cancerous (including the type of cancerous lesion) versus benign lesions.
Index test(s)
Computed tomography (CT) scan
This involves a series of X‐rays taken from different angles, which are then reconstructed using a computer (National Cancer Institute 2011a). Morphological features of the lesion, such as density, regularity of margins, vascularity, and the diameter of the pancreatic duct, are taken into account to characterise the lesion. The main side effect of CT scan is the ionising radiation (radioactivity) associated with it. Everyone is exposed to very small amounts of radiation (background radiation). One CT scan of the abdomen is equivalent to approximately three years of background radiation (Fred 2004). In addition, the contrast material (dye used to view the structures better) can cause allergic reactions, such as difficulty breathing, or kidney damage, particularly in people with pre‐existing kidney disease (Namasivayam 2006).
Magnetic resonance imaging (MRI)
This involves the use of a powerful magnet to produce images of different tissues of the body. Magnetic resonance imaging is also known as nuclear magnetic resonance imaging (NMRI) (National Cancer Institute 2011b). Similar features as those employed in CT scan are used to characterise the lesion. While MRI does not use radiation, it is contraindicated in people with metallic implants such as artificial joints, those with cardiac pacemakers (devices used to control heart rhythm), and those with claustrophobia (fear of closed spaces) (Dill 2008). Some of the contrasts used can also cause kidney damage (Dill 2008).
Positron emission tomography (PET)
This involves the use of a small amount of radioactive glucose (sugar) to differentiate between different tissues. It takes advantage of the tendency of cancer cells to use more glucose than normal cells. Positron emission tomography is also known as PET scan (National Cancer Institute 2011c). Cancerous lesions appear as areas of increased uptake. Positron emission tomography also uses ionising radiation (Leide‐Svegborn 2010). The radiation exposure to one PET scan is similar to that in one CT scan of abdomen (Fred 2004; Leide‐Svegborn 2010).
Endoscopic ultrasound (EUS)
This involves the use of an endoscope, a camera introduced into a body cavity to view the inside of the body. An ultrasound (high‐energy sound waves) probe at the end of the endoscope is used to differentiate tissues. Endoscopic ultrasound is also known as endosonography (National Cancer Institute 2011d). Features such as echogenicity and regularity of margins are taken into account and used to characterise the lesion. Complications following EUS are rare and include perforation (Benson 2010; Niv 2011).
EUS elastography
This measures the stiffness of the lesion, which can be used to identify whether the lesion is benign or cancerous (Iglesias‐Garcia 2010). The complications associated with EUS elastography are the same as with EUS.
EUS‐guided biopsy
This is the removal of cells or tissues for examination by a pathologist. The pathologist may study the tissue under a microscope or perform other tests on the cells or tissue. There are many different types of biopsy procedures. The most common types include:
-
incisional biopsy, in which only a sample of tissue is removed;
-
excisional biopsy, in which an entire lump or suspicious area is removed; and
-
needle biopsy, in which a sample of tissue or fluid is removed with a needle. When a wide needle is used the procedure is called a core biopsy. When a thin needle is used the procedure is called a fine‐needle aspiration biopsy (FNAB) (National Cancer Institute 2011e).
Because of the risk of dissemination from cancer, EUS‐guided biopsy is preferable to percutaneous (image‐guided) biopsy (Micames 2003). The examinations under the microscope used may include the routine haemotoxylin and eosin stain for core biopsy and special staining for FNAB (Mehta 2010). Immunocytochemistry and proteomic profiling to identify the presence of biomarkers in the tissue may also be used in the diagnosis (Cui 2009; Mehta 2010). A positive core biopsy can confirm cancer, but a negative core biopsy cannot rule out cancer. Cytology results are not quite as reliable as core biopsy as false‐positive cytology has been reported (Hancke 1984).
Complications associated with EUS‐guided biopsy include those associated with EUS as well as bleeding (Benson 2010; Niv 2011).
Of these index tests, the commonly available tests are CT scan and MRI. The remaining tests (PET, EUS, EUS elastography, and EUS‐guided biopsy) are available in major tertiary centres only.
Clinical pathway
There is no standard algorithm in the diagnosis or management of focal pancreatic lesions. The algorithm may vary from one centre to another and even within the same centre (Gaujoux 2011; Goh 2006b). One possible diagnostic clinical pathway is shown in Figure 1. As noted in Figure 1, an increase in the size of or change of morphological features is one of the reasons that surgeons recommend surgical excision, as this may indicate that the lesion was malignant in the first instance (without features suggestive of malignancy in the original scan) or has transformed into a malignant lesion. The interval for sequential scans is variable. Our local protocol advises sequential scanning in one year in the absence of malignant features. It is important to distinguish whether the focal pancreatic lesion is benign with no cancer potential so that unnecessary surgery and anxiety can be avoided. It is also important to know whether the lesion is precancerous or cancerous so that an informed decision about surgery can be made after weighing the potential benefits and harms. In addition, new alternative treatments such as radiofrequency ablation (destruction of tissue using radiofrequency waves) are being evaluated for precancerous lesions (Pereira 2015). It is also necessary to differentiate the different types of cancer, since different malignancies carry different prognoses (Klempnauer 1995). Some surgeons follow the single‐test strategy, that is making decisions based on the features of the lesion in a single test, while others follow repeated testing (repeating the imaging modality or using a different imaging modality), particularly if the nature of the lesion is indeterminate. The optimal interval between the tests in the repeated‐testing strategy is unknown.
Clinical pathway.
Abbreviations:
Ca 19‐9: carbohydrate antigen 19‐9
CT: computed tomography
EUS: endoscopic ultrasound
MRI: magnetic resonance imaging
PET: positron emission tomography
Prior test(s)
The tests that occur prior to pancreatic imaging depend on how the patient presents. The investigation may be targeted if the patient presents with abdominal symptoms, however it is equally possible that the pancreatic lesion is an incidental finding on an abdominal scan for an alternative reason. As pancreatic cancer is relatively late presenting (Porta 2005), the number of incidental lesions found will be high comparative to other cancers where symptoms will primarily drive discovery. Whilst CT, MRI, and PET may identify incidental lesions, EUS and EUS‐guided fine‐needle aspiration (EUS‐FNA) are the likely second test for known lesions of symptomatic individuals.
Role of index test(s)
All of the index tests described are used primarily to characterise pancreatic lesions as either benign or cancerous, or more importantly as needing significant or more conservative treatment. The location of the pancreas makes percutaneous biopsy dangerous because of the risk of cancer spread, therefore determination of cancer stage and consequently required treatment must be made non‐invasively by the imaging techniques and by EUS‐FNA.
Alternative test(s)
Computed tomography is usually part of a standard algorithm for assessing focal pancreatic lesions (Gaujoux 2011). If the incidental lesion is detected on CT scan, then CT scan can be the only investigation, since the added value of the other tests is not known. One or more of the above tests may be used in addition to, or instead of, CT scan. Diagnostic laparoscopy and laparoscopic ultrasound are other tests that may be used in the differential diagnosis of focal pancreatic lesions; however, these tests are not used routinely. Serum carbohydrate antigen 19‐9 (CA 19‐9) is a substance released into the bloodstream by both cancer cells and normal cells and is used as a type of tumour marker (National Cancer Institute 2011f). Excessive CA 19‐9 in the blood can be a sign of pancreatic cancer or other types of cancer or conditions. The amount of CA 19‐9 in the blood can be used to measure how effective cancer treatments are or if cancer has returned. It can be used in conjunction with other imaging modalities in the assessment of the focal pancreatic lesion.
Rationale
The various imaging modalities use different methods to differentiate normal and diseased tissues. Endoscopic ultrasound is closer to the tissues and therefore high‐frequency ultrasound waves can be used, which have better resolution but poorer penetration than an external ultrasound. Image‐guided biopsy can be performed and the tissue can be examined under the microscope to differentiate between types of focal pancreatic lesion.
Accurate characterisation of lesions will help in patient management. Patients with cancerous lesions will be offered surgery if there is no distant spread of cancer and assuming they are fit for major surgery. Patients with cancerous lesions who are not eligible for surgery because of distant spread of cancer or lack of fitness for major surgery will be offered other treatments such as chemotherapy. Patients with precancerous lesions may also undergo surgery or ablation depending upon the clinician and patient preferences. Unnecessary major surgery can be avoided in patients with benign lesions.
There is currently no Cochrane review of studies assessing the diagnostic accuracy of different imaging modalities in the assessment of focal pancreatic lesions.
Objectives
To determine and compare the diagnostic accuracy of various imaging modalities in detecting cancerous and precancerous lesions in people with focal pancreatic lesions.
Secondary objectives
We planned to explore the following sources of heterogeneity.
-
Studies at low risk of bias versus those at unclear or high risk of bias (as assessed by the revised Quality Assessment of Diagnostic Accuracy Studies (QUADAS) tool as recommended by the Cochrane Screening and Diagnostic Tests Methods Group) (Whiting 2006). In particular, we considered the studies classified as 'yes' for the items differential verification, un‐interpretable results, and withdrawals as the most important sources of heterogeneity.
-
Full‐text publications versus abstracts (this might be indicative of publication bias, since there may be an association between the results of the study and the study reaching full publication) (Eloubeidi 2001).
-
Prospective studies versus retrospective studies.
-
Different types of reference standard.
-
Symptomatic versus asymptomatic lesions (the presence of symptoms may increase the pre‐test probability).
-
Solid versus cystic lesions (as the diagnostic accuracy of the imaging modalities may vary depending upon whether the lesion is solid or cystic).
-
Participants with chronic pancreatitis versus those without chronic pancreatitis.
-
Different criteria used by the authors to classify the lesions.
-
Single imaging versus sequential imaging (repeated imaging).
-
Different intervals of sequential imaging (e.g. imaging every six months versus annual review).
Methods
Criteria for considering studies for this review
Types of studies
We included studies reporting on cross‐sectional information of the index test and reference test in the appropriate patient population (see below), irrespective of language or publication status or whether the data were collected prospectively or retrospectively. However, we excluded case series in which only true‐positive results or true‐negative results were reported without any information on the other participants who underwent the test.
Participants
Adults with focal pancreatic lesions.
Index tests
CT scan, MRI scan, PET scan, EUS, EUS elastography, and EUS‐guided biopsy either alone or in combination as replacement for major surgery for diagnostic purposes.
We accepted the criteria stated by the authors to classify the lesion as benign, precancerous, and cancerous for different imaging modalities.
There is no standard algorithm in the diagnosis or management of focal pancreatic lesions. Other tests that may be used in the diagnosis of focal pancreatic lesions include diagnostic laparoscopy, laparoscopic ultrasound, serum levels of CA 19‐9, and surgical resection (surgical resection may be considered diagnostic when the diagnosis is uncertain after all other diagnostic modalities have been attempted).
Target conditions
-
Benign versus precancerous and cancerous lesions (including the type of cancerous lesion).
-
Benign and precancerous versus cancerous lesions.
Reference standards
We accepted the following reference standards.
-
Histopathological examination of the entire lesion by surgical resection (gold standard). This classified the lesion as benign, precancerous, or cancerous.
-
Histopathological examination (irrespective of how the tissues were obtained for histopathological examination) in people with positive test (for cancerous or precancerous lesions) and clinical follow‐up by a doctor (with or without sequential follow‐up with imaging but using appropriate criteria such as metastases or confirmation of cancer by biopsy or death of participants due to cancer) of all participants with negative test for a period of at least six months and for a maximum period of 24 months. Until a definitive diagnosis is available, percutaneous biopsy is generally avoided because of the fear of seeding of cancer cells in potentially resectable cancers. As anticipated, the tissues obtained for histopathological examination were obtained from surgical resection. It is unlikely that patients with a low likelihood for cancer based on clinical symptoms and signs and test results (may include the results of index test) are subject to surgery or biopsy. Even if a biopsy is performed in such patients, a cancerous or precancerous lesion cannot be ruled out because of sampling error. Consequently, such patients are usually followed up clinically with sequential imaging. Pancreatic adenocarcinoma will cause clinical deterioration or increase in tumour size during a period of six months, and so we accepted clinical follow‐up or sequential follow‐up imaging (irrespective of the modality of the imaging) of all participants with a negative biopsy or no biopsy for at least six months as one of the reference standards. However, we accepted clinical follow‐up as a reference standard only when the criteria used for diagnosis were appropriate (e.g. identification of metastases, later biopsy of the lesion confirming the nature of the lesion, and death of participants due to cancer). The choice of a maximum period of 24 months was an arbitrary choice based on the low probability of precancerous lesions becoming cancerous during 24 months. Clinical follow‐up of patients is unlikely to classify precancerous lesions correctly since patients are unlikely to develop metastases or die within this interval.
Search methods for identification of studies
Electronic searches
We searched the following databases.
-
Cochrane Central Register of Controlled Trials (CENTRAL) in the Cochrane Library (Issue 7, 2016) (Appendix 2).
-
MEDLINE via PubMed (January 1946 to 19 July 2016) (Appendix 3).
-
Embase via OvidSP (January 1947 to 19 July 2016) (Appendix 4).
-
Science Citation Index Expanded via ISI Web of Knowledge (January 1980 to 19 July 2016) (Appendix 5).
Searching other resources
We searched the references of included studies to identify further studies (Horsley 2011). We also searched for additional articles related to the included studies by performing the 'related search' function in MEDLINE (PubMed) and Embase (OvidSP) and 'citing reference' search (search the articles that cited the included articles) in Science Citation Index Expanded and Embase (OvidSP) (Sampson 2008).
Data collection and analysis
Selection of studies
Two review authors independently searched the references to identify relevant studies. We obtained the full text of references that at least one of the review authors consider relevant and used these full texts to further exclude irrelevant references. We selected references to studies that met the inclusion criteria for data extraction. Any differences in study selection were arbitrated by review author BR Davidson.
Data extraction and management
Two review authors independently extracted the following data from each included study.
-
First author of report.
-
Year of publication of report.
-
Study design (prospective or retrospective; cross‐sectional studies or randomised clinical trials).
-
Inclusion and exclusion criteria for individual studies.
-
Total number of participants.
-
Number of females.
-
Mean age of the participants.
-
Criteria used for classification of lesions.
-
Preoperative tests carried out prior to index test.
-
Index test.
-
Reference standard.
-
True positive (TP), false positive (FP), true negative (TN), and false negative (FN) data.
Main analysis
The unit of analysis was the participant. We extracted the TP, FP, TN, and FN information for each index test for the following situations (when data were available).
-
Precancerous or cancerous lesions (positive test) versus benign lesions with no cancer potential (negative test) (this helps determine whether the patient needs further follow‐up).
-
Cancerous lesions (positive test) versus non‐cancerous lesions (negative test) (this helps determine whether the patient needs immediate surgery).
-
In the group of participants with precancerous or cancerous lesions (i.e. those with positive test in the analysis of benign lesions with no cancer potential (negative test) versus precancerous or cancerous lesions (positive test)), we extracted the TP, FP, TN, and FN information for cancerous lesions (positive test) versus precancerous lesions (negative test) (this helps in assessing whether or not surgery is appropriate; surgery is the only curative option for cancerous lesions, while follow‐up may be an option for precancerous lesions).
We extracted the information on indeterminate results separately from the TP, FP, TN, and FN data. There is no standard algorithm of management of patients with indeterminate results in the first scan. Some surgeons may recommend surgical resection for indeterminate lesions, while others may advise additional scans or sequential follow‐up imaging. We therefore planned to perform a sensitivity analysis as described in Sensitivity analyses.
For tests performed for sequential follow‐up imaging (repeated‐testing strategy), we planned to extract the TP, FP, TN, and FN data for the strategy as a whole. We considered increase in size or change in the lesion on sequential follow‐up imaging (performed within 12 months) a positive index test. If the lesion remained static (or decreased in size) without any change in the characteristics of the lesion, we considered this a negative index test. The majority of surgeons will recommend further follow‐up imaging or no follow‐up if the sequential follow‐up image shows no change in the lesion, and there is no clinical deterioration for the comparison between precancerous and cancerous lesions. We therefore considered indeterminate results on sequential follow‐up imaging as negative results for this comparison.
We sought further information from study authors where necessary. Any differences between the review authors were resolved by discussion.
Assessment of methodological quality
Two review authors independently assessed the quality of the studies using the QUADAS‐2 assessment tool (Whiting 2006; Whiting 2011). We resolved any differences in assessment using the QUADAS‐2 assessment algorithm published in the protocol. We sought further information from the authors of the studies in order to accurately assess the methodological quality of the studies.
We assessed the quality items derived from the QUADAS‐2 tool using the methodology stated in Table 1.
| Domain | Signalling question | Signalling question | Signalling question | Risk of bias | Concerns for |
| 1: Patient sampling | Was a consecutive or random sample of patients enrolled? | Was a case‐control design avoided? | Did the study avoid inappropriate exclusions? | Could the selection of participants have introduced bias? | Are there concerns that the included participants and setting do not match the review question? |
| Yes: all consecutive patients or random sample of patients with focal pancreatic lesions were enrolled No: selected patients were enrolled Unclear: this was not clear from the report | Yes: case‐control design was avoided No: case‐control design was not avoided Unclear: this was not clear from the report | Yes: the study avoided inappropriate exclusions (i.e. difficult‐to‐diagnose patients) No: the study excluded patients inappropriately Unclear: this was not clear from the report | Low risk: 'yes' for all signalling questions High risk: 'no' or 'unclear' for at least 1 signalling question | Low concern: the selected participants represent the patients in whom the tests will be used in clinical practice (please see diagnostic pathway (Figure 1)) High concern: there is high concern that participant selection was performed in such a way that the included participants did not represent the patients in whom the tests will be used in clinical practice | |
| 2: Index test(s) | Were the index test results interpreted without knowledge of the results of the reference standard? | If a threshold was used, was it prespecified? | — | Could the conduct or interpretation of the index test have introduced bias? | Are there concerns that the index test, its conduct, or its interpretation differ from the review question? |
| Yes: index test results were interpreted without knowledge of the results of the reference standard No: index test results were interpreted with knowledge of the results of the reference standard Unclear: this was not clear from the report | Yes: if the criteria for a positive test were prespecified No: if the criteria for a positive test were not prespecified Unclear: this was not clear from the report | — | Low risk: 'yes' for all signalling questions High risk: 'no' or 'unclear' for at least 1 of the 2 signalling questions | High concern: there is high concern that the conduct or interpretation of the index test differs from the way it is likely to be used in clinical practice Low concern: there is low concern that the conduct or interpretation of the index test differs from the way it is likely to be used in clinical practice | |
| 3: Target condition and reference standard(s) | Is the reference standard likely to classify the target condition correctly? | Were the reference standard results interpreted without knowledge of the results of the index tests? | — | Could the reference standard, its conduct, or its interpretation have introduced bias? | Are there concerns that the target condition as defined by the reference standard does not match the review question? |
| Yes: histopathological examination of the entire lesion by surgical resection No: histopathological examination (irrespective of how the tissues were obtained for histopathological examination) in patients with positive test (for cancerous or precancerous lesions) and clinical follow‐up by a doctor (with or without sequential follow‐up with imaging) of all patients with negative test for a period of at least 6 months and for a maximum period of 24 months Unclear: this was not clear from the report. Such studies will be excluded Yes: reference standard results were interpreted without knowledge of the results of the index test No: reference standard results were interpreted with knowledge of the results of the index test Unclear: this was not clear from the report | — | Low risk: 'yes' for all signalling questions High risk: 'no' or 'unclear' for at least 1 of the 2 signalling questions | Low concern: histopathological examination of the entire lesion by surgical resection High concern: histopathological examination (irrespective of how the tissues were obtained for histopathological examination) in patients with positive test (for cancerous or precancerous lesions) and clinical follow‐up by a doctor (with or without sequential follow‐up with imaging) of all patients with negative test for a period of at least 6 months and for a maximum period of 24 months | — | |
| 4: Flow and timing | Was there an appropriate interval between index test and reference standard? | Did all patients receive the same reference standard? | Were all patients included in the analysis? | Could the patient flow have introduced bias? | — |
| Yes: histopathological examination of the entire lesion (gold standard) ‐ performed within 2 months (chosen arbitrarily). Histopathological examination (irrespective of how the tissues were obtained for histopathological examination) in patients with positive test (for cancerous or precancerous lesions) performed within 2 months and clinical follow‐up (including sequential follow‐up with imaging) of all patients with negative test for a period of at least 6 months No: the histopathological examination was performed beyond 2 months of the index tests. The clinical follow‐up (including sequential follow‐up imaging) was performed less than 6 months after the index test, because some tumours may be slow‐growing Unclear: this was not clear from the report | Yes: histopathological examination of the entire lesion by surgical resection No: histopathological examination (irrespective of how the tissues were obtained for histopathological examination) in patients with positive test (for cancerous or precancerous lesions) and clinical follow‐up by a doctor (with or without sequential follow‐up with imaging) of all patients with negative test for a period of at least 6 months and for a maximum period of 24 months Unclear: this was not clear from the report. Such studies will be excluded | Yes: all patients meeting the selection criteria (selected participants) were included in the analysis, or data on all of the selected participants were available so that a 2 x 2 table including all selected participants could be constructed No: not all patients meeting the selection criteria were included in the analysis, or the 2 x 2 table could not be constructed using data on all selected participants Unclear: this was not clear from the report | Low risk: 'yes' for all signalling questions High risk: 'no' or 'unclear' for at least 1 signalling question | — |
Statistical analysis and data synthesis
We have plotted study estimates of sensitivity and specificity on forest plots and in receiver operating characteristic (ROC) space to explore between‐study variation in the performance of each test. To estimate the summary sensitivity and specificity of each test, we planned to perform the meta‐analysis by fitting the bivariate model (Chu 2006; Reitsma 2005), which accounts for between‐study variability in estimates of sensitivity and specificity through the inclusion of random effects for the logit sensitivity and logit specificity parameters of the bivariate model. As there was lack of convergence due to sparse data, we tried other alternate models suggested by Takwoingi 2015 and colleagues. These included the random‐effects model, ignoring the inverse correlation between sensitivities and specificities in the different studies due to intrinsic threshold effect, and the fixed‐effect model for either sensitivity or specificity or both after visualising the forest plots and summary receiver operating characteristics (SROC) plots (Takwoingi 2015). We based our choice between the different models on the distribution of sensitivities and specificities as noted in the forest plots or ROC space. We also used the model fit as indicated by the ‐2 log likelihood and considered the model with the lower ‐2 log likelihood to be the better model.
We planned to compare the diagnostic accuracy of the tests by including covariate terms for test type (CT scan, MRI, PET, EUS, EUS‐FNA, EUS elastography) in the bivariate model to estimate differences in the sensitivity and specificity of the tests. We planned to allow both the sensitivity and specificity to vary by covariate. In addition, we planned to permit the variances of the random effects and their covariance to also depend on test type, thus allowing the variances to differ between tests. We planned to use likelihood ratio tests to compare the model with and without covariate (test type). We planned to use a P value of less than 0.05 for the likelihood ratio test to indicate differences in the diagnostic accuracy between the tests. If studies that reported different tests in the same study population were available from at least four studies, we planned to perform a direct head‐to‐head comparison by limiting the test comparison to such studies. We planned to calculate the relative sensitivities and specificities for each pair‐wise comparison of tests.
We performed the meta‐analysis using the NLMIXED command in SAS version 9.4 (SAS Institute Inc, Cary, North Carolina, USA) (Takwoingi 2012). The post‐test probabilities were calculated using these pre‐test probabilities and the summary positive and negative likelihood ratios. We calculated the summary likelihood ratios and their confidence intervals from the functions of the parameter estimates from the model that we fitted to estimate the summary sensitivities and specificities. Post‐test probability associated with a positive test is the probability of having the target condition (e.g. precancer or cancer) on the basis of a positive test result (e.g. positive CT) and is the same as the term 'positive predictive value' used in a single diagnostic accuracy study. Post‐test probability associated with a negative test is the probability of having the target condition (e.g. precancer or cancer) on the basis of a negative test result (e.g. negative CT) and is 1 ‐ 'negative predictive value'. 'Negative predictive value' is the term used in a single diagnostic accuracy study to indicate the chance that the participant has no target condition when the test is negative. We have reported the summary sensitivity, specificity, and post‐test probabilities for the median pre‐test probabilities whenever possible.
Investigations of heterogeneity
We visually inspected forest plots of sensitivity and specificity and the ROC curve to identify heterogeneity. We planned to explore heterogeneity by using the different sources of heterogeneity as covariates in the METADAS macro (Takwoingi 2012), but due to the sparseness of the data we were unable to do this. We planned to assess whether there was a statistically significant difference in the likelihood ratios in order to identify heterogeneity. Although we did not formally compare the diagnostic test accuracy of different index tests between solid and cystic lesions, we have presented a subgroup analysis of solid and cystic lesions, since some clinicians consider the diagnostic test accuracies to differ between the two.
Sensitivity analyses
In the presence of indeterminate results (for any reason) for the initial test, we planned to consider two scenarios: the participants with indeterminate results as positive for the test, as some surgeons will recommend surgical resection for indeterminate lesions; and the indeterminate results as negative for the test, as some surgeons will recommend sequential follow‐up imaging. We planned to assess the diagnostic accuracy in both of these scenarios. However, due to sparse data and few studies reporting indeterminate results we did not perform the above.
We also planned to assess the comparative performance of tests by direct comparison (i.e. the tests performed in the same participant) versus indirect comparison (the tests performed in different participants across studies).
Results
Results of the search
We identified 33,795 references through electronic searches of the Cochrane Central Register of Controlled Trials (CENTRAL), MEDLINE, Embase, and Science Citation Index. We were left with 24,799 references after removing duplicate references. We excluded 23,879 clearly irrelevant references through reading the abstracts. We sought the full text for 920 references for further assessment. We did not identify any additional references to studies through other searches. We excluded 866 references for the reasons described in the Characteristics of excluded studies tables. Fifty‐two studies (54 references) met the inclusion criteria. Two studies reported the diagnostic test data on solid and cystic lesions separately (Brandwein 2001 ‐ Cystic; Brandwein 2001 ‐ Solid; Fischer 2009 ‐ Cystic; Fischer 2009 ‐ Solid)therefore, we considered them as separate studies. We thus included a total of 54 studies in the review (Brand 2000; Brandwein 2001 ‐ Cystic; Brandwein 2001 ‐ Solid; Cellier 1998; Choi 2003; Correa‐Gallego 2009; de Jong 2012; Doi 2002; Erkan 2012; Fischer 2009 ‐ Cystic; Fischer 2009 ‐ Solid; Fisher 2008; Grieser 2010; Harrison 1999; Higashi 1997; Hong 2010; Hu 2013; Jafarimehr 2010; Jang 2014a; Jang 2014b; Jin 2013a; Jin 2015; Kalha 2003; Kamata 2016a; Kato 1995; Kim 2015; Klau 2011; Kobayashi 2012; Kubo 2001; Kucera 2012; Le Baleur 2011a; Lee 2014; Maire 2008; McHenry 2002; Nakagawa 2009; Nara 2009; Ogawa 2008; Ogawa 2014; Otomi 2014; Pais 2007; Sahani 2006; Saito 2013; Salla 2007; Sedlack 2002; Smith 2016; Takanami 2011; Takeshita 2008; Tan 2009; Taouli 2000; Tomimaru 2010; Yamao 2001; Zhan 2011; Zhan 2013). The reference flow diagram is shown in Figure 2.
Study flow diagram.
Characteristics of included studies
For a summary of the characteristics of included studies see the Characteristics of included studies table.
We included a total of 54 studies involving 31,196 participants in this systematic review. The studies reported investigation of eight different target conditions:
-
cancerous versus benign or precancerous lesions;
-
cancerous versus benign lesions;
-
precancerous or cancerous lesions versus benign lesions;
-
cancerous (invasive carcinoma) versus precancerous (dysplasia) lesions;
-
cancerous (high‐grade dysplasia or invasive carcinoma) versus precancerous (low‐ or intermediate‐grade dysplasia) lesions;
-
cancerous (invasive carcinoma) versus precancerous (low‐grade dysplasia) lesions;
-
precancerous or cancerous (intermediate‐ or high‐grade dysplasia or invasive carcinoma) versus precancerous (low‐grade dysplasia) lesions; and
-
precancerous or cancerous (intermediate‐ or high‐grade dysplasia or invasive carcinoma) versus precancerous (low‐grade dysplasia) or benign lesions.
The variation in target condition was due to different definitions of what constitutes a benign, precancerous, and cancerous lesion. For example, the World Health Organization pancreatic tumour classification system classifies intraductal papillary mucinous neoplasms' (IPMNs) as precancerous tumours regardless of dysplasia (Luttges 2011). However, many of the included studies considered IPMNs to be benign lesions or even classified them as benign or cancerous based on the grade of dysplasia. This meant that the index tests were actually used for differentiating between very different populations of cancerous and benign tumours, and therefore the combination of all studies as simply cancer versus benign would have been inappropriate. In addition, different surgeons will have different thresholds for recommending surgery. Consequently, we have presented the results for all of the various definitions used by authors to classify a lesion as benign, precancerous, or cancerous.
Three studies reported data on tests differentiating cancerous from benign or precancerous lesions. Of these three studies, one reported the performance of EUS‐FNA using cytology (McHenry 2002); another reported the performance of EUS‐FNA using a carcinoembryonic antigen (CEA) threshold of 500 ng/mL (Kalha 2003); and the third reported the performance of PET to differentiate between benign or precancerous and cancerous lesions (Jafarimehr 2010). The median pre‐test probability of a cancerous lesion in these studies was 0.625 or 62.5% (minimum 0.533, maximum 0.711).
Twelve studies reported data on tests differentiating cancerous from benign lesions. Of these 12 studies, two reported the performance of EUS (Brand 2000; Harrison 1999); three reported the performance of EUS‐FNA (Brandwein 2001 ‐ Cystic; Brandwein 2001 ‐ Solid; Cherian 2010); three reported the performance of PET (Erkan 2012; Higashi 1997; Kato 1995); one reported the performance of PET with a standard uptake value (SUV) maximum of greater than 3.5 as its threshold for positivity (Hu 2013); two reported the performance of CT (Grieser 2010; Harrison 1999); and one reported the performance of MRI to differentiate between cancerous and benign lesions (Klau 2011). The median pre‐test probability of a cancerous lesion in these studies was 0.697 or 69.7% (minimum 0.231, maximum 0.889).
Six studies reported data on tests differentiating precancerous or cancerous from benign lesions, with one study providing data for multiple imaging modalities (Sedlack 2002). One study reported the performance of EUS (Sedlack 2002); three studies reported the performance of EUS‐FNA (Fischer 2009 ‐ Cystic; Fischer 2009 ‐ Solid; Sedlack 2002); one study reported the performance of EUS‐FNA using a CEA threshold of 50 ng/mL (Sedlack 2002); one study reported the performance of PET with an SUV maximum threshold of greater than 2.4 as its threshold for positivity (Otomi 2014); one study reported the performance of CT (Fisher 2008); and one study reported the performance of MRI (Jang 2014a). The median pre‐test probability of a precancerous or cancerous lesion in these studies was 0.706 or 70.6% (minimum 0.519, maximum 0.75).
Twelve studies reported data on tests differentiating cancerous invasive carcinomas from precancerous dysplastic lesions, with some studies reporting the diagnostic test accuracy or more than one index test. Five studies reported the performance of EUS (Cellier 1998; de Jong 2012; Nakagawa 2009; Yamao 2001; Zhan 2011); three studies reported the performance of EUS‐FNA (Jin 2015; Pais 2007; Salla 2007); and one study reported the performance of EUS‐FNA using a CEA threshold of 200 ng/mL (Maire 2008). Six studies reported the performance of CT (Cellier 1998; Nakagawa 2009; Nara 2009; Ogawa 2008; Taouli 2000; Yamao 2001), and one study reported the performance of MRI (de Jong 2012). The median pre‐test probability of a cancerous invasive carcinoma was 0.270 or 27% (minimum 0.122, maximum 0.618).
Eighteen studies reported data on tests differentiating cancerous lesions defined by high‐grade dysplasia or invasive carcinoma from precancerous lesions with a low or intermediate grade of dysplasia, with some studies reporting the diagnostic test accuracy or more than one index test. Four studies reported the performance of EUS (Doi 2002; Kobayashi 2012; Lee 2014; Yamao 2001). Three studies reported the performance of EUS‐FNA (Jin 2013a; Smith 2016; Zhan 2013). Three studies reported the performance of EUS‐FNA using a CEA threshold of 200 ng/mL (Correa‐Gallego 2009; Kucera 2012; Maire 2008). One study reported the performance of EUS‐FNA using a carbohydrate antigen 19‐9 threshold of greater than 1000 U/mL (Maire 2008). One study reported the performance of EUS‐FNA using a CEA threshold of 692.8 ng/mL (Zhan 2013). Four studies reported the performance of PET with an SUVmax value between 2 and 2.5 as their threshold for positivity (Hong 2010; Saito 2013; Takanami 2011; Tomimaru 2010). Three studies reported the performance of CT (Hong 2010; Le Baleur 2011a; Yamao 2001). Three studies reported the performance of MRI (Jang 2014b; Kim 2015; Ogawa 2014). The median pre‐test probability of a cancerous lesion defined by high‐grade dysplasia or invasive carcinoma in these studies was 0.449 or 44.9% (minimum 0.167, maximum 0.875).
Two studies reported data on tests differentiating cancerous invasive carcinomas from precancerous lesions with a low grade of dysplasia. One study reported the performance of EUS (Kubo 2001), and one study reported the performance of CT (Takeshita 2008). The median pre‐test probability of cancerous invasive carcinoma in these studies was 0.214 or 21.4% (minimum 0.174, maximum 0.255).
Five studies reported data on tests differentiating precancerous or cancerous lesions that may be moderately or highly dysplastic or invasive carcinomas from precancerous lesions with a low grade of dysplasia. Three studies reported the performance of CT (Ogawa 2008; Sahani 2006; Tan 2009), and two studies reported the performance of MRI (Choi 2003; Sahani 2006). None of the studies reported the diagnostic accuracy of EUS elastography or sequential testing. The median pre‐test probability of a cancerous lesion that may be moderately or highly dysplastic or an invasive carcinoma in these studies was 0.593 or 59.3% (minimum 0.574, maximum 0.68).
One study reported data on tests differentiating precancerous or cancerous lesions that may be moderately or highly dysplastic or invasive carcinomas from benign or precancerous lesions with a low grade of dysplasia. This study reported the performance of EUS. The median pre‐test probability of a cancerous lesion that may be moderately or highly dysplastic or an invasive carcinoma in this study was 0.429 or 42.9%.
Forty‐six studies were full‐text publications (Brand 2000; Brandwein 2001 ‐ Cystic; Brandwein 2001 ‐ Solid; Cellier 1998; Cherian 2010; Choi 2003; Correa‐Gallego 2009; de Jong 2012; Doi 2002; Fisher 2008; Grieser 2010; Harrison 1999; Higashi 1997; Hong 2010; Hu 2013; Jang 2014a; Jang 2014b; Jin 2015; Kamata 2016a; Kato 1995; Kim 2015; Klau 2011; Kobayashi 2012; Kubo 2001; Kucera 2012; Le Baleur 2011a; Lee 2014; Maire 2008; Nakagawa 2009; Nara 2009; Ogawa 2008; Ogawa 2014; Otomi 2014; Pais 2007; Sahani 2006; Saito 2013; Salla 2007; Sedlack 2002; Smith 2016; Takanami 2011; Takeshita 2008; Tan 2009; Taouli 2000; Tomimaru 2010; Yamao 2001; Zhan 2013). The remaining studies were abstracts (Erkan 2012; Fischer 2009 ‐ Cystic; Fischer 2009 ‐ Solid; Jafarimehr 2010; Jin 2013a; Kalha 2003; McHenry 2002; Zhan 2011). Three studies were prospective (Brand 2000; de Jong 2012; Erkan 2012); 39 were retrospective (Brandwein 2001 ‐ Cystic; Brandwein 2001 ‐ Solid; Cellier 1998; Cherian 2010; Correa‐Gallego 2009; Doi 2002; Fisher 2008; Grieser 2010; Harrison 1999; Hong 2010; Hu 2013; Jafarimehr 2010; Jang 2014a; Jang 2014b; Jin 2013a; Jin 2015; Kalha 2003; Kamata 2016a; Kim 2015; Klau 2011; Kobayashi 2012; Kubo 2001; Kucera 2012; Lee 2014; Maire 2008; McHenry 2002; Nakagawa 2009; Ogawa 2008; Otomi 2014; Pais 2007; Sahani 2006; Saito 2013; Salla 2007; Sedlack 2002; Smith 2016; Takanami 2011; Taouli 2000; Zhan 2011; Zhan 2013); and 12 did not state whether they were prospective or retrospective (Choi 2003; Fischer 2009 ‐ Cystic; Fischer 2009 ‐ Solid; Higashi 1997; Kato 1995; Le Baleur 2011a; Nara 2009; Ogawa 2014; Takeshita 2008; Tan 2009; Tomimaru 2010; Yamao 2001).
None of the studies reported data on symptomatic and asymptomatic participants separately. Forty‐two studies (2086 participants) reported on cystic pancreatic lesions (Brandwein 2001 ‐ Cystic; Cellier 1998; Choi 2003; Correa‐Gallego 2009; de Jong 2012; Doi 2002; Fischer 2009 ‐ Cystic; Fisher 2008; Hong 2010; Hu 2013; Jang 2014a; Jang 2014b; Jin 2013a; Jin 2015; Kalha 2003; Kamata 2016a; Kim 2015; Kobayashi 2012; Kubo 2001; Kucera 2012; Le Baleur 2011a; Lee 2014; Maire 2008; McHenry 2002; Nakagawa 2009; Nara 2009; Ogawa 2008; Ogawa 2014; Pais 2007; Sahani 2006; Saito 2013; Salla 2007; Sedlack 2002; Smith 2016; Takanami 2011; Takeshita 2008; Tan 2009; Taouli 2000; Tomimaru 2010; Yamao 2001; Zhan 2011; Zhan 2013). Four studies reported on solid pancreatic lesions (Brandwein 2001 ‐ Solid; Cherian 2010; Fischer 2009 ‐ Solid; Klau 2011). The remaining eight studies either did not mention whether the lesions were cystic or solid, or did not report this information separately (Brand 2000; Erkan 2012; Grieser 2010; Harrison 1999; Higashi 1997; Jafarimehr 2010; Kato 1995; Otomi 2014). None of the studies reported data on people with chronic pancreatitis separately.
Overall, 12 studies reported data on EUS results (Brand 2000; Cellier 1998; de Jong 2012; Doi 2002; Harrison 1999; Kamata 2016a; Kobayashi 2012; Kubo 2001; Lee 2014; Nakagawa 2009; Sedlack 2002; Yamao 2001); 19 studies reported data on EUS‐FNA (Brandwein 2001 ‐ Cystic; Brandwein 2001 ‐ Solid; Cherian 2010; Correa‐Gallego 2009; Fischer 2009 ‐ Cystic; Fischer 2009 ‐ Solid; Fisher 2008; Jin 2013a; Jin 2015; Kalha 2003; Kucera 2012; Maire 2008; McHenry 2002; Pais 2007; Salla 2007; Sedlack 2002; Smith 2016; Zhan 2011; Zhan 2013); 10 studies reported data on PET (Erkan 2012; Higashi 1997; Hong 2010; Hu 2013; Jafarimehr 2010; Kato 1995; Otomi 2014; Saito 2013; Takanami 2011; Tomimaru 2010); 13 studies reported data on CT (Cellier 1998; Grieser 2010; Harrison 1999; Hong 2010; Le Baleur 2011a; Nakagawa 2009; Nara 2009; Ogawa 2008; Sahani 2006; Takeshita 2008; Tan 2009; Taouli 2000; Yamao 2001); and eight studies reported data on MRI (Choi 2003; de Jong 2012; Jang 2014a; Jang 2014b; Kim 2015; Klau 2011; Ogawa 2014; Sahani 2006).
The criteria for a positive test result varied widely by study and are described in detail in Characteristics of included studies. The reference standards in all of the included studies was surgical excision.
Methodological quality of included studies
The methodological quality of the included studies is summarised in Figure 3 and Figure 4. None of the included studies was of high methodological quality.
Risk of bias and applicability concerns graph: review authors' judgements about each domain presented as percentages across included studies.
Risk of bias and applicability concerns summary: review authors' judgements about each domain for each included study.
Participant selection domain
In the participant selection domain, nine studies had a low risk of bias (Cherian 2010; Correa‐Gallego 2009; Fisher 2008; Kamata 2016a; Klau 2011; Nara 2009; Otomi 2014; Saito 2013; Salla 2007). All of the studies had high applicability concerns because of concerns that the participants did not match the review question. The review question was to find out the diagnostic accuracy of these index tests in people with focal lesions. However, all of the studies meeting the inclusion criteria for this review except Cherian 2010 used surgical excision as the reference standard, suggesting that the surgeons considered these patients to be at high risk of malignancy based on the results of the index tests or the tests that patients had prior to or subsequent to the index test. Cherian 2010 was also at high risk of applicability concern because it excluded participants with resectable lesions on CT scan and included only those equivocal lesions on CT scan.
Index test domain
In the index test domain, nine studies were at low risk of bias (Correa‐Gallego 2009; Hong 2010; Jang 2014b; Kim 2015; Kubo 2001; Nara 2009; Ogawa 2014; Tan 2009; Taouli 2000). Of the remaining studies, 31 were at unclear risk of bias because it was unclear whether the index test results were interpreted without knowledge of the results of the reference standard (Brand 2000; Brandwein 2001 ‐ Cystic; Brandwein 2001 ‐ Solid; Cellier 1998; Choi 2003; Cherian 2010; de Jong 2012; Doi 2002; Erkan 2012; Fischer 2009 ‐ Cystic; Fischer 2009 ‐ Solid; Fisher 2008; Harrison 1999; Jafarimehr 2010; Jin 2013a; Jin 2015; Kalha 2003; Kamata 2016a; Kato 1995; Kobayashi 2012; Kucera 2012; Le Baleur 2011a; McHenry 2002; Ogawa 2008; Pais 2007; Salla 2007; Sedlack 2002; Smith 2016; Yamao 2001; Zhan 2011; Zhan 2013). Fifteen studies were at high risk of bias because the threshold for the index test was not prespecified (Grieser 2010; Higashi 1997; Hu 2013; Jang 2014a; Klau 2011; Lee 2014; Maire 2008; Nakagawa 2009; Otomi 2014; Sahani 2006; Saito 2013; Takanami 2011; Takeshita 2008; Tomimaru 2010; Zhan 2013). Twenty‐eight studies had low applicability concerns (Brand 2000; Brandwein 2001 ‐ Cystic; Brandwein 2001 ‐ Solid; Cellier 1998; Choi 2003; Cherian 2010; Correa‐Gallego 2009; de Jong 2012; Doi 2002; Hong 2010; Hu 2013; Jang 2014b; Jin 2013a; Jin 2015; Kalha 2003; Kamata 2016a; Kim 2015; Kubo 2001; Le Baleur 2011a; Nara 2009; Ogawa 2008; Ogawa 2014; Pais 2007; Sahani 2006; Sedlack 2002; Smith 2016; Yamao 2001; Zhan 2013), and the remaining 27 studies had high applicability concerns because of concerns that the index test, its conduct, or interpretation differed from the review question (Erkan 2012; Fischer 2009 ‐ Cystic; Fischer 2009 ‐ Solid; Fisher 2008; Grieser 2010; Harrison 1999; Higashi 1997; Jafarimehr 2010; Jang 2014a; Kato 1995; Klau 2011; Kobayashi 2012; Kucera 2012; Lee 2014; Maire 2008; McHenry 2002; Nakagawa 2009; Otomi 2014; Saito 2013; Salla 2007; Sedlack 2002; Takanami 2011; Takeshita 2008; Tan 2009; Taouli 2000; Tomimaru 2010; Zhan 2011).
Reference standard domain
In the reference standard domain, three studies were at low risk of bias (Correa‐Gallego 2009; Grieser 2010; Hu 2013). Two studies were at high risk of bias because the reference standard results were not interpreted without knowledge of the index test results (Pais 2007), or because radiological and clinical follow‐up was used in some of the participants as the reference standard. The remaining 49 studies were at unclear risk of bias as it was unclear if the reference standard was interpreted without knowledge of the results of index tests (Brand 2000; Brandwein 2001 ‐ Cystic; Brandwein 2001 ‐ Solid; Cellier 1998; Choi 2003; de Jong 2012; Doi 2002; Erkan 2012; Fischer 2009 ‐ Cystic; Fischer 2009 ‐ Solid; Fisher 2008; Harrison 1999; Higashi 1997; Hong 2010; Jafarimehr 2010; Jang 2014a; Jang 2014b; Jin 2013a; Jin 2015; Kalha 2003; Kamata 2016a; Kato 1995; Kim 2015; Klau 2011; Kobayashi 2012; Kubo 2001; Kucera 2012; Le Baleur 2011a; Lee 2014; Maire 2008; McHenry 2002; Nakagawa 2009; Nara 2009; Ogawa 2008; Ogawa 2014; Otomi 2014; Sahani 2006; Saito 2013; Salla 2007; Sedlack 2002; Smith 2016; Takanami 2011; Takeshita 2008; Tan 2009; Taouli 2000; Tomimaru 2010; Yamao 2001; Zhan 2011; Zhan 2013). All studies were at low concern for applicability, as we considered the definition of the target condition by the reference standard to match the review question.
Flow and timing domain
None of the studies were at low risk of bias in the flow and timing domain. Thirty studies were at high risk of bias because not all of the participants were included in the analysis, or there was an inappropriate interval between the index test and reference standard (Brand 2000; Brandwein 2001 ‐ Cystic; Cellier 1998; Choi 2003; Correa‐Gallego 2009; de Jong 2012; Doi 2002; Erkan 2012; Hong 2010; Jang 2014a; Jang 2014b; Jin 2015; Kalha 2003; Kamata 2016a; Kato 1995; Kim 2015; Kobayashi 2012; Kucera 2012; Lee 2014; Nakagawa 2009; Ogawa 2008; Ogawa 2014; Pais 2007; Sedlack 2002; Smith 2016; Takanami 2011; Tan 2009; Taouli 2000; Tomimaru 2010; Yamao 2001). One study was at high risk of bias because the reference standards that participants received were dependent on the index test results. The remaining 23 studies were at unclear risk of bias because it was either unclear if there was an appropriate interval between the index test and reference standard or if all participants were included in the analysis, or both (Brandwein 2001 ‐ Solid; Fischer 2009 ‐ Cystic; Fischer 2009 ‐ Solid; Fisher 2008; Grieser 2010; Harrison 1999; Higashi 1997; Hu 2013; Jafarimehr 2010; Jin 2013a; Klau 2011; Kubo 2001; Le Baleur 2011a; Maire 2008; McHenry 2002; Nara 2009; Otomi 2014; Sahani 2006; Saito 2013; Salla 2007; Takeshita 2008; Zhan 2011; Zhan 2013).
Findings
The results are summarised in the summary of findings Table. The overall sensitivities and specificities for different tests for different target conditions are tabulated in Table 2. A detailed description is given below.
| Comparison | Name of test | Sensitivity | Specificity |
| Cancerous versus benign or precancerous | EUS‐FNA | 0.79 (95% CI 0.60 to 0.91) | 1.00 (95% CI 0.85 to 1.00) |
| Cancerous versus benign or precancerous | EUS‐FNA | 0.93 (95% CI 0.70 to 0.99) | 0.33 (95% CI 0.12 to 0.65) |
| Cancerous versus benign or precancerous | PET | 0.85 (95% CI 0.73 to 0.92) | 0.91 (95% CI 0.72 to 0.97) |
| Cancerous versus benign | EUS | 0.95 (95% CI 0.84 to 0.99) | 0.53 (95% CI 0.31 to 0.74) |
| Cancerous versus benign | EUS‐FNA | 0.79 (95% CI 0.07 to 1.00) | 1.00 (95% CI 0.91 to 1.00) |
| Cancerous versus benign | PET (criteria unspecified) | 0.92 (95% CI 0.80 to 0.97) | 0.65 (95% CI 0.39 to 0.85) |
| Cancerous versus benign | PET (SUVmax > 3.5) | 0.96 (95% CI 0.87 to 0.99) | 0.62 (95% CI 0.43 to 0.78) |
| Cancerous versus benign | CT | 0.98 (95% CI 0.00 to 1.00) | 0.76 (95% CI 0.02 to 1.00) |
| Cancerous versus benign | MRI | 0.80 (95% CI 0.58 to 0.92) | 0.89 (95% CI 0.57 to 0.98) |
| Precancerous or cancerous versus benign | EUS | 0.92 (95% CI 0.74 to 0.98) | 0.60 (95% CI 0.31 to 0.83) |
| Precancerous or cancerous versus benign | EUS‐FNA (cytology) | 0.73 (95% CI 0.01 to 1.00) | 0.94 (95% CI 0.15 to 1.00) |
| Precancerous or cancerous versus benign | EUS‐FNA | 0.29 (95% CI 0.08 to 0.64) | 0.25 (95% CI 0.05 to 0.70) |
| Precancerous or cancerous versus benign | PET | 0.94 (95% CI 0.74 to 0.99) | 0.93 (95% CI 0.69 to 0.99) |
| Precancerous or cancerous versus benign | CT | 0.62 (95% CI 0.45 to 0.76) | 0.64 (95% CI 0.39 to 0.84) |
| Precancerous or cancerous versus benign | MRI | 0.93 (95% CI 0.69 to 0.99) | 0.85 (95% CI 0.58 to 0.96) |
| Cancerous (invasive carcinoma) versus precancerous (dysplasia) | EUS | 0.78 (95% CI 0.45 to 0.94) | 0.91 (95% CI 0.61 to 0.98) |
| Cancerous (invasive carcinoma) versus precancerous (dysplasia) | EUS‐FNA | 0.66 (95% CI 0.03 to 0.99) | 0.92 (95% CI 0.73 to 0.98) |
| Cancerous (invasive carcinoma) versus precancerous (dysplasia) | EUS‐FNA | 1.00 (95% CI 0.57 to 1.00) | 0.64 (95% CI 0.48 to 0.78) |
| Cancerous (invasive carcinoma) versus precancerous (dysplasia) | CT | 0.72 (95% CI 0.50 to 0.87) | 0.92 (95% CI 0.81 to 0.97) |
| Cancerous (invasive carcinoma) versus precancerous (dysplasia) | MRI | 0.75 (95% CI 0.30 to 0.95) | 0.93 (95% CI 0.77 to 0.98) |
| Cancerous (high‐grade dysplasia or invasive carcinoma) versus precancerous (low‐ or intermediate‐grade dysplasia) | EUS | 0.86 (95% CI 0.74 to 0.92) | 0.91 (95% CI 0.83 to 0.96) |
| Cancerous (high‐grade dysplasia or invasive carcinoma) versus precancerous (low‐ or intermediate‐grade dysplasia) | EUS‐FNA | 0.47 (95% CI 0.24 to 0.70) | 0.91 (95% CI 0.32 to 1.00) |
| Cancerous (high‐grade dysplasia or invasive carcinoma) versus precancerous (low‐ or intermediate‐grade dysplasia) | EUS‐FNA | 0.58 (95% CI 0.28 to 0.83) | 0.51 (95% CI 0.19 to 0.81) |
| Cancerous (high‐grade dysplasia or invasive carcinoma) versus precancerous (low‐ or intermediate‐grade dysplasia) | EUS‐FNA | 0.90 (95% CI 0.60 to 0.98) | 0.42 (95% CI 0.26 to 0.59) |
| Cancerous (high‐grade dysplasia or invasive carcinoma) versus precancerous (low‐ or intermediate‐grade dysplasia) | EUS‐FNA | 0.80 (95% CI 0.49 to 0.94) | 0.90 (95% CI 0.60 to 0.98) |
| Cancerous (high‐grade dysplasia or invasive carcinoma) versus precancerous (low‐ or intermediate‐grade dysplasia) | PET | 0.90 (95% CI 0.79 to 0.96) | 0.94 (95% CI 0.81 to 0.99) |
| Cancerous (high‐grade dysplasia or invasive carcinoma) versus precancerous (low‐ or intermediate‐grade dysplasia) | CT | 0.87 (95% CI 0.00 to 1.00) | 0.96 (95% CI 0.00 to 1.00) |
| Cancerous (high‐grade dysplasia or invasive carcinoma) versus precancerous (low‐ or intermediate‐grade dysplasia) | MRI | 0.69 (95% CI 0.44 to 0.86) | 0.93 (95% CI 0.43 to 1.00) |
| Cancerous (invasive carcinoma) versus precancerous (low‐grade dysplasia) | EUS | 0.77 (95% CI 0.50 to 0.92) | 0.89 (95% CI 0.76 to 0.96) |
| Cancerous (invasive carcinoma) versus precancerous (low‐grade dysplasia) | CT | 0.50 (95% CI 0.22 to 0.78) | 0.95 (95% CI 0.83 to 0.99) |
| Precancerous or cancerous (intermediate‐ or high‐grade dysplasia or invasive carcinoma) versus precancerous (low‐grade dysplasia) | CT | 0.83 (95% CI 0.68 to 0.92) | 0.83 (95% CI 0.64 to 0.93) |
| Precancerous or cancerous (intermediate‐ or high‐grade dysplasia or invasive carcinoma) versus precancerous (low‐grade dysplasia) | MRI | 0.80 (95% CI 0.58 to 0.92) | 0.81 (95% CI 0.53 to 0.95) |
| Precancerous or cancerous (intermediate‐ or high‐grade dysplasia or invasive carcinoma) versus precancerous (low‐grade dysplasia) or benign | EUS | 0.97 (95% CI 0.83 to 0.99) | 0.40 (95% CI 0.26 to 0.55) |
| Cystic lesion subgroup analysis | Cancerous versus benign ‐ EUS‐FNA (cytology) | 0.50 (95% CI 0.19 to 0.81) | 1.00 (95% CI 0.84 to 1.00) |
| Cystic lesion subgroup analysis | Cancerous versus benign ‐ PET | 0.96 (95% CI 0.87 to 0.99) | 0.62 (95% CI 0.43 to 0.78) |
| Cystic lesion subgroup analysis | Precancerous or cancerous versus benign ‐ EUS‐FNA | 0.43 (95% CI 0.19 to 0.71) | 1.00 (95% CI 0.74 to 1.00) |
CA 19‐9: carbohydrate antigen 19‐9
CEA: carcinoembryonic antigen
CI: confidence interval
CT: computed tomography
EUS: endoscopic ultrasound
FNA: fine‐needle aspiration
MRI: magnetic resonance imaging
PET: positron emission tomography
SUVmax: maximum standardised uptake values
Cancerous versus benign or precancerous
EUS‐FNA cytology: We included one study reporting data on 45 participants for this test (McHenry 2002). The sensitivity and specificity for diagnosing cancer were 0.79 (95% confidence interval (CI) 0.60 to 0.91) and 1.00 (95% CI 0.85 to 1.00), respectively.
EUS‐FNA (CEA > 500 ng/mL): We included one study reporting data on 24 participants for this test (Kalha 2003). The sensitivity and specificity for diagnosing cancer were 0.93 (95% CI 0.70 to 0.99) and 0.33 (95% CI 0.12 to 0.65), respectively.
PET (criteria: not specified): We included one study reporting data on 76 participants for this test (Jafarimehr 2010). The sensitivity and specificity for diagnosing cancer were 0.85 (95% CI 0.73 to 0.92) and 0.91 (95% CI 0.72 to 0.97), respectively.
The results including sensitivities and specificities and post‐test probabilities at median pre‐test probabilities are summarised in summary of findings Table. A forest plot summarising all of the sensitivity and specificity data for the 'cancerous versus benign or precancerous' studies is shown in Figure 5.
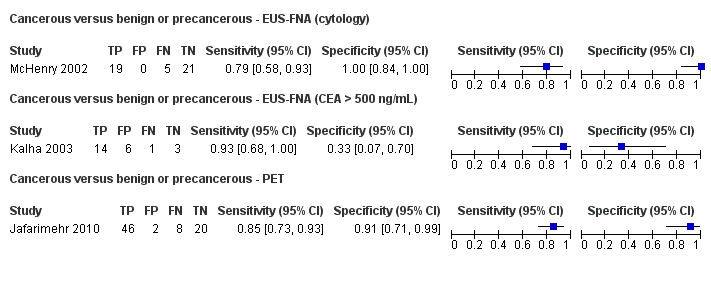
Forest plot ‐ Cancerous versus benign or precancerous.
Cancerous versus benign
EUS: Two studies reporting data on 133 participants were included for this test, allowing meta‐analysis to be performed (Brand 2000; Harrison 1999). The summary sensitivity and summary specificity for diagnosing cancer were 0.95 (95% CI 0.84 to 0.99) and 0.53 (95% CI 0.31 to 0.74), respectively.
EUS‐FNA cytology: Three studies reporting data on 147 participants were included for this test (Brandwein 2001 ‐ Cystic; Brandwein 2001 ‐ Solid; Cherian 2010). The sensitivity and specificity for diagnosing cancer were 0.79 (95% CI 0.07 to 1.00) and 1.00 (95% CI 0.91 to 1.00), respectively.
PET (criteria: not specified): Three studies reporting data on 99 participants were included for this test, allowing meta‐analysis to be performed (Erkan 2012; Higashi 1997; Kato 1995). The summary sensitivity and summary specificity for diagnosing cancer were 0.92 (95% CI 0.80 to 0.97) and 0.65 (95% CI 0.39 to 0.85), respectively.
PET (SUVmax > 3.5): We included one study reporting data on 80 participants for this test (Hu 2013). The sensitivity and specificity for diagnosing cancer were 0.96 (95% CI 0.87 to 0.99) and 0.62 (95% CI 0.43 to 0.78), respectively.
CT: Two studies reporting data on 123 participants were included for this test, allowing meta‐analysis to be performed (Grieser 2010; Harrison 1999). The summary sensitivity and summary specificity for diagnosing cancer were 0.98 (95% CI 0.00 to 1.00) and 0.76 (95% CI 0.02 to 1.00), respectively.
MRI: We included one study reporting data on 29 participants for this test (Klau 2011). The sensitivity and specificity for diagnosing cancer were 0.80 (95% CI 0.58 to 0.92) and 0.89 (95% CI 0.57 to 0.98), respectively.
The results including sensitivities and specificities and post‐test probabilities at median pre‐test probabilities are summarised in summary of findings Table. A forest plot summarising all of the sensitivity and specificity data for the 'cancerous versus benign' studies is shown in Figure 6.
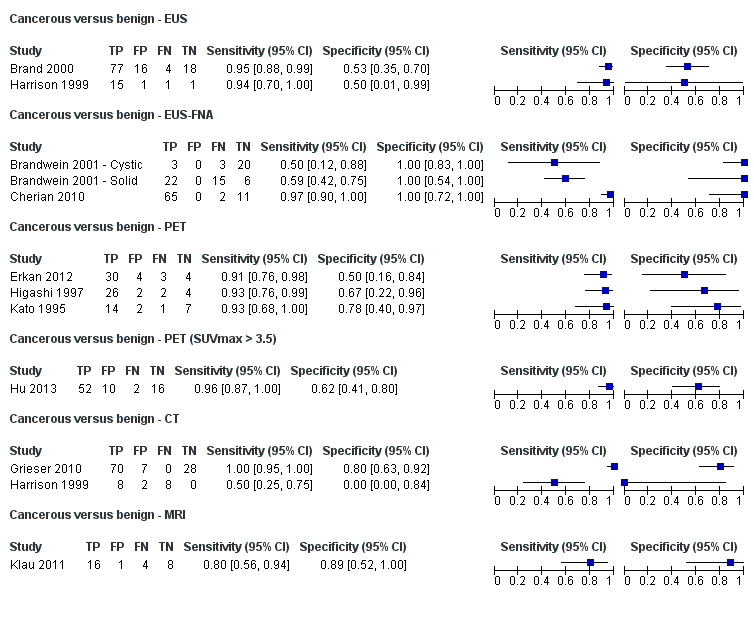
Forest plot ‐ Cancerous versus benign.
Precancerous or cancerous versus benign
EUS: We included one study reporting data on 34 participants for this test (Sedlack 2002). The sensitivity and specificity for diagnosing cancer or precancer were 0.92 (95% CI 0.74 to 0.98) and 0.60 (95% CI 0.31 to 0.83), respectively.
EUS‐FNA cytology: We included three studies, reporting data on 52 participants for this test (Fischer 2009 ‐ Cystic; Fischer 2009 ‐ Solid; Sedlack 2002). The summary sensitivity and summary specificity for diagnosing cancer or precancer were 0.73 (95% CI 0.01 to 1.00) and 0.94 (95% CI 0.15 to 1.00), respectively.
EUS‐FNA (CEA > 50 ng/mL): We included one study reporting data on 11 participants for this test (Sedlack 2002). The sensitivity and specificity for diagnosing cancer or precancer were 0.29 (95% CI 0.08 to 0.64) and 0.25 (95% CI 0.05 to 0.70), respectively.
PET (SUVmax > 2.4): We included one study reporting data on 32 participants for this test (Otomi 2014). The sensitivity and specificity for diagnosing cancer or precancer were 0.94 (95% CI 0.74 to 0.99) and 0.93 (95% CI 0.69 to 0.99), respectively.
CT: We included one study reporting data on 48 participants for this test (Fisher 2008). The sensitivity and specificity for diagnosing cancer or precancer were 0.62 (95% CI 0.45 to 0.76) and 0.64 (95% CI 0.39 to 0.84), respectively.
MRI: We included one study reporting data on 27 participants for this test (Jang 2014a). The sensitivity and specificity for diagnosing cancer or precancer were 0.93 (95% CI 0.69 to 0.99) and 0.85 (95% CI 0.58 to 0.96), respectively.
The results including sensitivities and specificities and post‐test probabilities at median pre‐test probabilities are summarised in summary of findings Table. A forest plot summarising all of the sensitivity and specificity data for the 'precancerous or cancerous versus benign' studies is shown in Figure 7.
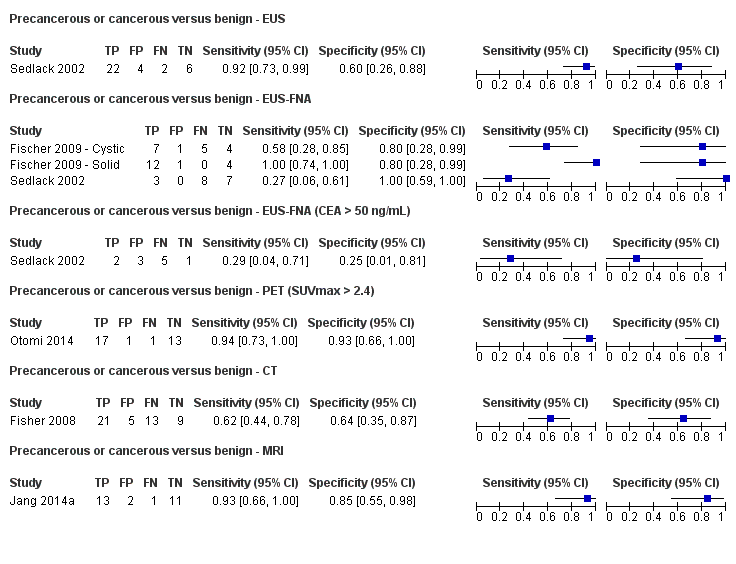
Forest plot ‐ Precancerous or cancerous versus benign.
Cancerous (invasive carcinoma) versus precancerous (dysplasia)
EUS: Five studies reporting data on 156 participants were included for this test, allowing meta‐analysis to be performed (Cellier 1998; de Jong 2012; Nakagawa 2009; Yamao 2001; Zhan 2011). The summary sensitivity and summary specificity for diagnosing invasive cancer were 0.78 (95% CI 0.45 to 0.94) and 0.91 (95% CI 0.61 to 0.98), respectively.
EUS‐FNA cytology: Three studies reporting data on 158 participants were included for this test, allowing meta‐analysis to be performed (Jin 2013a; Pais 2007; Salla 2007). The summary sensitivity and summary specificity for diagnosing invasive cancer were 0.66 (95% CI 0.03 to 0.99) and 0.92 (95% CI 0.73 to 0.98), respectively.
EUS‐FNA (CEA > 200 ng/mL): We included one study reporting data on 41 participants for this test (Maire 2008). The sensitivity and specificity for diagnosing invasive cancer were 1.00 (95% CI 0.57 to 1.00) and 0.64 (95% CI 0.48 to 0.78), respectively.
CT: Six studies reporting data on 326 participants were included for this test, allowing meta‐analysis to be performed (Cellier 1998; Nakagawa 2009; Nara 2009; Ogawa 2008; Taouli 2000; Yamao 2001). The summary sensitivity and summary specificity for diagnosing invasive cancer were 0.72 (95% CI 0.50 to 0.87) and 0.92 (95% CI 0.81 to 0.97), respectively.
MRI: We included one study reporting data on 32 participants for this test (de Jong 2012). The sensitivity and specificity for diagnosing invasive cancer were 0.75 (95% CI 0.30 to 0.95) and 0.93 (95% CI 0.77 to 0.98), respectively.
The results including sensitivities and specificities and post‐test probabilities at median pre‐test probabilities are summarised in summary of findings Table. A forest plot summarising all of the sensitivity and specificity data for the 'cancer (invasive carcinoma) versus precancerous (dysplasia)' studies is shown in Figure 8.
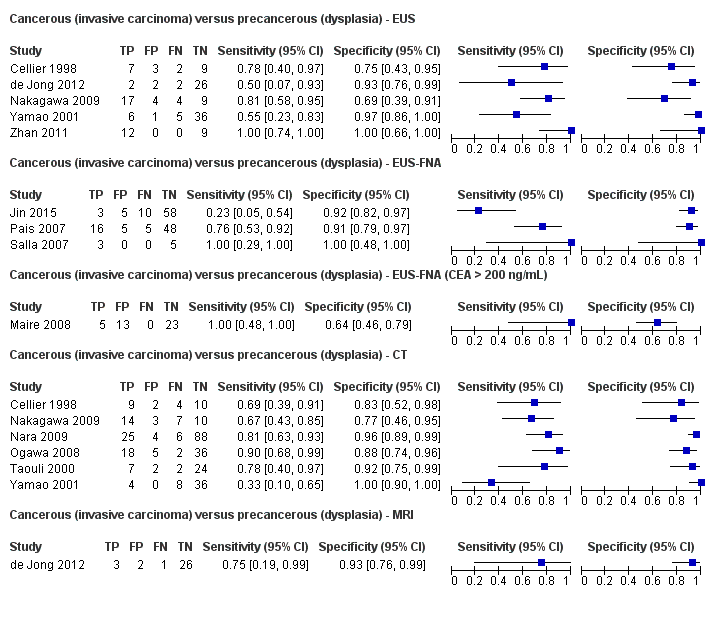
Forest plot ‐ Cancerous (invasive carcinoma) versus precancerous (dysplasia).
Cancerous (high‐grade dysplasia or invasive carcinoma) versus precancerous (low‐ or intermediate‐grade dysplasia)
EUS: Four studies reporting data on 196 participants were included for this test, allowing meta‐analysis to be performed (Doi 2002; Kobayashi 2012; Lee 2014; Yamao 2001). The summary sensitivity and summary specificity for diagnosing high‐grade dysplasia or invasive cancer were 0.86 (95% CI 0.74 to 0.92) and 0.91 (95% CI 0.83 to 0.96), respectively.
EUS‐FNA cytology: Three studies reporting data on 310 participants were included for this test, allowing meta‐analysis to be performed (Jin 2013a; Smith 2016; Zhan 2013). The summary sensitivity and summary specificity for diagnosing high‐grade dysplasia or invasive cancer were 0.47 (95% CI 0.24 to 0.70) and 0.91 (95% CI 0.32 to 1.00), respectively.
EUS‐FNA (CEA > 200 ng/mL): Three studies reporting data on 160 participants were included for this test, allowing meta‐analysis to be performed (Correa‐Gallego 2009; Kucera 2012; Maire 2008). The summary sensitivity and summary specificity for diagnosing high‐grade dysplasia or invasive cancer were 0.58 (95% CI 0.28 to 0.83) and 0.51 (95% CI 0.19 to 0.81), respectively.
EUS‐FNA (carbohydrate antigen 19‐9 > 1000 U/mL): We included one study reporting data on 41 participants for this test (Maire 2008). The sensitivity and specificity for diagnosing high‐grade dysplasia or invasive cancer were 0.90 (95% CI 0.60 to 0.98) and 0.42 (95% CI 0.26 to 0.59), respectively.
EUS‐FNA (CEA > 692.8 ng/mL): We included one study reporting data on 20 participants for this test (Zhan 2013). The sensitivity and specificity for diagnosing high‐grade dysplasia or invasive cancer were 0.80 (95% CI 0.49 to 0.94) and 0.90 (95% CI 0.60 to 0.98), respectively.
PET (SUVmax 2 to 2.5): Four studies reporting data on 124 participants were included for this test, allowing meta‐analysis to be performed (Hong 2010; Saito 2013; Takanami 2011; Tomimaru 2010). The summary sensitivity and summary specificity for diagnosing high‐grade dysplasia or invasive cancer were 0.90 (95% CI 0.79 to 0.96) and 0.94 (95% CI 0.81 to 0.99), respectively.
CT: Three studies reporting data on 139 participants were included for this test, allowing meta‐analysis to be performed (Hong 2010; Le Baleur 2011a; Yamao 2001). The summary sensitivity and summary specificity for diagnosing high‐grade dysplasia or invasive cancer were 0.87 (95% CI 0.00 to 1.00) and 0.96 (95% CI 0.00 to 1.00), respectively.
MRI: Three studies reporting data on 189 participants were included for this test, allowing meta‐analysis to be performed (Jang 2014b; Kim 2015; Ogawa 2014). The summary sensitivity and summary specificity for diagnosing high‐grade dysplasia or invasive cancer were 0.69 (95% CI 0.44 to 0.86) and 0.93 (95% CI 0.43 to 1.00), respectively.
The results including sensitivities and specificities and post‐test probabilities at median pre‐test probabilities are summarised in summary of findings Table. A forest plot summarising all of the sensitivity and specificity data for the 'cancer (high‐grade dysplasia or invasive carcinoma) versus precancerous (low‐ or intermediate‐grade dysplasia)' studies is shown in Figure 9.
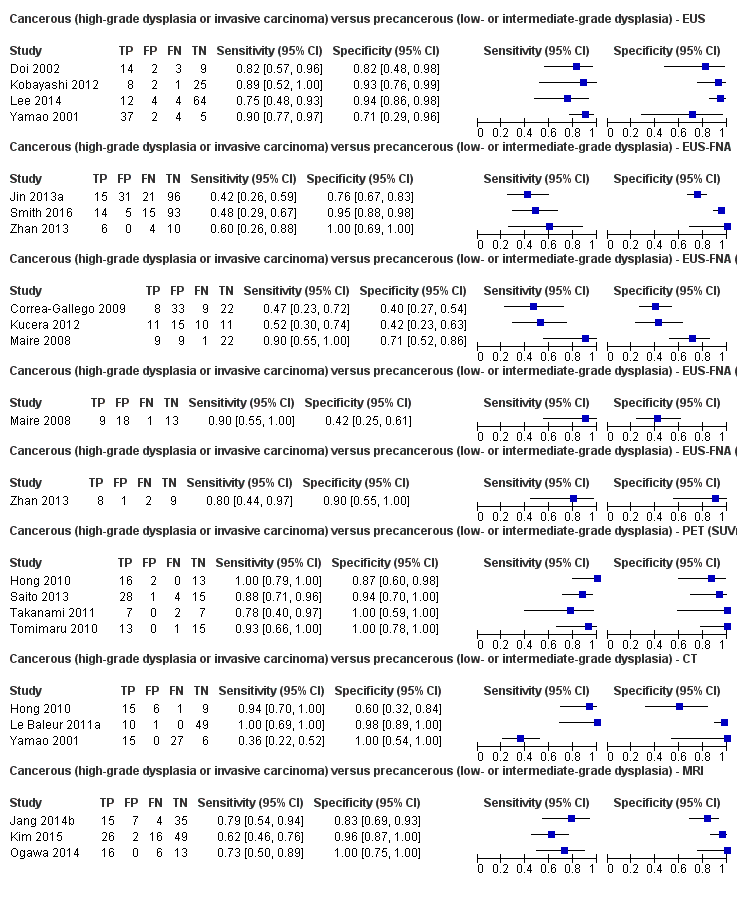
Forest plot ‐ Cancerous (high‐grade dysplasia or invasive carcinoma) versus precancerous (low‐ or intermediate‐grade dysplasia).
Cancerous (invasive carcinoma) versus precancerous (low‐grade dysplasia)
EUS: We included one study reporting data on 51 participants for this test (Kubo 2001). The sensitivity and specificity for diagnosing invasive cancer were 0.77 (95% CI 0.50 to 0.92) and 0.89 (95% CI 0.76 to 0.96), respectively.
CT: We included one study reporting data on 46 participants for this test (Takeshita 2008). The sensitivity and specificity for diagnosing invasive cancer were 0.50 (95% CI 0.22 to 0.78) and 0.95 (95% CI 0.83 to 0.99), respectively.
The results including sensitivities and specificities and post‐test probabilities at median pre‐test probabilities are summarised in summary of findings Table. A forest plot summarising all of the sensitivity and specificity data for the 'cancer (invasive carcinoma) versus precancerous (low‐grade dysplasia)' studies is shown in Figure 10.

Forest plot ‐ Cancerous (invasive carcinoma) versus precancerous (low‐grade dysplasia).
Precancerous or cancer (intermediate‐ or high‐grade dysplasia or invasive carcinoma) versus precancerous (low‐grade dysplasia)
CT: Three studies reporting data on 106 participants were included for this test, allowing meta‐analysis to be performed (Ogawa 2008; Sahani 2006; Tan 2009). The summary sensitivity and summary specificity for diagnosing intermediate‐ or high‐grade dysplasia or invasive cancer were 0.83 (95% CI 0.68 to 0.92) and 0.83 (95% CI 0.64 to 0.93), respectively.
MRI: Two studies reporting data on 71 participants were included for this test, allowing meta‐analysis to be performed (Choi 2003; Takeshita 2008). The summary sensitivity and specificity for diagnosing intermediate‐ or high‐grade dysplasia or invasive cancer were 0.80 (95% CI 0.58 to 0.92) and 0.81 (95% CI 0.53 to 0.95), respectively.
The results including sensitivities and specificities and post‐test probabilities at median pre‐test probabilities are summarised in summary of findings Table. A forest plot summarising all of the sensitivity and specificity data for the 'precancerous or cancer (intermediate‐ or high‐grade dysplasia or invasive carcinoma) versus precancerous (low‐grade dysplasia)' studies is shown in Figure 11.

Forest plot ‐ Precancerous or cancerous (intermediate‐ or high‐grade dysplasia or invasive carcinoma) versus precancerous (low‐grade dysplasia).
Precancerous or cancerous (intermediate‐ or high‐grade dysplasia or invasive carcinoma) versus precancerous (low‐grade dysplasia) or benign
EUS: We included one study reporting data on 70 participants for this test (Kamata 2016a). The sensitivity and specificity for diagnosing intermediate‐ or high‐grade dysplasia or invasive carcinoma were 0.97 (95% CI 0.83 to 0.99) and 0.40 (95% CI 0.26 to 0.55), respectively.
The results including sensitivity and specificity and post‐test probability at median pre‐test probability are summarised in summary of findings Table. A forest plot summarising the sensitivity and specificity data for the 'precancerous or cancerous (intermediate‐ or high‐grade dysplasia or invasive carcinoma) versus precancerous (low‐grade dysplasia) or benign' study is shown in Figure 12.

Forest plot of 33 Cancerous (high‐grade dysplasia or invasive carcinoma) versus precancerous (low‐ or intermediate‐grade dysplasia) or benign ‐ EUS.
Subgroup analyses
We assessed the performance of the tests excluding any studies investigating participants with solid lesions and those in which information for solid and cystic lesions was not reported separately. All of the studies assessing the ability of different imaging modalities to differentiate precancerous versus cancerous lesions regardless of the definitions used by authors for precancer and cancer (Analysis 4 to Analysis 8) included participants with cystic focal pancreatic lesions only, therefore all the results reported are for cystic focal pancreatic lesions only.
In the analysis assessing the ability of different imaging modalities to differentiate benign or precancerous versus cancerous lesions, we excluded one study because if did not specify the type (solid or cystic) of lesions for which included participants were investigated (Jafarimehr 2010). However, as this study did not contribute to a meta‐analysis, there were no changes to the analysis.
Cancerous versus benign
In the analysis assessing the ability of different imaging modalities to differentiate benign versus cancerous lesions, we excluded eight studies because they did not explicitly include participants with cystic lesions (Brand 2000; Erkan 2012; Grieser 2010; Harrison 1999; Higashi 1997; Hu 2013; Kato 1995; Klau 2011), and one study that only had one component included (Brandwein 2001 ‐ Cystic; Brandwein 2001 ‐ Solid). This left two remaining studies, which did not contribute to a meta‐analysis due to the exclusion of the other studies (Brandwein 2001 ‐ Cystic; Hu 2013). We therefore performed no meta‐analyses for this group. The new findings for benign versus cancerous lesions are described below.
EUS‐FNA: We included one study reporting data on 26 participants for this test (Brandwein 2001 ‐ Cystic). The sensitivity and specificity for diagnosing cancer were 0.50 (95% CI 0.19 to 0.81) and 1.00 (95% CI 0.84 to 1.00), respectively.
PET: We included one study reporting data on 80 participants for this test (Hu 2013). The sensitivity and specificity for diagnosing cancer were 0.96 (95% CI 0.87 to 0.99) and 0.62 (95% CI 0.43 to 0.78), respectively.
A forest plot summarising all the sensitivity and specificity data for the cystic subgroup analysis of 'cancerous versus benign lesion' studies is shown in Figure 13.
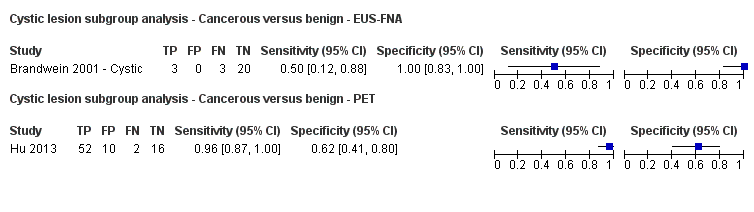
Forest plot ‐ Cystic lesion subgroup analysis: Cancerous versus benign.
Precancerous or cancerous versus benign
In the analysis assessing the ability of different imaging modalities to differentiate precancerous or cancerous versus benign lesions, we excluded a component of one study because the participants had solid pancreatic lesions (Fischer 2009 ‐ Solid). We therefore re‐performed the meta‐analysis for precancerous or cancerous versus benign lesions ‐ EUS‐FNA without these data. The remaining tests for this target condition did not have any studies excluded and were therefore not redone. The new findings are described below.
EUS‐FNA: Two studies reporting data on 34 participants were included for this test, allowing meta‐analysis to be performed (Fischer 2009 ‐ Cystic; Sedlack 2002). The summary sensitivity and summary specificity for diagnosing precancer or cancer were 0.43 (95% CI 0.19 to 0.71) and 1.00 (95% CI 0.74 to 1.00), respectively.
A forest plot summarising the sensitivity and specificity data for the cystic subgroup analysis of 'precancerous or cancerous versus benign lesion' study is shown in Figure 14.
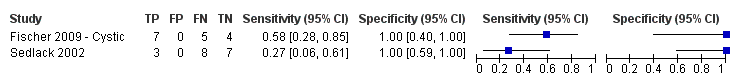
Forest plot ‐ Cystic lesion subgroup analysis: Precancerous or cancerous versus benign ‐ EUS‐FNA.
Discussion
Summary of main results
The results are summarised in summary of findings Table.
We included 54 studies involving a total of 3196 participants that evaluated the diagnostic accuracy of various imaging modalities (EUS, EUS‐FNA, PET, CT, and MRI) for characterising focal pancreatic lesions. We identified eight different target conditions in these studies, with the studies using imaging modalities to differentiate: cancerous versus benign or precancerous lesions; cancerous versus benign lesions; precancerous or cancerous lesions versus benign lesions; cancerous (invasive carcinoma) versus precancerous (dysplasia) lesions; cancerous (high‐grade dysplasia or invasive carcinoma) versus precancerous (low‐ or intermediate‐grade dysplasia) lesions; cancerous (invasive carcinoma) versus precancerous (low‐grade dysplasia) lesions; precancerous or cancerous (intermediate‐ or high‐grade dysplasia or invasive carcinoma) versus precancerous (low‐grade dysplasia) lesions; and precancerous or cancerous (intermediate‐ or high‐grade dysplasia or invasive carcinoma) versus precancerous (low‐grade dysplasia) or benign lesions. The wide variety of tumour types that constituted benign and cancerous lesions within the studies meant that only a few meaningful meta‐analyses could be performed. None of the comparisons in which single studies were included were of sufficiently high methodological quality to warrant highlighting of the results.
For differentiation of cancerous lesions from benign or precancerous lesions, only single studies were included and therefore meta‐analysis was not performed. Overall, EUS‐FNA (cytology) had a sensitivity of 0.79 (95% CI 0.60 to 0.91) and specificity of 1.00 (95% CI 0.85 to 1.00); EUS‐FNA (CEA > 500 ng/mL) had a sensitivity of 0.93 (95% CI 0.70 to 0.99) and specificity of 0.33 (95% CI 0.12 to 0.65); and PET had a sensitivity of 0.85 (95% CI 0.73 to 0.92) and specificity of 0.91 (95% CI 0.72 to 0.97).
The second analysis, of studies differentiating cancerous versus benign lesions, provided three tests in which meta‐analysis could be performed, however the data were sparse: one of these tests contained three studies, and the remaining two tests contained two studies, meaning the meta‐analysis was of limited value. There was little difference in the diagnostic test accuracy between the imaging techniques. EUS‐FNA achieved very high specificity (of 1.00, i.e. no false negatives) but modest sensitivity (0.79; 95% CI 0.07 to 1.00). A high specificity of EUS‐FNA can be expected, since this involves physically sampling the lesion. However, the modest sensitivity may reflect that the sampling methods were inadequate. Additional guidance such as identifying the location most likely to yield the correct results or additional guidance using optical endoscopy techniques such as confocal laser microendoscopy may overcome this problem and improve the sensitivity of EUS (Giovannini 2012), but there are major challenges, such as knowing the area within the lesion that is being examined by confocal laser microendoscopy, that must be addressed before such methods can be used routinely.
The third analysis, of studies differentiating precancerous or cancerous and benign lesions, only provided one test (EUS‐FNA) for which meta‐analysis was performed. The results were unreliable due to significant heterogeneity in the results between the studies.
The fourth analysis, of studies differentiating cancerous (invasive carcinoma) versus precancerous (dysplasia) lesions, provided three tests in which meta‐analysis was performed, with one test containing five studies (EUS), one test containing three studies (EUS‐FNA), and the third test containing six studies (CT). All five of the tests included in the analysis had a similar level of accuracy according to their respective ROC curves. EUS and CT showed the highest (and similar) accuracy estimates (EUS = sensitivity 0.78 and specificity 0.91; CT = sensitivity 0.72 and specificity 0.92) and included the largest number of studies (five and six, respectively) among all comparisons.
The fifth analysis, of studies differentiating cancerous (high‐grade dysplasia or invasive carcinoma) versus precancerous (low‐ or intermediate‐grade dysplasia) lesions, provided six tests in which meta‐analysis was performed, with two tests containing four studies (EUS and PET SUVmax 2 to 2.5), one test containing two studies (EUS‐FNA), three tests containing three studies (EUS‐FNA > 200, CT, and MRI), and the remaining two tests providing single studies. PET performed with the highest accuracy (sensitivity 0.90 (95% CI 0.79 to 0.96) and specificity 0.94 (95% CI 0.81 to 0.99)).
The sixth analysis, of studies differentiating cancerous (invasive carcinoma) versus precancerous (low‐grade dysplasia) lesions, provided no tests in which meta‐analysis was performed.
The seventh analysis, of studies differentiating precancerous or cancerous (intermediate‐ or high‐grade dysplasia or invasive carcinoma) versus precancerous (low‐grade dysplasia) lesions, provided two tests in which meta‐analysis was performed. The meta‐analysis results for CT (sensitivity 0.83 (95% CI 0.68 to 0.92) and specificity 0.83 (95% CI 0.64 to 0.93)) were similar to those of MRI (sensitivity 0.80 (95% CI 0.58 to 0.92) and specificity 0.81 (95% CI 0.53 to 0.95)), however lack of significant data means little can be inferred from this.
The eighth analysis, of studies differentiating precancerous or cancerous (intermediate‐ or high‐grade dysplasia or invasive carcinoma) versus precancerous (low‐grade dysplasia) or benign lesions, provided no tests in which meta‐analysis was performed.
We performed a subgroup analysis to investigate the performance of imaging modalities for cystic pancreatic lesions. This only resulted in alterations to the 'cancerous versus benign or precancerous', 'cancerous versus benign', and 'precancerous or cancerous versus benign' groups, however when re‐performed in these groups, the analysis did not result in any significant changes.
Overall, none of the tests assessed had sufficient overall diagnostic accuracy to be considered a definitive diagnostic modality. High sensitivity of the test is required so that precancer or cancer is not missed. High specificity is required to avoid major surgery. Sensitivity and specificity in excess of 90% are required to recommend the particular modality over other modalities. Only PET in differentiating precancerous (low‐ or intermediate‐grade dysplasia) versus cancer (high‐grade dysplasia or invasive carcinoma) approaches this level of accuracy. Overall, modalities other than EUS‐FNA had moderate to high sensitivity but moderate specificity, while EUS‐FNA had high specificity with moderate sensitivity in distinguishing the nature of focal pancreatic lesions.
Strengths and weaknesses of the review
We conducted a thorough literature search and included full‐text publications and abstracts without any language restrictions. Two review authors independently identified and extracted data from the studies, potentially reducing the chance of error that would be associated with one person performing the data extraction. We used strict reference standards that are likely to diagnose the target condition with a high degree of accuracy. These were the major strengths of the review.
We included EUS‐FNA as part of the review. Strictly speaking, EUS‐FNA cannot be considered an imaging modality since it uses cytology criteria or levels of tumour markers in the aspirate rather than imaging features to make the diagnosis. We had mentioned at the protocol stage that we would include EUS‐FNA in this review, as the searches for EUS return EUS‐FNA as well and because EUS‐FNA along with the imaging modalities included in this review are the most widely used tests for characterising focal pancreatic lesions. Our review provides the most important information about the tests performed to characterise focal lesions in one location and hence is probably more useful for clinicians, who would otherwise have to search for another review for information on EUS‐FNA.
The major limitation in the review process was the diverse nature of the collected data, with a wide variety of definitions of benign, precancerous, and cancerous lesions. This limited the possible analysis of the data and the conclusions that could be made from our analyses. While some authors defined precancerous lesions as lesions with low‐ and intermediate‐grade dysplasia, others defined it as low‐grade dysplasia only, while yet others considered any form of dysplasia as precancerous lesions. In the comparison 'cancer versus benign', it is unclear how the study authors dealt with precancerous lesions, that is whether they included precancerous lesions in the 'cancer' group or the 'benign' group, or whether they simply excluded them, consequently undermining any conclusions that could be made for this comparison.
We could not perform a bivariate random‐effects model that takes correlation between sensitivity and specificity into account and were unable to compare the diagnostic test accuracy of index tests using formal statistical methods due to the sparseness of data for each comparison. As a result, we performed the analysis using simpler models suggested by Takwoingi 2015 and colleagues. We reported the model with the lowest ‐2 log likelihood and also visualised the forest plots and ROC plots in deciding the model to be reported. The confidence intervals were extremely wide for the following analyses: benign versus cancer: CT; benign versus cancer: EUS‐FNA; benign versus precancer or cancer: EUS‐FNA; and precancer (low‐ or intermediate‐grade dysplasia) versus cancer (high‐grade dysplasia or invasive carcinoma): CT. While fixed‐effect model provided narrower confidence intervals for some of the above analyses, such models were inappropriate for these data because of the poor overlap of confidence intervals on the forest plot. This observation (i.e. that fixed‐effect models were not appropriate) was supported by the ‐2 log likelihoods, which were higher for the univariate fixed‐effect model than those of the models presented. The alternative was not to perform a meta‐analysis at all, which is even more difficult to interpret. At least the current results allowed us to interpret that the sensitivity or specificity or both could not be estimated reliably. There was reasonable overlap of confidence intervals in the other meta‐analyses performed. With regard to the tests for which meta‐analysis could not be performed, the diagnostic test accuracy from single studies needs confirmation by other studies to assess whether the results are reproducible. Hence, we are unable to arrive at any major conclusions based on information by a single study.
A high proportion of studies were at high risk of bias and with high concern regarding applicability in all four domains of the QUADAS‐2 tool. This makes the validity of the results questionable. Of particular concern was the type of people who underwent these tests. Because of the strict but appropriate reference standard, all of the participants in all of the studies included in this review except Cherian 2010 underwent surgical resection. This suggested that the surgeons thought that these participants had high probability of having high‐grade dysplasia or cancer, either because of the results of this test or other tests performed alongside the index tests. Since most of the studies were retrospective studies, if participants were operated on on the basis of the index test, and only participants who underwent surgery were included, participants with negative index tests but who had cancer would have been excluded inappropriately. This would have resulted in overestimation of sensitivity. The studies did not report the proportion of people in whom the different tests were feasible. This is particularly important for EUS and EUS‐FNA, since the participants may have been selected to undergo EUS or EUS‐FNA based on the proximity to the stomach or duodenum. This increases the concern regarding applicability. The studies did not report the complications associated with the index test. While this is unlikely to influence the diagnostic accuracy of the index test, it may have implications in determining the balance of benefits and harms in choosing a test.
Another limitation of this review was that we have included sensitivity‐maximising diagnostic filters for searching MEDLINE and Embase databases (Haynes 2004; Wilczynski 2005), and also used terms to limit the searches in Science Citation Index. We did this because the original searches without the filters retrieved more than 60,000 references. We had to balance the possibility of missing some studies against the risk of not being able to complete the review. We decided that it is useful to have evidence from major studies rather than having no information at all. However, it must be noted that the diagnostic filters we used have a sensitivity of 98.6% for MEDLINE and 100% for Embase. Consequently, the chances that we missed some relevant diagnostic studies are extremely low. This was further reduced by performing a 'related search' and 'citing reference search', in which we found no studies that could be included in this review.
We identified six other systematic reviews on the topics included in this systematic review (Banafea 2016; Chen 2012; Fuccio 2013; Gillis 2015; Hewitt 2012; Mei 2013). These included the role of EUS‐FNA (cytology), K‐ras gene mutation analysis of FNA aspirate, and EUS elastography in focal pancreatic lesions. The diagnostic test accuracy in four of the studies showed that EUS cytology and K‐ras gene mutation analysis of FNA aspirate had a reasonably high sensitivity (0.80 to 0.86) and very high specificity (96% to 98%) in solid pancreatic lesions (Banafea 2016; Chen 2012; Fuccio 2013; Hewitt 2012). These studies accepted cytology and clinical follow‐up (without specifying the exact nature of acceptable clinical follow‐up) in addition to histopathology as reference standards (Chen 2012; Fuccio 2013; Hewitt 2012). It is likely that this methodological difference was responsible for the major differences between our observations and these systematic reviews. In addition, these systematic reviews restricted participants to those with solid pancreatic lesions (Banafea 2016; Chen 2012; Fuccio 2013; Hewitt 2012), which could be another explanation for the differences between our observations and these systematic reviews. One systematic review evaluated EUS elastography in focal pancreatic lesions and reported a high sensitivity of 0.95 and a specificity of 0.67 (Mei 2013). We did not identify any study evaluating EUS elastography that met our inclusion criteria with respect to our reference standard, therefore we are unable to comment on the observation by Mei 2013. The last systematic review evaluated the role of EUS‐FNA and EUS‐FNA molecular analysis (i.e. check for abnormal genes) in people with cystic pancreatic lesions. The authors found poor sensitivity and high specificity of EUS‐FNA, which is similar to our findings (Gillis 2015).
Applicability of findings to the review question
All studies had high applicability concerns, making the applicability of findings to the target patient population of all incidental lesions questionable. The findings are applicable only for people who are suspected to be at high risk of high‐grade dysplasia or cancer. The review question was to find out the diagnostic accuracy of these index tests in people with focal pancreatic lesions, usually detected incidentally. However, all of the studies that met the inclusion criteria for this review used surgical excision as the reference standard, suggesting that the surgeons considered these patients to have a high risk of malignancy based on the results of the index tests or any additional tests. In terms of current availability of these tests, CT scan and MRI are likely to be available in most secondary centres. EUS is likely to be available in limited secondary centres and most tertiary centres that treat pancreatic lesions. PET is likely to be available only in limited tertiary centres, although the tertiary centres are likely to have access to a PET scan. However, based on the observations in this review, there do not appear to be any major differences between the different imaging modalities. The improved sensitivity of EUS‐FNA compared to other imaging modalities is compensated by a corresponding decrease in sensitivity, consequently there do not appear to be major advantages to using EUS for characterising focal pancreatic lesions compared to other non‐invasive methodologies.

Clinical pathway.
Abbreviations:
Ca 19‐9: carbohydrate antigen 19‐9
CT: computed tomography
EUS: endoscopic ultrasound
MRI: magnetic resonance imaging
PET: positron emission tomography

Study flow diagram.

Risk of bias and applicability concerns graph: review authors' judgements about each domain presented as percentages across included studies.

Risk of bias and applicability concerns summary: review authors' judgements about each domain for each included study.

Forest plot ‐ Cancerous versus benign or precancerous.

Forest plot ‐ Cancerous versus benign.

Forest plot ‐ Precancerous or cancerous versus benign.

Forest plot ‐ Cancerous (invasive carcinoma) versus precancerous (dysplasia).

Forest plot ‐ Cancerous (high‐grade dysplasia or invasive carcinoma) versus precancerous (low‐ or intermediate‐grade dysplasia).

Forest plot ‐ Cancerous (invasive carcinoma) versus precancerous (low‐grade dysplasia).

Forest plot ‐ Precancerous or cancerous (intermediate‐ or high‐grade dysplasia or invasive carcinoma) versus precancerous (low‐grade dysplasia).

Forest plot of 33 Cancerous (high‐grade dysplasia or invasive carcinoma) versus precancerous (low‐ or intermediate‐grade dysplasia) or benign ‐ EUS.

Forest plot ‐ Cystic lesion subgroup analysis: Cancerous versus benign.

Forest plot ‐ Cystic lesion subgroup analysis: Precancerous or cancerous versus benign ‐ EUS‐FNA.

Cancerous versus benign or precancerous ‐ EUS‐FNA (cytology).

Cancerous versus benign or precancerous ‐ EUS‐FNA (CEA > 500 ng/mL).

Cancerous versus benign or precancerous ‐ PET.

Cancerous versus benign ‐ EUS.

Cancerous versus benign ‐ EUS‐FNA.

Cancerous versus benign ‐ PET.

Cancerous versus benign ‐ PET (SUVmax > 3.5).

Cancerous versus benign ‐ CT.

Cancerous versus benign ‐ MRI.

Precancerous or cancerous versus benign ‐ EUS.

Precancerous or cancerous versus benign ‐ EUS‐FNA.

Precancerous or cancerous versus benign ‐ EUS‐FNA (CEA > 50 ng/mL).

Precancerous or cancerous versus benign ‐ PET (SUVmax > 2.4).

Precancerous or cancerous versus benign ‐ CT.

Precancerous or cancerous versus benign ‐ MRI.

Cancerous (invasive carcinoma) versus precancerous (dysplasia) ‐ EUS.

Cancerous (invasive carcinoma) versus precancerous (dysplasia) ‐ EUS‐FNA.

Cancerous (invasive carcinoma) versus precancerous (dysplasia) ‐ EUS‐FNA (CEA > 200 ng/mL).

Cancerous (invasive carcinoma) versus precancerous (dysplasia) ‐ CT.

Cancerous (invasive carcinoma) versus precancerous (dysplasia) ‐ MRI.

Cancerous (high‐grade dysplasia or invasive carcinoma) versus precancerous (low‐ or intermediate‐grade dysplasia) ‐ EUS.

Cancerous (high‐grade dysplasia or invasive carcinoma) versus precancerous (low‐ or intermediate‐grade dysplasia) ‐ EUS‐FNA.

Cancerous (high‐grade dysplasia or invasive carcinoma) versus precancerous (low‐ or intermediate‐grade dysplasia) ‐ EUS‐FNA (CEA > 200 ng/mL).

Cancerous (high‐grade dysplasia or invasive carcinoma) versus precancerous (low‐ or intermediate‐grade dysplasia) ‐ EUS‐FNA (CA 19‐9 > 1000 U/mL).

Cancerous (high‐grade dysplasia or invasive carcinoma) versus precancerous (low‐ or intermediate‐grade dysplasia) ‐ EUS‐FNA (CEA > 692.8 ng/mL).

Cancerous (high‐grade dysplasia or invasive carcinoma) versus precancerous (low‐ or intermediate‐grade dysplasia) ‐ PET (SUVmax 2 to 2.5).

Cancerous (high‐grade dysplasia or invasive carcinoma) versus precancerous (low‐ or intermediate‐grade dysplasia) ‐ CT.

Cancerous (high‐grade dysplasia or invasive carcinoma) versus precancerous (low‐ or intermediate‐grade dysplasia) ‐ MRI.

Cancerous (invasive carcinoma) versus precancerous (low‐grade dysplasia) ‐ EUS.

Cancerous (invasive carcinoma) versus precancerous (low‐grade dysplasia) ‐ CT.

Precancerous or cancerous (intermediate‐ or high‐grade dysplasia or invasive carcinoma) versus precancerous (low‐grade dysplasia) ‐ CT.
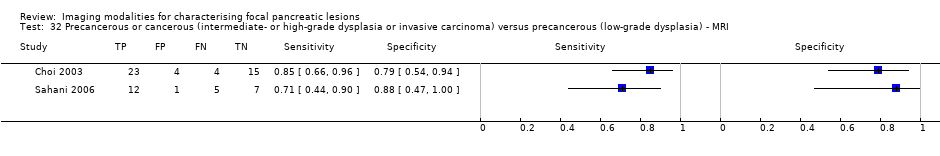
Precancerous or cancerous (intermediate‐ or high‐grade dysplasia or invasive carcinoma) versus precancerous (low‐grade dysplasia) ‐ MRI.

Cancerous (high‐grade dysplasia or invasive carcinoma) versus precancerous (low‐ or intermediate‐grade dysplasia) or benign ‐ EUS.

Cystic lesion subgroup analysis ‐ Cancerous versus benign ‐ EUS‐FNA.

Cystic lesion subgroup analysis ‐ Cancerous versus benign ‐ PET.

Cystic lesion subgroup analysis ‐ Precancerous or cancerous versus benign ‐ EUS‐FNA.
| Name of test | Number of studies (number of participants) | Sensitivity (95% CI) | Specificity (95% CI) | Post‐test probability of positive test* (95% CI) | Post‐test probability of negative test* (95% CI) | Number of false positives per 100 positive index test results (95% CI) | Number of false negatives per 100 negative index test results (95% CI) | Risk of bias | Applicability concerns | Uncertainty (due to inconsistency or inability to assess inconsistency, and random errors because of overall small sample size) |
| Cancerous versus benign or precancerous (median pre‐test probability: 63%) | ||||||||||
| EUS‐FNA (cytology) | 1 (45) | 0.79 (0.60 to 0.91) | 1.00 (0.85 to 1.00) | 98% (79% to 100%) | 26% (14% to 43%) | 2 (0 to 21) | 26 (14 to 43) | Unclear | High | High |
| EUS‐FNA (CEA > 500 ng/mL) | 1 (24) | 0.93 (0.70 to 0.99) | 0.33 (0.12 to 0.65) | 70% (59% to 79%) | 25% (4% to 73%) | 30 (21 to 41) | 25 (4 to 73) | High | High | High |
| PET (criteria unspecified) | 1 (76) | 0.85 (0.73 to 0.92) | 0.91 (0.72 to 0.97) | 94% (81% to 98%) | 21% (12% to 34%) | 6 (2 to 19) | 21 (12 to 34) | Unclear | High | High |
| Cancerous versus benign (median pre‐test probability: 70%) | ||||||||||
| EUS | 2 (133) | 0.95 (0.84 to 0.99) | 0.53 (0.31 to 0.74) | 82% (74% to 88%) | 18% (6% to 45%) | 18 (12 to 26) | 18 (6 to 45) | Unclear or high | High | High |
| EUS‐FNA (cytology) | 3 (147) | 0.79 (0.07 to 1.00) | 1.00 (0.91 to 1.00) | 99% (90% to 100%) | 32% (2% to 92%) | 0 (0 to 9) | 32 (2 to 92) | High | High | High |
| PET (criteria unspecified) | 3 (99) | 0.92 (0.80 to 0.97) | 0.65 (0.39 to 0.85) | 86% (75% to 92%) | 22% (9% to 44%) | 14 (8 to 25) | 22 (9 to 44) | High | High | High |
| PET (SUVmax > 3.5) | 1 (80) | 0.96 (0.87 to 0.99) | 0.62 (0.43 to 0.78) | 85% (78% to 90%) | 12% (3% to 36%) | 15 (10 to 22) | 12 (3 to 36) | High | High | High |
| CT | 2 (123) | 0.98 (0.00 to 1.00) | 0.76 (0.02 to 1.00) | 90% (17% to 100%) | 6% (0% to 100%) | 10 (0 to 83) | 6 (0 to 100) | Unclear or high | High | High |
| MRI | 1 (29) | 0.80 (0.58 to 0.92) | 0.89 (0.57 to 0.98) | 94% (72% to 99%) | 34% (17% to 56%) | 6 (1 to 28) | 34 (17 to 56) | High | High | High |
| Precancerous or cancerous versus benign (median pre‐test probability: 71%) | ||||||||||
| EUS | 1 (34) | 0.92 (0.74 to 0.98) | 0.60 (0.31 to 0.83) | 85% (72% to 92%) | 25% (7% to 58%) | 15 (8 to 28) | 25 (7 to 58) | High | High | High |
| EUS‐FNA (cytology) | 2 (52) | 0.73 (0.01 to 1.00) | 0.94 (0.15 to 1.00) | 97% (25% to 100%) | 41% (1% to 98%) | 3 (0 to 75) | 41 (1 to 98) | Unclear or high | High | High |
| EUS‐FNA (CEA > 50 ng/mL) | 1 (11) | 0.29 (0.08 to 0.64) | 0.25 (0.05 to 0.70) | 48% (20% to 77%) | 87% (54% to 98%) | 52 (23 to 80) | 87 (54 to 98) | High | High | High |
| PET (SUVmax 2.4) | 1 (32) | 0.94 (0.74 to 0.99) | 0.93 (0.69 to 0.99) | 97% (83% to 100%) | 13% (2% to 49%) | 3 (0 to 17) | 13 (2 to 49) | High | High | High |
| CT | 1 (48) | 0.62 (0.45 to 0.76) | 0.64 (0.39 to 0.84) | 81% (66% to 90%) | 59% (44% to 72%) | 19 (10 to 34) | 59 (44 to 72) | Unclear | High | High |
| MRI | 1 (27) | 0.93 (0.69 to 0.99) | 0.85 (0.58 to 0.96) | 94% (80% to 98%) | 17% (3% to 58%) | 6 (2 to 20) | 17 (3 to 58) | High | High | High |
| Cancerous (invasive carcinoma) versus precancerous (dysplasia) (median pre‐test probability: 27%) | ||||||||||
| EUS | 5 (156) | 0.78 (0.45 to 0.94) | 0.91 (0.61 to 0.98) | 75% (37% to 94%) | 8% (3% to 22%) | 25 (6 to 63) | 8 (3 to 22) | Unclear or high | High | High |
| EUS‐FNA (cytology) | 3 (158) | 0.66 (0.03 to 0.99) | 0.92 (0.73 to 0.98) | 75% (29% to 95%) | 12% (1% to 69%) | 25 (5 to 71) | 12 (1 to 69) | Unclear or high | High | High |
| EUS‐FNA (CEA > 200 ng/mL) | 1 (41) | 1.00 (0.57 to 1.00) | 0.64 (0.48 to 0.78) | 51% (40% to 61%) | Not estimable | 49 (39 to 60) | Not estimable | High | High | High |
| CT | 6 (326) | 0.72 (0.50 to 0.87) | 0.92 (0.81 to 0.97) | 78% (57% to 91%) | 10% (5% to 18%) | 22 (9 to 43) | 10 (5 to 18) | Unclear or high | High | High |
| MRI | 1 (32) | 0.75 (0.30 to 0.95) | 0.93 (0.77 to 0.98) | 80% (48% to 94%) | 9% (2% to 35%) | 20 (6 to 52) | 9 (2 to 35) | High | High | High |
| Cancerous (high‐grade dysplasia or invasive carcinoma) versus precancerous (low‐ or intermediate‐grade dysplasia) (median pre‐test probability: 45%) | ||||||||||
| EUS | 4 (196) | 0.86 (0.74 to 0.92) | 0.91 (0.83 to 0.96) | 89% (80% to 94%) | 11% (7% to 19%) | 11 (6 to 20) | 11 (7 to 19) | High | High | High |
| EUS‐FNA (cytology) | 3 (310) | 0.47 (0.24 to 0.70) | 0.91 (0.32 to 1.00) | 81% (19% to 99%) | 32% (22% to 45%) | 19 (1 to 81) | 32 (22 to 45) | Unclear or high | High | High |
| EUS‐FNA (CEA > 200 ng/mL) | 3 (160) | 0.58 (0.28 to 0.83) | 0.51 (0.19 to 0.81) | 49% (28% to 70%) | 40% (19% to 65%) | 51 (30 to 72) | 40 (19 to 65) | High | High | High |
| EUS‐FNA (CA 19‐9 > 1000 U/mL) | 1 (41) | 0.90 (0.60 to 0.98) | 0.42 (0.26 to 0.59) | 56% (47% to 65%) | 16% (3% to 57%) | 44 (35 to 53) | 16 (3 to 57) | High | High | High |
| EUS‐FNA (CEA > 692.8 ng/mL) | 1 (20) | 0.80 (0.49 to 0.94) | 0.90 (0.60 to 0.98) | 87% (50% to 98%) | 15% (5% to 39%) | 13 (2 to 50) | 15 (5 to 39) | Unclear | High | High |
| PET (SUVmax > 2 to 2.5) | 4 (124) | 0.90 (0.79 to 0.96) | 0.94 (0.81 to 0.99) | 93% (78% to 98%) | 8% (4% to 16%) | 7 (2 to 22) | 8 (4 to 16) | High | High | High |
| CT | 3 (139) | 0.87 (0.00 to 1.00) | 0.96 (0.00 to 1.00) | 95% (0% to 100%) | 10% (0% to 100%) | 5 (0 to 100) | 10 (0 to 100) | Unclear or high | High | High |
| MRI | 3 (189) | 0.69 (0.44 to 0.86) | 0.93 (0.43 to 1.00) | 89% (35% to 99%) | 21% (12% to 36%) | 11 (1 to 65) | 21 (12 to 36) | High | High | High |
| Cancerous (invasive carcinoma) versus precancerous (low‐grade dysplasia) (median pre‐test probability: 21%) | ||||||||||
| EUS | 1 (51) | 0.77 (0.50 to 0.92) | 0.89 (0.76 to 0.96) | 67% (43% to 84%) | 7% (3% to 16%) | 33 (16 to 57) | 7 (3 to 16) | Unclear | High | High |
| CT | 1 (46) | 0.50 (0.22 to 0.78) | 0.95 (0.83 to 0.99) | 72% (36% to 92%) | 13% (7% to 22%) | 28 (8 to 64) | 13 (7 to 22) | High | High | High |
| Precancerous or cancerous (intermediate‐ or high‐grade dysplasia or invasive carcinoma) versus precancerous (low‐grade dysplasia) (median pre‐test probability: 59%) | ||||||||||
| CT | 3 (106) | 0.83 (0.68 to 0.92) | 0.83 (0.64 to 0.93) | 89% (56% to 98%) | 33% (18% to 52%) | 11 (2 to 44) | 33 (18 to 52) | High | High | High |
| MRI | 2 (71) | 0.80 (0.58 to 0.92) | 0.81 (0.53 to 0.95) | 86% (67% to 95%) | 27% (13% to 47%) | 14 (5 to 33) | 27 (13 to 47) | High | High | High |
| Precancerous or cancerous (intermediate‐ or high‐grade dysplasia or invasive carcinoma) versus precancerous (low‐grade dysplasia) or benign (median pre‐test probability: 43%) | ||||||||||
| EUS | 1 (70) | 0.97 (0.83 to 0.99) | 0.40 (0.26 to 0.55) | 55% (48% to 61%) | 6% (1% to 31%) | 45 (39 to 52) | 6 (1 to 31) | High | High | High |
| *Post‐test probability was calculated at the median pre‐test probability. Abbreviations: CA 19‐9: carbohydrate antigen 19‐9 | ||||||||||
| Domain | Signalling question | Signalling question | Signalling question | Risk of bias | Concerns for |
| 1: Patient sampling | Was a consecutive or random sample of patients enrolled? | Was a case‐control design avoided? | Did the study avoid inappropriate exclusions? | Could the selection of participants have introduced bias? | Are there concerns that the included participants and setting do not match the review question? |
| Yes: all consecutive patients or random sample of patients with focal pancreatic lesions were enrolled No: selected patients were enrolled Unclear: this was not clear from the report | Yes: case‐control design was avoided No: case‐control design was not avoided Unclear: this was not clear from the report | Yes: the study avoided inappropriate exclusions (i.e. difficult‐to‐diagnose patients) No: the study excluded patients inappropriately Unclear: this was not clear from the report | Low risk: 'yes' for all signalling questions High risk: 'no' or 'unclear' for at least 1 signalling question | Low concern: the selected participants represent the patients in whom the tests will be used in clinical practice (please see diagnostic pathway (Figure 1)) High concern: there is high concern that participant selection was performed in such a way that the included participants did not represent the patients in whom the tests will be used in clinical practice | |
| 2: Index test(s) | Were the index test results interpreted without knowledge of the results of the reference standard? | If a threshold was used, was it prespecified? | — | Could the conduct or interpretation of the index test have introduced bias? | Are there concerns that the index test, its conduct, or its interpretation differ from the review question? |
| Yes: index test results were interpreted without knowledge of the results of the reference standard No: index test results were interpreted with knowledge of the results of the reference standard Unclear: this was not clear from the report | Yes: if the criteria for a positive test were prespecified No: if the criteria for a positive test were not prespecified Unclear: this was not clear from the report | — | Low risk: 'yes' for all signalling questions High risk: 'no' or 'unclear' for at least 1 of the 2 signalling questions | High concern: there is high concern that the conduct or interpretation of the index test differs from the way it is likely to be used in clinical practice Low concern: there is low concern that the conduct or interpretation of the index test differs from the way it is likely to be used in clinical practice | |
| 3: Target condition and reference standard(s) | Is the reference standard likely to classify the target condition correctly? | Were the reference standard results interpreted without knowledge of the results of the index tests? | — | Could the reference standard, its conduct, or its interpretation have introduced bias? | Are there concerns that the target condition as defined by the reference standard does not match the review question? |
| Yes: histopathological examination of the entire lesion by surgical resection No: histopathological examination (irrespective of how the tissues were obtained for histopathological examination) in patients with positive test (for cancerous or precancerous lesions) and clinical follow‐up by a doctor (with or without sequential follow‐up with imaging) of all patients with negative test for a period of at least 6 months and for a maximum period of 24 months Unclear: this was not clear from the report. Such studies will be excluded Yes: reference standard results were interpreted without knowledge of the results of the index test No: reference standard results were interpreted with knowledge of the results of the index test Unclear: this was not clear from the report | — | Low risk: 'yes' for all signalling questions High risk: 'no' or 'unclear' for at least 1 of the 2 signalling questions | Low concern: histopathological examination of the entire lesion by surgical resection High concern: histopathological examination (irrespective of how the tissues were obtained for histopathological examination) in patients with positive test (for cancerous or precancerous lesions) and clinical follow‐up by a doctor (with or without sequential follow‐up with imaging) of all patients with negative test for a period of at least 6 months and for a maximum period of 24 months | — | |
| 4: Flow and timing | Was there an appropriate interval between index test and reference standard? | Did all patients receive the same reference standard? | Were all patients included in the analysis? | Could the patient flow have introduced bias? | — |
| Yes: histopathological examination of the entire lesion (gold standard) ‐ performed within 2 months (chosen arbitrarily). Histopathological examination (irrespective of how the tissues were obtained for histopathological examination) in patients with positive test (for cancerous or precancerous lesions) performed within 2 months and clinical follow‐up (including sequential follow‐up with imaging) of all patients with negative test for a period of at least 6 months No: the histopathological examination was performed beyond 2 months of the index tests. The clinical follow‐up (including sequential follow‐up imaging) was performed less than 6 months after the index test, because some tumours may be slow‐growing Unclear: this was not clear from the report | Yes: histopathological examination of the entire lesion by surgical resection No: histopathological examination (irrespective of how the tissues were obtained for histopathological examination) in patients with positive test (for cancerous or precancerous lesions) and clinical follow‐up by a doctor (with or without sequential follow‐up with imaging) of all patients with negative test for a period of at least 6 months and for a maximum period of 24 months Unclear: this was not clear from the report. Such studies will be excluded | Yes: all patients meeting the selection criteria (selected participants) were included in the analysis, or data on all of the selected participants were available so that a 2 x 2 table including all selected participants could be constructed No: not all patients meeting the selection criteria were included in the analysis, or the 2 x 2 table could not be constructed using data on all selected participants Unclear: this was not clear from the report | Low risk: 'yes' for all signalling questions High risk: 'no' or 'unclear' for at least 1 signalling question | — |
| Comparison | Name of test | Sensitivity | Specificity |
| Cancerous versus benign or precancerous | EUS‐FNA | 0.79 (95% CI 0.60 to 0.91) | 1.00 (95% CI 0.85 to 1.00) |
| Cancerous versus benign or precancerous | EUS‐FNA | 0.93 (95% CI 0.70 to 0.99) | 0.33 (95% CI 0.12 to 0.65) |
| Cancerous versus benign or precancerous | PET | 0.85 (95% CI 0.73 to 0.92) | 0.91 (95% CI 0.72 to 0.97) |
| Cancerous versus benign | EUS | 0.95 (95% CI 0.84 to 0.99) | 0.53 (95% CI 0.31 to 0.74) |
| Cancerous versus benign | EUS‐FNA | 0.79 (95% CI 0.07 to 1.00) | 1.00 (95% CI 0.91 to 1.00) |
| Cancerous versus benign | PET (criteria unspecified) | 0.92 (95% CI 0.80 to 0.97) | 0.65 (95% CI 0.39 to 0.85) |
| Cancerous versus benign | PET (SUVmax > 3.5) | 0.96 (95% CI 0.87 to 0.99) | 0.62 (95% CI 0.43 to 0.78) |
| Cancerous versus benign | CT | 0.98 (95% CI 0.00 to 1.00) | 0.76 (95% CI 0.02 to 1.00) |
| Cancerous versus benign | MRI | 0.80 (95% CI 0.58 to 0.92) | 0.89 (95% CI 0.57 to 0.98) |
| Precancerous or cancerous versus benign | EUS | 0.92 (95% CI 0.74 to 0.98) | 0.60 (95% CI 0.31 to 0.83) |
| Precancerous or cancerous versus benign | EUS‐FNA (cytology) | 0.73 (95% CI 0.01 to 1.00) | 0.94 (95% CI 0.15 to 1.00) |
| Precancerous or cancerous versus benign | EUS‐FNA | 0.29 (95% CI 0.08 to 0.64) | 0.25 (95% CI 0.05 to 0.70) |
| Precancerous or cancerous versus benign | PET | 0.94 (95% CI 0.74 to 0.99) | 0.93 (95% CI 0.69 to 0.99) |
| Precancerous or cancerous versus benign | CT | 0.62 (95% CI 0.45 to 0.76) | 0.64 (95% CI 0.39 to 0.84) |
| Precancerous or cancerous versus benign | MRI | 0.93 (95% CI 0.69 to 0.99) | 0.85 (95% CI 0.58 to 0.96) |
| Cancerous (invasive carcinoma) versus precancerous (dysplasia) | EUS | 0.78 (95% CI 0.45 to 0.94) | 0.91 (95% CI 0.61 to 0.98) |
| Cancerous (invasive carcinoma) versus precancerous (dysplasia) | EUS‐FNA | 0.66 (95% CI 0.03 to 0.99) | 0.92 (95% CI 0.73 to 0.98) |
| Cancerous (invasive carcinoma) versus precancerous (dysplasia) | EUS‐FNA | 1.00 (95% CI 0.57 to 1.00) | 0.64 (95% CI 0.48 to 0.78) |
| Cancerous (invasive carcinoma) versus precancerous (dysplasia) | CT | 0.72 (95% CI 0.50 to 0.87) | 0.92 (95% CI 0.81 to 0.97) |
| Cancerous (invasive carcinoma) versus precancerous (dysplasia) | MRI | 0.75 (95% CI 0.30 to 0.95) | 0.93 (95% CI 0.77 to 0.98) |
| Cancerous (high‐grade dysplasia or invasive carcinoma) versus precancerous (low‐ or intermediate‐grade dysplasia) | EUS | 0.86 (95% CI 0.74 to 0.92) | 0.91 (95% CI 0.83 to 0.96) |
| Cancerous (high‐grade dysplasia or invasive carcinoma) versus precancerous (low‐ or intermediate‐grade dysplasia) | EUS‐FNA | 0.47 (95% CI 0.24 to 0.70) | 0.91 (95% CI 0.32 to 1.00) |
| Cancerous (high‐grade dysplasia or invasive carcinoma) versus precancerous (low‐ or intermediate‐grade dysplasia) | EUS‐FNA | 0.58 (95% CI 0.28 to 0.83) | 0.51 (95% CI 0.19 to 0.81) |
| Cancerous (high‐grade dysplasia or invasive carcinoma) versus precancerous (low‐ or intermediate‐grade dysplasia) | EUS‐FNA | 0.90 (95% CI 0.60 to 0.98) | 0.42 (95% CI 0.26 to 0.59) |
| Cancerous (high‐grade dysplasia or invasive carcinoma) versus precancerous (low‐ or intermediate‐grade dysplasia) | EUS‐FNA | 0.80 (95% CI 0.49 to 0.94) | 0.90 (95% CI 0.60 to 0.98) |
| Cancerous (high‐grade dysplasia or invasive carcinoma) versus precancerous (low‐ or intermediate‐grade dysplasia) | PET | 0.90 (95% CI 0.79 to 0.96) | 0.94 (95% CI 0.81 to 0.99) |
| Cancerous (high‐grade dysplasia or invasive carcinoma) versus precancerous (low‐ or intermediate‐grade dysplasia) | CT | 0.87 (95% CI 0.00 to 1.00) | 0.96 (95% CI 0.00 to 1.00) |
| Cancerous (high‐grade dysplasia or invasive carcinoma) versus precancerous (low‐ or intermediate‐grade dysplasia) | MRI | 0.69 (95% CI 0.44 to 0.86) | 0.93 (95% CI 0.43 to 1.00) |
| Cancerous (invasive carcinoma) versus precancerous (low‐grade dysplasia) | EUS | 0.77 (95% CI 0.50 to 0.92) | 0.89 (95% CI 0.76 to 0.96) |
| Cancerous (invasive carcinoma) versus precancerous (low‐grade dysplasia) | CT | 0.50 (95% CI 0.22 to 0.78) | 0.95 (95% CI 0.83 to 0.99) |
| Precancerous or cancerous (intermediate‐ or high‐grade dysplasia or invasive carcinoma) versus precancerous (low‐grade dysplasia) | CT | 0.83 (95% CI 0.68 to 0.92) | 0.83 (95% CI 0.64 to 0.93) |
| Precancerous or cancerous (intermediate‐ or high‐grade dysplasia or invasive carcinoma) versus precancerous (low‐grade dysplasia) | MRI | 0.80 (95% CI 0.58 to 0.92) | 0.81 (95% CI 0.53 to 0.95) |
| Precancerous or cancerous (intermediate‐ or high‐grade dysplasia or invasive carcinoma) versus precancerous (low‐grade dysplasia) or benign | EUS | 0.97 (95% CI 0.83 to 0.99) | 0.40 (95% CI 0.26 to 0.55) |
| Cystic lesion subgroup analysis | Cancerous versus benign ‐ EUS‐FNA (cytology) | 0.50 (95% CI 0.19 to 0.81) | 1.00 (95% CI 0.84 to 1.00) |
| Cystic lesion subgroup analysis | Cancerous versus benign ‐ PET | 0.96 (95% CI 0.87 to 0.99) | 0.62 (95% CI 0.43 to 0.78) |
| Cystic lesion subgroup analysis | Precancerous or cancerous versus benign ‐ EUS‐FNA | 0.43 (95% CI 0.19 to 0.71) | 1.00 (95% CI 0.74 to 1.00) |
| CA 19‐9: carbohydrate antigen 19‐9 | |||
| Test | No. of studies | No. of participants |
| 1 Cancerous versus benign or precancerous ‐ EUS‐FNA (cytology) Show forest plot | 1 | 45 |
| 2 Cancerous versus benign or precancerous ‐ EUS‐FNA (CEA > 500 ng/mL) Show forest plot | 1 | 24 |
| 3 Cancerous versus benign or precancerous ‐ PET Show forest plot | 1 | 76 |
| 4 Cancerous versus benign ‐ EUS Show forest plot | 2 | 133 |
| 5 Cancerous versus benign ‐ EUS‐FNA Show forest plot | 3 | 147 |
| 6 Cancerous versus benign ‐ PET Show forest plot | 3 | 99 |
| 7 Cancerous versus benign ‐ PET (SUVmax > 3.5) Show forest plot | 1 | 80 |
| 8 Cancerous versus benign ‐ CT Show forest plot | 2 | 123 |
| 9 Cancerous versus benign ‐ MRI Show forest plot | 1 | 29 |
| 10 Precancerous or cancerous versus benign ‐ EUS Show forest plot | 1 | 34 |
| 11 Precancerous or cancerous versus benign ‐ EUS‐FNA Show forest plot | 3 | 52 |
| 12 Precancerous or cancerous versus benign ‐ EUS‐FNA (CEA > 50 ng/mL) Show forest plot | 1 | 11 |
| 13 Precancerous or cancerous versus benign ‐ PET (SUVmax > 2.4) Show forest plot | 1 | 32 |
| 14 Precancerous or cancerous versus benign ‐ CT Show forest plot | 1 | 48 |
| 15 Precancerous or cancerous versus benign ‐ MRI Show forest plot | 1 | 27 |
| 16 Cancerous (invasive carcinoma) versus precancerous (dysplasia) ‐ EUS Show forest plot | 5 | 156 |
| 17 Cancerous (invasive carcinoma) versus precancerous (dysplasia) ‐ EUS‐FNA Show forest plot | 3 | 158 |
| 18 Cancerous (invasive carcinoma) versus precancerous (dysplasia) ‐ EUS‐FNA (CEA > 200 ng/mL) Show forest plot | 1 | 41 |
| 19 Cancerous (invasive carcinoma) versus precancerous (dysplasia) ‐ CT Show forest plot | 6 | 326 |
| 20 Cancerous (invasive carcinoma) versus precancerous (dysplasia) ‐ MRI Show forest plot | 1 | 32 |
| 21 Cancerous (high‐grade dysplasia or invasive carcinoma) versus precancerous (low‐ or intermediate‐grade dysplasia) ‐ EUS Show forest plot | 4 | 196 |
| 22 Cancerous (high‐grade dysplasia or invasive carcinoma) versus precancerous (low‐ or intermediate‐grade dysplasia) ‐ EUS‐FNA Show forest plot | 3 | 310 |
| 23 Cancerous (high‐grade dysplasia or invasive carcinoma) versus precancerous (low‐ or intermediate‐grade dysplasia) ‐ EUS‐FNA (CEA > 200 ng/mL) Show forest plot | 3 | 160 |
| 24 Cancerous (high‐grade dysplasia or invasive carcinoma) versus precancerous (low‐ or intermediate‐grade dysplasia) ‐ EUS‐FNA (CA 19‐9 > 1000 U/mL) Show forest plot | 1 | 41 |
| 25 Cancerous (high‐grade dysplasia or invasive carcinoma) versus precancerous (low‐ or intermediate‐grade dysplasia) ‐ EUS‐FNA (CEA > 692.8 ng/mL) Show forest plot | 1 | 20 |
| 26 Cancerous (high‐grade dysplasia or invasive carcinoma) versus precancerous (low‐ or intermediate‐grade dysplasia) ‐ PET (SUVmax 2 to 2.5) Show forest plot | 4 | 124 |
| 27 Cancerous (high‐grade dysplasia or invasive carcinoma) versus precancerous (low‐ or intermediate‐grade dysplasia) ‐ CT Show forest plot | 3 | 139 |
| 28 Cancerous (high‐grade dysplasia or invasive carcinoma) versus precancerous (low‐ or intermediate‐grade dysplasia) ‐ MRI Show forest plot | 3 | 189 |
| 29 Cancerous (invasive carcinoma) versus precancerous (low‐grade dysplasia) ‐ EUS Show forest plot | 1 | 51 |
| 30 Cancerous (invasive carcinoma) versus precancerous (low‐grade dysplasia) ‐ CT Show forest plot | 1 | 46 |
| 31 Precancerous or cancerous (intermediate‐ or high‐grade dysplasia or invasive carcinoma) versus precancerous (low‐grade dysplasia) ‐ CT Show forest plot | 3 | 106 |
| 32 Precancerous or cancerous (intermediate‐ or high‐grade dysplasia or invasive carcinoma) versus precancerous (low‐grade dysplasia) ‐ MRI Show forest plot | 2 | 71 |
| 33 Cancerous (high‐grade dysplasia or invasive carcinoma) versus precancerous (low‐ or intermediate‐grade dysplasia) or benign ‐ EUS Show forest plot | 1 | 70 |
| 34 Cystic lesion subgroup analysis ‐ Cancerous versus benign ‐ EUS‐FNA Show forest plot | 1 | 26 |
| 35 Cystic lesion subgroup analysis ‐ Cancerous versus benign ‐ PET Show forest plot | 1 | 80 |
| 36 Cystic lesion subgroup analysis ‐ Precancerous or cancerous versus benign ‐ EUS‐FNA Show forest plot | 2 | 34 |