Scolaris Content Display Scolaris Content Display

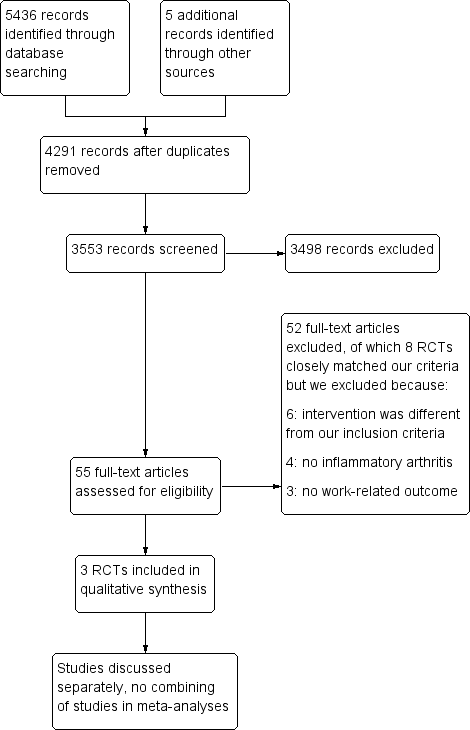
Study flow diagram.
Figuras y tablas -
Figure 1

Study flow diagram.

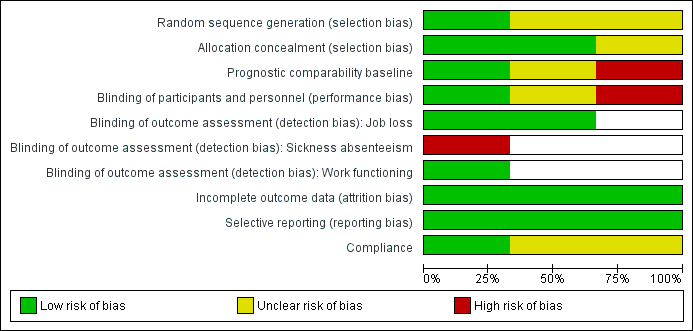
Risk of bias graph: review authors' judgements about each risk of bias item presented as percentages across all included trials.
Figuras y tablas -
Figure 2

Risk of bias graph: review authors' judgements about each risk of bias item presented as percentages across all included trials.

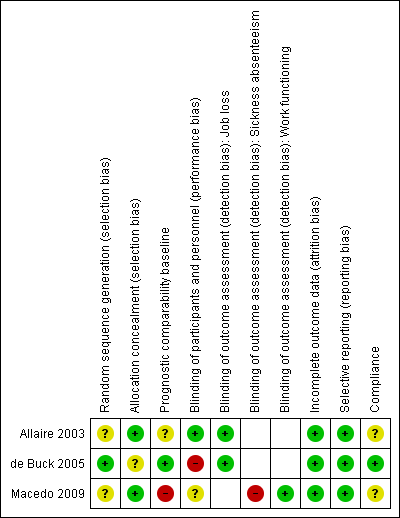
Risk of bias summary: review authors' judgements about each risk of bias item for each included trial.
Figuras y tablas -
Figure 3

Risk of bias summary: review authors' judgements about each risk of bias item for each included trial.

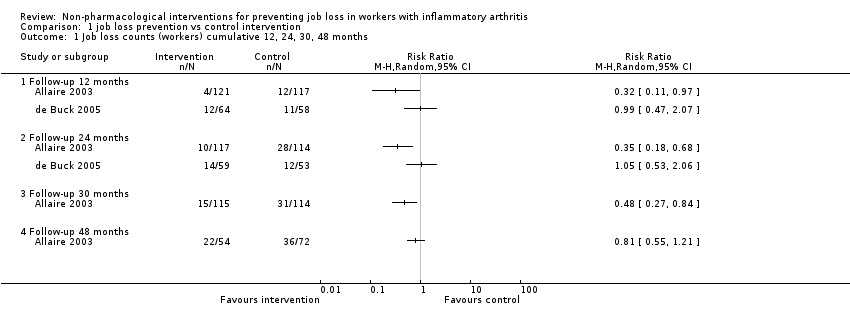
Comparison 1 job loss prevention vs control intervention, Outcome 1 Job loss counts (workers) cumulative 12, 24, 30, 48 months.
Figuras y tablas -
Analysis 1.1

Comparison 1 job loss prevention vs control intervention, Outcome 1 Job loss counts (workers) cumulative 12, 24, 30, 48 months.

Comparison 1 job loss prevention vs control intervention, Outcome 2 Sickness absenteeism ‐ work days missed per month ‐ six months.
Figuras y tablas -
Analysis 1.2

Comparison 1 job loss prevention vs control intervention, Outcome 2 Sickness absenteeism ‐ work days missed per month ‐ six months.

Comparison 1 job loss prevention vs control intervention, Outcome 3 Work functioning ‐ RA WIS ‐ six months.
Figuras y tablas -
Analysis 1.3

Comparison 1 job loss prevention vs control intervention, Outcome 3 Work functioning ‐ RA WIS ‐ six months.

Comparison 1 job loss prevention vs control intervention, Outcome 4 Extra: Job loss or increase in disability pension: counts (participants) ‐ 24 months.
Figuras y tablas -
Analysis 1.4

Comparison 1 job loss prevention vs control intervention, Outcome 4 Extra: Job loss or increase in disability pension: counts (participants) ‐ 24 months.

Comparison 1 job loss prevention vs control intervention, Outcome 5 Extra: Job loss events ‐ permanent and temporary ‐ 48 months.
Figuras y tablas -
Analysis 1.5

Comparison 1 job loss prevention vs control intervention, Outcome 5 Extra: Job loss events ‐ permanent and temporary ‐ 48 months.

Comparison 1 job loss prevention vs control intervention, Outcome 6 Extra: Sickness absenteeism ‐ Workdays missed as proportion of days worked over the past month ‐ six months.
Figuras y tablas -
Analysis 1.6

Comparison 1 job loss prevention vs control intervention, Outcome 6 Extra: Sickness absenteeism ‐ Workdays missed as proportion of days worked over the past month ‐ six months.

Summary of findings for the main comparison. Job loss prevention compared to control intervention in people with inflammatory arthritis

Job loss prevention compared to control intervention in people with IA

Patient or population: people with IA
Settings:
Intervention: job loss prevention
Comparison: control intervention consisting of usual care or information

Outcomes

Illustrative comparative risks* (95% CI)

Relative effect
(95% CI)

No of participants
(trials)

Quality of the evidence
(GRADE)

Comments

Assumed risk

Corresponding risk

Control intervention 7

Job loss prevention

Job loss
Self report by questionnaire
Follow‐up: mean 24 months

See comment

See comment

Not estimable

340
(2 trials)

⊕⊝⊝⊝
very low1,2,3,4

Due to inconsistency in the trials we did not pool these two trials

Sickness absenteeism
Self reported no workdays missed in past month. Scale from: 0 to 22.
Follow‐up: mean 6 months

The mean sickness absenteeism in the control groups was
2.75 days absent

The mean sickness absenteeism in the intervention groups was
2.42 lower
(5.03 lower to 0.19 higher)

32
(1 study)

⊕⊝⊝⊝
very low5,6

Work functioning
Rheumatoid Arthritis Work Instability Scale. Scale from: 0 to 23 (higher score = worse work functioning)
Follow‐up: mean 6 months

The mean work functioning in the control groups was
13.67 score points

The mean work functioning in the intervention groups was
4.67 lower
(8.43 to 0.91 lower)

32
(1 study)

⊕⊝⊝⊝
very low5,6

*The basis for the assumed risk (e.g. the median control group risk across studies) is provided in footnotes. The corresponding risk (and its 95% CI) is based on the assumed risk in the comparison group and the relative effect of the intervention (and its 95% CI).
CI: Confidence interval;

GRADE Working Group grades of evidence
High quality: Further research is very unlikely to change our confidence in the estimate of effect.
Moderate quality: Further research is likely to have an important impact on our confidence in the estimate of effect and may change the estimate.
Low quality: Further research is very likely to have an important impact on our confidence in the estimate of effect and is likely to change the estimate.
Very low quality: We are very uncertain about the estimate.

1 We judged the RCTs by de Buck 2005 and Macedo 2009 to have an overall high risk of bias and the RCT by Allaire 2003 to have an overall low risk of bias. Overall, we judged serious risk of bias to be present and therefore we downgraded the quality of the evidence by one level (‐1).
2 The magnitude of the effect on job loss for Allaire 2003 and de Buck 2005 show different relative risks. Allaire 2003 cites a highly significant and large beneficial effect (24 months: RR 0.35, 95% CI 0.18 to 0.68) whereas de Buck 2005 shows no effect (RR 1.05, 95% CI 0.53 to 2.06). The CIs hardly overlap. In addition, considerable statistical heterogeneity is present (I2 > 80%). Hence we did not pool the results. As we failed to identify a plausible explanation for the inconsistency, we downgraded the quality of the evidence by two levels (‐2). For the outcomes sickness absenteeism and work functioning, we only had one included RCT. Hence we judged inconsistency as not serious.
3 The number of job loss events was less than 300. The 'threshold rule of thumb value' states that there should be at least 300 events for job loss (dichotomous outcome), and for continuous outcomes there should be at least 400 participants (Higgins 2011). None of the trials fulfilled this criterion, nor did any of the comparisons for any of the outcomes. As the two RCTs reporting on job loss (Allaire 2003; de Buck 2005) were considerably larger than the one very small study (Macedo 2009) we judged the two to have serious imprecision, and so we downgraded the quality of the evidence by just one level (‐1).
4 We included both trials with smaller (N = 32 in Macedo 2009) and larger (N = 140 in de Buck 2005, N = 242 in Allaire 2003) sample sizes and both trials with positive (Allaire 2003 ; Macedo 2009) as well as non‐significant results (de Buck 2005). Given the low number of trials we were unable to further analyse publication bias with funnel plots or with statistical tests. Consequently we did not downgrade the quality of the evidence.
5 Risk of bias in the Macedo 2009 RCT related in particular to an absence of prognostic comparability and blinding of outcome assessment, which we judged to be sources for serious risk of bias. Consequently we downgraded the quality of the evidence by one level (‐1).
6Macedo 2009 included only 32 participants in total. We considered it to have very serious imprecision for the outcomes sickness absenteeism and work functioning. Thus we downgraded the quality of the evidence by two levels (‐2).

7 All control groups received either usual care or a minimal intervention such as written information in Allaire 2003.

Figuras y tablas -
Summary of findings for the main comparison. Job loss prevention compared to control intervention in people with inflammatory arthritis
Table 1. Other outcome data reported in the RCTs

Outcome measures

Follow‐up times

Trials

Extra analyses

Combined job loss or increase of disability pension

24 months

de Buck 2005

Analysis 1.4

Job loss events

48 months

Allaire 2003

Analysis 1.5

Sickness absenteeism defined as workdays missed in proportion to days worked

Macedo 2009

Analysis 1.6

In this table we present other supporting job loss outcome data reported in the trials for informative purposes only. These data do not contribute to our conclusions.

Figuras y tablas -
Table 1. Other outcome data reported in the RCTs
Comparison 1. job loss prevention vs control intervention

Outcome or subgroup title

No. of studies

No. of participants

Statistical method

Effect size

1 Job loss counts (workers) cumulative 12, 24, 30, 48 months Show forest plot

2

Risk Ratio (M‐H, Random, 95% CI)

Totals not selected

1.1 Follow‐up 12 months

2

Risk Ratio (M‐H, Random, 95% CI)

0.0 [0.0, 0.0]

1.2 Follow‐up 24 months

2

Risk Ratio (M‐H, Random, 95% CI)

0.0 [0.0, 0.0]

1.3 Follow‐up 30 months

1

Risk Ratio (M‐H, Random, 95% CI)

0.0 [0.0, 0.0]

1.4 Follow‐up 48 months

1

Risk Ratio (M‐H, Random, 95% CI)

0.0 [0.0, 0.0]

2 Sickness absenteeism ‐ work days missed per month ‐ six months Show forest plot

1

Mean Difference (IV, Fixed, 95% CI)

Totals not selected

3 Work functioning ‐ RA WIS ‐ six months Show forest plot

1

Mean Difference (IV, Fixed, 95% CI)

Totals not selected

4 Extra: Job loss or increase in disability pension: counts (participants) ‐ 24 months Show forest plot

1

Risk Ratio (M‐H, Fixed, 95% CI)

Totals not selected

5 Extra: Job loss events ‐ permanent and temporary ‐ 48 months Show forest plot

1

Risk Ratio (M‐H, Fixed, 95% CI)

Totals not selected

6 Extra: Sickness absenteeism ‐ Workdays missed as proportion of days worked over the past month ‐ six months Show forest plot

1

Mean Difference (IV, Fixed, 95% CI)

Totals not selected

Figuras y tablas -
Comparison 1. job loss prevention vs control intervention