Topiramate monotherapy for juvenile myoclonic epilepsy
Abstract
Background
Topiramate is a newer broad‐spectrum of antiepileptic drug (AED). Some studies have shown the benefits of topiramate monotherapy in the treatment of juvenile myoclonic epilepsy (JME). However, there are no current systematic reviews to determine the efficacy and tolerability of topiramate monotherapy in people with JME.
Objectives
To determine the efficacy and tolerability of topiramate monotherapy in the treatment of JME.
Search methods
We searched the Cochrane Epilepsy Group Specialized Register (2 November 2015), the Cochrane Central Register of Controlled Trials (CENTRAL via the Cochrane Register of Studies CRSO, 2 November 2015), MEDLINE (Ovid, 2 November 2015), EMBASE (1 July 2015) and ClinicalTrials.gov (2 November 2015). In an effort to identify further published, unpublished and ongoing trials, we searched ongoing trials registers, reference lists and relevant conference proceedings, and contacted authors and pharmaceutical companies.
Selection criteria
We included randomized controlled trials (RCTs) investigating topiramate monotherapy versus placebo or other AED treatment for people with JME, with the outcomes of proportion of responders or experiencing adverse events (AEs).
Data collection and analysis
Two review authors independently screened the titles and abstracts of identified records, selected studies for inclusion, extracted data, cross‐checked the data for accuracy and assessed the methodological quality. We performed no meta‐analyses due to the limited available data.
Main results
We included three studies with 83 participants. For the efficacy, a greater proportion of participants in the topiramate group had a 50% or more reduction in primarily generalized tonic‐clonic seizures (PGTCS) compared with participants in the placebo group. There were no significant differences between topiramate versus valproate in participants responding with a 50% or more reduction in myoclonic seizures or in PGTCS or seizure‐free. Concerning tolerability, we ranked AEDs associated with topiramate as moderate‐to‐severe, while we ranked 59% of AEDs linked to valproate as severe complaints. Moreover, systemic toxicity scores were higher in the valproate group than the topiramate group. We judged the quality of the evidence from the studies to be very low.
Authors' conclusions
This review does not provide sufficient evidence to support topiramate for the treatment of people with JME. Based on the current limited available data, topiramate seems to be better tolerated than valproate, but there were no more benefits of efficacy in topiramate compared with valproate. In the future, well‐designed, double‐blind RCTs with large samples are required to test the efficacy and tolerability of topiramate in people with JME.
PICO
Plain language summary
Topiramate monotherapy for juvenile myoclonic epilepsy
Background
Juvenile myoclonic epilepsy (JME) is characterized by involuntary (uncontrolled) twitching of muscles in shoulders and arms after awakening, often starting in childhood.
Study characteristics
We searched scientific databases for clinical trials comparing the antiepileptic drug, topiramate, with placebo (a pretend treatment) or another antiepileptic drug in people with JME. We wanted to evaluate how well topiramate worked and if it had any side effects.
Key results
We included and analyzed three randomized controlled trials (clinical studies where people are randomly put into one of two or more treatment groups) with 83 participants (identified from a literature search carried out on 2 November 2015). It seems that topiramate is better tolerated than valproate, but is no more effective than valproate. Topiramate seemed to work better than placebo based on a small number of included people.
Quality of the evidence
The quality of the evidence from the studies was very low and results should be interpreted with caution. In the future, well‐designed, double‐blind (where neither the participant nor the researcher know which treatment has been given until after the results have been collected) RCTs with large numbers of participants are required to test how effective and well tolerated topiramate is in people with JME.
Authors' conclusions
Summary of findings
| Topiramate compared with placebo for juvenile myoclonic epilepsy | ||||||
| Patient or population: people with juvenile myoclonic epilepsy Settings: 18 centers in the United States; 10 centers in Europe; 1 center in Costa Rica Intervention: topiramate Comparison: placebo | ||||||
| Outcomes | Illustrative comparative risks* (95% CI) | Relative effect | No of Participants | Quality of the evidence | Comments | |
| Assumed risk | Corresponding risk | |||||
| Placebo | Topiramate | |||||
| Proportion of responders (at least 50% seizure frequency reduction in PGTCS) | 182 per 1000 | 727 per 1000 (197 to 1000) | RR 4.00 (1.08 to 14.75) | 22 (1 study) | ⊕⊝⊝⊝ | More participants taking topiramate responded with a 50% or more reduction in PGTCS compared with placebo (P = 0.03) |
| Proportion of participants who experienced at least one AE and individual AEs | See comment | See comment | NA | 22 (1 study) | ⊕⊝⊝⊝ | Number of participants experiencing at least one AE was not reported. Individual AEs: no significant differences were found in nausea, upper respiratory tract infection, abnormal vision, or diarrhoea between topiramate versus placebo |
| Number of participants who were seizure‐free | Not reported | Not reported | NA | |||
| *The basis for the assumed risk was the event rate in the control group. The corresponding risk (and its 95% confidence interval) is based on the assumed risk in the comparison group and the relative effect of the intervention (and its 95% CI). | ||||||
| GRADE Working Group grades of evidence | ||||||
| 1 The included trials were reported as randomized, double‐blind trials with insufficient methodological information | ||||||
| Topiramate compared with valproate for juvenile myoclonic epilepsy | ||||||
| Patient or population: people with juvenile myoclonic epilepsy Settings: Cincinnati Children’s Hospital Medical Center, Cincinnati, USA; Haeundae Paik Hospital, Busan, Republic of Korea Intervention: topiramate Comparison: valproate | ||||||
| Outcomes | Illustrative comparative risks* (95% CI) | Relative effect | No of Participants | Quality of the evidence | Comments | |
| Assumed risk | Corresponding risk | |||||
| Valproate | Topiramate | |||||
| Proportion of responders (at least 50% seizure frequency reduction in myoclonic seizures) | 1000 per 1000 | 857 per 1000 (670 to 1000) | RR 0.88 (0.67 to 1.15) | 28 | ⊕⊝⊝⊝ | No significant difference was found |
| Proportion of responders (at least 50% seizure frequency reduction in PGTCS) | 750 per 1000 | 917 per 1000 (510 to 1000) | RR 1.22 (0.68 to 2.21) | 28 | ⊕⊝⊝⊝ | No significant difference was found |
| Proportion of participants who experienced at least one AE and individual AEs | See comment | See comment | NA | 61 | ⊕⊝⊝⊝ | Number of participants experiencing at least one AE was not reported. In Levisohn 2007 and Park 2013, we found significant differences in the AEs of paraesthesia, weight gain and tremor. Moreover, no significant difference was found in headache, concentration difficulty, fatigue, alopecia, dizziness, weight loss, psychomotor slowing, somnolence, nausea, appetite increase, insomnia, abnormal vision, rash, anorexia, hallucination or diarrhoea. |
| Number of participants who were seizure‐free | 563 per 1000 | 636 per 1000 (343 to 1188) | RR 1.13 (0.61 to 2.11) | 33 | ⊕⊝⊝⊝ | No significant difference was found (P = 0.08) |
| *The basis for the assumed risk was the event rate in the control group. The corresponding risk (and its 95% confidence interval) is based on the assumed risk in the comparison group and the relative effect of the intervention (and its 95% CI). | ||||||
| GRADE Working Group grades of evidence | ||||||
| 1 The included trials were reported as randomized, double‐blind trials with insufficient methodological information | ||||||
Background
Description of the condition
Juvenile myoclonic epilepsy (JME) was first described by Janz in 1985. It is a primary generalized epilepsy, which is characterized by irregular myoclonic jerks of shoulders and arms after awakening and bilateral synchronous, with four to six per second spike‐wave complexes (Janz 1985). JME accounts for 5% to 11% of all epilepsy cases and its prevalence varies between 10 and 20 per 100,000 population (Jallon 2005; Panayiotopoulos 1991). Age of onset ranges from six to 22 years old, but 50% of cases present between 13 and 16 years of age. Valproate is widely regarded as the first‐line therapy in JME owing to its broad spectrum of activity. However, there remains 20% of people with JME who do not achieve satisfactory control with valproate (Calleja 2001). In addition, it is generally acknowledged that JME requires lifelong therapy and the adverse effects (AE) in chronic valproate therapy are extensive (Sharpe 2008). Thus, alternative effective broad‐spectrum agents are required.
Description of the intervention
Topiramate is a newer broad‐spectrum agent that is effective in many seizure types, including focal onset and primarily generalized tonic‐clonic seizures (PGTCS) and Lennox‐Gastaut syndrome (Biton 1999; Guberman 2002; Sachdeo 1999). Topiramate monotherapy during the first year after onset controls GTCS in 62.5% of people and myoclonic jerks in 68.8% of people, although 13.6% of people have an increase in frequency of absence seizures (Alfradique 2007). Moreover, topiramate has less risk of teratogenicity than valproate, and can be used as an alternative first‐line agent in women of childbearing age (Montouris 2009).
How the intervention might work
As a sulphamate‐substituted monosaccharide, the main mode of action of topiramate is through the inhibition of carbonic anhydrase. Meanwhile, it also has antiepileptic activity, which is probably attributed to other mechanisms, including modulation of voltage‐dependent sodium channels, potentiation of GABAergic inhibition at a novel site on the gamma‐aminobutyric acid‐A (GABA‐A) receptor and possible action at N‐methyl‐D‐aspartate (NMDA) receptors (Hanaya 1998; White 2000; Zona 1997).
Why it is important to do this review
Some studies found topiramate effective in people with JME. However, no systematic review currently exists in the peer‐reviewed literature that focuses on this subject. This review aims to evaluate the efficacy and tolerability of topiramate monotherapy for people with JME.
Objectives
To evaluate the efficacy and tolerability of topiramate monotherapy in the treatment of JME.
Methods
Criteria for considering studies for this review
Types of studies
We included randomized controlled trials (RCTs) of topiramate monotherapy versus placebo or other antiepileptic drug (AED) treatment for people with JME. We included randomized cross‐over studies in meta‐analyses using the results from paired analyses (Elbourne 2002).
Types of participants
Inclusion criteria
-
People with a confirmed diagnosis of JME. Diagnostic criteria included myoclonic jerks and seizure onset in adolescence. We applied no limitation of age for enrolment.
-
People with co‐existent PGTCS with electroencephalogram (EEG)‐confirmed JME were also eligible.
Exclusion criteria
-
Previous discontinuation of topiramate owing to an AE.
-
Co‐therapy with any other AED.
-
Use of an experimental medication or device within 30 days of study entry.
Types of interventions
-
Experimental intervention: topiramate monotherapy.
-
Control intervention: placebo or other AED treatment.
-
Different control groups were separately analyzed.
Types of outcome measures
We collected and analyzed the outcomes of all the participants initially randomized by intention‐to‐treat (ITT).
Primary outcomes
-
Proportion of responders (at least 50% seizure frequency reduction from baseline to end of treatment).
Secondary outcomes
-
Proportion of participants who experienced at least one AE.
-
Proportion of participants who experienced each individual AE, such as ataxia, dizziness, fatigue or nausea.
-
Number of participants who were seizure‐free.
Search methods for identification of studies
Electronic searches
We searched the following databases:
-
Cochrane Epilepsy Group Specialized Register (2 November 2015) using the search strategy set out in Appendix 1;
-
the Cochrane Central Register of Controlled Trials (CENTRAL via the Cochrane Register of Studies CRSO, 2 November 2015) using the search strategy set out in Appendix 2;
-
MEDLINE 1946‐ (Ovid, 2 November 2015) using the search strategy set out in Appendix 3;
-
EMBASE (1 July 2015) using the search strategy set out in Appendix 4 ;
-
ClinicalTrials.gov (2 November 2015) using the search terms: topiramate; topamax; McN 4853; epitomax, AND myoclonic; Janz; petit mal.
Note: it is no longer necessary to search EMBASE, because randomised and quasi‐randomised controlled trials in EMBASE are now included in CENTRAL.
Searching other resources
We also:
-
searched reference lists of articles obtained from any source;
-
searched conference proceedings likely to contain trials relevant to the review;
-
contacted researchers, pharmaceutical companies and relevant trial authors to seek information about unpublished or incomplete trials.
We did not impose any language restrictions on our searches, and we attempted to obtain translations of articles where necessary.
Data collection and analysis
Selection of studies
Two review authors (LJ, WL) independently evaluated titles and abstracts of identified trials to determine if they fulfilled the inclusion criteria. We obtained all potentially relevant studies for further consideration. We listed the excluded studies and reported the reasons for exclusion. We resolved any disagreements by discussion or by an independent party if necessary.
Data extraction and management
Two review authors (LJ, WL) independently extracted eligible data from the published reports onto standardized forms, and cross‐checked them for accuracy. We resolved disagreements regarding data extraction by consensus between the review authors.
We used checklists to record independently details of the following:
-
study design;
-
total study duration;
-
methods of generating randomization schedule;
-
method of concealment of allocation;
-
blinding;
-
use of an ITT analysis (all participants initially randomized were included in the analyses as allocated to groups);
-
AEs and drop‐outs for all reasons;
-
participants (country, number of participants, age, gender, inclusion and exclusion criteria);
-
comparison (details of the intervention in treatment and control groups, details of co‐intervention(s) in both groups, duration of treatment);
-
outcomes and time points of measures (number of participants in each group and outcome, regardless of compliance);
-
factors for heterogeneity (sample size, missing participants, confidence interval (CI) and P value in measurement, subgroup analyses).
Assessment of risk of bias in included studies
Two review authors (LJ, WL) independently assessed methodological quality according to the Cochrane Handbook for Systematic Reviews of Interventions (Higgins 2011). We assessed six specific domains including: sequence generation, allocation concealment, blinding, incomplete outcome data, selective outcome reporting and other bias. We judged the result in each domain as 'low risk' of bias, 'high risk' of bias or 'unclear risk' of bias.
Measures of treatment effect
We tried to evaluate the data from all the participants initially randomized as far as practically possible. We expressed continuous outcomes as mean difference (MD) with 95% CI. Outcomes such as the proportion of responders were commonly reported as dichotomous outcomes; we used risk ratio (RR) with 95% CI to express the effect size. If a trial (or group within a trial) reported no AEs or drop‐outs, we calculated risk differences (RD) instead of RRs with 95% CI.
Unit of analysis issues
For any unit of analysis issues, we dealt with them according to The Cochrane Handbook for Systematic Reviews of Interventions (Higgins 2011).
Dealing with missing data
We attempted to contact the principal investigator for further details if any data were missing. According to ITT analysis, all randomized participants were included. We planned to assign zero improvement of dichotomous outcomes for the withdrawals. We planned to consider different scenarios (best‐case and worst‐case) to account for missing data.
Assessment of heterogeneity
We planned to use the standard Chi2 statistic and I2 statistic to measure the heterogeneity (Higgins 2011), and make a judgement according to the visual inspection of forest plots. For the Chi2 test, we would have rejected the hypothesis of tolerability if the P value was less than 0.10 and an I2 greater than 50% would represent significant heterogeneity. In this case, we would have tried to explore factors for heterogeneity.
Assessment of reporting biases
We planned to assess the publication bias by funnel plot if we had found more than 10 studies. However, the review included only three studies.
Data synthesis
If we found neither clinical nor statistical heterogeneity, we planned to pool results using a fixed‐effect model. We would have analyzed different controls separately. For statistical heterogeneity, we planned to incorporate the results into a random‐effects model. For heterogeneity that could not be readily explained, we would not have pooled the data but only given a description of the results.
Summary of Findings and Quality of the Evidence (GRADE)
In a post‐hoc change, we have presented two summary of findings tables; one for each comparison (summary of findings Table for the main comparison; summary of findings Table 2). We reported all outcomes in the tables; but made a general statement about the summary of findings for individual adverse events and the evidence is graded based on consideration of the evidence of all of the adverse events.
We determined the quality of the evidence using the GRADE approach; and downgraded evidence in the presence of a high risk of bias in at least one study, indirectness of the evidence, unexplained heterogeneity or inconsistency, imprecision of results, high probability of publication bias. We downgraded evidence by one level if we considered the limitation to be serious and by two levels if very serious.
Subgroup analysis and investigation of heterogeneity
We planned to analyze subgroups of studies categorized according to different doses and durations of topiramate.
As a formal method of comparing subgroups, we used the Chi2 test (to test for significant differences between subgroups of participants). For all statistical analyses, we used Review Manager 5 (RevMan 2014).
However, we did not perform subgroup analyses due to the limited available data.
Sensitivity analysis
We planned to perform sensitivity analyses for unexplained heterogeneity, such as the exclusion of cross‐over trials from the analysis, the robustness of results to fixed‐effect versus random‐effects assumptions and the inclusion or exclusion of studies at high risk of bias, with inadequate allocation concealment or lack of blinded outcome assessor. We planned to use best‐case and worst‐case scenarios for taking into account missing data.
However, we performed no sensitivity analyses due to the limited available data.
Results
Description of studies
Results of the search
We identified 60 references from the electronic database searches after excluding duplicates (Figure 1). After screening the titles and abstracts, we obtained the full papers of four studies and assessed them for eligibility. We excluded one study, due to the non‐randomized style. There were no ongoing RCTs.

Study flow diagram.
Included studies
Three randomized studies with 83 participants met the inclusion criteria.
One study enrolled 22 people with JME and evaluated the efficacy and tolerability of topiramate versus placebo (Biton 2005). The starting dose of topiramate 50 mg/day or equivalent placebo tablets was maintained for four weeks, then increased at two‐week intervals to target dosages of 400 mg/day in adults or 6 mg/kg/day in children. Treatment was continued for an additional 12 weeks.
Two studies focused on the efficacy and tolerability of topiramate versus valproate in people with JME (Levisohn 2007; Park 2013). In Levisohn 2007, 28 participants were assigned at a 2:1 ratio to topiramate (19 participants) or valproate (nine participants) for 26 weeks. The topiramate target dosage was 3 to 4 mg/kg/day (maximum 9 mg/kg/day) for participants aged 12‐16 years and 200 mg/day (maximum 600 mg/day) for participants aged over 16 years. Valproate target dosages were 10 mg/kg/day in participants aged 12 to 16 years and 750 mg/day in participants aged over 16 years (overall maximum 60 mg/kg/day). Medications were titrated at one‐ to two‐week intervals according to clinical response and were administered in divided doses. In Park 2013, 33 participants were assigned at a 1 : 1 ratio to topiramate (16 participants) or valproate (17 participants) for 32 weeks. The assigned AED was titrated up to 1200 mg/day for valproate or 100 mg/day for topiramate. The dose of valproate was titrated up 300 mg/day for two weeks, whereas topiramate was increased 25 mg/day for two weeks. In participants with a poor response to medication during the 24‐week maintenance phase, the dose of valproate was increased 300 mg/day for one month to a maximum dose of 2400 mg/day, and the dose of topiramate was increased 50 mg/day for one month to a maximum 300 mg/day. Further details of the included studies are provided in the Characteristics of included studies table.
Excluded studies
We excluded one study after full‐text evaluation (Sousa Pda 2005). The reason for exclusion was due to the non‐randomized style (see Characteristics of excluded studies table).
Risk of bias in included studies
All three included studies were subject to an assessment of bias on six domains. The information regarding risk of bias is provided in Figure 2 and Figure 3.
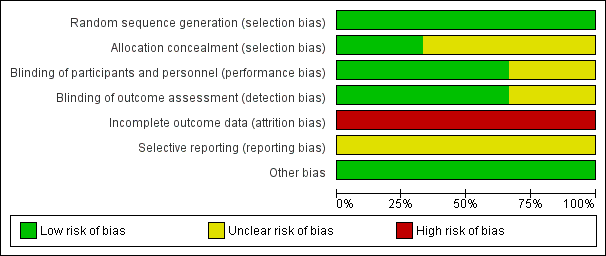
Risk of bias graph: review authors' judgements about each risk of bias item presented as percentages across all included studies.

Risk of bias summary: review authors' judgements about each risk of bias item for each included study.
Allocation
All three included studies reported the method of random sequence generation and we assessed them as at low risk of bias. However, only one study described the details of allocation concealment (Levisohn 2007). For the studies without information of allocation concealment, we assessed them as at unclear risk of bias.
Blinding
Two studies were double‐blind RCTs with low risk of bias (Biton 2005; Levisohn 2007). One study was open‐label, without information of blinding, therefore, we evaluated this at high risk of bias (Park 2013).
Incomplete outcome data
All three studies had incomplete outcome data. The proportion of participants who discontinued was more than 10% in all the studies. Therefore, we assessed all three studies at high risk of bias.
Selective reporting
We intended to use the table of 'Outcome Reporting Bias In Trials (ORBIT)' to evaluate selective outcome reporting (Kirkham 2010). However, the reporting bias could not be assessed as none of pre‐published protocols were available.
Other potential sources of bias
We found no other potential sources of bias. Insufficient numbers of trials were available for a funnel plot analysis.
Effects of interventions
See: Summary of findings for the main comparison ; Summary of findings 2
Efficacy
Topiramate versus placebo
In Biton 2005, significantly more participants taking topiramate responded with a 50% or more reduction in PGTCS compared with placebo (73% with topiramate versus 18% with placebo; (RR 4.00, 95% CI 1.08 to 14.75, P value = 0.03) (Analysis 1.1). The median PGTCS reduction after 20 weeks was 64% in the topiramate group and 38% in the placebo group, which was not significantly different. Topiramate improved control of myoclonic seizures, including an increase in the number of weeks without myoclonic seizures (171% increase with topiramate versus 130% increase with placebo), which was not significantly different. The number of absence‐free weeks was increased by 15% in topiramate group, but decreased by 7% in placebo group (P value = 0.07). Three participants taking topiramate had no PGTCS and one had no myoclonic seizures, and two participants taking placebo had no PGTCS. In five participants taking placebo, seizure frequency increased more than 50% from baseline (PGTCS, one participant; absence, three participants; myoclonic, one participant), while seizure frequency increased more than 50% in two participants taking topiramate (absence, one participant; myoclonic, one participant).
Topiramate versus valproate
In Levisohn 2007 using ITT, fewer participants taking topiramate responded with a 50% or more reduction in myoclonic seizures compared with valproate, which was not significantly different (85% with topiramate versus 100% with valproate, (RR 0.88, 95% CI 0.67 to 1.15)) (Analysis 2.1). However, more participants taking topiramate responded with a 50% or more reduction in PGTCS compared with valproate, which was not significantly different (91% with topiramate versus 75% with valproate,(RR 1.22, 95% CI 0.68 to 2.21) ) (Analysis 2.2).
For Park 2013, 11/16 (68.9%) participants in the topiramate group completed 24‐week maintenance therapy, in which 7/11 (64%) were seizure‐free. While 16/17 (94.1%) participants in the valproate group completed 24‐week follow‐up, in which 9/16 (56%) were seizure‐free. This was not significantly different ((RR 1.13, 95% CI 0.61 to 2.11, P value = 0.08) (Analysis 2.3).
In Levisohn 2007, 8/12 (67%) participants in the topiramate group and 4/7 (57%) participants in the valproate group had no seizures during the 12‐week maintenance period. Physicians reported that 73% of participants experienced marked/moderate global improvement with topiramate or valproate treatment, whereas 56% of participants felt that they had experienced marked/moderate improvement. According to physicians and participants, 43% of topiramate‐treated participants and 14% of valproate‐treated participants experienced marked/moderate improvement in alertness. Alertness worsened in one valproate‐treated participants.
Tolerability
None of the studies reported the number of participants who experienced at least one AE.
Topiramate versus placebo
In Biton 2005, we found no significant difference in the AEs of nausea (Analysis 1.2), upper respiratory tract infection (Analysis 1.3), abnormal vision (Analysis 1.4), or diarrhoea (Analysis 1.5) between topiramate versus placebo.
Topiramate versus valproate
In Levisohn 2007 and Park 2013, we found significant differences in the AEs of paraesthesia (Analysis 2.4), weight gain (Analysis 2.5), and tremor (Analysis 2.6). There was no significant difference in headache (Analysis 2.7), concentration difficulty (Analysis 2.8), fatigue (Analysis 2.9), alopecia (Analysis 2.10), dizziness (Analysis 2.11), weight loss (Analysis 2.12), psychomotor slowing (Analysis 2.13), somnolence (Analysis 2.14), nausea (Analysis 2.15), appetite increase (Analysis 2.16), insomnia (Analysis 2.17), abnormal vision (Analysis 2.18), rash (Analysis 2.19), anorexia (Analysis 2.20), hallucination (Analysis 2.21) or diarrhoea (Analysis 2.22).
In Levisohn 2007, systemic toxicity scores were higher in participants taking valproate at each evaluation (at four, eight, 14 and 26 weeks). Neurotoxicity scores did not substantially differ between treatment groups.
Discussion
Summary of main results
For efficacy, there were significantly more participants in the topiramate group with a 50% or more reduction in PGTCS than participants in placebo group (Biton 2005). There were no significant differences between topiramate versus valproate in participants who responded with a 50% or more reduction in myoclonic seizures or in PGTCS (Levisohn 2007), or who were seizure‐free (Park 2013). Concerning tolerability, there were 23 AEs occurred in 11 participants taking topiramate and seven AEs in 11 participants taking placebo (Biton 2005). AEs associated with topiramate were ranked as moderate‐to‐severe, while 59% of AEs linked to valproate were ranked as severe complaints (Park 2013). Moreover, systemic toxicity scores were higher in valproate group than topiramate group (Levisohn 2007).
Overall completeness and applicability of evidence
The evidence for topiramate in the treatment of JME was insufficient. Because of the limited number of included studies and substantial heterogeneity in comparison (different controls) and outcomes design, meta‐analysis was not applicable. We found high risk of bias in incomplete outcome data in all the three RCTs. Furthermore, the sample size of randomized participants was too small to reach a robust conclusion. For topiramate versus placebo, 22 participants were randomized, while there were 61 participants randomized in topiramate versus valproate. Therefore, studies with high‐quality and large samples are required to strengthen the applicability of evidence.
Quality of the evidence
The limitations of methodology were found in all the included studies. Two RCTs did not provide any information of allocation concealment, therefore, we assessed them as unclear risk of bias (Biton 2005; Park 2013). One RCT was not of double‐blind design with high risk of bias in blinding (Park 2013). In all the three RCTs, attrition bias was with high risk (Biton 2005; Levisohn 2007; Park 2013). The reporting bias could not be assessed as none of pre‐published protocols were available. Therefore, we regard the quality of evidence to be very low and the conclusions should be interpreted with caution.
Potential biases in the review process
The search for trials was rigorously performed based on the strategies in different electronic databases. To identify unpublished or incomplete trials, we also searched for protocols, but found no eligible studies. In addition, due to the inclusion of only three RCTs, we could not assess publication bias using funnel plots. Therefore, we could not excluded the possibility that we did not identify unpublished trials.

Study flow diagram.

Risk of bias graph: review authors' judgements about each risk of bias item presented as percentages across all included studies.

Risk of bias summary: review authors' judgements about each risk of bias item for each included study.
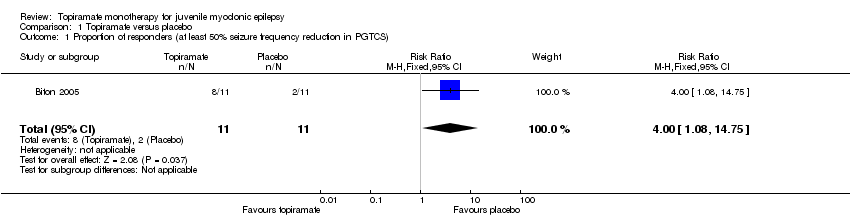
Comparison 1 Topiramate versus placebo, Outcome 1 Proportion of responders (at least 50% seizure frequency reduction in PGTCS).

Comparison 1 Topiramate versus placebo, Outcome 2 Nausea.

Comparison 1 Topiramate versus placebo, Outcome 3 Upper respiratory tract infection.

Comparison 1 Topiramate versus placebo, Outcome 4 Abnormal vision.

Comparison 1 Topiramate versus placebo, Outcome 5 Diarrhoea.

Comparison 2 Topiramate versus valproate, Outcome 1 Proportion of responders (at least 50% seizure frequency reduction in myoclonic seizures).
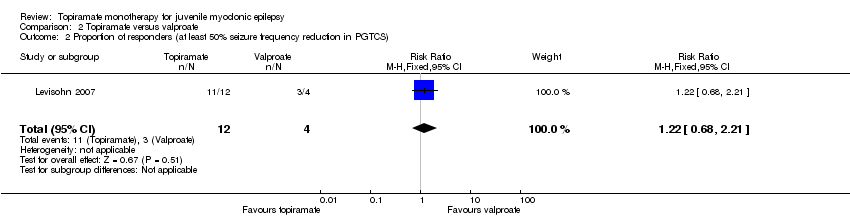
Comparison 2 Topiramate versus valproate, Outcome 2 Proportion of responders (at least 50% seizure frequency reduction in PGTCS).

Comparison 2 Topiramate versus valproate, Outcome 3 Number of participants with seizure‐free.
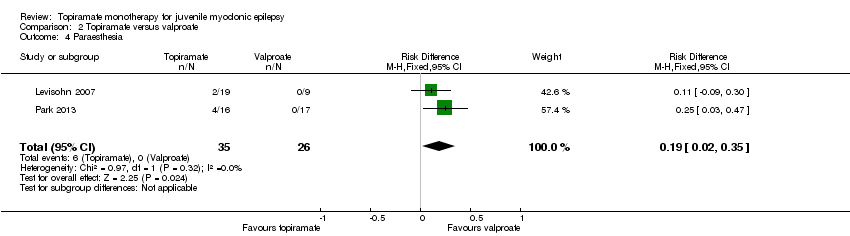
Comparison 2 Topiramate versus valproate, Outcome 4 Paraesthesia.

Comparison 2 Topiramate versus valproate, Outcome 5 Weight gain.

Comparison 2 Topiramate versus valproate, Outcome 6 Tremor.
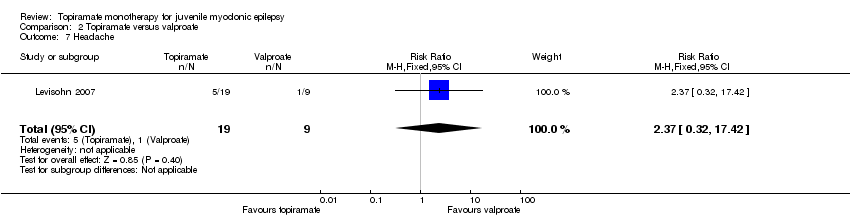
Comparison 2 Topiramate versus valproate, Outcome 7 Headache.
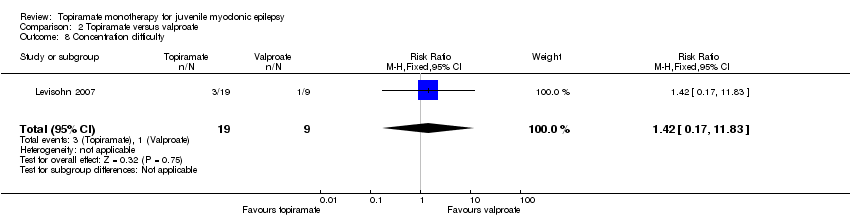
Comparison 2 Topiramate versus valproate, Outcome 8 Concentration difficulty.
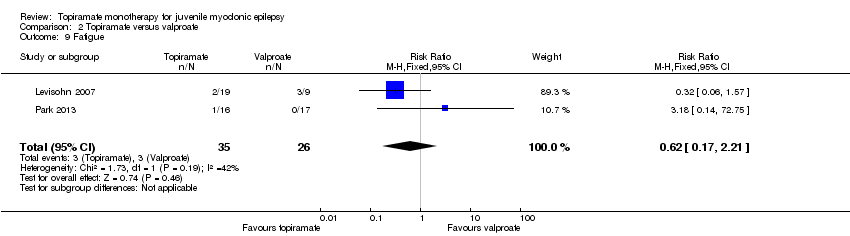
Comparison 2 Topiramate versus valproate, Outcome 9 Fatigue.

Comparison 2 Topiramate versus valproate, Outcome 10 Alopecia.

Comparison 2 Topiramate versus valproate, Outcome 11 Dizziness.

Comparison 2 Topiramate versus valproate, Outcome 12 Weight loss.

Comparison 2 Topiramate versus valproate, Outcome 13 Psychomotor slowing.
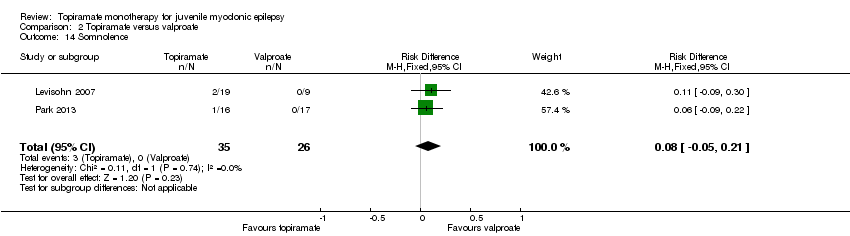
Comparison 2 Topiramate versus valproate, Outcome 14 Somnolence.

Comparison 2 Topiramate versus valproate, Outcome 15 Nausea.

Comparison 2 Topiramate versus valproate, Outcome 16 Appetite increase.

Comparison 2 Topiramate versus valproate, Outcome 17 Insomnia.
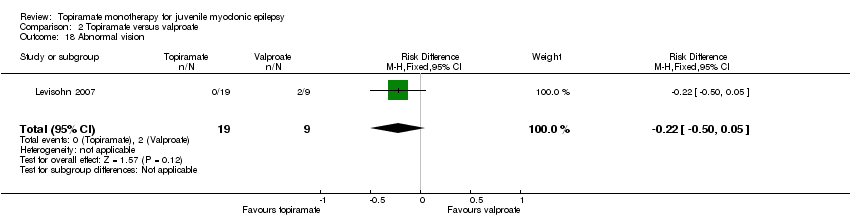
Comparison 2 Topiramate versus valproate, Outcome 18 Abnormal vision.

Comparison 2 Topiramate versus valproate, Outcome 19 Rash.

Comparison 2 Topiramate versus valproate, Outcome 20 Anorexia.

Comparison 2 Topiramate versus valproate, Outcome 21 Hallucination.

Comparison 2 Topiramate versus valproate, Outcome 22 Diarrhoea.
| Topiramate compared with placebo for juvenile myoclonic epilepsy | ||||||
| Patient or population: people with juvenile myoclonic epilepsy Settings: 18 centers in the United States; 10 centers in Europe; 1 center in Costa Rica Intervention: topiramate Comparison: placebo | ||||||
| Outcomes | Illustrative comparative risks* (95% CI) | Relative effect | No of Participants | Quality of the evidence | Comments | |
| Assumed risk | Corresponding risk | |||||
| Placebo | Topiramate | |||||
| Proportion of responders (at least 50% seizure frequency reduction in PGTCS) | 182 per 1000 | 727 per 1000 (197 to 1000) | RR 4.00 (1.08 to 14.75) | 22 (1 study) | ⊕⊝⊝⊝ | More participants taking topiramate responded with a 50% or more reduction in PGTCS compared with placebo (P = 0.03) |
| Proportion of participants who experienced at least one AE and individual AEs | See comment | See comment | NA | 22 (1 study) | ⊕⊝⊝⊝ | Number of participants experiencing at least one AE was not reported. Individual AEs: no significant differences were found in nausea, upper respiratory tract infection, abnormal vision, or diarrhoea between topiramate versus placebo |
| Number of participants who were seizure‐free | Not reported | Not reported | NA | |||
| *The basis for the assumed risk was the event rate in the control group. The corresponding risk (and its 95% confidence interval) is based on the assumed risk in the comparison group and the relative effect of the intervention (and its 95% CI). | ||||||
| GRADE Working Group grades of evidence | ||||||
| 1 The included trials were reported as randomized, double‐blind trials with insufficient methodological information | ||||||
| Topiramate compared with valproate for juvenile myoclonic epilepsy | ||||||
| Patient or population: people with juvenile myoclonic epilepsy Settings: Cincinnati Children’s Hospital Medical Center, Cincinnati, USA; Haeundae Paik Hospital, Busan, Republic of Korea Intervention: topiramate Comparison: valproate | ||||||
| Outcomes | Illustrative comparative risks* (95% CI) | Relative effect | No of Participants | Quality of the evidence | Comments | |
| Assumed risk | Corresponding risk | |||||
| Valproate | Topiramate | |||||
| Proportion of responders (at least 50% seizure frequency reduction in myoclonic seizures) | 1000 per 1000 | 857 per 1000 (670 to 1000) | RR 0.88 (0.67 to 1.15) | 28 | ⊕⊝⊝⊝ | No significant difference was found |
| Proportion of responders (at least 50% seizure frequency reduction in PGTCS) | 750 per 1000 | 917 per 1000 (510 to 1000) | RR 1.22 (0.68 to 2.21) | 28 | ⊕⊝⊝⊝ | No significant difference was found |
| Proportion of participants who experienced at least one AE and individual AEs | See comment | See comment | NA | 61 | ⊕⊝⊝⊝ | Number of participants experiencing at least one AE was not reported. In Levisohn 2007 and Park 2013, we found significant differences in the AEs of paraesthesia, weight gain and tremor. Moreover, no significant difference was found in headache, concentration difficulty, fatigue, alopecia, dizziness, weight loss, psychomotor slowing, somnolence, nausea, appetite increase, insomnia, abnormal vision, rash, anorexia, hallucination or diarrhoea. |
| Number of participants who were seizure‐free | 563 per 1000 | 636 per 1000 (343 to 1188) | RR 1.13 (0.61 to 2.11) | 33 | ⊕⊝⊝⊝ | No significant difference was found (P = 0.08) |
| *The basis for the assumed risk was the event rate in the control group. The corresponding risk (and its 95% confidence interval) is based on the assumed risk in the comparison group and the relative effect of the intervention (and its 95% CI). | ||||||
| GRADE Working Group grades of evidence | ||||||
| 1 The included trials were reported as randomized, double‐blind trials with insufficient methodological information | ||||||
| Outcome or subgroup title | No. of studies | No. of participants | Statistical method | Effect size |
| 1 Proportion of responders (at least 50% seizure frequency reduction in PGTCS) Show forest plot | 1 | 22 | Risk Ratio (M‐H, Fixed, 95% CI) | 4.0 [1.08, 14.75] |
| 2 Nausea Show forest plot | 1 | 22 | Risk Ratio (M‐H, Fixed, 95% CI) | 1.67 [0.52, 5.33] |
| 3 Upper respiratory tract infection Show forest plot | 1 | 22 | Risk Ratio (M‐H, Fixed, 95% CI) | 1.5 [0.31, 7.30] |
| 4 Abnormal vision Show forest plot | 1 | 22 | Risk Ratio (M‐H, Fixed, 95% CI) | 2.0 [0.21, 18.98] |
| 5 Diarrhoea Show forest plot | 1 | 22 | Risk Ratio (M‐H, Fixed, 95% CI) | 2.0 [0.21, 18.98] |
| Outcome or subgroup title | No. of studies | No. of participants | Statistical method | Effect size |
| 1 Proportion of responders (at least 50% seizure frequency reduction in myoclonic seizures) Show forest plot | 1 | 23 | Risk Ratio (M‐H, Fixed, 95% CI) | 0.88 [0.67, 1.15] |
| 2 Proportion of responders (at least 50% seizure frequency reduction in PGTCS) Show forest plot | 1 | 16 | Risk Ratio (M‐H, Fixed, 95% CI) | 1.22 [0.68, 2.21] |
| 3 Number of participants with seizure‐free Show forest plot | 1 | 27 | Risk Ratio (M‐H, Fixed, 95% CI) | 1.13 [0.61, 2.11] |
| 4 Paraesthesia Show forest plot | 2 | 61 | Risk Difference (M‐H, Fixed, 95% CI) | 0.19 [0.02, 0.35] |
| 5 Weight gain Show forest plot | 2 | 61 | Risk Difference (M‐H, Fixed, 95% CI) | ‐0.30 [‐0.49, ‐0.10] |
| 6 Tremor Show forest plot | 1 | 33 | Risk Difference (M‐H, Fixed, 95% CI) | ‐0.24 [‐0.45, ‐0.02] |
| 7 Headache Show forest plot | 1 | 28 | Risk Ratio (M‐H, Fixed, 95% CI) | 2.37 [0.32, 17.42] |
| 8 Concentration difficulty Show forest plot | 1 | 28 | Risk Ratio (M‐H, Fixed, 95% CI) | 1.42 [0.17, 11.83] |
| 9 Fatigue Show forest plot | 2 | 61 | Risk Ratio (M‐H, Fixed, 95% CI) | 0.62 [0.17, 2.21] |
| 10 Alopecia Show forest plot | 2 | 61 | Risk Ratio (M‐H, Fixed, 95% CI) | 0.24 [0.06, 1.02] |
| 11 Dizziness Show forest plot | 1 | 28 | Risk Ratio (M‐H, Fixed, 95% CI) | 0.95 [0.10, 9.13] |
| 12 Weight loss Show forest plot | 1 | 28 | Risk Difference (M‐H, Fixed, 95% CI) | 0.11 [‐0.09, 0.30] |
| 13 Psychomotor slowing Show forest plot | 1 | 28 | Risk Difference (M‐H, Fixed, 95% CI) | 0.11 [‐0.09, 0.30] |
| 14 Somnolence Show forest plot | 2 | 61 | Risk Difference (M‐H, Fixed, 95% CI) | 0.08 [‐0.05, 0.21] |
| 15 Nausea Show forest plot | 2 | 61 | Risk Ratio (M‐H, Fixed, 95% CI) | 0.21 [0.04, 1.18] |
| 16 Appetite increase Show forest plot | 1 | 28 | Risk Difference (M‐H, Fixed, 95% CI) | ‐0.22 [‐0.50, 0.05] |
| 17 Insomnia Show forest plot | 1 | 28 | Risk Difference (M‐H, Fixed, 95% CI) | ‐0.22 [‐0.50, 0.05] |
| 18 Abnormal vision Show forest plot | 1 | 28 | Risk Difference (M‐H, Fixed, 95% CI) | ‐0.22 [‐0.50, 0.05] |
| 19 Rash Show forest plot | 1 | 28 | Risk Difference (M‐H, Fixed, 95% CI) | ‐0.22 [‐0.50, 0.05] |
| 20 Anorexia Show forest plot | 1 | 33 | Risk Ratio (M‐H, Fixed, 95% CI) | 3.19 [0.37, 27.58] |
| 21 Hallucination Show forest plot | 1 | 33 | Risk Difference (M‐H, Fixed, 95% CI) | 0.06 [‐0.09, 0.22] |
| 22 Diarrhoea Show forest plot | 1 | 33 | Risk Difference (M‐H, Fixed, 95% CI) | ‐0.12 [‐0.30, 0.06] |