Cirugía para el dedo en gatillo
Resumen
Antecedentes
El dedo en gatillo es un trastorno clínico común, caracterizado por dolor y atrapamiento cuando el paciente flexiona y extiende los dedos debido a la desproporción entre el diámetro de los tendones flexores y la polea A1. El abordaje terapéutico puede incluir tratamientos no quirúrgicos o quirúrgicos. En la actualidad no hay ningún consenso acerca del mejor abordaje de tratamiento quirúrgico (enfoque abierto, percutáneo o endoscópico).
Objetivos
Evaluar la efectividad y la seguridad de diferentes métodos de tratamiento quirúrgico para el dedo en gatillo (enfoques abiertos, percutáneos o endoscópicos) en adultos en cualquier estadio de la enfermedad.
Métodos de búsqueda
Se hicieron búsquedas en CENTRAL, MEDLINE, Embase y LILACS hasta agosto 2017.
Criterios de selección
Se incluyeron ensayos controlados aleatorios o cuasialeatorios que evaluaban a adultos con dedo en gatillo y que comparaban cualquier tipo de tratamiento quirúrgico entre sí o con cualquier otra intervención no quirúrgica. Los resultados principales fueron la resolución del dedo en gatillo, el dolor, la función de la mano, el éxito del tratamiento o la satisfacción informados por el participante, la recurrencia de la afección, los eventos adversos y la lesión neurovascular.
Obtención y análisis de los datos
Dos autores de la revisión, de forma independiente, seleccionaron los informes de los ensayos, extrajeron los datos y evaluaron el riesgo de sesgo. Las medidas del efecto del tratamiento para los resultados dicotómicos calcularon los cocientes de riesgos (CR), y las diferencias de medias (DM) o las diferencias de medias estandarizadas (DME) para los resultados continuos, con intervalos de confianza (IC) del 95%. De ser posible, los datos se agruparon en el metanálisis mediante el modelo de efectos aleatorios. GRADE se utilizó para evaluar la calidad de la evidencia para cada resultado.
Resultados principales
Se incluyeron catorce ensayos, lo cual dio lugar a un total de 1260 participantes, con 1361 dedos en gatillo. La edad de los participantes incluidos en los estudios varió de 16 a 88 años; y la mayoría de los participantes eran mujeres (aproximadamente 70%). La duración promedio de los síntomas varió de tres a 15 meses, y el seguimiento después del procedimiento varió desde ocho semanas a 23 meses.
Los estudios informaron nueve tipos de comparaciones: cirugía abierta versus inyecciones de corticosteroides (dos estudios); cirugía percutánea versus inyección de corticosteroides (cinco estudios); cirugía abierta versus inyección de corticosteroides más inyección de ácido hialurónico guiada por ecografía (un estudio); cirugía percutánea más inyección de corticosteroides versus inyección de corticosteroides (un estudio); cirugía percutánea versus cirugía abierta (cinco estudios); cirugía endoscópica versus cirugía abierta (un estudio); y tres comparaciones de los tipos de incisión para la cirugía abierta (incisión transversal de la piel en el pliegue palmar distal, incisión transversal de la piel alrededor de 2–3 mm de forma distal del pliegue palmar distal, e incisión longitudinal de la piel) (un estudio).
La mayoría de los estudios tuvieron fallas metodológicas significativas y se consideraron en riesgo alto o poco claro de sesgo de selección, sesgo de realización, sesgo de detección y sesgo de informe. La comparación primaria fue la cirugía abierta versus inyecciones de corticosteroides, debido a que la cirugía abierta es el método de tratamiento más antiguo y más ampliamente utilizado y considerado como cirugía estándar, mientras que la inyección de corticosteroides es el método de tratamiento de control menos invasivo según lo informado en los estudios de esta revisión y a menudo se usa como tratamiento de primera línea en la práctica clínica.
En comparación con la inyección de corticosteroides, hubo evidencia de baja calidad de que la cirugía abierta proporciona beneficios en lo que se refiere a la menor recurrencia de la afección, aunque tiene la desventaja de ser más dolorosa. La evidencia se disminuyó debido a las fallas en el diseño del estudio y la imprecisión.
Basado en dos ensayos (270 participantes) desde seis hasta 12 meses, 50/130 (o 385 por 1000) individuos presentaron la recurrencia del dedo en gatillo en el grupo de inyección de corticosteroides en comparación con 8/140 (o 65 por 1000; rango 35 a 127) en el grupo de cirugía abierta, CR 0,17 (IC del 95%: 0,09 a 0,33), para una diferencia de riesgos absoluta de que 29% pacientes menos presentaron la recurrencia de los síntomas con la cirugía abierta (60% individuos menos a 3% más); el cambio relativo se traduce en una mejoría del 83% en el grupo de cirugía abierta (67% a 91% mejor).
A la semana, 9/49 pacientes (184 por 1000) presentaron dolor en la palma de la mano en el grupo de inyección de corticosteroides en comparación con 38/56 (o 678 por 1000; con una variación de 366 a 1000) en el grupo de cirugía abierta, CR 3,69 (IC del 95%: 1,99 a 6,85), para una diferencia de riesgos absoluta de que un 49% más presentó dolor con la cirugía abierta (33% a 66% más); el cambio relativo se traduce en un empeoramiento del 269% (585% a 99% peor) (un ensayo, 105 participantes).
Debido a la evidencia de calidad muy baja de dos ensayos no existe seguridad sobre si la cirugía abierta mejora la resolución del dedo en gatillo a los seis a 12 meses de seguimiento, en comparación con la inyección de corticosteroides (131/140 observado en el grupo de cirugía abierta en comparación con 80/130 en el grupo de control; CR 1,48; IC del 95%: 0,79 a 2,76); la evidencia se disminuyó debido a las fallas en el diseño de estudio, la inconsistencia y la imprecisión. Debido a la evidencia de baja calidad de dos ensayos y las tasas de eventos reducidas (270 participantes) del seguimiento de seis hasta 12 meses, no existe seguridad en cuanto a si la cirugía abierta aumentó el riesgo de eventos adversos (incidencia de infección, lesión del tendón, erupciones, malestar en la piel y necrosis grasa) (18/140 observado en el grupo de cirugía abierta en comparación con 17/130 en el grupo de control; CR 1,02; IC del 95%: 0,57 a 1,84) y de lesión neurovascular (9/140 observado en el grupo de cirugía abierta en comparación con 4/130 en el grupo de control; CR 2,17; IC del 95%: 0,7 a 6,77). Doce participantes (8 versus 4) no completaron el seguimiento, y se consideró que no tuvieron un resultado positivo en el análisis de datos. No existe seguridad sobre si la cirugía abierta fue más efectiva que la inyección de corticosteroides en la mejoría de la función de la mano o la satisfacción del participante debido a que los estudios no informaron estos resultados.
Conclusiones de los autores
La evidencia de baja calidad indica que, en comparación con la inyección de corticosteroides, el tratamiento quirúrgico abierto en los pacientes con dedo en gatillo, puede dar lugar a una tasa de recurrencia menor desde seis hasta 12 meses luego del tratamiento, aunque aumenta la incidencia del dolor durante la primera semana de seguimiento. No existe seguridad acerca del efecto de la cirugía abierta con respecto a la tasa de resolución a los seis a 12 meses de seguimiento, en comparación con las inyecciones de corticosteroides, debido a la heterogeneidad alta y a los eventos escasos que ocurrieron en los ensayos; tampoco existe seguridad acerca del riesgo de eventos adversos y la lesión neurovascular debido a que ocurrieron pocos eventos en los estudios. No se informó la función de la mano ni la satisfacción del participante.
PICOs
Resumen en términos sencillos
Cirugía para el dedo en gatillo
Antecedentes
El dedo en gatillo se caracteriza clínicamente por dolor y una posición de atrapamiento durante los movimientos de los dedos. Clásicamente, el tratamiento inicial es no quirúrgico e incluye fármacos antiinflamatorios no esteroides, entablillado e inyección de corticosteroides, y puede requerir tratamiento quirúrgico si se observa el fracaso del tratamiento convencional. Aunque es un trastorno común, no hay ningún consenso acerca del mejor abordaje de tratamiento quirúrgico (a través de una incisión en la piel y la visión directa de las estructuras de la mano [abierto]; enfoques vía una aguja o bisturí introducido a través de la piel, sin visión directa de las estructuras de la mano [percutáneo]; o vía un tubo flexible con una cámara ligera adherida al mismo (endoscópico).
Características de los estudios
Esta revisión Cochrane está actualizada hasta agosto 2017. Se incluyeron 14 ensayos controlados aleatorios que incluían a 1260 participantes, lo cual dio lugar a un total de 1361 dedos en gatillo. Dos estudios compararon la cirugía abierta versus inyecciones de corticosteroides, cinco estudios compararon la cirugía percutánea versus inyección de corticosteroides, un estudio comparó la cirugía abierta versus inyección de corticosteroides más inyección de ácido hialurónico, un estudio comparó la cirugía percutánea más inyección de corticosteroides versus inyección de corticosteroides, cinco estudios compararon la cirugía percutánea versus cirugía abierta, un estudio comparó la cirugía endoscópica versus cirugía abierta y un estudio comparó tres tipos de incisión en la piel versus cirugía abierta. La mayoría de los participantes fueron mujeres (alrededor del 70%); tenían entre 16 y 88 años; y el seguimiento medio de los participantes después del procedimiento fue de ocho semanas a 23 meses. Debido a las limitaciones relacionadas con el espacio, el informe de todos los resultados estuvo limitado a la comparación principal — cirugía abierta versus inyección de corticosteroides — debido a que la cirugía abierta es el método de tratamiento más antiguo y más ampliamente usado y considerado como una cirugía estándar, mientras que la inyección de corticosteroides es el método de tratamiento de control menos invasivo según lo informado en los estudios de esta revisión y a menudo se usa como tratamiento de primera línea en la práctica clínica.
Resultados clave
Basado en dos ensayos (270 participantes), comparado con el procedimiento de inyección de corticosteroides:
Resolución del dedo en gatillo (reducción de los síntomas sin recurrencia):
• 92 de cada 100 pacientes presentaron la resolución de los síntomas con la cirugía abierta.
• 61 de cada 100 pacientes presentaron la resolución de los síntomas con la inyección de corticosteroides.
La incidencia del dolor, evaluado como la presencia o la ausencia de dolor después de realizar el procedimiento (a la semana):
• 49% pacientes más presentaron dolor con la cirugía abierta (33% a 66% más).
• 68 de cada 100 pacientes presentaron dolor con la cirugía abierta.
• 19 de cada 100 pacientes presentaron dolor con la inyección de corticosteroides.
Recurrencia del dedo en gatillo (de seis a 12 meses):
• 29% pacientes menos presentaron la recurrencia de los síntomas con la cirugía abierta (60% menos a 3% más).
• 7 de cada 100 pacientes presentaron la recurrencia de los síntomas con la cirugía abierta.
• 39 de cada 100 pacientes presentaron la recurrencia de los síntomas con la inyección de corticosteroides.
Eventos adversos:
Los eventos adversos incluidas las infecciones, las lesiones del tendón, el malestar en la piel, las erupciones o la necrosis grasa en el sitio del procedimiento, o los eventos neovasculares fueron poco comunes en cualquiera de los grupos de tratamiento.
Ningún estudio informó la función de la mano ni el éxito del tratamiento o la satisfacción informados por el participante.
Calidad de la evidencia
La evidencia de calidad muy baja proveniente de dos ensayos significa que no existe seguridad sobre si la cirugía abierta mejora la resolución del dedo en gatillo en comparación con la inyección de corticosteroides, debido al riesgo de sesgo en el diseño de los estudios, las inconsistencias entre los estudios y el número pequeño de participantes en los estudios. La evidencia de baja calidad proveniente de dos ensayos indica que la cirugía abierta puede dar lugar a menos recurrencias del dedo en gatillo en comparación con el procedimiento de inyección de corticosteroides, aunque aumenta la incidencia del dolor durante la primera semana después del procedimiento. La evidencia se disminuyó a “baja” debido al riesgo de sesgo en el diseño y el número pequeño de participantes. Ningún estudio midió la mejoría funcional ni la satisfacción del participante en la comparación entre la cirugía abierta y la inyección de corticosteroides. No existe seguridad sobre si hay una diferencia en el riesgo de eventos adversos o la lesión neurovascular entre los tratamientos, debido a que ocurrieron pocos eventos en los estudios.
Sólo se encontró evidencia de calidad baja y muy baja para otras comparaciones por lo cual no existe seguridad sobre si la cirugía percutánea posee beneficios sobre la inyección de corticosteroides, o si la cirugía abierta es mejor que los corticosteroides más ácido hialurónico, o si un tipo de cirugía es mejor que otra.
Authors' conclusions
Summary of findings
| Open surgery versus steroid injection for treating trigger finger | ||||||
| Patient or population: patients with trigger finger | ||||||
| Outcomes | Illustrative comparative risks* (95% CI) | Relative effect | No of Participants | Quality of the evidence | Comments | |
| Assumed risk | Corresponding risk | |||||
| Steroid injection | Open surgery | |||||
| Resolution of symptoms (after one or more injections) Follow‐up: 6 to 12 months | 615 per 1000 | 911 per 1000 | RR 1.48 | 270 | ⊕⊝⊝⊝ LOW 1,2,3 | Absolute difference: 28% more had resolution of symptoms with open surgery (2% fewer to 58% more); relative change: 48% more (21% fewer to 176% more). The NNTH n/a4. |
| Pain Proportion with pain on the palm of the hand Follow‐up: 1 week | 184 per 1000 | 678 per 1000 | RR 3.69 | 105 | ⊕⊕⊝⊝ | Absolute risk difference: 49% more people had pain with surgery (33% to 66% more), and the relative percent change translates to worsening of 269% (585% to 99% worse). The NNTH was 3 (95% CI 1 to 5). |
| Function Not measured | See comment | See comment | See comment | ‐ | See comment | Not measured in any trial. |
| Participant global assessment of success Not measured | See comment | See comment | See comment | ‐ | See comment | Not measured in any trial. |
| Recurrence Follow‐up: range 6 to 12 months | 385 per 1000 | 65 per 1000 | RR 0.17 | 270 | ⊕⊕⊝⊝ | Absolute risk difference: 29% fewer people had recurrence with open surgery (60% fewer to 3% more), and the relative percent change translates to improvement of 83% (67% to 91% better). NNTB 4 (95% CI 3 to 4). |
| Adverse events (infection, tendon or pulley injury, flare, cutaneous discomfort, fat necrosis) Follow‐up: range 6 to 12 months | 131 per 1000 | 133 per 1000 | RR 1.02 (0.57 to 1.84) | 270 | ⊕⊕⊝⊝ | Absolute risk difference: 0% (3% fewer to 4% more), and the relative percent change translates to worsening of 2% (43% better to 84% worse). The NNTH n/a4. |
| Neurovascular injury Follow‐up: range 6 to 12 months | 31 per 1000 | 67 per 1000 | RR 2.17 (0.7 to 6.77) | 270 | ⊕⊕⊝⊝ | Absolute risk difference: 2% more people had neurovascular injury with open surgery (6% fewer to 11% more); relative change: 117% more (30% fewer to 577% more). The NNTB n/a4. |
| *The basis for the assumed risk (e.g. the median control group risk across studies) is provided in footnotes. The corresponding risk (and its 95% confidence interval) is based on the assumed risk in the comparison group and the relative effect of the intervention (and its 95% CI). | ||||||
| GRADE Working Group grades of evidence | ||||||
| 1The trials had methodological flaws: risk of detection bias. 2Inconsistency: heterogeneity was high. 3Imprecision: the total number of events was small, or the 95% confidence interval includes both open surgery and steroid injection groups, or the 95% confidence interval includes both no clinical effect, and "appreciable benefit" in favour of the open surgery group. 4Number needed to treat to benefit (NNTB), or harm (NNTH) not applicable (n/a) when result is not statistically significant. NNT for dichotomous outcomes calculated using Cates NNT calculator (http://www.nntonline.net/visualrx/). NNT for continuous outcomes calculated using Wells Calculator (CMSG editorial office). | ||||||
| Percutaneous surgery versus steroid injection for treating trigger finger | ||||||
| Patient or population: patients with trigger finger | ||||||
| Outcomes | Illustrative comparative risks* (95% CI) | Relative effect | No of Participants | Quality of the evidence | Comments | |
| Assumed risk | Corresponding risk | |||||
| Steroid injection | Percutaneous surgery | |||||
| Resolution of symptoms (after 1 or more injections) Follow‐up: range 6 to 12 months | 545 per 1000 | 1000 per 1000 | RR 2.11 | 191 | ⊕⊝⊝⊝ | Absolute difference: 42% more had resolution of symptoms with percutaneous surgery (15% fewer to 98% more); relative change: 111% more (69% fewer to 1351% more) NNTB n/a4 |
| Pain (Visual analogue scale: Follow‐up: 1 month | The mean pain in the control group was 2.7 | The mean pain in the intervention group was 1.8 lower (5.72 lower to 2.12 higher) | 222 | ⊕⊝⊝⊝ | Absolute reduction: 18% pain reduction with percutaneous surgery (57% reduction to 21% increase), and the relative percent change translates to improvement of 25% (29% worse to 78% better)5. NNTB n/a4 Although a decrease of 1.8 in the VAS score (VAS: 0 to 10 points; where 0 mean no pain and 10 severe pain) may correspond to clinical improvement, there was no statistical difference between the groups and some participants' pain worsened). | |
| Function Not measured | See comment | See comment | ‐ | See comment | Not measured in any trial. | |
| Participant global assessment of success Not measured | See comment | See comment | ‐ | See comment | Not measured in any trial. | |
| Recurrence Follow‐up: range 6 to 12 months | 197 per 1000 | 112 per 1000 | RR 0.57 | 392 | ⊕⊝⊝⊝ | Absolute risk difference: 9% fewer people had recurrence with percutaneous surgery (19% fewer to 2% more), and the relative percent change translates to improvement of 43% (59% worse to 79% better). The NNTB n/a4. |
| Adverse events (infection, partial loss of movement, tendon or −0 injury, dysaesthesia, and skin atrophy or hypopigmentation) Follow‐up: range 6 to 12 months | 89 per 1000 | 140 per 1000 | RR 1.58 | 392 | ⊕⊝⊝⊝ | Absolute risk difference: 3% more people had adverse events with percutaneous surgery (5% fewer to 11% more), and the relative percent change translates to worsening of 58% (9% better to 175% worse). The NNTH n/a4. |
| Neurovascular injury Follow‐up: range 6 to 12 months | 30 per 1000 | 11 per 1000 (1 to 100) | RR 0.35 | 191 | ⊕⊕⊝⊝ | Absolute difference: fewer than 1% had neurovascular injury with percutaneous surgery (5% fewer to 3% more); relative change: 65% fewer (229% fewer to 96% more). The NNTB n/a4. |
| *The basis for the assumed risk (e.g. the median control group risk across studies) is provided in footnotes. The corresponding risk (and its 95% confidence interval) is based on the assumed risk in the comparison group and the relative effect of the intervention (and its 95% CI). | ||||||
| GRADE Working Group grades of evidence | ||||||
| 1The two trials had methodological flaws; they did not blind the outcome assessor, and they had selective reporting or unclear risk for incomplete outcome data. 2Inconsistency: heterogeneity was high. 3Imprecision: the total number of events was small, or the 95% confidence interval includes both percutaneous surgery and steroid injection groups, or the 95% confidence interval includes both no clinical effect, and "appreciable benefit" in favour of the steroid injection group. 4Number needed to treat for an additional beneficial outcome (NNTB), or for an additional harmful outcome (NNTH) not applicable (n/a) when result is not statistically significant. NNT for dichotomous outcomes calculated using Cates NNT calculator (www.nntonline.net/visualrx/). NNT for continuous outcomes calculated using Wells Calculator (CMSG editorial office). 5Basis for assumed risk was the mean baseline risk from the studies in the meta‐analysis. 6The five trials had methodological flaws; two were quasi‐randomised; four did not blind the outcome assessor and three had unclear risk for incomplete outcome data (one trial had follow‐up loss 17%, but 'intention to treat analysis' was not done; two trials did not report the follow‐up loss); four trials had selective reporting. We opted by double downgrade. | ||||||
| Open surgery versus steroid injection plus hyaluronic acid injection guided by ultrasound for treating trigger finger | ||||||
| Patient or population: patients with trigger finger | ||||||
| Outcomes | Illustrative comparative risks* (95% CI) | Relative effect | No of Participants | Quality of the evidence | Comments | |
| Assumed risk | Corresponding risk | |||||
| Steroid injection plus hyaluronic acid injection guided by ultrasound | Open surgery | |||||
| Resolution of symptoms Follow up: 12 months | 733 per 1000 | 990 per 1000 | RR 1.35 | 30 | ⊕⊝⊝⊝ | Absolute difference: 27% more had resolution of symptoms with open surgery (3% to 50% more); relative change: 35% more (2% fewer to 85% more). The NNTB n/a3. |
| Pain (short‐term) Not measured | See comment | See comment | ‐ | See comment | Pain in 6‐month follow‐up was assessed by visual analogue scale (VAS: 0 to 10 points; where 0 means no pain and 10 severe pain), but the authors failed to report any measurement of variance: standard deviation, standard errors, P values, or confidence intervals. The VAS score was 1 point (range 0 to 2) in open surgery group, and 1 point (range 0 to 3) in steroid plus hyaluronic acid injection group. This is not clinically significant. | |
| Function Not measured | See comment | See comment | ‐ | See comment | Functional status of the hand in follow‐up of 6 months was assessed by DASH score, but the authors failed to report any measurement of variance. The DASH score was 11% (range 7 to 16) in open surgery group and 13% (range 7 to 20) in steroid plus hyaluronic acid injection group; it translates to absolute improvement of 2% (DASH score: 0 to 100%; where 0 means no disability and 100 the most severe disability) in the open surgery group. This is not a clinically significant difference. | |
| Participant global assessment of success Not measured | See comment | See comment | ‐ | See comment | Patient satisfaction in follow‐up was at 6 months assessed by satisfaction visual analogue scale (SVAS: 0 to 10 points; where 0 means totally unsatisfied and 10 completely satisfied), but the authors failed to report any measurement of variance: standard deviation, standard errors, P values, or confidence intervals. The SVAS score was 7.8 points (3 to 10 range) in the open surgery group, and 7.4 points (2 to 10 range) in steroid plus hyaluronic acid injection group; it translates to absolute improvement of 0.4 point in the open surgery group. This is not a clinically significant difference. | |
| Recurrence Follow‐up: 12 months | 200 per 1000 | 28 per 1000 | RR 0.14 | 30 | ⊕⊝⊝⊝ | Absolute risk difference: 20% fewer people had recurrence with open surgery (42% fewer to 2% more), and the relative percent change translates to improvement of 86% (99% worse to 155% better). The NNTB n/a3. |
| Adverse events (partial loss of movement, algodystrophic syndrome) Follow‐up: 12 months | 67 per 1000 | 200 per 1000 | RR 3.00 | 30 | ⊕⊝⊝⊝ | Absolute risk difference: 13% more people had adverse events with open surgery (11% fewer to 37% more), and the relative percent change translates to worsening of 200% (2468% worse to 65% better). The NNTH n/a3. |
| Neurovascular injury Not measured | See comment | See comment | See comment | ‐ | See comment | Not measured in any trial. |
| *The basis for the assumed risk (e.g. the median control group risk across studies) is provided in footnotes. The corresponding risk (and its 95% confidence interval) is based on the assumed risk in the comparison group and the relative effect of the intervention (and its 95% CI). | ||||||
| GRADE Working Group grades of evidence | ||||||
| 1The trial had methodological flaws; it did not describe how random sequence generation was created and whether allocation concealment was done; the outcome assessor was not blinded, and it had selective reporting. We opted by double downgrade. 2Imprecision: the total number of events was small, or the 95% confidence interval includes both no clinical effect, and "appreciable benefit" in favour of the open surgery group, or the 95% confidence interval includes both open surgery and steroid injection plus hyaluronic acid injection groups. 3Number needed to treat for an additional beneficial outcome (NNTB), or for an additional harmful outcome (NNTH) not applicable (n/a) when result is not statistically significant. NNT for dichotomous outcomes calculated using Cates NNT calculator (www.nntonline.net/visualrx/). NNT for continuous outcomes calculated using Wells Calculator (CMSG editorial office). | ||||||
| Percutaneous surgery plus steroid injection versus steroid injection for treating trigger finger | ||||||
| Patient or population: patients with trigger finger | ||||||
| Outcomes | Illustrative comparative risks* (95% CI) | Relative effect | No of Participants | Quality of the evidence | Comments | |
| Assumed risk | Corresponding risk | |||||
| Steroid injection | Percutaneous surgery plus steroid injection | |||||
| Resolution of symptoms (after 1 or more injections) Follow up: range 6 to 42 months | 590 per 1000 | 891 per 1000 | RR 1.51 | 127 | ⊕⊝⊝⊝ | Absolute difference: 30% more had resolution of symptoms with percutaneous surgery plus steroid injection (16% to 45% more); relative change: 51% more (21% to 90% more). NNTB 4 (95% CI 3 to 6). |
| Pain (short‐term) Not measured | See comment | See comment | See comment | ‐ | See comment | Pain in follow‐up of 2 weeks was assessed by visual analogue scale (VAS: 0 to 10 points; where 0 means no pain and 10 severe pain), but the authors failed to report any measurement of variance: standard deviation, standard errors, P values, or confidence intervals. The VAS score was 0.4 point in percutaneous surgery plus steroid injection group, and 0.3 point in steroid injection group; it translates to absolute worsening of 0.1 point in the percutaneous surgery plus steroid injection group. This is not a clinically significant difference. |
| Function Not measured | See comment | See comment | See comment | ‐ | See comment | Not measured in any trial. |
| Participant global assessment of success Not measured | See comment | See comment | See comment | ‐ | See comment | Not measured in any trial. |
| Recurrence Not measured | See comment | See comment | See comment | ‐ | See comment | Not measured in any trial. |
| Adverse events (infection, partial loss of movement) Follow‐up: range 6 to 42 months | 33 per 1000 | 30 per 1000 | RR 0.92 | 127 (1 RCT) | ⊕⊝⊝⊝ | Absolute risk difference: 0% (6% fewer to 6% more); relative percentage change: 8% fewer (536% fewer to 87% more). The NNTB n/a3. |
| Neurovascular injury Follow‐up: range 6 to 42 months | 16 per 1000 | 15 per 1000 | RR 0.92 | 127 | ⊕⊝⊝⊝ | Absolute risk difference: 0% (4% fewer to 4% more); relative percentage change: 8% fewer (1346% fewer to 94% more). The NNTB n/a3. |
| *The basis for the assumed risk (e.g. the median control group risk across studies) is provided in footnotes. The corresponding risk (and its 95% confidence interval) is based on the assumed risk in the comparison group and the relative effect of the intervention (and its 95% CI). | ||||||
| GRADE Working Group grades of evidence | ||||||
| 1The trial had methodological flaws; it did not describe how random sequence generation was created and whether allocation concealment was done; the outcome assessor was not blinded and it had selective reporting. We opted by double downgrade. 2Imprecision: the total number of events was small, or the 95% confidence interval includes both percutaneous surgery plus steroid injection, and steroid injection groups. 3Number needed to treat to benefit (NNTB), or harm (NNTH) not applicable (n/a) when result is not statistically significant. NNT for dichotomous outcomes calculated using Cates NNT calculator (http://www.nntonline.net/visualrx/). NNT for continuous outcomes calculated using Wells Calculator (CMSG editorial office). | ||||||
| Percutaneous surgery versus open surgery for treating trigger finger | ||||||
| Patient or population: patients with trigger finger | ||||||
| Outcomes | Illustrative comparative risks* (95% CI) | Relative effect | No of Participants | Quality of the evidence | Comments | |
| Assumed risk | Corresponding risk | |||||
| Open surgery | Percutaneous surgery | |||||
| Resolution of symptoms Follow‐up: range 2 to 6 months | 995 per 1000 | 995 per 1000 | RR 1.00 | 429 | ⊕⊕⊝⊝ | Absolute risk difference: 0% (3% fewer to 2% more); relative percentage change: 0% (3% fewer to 2% more). NNTB n/a2. |
| Pain (1 to 6 scale) Follow‐up: 1 week | The mean pain short term (1 to 6 scale) in the control group was 2.5 | The mean pain short term (1 to 6 scale) in the intervention group was 0.3 higher (0.34 lower to 0.94 higher) | ‐ | 36 | ⊕⊝⊝⊝ | Absolute risk difference: 6% increase in pain with percutaneous surgery (7% reduction to 19% increase), and the relative percent change translates to worsening of 7% (22% worse to 8% better)5. NNTH n/a2. The difference of 0.3 points in the pain score (pain score: 1 to 6 points; where 1 means no pain and 6 extreme pain) is not clinically significant. |
| Function Not measured | See comment | See comment | See comment | ‐ | See comment | Not measured in any trial. |
| Participant global assessment of success Not measured | See comment | See comment | See comment | ‐ | See comment | Not measured in any trial. |
| Recurrence Follow‐up: range 2 to 6 months | 5 per 1000 | 1 per 1000 | RR 0.28 | 397 | ⊕⊕⊝⊝ | Absolute risk difference: 0% (2% fewer to 2% more); relative percentage change: 72% fewer (583% fewer to 99% more). The NNTB n/a2. |
| Adverse events (infection, partial loss of movement, tendon or pulley injury, oedema or inflammation or hematoma, adherence) Follow‐up: range 2 to 6 months | 14 per 1000 | 11 per 1000 | RR 0.80 | 429 | ⊕⊝⊝⊝ | Absolute risk difference: 0% (2% fewer to 2% more); relative percentage change: 20% fewer (268% fewer to 83% more). The NNTB n/a2. |
| Neurovascular injury Follow‐up: range 2 to 6 months | 0 per 1000 | 0 per 1000 | Could not be estimated | 397 | ⊕⊝⊝⊝ | There was no injury in both groups. |
| *The basis for the assumed risk (e.g. the median control group risk across studies) is provided in footnotes. The corresponding risk (and its 95% confidence interval) is based on the assumed risk in the comparison group and the relative effect of the intervention (and its 95% CI). | ||||||
| GRADE Working Group grades of evidence | ||||||
| 1All five trials had methodological flaws; one was quasi‐randomised; three had adequate concealed treatment allocation, and one did not describe how this allocation concealment was done; the subjective outcomes assessor was blinded in one, and no trial blinded the objective outcomes assessor; selective reporting was observed in three trials. We choe to double downgrade. 2Number needed to treat to benefit (NNTB), or harm (NNTH) not applicable (n/a) when result is not statistically significant. NNT for dichotomous outcomes calculated using Cates NNT calculator (www.nntonline.net/visualrx/). NNT for continuous outcomes calculated using Wells Calculator (CMSG editorial office). 3This quasi‐randomised trial had bias in the random sequence generation and allocation concealment; the outcome assessor was not blinded, and it had selective reporting. We opted by double downgrade. 4Imprecision: the total number of events was small, or the 95% confidence interval includes both no clinical effect and "appreciable benefit" in favour of the open surgery group, or the 95% confidence interval includes both percutaneous and open surgery. 5Basis for assumed risk was the mean baseline risk from the study in the meta‐analysis. 6 The four trials had methodological flaws; one was quasi‐randomised; only two had adequate concealed treatment allocation, and one did not describe how this allocation concealment was done; the outcome assessor was not blinded and three had selective reporting in the trial. We opted by double downgrade. | ||||||
| Endoscopic surgery versus open surgery for treating trigger finger | ||||||
| Patient or population: patients with trigger finger | ||||||
| Outcomes | Illustrative comparative risks* (95% CI) | Relative effect | No of Participants | Quality of the evidence | Comments | |
| Assumed risk | Corresponding risk | |||||
| Open surgery | Endoscopic surgery | |||||
| Resolution of symptoms Follow‐up: 3 months | 1000 per 1000 | 1000 per 1000 | RR 1.00 | 231 | ⊕⊝⊝⊝ | Absolute risk difference: 0% (2% fewer to 2% more); relative percentage change: 0% (2% fewer to 2% more).The NNTB n/a3. |
| Pain (short‐term) Not measured | See comment | See comment | See comment | ‐ | See comment | Not measured in any trial. |
| Function Not measured | See comment | See comment | See comment | ‐ | See comment | Not measured in any trial. |
| Participant global assessment of success Not measured | See comment | See comment | See comment | ‐ | See comment | Not measured in any trial. |
| Recurrence Not measured | See comment | See comment | See comment | ‐ | See comment | Not measured in any trial. |
| Adverse events (infection, dysaesthesia) Follow‐up: 3 months | 26 per 1000 | 70 per 1000 | RR 2.74 | 231 | ⊕⊝⊝⊝ | Absolute risk difference: 4% more people had adverse events with endoscopic surgery (1% fewer to 10% more), and the relative percent change translates to worsening of 174% (906% worse to 26% better). The NNTH n/a3. |
| Neurovascular injury Follow‐up: 3 months | 0 per 1000 | 0 per 1000 | RR 3.08 | 231 | ⊕⊝⊝⊝ | Absolute difference: 1% more had neurovascular injury with endoscopic surgery (2% fewer to 3% more); relative change: 208% more (87% fewer to 7379% more). The NNTH n/a3. |
| *The basis for the assumed risk (e.g. the median control group risk across studies) is provided in footnotes. The corresponding risk (and its 95% confidence interval) is based on the assumed risk in the comparison group and the relative effect of the intervention (and its 95% CI). | ||||||
| GRADE Working Group grades of evidence | ||||||
| 1The trial had methodological flaws; the authors did not describe how randomisation sequence was created and whether allocation concealment was done; the outcome assessor was not blinded and the trial had selective reporting. We chose to double downgrade. 2Imprecision: the total number of events was small, or the 95% confidence interval includes both open surgery and endoscopic surgery groups. 3Number needed to treat for an additional beneficial outcome (NNTB), or for an additional harmful outcome (NNTH) not applicable (n/a) when result is not statistically significant. NNT for dichotomous outcomes calculated using Cates NNT calculator (www.nntonline.net/visualrx/). NNT for continuous outcomes calculated using Wells Calculator (CMSG editorial office). | ||||||
| Open surgery by transverse incision of the skin about 2–3 mm distally from distal palmar crease compared to open surgery by longitudinal incision of the skin for trigger finger | ||||||
| Patient or population: patients with trigger finger | ||||||
| Outcomes | Illustrative comparative risks* (95% CI) | Relative effect | № of participants | Quality of the evidence | Comments | |
| Assumed risk | Corresponding risk | |||||
| Open surgery by longitudinal incision of the skin | Open surgery by transverse incision of the skin about 2–3 mm distally from distal palmar crease | |||||
| Resolution of symptoms Not measured | See comment | See comment | ‐ | See comment | Not measured in any trial. | |
| Pain (short‐term) Not measured | See comment | See comment | ‐ | See comment | Not measured in any trial. | |
| Function (DASH score: 0 to 100 points) Follow‐up: 12 months | The mean DASH score in the control group was 15.3 | The mean DASH score in the intervention group was 8.9 lower (23.35 lower to 5.55 higher) | ‐ | 21 | ⊕⊝⊝⊝ | Absolute risk difference: 8.9% increase in hand function with open surgery by transverse incision of the skin about 2–3 mm distally from the distal palmar crease (23.35% increase to 5.55% reduction), and the relative percentage change translates to improvement of 21.7% (13.54% worse to 56.95% better)3. NNTH n/a4. The difference of 8.9 points in the DASH score (DASH: 0 to 100 points; where 0 means no disability and 100 means the most severe disability) is not clinically significant. |
| Participant global assessment of success Not measured | See comment | See comment | ‐ | See comment | Not measured in any trial. | |
| Recurrence Not measured | See comment | See comment | ‐ | See comment | Not measured in any trial. | |
| Adverse events Not measured | See comment | See comment | ‐ | See comment | Not measured in any trial. | |
| Neurovascular injury Not measured | See comment | See comment | ‐ | See comment | Not measured in any trial. | |
| *The risk in the intervention group (and its 95% confidence interval) is based on the assumed risk in the comparison group and the relative effect of the intervention (and its 95% CI). | ||||||
| GRADE Working Group grades of evidence | ||||||
| 1 The trial had methodological flaws; the authors did not describe how randomisation sequence was created and whether allocation concealment was done; the outcome assessor was not blinded and the trial had selective reporting. We opted by double downgrade. 2 Imprecision: the total number of events was small, or the 95% confidence interval includes both groups (transverse incision of the skin about 2–3 mm distally from distal palmar crease and longitudinal incision of the skin). 3Basis for assumed risk was the mean baseline risk from the study in the meta‐analysis. 4Number needed to treat to benefit (NNTB), or harm (NNTH) not applicable (n/a) when result is not statistically significant. NNT for dichotomous outcomes calculated using Cates NNT calculator (www.nntonline.net/visualrx/). NNT for continuous outcomes calculated using Wells Calculator (CMSG editorial office). | ||||||
| Open surgery by transverse incision of the skin in the distal palmar crease compared to open surgery by longitudinal incision of the skin for trigger finger | ||||||
| Patient or population: patients with trigger finger | ||||||
| Outcomes | Illustrative comparative risks* (95% CI) | Relative effect | № of participants | Quality of the evidence | Comments | |
| Assumed risk | Corresponding risk | |||||
| Open surgery by longitudinal incision of the skin | Open surgery by transverse incision of the skin in the distal palmar crease | |||||
| Resolution of symptoms Not measured | See comment | See comment | ‐ | See comment | Not measured in any trial. | |
| Pain (short‐term) Not measured | See comment | See comment | ‐ | See comment | Not measured in any trial. | |
| Function (DASH score: 0 to 100 points) Follow‐up: 12 months | The mean DASH score in the control group was 15.3 | The mean DASH score in the intervention group was 3.1 higher (21.28 lower to 27.48 higher) | ‐ | 22 | ⊕⊝⊝⊝ | Absolute reduction: 3.1% function reduction with open surgery by transverse incision of the skin in the distal palmar crease (27.48% reduction to 21.28% increase), and the relative percent change translates to worsening of 7.56% (67.02% worse to 51.9% better)3. NNTB n/a4. The difference of 3.1 points in the DASH score (DASH: 0 to 100 points; where 0 means no disability and 100 means the most severe disability) is not clinically significant. |
| Participant global assessment of success Not measured | See comment | See comment | Not estimable | ‐ | See comment | Not measured in any trial. |
| Recurrence Not measured | See comment | See comment | Not estimable | ‐ | See comment | Not measured in any trial. |
| Adverse events Not measured | See comment | See comment | Not estimable | ‐ | See comment | Not measured in any trial. |
| Neurovascular injury Not measured | See comment | See comment | Not estimable | ‐ | See comment | Not measured in any trial. |
| *The risk in the intervention group (and its 95% confidence interval) is based on the assumed risk in the comparison group and the relative effect of the intervention (and its 95% CI). | ||||||
| GRADE Working Group grades of evidence | ||||||
| 1 The trial had methodological flaws; the authors did not describe how randomisation sequence was created and whether allocation concealment was done; the outcome assessor was not blinded and the trial had selective reporting. We chose to double downgrade. 2 Imprecision: the total number of events was small, or the 95% confidence interval includes both groups (transverse incision of the skin in the distal palmar crease and longitudinal incision of the skin). 3Basis for assumed risk was the mean baseline risk from the study in the meta‐analysis. 4Number needed to treat to benefit (NNTB), or harm (NNTH) not applicable (n/a) when result is not statistically significant. NNT for dichotomous outcomes calculated using Cates NNT calculator (www.nntonline.net/visualrx/). NNT for continuous outcomes calculated using Wells Calculator (CMSG editorial office). | ||||||
| Open surgery by transverse incision of the skin in the distal palmar crease compared to open surgery by transverse incision of the skin about 2–3 mm distally from distal palmar crease for trigger finger | ||||||
| Patient or population: patients with trigger finger | ||||||
| Outcomes | Illustrative comparative risks* (95% CI) | Relative effect | № of participants | Quality of the evidence | Comments | |
| Assumed risk | Corresponding risk | |||||
| Open surgery by transverse incision of the skin about 2–3 mm distally from distal palmar crease | Open surgery by transverse incision of the skin in the distal palmar crease | |||||
| Resolution of symptoms Not measured | See comment | See comment | ‐ | See comment | Not measured in any trial. | |
| Pain (short‐term) Not measured | See comment | See comment | ‐ | See comment | Not measured in any trial. | |
| Function (DASH score: 0 to 100 points) Follow‐up: 12 months | The mean DASH score in the control group was 6.4 | The mean DASH score in the intervention group was 12 higher | ‐ | 21 | ⊕⊝⊝⊝ | Absolute risk difference: 12% decrease in function with open surgery by transverse incision of the skin in the distal palmar crease (32.84% reduction to 8.84% increase), and the relative percentage change translates to worsening of 61.22% (167.55% worse to 45.1% better)3. NNTH n/a4. Although an increase of 12 in the DASH score (DASH: 0 to 100 points; where 0 means no disability and 100 means the most severe disability) may correspond to clinical worsening, there was no statistical difference between the groups and some participants' hand function improved). |
| Participant global assessment of success Not measured | See comment | See comment | ‐ | See comment | Not measured in any trial. | |
| Recurrence Not measured | See comment | See comment | ‐ | See comment | Not measured in any trial. | |
| Adverse events Not measured | See comment | See comment | ‐ | See comment | Not measured in any trial. | |
| Neurovascular injury Not measured | See comment | See comment | ‐ | See comment | Not measured in any trial. | |
| *The risk in the intervention group (and its 95% confidence interval) is based on the assumed risk in the comparison group and the relative effect of the intervention (and its 95% CI). | ||||||
| GRADE Working Group grades of evidence | ||||||
| 1 The trial had methodological flaws; the authors did not describe how randomisation sequence was created and whether allocation concealment was done; the outcome assessor was not blinded and the trial had selective reporting. We chose to double downgrade. 2 Imprecision: the total number of events was small, or the 95% confidence interval includes both groups (transverse incision of the skin in the distal palmar crease and transverse incision of the skin about 2–3 mm distally from distal palmar crease). 3Basis for assumed risk was the mean baseline risk from the study in the meta‐analysis. 4Number needed to treat to benefit (NNTB), or harm (NNTH) not applicable (n/a) when result is not statistically significant. NNT for dichotomous outcomes calculated using Cates NNT calculator (www.nntonline.net/visualrx/). NNT for continuous outcomes calculated using Wells Calculator (CMSG editorial office). | ||||||
Background
Flexor tendons of the hands slide inside osteofibrous tunnels (pulleys) (Akhtar 2005; Doyle 1975; Doyle 1977; Doyle 1988; Doyle 1989; Jones 1988). Trigger finger is a common clinical disorder, characterised by catching or snapping as the patient flexes and extends digits because of a disproportion between the diameter of flexor tendons and the A1 pulley (Akhtar 2005; Eastwood 1992; Sato 2012; Wolfe 2005). The gliding of the flexor tendons can cause adaptive changes that lead to stenosis of the A1 pulley (Sampson 1991). The friction caused in the flexor tendons when passing through the stenotic pulley can change the fibres, forming an intratendinous lump (Hueston 1972). The clinical manifestation may vary from an occasional snapping to finger locked in flexion (Akhtar 2005; Peters‐Veluthamaningal 2009; Quinnell 1980), although sometimes locking in extension, hence an inability to achieve flexion of the affected finger, can also occur (Hueston 1972). The presence of pain is common, ranging from severe to mild discomfort, often in the palm, on the metacarpophalangeal (MCP) joint or on the proximal interphalangeal (PIP) joint (Eastwood 1992; Ryzewicz 2006).
Description of the condition
Trigger finger has an incidence of about 2.6% in the general population (Strom 1977). It is one of the most common causes of pain and disability in the hand (Akhtar 2005; Wolfe 2005). It is four to six times more frequent in women, and can occur at any age, but it more often affects the dominant hand of people in their fifties (Fleisch 2007; Sato 2012; Weilby 1970). The most affected digits are the thumb, ring and middle finger; the index finger is almost always the least involved (Blyth 1996; Ragoowansi 2005; Weilby 1970). It is not uncommon for a person to have multiple trigger digits (Ryzewicz 2006; Sheikh 2014). Notta 1850 first described this disease many years ago. Although histological changes of A1 pulley and synovial proliferation have been identified as factors that prompt trigger finger, the exact aetiology is still unknown (Quinnell 1980; Sampson 1991; Sato 2012). Some diseases are associated with trigger finger, such as gout, carpal tunnel syndrome, De Quervain's disease, diabetes, amyloidosis and mucopolysaccharidosis, as a consequence of connective tissue metabolism changes (Akhtar 2005; Ryzewicz 2006; Turowski 1997); in the population of diabetic patients, for example, the incidence of trigger digits reaches 10% (Stahl 1997). The patient may start feeling pain on the palm or in the proximal interphalangeal joint without triggering of the digit; these symptoms may disappear or increase in severity, leading to pain and hand dysfunction and they can result in stiffness of the affected fingers' PIP joint (Ryzewicz 2006). Quinnell 1980 classified trigger finger into five types: type zero (0), with normal motion; type I, uneven movement; type II, trigger finger that is actively corrected; type III, trigger finger that needs an external force for unlocking; and type IV, with a fixed deformity.
Description of the intervention
The initial treatment for trigger finger is conservative and involves activity modification, non‐steroidal anti‐inflammatory drugs, splinting (Patel 1992), and corticosteroid injection (Kazuki 2006; Murphy 1995; Ring 2008). A Cochrane Review summarised the efficacy of corticosteroid injections for trigger finger in adults. Corticosteroid injection with lidocaine was more effective than lidocaine alone; however, only two small studies were included on this review. The risk of adverse events was uncertain (Peters‐Veluthamaningal 2009).
However, some studies reported recurrence rate up to 48% after corticosteroid treatment (Kazuki 2006; Rhoades 1984; Ring 2008). For any stage of the disease, the initial treatment is conservative; however, if tendinous obstruction symptoms are not satisfactorily relieved through conservative treatments, the A1 pulley is sharply incised longitudinally, through an open (Fahey 1954; Paul 1992), percutaneous (Bain 1995; Cebesoy 2007; Eastwood 1992; Gilberts 2001; Lorthioir 1952; Pope 1995), or endoscopic (Pegoli 2008) surgical approach. Surgical treatment for trigger finger has a reported success rate of up to 97% (Gilberts 2001; Pegoli 2008; Turowski 1997).
The open surgical method involves skin incision, dissection of the neurovascular bundles, and identification and incision of the A1 pulley under direct vision, which arguably minimises the injury risk to other structures (Akhtar 2005; Fahey 1954; Turowski 1997).
Lorthioir 1952 first described the percutaneous method using a small tenotome. Eastwood 1992 used a needle in the procedure. Nowadays the technique consists of cutting the A1 pulley by a percutaneous insertion of a small instrument (e.g. needle or hook knife) under local anaesthesia (Gulabi 2014; Guler 2013; Rojo‐Manaute 2012a). Some argue that this approach may increase the risk of damaging the neurovascular bundle, flexor tendon and capsule, but the approach is gaining acceptance due to the convenience of surgically treating trigger finger with no incision (Cebesoy 2007; Gilberts 2001Gulabi 2014; Huang 2015).
Endoscopic release consists of two small incisions through which a type of fibre‐optic endoscope (camera) passes (Pegoli 2008). The pulley is identified and is opened by a small lamina adapted to the endoscope (Pegoli 2008). This procedure is the least common due to its costs and greater learning curve (Pegoli 2008).
How the intervention might work
The pulleys are fibrous tissue bands that maintain the flexor tendons in a constant connection to the joint axis of motion; the A1 pulley begins on the volar plate of the MCP joint, from which about two‐thirds of its fibres emerge, while its remaining portion is attached to the base of the proximal phalanx (Doyle 1988). People with trigger finger exhibit a pulley stenosis A1 and changes in the fibres of the flexor tendons, with the formation of an intratendinous node and consequent rebound or blocking of the movement of the affected finger (Hueston 1972), and the surgical treatment consists of sectioning the pulley A1 while preserving the flexor tendons to restore the coordinated movement of the finger (Akhtar 2005; Paul 1992). Surgical treatment can be performed through open, percutaneous or endoscopic surgery. Studies of open surgery have reported that the method has the advantage of directly visualizing the structures, allowing a complete section of the A1 pulley with minimum risk of injury to the flexors, tendon and neurovascular bundles (Paul 1992; Turowski 1997), although complications such as surgical site infection and hypertrophic scar or pain have been reported as potential disadvantages (Thorpe 1988). The advantages described for percutaneous surgery are the option to perform a surgical procedure without incising the skin, early return to activities (3.9 days on average) and quick implementation of the technique (seven minutes on average), but disadvantages such as risk of neurovascular injury, or injury to flexor tendons or the joint capsule have been reported, because these structures could not be visualized (Cebesoy 2007; Gilberts 2001; Huang 2015). Some studies, however, have described cutaneous parameters of the palmar surface that serve as reference to locate the A1 pulley (Fiorini 2011; Wilhelmi 2001). In endoscopic surgery the pulley A1 section is performed under indirect visualization with a camera introduced through the skin, and the absence of scar contraction, early return to activities and quick execution of the procedure (4½ minutes on average) were reported as the main advantages of the technique; on the other hand, the high cost and long learning curve were reported as disadvantages (Pegoli 2008).
Why it is important to do this review
Trigger digit is one of the most common forms of tenosynovitis, and affects mostly middle‐aged women's hands (Sato 2012; Weilby 1970). It can lead to long‐term pain, deformity and disability (Akhtar 2005; Eastwood 1992). Despite its high frequency, there is no consensus about the best surgical approach to treat it.
This review summarises the available evidence in the literature of surgical interventions, considering safety and benefits of treatment as measured by resolution of the condition, pain, hand function, patient satisfaction, frequency of recurrence of triggering, adverse events and neurovascular injury.
Objectives
To evaluate the effectiveness and safety of different methods of surgical treatment for trigger finger (open, percutaneous or endoscopic approaches) in adults at any stage of the disease.
Methods
Criteria for considering studies for this review
Types of studies
We included any randomised or quasi‐randomised (not strictly random: e.g. by date of birth, hospital record number, alternation) controlled trials of surgical treatment for trigger finger.
Types of participants
We included all studies involving adults who had been diagnosed with trigger finger. Any trials exclusively including adolescents or children were excluded. Studies that included children were only included if the proportion of children was less than 10%, or data were presented separately for adults.
This review assessed only adults because the physiopathology, treatment timing and techniques are different in children.
Types of interventions
Surgical treatment for trigger finger was considered, including open, percutaneous or endoscopic techniques.
All control interventions were eligible, including non‐surgical interventions (use of splinting, physiotherapy and corticosteroids infiltration), placebo, no interventions ('wait and see') and any other therapy (including different surgical interventions).
We included studies with co‐interventions, as long as the effect of surgery could be assessed (i.e. we excluded trials that used the same surgery in two treatment arms plus a co‐intervention in one arm). Studies that included co‐interventions as a comparator were assessed separately from studies with a single comparator (e.g. open surgery versus percutaneous surgery plus steroid injection were assessed separately from trials comparing open surgery and percutaneous surgery).
Types of outcome measures
We considered for inclusion studies that included at least one of the following outcome measures.
Major outcomes
-
Resolution of trigger finger (as defined in the trials).
-
Pain. Severity of pain or tenderness at the base of the digit on the palm of the hand, or incidence of pain as a dichotomous outcome. Preference was given to reports of the severity of pain measured using validated pain scales (visual analogue scale (VAS) or numerical rating scale).
-
Functional status of the hand (using validated instruments to measure hand function, e.g. Disability of the Arm, Shoulder and Hand questionnaire, or DASH).
-
Participant‐reported treatment success or satisfaction (either reported as a proportion with success, or using validated questionnaires).
-
Frequency of recurrence of triggering or locking of the affected fingers.
-
Number of patients experiencing any adverse event (e.g. superficial infection, deep infection and adherence).
-
Neurovascular injury.
Timing of outcomes measurement
If there were available data, we extracted outcomes at the following time periods: short‐term follow‐up (up to three months following treatment); intermediate follow‐up (more than three months and up to six months after the end of treatment); and long‐term (more than six months after the end of treatment). When multiple time points (e.g. one, six, eight and 12 weeks' follow‐up) were reported in the trials, we extracted all available data and reported the results; however in the analysis of the different comparison groups of the studies that reported results in the same period of time, we grouped the data using the time period reported in the publications. When different time periods were reported in studies of the same analysis group, we used the longest time period reported in each study for the outcomes 'resolution', 'hand function', 'patient satisfaction', 'recurrence of trigger finger', 'adverse events' and 'neurovascular injury' for the short‐term, intermediate‐term and long‐term periods. For the pain outcome we used the shortest time period reported in the short‐term; however in the intermediate and long term we carried out the analyses using the longest time period reported. To prepare the 'Summary of findings' tables we reported the data using the longest time period assessed in each study for the outcomes 'resolution', 'hand function', 'patient satisfaction', 'recurrence of trigger finger', 'adverse events' and 'neurovascular injury'; while for the outcome 'pain', we reported the shortest time period assessed in the studies, as we believe that the pain assessment in the period closest to the date of the procedure is very important for patients deciding between the various types of treatment, and is different from the other outcomes, in which the longest period of time is the most important factor in the therapeutic decision.
Search methods for identification of studies
Electronic searches
Our search strategy followed Cochrane Musculoskeletal Group (CMSG) methods used in reviews. We searched the Cochrane Central Register of Controlled Trials (CENTRAL; 2017, Issue 7) in the Cochrane Library (searched 16 August 2017), MEDLINE (1946 to 02 August 2017), Embase (1947 to 02 August 2017) and Latin American and Caribbean Health Sciences (LILACS, 1982 to 02 August 2017) (Appendix 1; Appendix 2; Appendix 3; Appendix 4; Appendix 5). We set no restrictions based on language, publication status or publication date.
In MEDLINE (Ovid), the Cochrane Highly Sensitive Search Strategy for identifying randomised trials (sensitivity and precision‐maximising version) (Lefebvre 2009) was combined with the subject‐specific search (Appendix 2). The MEDLINE strategy was adapted appropriately for the other databases.
We also searched the registries ClinicalTrials.gov (U.S. National Institute of Health) and World Health Organization (WHO) International Clinical Trial Registry Platform for ongoing and recently completed studies (15 September 2017) (Appendix 6; Appendix 7).
Searching other resources
We checked the reference lists of included articles, reviews and textbooks for possible relevant studies.
Data collection and analysis
The intended methodology for data collection and analysis was described in our published protocol (Ventin 2014), which was based on the one explained in the Cochrane Handbook for Systematic Reviews of Interventions (Higgins 2011a).
Selection of studies
Two review authors (HFJ and MJT) independently screened title and abstract of studies that met the inclusion criteria for this review. They resolved differences by discussion and consensus and, when necessary, by discussion with the third review author (JCB).
Data extraction and management
Two review authors (HFJ and MJT) used a piloted data extraction form to independently collect data, including the following.
-
Study design and duration, funding sources and details of trial registration.
-
Place of study, number of participants assigned and assessed, inclusion criteria, exclusion criteria, age, gender, side, affected digits and classification of trigger finger.
-
Characteristics of study interventions including timing of intervention, duration of treatment, type of surgery (open, percutaneous or endoscopic) or conservative interventions (steroid only or steroid plus hyaluronic acid injection), rehabilitation and any co‐interventions.
-
Characteristics of study outcomes such as duration of follow‐up, loss to follow‐up and outcomes reported in the studies.
We included nine comparisons: open surgery versus steroid injection; percutaneous surgery versus steroid injection; open surgery versus steroid injection plus hyaluronic acid injection guided by ultrasound; percutaneous surgery plus steroid injection versus steroid injection; percutaneous surgery versus open surgery; endoscopic surgery versus open surgery; open surgery by transversal incision of the skin about 2–3 mm distally from distal palmar crease versus open surgery by longitudinal incision of the skin at the level of the A1‐pulley without crossing the distal palmar crease proximal; open surgery by transversal incision of the skin in the distal palmar crease versus open surgery by longitudinal incision of the skin at the level of the A1‐pulley without crossing the distal palmar crease proximal; and open surgery by transversal incision of the skin in the distal palmar crease versus open surgery by transversal incision of the skin about 2–3 mm distally from distal palmar crease.
We considered as the primary comparison 'Open surgery versus steroid injection', because open surgery is the oldest and most traditional method of treatment for trigger finger, while steroid injection is the least invasive method reported in the included studies.
A third review author (JCB) resolved all initial differences of opinion. There was no blinding for the study author, institution or journal at this stage.
Two review authors (HFJ and MJT) entered data into Review Manager 5 (RevMan 5) (Review Manager 2014). We sent requests to the primary trial authors of the 14 studies to clarify any omitted data or study characteristics (Aref 2014; Bamroongshawgasame 2010; Callegari 2011; Chao 2009; Dierks 2008; Gilberts 2001; Hansen 2017; Kloeters 2016; Maneerit 2003; Nikolaou 2017; Pegoli 2008; Sato 2012; Singh 2005; Zyluk 2011), but only one author responded to the e‐mail (Sato 2012), informing us about the exact number of the thumbs, index, long, ring and little fingers included in each comparison group of the study.
Assessment of risk of bias in included studies
Two independent review authors (HFJ and ML) assessed the risks of bias of the included studies. As recommended by Cochrane's 'Risk of bias' tool (Higgins 2011a), the following methodological domains were assessed.
-
Random sequence generation.
-
Allocation concealment.
-
Blinding of participants and personnel.
-
Blinding of outcome assessment: was considered blinding separately for subjective self‐reported outcomes (e.g. resolution of symptoms, pain, function, treatment success or patient satisfaction, recurrence) and objective outcomes (e.g. adverse events, neurovascular injury).
-
Incomplete outcome data.
-
Selective reporting.
-
Other bias, such as major baseline imbalance, risk of bias associated with care providers and differences in rehabilitation.
Each of these criteria was explicitly judged as described by Higgins 2011a into one of these categories: low risk of bias; high risk of bias; and unclear risk of bias (either lack of information or uncertainty over the potential for bias). When necessary, authors recorded and resolved by consensus their disagreements regarding the risk of bias for domains.
Measures of treatment effect
We calculated the risk ratios (RRs) with 95% confidence intervals (CIs) for dichotomous outcomes. We calculated mean differences (MDs) with 95% CIs for continuous outcomes (pain and hand function). We planned to calculate standardised mean differences (SMDs) for continuous outcomes if they were pooled on different scales, but it was not necessary.
We also presented the absolute per cent difference and relative per cent change from baseline for all outcomes in the 'Comments' column of the 'Summary of findings' table. For outcomes that differ statistically between treatment groups, we expressed estimate effects as the number needed to treat for an additional beneficial outcome (NNTB) and the number needed to treat for an additional harmful outcome (NNTH).
For dichotomous outcomes, we calculated the absolute risk difference using the risk difference statistic in RevMan 5 software (Review Manager 2014), and expressed the result as a percentage. For continuous outcomes, we calculated the absolute benefit as the improvement in the intervention group minus the improvement in the control group, in the original units, expressed as a percentage.
We calculated the relative per cent change for dichotomous data as RR − 1 and expressed as a percentage. For continuous outcomes, we calculated the relative difference in the change from baseline as the absolute benefit divided by the baseline mean of the control group, expressed as a percentage.
For dichotomous outcomes, we calculated NNTB or NNTH from the event rate in the control group (unless we knew the population event rate) using the Visual Rx NNT calculator (Cates 2008); we used RR when adverse events were assessed and we used the odds ratio when beneficial events were assessed. For continuous outcomes, NNTB was calculated using the Wells calculator software available at the CMSG editorial office (www.cochranemsk.org). The minimal clinically important difference (MCID) for each outcome was determined for input into the calculator; we assumed that a difference of 1.5 points on a 10‐point pain scale between groups is clinically important. For function, we would have assumed a difference of 10 points on the 100‐point DASH score is clinically important.
Unit of analysis issues
The unit of randomisation was usually the individual participants. Exceptionally, as in the case of trials including people with more than one finger assessed, we assessed the trial data for fingers, instead of individual participants. We planned to identify studies that randomise or allocate clusters (e.g. many fingers) but do not account for clustering analysis, and when possible, re‐analyse such studies by calculating effective sample sizes according to the methods described in Higgins 2011b, but that was not necessary because none carried out cluster‐allocation studies.
Dealing with missing data
We attempted to extract outcomes for all participants randomised to any intervention. In case there was insufficient information relative to estimate effects, such as number of participants, means, measures of uncertainty (standard deviation or error), or number of events and participants, we tried to contact authors of included studies.
For dichotomous outcomes, we used number randomised as denominator, making the assumption that any participants missing at the end of treatment did not have a positive outcome (e.g. for the outcome 'number of patients experiencing any adverse event', we assumed any missing participants had an adverse event).
For continuous outcomes with no standard deviation reported, we planned to calculate standard deviations if possible from standard errors, P values, or confidence intervals, according to the methods outlined in Higgins 2011b; if this was not possible we considered imputing missing standard deviations from other trials of the same meta‐analysis.
When impossible to acquire missing data, we addressed the potential impact of missing data on the findings of the review in the Discussion section.
Assessment of heterogeneity
We estimated the presence of heterogeneity across the included studies with visual examination of the forest plot generated from meta‐analysis of studies initially considered appropriate for pooling. We assessed the degree of statistical heterogeneity based on the test for heterogeneity and the I² statistic. We interpreted the values as follows: 0% to 40% might not be important; 30% to 60% may represent moderate heterogeneity; 50% to 90% may represent substantial heterogeneity; and 75% to 100% shows considerable heterogeneity (Deeks 2011).
Assessment of reporting biases
We planned to draw funnel plots from primary outcomes to assess the potential publication bias (small‐study effects), if more than 10 studies were included in the meta‐analyses. However, due to the small number of studies included in each comparison it was not possible to perform this type of analysis. We also assessed the presence of bias for small studies in the overall meta‐analysis by checking whether the random‐effects estimate of the intervention effect is more efficient than the fixed‐effect estimate (Sterne 2011).
Data synthesis
For results of comparable groups of studies — with similar participants, the same intervention and comparator, and using the same outcome measure — we pooled outcomes in a meta‐analysis using the random‐effects model as a default, as we expected some variation in the surgery and comparators.
GRADE and 'Summary of findings' tables
We presented the main results (resolution of trigger finger, severity of pain, functional status of the hand ‒ DASH, participant‐reported treatment success, frequency of recurrence of triggering, adverse events and neurovascular injury) of the review in 'Summary of findings' tables in order to improve the readability of the review. The 'Summary of findings' tables provide key information concerning the quality of evidence, the magnitude of effect of the interventions examined (open, percutaneous and endoscopic approach) and the sum of available data on the main outcomes (Schünemann 2011). GRADEpro GDT software was used to provide an overall grading of the quality of the evidence (GRADEpro GDT).
Subgroup analysis and investigation of heterogeneity
Had sufficient data been available, we planned to conduct a subgroup analysis to determine different estimated effects across different age ranges (i.e. younger adults (< 65 years) or older people (65 years and older)); the presence or absence of comorbidities (including carpal tunnel syndrome, diabetes, gout, De Quervain's disease, mucopolysaccharidosis, amyloidosis and rheumatoid arthritis); and at different follow‐up times (i.e. short‐term (up to three months), intermediate‐term (more than three months and up to six months) or long‐term follow‐up (greater than six months)). Due to lack of data in included studies it was not possible to perform subgroup analysis for age or presence of comorbidities. It was possible to carry out a subgroup analysis by different follow‐up times for some comparisons (see Effects of interventions).
Sensitivity analysis
We performed a sensitive analysis to investigate the robustness of the treatment effect to allocation concealment, by removing the trials that reported inadequate or unclear allocation concealment from meta‐analysis to see if this changes the overall treatment effect. And we also investigated the effect of imputation of missing data (e.g. imputation of standard deviation).
Results
Description of studies
See: Characteristics of included studies; Characteristics of excluded studies and Characteristics of ongoing studies.
Results of the search
The search strategy was completed in August 2017. We found a total of 402 records from the following databases: Cochrane Musculoskeletal Group Specialised Register (4 records); Cochrane Central Register of Controlled Trials (95); MEDLINE (100); Embase (120); LILACS (24); ClinicalTrials.gov (20); and the WHO International Clinical Trials Registry Platform (39).
We also found three potentially eligible studies from other sources (one from the studies that were included in other published reviews and two by means of automatic search of Google Scholar related to a previous publication on the topic of trigger finger (Fiorini 2011)).
The search result was our identification of 52 bibliographic citations for potentially includable studies, for which we obtained full reports. We finally included 14 studies in this review, from a total of 28 published reports. The included studies were published between 2001 and 2017 (Aref 2014; Bamroongshawgasame 2010; Callegari 2011; Chao 2009; Dierks 2008; Gilberts 2001; Hansen 2017; Kloeters 2016; Maneerit 2003; Nikolaou 2017; Pegoli 2008; Sato 2012; Singh 2005; Zyluk 2011). Only three trials had a published protocol (Hansen 2017; Nikolaou 2017; Sato 2012).
In total there are 14 included studies, 15 excluded studies and three ongoing studies (Figure 1).

Study flow diagram.
Included studies
Characteristics of the 14 included studies can be found in Characteristics of included studies.
Thirteen studies included in the review reported the results in a single publication (Bamroongshawgasame 2010; Callegari 2011; Chao 2009; Dierks 2008; Gilberts 2001; Hansen 2017; Kloeters 2016; Maneerit 2003; Nikolaou 2017; Pegoli 2008; Sato 2012; Singh 2005; Zyluk 2011). One study reported the results in two publications (Aref 2014).
All trials were reported in English.
Design of the studies
Eleven studies were reported as randomised trials — Bamroongshawgasame 2010, Callegari 2011, Chao 2009, Gilberts 2001, Hansen 2017, Kloeters 2016, Maneerit 2003, Nikolaou 2017, Pegoli 2008, Sato 2012 and Zyluk 2011 — and three were quasi‐randomised (Aref 2014; Dierks 2008; Singh 2005). In Aref 2014 and Singh 2005 the patients were randomised to either percutaneous surgery or steroid injection using their birth year, and in Dierks 2008 the patients were randomised to either open or percutaneous surgery using their patient numbers. All studies had two intervention groups, except Kloeters 2016 and Sato 2012 which had three intervention groups. All 14 studies were single‐centre trials. Aref 2014 took place in Iran; Bamroongshawgasame 2010 and Maneerit 2003 in Thailand; Callegari 2011 and Pegoli 2008 in Italy; Chao 2009 in China; Dierks 2008 in Germany; Gilberts 2001 and Kloeters 2016 in the Netherlands; Hansen 2017 in Denmark; Nikolaou 2017 in Greece; Sato 2012 in Brazil; Singh 2005 in Malaysia; and Zyluk 2011 in Poland.
Sample sizes
The 14 trials enrolled a total of 1260 participants, totalling at least 1361 fingers: a study enrolled 115 participants with a 20 follow‐up loss, but the authors did not describe what the totality of fingers involved in the study represented in the loss of these 20 participants (Zyluk 2011). The total follow‐up loss in 14 trials was 2.9% (37 participants).
Participants
Age and gender
The age of participants included in the studies ranged from 16 to 88 years. Callegari 2011 assessed participants aged between 35 and 70 years; Dierks 2008 included adults with ages ranging between 18 and 80 years; Gilberts 2001, Hansen 2017, Kloeters 2016 and Nikolaou 2017 included participants aged 18 years or older; Sato 2012 enrolled participants older than 15 years of age; Aref 2014, Chao 2009, Maneerit 2003 and Singh 2005 reported the inclusion of adult participants, but did not specify their age; Bamroongshawgasame 2010, Pegoli 2008 and Zyluk 2011 did not report age as an inclusion criterion, but all participants in these three studies were adults over 18 years of age. Most participants were women (approximately 70%), but the exact number was not calculated because the studies of Gilberts 2001, Maneerit 2003 and Sato 2012 reported gender in relation to the number of fingers, while the others related the number of participants.
Affected digits
Ten studies (Aref 2014; Bamroongshawgasame 2010; Callegari 2011; Chao 2009; Gilberts 2001; Kloeters 2016; Maneerit 2003; Pegoli 2008; Sato 2012; Singh 2005) published data regarding which digits were affected in the assigned participants, totalling 1002 digits, of which 385 (38%) were thumbs, 89 (9%) index, 286 (29%) middle, 205 (20%) ring and 37 (4%) little finger. Zyluk 2011 reported data regarding which digits were affected in the assessed participants, totalling 105 digits, of which 39 (37%) were thumbs, 1 (1%) index, 22 (21%) middle, 35 (33%) ring and 8 (8%) little; Hansen 2017 published the percentage of each affected finger, but was not explicit if the data were referring to the assigned participants (165 digits) or assessed participants (153 digits); Hansen 2017 reported that 39% of the digits were thumbs, 5% index, 25% middle, 25% ring and 6% little.
Dierks 2008 and Nikolaou 2017 assigned a total of 68 participants, but they did not report data on which fingers were affected in these participants.
Types/classification of trigger finger
All trials assessed only participants with trigger finger. Aref 2014, Chao 2009, Hansen 2017, Kloeters 2016, Maneerit 2003, Sato 2012 and Singh 2005 used the classification of Quinnell 1980 to characterise the participants: while Kloeters 2016, Maneerit 2003, Sato 2012 and Singh 2005 used gradation from 0 to IV, Aref 2014, Chao 2009 and Hansen 2017 gradated triggering from I to V, Bamroongshawgasame 2010, Callegari 2011, Nikolaou 2017 and Zyluk 2011 used the classification of Froimson 1993, which corresponds to a change in the classification of Quinnell 1980. Dierks 2008, Gilberts 2001 and Pegoli 2008 did not use any kind of classification.
Timing of intervention
Eleven studies reported data on the timing of intervention (Bamroongshawgasame 2010; Callegari 2011; Chao 2009; Dierks 2008; Gilberts 2001; Hansen 2017; Kloeters 2016; Maneerit 2003; Nikolaou 2017; Sato 2012; Zyluk 2011). Bamroongshawgasame 2010, Kloeters 2016 and Nikolaou 2017 reported that the participants had presented trigger finger symptoms for at least three months; Callegari 2011 reported an average time of 3.5 months (range: 1 to 6 months). Two studies reported that the participants had, on average, shown symptoms for four months (Chao 2009; Maneerit 2003). Dierks 2008 reported that the participants subjected to percutaneous surgery had, on average, shown symptoms for seven months (range: 1 to 36), while in the group subjected to open surgery, the average had been 12 months (range: 1 to 60 months). Gilberts 2001 reported that on average the timing of intervention had been six months (range: 1 to 24 months) in the group subjected to percutaneous surgery and 12 months (range: 1 to 144 months) in the open surgery group. Hansen 2017 reported that the average time for performing intervention after the beginning of symptoms was four months in the open surgery group and five months in the steroid injection group. Sato 2012 reported average time of 15 months in the percutaneous surgery group, 10.5 months in the open surgery group and 11.8 months in the steroid injection group. Zyluk 2011 reported that the average time for performing intervention after the beginning of symptoms was five months in the percutaneous surgery group and six months in the steroid injection group. Three studies did not report any data on the timing of intervention (Aref 2014; Pegoli 2008; Singh 2005).
Interventions
Based on surgical intervention methods, we grouped the studies in nine comparison groups:
Comparison 1: open surgery versus steroid injection (Hansen 2017; Sato 2012). Follow‐up data were available for 269 participants, totalling 270 fingers (140 with open surgery and 130 with steroid injection). In total 12 participants (12 digits) were follow‐up loss in Hansen 2017: seven participants (seven digits) did not receive allocated intervention — six in open surgery group and one in steroid injection group —, and five participants (five fingers) did not complete the follow‐up — two in the open surgery group and three in the steroid injection group.
Comparison 2: percutaneous surgery versus steroid injection (Aref 2014; Chao 2009; Sato 2012; Singh 2005; Zyluk 2011). Follow‐up data were available for 344 participants, totalling 368 fingers (176 with percutaneous surgery and 192 with steroid injection). Two studies had follow‐up loss (Chao 2009; Zyluk 2011). In Chao 2009 three participants (four fingers) did not complete the follow‐up, with one participant (one finger) in the percutaneous surgery group and two participants (three fingers) in the steroid injection group. In Zyluk 2011 20 participants did not complete the follow‐up, in which 12 were in the percutaneous surgery group and eight in the steroid injection group.
Comparison 3: open surgery versus steroid injection plus ultrasound‐guided hyaluronic acid injection (Callegari 2011). Follow‐up data were available for 30 participants, totalling 30 fingers (15 with open surgery and 15 with steroid injection plus ultrasound‐guided hyaluronic acid injection).
Comparison 4: percutaneous surgery plus steroid injection versus steroid injection (Maneerit 2003). Follow‐up data were available for 113 participants, totalling 125 fingers (65 with percutaneous surgery plus steroid injection and 60 with steroid injection). Two participants (two fingers), with one in each group, did not complete the follow‐up.
Comparison 5: percutaneous surgery versus open surgery (Bamroongshawgasame 2010; Dierks 2008; Gilberts 2001; Nikolaou 2017; Sato 2012). Follow‐up data were available for 402 participants, totalling 429 fingers (215 with percutaneous surgery and 214 with open surgery).
Comparison 6: endoscopic surgery versus open surgery (Pegoli 2008). Follow‐up data were available for 200 participants, totalling 231 fingers (114 with endoscopic release and 117 with open surgery).
Comparison 7: open surgery by transversal incision of the skin about 2–3 mm distally from the distal palmar crease versus open surgery by longitudinal incision of the skin at the level of the A1‐pulley without crossing the proximal distal palmar crease (Kloeters 2016). Follow‐up data were available for 20 participants, totalling 21 fingers (10 with open surgery by transversal incision of the skin about 2–3 mm distally from distal palmar crease and 11 open surgery by longitudinal incision of the skin).
Comparison 8: open surgery by transversal incision of the skin in the distal palmar crease versus open surgery by longitudinal incision of the skin at the level of the A1‐pulley without crossing the distal palmar crease proximal (Kloeters 2016). Follow‐up data were available for 20 participants, totalling 22 fingers (11 with open surgery by transversal incision of the skin in the distal palmar crease and 11 open surgeries by longitudinal incision of the skin).
Comparison 9: open surgery by transversal incision of the skin in the distal palmar crease versus open surgery by transversal incision of the skin about 2–3 mm distally from distal palmar crease (Kloeters 2016). Follow‐up data were available for 20 participants, totalling 21 fingers (11 with open surgery by transversal incision of the skin in the distal palmar crease and 10 open surgeries by transversal incision of the skin about 2–3 mm distally from distal palmar crease).
Outcome measures
The trials varied in their follow‐up times. Twelve studies stipulated follow‐up time points (Bamroongshawgasame 2010; Callegari 2011; Chao 2009; Dierks 2008; Gilberts 2001; Hansen 2017; Kloeters 2016; Nikolaou 2017; Pegoli 2008; Sato 2012; Singh 2005; Zyluk 2011); one trial reported mean follow‐up of 23 months (six to 42 months) and was considered long term (Maneerit 2003); one trial did not clearly specify the follow‐up period, but reported weekly evaluations of the participants in the first six weeks and cases of recurrence with up to nine months of follow‐up (long term) (Aref 2014). Five trials were short term (Bamroongshawgasame 2010; Dierks 2008; Gilberts 2001; Nikolaou 2017; Pegoli 2008); Bamroongshawgasame 2010 reported follow‐up data for eight weeks, while Dierks 2008, Gilberts 2001; Nikolaou 2017 and Pegoli 2008 conducted follow‐up to 12 weeks. Two trials presented data for six months (intermediate term) (Sato 2012; Zyluk 2011). Five trials related follow‐up data for one year (long term) (Callegari 2011; Chao 2009; Hansen 2017; Kloeters 2016; Singh 2005).
Major outcomes
Resolution of trigger finger
Resolution of trigger finger was assessed by ten trials (Bamroongshawgasame 2010; Callegari 2011; Chao 2009; Dierks 2008; Gilberts 2001; Hansen 2017; Maneerit 2003; Nikolaou 2017; Pegoli 2008; Sato 2012). The resolution definition was heterogeneous among the studies and some authors reported it as "successful treatment", "healing" or "satisfactory results". Bamroongshawgasame 2010 considered successful trigger finger treatment as the relief of pain and the cessation of finger locking after the procedure. Callegari 2011 considered satisfactory results as the remission of symptoms within six weeks, with no recurrence within six months. Chao 2009 and Maneerit 2003 considered as satisfactory the participants who progressed with pain score lower than or equal to one (VAS scale) and cessation of triggering. Dierks 2008 considered successful treatment as the complete relief of symptoms. Gilberts 2001 assessed the success of the treatment as the cessation of triggering, with no recurrence during follow‐up (three months). Hansen 2017 considered cure if cessation of blockage was maintained after 12 months of the treatment. Nikolaou 2017 reported resolution as the “success rate” per digit after the procedure. Pegoli 2008 considered resolution as the disappearance of triggering after the procedure. Sato 2012 described trigger finger healing as the remission of symptoms with the cessation of blockage with no recurrence within six months. Aref 2014, Kloeters 2016, Singh 2005 and Zyluk 2011 did not evaluate this primary endpoint.
Severity or incidence of pain
Thirteen trials reported pain (Aref 2014; Bamroongshawgasame 2010; Callegari 2011; Chao 2009; Dierks 2008; Gilberts 2001; Hansen 2017; Maneerit 2003; Nikolaou 2017; Pegoli 2008; Sato 2012; Singh 2005; Zyluk 2011), but only eight studies assessed pain in the hand after the procedure and published data (Bamroongshawgasame 2010; Callegari 2011; Chao 2009; Dierks 2008; Hansen 2017; Maneerit 2003; Sato 2012; Zyluk 2011); only two studies assessed it through continuous measurements and reported complete data (Chao 2009; Dierks 2008). Aref 2014 reported that pain was assessed using the VAS scale, but did not report the data. Bamroongshawgasame 2010 used a zero to three score scale, but the data reported in an inaccurate chart was incomplete as it did not report the exact values and standard deviations. Callegari 2011, Chao 2009, Maneerit 2003 and Zyluk 2011 used a VAS scale with a range of 0 to 10 cm, but Callegari 2011, Maneerit 2003 and Zyluk 2011 did not report the standard deviations. Dierks 2008 assessed pain using a 1 to 6 scale. Hansen 2017 reported that pain was assessed using a 1 to 10 scale, but did not report the standard deviations. Sato 2012 reported pain where the procedure was performed (topical pain), assessed through dichotomized "yes or no" (presence or absence of pain). Gilberts 2001, Nikolaou 2017 and Pegoli 2008 reported the average postoperative pain duration in days. Singh 2005 reported pain assessment but did not describe what method was used and did not report the data. Kloeters 2016 did not measure any this outcome.
Functional status of the hand
Only three trials — Callegari 2011, Kloeters 2016 and Nikolaou 2017 — evaluated functional status of the hand by validated instruments, and they used Disabilities of the Arm, Shoulder and Hand (DASH or QuickDASH) questionnaire; Callegari 2011 and Kloeters 2016 used the DASH questionnaire, while Nikolaou 2017 assessed the data using the QuickDASH questionnaire. Kloeters 2016 reported complete data about DASH, informing the respective standard error means to each DASH score; Callegari 2011 and Nikolaou 2017 did not report any variance measure.
Aref 2014, Bamroongshawgasame 2010, Chao 2009, Dierks 2008, Gilberts 2001, Hansen 2017, Maneerit 2003, Pegoli 2008, Sato 2012, Singh 2005 and Zyluk 2011 did not evaluate this outcome.
Participant‐reported treatment success or satisfaction
Only four trials assessed post‐treatment patient satisfaction (Aref 2014; Bamroongshawgasame 2010; Callegari 2011; Singh 2005), but two trials reported the data incompletely (Bamroongshawgasame 2010; Callegari 2011), and two trials did not report the data (Aref 2014; Singh 2005). Bamroongshawgasame 2010 measured patient satisfaction using a 0 to 3 score (0 = unsatisfied, 1 = somewhat satisfied, 2 = satisfied and 3 = very satisfied), and Callegari 2011 used a visual satisfaction scale (SVAS) gradated from 0 to 10. The other ten trials did not assess participant‐reported treatment success or satisfaction (Chao 2009; Dierks 2008; Gilberts 2001; Hansen 2017; Kloeters 2016; Maneerit 2003; Nikolaou 2017; Pegoli 2008; Sato 2012; Zyluk 2011).
Frequency of recurrence of triggering or locking of the affected fingers
Eight studies reported direct data on the recurrence of trigger finger (Aref 2014; Bamroongshawgasame 2010; Callegari 2011; Gilberts 2001; Hansen 2017; Sato 2012; Singh 2005; Zyluk 2011). Aref 2014, Bamroongshawgasame 2010, Gilberts 2001, Hansen 2017 and Singh 2005 reported the recurrence of triggering, but did not define it. Callegari 2011 considered recurrence as the return of any degree of triggering after a full remission period of trigger finger. Sato 2012 defined recurrence (relapse) as the return of finger locking within six months of follow‐up. Zyluk 2011 considered recurrence of triggering as the return to the baseline grade of triggering, after a period of total or partial improvement. Two studies did not evaluate the recurrence of triggering as a study outcome, but published indirect data on it (Chao 2009; Dierks 2008): Chao 2009 reported on participants who again experienced pain and relapse of triggering after a period of remission of the symptoms, which we consider as recurrence; Dierks 2008 reported that all participants had relief from the symptoms for 12 weeks (final study follow‐up). Kloeters 2016, Maneerit 2003, Nikolaou 2017 and Pegoli 2008 did not report or provide data on recurrence.
Number of patients experiencing any adverse event
All assessed trials referred to some adverse event, except Kloeters 2016 which did not publish any data about adverse event. Aref 2014 assessed finger stiffness, tendon bowstringing (pulley injury), dysaesthesia, and skin atrophy or skin hypopigmentation. Bamroongshawgasame 2010 assessed A2 pulley injury. Callegari 2011 assessed abnormal flexion of the finger and algodystrophic syndrome after the procedure. Chao 2009 assessed infection and tendon bowstringing (pulley injury). Dierks 2008 observed transient inflammation. Gilberts 2001 assessed haematoma and diffuse swelling of the operated digit, and adherence of flexor tendon. Hansen 2017 assessed infection, tendon bowstringing (pulley injury), digit flare after procedure, fat necrosis in digit and tendon rupture. Maneerit 2003 assessed infection and partial loss of flexion of the finger after treatment. Pegoli 2008 assessed infection and dysaesthesia. Nikolaou 2017 assessed infection and partial loss of movement in operated digit. Sato 2012 assessed the presence of infection and rupture of the flexor tendon after the procedure. Singh 2005 assessed stiffness of the fingers, tendon bowstringing (pulley injury), and dysaesthesia. Zyluk 2011 measured the active range of motion of the fingers; the authors reported on infection and algodystrophic syndrome incompletely as they stated that there was no case in which these complications occurred in the steroid injection group, but the authors did not mention whether these complications occurred in the percutaneous surgery group.
Neurovascular injury
Nine trials assessed neurovascular injury, although Zyluk 2011 only reported data on one of the comparison groups (Bamroongshawgasame 2010; Chao 2009; Dierks 2008; Gilberts 2001; Hansen 2017; Maneerit 2003; Pegoli 2008; Sato 2012; Zyluk 2011). Five studies did not assess neurovascular injury (Aref 2014; Callegari 2011; Kloeters 2016; Nikolaou 2017; Singh 2005).
Excluded studies
We excluded 15 studies because they did not fulfil our inclusion criteria. The reasons for exclusion are supplied in Characteristics of excluded studies.
Studies awaiting classification
There are no studies awaiting classification.
Ongoing studies
Our search regarding ongoing trials (15 September 2017) found 20 records on Clinicaltrials.gov (U.S. National Institute of Health) and 39 records on the World Health Organization (WHO) International Clinical Trial Registry Platform, a total of 59 records. Excluding the duplicate registers (N = 20) and studies related to other subjects (N = 30), six did not fulfil our inclusion criteria, leaving three trials (NTR1135; TCTR20140529001; TCTR20150416001) to be included in an update of this review.
The ongoing study NTR1135 is a multicentre randomised trial with two intervention groups. This ongoing study is taking place in the Netherlands and it should enrol a total of 490 participants.
The ongoing study TCTR20140529001 is a single‐centre randomised trial with two intervention groups. This ongoing study is taking place in Thailand and it should enrol a total of 128 participants.
The ongoing study TCTR20150416001 is a single‐centre randomised trial with two intervention groups. This ongoing study is taking place in Thailand and it should enrol a total of 51 participants.
We report the details of the ongoing studies in Characteristics of ongoing studies.
Risk of bias in included studies
The 14 trials had many methodological flaws and were considered at high risk of bias (Figure 2, Figure 3 and Characteristics of included studies).

Risk of bias graph: review authors' judgements about each risk of bias item presented as percentages across all included studies.

Risk of bias summary: review authors' judgements about each risk of bias item for each included study.
When we estimated the presence of bias for small studies in the overall meta‐analysis by checking whether the results of the outcomes change in the analyses using random‐effects or fixed‐effect (Sterne 2011), there were changes in five analyses in two comparisons ― one analysis in the comparison between open surgery and steroid injection, and four analyses in the comparison of percutaneous surgery versus steroid injection ―, and there were no changes in results in the other seven comparisons. In comparison 1 (open surgery versus steroid injection) the outcome resolution of symptoms (six to 12 months) did not differ between groups in the random‐effects analysis (RR 1.48, 95% CI 0.79 to 2.76) and was favourable to the open surgery group in the fixed‐effect analysis (RR 1.51, 95% CI 1.31 to 1.73) (Analysis 1.1). In comparison 2 (percutaneous surgery versus steroid injection) the outcome resolution of symptoms (six to 12 months) did not differ between groups in the random‐effects analysis (RR 2.11, 95% CI 0.31 to 14.51) and was favourable to the percutaneous surgery group in the fixed‐effect analysis (RR 1.77, 95% CI 1.48 to 2.12) (Analysis 2.1). Short‐term pain (one month) showed no difference between groups in the random‐effects analysis (RR −1.80, 95% CI −5.72 to 2.12), but was favourable to the percutaneous surgery group in the fixed‐effect analysis (RR −1.46, 95% CI −1.81 to −1.11) (Analysis 2.2.1). The outcome recurrence (range six to 12 months) showed no difference between groups in the random‐effects analysis (RR 0.57, 95% CI 0.21 to 1.59), but was favourable to the percutaneous surgery group in the fixed‐effect analysis (RR 0.60, 95% CI 0.37 to 0.96) (Analysis 2.4). Adverse event 'partial loss of movement' showed no difference between groups in the random‐effects analysis (RR 3.09, 95% CI 0.87 to 10.97) and was favourable to the steroid injection group in the fixed‐effect analysis (RR 2.93, 95% CI 1.41 to 6.07) (Analysis 2.5.2).
Allocation
Chao 2009 and Zyluk 2011 described that the generation of random sequence was accomplished by selecting number one or two from sealed envelopes in the presence of a witness and in Sato 2012 it was done by means of a six‐sided die with two sides representing one of the three treatments, drawn prior to beginning the study by a person not involved in the research; in Hansen 2017 the generation of the random sequence was done by using the Research Randomizer software (Research Randomizer). Three trials were considered quasi‐randomised (Aref 2014; Dierks 2008; Singh 2005); Aref 2014 and Singh 2005 allocated participants based on their year of birth; in Dierks 2008 they were allocated by the register number. The seven remaining trials did not provide enough information about how the random sequence generation was done (Bamroongshawgasame 2010; Callegari 2011; Gilberts 2001; Kloeters 2016; Maneerit 2003; Nikolaou 2017; Pegoli 2008).
Allocation concealment before the assignment was adequate for Chao 2009, Gilberts 2001, Hansen 2017, Nikolaou 2017, Sato 2012 and Zyluk 2011 (sealed envelopes). Aref 2014, Dierks 2008 and Singh 2005 were quasi‐randomised. Bamroongshawgasame 2010, Callegari 2011, Kloeters 2016, Maneerit 2003 and Pegoli 2008 did not describe their allocation concealment methods.
Blinding
We considered all trials to be at high risk of performance bias (Aref 2014; Bamroongshawgasame 2010; Callegari 2011; Chao 2009; Dierks 2008; Gilberts 2001; Hansen 2017; Kloeters 2016; Maneerit 2003; Nikolaou 2017; Pegoli 2008; Sato 2012; Singh 2005; Zyluk 2011). Since all of the included studies compared different surgical techniques with or without corticoid injection, it was not possible to provide blind treatment. The participants were not blinded in any of the trials regarding the procedure performed.
Detection bias was considered blinding separately for self‐reported subjective outcomes (e.g. resolution of symptoms, pain, function, patient satisfaction, recurrence) and objective outcomes (e.g. adverse events, neurovascular injury). Twelve trials did not blind the assessors for self‐reported subjective outcomes and they were considered at high risk of bias (Aref 2014; Bamroongshawgasame 2010; Callegari 2011; Chao 2009; Dierks 2008; Gilberts 2001; Hansen 2017; Kloeters 2016; Maneerit 2003; Pegoli 2008; Sato 2012; Singh 2005); two trials blinded the assessors to the self‐reported subjective outcomes and they were considered at low risk of bias (Nikolaou 2017; Zyluk 2011). Twelve trials did not blind the assessors for objective outcomes and they were considered at high risk of bias (Aref 2014; Bamroongshawgasame 2010; Callegari 2011; Chao 2009; Dierks 2008; Gilberts 2001; Hansen 2017; Maneerit 2003; Nikolaou 2017; Pegoli 2008; Sato 2012; Singh 2005); only one trial blinded the assessors to the objective outcomes and it was considered as at low risk of bias (Zyluk 2011). It was possibly because Zyluk 2011 compared percutaneous surgery (using needle, without incision) with steroid injection. One trial (Kloeters 2016) did not assess or report any objective outcome and was considered unclear risk of bias.
Incomplete outcome data
We judged trials to be at low risk of bias if follow‐up was completed by more than 80% of participants, missing data were balanced in the groups and an intention‐to‐treat analysis was described for the primary outcomes. Ten trials were considered at low risk of attrition bias (Bamroongshawgasame 2010; Callegari 2011; Chao 2009; Dierks 2008; Gilberts 2001; Hansen 2017; Maneerit 2003; Nikolaou 2017; Pegoli 2008; Sato 2012); and one was at high risk (Zyluk 2011). Aref 2014, Kloeters 2016 and Singh 2005 were at unclear risk.
Bamroongshawgasame 2010, Callegari 2011, Dierks 2008, Gilberts 2001, Nikolaou 2017, Pegoli 2008 and Sato 2012 reported no losses to follow‐up. Chao 2009, Hansen 2017 and Maneerit 2003 were judged to be at low risk of bias because the data loss was small and balanced in both groups; in Chao 2009 the data loss was one (2%) and three (6%) respectively, in percutaneous surgery and steroid injection groups; in Hansen 2017 eight participants (9%) in open surgery group and four (5%) in steroid injection group were allocated to treatment, but they did not receive the allocated treatment or they did not complete to follow up of 12 months; and in Maneerit 2003 the data loss was one (1.5%) and one (1.6%) respectively in percutaneous surgery plus steroid injection and steroid injection groups.
Zyluk 2011 was judged as high risk despite a follow‐up loss of 17% (20/115 participants), because the loss in the percutaneous surgery group was significantly higher than in the steroid injection group, 12 (22%) and eight (13%) respectively, and the intention‐to‐treat analysis was not carried out. Aref 2014, Kloeters 2016 and Singh 2005 were judged as unclear risk because they did not clearly report if there was a follow‐up loss of participants during the study.
Selective reporting
Only one trial (Hansen 2017) was considered at low risk regarding reporting bias; Hansen 2017 published the protocol before the recruitment of participants began and always followed the protocoled methodology.
Eleven trials did not publish a prior protocol specifying the study’s results of interest and were considered at high risk of bias (Aref 2014; Bamroongshawgasame 2010; Callegari 2011; Chao 2009; Dierks 2008; Gilberts 2001; Kloeters 2016; Maneerit 2003; Pegoli 2008; Singh 2005; Zyluk 2011). Aref 2014 and Singh 2005 did not report results of interest, such as resolution, pain and functional status of the hand; Bamroongshawgasame 2010, Gilberts 2001 and Pegoli 2008 did not assess functional status of the hand and assessed pain through non‐validated measures. Callegari 2011 reported incomplete outcomes of pain and functional status of the hand because, although the VAS and DASH values were provided, the respective standard deviations were not provided. Chao 2009 and Dierks 2008 did not assess functional status, an outcome of interest in the review. Kloeters 2016 did not assess results of interest, such as resolution and pain. Maneerit 2003 did not assess the functional hand status and incompletely reported pain, because although the VAS value was provided, the standard deviation value was not reported. Zyluk 2011 did not assess resolution and functional hand status, and pain were reported incompletely, because although the VAS value was provided, the standard deviation value was not reported.
Two trials (Nikolaou 2017; Sato 2012) were considered as unclear risk of bias. Nikolaou 2017 published the study on February 18, 2017, after the protocol was published on July 6, 2016, but was considered as uncertain risk of bias for having submitted the finalized study for evaluation by the editorial board of the journal on July 4, 2016, two days prior to the publication of the protocol. Sato 2012 was considered as unclear risk of bias because although its protocol was available before the publication of the trial, the study protocol was published on 4 October 2010 and the study started on 1 November 2002 and was concluded on 3 March 2007 (Sato 2012).
Other potential sources of bias
Three trials were considered at low risk for 'other bias' (Bamroongshawgasame 2010; Dierks 2008; Gilberts 2001). Three trials were considered at high risk of other potential bias (Callegari 2011; Kloeters 2016; Pegoli 2008). Rehabilitation differences were reported in Callegari 2011. Kloeters 2016 and Pegoli 2008 presented imbalance between groups: in Kloeters 2016 there was a significant difference in baseline DASH scores between groups, and in Pegoli 2008 there was baseline imbalance between the groups regarding the presence of associated diseases (38% in the open surgery group and 14% in the endoscopic surgery group), which were operated concomitantly with trigger finger.
Eight trials were considered at unclear risk of other biases (Aref 2014; Chao 2009; Hansen 2017; Maneerit 2003; Nikolaou 2017; Sato 2012; Singh 2005; Zyluk 2011); Aref 2014, Nikolaou 2017 and Singh 2005 did not provide data on baseline balance, rehabilitation and care providers; Chao 2009, Hansen 2017, Maneerit 2003 and Sato 2012 reported no information on rehabilitation or care providers, or both. Zyluk 2011 did not report any data about rehabilitation.
Effects of interventions
See: Summary of findings for the main comparison Open surgery versus steroid injection for treating trigger finger; Summary of findings 2 Percutaneous surgery versus steroid injection for treating trigger finger; Summary of findings 3 Open surgery versus steroid injection plus hyaluronic acid injection guided by ultrasound for treating trigger finger; Summary of findings 4 Percutaneous surgery plus steroid injection compared to steroid injection for trigger finger; Summary of findings 5 Percutaneous surgery versus open surgery for treating trigger finger; Summary of findings 6 Endoscopic surgery versus open surgery for treating trigger finger; Summary of findings 7 Open surgery by transverse incision of the skin about 2–3 mm distally from distal palmar crease compared to open surgery by longitudinal incision of the skin for trigger finger; Summary of findings 8 Open surgery by transverse incision of the skin in the distal palmar crease compared to open surgery by longitudinal incision of the skin for trigger finger; Summary of findings 9 Open surgery by transverse incision of the skin in the distal palmar crease compared to open surgery by transverse incision of the skin about 2–3 mm distally from distal palmar crease for trigger finger
We considered as comparison any surgical intervention versus another surgical intervention or versus any conservative intervention: open surgery versus steroid injection; percutaneous surgery versus steroid injection; open surgery versus steroid injection plus hyaluronic acid injection guided by ultrasound; percutaneous surgery plus steroid injection versus steroid injection; percutaneous surgery versus open surgery; endoscopic surgery versus open surgery; open surgery by transversal incision of the skin about 2–3 mm distally from distal palmar crease versus open surgery by longitudinal incision of the skin at the level of the A1‐pulley without crossing the distal palmar crease proximal; open surgery by transversal incision of the skin in the distal palmar crease versus open surgery by longitudinal incision of the skin at the level of the A1‐pulley without crossing the distal palmar crease proximal; and open surgery by transversal incision of the skin in the distal palmar crease versus open surgery by transversal incision of the skin about 2–3 mm distally from distal palmar crease. We considered as primary comparison 'open surgery versus steroid injection', because open surgery is the oldest surgical method used for the treatment of trigger finger, while the steroid injection is the least invasive method reported in the studies included.
We present all outcomes in the 'Summary of findings' tables (summary of findings Table for the main comparison; summary of findings Table 2; summary of findings Table 3; summary of findings Table 4; summary of findings Table 5; summary of findings Table 6; summary of findings Table 7; summary of findings Table 8; summary of findings Table 9).
Comparison 1: open surgery versus steroid injection
Two trials reported outcomes for the comparison of open surgery versus steroid injection (Hansen 2017; Sato 2012). Hansen 2017 performed the ultrasonic guided infiltration, while Sato 2012 performed infiltration without the use of ultrasound. The most relevant data regarding this comparison are shown in summary of findings Table for the main comparison.
Resolution of trigger finger
The combined analysis of the results of Hansen 2017 and Sato 2012 comparing the open surgery and steroid injection groups (after one or more injections) showed no differences between the two comparison groups (131/140 versus 80/130; RR 1.48, 95% CI 0.79 to 2.76; I² = 95%), although the two individual studies showed favourable individual results for open surgery but high heterogeneity due to lack of overlapping confidence intervals (see Analysis 1.1). Hansen 2017 had 12 participants (8 versus 4) lost to follow‐up and was considered as a resolution failure.
When the results were subgrouped by time periods (short, intermediate or long term) for exploratory purposes, the subgroup trials showed differences between groups (Chi² = 17.14, df = 2 (P = 0.0002), I² = 88.3%) (see Analysis 1.7) (Hansen 2017; Sato 2012). Hansen 2017 assessed the results comparing open surgery with short‐term infiltration and the results analysis showed no difference between groups (76/84 versus 68/81; RR 1.08, 95% CI 0.96 to 1.21); Sato 2012 reported intermediate‐term results and the data analysis showed differences in favour of the open surgery group when compared with steroid injections (56/56 versus 42/49; RR 1.17, 95% Cl 1.04 to 1.31); in the long‐term assessment the results analysis of Hansen 2017, comparing open surgery with infiltration, showed difference in favour of the open surgery group (75/84 versus 38/81; RR 1.90, 95% CI 1.49 to 2.43) (see Analysis 1.7).
Severity or incidence of pain
Hansen 2017 and Sato 2012 reported pain. Hansen 2017 assessed by a numerical rating scale from 1 to 10 (1 = no pain, and 10 = worst imaginable pain) and reported the median and interquartile range (IQR) before treatment and after three and 12 months follow‐up, but did not report the mean and standard deviation; the median in baseline was 6 (IQR = 5‐7) in both groups; no difference between groups was reported in Hansen 2017 at three months follow‐up, with median 1 (IQR = 1‐2) in the open surgery group and 1 (IQR 1‐1) in the steroid injection group; at 12 months follow‐up differences in favor of the open surgery group was reported in Hansen 2017, that found median 1 (IQR 1‐1) in the open surgery group and 3 (IQR = 1‐5) in the steroid injection group (P < 0.05). Analyses were realized using the median as an approximate for the mean, and the IQR to estimate an approximate standard deviations: the results' analyses of Hansen 2017 comparing open surgery and steroid injection groups showed no differences between the two comparison groups in short‐term (at three months follow‐up) (MD 0.00, 95% CI −0.23 to 0.23, 1 to 10‐point scale where 1 means no pain and 10 worst imaginable pain), but it was favourable to open surgery group in long‐term (at 12 months follow‐up) (MD ‐2.00, 95% CI −2.68 to ‐1.32), with clinically significant differences (Analysis 1.3).
Sato 2012 assessed the presence of pain in the palm of the hand after the procedure, and the results analysis showed significantly more participants feeling pain in the palm of the hand in the open surgery group than in the steroid injection group in short‐term follow‐up at one week (38/56 versus 9/49; RR 3.69, 95% CI 1.99 to 6.85), but no significant difference between groups was found in intermediate‐term follow‐up at six months (0/56 versus 4/49; RR 0.10, 95% CI 0.01 to 1.77) (Analysis 1.2).
Function or disability
No data about function or disability was assessed in Hansen 2017 or Sato 2012.
Participant‐reported treatment success or satisfaction
No data about patient satisfaction was assessed in Hansen 2017 or Sato 2012.
Recurrence of triggering
The pooled results analysis of Hansen 2017 and Sato 2012 showed a significant difference in favour of the open surgery group when compared with the steroid injection group at the end of follow‐up (8/140 versus 50/130; RR 0.17, 95% CI 0.09 to 0.33; Chi² = 0.59, df = 1 (P = 0.44); I² = 0% ) (see Analysis 1.4). Hansen 2017 had a loss of follow‐up of 12 participants (8 versus 4), which we considered as recurrence events.
When the results were subgrouped by time of outcome measurement (short, intermediate or long term) for exploratory purposes, no trial was short term in this comparison. One trial was intermediate term and marginal differences were identified in favour of the open surgery group (0/56 versus 7/49; RR 0.06, 95% CI 0.00 to 1.00) (see Analysis 1.8) (Sato 2012). In the long term assessment the results analysis of Hansen 2017 showed a significant difference in favour of the open surgery group (8/84 versus 43/81; RR 0.18, 95% CI 0.09 to 0.36) (see Analysis 1.8).
Adverse events
No significant differences between open surgery and steroid injection groups were noted in the combined results from Hansen 2017 and Sato 2012 for adverse events (18/140 versus 17/130; RR 1.02, 95% CI 0.57 to 1.84) (see Analysis 1.5). Twelve participants (8 versus 4) did not complete the follow‐up in Hansen 2017, and were considered as adverse events in the data analysis.
Analyses by types of adverse events indicated that no significant difference between groups was observed for infection (11/140 versus 4/130; RR 2.65, 95% CI 0.88 to 7.99); there was no tendon or pulley injury in both groups (0/56 versus 0/49; risk ratio could not be estimated); there was no significant difference in the groups for flare around procedure site (8/84 versus 15/81; RR 0.51, 95% CI 0.23 to 1.15) and for fat necrosis at the procedure site (8/84 versus 6/81; RR 1.29, 95% CI 0.47 to 3.54), but there was significant differences in favour of the steroid injection group for cutaneous discomfort around procedure site after 12 months (15/84 versus 4/81; RR 3.62, 95% CI 1.25 to 10.44) (see Analysis 1.5).
Neurovascular injury
Only one case of neurovascular injury was reported in the combined results of two studies (Hansen 2017; Sato 2012), which occurred in the open surgery group, however Hansen 2017 had a loss of follow‐up of 12 participants (8 versus 4), which we considered as neurovascular injury in the analysis. No statistically significant differences between the two groups were observed in the combined results analysis of Hansen 2017 and Sato 2012 (9/140 versus 4/130; RR 2.17, 95% CI 0.70 to 6.77) (see Analysis 1.6).
Comparison 2: percutaneous surgery versus steroid injection
Five studies reported outcomes comparing percutaneous surgery to steroid injection (Aref 2014; Chao 2009; Sato 2012; Singh 2005; Zyluk 2011). The most relevant information on the outcomes of this comparison is classified in summary of findings Table 2.
Resolution of trigger finger
Two studies assessed the resolution and the combined analysis of the results comparing the percutaneous surgery and steroid injection groups (after one or more injections) showed no differences between the two comparison groups in six to 12 months follow‐up (89/92 versus 54/99; RR 2.11, 95% CI 0.31 to 14.51; I² = 98%), although the two individual studies showed favourable individual results for percutaneous surgery but high heterogeneity due to lack of overlapping confidence intervals (see Analysis 2.1) (Chao 2009; Sato 2012). Chao 2009 had four participants (1 versus 3) lost to follow‐up and was considered as a resolution failure.
When the results were subgrouped by time periods (short, intermediate or long term) for exploratory purposes, the subgroup trial showed differences between groups (Chi² = 30.82, df = 2 (P < 0.00001), I² = 93.5%). Chao 2009 assessed the results comparing percutaneous surgery with short‐term infiltration and the results analysis showed differences in favour of the percutaneous surgery group (43/47 versus 21/50; RR 2.18, 95% CI 1.55 to 3.05). Sato 2012 reported intermediate‐term results and the data analysis showed differences in favour of the percutaneous surgery group when compared with steroid injections (45/45 versus 42/49; RR 1.16, 95% Cl 1.03 to 1.31). In the long‐term assessment the results analysis of Chao 2009, comparing percutaneous surgery with one or more infiltrations, showed difference in favour of the percutaneous surgery group (44/47 versus 12/50; RR 3.90, 95% CI 2.37 to 6.42) (see Analysis 2.7).
Severity or incidence of pain
Chao 2009, Sato 2012 and Zyluk 2011 reported pain. Two trials assessed pain using VAS score and the combined results' analysis showed no difference between groups in the short‐term (MD −1.80, 95% CI −5.72 to 2.12; I² = 99%, 0 to 10‐point scale where 0 means no pain and 10 severe pain) (see Analysis 2.2) (Chao 2009; Zyluk 2011); although no statistical difference was found between the groups, a decrease of 1.8 point in the VAS score could correspond to a clinical improvement in favour of percutaneous surgery. The study of Zyluk 2011 did not report the standard deviation, but was included in the meta‐analysis with the same standard deviation reported by Chao 2009, as foreseen in the protocol by Ventin 2014. Zyluk 2011 reported significantly less pain in the percutaneous surgery group in the intermediate term, although the differences between the VAS scores are not clinically significant (mean VAS score at pre‐treatment and six months were respectively 3.5 and 0.4 for the percutaneous surgery group and 3.9 and 1.3 for the injection group; the standard deviation and P value were not reported). Chao 2009 assessed pain using VAS score in the long term (one year) and the results' analysis was favourable to percutaneous surgery (MD ‐6.50, 95% CI ‐7.25 to −5.75, 0 to 10‐point scale), with clinically significant differences (see Analysis 2.2).
Sato 2012 assessed the presence of pain in the palm of the hand after the procedure and the results' analysis was favourable to the steroid injection group in short‐term follow‐up at one week (30/45 versus 9/49; RR 3.63, 95% CI 1.94 to 6.78); no significant difference between groups was found in the intermediate‐term follow‐up at six months (0/45 versus 4/49; RR 0.12, 95% CI 0.01 to 2.18) (see Analysis 2.3).
Function or disability
Function or disability was not measured by any instrument in Aref 2014, Chao 2009, Sato 2012, Singh 2005 or Zyluk 2011.
Participant‐reported treatment success or satisfaction
No trial reported data about patient satisfaction.
Recurrence of triggering
Five trials reported triggering recurrence and the analysis of the combined results showed no differences between groups (22/189 versus 40/203; RR 0.57, 95% CI 0.21 to 1.59; I² = 62%) (Aref 2014; Chao 2009; Sato 2012; Singh 2005; Zyluk 2011); two trials had a pooled loss of follow‐up of 24 participants (13 versus 11), which we considered as recurrence events (see Analysis 2.4) (Chao 2009; Zyluk 2011).
When the results' analysis was sub‐grouped for follow‐up, we observed no differences between the groups in the short term (12/58 versus 8/67; RR 1.73, 95% CI 0.76 to 3.94), in the intermediate term (12/103 versus 21/116; RR 0.37, 95% CI 0.02 to 5.50; I² = 73%) and in the long term (10/86 versus 19/87; RR 0.55; 95% CI 0.10 to 2.99; I² = 71%); the test for differences between subgroups showed no difference between the two interventions (Chi² = 2.30, df = 2 (P = 0.32), I² = 12.9%) (see Analysis 2.8).
Adverse events
The pooled results of five studies showed no statistically significant difference between the two groups in the analysis of total adverse events (26/189 versus 18/203; RR 1.58, 95% CI 0.91 to 2.75; I² = 0%) (Aref 2014; Chao 2009; Sato 2012; Singh 2005; Zyluk 2011); (see Analysis 2.5). Two studies had a total of 24 participants (13 versus 11) with follow‐up loss, which were considered as adverse events (Chao 2009; Zyluk 2011).
Analyses by kinds of adverse events indicated no differences between the groups for infection (1/92 versus 3/99; RR 0.35, 95% CI 0.04 to 3.29), partial loss of movement (23/97 versus 8/104; RR 3.09, 95% CI 0.87 to 10.97) and tendon or pulley injury (3/131 versus 3/136; RR 1.00, 95% CI 0.21 to 4.81). Dysaesthesia was reported only in the steroid injection group, but there were no differences between the two comparison groups (0/39 versus 4/37; RR 0.20, 95% CI 0.02 to 1.67), and also skin atrophy or hypopigmentation (0/25 versus 3/25; RR 0.14, 95% CI 0.01 to 2.63) (see Analysis 2.5).
Neurovascular injury
No neurovascular injury cases of the participants who completed the follow‐up were reported in the combined results of two studies (Chao 2009; Sato 2012), although four participants in the study of Chao 2009 did not complete the follow‐up and were considered as having neurovascular injury. The analysis of the combined data showed no difference between the two groups (1/92 versus 3/99; RR 0.35, 95% CI 0.04 to 3.29) (see Analysis 2.6).
Comparison 3: open surgery versus steroid injection plus hyaluronic acid injection guided by ultrasound
Only one trial reported the outcomes comparing open surgery to steroid injection plus ultrasound‐guided hyaluronic acid injection (Callegari 2011). The main information on this comparison is in summary of findings Table 3.
Resolution of trigger finger
The results' analysis of Callegari 2011 showed no significant difference between the two groups at the six‐month follow‐up (15/15 versus 14/15; RR 1.07, 95% CI 0.89 to 1.28) and at the one‐year follow‐up (15/15 versus 11/15; RR 1.35, 95% CI 0.98 to 1.85) (see Analysis 3.1).
Severity of pain
Callegari 2011 assessed pain using the VAS score (VAS score: 0 to 10 points, where 0 means no pain and 10 severe pain), which found no statistically significant differences between the two intermediate‐term groups (mean VAS in both groups was one point in six months and four points in the pre‐treatment). The results could not be analysed because the standard deviation of VAS was not reported. There was no clinically significant difference between the pre‐treatment groups and those with six months of follow‐up.
Function or disability
The DASH scores (DASH score: 0% to 100%, where 0% means no disability and 100% means the most severe disability) at six months (intermediate‐term), without a variance measure, were reported in Callegari 2011, which described a mean difference (MD) of 11% in the open surgery group and 13% in the injection group. The pre‐treatment DASH scores were 33% in the open surgery group and 31% in the injection group. There was no clinically significant difference between the pre‐treatment groups and with six months of follow‐up.
Participant‐reported treatment success or satisfaction
Callegari 2011 measured patient satisfaction using the scoring system SVAS (Satisfaction Visual Analogue Scale: 0 to 10 points, where 0 means totally unsatisfied and 10 completely satisfied), but did not report the standard deviation; an average difference of 0.2 was found (8.4 in the open surgery group versus 8.2 in the injection group) with three months of follow‐up and 0.4 (7.8 in open surgery group versus 7.4 in injection group) with six months of follow‐up. There was no clinically significant difference between the pre‐treatment groups and those with six months of follow‐up.
Recurrence of triggering
There was no significant difference between the two groups in the results analysis for recurrence of trigger finger at six months of follow‐up (0/15 versus 0/15; risk ratio could not be estimated) and at one year of follow‐up (0/15 versus 3/15; RR 0.14, 95% CI 0.01 to 2.55) in Callegari 2011 (see Analysis 3.2).
Adverse events
No statistically significant differences were observed between the open surgery and injection groups in the data analysis of the total adverse events in Callegari 2011 (3/15 versus 1/15; RR 3.00, 95% CI 0.35 to 25.68); analysis by type of adverse events indicated that algodystrophic syndrome occurred only in the open surgery group (1/15 versus 0/15; RR 3.00, 95% CI 0.13 to 68.26). The partial loss of movement was more common in the open surgery group (2/15 versus 1/15; RR 2.00, 95% CI 0.20 to 19.78) (see Analysis 3.3).
Neurovascular injury
No data about neurovascular injury was reported by Callegari 2011.
Comparison 4: percutaneous surgery plus steroid injection versus steroid injection
Only one study reported results comparing percutaneous surgery plus steroid injection versus steroid injection (Maneerit 2003). The most relevant data regarding the outcome of this comparison are grouped in summary of findings Table 4.
Resolution of trigger finger
Maneerit 2003 reported long‐term results comparing percutaneous surgery plus steroid injection versus one or more steroid injections, and the analysis of the results was favourable to the percutaneous surgery plus steroid injection group (59/66 versus 36/61; RR 1.51, 95% Cl 1.21 to 1.90) (see Analysis 4.1). Two participants (1 versus 1) did not complete follow‐up and were considered as resolution failure in the data analysis.
Severity of pain
In Maneerit 2003 no significant differences between the short‐term groups were found (mean VAS score zero to 10‐scale at two weeks was 0.4 versus 0.3, with pre‐treatment score of five in both groups; reported P > 0.05). Maneerit 2003 did not report the standard deviation, making it impossible to analyse the data. The difference of 0.1 point score between the groups is not a clinically significant difference.
Function or disability
No data about function or disability were assessed in Maneerit 2003.
Participant‐reported treatment success or satisfaction
No data about patient satisfaction were assessed in Maneerit 2003.
Recurrence of triggering
No data about recurrence of triggering were reported by Maneerit 2003.
Adverse events
The data analysis of all adverse events in Maneerit 2003 showed no significant differences between the groups (2/66 versus 2/61; RR 0.92, 95% CI 0.13 to 6.36) (see Analysis 4.2). Two participants (1 versus 1) did not complete the follow‐up and were considered as adverse events in the data analysis.
Analyses by kinds of adverse events did not differ between groups for infection (1/66 versus 2/61; RR 0.46, 95% CI 0.04 to 4.97) and partial loss of movement (2/66 versus 1/61; RR 1.85, 95% CI 0.17 to 19.87) (see Analysis 4.2). The test for subgroup differences showed no difference between the two groups (Chi² = 0.65, df = 1 (P = 0.42), I² = 0%) (see Analysis 4.2).
Neurovascular injury
No neurovascular injury was reported by Maneerit 2003 in participants who concluded the follow‐up but two participants (1 versus 1) did not complete follow‐up and were considered as having neurovascular injury in the results analysis; there were no statistical differences between the two comparison groups (1/66 versus 1/61; RR 0.92, 95% CI 0.06 to 14.46) (see Analysis 4.3).
Comparison 5: percutaneous surgery versus open surgery
Five studies reported data comparing percutaneous surgery versus open surgery (Bamroongshawgasame 2010; Dierks 2008; Gilberts 2001; Nikolaou 2017; Sato 2012). Nikolaou 2017 performed the percutaneous surgery guided by ultrasound, while in the other studies percutaneous surgery was performed without ultrasound visibility (Bamroongshawgasame 2010; Dierks 2008; Gilberts 2001; Sato 2012).The main information on the outcome of this comparison is in summary of findings Table 5.
Resolution of trigger finger
Pooled data from five trials showed no significant difference in overall resolution at endpoint between the two groups (213/215 versus 213/214; RR 1.00, 95% CI 0.97 to 1.02; Chi² = 1.60, df = 4 (P = 0.81); I² = 0% ) (see Analysis 5.1) (Bamroongshawgasame 2010; Dierks 2008; Gilberts 2001; Nikolaou 2017; Sato 2012).
When the results were sub‐grouped by time of outcome measurement (short, intermediate or long term) for exploratory purposes, four trials were short term and no statistically significant differences were identified between the two groups for resolution (168/170 versus 157/157; RR 1.00, 95% CI 0.97 to 1.02; Chi² = 1.56, df = 3 (P = 0.67); I² = 0%) (see Analysis 5.6) (Bamroongshawgasame 2010; Dierks 2008; Gilberts 2001; Nikolaou 2017). Only one trial was intermediate term and no statistically significant difference was identified between the two groups for resolution (45/45 versus 56/56; RR 1.00, 95% CI 0.96 to 1.04) (see Analysis 5.6) (Sato 2012). In this comparison no trial was long term.
Severity or incidence of pain
Five trials reported pain (Bamroongshawgasame 2010; Dierks 2008; Gilberts 2001; Nikolaou 2017; Sato 2012). Data from Bamroongshawgasame 2010 on treatment pain were reported incompletely and shown by figure; therefore the results of this trial were not entered into the meta‐analysis. The author reported no pain in both groups after six weeks.
The results' analysis of Dierks 2008 indicated no significant differences between percutaneous and open surgery groups at one week (MD 0.30, 95% CI −0.34 to 0.94; 1‐ to 6‐point scale) or 12 weeks (MD 0.00, 95% CI −0.52 to 0.52; 1‐ to 6‐point scale) (see Analysis 5.2). These differences are not clinically significant.
Gilberts 2001 assessed the mean duration of postoperative pain and reported 5.7 days (range 3 to 60) in the open surgery group and 3.1 days (range 0 to 21) in the percutaneous surgery group (P = 0.039). Nikolaou 2017 reported the mean time of analgesic use in days, which was 2.9 days in the open surgery group and 3.5 days in the group treated with percutaneous surgery (P > 0.05). Sato 2012 assessed the presence of pain in the palm of the hand after the procedure and the results' analysis showed no significant differences between the groups in the short term, after a week of follow‐up (30/45 versus 38/56; RR 0.98, 95% CI 0.75 to 1.29) (see Analysis 5.3). In the intermediate time, the results' analysis of Sato 2012 showed no difference between the two groups too, at six months of follow‐up (0/45 versus 0/56; risk ratio could not be estimated) (see Analysis 5.3).
Function or disability
Only Nikolaou 2017 reported data on function or disability of the hand, accessing the QuickDASH scores preoperatively and after the procedure, without a variance measure. The pre‐treatment QuickDASH scores were 43.2 in the open surgery group and 45.5 in the percutaneous surgery group; in the follow‐up after two, four and 12 weeks the QuickDASH scores were 8.2, 1.3 and 0 in the open surgery group, and 7.5, 0.5 and 0 in the percutaneous surgery group, respectively. There was no clinically significant difference between groups in all periods accessed (P > 0.05).
No data about function or disability was assessed in Bamroongshawgasame 2010, Dierks 2008, Gilberts 2001 or Sato 2012.
Participant‐reported treatment success or satisfaction
Only Bamroongshawgasame 2010 assessed patient satisfaction and reported inaccurately, through a graphic representation, that 100% of patients in both groups were satisfied after three weeks of treatment (80/80 versus 80/80).
Other four trials did not assess any data for this outcome (Dierks 2008; Gilberts 2001; Nikolaou 2017; Sato 2012).
Recurrence of triggering
Four trials reported the recurrence of trigger finger and the combined data from these studies showed no significant differences between the percutaneous and open surgery groups at the end of follow‐up (0/199 versus 1/198; RR 0.28, 0.01 to 6.83) (see Analysis 5.4) (Bamroongshawgasame 2010; Dierks 2008; Gilberts 2001; Sato 2012). When the studies were assessed for explanatory purposes, we observed that three trials did not show any cases of recurrence in both groups (0/145 versus 0/152) (Bamroongshawgasame 2010; Dierks 2008; Sato 2012). Only one trial reported the recurrence of triggering after two months in the open surgery group (0/54 versus 1/46) (Gilberts 2001). Bamroongshawgasame 2010, Dierks 2008 and Gilberts 2001 observed short‐term results, while Sato 2012 observed intermediate‐term results.
When the results were subgrouped by time of outcome measurement (short, intermediate or long‐term) for exploratory purposes, three trials were short‐term and no differences between the groups was observed (0/154 versus 1/142; RR 0.28, 95% CI 0.01 to 6.83) (Bamroongshawgasame 2010; Dierks 2008; Gilberts 2001). One trial was intermediate‐term and no differences was foud between groups (0/45 versus 0/56; risk ratio could not be estimated) (see Analysis 5.7) (Sato 2012). No trial was long‐term in this comparison.
No data about recurrence of triggering were assessed in Nikolaou 2017.
Adverse events
No significant differences between percutaneous and open surgery groups were noted in the combined results for adverse events from five trials (Bamroongshawgasame 2010; Dierks 2008; Gilberts 2001; Nikolaou 2017; Sato 2012), and no heterogeneity was observed (I² = 0%) (3/215 versus 3/214; RR 0.80, 95% CI 0.17 to 3.68) (see Analysis 5.5).
Analyses by types of adverse events indicated that in both treatment groups there was no infection (0/61 versus 0/72; risk ratio could not be estimated), no partial loss of movement (0/16 versus 0/16; risk ratio could not be estimated), as well as tendon or pulley injury (0/125 versus 0/136; risk ratio could not be estimated). There was swelling, inflammation or haematoma in both groups and no significant differences (2/74 versus 2/62; RR 0.80, 95% CI 0.12 to 5.30; Chi² = 0.76, df = 1 (P = 0.38); I² = 0%). Adherence only occurred in the open surgery group (0/54 versus 1/46; RR 0.28, 95% CI 0.01 to 6.83). Other adverse events not specified by an author occurred in the percutaneous surgery group (1/54 versus 0/46; RR 2.56, 95% CI 0.11 to 61.45) (see Analysis 5.5) (Gilberts 2001).
Neurovascular injury
Combined data from four trials reported no neurovascular injury in both groups (0/199 versus 0/198) (Bamroongshawgasame 2010; Dierks 2008; Gilberts 2001; Sato 2012).
No data about neurovascular injury was reported by Nikolaou 2017.
Comparison 6: endoscopic surgery versus open surgery
Only one study compared endoscopic surgery versus open surgery (Pegoli 2008). The relevant data on the main outcomes of this comparison are listed in summary of findings Table 6.
Resolution of trigger finger
The results' analysis of Pegoli 2008 indicated no significant differences in resolution between endoscopic and open surgery groups (114/114 versus 117/117; RR 1.00; 95% CI 0.98 to 1.02) (see Analysis 6.1).
Pain
Pegoli 2008 assessed the duration of pain, in days, and reported that the average pain time after the procedure was 23 days in the endoscopic surgery group and 45 days in the open surgery group.
Function or disability
No data about function or disability were assessed in Pegoli 2008.
Participant‐reported treatment success or satisfaction
No data about patient satisfaction were assessed in Pegoli 2008.
Recurrence of triggering
There were no cases of recurrence of triggering in either group (0/114 versus 0/117).
Adverse events
No significant differences between endoscopic and open surgery groups were noted in the results' analysis for all adverse events in Pegoli 2008, although a higher number of complications was reported in the endoscopic surgery group when compared with the open surgery group (8/114 versus 3/117; RR 2.74, 95% CI 0.74 to 10.06) (see Analysis 6.2). Pegoli 2008 assessed dysaesthesia and infection events and all of the adverse event cases reported corresponded to dysaesthesia, while no infection cases were observed in either group (see Analysis 6.2).
Neurovascular injury
Pegoli 2008 reported neurovascular injury only in the endoscopic surgery group and no significant differences between groups were noted in the results analysis (1/114 versus 0/117; RR 3.08, 95% CI 0.13 to 74.79) (see Analysis 6.3).
Comparison 7: open surgery by transverse incision of the skin about 2–3 mm distally from distal palmar crease versus open surgery by longitudinal incision of the skin at the level of the A1‐pulley without crossing the distal palmar crease proximal
Only one study compared open surgery by transverse incision of the skin about 2–3 mm distally from distal palmar crease versus open surgery by longitudinal incision of the skin at the level of the A1‐pulley without crossing the proximal distal palmar crease (Kloeters 2016).
Kloeters 2016 assessed data on function or disability of the hand by DASH score. No data on resolution of trigger finger, pain, patient satisfaction, recurrence, adverse events or neurovascular injury were assessed in the trial.
The DASH scores (DASH score: 0 to 100, where 0 means no disability and 100 means the most severe disability) and respective mean standard error at preoperative baseline, and at one, three and 12 months follow‐up were reported in Kloeters 2016. Analyzes of the results showed that although the baseline preoperative values of the DASH score were significantly lower in the open surgery group by transverse incision of the skin about 2–3 mm distally from distal palmar crease, no significant difference between the groups was observed at one (MD −1.50, 95% CI −19.19 to 16.19; 0‐ to 100‐point scale), three (MD −2.00, 95% CI −16.45 to 12.45; 0‐ to 100‐point scale) and 12 months follow‐up (MD −8.90, 95% CI −23.35 to 5.55; 0‐ to 100‐point scale) (see Analysis 7.1).
Comparison 8: open surgery by transverse incision of the skin in the distal palmar crease versus open surgery by longitudinal incision of the skin at the level of the A1‐pulley without crossing the distal palmar crease proximal
Only one study compared open surgery by transverse incision of the skin in the distal palmar crease versus open surgery by longitudinal incision of the skin at the level of the A1‐pulley without crossing the proximal distal palmar crease (Kloeters 2016).
Kloeters 2016 assessed data on function or disability of the hand by DASH score. No data regarding resolution of trigger finger, pain, patient satisfaction, recurrence, adverse events or neurovascular injury were assessed in the trial.
The DASH scores and respective standard error mean at preoperative baseline, and at one, three and 12 months follow‐up were reported in Kloeters 2016. The analyzes of the results showed that there was no significant difference between the two comparison groups in the follow‐up with one (MD 5.20, 95% CI −16.67 to 27.07; 0‐ to 100‐point scale), three (MD 1.60, 95% CI −15.27 to 18.47; 0‐ to 100‐point scale) and 12 months (MD 3.10, 95% CI −21.28 to 27.48; 0‐ to 100‐point scale) (see Analysis 8.1).
Comparison 9: open surgery by transverse incision of the skin in the distal palmar crease versus open surgery by transverse incision of the skin about 2–3 mm distally from distal palmar crease
Only one study compared open surgery by transverse incision of the skin in the distal palmar crease versus open surgery by transverse incision of the skin about 2–3 mm distally from distal palmar crease (Kloeters 2016).
Kloeters 2016 assessed data on function or disability of the hand by DASH score. No data regarding resolution of trigger finger, pain, patient satisfaction, recurrence, adverse events or neurovascular injury were assessed in the trial.
The DASH scores and respective standard error of the mean at preoperative baseline, and at one, three and 12 months follow‐up were reported in Kloeters 2016. The analyzes of the results showed that although the baseline preoperative values of the DASH score were significantly lower in the open surgery group by transverse incision of the skin about 2–3 mm distally from distal palmar crease, no significant difference between the groups was observed at one (MD 6.70, 95% CI −13.67 to 27.07; 0‐ to 100‐point scale), three (MD 3.60, 95% CI −12.84 to 20.04; 0‐ to 100‐point scale) and 12 months follow‐up (MD 12.00, 95% CI −8.84 to 32.84; 0‐ to 100‐point scale) (see Analysis 9.1).
Sensitivity analyses
Three quasi‐randomised trials were considered at high risk of selection bias (Aref 2014; Dierks 2008; Singh 2005). Five randomised trials were considered at unclear allocation concealment (Bamroongshawgasame 2010; Callegari 2011; Kloeters 2016; Maneerit 2003; Pegoli 2008). We were unable to perform the sensitivity analyses in Comparisons 3, 4, 6, 7, 8 and 9, since they corresponded to only one trial. In Comparison 1 (open surgery versus steroid injection) all studies (Hansen 2017; Sato 2012) were low risk of selection bias, and no change in the analyses was observed for all the outcomes analysed (resolution, pain, frequency of recurrence, adverse events and neurovascular injury) (see Analysis 1.1; Analysis 1.2; Analysis 1.3; Analysis 1.4; Analysis 1.5; Analysis 1.6). When we removed the studies with high or uncertain risk of bias in Comparison 2 (percutaneous surgery versus steroid injection) there was no change in the analyses for the outcomes of resolution, pain or neurovascular injury (see Analysis 2.1; Analysis 2.2; Analysis 2.3; Analysis 2.6). In the analysis of the recurrence outcome we observed that in the final assessment of follow‐up (six to 12 months) there were no significant differences between the two groups either in the analysis of all trials (RR 0.57, 95% CI 0.21 to 1.59), or in the analysis after removing Aref 2014 and Singh 2005 (RR 0.23, 95% CI 0.03 to 2.08) (see Analysis 2.4). We only found a change in the recurrence results in the long‐term subgroup (more than six months), which had initially shown no difference between groups (RR 0.55, 95% CI 0.10 to 2.99) and was then favourable to the percutaneous surgery group (RR 0.09, 95% CI 0.01 to 0.66), after removing the studies Aref 2014 and Singh 2005 (see Analysis 2.8.3). When we analysed the outcome of adverse events there were no result changes, which remained with no significant difference between groups, both in the analysis for total adverse events with all studies (RR 1.58, 95% CI 0.91 to 2.75), or after removing the studies Aref 2014 and Singh 2005 (RR 1.14, 95% CI 0.25 to 5.14) (see Analysis 2.5). In Comparison 5 (percutaneous surgery versus open surgery) the data analyses with all studies were similar to the analyses after the removal of studies with high or uncertain risk of bias (Bamroongshawgasame 2010; Dierks 2008), which remained with no differences between the comparison groups for all the outcomes analysed (resolution, pain, frequency of recurrence and adverse events) (see Analysis 5.1; Analysis 5.2; Analysis 5.3; Analysis 5.4; Analysis 5.5). The resolution at the end of treatment (two‐ to six‐months' follow‐up) with all studies included (RR 1.00, 95% CI 0.97 to 1.02) remained with no difference between groups after removing the studies Bamroongshawgasame 2010 and Dierks 2008 (RR 1.00, 95% CI 0.97 to 1.04) (see Analysis 5.1); the same outcome was observed for adverse events, which remained with no significant difference between groups in the analysis with all studies included (RR 0.80, 95% CI 0.17 to 3.68) and after removing the two studies (Bamroongshawgasame 2010; Dierks 2008) (RR 0.57, 95% CI 0.10 to 3.25) (see Analysis 5.5). The pain outcome was assessed by only one study and the outcome frequency of recurrence did not change (see Analysis 5.2; Analysis 5.3; Analysis 5.4).
We also investigated the effect of imputation of incomplete outcome data on the results. In Comparison 1 the outcome resolution continued with no significant differences between the two groups when the results between open surgery versus steroid injection were compared at the end of follow‐up (six to 12 months) for the best‐case scenario (RR 1.48, 95% CI 0.82 to 2.68) and for the worst‐case scenario (RR 1.48, 95% CI 0.79 to 2.76). No data loss was observed in the analyses of the incidence of pain on the palm of the hand. Hansen 2017 reported data about severity of pain and provided the median and the IQR, but they did not report the mean and standard deviation; the sensitivity analysis for data loss showed no change in the outcome for pain (1 to 10 scale), which remained with no significant difference between groups in a short follow‐up time (three months) as well as when we considered the results based on the median and IQR reported in Hansen 2017 (open surgery group: median 1, IQR 1 to 2; steroid injection group: mean 1, IQR 1 to 1; P > 0.05), as in the analyses of results using an approximate mean and an approximate SD (MD 0.00, 95% CI −0.23 to 0.23); there was no change in the results in the long term follow‐up (12 months), which remained favorable to the open surgery group as well as when we considered the results based on the median and IQR reported in Hansen 2017 (open surgery group: median 1, IQR 1 to 1; steroid injection group: mean 3, IQR 1 to 5; P < 0.05), as in the analyses of results that showed approximate mean and SD (MD ‐2.00, 95% CI −2.68 to ‐1.32). There was no change in the results for the outcome recurrence at endpoint (six to 12 months) which remained favourable to open surgery group in the worst‐case scenario (RR 0.17, 95% CI 0.09 to 0.33), and in the best‐case scenario (RR 0.03, 95% CI 0.00 to 0.19). There were no changes in the results of total adverse events, which remained unchanged between treatment groups at both the worst (RR 1.02, 95% CI 0.57 to 1.84) and best‐case scenario (RR 0.74, 95% CI 0.34 to 1.60). There were also no changes in the outcome results of neurovascular injury, which remained unchanged between groups in both the worst‐case scenario (RR 2.17, 95% CI 0.70 to 6.77), and best‐case scenario (RR 2.89, 95% CI 0.12 to 70.03). In Comparison 2 the outcome resolution continued with no significant differences between the two groups when the results between percutaneous surgery versus steroid injection were compared at the end of follow‐up (six months to one year) for the best‐case scenario (RR 1.91, 95% CI 0.42 to 8.63) and for the worst‐case scenario (RR 2.11, 95% CI 0.31 to 14.51). We observed a change in the pain outcome (VAS) in which the analysis with all studies included showed no difference between the two groups in the short term (MD −1.80, 95% CI −5.72 to 2.12), while after removing one study ― Zyluk 2011 ― that did not report the standard deviation, we observed that the result was then favourable to the percutaneous surgery group (MD −3.80, 95% CI −4.34 to −3.26). There was no change in the results for the outcome recurrence at endpoint (six to 12 months) which continued with no difference between the two groups in the worst‐case scenario (RR 0.57, 95% CI 0.21 to 1.59), and in the best‐case scenario (RR 0.30, 95% CI 0.07 to 1.39). The results also did not change for the outcome adverse events, which continued with no difference between the two groups in the worst‐case scenario (RR 1.58, 95% CI 0.91 to 2.75), and in the best‐case scenario (RR 1.43, 95% CI 0.68 to 2.99). Comparison 3 (open surgery versus steroid injection plus ultrasound‐guided hyaluronic acid injection) consisted of only one study, which assessed the outcomes pain (VAS), functional status of the hand (DASH) and patient satisfaction but did not report the standard deviations, and therefore the data could not be assessed (Callegari 2011). The sensitivity analysis for data loss in Comparison 4 (percutaneous surgery plus steroid injection versus steroid injection) showed no difference in the outcome resolution of symptoms after one or more injections, which remained favourable to treatment with percutaneous surgery in the worst‐case scenario (RR 1.51, 95% CI 1.21 to 1.90) and in the best‐case scenario (RR 1.50, 95% CI 1.21 to 1.86). There was also no change in total adverse events, which remained with no significant difference between groups in the worst‐case scenario (RR 0.92, 95% CI 0.13 to 6.36), and in the best‐case scenario (RR 0.92, 95% CI 0.06 to 14.46). The analysis of Comparison 5 (percutaneous surgery versus open surgery) showed data loss for the assessment of pain and patient satisfaction in the study of Bamroongshawgasame 2010, which reported these outcomes only through figures, with inaccurate values and without standard deviation data. Comparisons 6, 7, 8 and 9 had no data loss.
Discussion
Summary of main results
We included 14 single‐centre trials (eleven randomised and three quasi‐randomised), involving 1361 fingers in 1260 participants, which compared, with each other or with any other medical treatment, the effectiveness of different surgical techniques for the treatment of trigger finger. These 14 studies allowed nine comparisons: open surgery versus steroid injection (two trials), in which one of the studies used ultrasound to guide the application of corticosteroids, while the other made the injections without using ultrasound; percutaneous surgery versus steroid injection (five trials); open surgery versus steroid injection plus ultrasound‐guided hyaluronic acid injection (one trial); percutaneous surgery plus steroid injection versus steroid injection (one trial); percutaneous surgery versus open surgery (five trials), in which one of the studies used ultrasound to guide the percutaneous surgery, while the other four performed the procedure without using ultrasound; endoscopic surgery versus open surgery (one trial); open surgery by transverse incision of the skin about 2–3 mm distally from distal palmar crease versus open surgery by longitudinal incision of the skin at the level of the A1‐pulley without crossing the proximal distal palmar crease (one trial); open surgery by transverse incision of the skin in the distal palmar crease versus open surgery by longitudinal incision of the skin at the level of the A1‐pulley without the proximal crossing the distal palmar crease (one trial); and open surgery by transverse incision of the skin in the distal palmar crease versus open surgery by transverse incision of the skin about 2–3 mm distally from the distal palmar crease (one trial).
There are three ongoing studies (see Ongoing studies): NTR1135 compares open surgery versus steroid injection and they were recruiting participants at the time of writing this review; TCTR20140529001 compares percutaneous surgery with needle versus percutaneous surgery with probe scalpel and recruitment had not started; and TCTR20150416001 compares open surgery versus percutaneous surgery and recruitment had started at the time of writing this review.
In our global analysis comparing the different types of surgical treatment for trigger finger, we present the results divided into nine groups according to the type of comparison performed. When possible, we present the results divided into subgroups according to the elapsed time (short‐, intermediate‐ and long‐term); it was not possible to sub‐group the results according to the participants’ age or according to the presence or absence of comorbidities due to lack of data in the included studies.
We did not assess all of the evidence for all outcomes we considered as important in all of the possible comparisons, due to the lack of reporting of relevant outcomes in the studies; we could not carry out analysis for the outcome 'patient satisfaction'.
In Comparison 1, the very low quality evidence leaves us uncertain if open surgery results in improvement in the resolution of triggering when compared with one or more steroid application (see summary of findings Table for the main comparison). Low quality evidence indicates that open surgery may decrease triggering recurrence, although it may more painful. We are uncertain if there were any differences between treatments for adverse events and neurovascular injury due to the low number of events (see summary of findings Table for the main comparison). No studies measured hand function or patient satisfaction. We downgraded evidence due to risk of detection bias, imprecision and, for the outcome 'resolution', high heterogeneity too (see summary of findings Table for the main comparison).
In Comparison 2, the very low quality evidence leaves us uncertain if when compared with steroid application, percutaneous surgery results in improvement in the resolution of triggering, pain relief in the short term, increases adverse events or reduces recurrence rates (see summary of findings Table 2). Low quality evidence indicates we are also uncertain if there was any difference in the risk of neurovascular injury, due to the low number of events. No trials measured hand function or patient satisfaction. We downgraded evidence due to risk of bias, imprecision and, for some outcomes, high heterogeneity (see summary of findings Table 2).
The very low quality of evidence in Comparison 3 indicates we are uncertain if there is any difference in the resolution of triggering, recurrence or adverse events between open surgery treatment and steroid injection plus ultrasound‐guided hyaluronic acid injection (see summary of findings Table 3). Reporting bias due to partial publication made it impossible to analyze the data regarding pain relief, functional improvement of the hand or patient satisfaction, because the authors failed to report any measurement of variance (standard deviation, standard errors, P values, or confidence intervals). We were unable to assess if the surgical treatment had a greater risk of neurovascular injury as the study did not report this outcome. We downgraded evidence due to risk of bias (double downgrade) and imprecision (see summary of findings Table 3).
In Comparison 4, the very low quality of evidence of the study indicates that we are uncertain if percutaneous surgery plus steroid injection improves resolution of triggering, results in more adverse events or an increased risk of neurovascular injury when compared with steroid injection (see summary of findings Table 4). Reporting bias due to partial publication made it impossible to analyze the data regarding pain relief, because the authors failed to report any measurement of variance (standard deviation, standard errors, P values, or confidence intervals). The study did not report functional measures, recurrence of triggering or patient satisfaction. We downgraded evidence due to risk of bias (double downgrade) and imprecision (see summary of findings Table 4).
The very low to low quality of evidence in the studies in Comparison 5 indicates that we are uncertain if percutaneous surgery resolves triggering, improves pain, reduces recurrence, increases adverse events, or the risk of neurovascular injury when compared to open surgery (see summary of findings Table 5). Hand function and patient satisfaction were not reported in the studies. We downgraded evidence due to risk of bias (double downgrade) and, for some outcomes, imprecision (see summary of findings Table 5).
The very low quality of evidence in the studies in Comparison 6 indicates that we are uncertain if endoscopic surgery improves the resolution of triggering, decreases adverse events or the risk of neurovascular injury when compared to open surgery (see summary of findings Table 6). Pain relief, functional hand improvement, recurrence of triggering and patient satisfaction were not reported. We downgraded evidence was downgraded due to risk of bias (double downgrade) and imprecision (see summary of findings Table 6).
In Comparisons 7, 8 and 9, the very low quality of evidence analysis from a study comparing three different types of incision for open surgery treatment of the trigger finger indicated that it is uncertain if one of two types of transverse incision of the skin — on the distal palmar crease, or two to three millimeters distally from the distal palmar crease — improves hand function when compared to longitudinal incision of the skin, and also showed to be uncertain whether there is any difference in the function of the hand when the transverse incision of the skin in the distal palmar crease was compared with transverse incision of the skin about 2‐3 mm distally from the distal palmar crease (see summary of findings Table 7; summary of findings Table 8; summary of findings Table 9). The study did not report data on resolution, pain, patient satisfaction, recurrence of triggering, adverse events or neurovascular injury (see summary of findings Table 7; summary of findings Table 8; summary of findings Table 9). We downgraded evidence due to risk of bias (double downgrade) and imprecision.
Overall completeness and applicability of evidence
The best recent evidence on surgery for trigger finger was obtained from eleven randomised trials and three quasi‐randomised trials, which assessed only adult individuals with trigger finger (thumb or other fingers) at any stage of the disease, totalling 1361 events in 1260 participants. The effectiveness of different types of surgical treatment were compared and also compared with steroid infiltration, sub‐grouping the results according to the follow‐up time (short‐, intermediate‐ and long‐term). Studies in which ultrasound was used as a guide were analyzed in conjunction with studies in which the same procedure was performed without ultrasound visibility, provided that the comparison was between the same treatment methods (ex: open surgery versus ultrasound‐guided steroid injection and open surgery versus steroid injection were analyzed in the same comparison). We were unable to sub‐group the results according to the age of the participants or the presence of associated comorbidities, due to the lack of data in the included studies.
No study reported all the important outcomes of the review: 10 trials reported the resolution of triggering and eight assessed pain, although one trial assessed pain dichotomously and five trials reported the data incompletely about pain. Three trials evaluated functional status of the hand by validated instruments, but only one reported complete data. No study reported complete data about patient satisfaction; 10 studies assessed triggering recurrence. Thirteen studies reported adverse events and eight trials reported full details of neurovascular injury.
A limitation of this review is that the resolution of triggering, considered as the main primary outcome, was defined differently in the 10 studies that reported it, which can interfere in the interpretation of the analyses of this outcome.
Quality of the evidence
In this review, the evidence was found to be of very low to low quality for the results grouped in the nine possible comparisons, and this was due to methodological flaws such as inadequate or uncertain allocation concealment in most studies and the lack of blinding of the outcomes assessed in 13 of 14 studies. Additionally, the trials included did not report data according to the CONSORT statement (Moher 2001), and only three studies (Hansen 2017; Nikolaou 2017; Sato 2012) published a protocol, but in Nikolaou 2017 and Sato 2012 it was dated after the study was finished.
In Comparison 1 (open surgery versus steroid injection), the evidence found was of very low quality for the outcome 'resolution', justified by one downgrade due to methodological flaws related to the risk of detection bias in the studies included in this comparison, one downgrade for imprecision due to the small number of events, and one downgrade for inconsistency because of high heterogeneity. As for the outcomes 'pain', 'trigger recurrence', 'adverse events' and 'neurovascular injury' we obtained low quality evidence, justified by a downgrade due to methodological flaws related to the risk of detection bias in the studies included in this comparison and a downgrade due to uncertainty related to the small number of events. The degree of evidence for the outcomes 'hand function' and 'participant satisfaction' was not assessed due to the lack of relevant data in the two studies included in this comparison.
Very low quality evidence was found in Comparison 2 (percutaneous surgery versus steroid injection) for the outcomes 'resolution', 'pain', 'trigger recurrence' and 'adverse events', and the results of the outcomes 'resolution' and 'pain' received one downgrade due to the methodological flaws of the studies related to detection bias and selective reporting, one downgrade for imprecision due to the small number of events, and one downgrade for inconsistency because of high heterogeneity; the outcomes 'trigger recurrence' and 'adverse events' received two downgrades due to significant methodological flaws related to bias selection (two trials were quasi‐randomised), the presence of detection bias and selective reporting and one downgrade due to uncertainty related to the small number of events. It is also emphasized that the outcome 'trigger recurrence' also received a downgrade for inconsistency related to high heterogeneity. Low‐quality evidence was obtained for the outcome 'neurovascular injury' which was downgraded due to the methodological flaws in the studies related to detection bias and selective reporting, and downgraded for inaccuracy due to the small number of events. It was not possible to assess the degree of evidence for the outcomes 'hand function' and 'participant satisfaction' due to the lack of relevant data in the five studies included in this comparison.
In Comparison 3 (open surgery versus steroid injection plus hyaluronic acid injection guided by ultrasound) evidence of very low quality was found for the outcomes 'resolution', 'trigger recurrence' and 'adverse events', justified by a double downgrade due to significant methodological flaws of the study related to unclear selection bias, the presence of detection bias and selective reporting; a third downgrade was justified for uncertainty due to the small number of participants in this comparison. It was not possible to assess the degree of evidence for the outcomes 'pain', 'hand function', 'participant satisfaction' and 'neurovascular injury' due to the lack of relevant data in the only study included in this comparison.
Very low evidence was obtained in Comparison 4 (percutaneous surgery plus steroid injection versus steroid injection) for the outcomes 'resolution', 'adverse events' and 'neurovascular injury', due to a double downgrade for the methodological flaws of the studies related to unclear selection bias, detection bias and selective reporting, in addition to one downgrade for inconsistency due to the small number of events. It was not possible to assess the degree of evidence for the outcomes 'pain', 'hand function', 'participant satisfaction' and 'trigger recurrence' due to the lack of relevant data in the only study included in this comparison.
In the comparison between percutaneous surgery and open surgery (Comparison 5) we obtained low‐quality evidence for the outcome 'resolution' due to a double downgrade for methodological flaws of the studies related to selection bias, detection bias and selective reporting. As for the outcomes 'pain', 'recurrence of trigger finger', 'adverse events' and 'neurovascular injury' we obtained very low quality evidence, justified by a double downgrade due to the methodological flaws of the studies related to selection bias, detection bias and selective reporting and one downgrade for imprecision related to the small number events in the studies of this comparison. It was not possible to assess the degree of evidence for the outcomes 'hand function' and 'participant satisfaction' due to the lack of relevant data in the four studies included in this comparison.
We found very low quality evidence in Comparison 6 (endoscopic surgery versus open surgery) for the outcomes 'resolution', 'adverse events' and 'neurovascular injury' due to a double downgrade for the methodological flaws of the only study in this comparison, related to lack of clarity regarding selection bias, and the presence of detection bias and selective reporting, and one downgrade for imprecision due to the small number of events in the study. It was not possible to assess the degree of evidence for the outcomes 'pain', 'hand function', 'participant satisfaction' and 'trigger recurrence' due to the lack of relevant data in the only study included in this comparison.
Very low‐quality evidence was found in Comparisons 7 (open surgery by transverse incision of the skin about 2–3 mm distally from the distal palmar crease versus open surgery by longitudinal incision of the skin), 8 (open surgery by transverse incision of the skin in the distal palmar crease versus open surgery by longitudinal incision of the skin) and 9 (open surgery by transverse incision of the skin in the distal palmar crease versus open surgery by transverse incision of the skin about 2–3 mm distally from the distal palmar crease) for the outcome 'hand function' which was double downgraded due to the methodological flaws in the study related to selection bias, detection bias and selective reporting, and downgraded for inaccuracy due to the small number of events. It was not possible to assess the degree of evidence for the outcomes 'resolution', 'pain', 'participant satisfaction', 'trigger recurrence', 'adverse events' and 'neurovascular injury' due to the lack of relevant data in the only study included in these comparisons.
Potential biases in the review process
This review started with a systematic search for potential studies without any language restrictions, which included a manual search in conference proceedings and in published articles and review citations, as well as ongoing or recently completed research studies; however, it is possible that we have missed some relevant studies, but we underscore that we keep an open channel to contact the author (HFJ) for continuous updates.
We conducted direct e‐mail communication with all the authors of the articles included in the review in order to try to obtain relevant omitted data; however we received feedback from only one of the authors (Sato 2012), who informed us about the exact number of the thumbs, index, long, ring and little fingers included in the study.
Whenever possible we followed the methods in our protocol. The changes are described in Differences between protocol and review.
Agreements and disagreements with other studies or reviews
We found some narrative reviews (Akhtar 2005; Fowler 2013; Health Information 2013; McAuliffe 2010; Ryzewicz 2006); and two systematic reviews which reported surgical treatment for trigger finger in adults (Huisstede 2010; Wang 2013). Huisstede 2010 included randomised or quasi‐randomised clinical trials and one systematic review on steroid injections, while Wang 2013 included only randomised or quasi‐randomised clinical trials. Although our results and conclusions are in partial agreement with these two reviews, our conclusions are more comprehensive and our methodology consistently differs from these and other reviews.
Huisstede 2010 assessed seven studies (a systematic review and six RCTs or quasi‐RCTs) related to the subject of trigger finger and the data reported showed the outcomes 'pain', 'hand function' and 'recovery'; the systematic review and three RCTs only reported the comparisons related to treatment with infiltration (medication type, application site and number of applications). One study (Topper 1997) randomised the participants into three different types of surgery but changed all treatments during the procedure, performing the same surgery in all participants; thus, it was not characterized a randomised clinical trial (see Excluded studies). Two studies (Dierks 2008; Gilberts 2001), totalling 136 fingers, reported percutaneous surgery versus open surgery, but the authors did not perform quantitative analysis of the data in the review. Huisstede 2010 concludes that there is moderate evidence that steroid injection is effective in the short term (one to four weeks), but not effective in the long term, and that surgical treatment may be regarded as a definitive treatment choice, but there is still no evidence regarding which is the most effective method (percutaneous or open). However Huisstede 2010 based their findings on only two studies (Dierks 2008; Gilberts 2001), while we included five studies in the same comparison (percutaneous surgery versus open surgery) (Bamroongshawgasame 2010; Dierks 2008; Gilberts 2001; Nikolaou 2017; Sato 2012). The results of this review are in agreement with those published by Huisstede 2010, since our analyses indicate it was uncertain if percutaneous surgery improves resolution of trigger finger during the follow‐up of two to six months, with low‐quality evidence, when compared to open surgery; and it was uncertain if there is any difference between the percutaneous and open surgical methods in reducing pain intensity (follow‐up of one week), recurrence rate and risk of adverse events or neurovascular injury (follow‐up two to six months), with very low‐quality evidence. However there were methodological differences between the two reviews, since Huisstede 2010 carried out only one qualitative analysis of the data using the methodology described by Van Tulder 2003, while we not only carried out a qualitative but also quantitative analysis of the data (see Data and analyses), also highlighting the fact that the outcomes we regarded as relevant (satisfaction, recurrence, adverse events and neurovascular injury) were not assessed by Huisstede 2010.
Wang 2013 systematically assessed the effect of percutaneous surgery compared with open surgery or with steroid injection, basing the results on seven studies (six RCTs and one quasi‐RCT), totalling 676 participants (Bamroongshawgasame 2010; Chao 2009; Dierks 2008; Gilberts 2001; Maneerit 2003; Sato 2012; Zyluk 2011). Four studies were included in the analysis that compared percutaneous surgery versus steroid injection (Chao 2009; Maneerit 2003; Sato 2012; Zyluk 2011), which showed favourable results for the treatment with percutaneous surgery for the outcome 'failure of the treatment' (no resolution of the trigger after treatment or trigger relapse after temporary recovery with treatment), but there were no differences between groups in the assessment of complications. Four studies were included in the comparison analysis between percutaneous surgery versus open surgery (Bamroongshawgasame 2010; Dierks 2008; Gilberts 2001; Sato 2012), which showed no difference between percutaneous surgery versus open surgery in the frequency of failure and complications of the treatments. Although in the comparison between percutaneous surgery versus steroid injection our results for the outcome 'adverse events' were consistent with the results published by Wang 2013, there are several differences between the two reviews: while Wang 2013 analysed three studies — Chao 2009, Sato 2012 and Zyluk 2011 — that compared a single intervention in each group (percutaneous surgery versus steroid injection) in conjunction with the study of Maneerit 2003, which carried out co‐interventions in one of the comparison groups (analysing percutaneous surgery plus steroid injection versus steroid injection), we included five studies — Aref 2014, Chao 2009, Sato 2012, Singh 2005 and Zyluk 2011 — that assessed only a single intervention in each comparison group (percutaneous surgery versus steroid injection). In another comparison group we analysed separately the study of Maneerit 2003, because when one intervention is added to the other we can change the outcome of the procedure. Moreover, Wang 2013 assessed the data only after one infiltration application, while our assessment was after one or more application; our results showed it is uncertain if when compared with one or more applications of steroid injection, the percutaneous surgery promotes increased resolution and decreased recurrence rates, adverse events and neurovascular injury in the follow‐up of six to 12 months, and also in pain relief in the follow‐up of one month; moreover, the outcomes we considered as relevant (pain and functional status of the hand) were not assessed by Wang 2013. In the comparison between percutaneous surgery versus open surgery Wang 2013 found four studies — Bamroongshawgasame 2010, Dierks 2008, Gilberts 2001 and Sato 2012 —, while we included five trials (Bamroongshawgasame 2010; Dierks 2008; Gilberts 2001; Nikolaou 2017; Sato 2012), but our analysis obtained compatible results, also showing that it is uncertain if one of the surgical methods is better than the other method with regard to resolution, recurrence, adverse events and neurovascular injury, in the follow‐up of two to six months. Wang 2013 did not use any method to classify the evidence found, while we classified the evidence as low quality (resolution) and as very low‐quality (recurrence, adverse events and neurovascular injury), using the software GRADEpro GDT. Unlike our study, Wang 2013 did not assess studies that compared open surgery with steroid injection (with or without hyaluronic acid plus) or studies that compared other types of surgical treatments (e.g. endoscopic surgery) or different kinds of incision for open surgery. Our assessment of the risk of bias is less favourable than that assessed by Wang 2013, as this study used scores to assess the internal validity of the studies, which can yield questionable assessments (Detsky 1992), while we used the Cochrane 'Risk of bias' tool, which is more reliable (Higgins 2011a).
Risk of bias graph: review authors' judgements about each risk of bias item presented as percentages across all included studies.
Risk of bias summary: review authors' judgements about each risk of bias item for each included study.
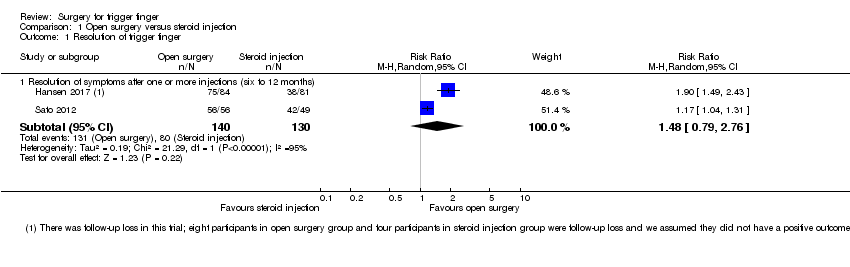
Comparison 1 Open surgery versus steroid injection, Outcome 1 Resolution of trigger finger.

Comparison 1 Open surgery versus steroid injection, Outcome 2 Pain on the palm of the hand.

Comparison 1 Open surgery versus steroid injection, Outcome 3 Pain (1 to 10 scale).

Comparison 1 Open surgery versus steroid injection, Outcome 4 Frequency of recurrence.

Comparison 1 Open surgery versus steroid injection, Outcome 5 Adverse events.

Comparison 1 Open surgery versus steroid injection, Outcome 6 Neurovascular injury.

Comparison 1 Open surgery versus steroid injection, Outcome 7 Subgroup analyses for resolution.
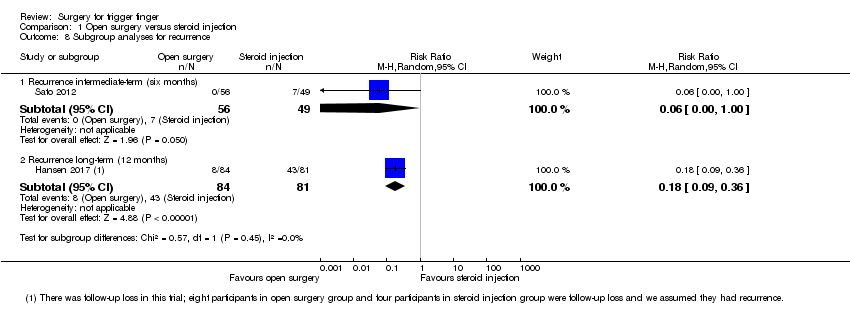
Comparison 1 Open surgery versus steroid injection, Outcome 8 Subgroup analyses for recurrence.

Comparison 2 Percutaneous surgery versus steroid injection, Outcome 1 Resolution of trigger finger.

Comparison 2 Percutaneous surgery versus steroid injection, Outcome 2 Pain (VAS: 0 to 10 scale).

Comparison 2 Percutaneous surgery versus steroid injection, Outcome 3 Pain on the palm of the hand.

Comparison 2 Percutaneous surgery versus steroid injection, Outcome 4 Frequency of recurrence.

Comparison 2 Percutaneous surgery versus steroid injection, Outcome 5 Adverse events.

Comparison 2 Percutaneous surgery versus steroid injection, Outcome 6 Neurovascular injury.

Comparison 2 Percutaneous surgery versus steroid injection, Outcome 7 Subgroup analyses for resolution.

Comparison 2 Percutaneous surgery versus steroid injection, Outcome 8 Subgroup analyses for recurrence.

Comparison 3 Open surgery versus steroid injection plus hyaluronic acid injection guided by ultrasound, Outcome 1 Resolution of trigger finger.

Comparison 3 Open surgery versus steroid injection plus hyaluronic acid injection guided by ultrasound, Outcome 2 Frequency of recurrence.
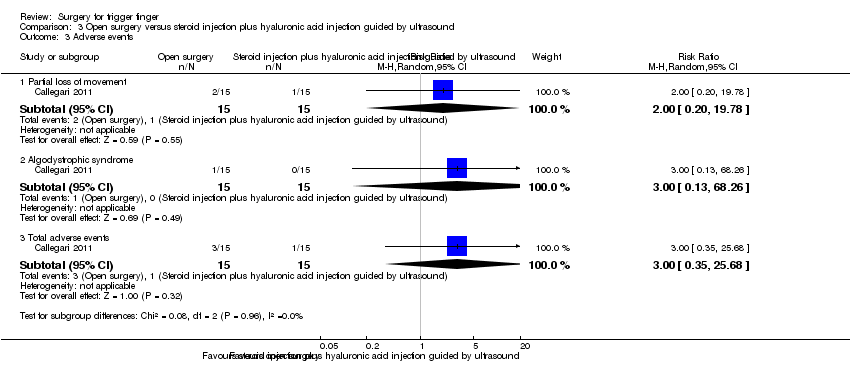
Comparison 3 Open surgery versus steroid injection plus hyaluronic acid injection guided by ultrasound, Outcome 3 Adverse events.

Comparison 4 Percutaneous surgery plus steroid injection versus steroid injection, Outcome 1 Resolution of trigger finger.

Comparison 4 Percutaneous surgery plus steroid injection versus steroid injection, Outcome 2 Adverse events.

Comparison 4 Percutaneous surgery plus steroid injection versus steroid injection, Outcome 3 Neurovascular injury.
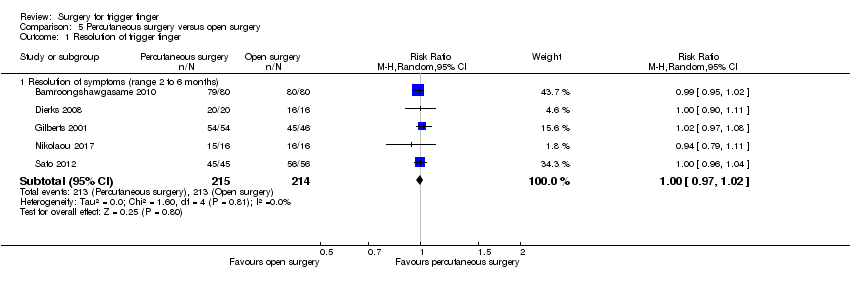
Comparison 5 Percutaneous surgery versus open surgery, Outcome 1 Resolution of trigger finger.

Comparison 5 Percutaneous surgery versus open surgery, Outcome 2 Pain (1 to 6 scale).
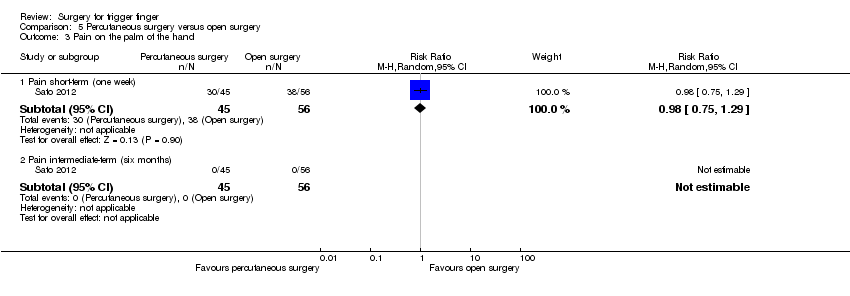
Comparison 5 Percutaneous surgery versus open surgery, Outcome 3 Pain on the palm of the hand.

Comparison 5 Percutaneous surgery versus open surgery, Outcome 4 Frequency of recurrence.

Comparison 5 Percutaneous surgery versus open surgery, Outcome 5 Adverse events.
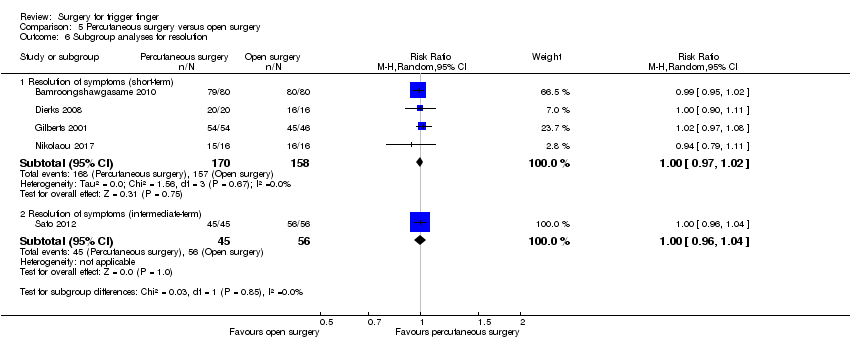
Comparison 5 Percutaneous surgery versus open surgery, Outcome 6 Subgroup analyses for resolution.

Comparison 5 Percutaneous surgery versus open surgery, Outcome 7 Subgroup analyses for recurrence.
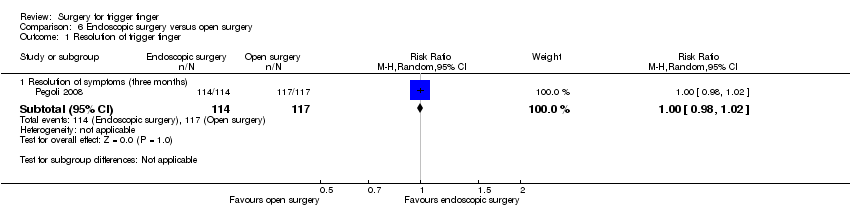
Comparison 6 Endoscopic surgery versus open surgery, Outcome 1 Resolution of trigger finger.
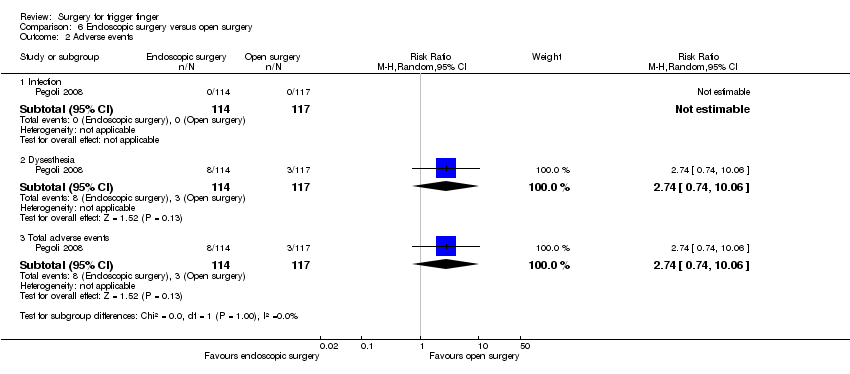
Comparison 6 Endoscopic surgery versus open surgery, Outcome 2 Adverse events.

Comparison 6 Endoscopic surgery versus open surgery, Outcome 3 Neurovascular injury.
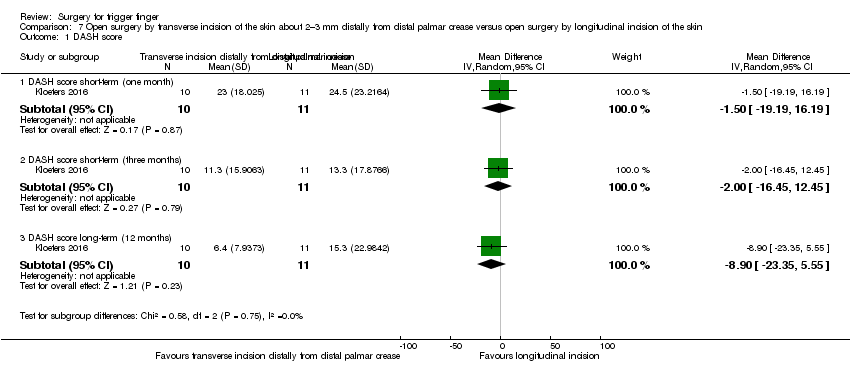
Comparison 7 Open surgery by transverse incision of the skin about 2–3 mm distally from distal palmar crease versus open surgery by longitudinal incision of the skin, Outcome 1 DASH score.
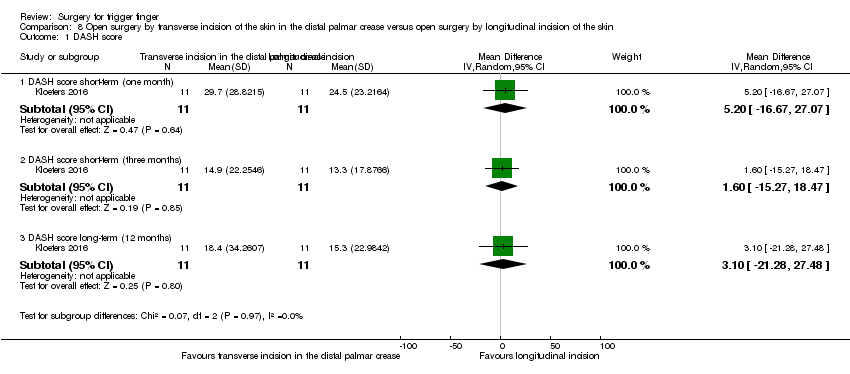
Comparison 8 Open surgery by transverse incision of the skin in the distal palmar crease versus open surgery by longitudinal incision of the skin, Outcome 1 DASH score.

Comparison 9 Open surgery by transverse incision of the skin in the distal palmar crease versus open surgery by transverse incision of the skin about 2–3 mm distally from distal palmar crease, Outcome 1 DASH score.
| Open surgery versus steroid injection for treating trigger finger | ||||||
| Patient or population: patients with trigger finger | ||||||
| Outcomes | Illustrative comparative risks* (95% CI) | Relative effect | No of Participants | Quality of the evidence | Comments | |
| Assumed risk | Corresponding risk | |||||
| Steroid injection | Open surgery | |||||
| Resolution of symptoms (after one or more injections) Follow‐up: 6 to 12 months | 615 per 1000 | 911 per 1000 | RR 1.48 | 270 | ⊕⊝⊝⊝ LOW 1,2,3 | Absolute difference: 28% more had resolution of symptoms with open surgery (2% fewer to 58% more); relative change: 48% more (21% fewer to 176% more). The NNTH n/a4. |
| Pain Proportion with pain on the palm of the hand Follow‐up: 1 week | 184 per 1000 | 678 per 1000 | RR 3.69 | 105 | ⊕⊕⊝⊝ | Absolute risk difference: 49% more people had pain with surgery (33% to 66% more), and the relative percent change translates to worsening of 269% (585% to 99% worse). The NNTH was 3 (95% CI 1 to 5). |
| Function Not measured | See comment | See comment | See comment | ‐ | See comment | Not measured in any trial. |
| Participant global assessment of success Not measured | See comment | See comment | See comment | ‐ | See comment | Not measured in any trial. |
| Recurrence Follow‐up: range 6 to 12 months | 385 per 1000 | 65 per 1000 | RR 0.17 | 270 | ⊕⊕⊝⊝ | Absolute risk difference: 29% fewer people had recurrence with open surgery (60% fewer to 3% more), and the relative percent change translates to improvement of 83% (67% to 91% better). NNTB 4 (95% CI 3 to 4). |
| Adverse events (infection, tendon or pulley injury, flare, cutaneous discomfort, fat necrosis) Follow‐up: range 6 to 12 months | 131 per 1000 | 133 per 1000 | RR 1.02 (0.57 to 1.84) | 270 | ⊕⊕⊝⊝ | Absolute risk difference: 0% (3% fewer to 4% more), and the relative percent change translates to worsening of 2% (43% better to 84% worse). The NNTH n/a4. |
| Neurovascular injury Follow‐up: range 6 to 12 months | 31 per 1000 | 67 per 1000 | RR 2.17 (0.7 to 6.77) | 270 | ⊕⊕⊝⊝ | Absolute risk difference: 2% more people had neurovascular injury with open surgery (6% fewer to 11% more); relative change: 117% more (30% fewer to 577% more). The NNTB n/a4. |
| *The basis for the assumed risk (e.g. the median control group risk across studies) is provided in footnotes. The corresponding risk (and its 95% confidence interval) is based on the assumed risk in the comparison group and the relative effect of the intervention (and its 95% CI). | ||||||
| GRADE Working Group grades of evidence | ||||||
| 1The trials had methodological flaws: risk of detection bias. 2Inconsistency: heterogeneity was high. 3Imprecision: the total number of events was small, or the 95% confidence interval includes both open surgery and steroid injection groups, or the 95% confidence interval includes both no clinical effect, and "appreciable benefit" in favour of the open surgery group. 4Number needed to treat to benefit (NNTB), or harm (NNTH) not applicable (n/a) when result is not statistically significant. NNT for dichotomous outcomes calculated using Cates NNT calculator (http://www.nntonline.net/visualrx/). NNT for continuous outcomes calculated using Wells Calculator (CMSG editorial office). | ||||||
| Percutaneous surgery versus steroid injection for treating trigger finger | ||||||
| Patient or population: patients with trigger finger | ||||||
| Outcomes | Illustrative comparative risks* (95% CI) | Relative effect | No of Participants | Quality of the evidence | Comments | |
| Assumed risk | Corresponding risk | |||||
| Steroid injection | Percutaneous surgery | |||||
| Resolution of symptoms (after 1 or more injections) Follow‐up: range 6 to 12 months | 545 per 1000 | 1000 per 1000 | RR 2.11 | 191 | ⊕⊝⊝⊝ | Absolute difference: 42% more had resolution of symptoms with percutaneous surgery (15% fewer to 98% more); relative change: 111% more (69% fewer to 1351% more) NNTB n/a4 |
| Pain (Visual analogue scale: Follow‐up: 1 month | The mean pain in the control group was 2.7 | The mean pain in the intervention group was 1.8 lower (5.72 lower to 2.12 higher) | 222 | ⊕⊝⊝⊝ | Absolute reduction: 18% pain reduction with percutaneous surgery (57% reduction to 21% increase), and the relative percent change translates to improvement of 25% (29% worse to 78% better)5. NNTB n/a4 Although a decrease of 1.8 in the VAS score (VAS: 0 to 10 points; where 0 mean no pain and 10 severe pain) may correspond to clinical improvement, there was no statistical difference between the groups and some participants' pain worsened). | |
| Function Not measured | See comment | See comment | ‐ | See comment | Not measured in any trial. | |
| Participant global assessment of success Not measured | See comment | See comment | ‐ | See comment | Not measured in any trial. | |
| Recurrence Follow‐up: range 6 to 12 months | 197 per 1000 | 112 per 1000 | RR 0.57 | 392 | ⊕⊝⊝⊝ | Absolute risk difference: 9% fewer people had recurrence with percutaneous surgery (19% fewer to 2% more), and the relative percent change translates to improvement of 43% (59% worse to 79% better). The NNTB n/a4. |
| Adverse events (infection, partial loss of movement, tendon or −0 injury, dysaesthesia, and skin atrophy or hypopigmentation) Follow‐up: range 6 to 12 months | 89 per 1000 | 140 per 1000 | RR 1.58 | 392 | ⊕⊝⊝⊝ | Absolute risk difference: 3% more people had adverse events with percutaneous surgery (5% fewer to 11% more), and the relative percent change translates to worsening of 58% (9% better to 175% worse). The NNTH n/a4. |
| Neurovascular injury Follow‐up: range 6 to 12 months | 30 per 1000 | 11 per 1000 (1 to 100) | RR 0.35 | 191 | ⊕⊕⊝⊝ | Absolute difference: fewer than 1% had neurovascular injury with percutaneous surgery (5% fewer to 3% more); relative change: 65% fewer (229% fewer to 96% more). The NNTB n/a4. |
| *The basis for the assumed risk (e.g. the median control group risk across studies) is provided in footnotes. The corresponding risk (and its 95% confidence interval) is based on the assumed risk in the comparison group and the relative effect of the intervention (and its 95% CI). | ||||||
| GRADE Working Group grades of evidence | ||||||
| 1The two trials had methodological flaws; they did not blind the outcome assessor, and they had selective reporting or unclear risk for incomplete outcome data. 2Inconsistency: heterogeneity was high. 3Imprecision: the total number of events was small, or the 95% confidence interval includes both percutaneous surgery and steroid injection groups, or the 95% confidence interval includes both no clinical effect, and "appreciable benefit" in favour of the steroid injection group. 4Number needed to treat for an additional beneficial outcome (NNTB), or for an additional harmful outcome (NNTH) not applicable (n/a) when result is not statistically significant. NNT for dichotomous outcomes calculated using Cates NNT calculator (www.nntonline.net/visualrx/). NNT for continuous outcomes calculated using Wells Calculator (CMSG editorial office). 5Basis for assumed risk was the mean baseline risk from the studies in the meta‐analysis. 6The five trials had methodological flaws; two were quasi‐randomised; four did not blind the outcome assessor and three had unclear risk for incomplete outcome data (one trial had follow‐up loss 17%, but 'intention to treat analysis' was not done; two trials did not report the follow‐up loss); four trials had selective reporting. We opted by double downgrade. | ||||||
| Open surgery versus steroid injection plus hyaluronic acid injection guided by ultrasound for treating trigger finger | ||||||
| Patient or population: patients with trigger finger | ||||||
| Outcomes | Illustrative comparative risks* (95% CI) | Relative effect | No of Participants | Quality of the evidence | Comments | |
| Assumed risk | Corresponding risk | |||||
| Steroid injection plus hyaluronic acid injection guided by ultrasound | Open surgery | |||||
| Resolution of symptoms Follow up: 12 months | 733 per 1000 | 990 per 1000 | RR 1.35 | 30 | ⊕⊝⊝⊝ | Absolute difference: 27% more had resolution of symptoms with open surgery (3% to 50% more); relative change: 35% more (2% fewer to 85% more). The NNTB n/a3. |
| Pain (short‐term) Not measured | See comment | See comment | ‐ | See comment | Pain in 6‐month follow‐up was assessed by visual analogue scale (VAS: 0 to 10 points; where 0 means no pain and 10 severe pain), but the authors failed to report any measurement of variance: standard deviation, standard errors, P values, or confidence intervals. The VAS score was 1 point (range 0 to 2) in open surgery group, and 1 point (range 0 to 3) in steroid plus hyaluronic acid injection group. This is not clinically significant. | |
| Function Not measured | See comment | See comment | ‐ | See comment | Functional status of the hand in follow‐up of 6 months was assessed by DASH score, but the authors failed to report any measurement of variance. The DASH score was 11% (range 7 to 16) in open surgery group and 13% (range 7 to 20) in steroid plus hyaluronic acid injection group; it translates to absolute improvement of 2% (DASH score: 0 to 100%; where 0 means no disability and 100 the most severe disability) in the open surgery group. This is not a clinically significant difference. | |
| Participant global assessment of success Not measured | See comment | See comment | ‐ | See comment | Patient satisfaction in follow‐up was at 6 months assessed by satisfaction visual analogue scale (SVAS: 0 to 10 points; where 0 means totally unsatisfied and 10 completely satisfied), but the authors failed to report any measurement of variance: standard deviation, standard errors, P values, or confidence intervals. The SVAS score was 7.8 points (3 to 10 range) in the open surgery group, and 7.4 points (2 to 10 range) in steroid plus hyaluronic acid injection group; it translates to absolute improvement of 0.4 point in the open surgery group. This is not a clinically significant difference. | |
| Recurrence Follow‐up: 12 months | 200 per 1000 | 28 per 1000 | RR 0.14 | 30 | ⊕⊝⊝⊝ | Absolute risk difference: 20% fewer people had recurrence with open surgery (42% fewer to 2% more), and the relative percent change translates to improvement of 86% (99% worse to 155% better). The NNTB n/a3. |
| Adverse events (partial loss of movement, algodystrophic syndrome) Follow‐up: 12 months | 67 per 1000 | 200 per 1000 | RR 3.00 | 30 | ⊕⊝⊝⊝ | Absolute risk difference: 13% more people had adverse events with open surgery (11% fewer to 37% more), and the relative percent change translates to worsening of 200% (2468% worse to 65% better). The NNTH n/a3. |
| Neurovascular injury Not measured | See comment | See comment | See comment | ‐ | See comment | Not measured in any trial. |
| *The basis for the assumed risk (e.g. the median control group risk across studies) is provided in footnotes. The corresponding risk (and its 95% confidence interval) is based on the assumed risk in the comparison group and the relative effect of the intervention (and its 95% CI). | ||||||
| GRADE Working Group grades of evidence | ||||||
| 1The trial had methodological flaws; it did not describe how random sequence generation was created and whether allocation concealment was done; the outcome assessor was not blinded, and it had selective reporting. We opted by double downgrade. 2Imprecision: the total number of events was small, or the 95% confidence interval includes both no clinical effect, and "appreciable benefit" in favour of the open surgery group, or the 95% confidence interval includes both open surgery and steroid injection plus hyaluronic acid injection groups. 3Number needed to treat for an additional beneficial outcome (NNTB), or for an additional harmful outcome (NNTH) not applicable (n/a) when result is not statistically significant. NNT for dichotomous outcomes calculated using Cates NNT calculator (www.nntonline.net/visualrx/). NNT for continuous outcomes calculated using Wells Calculator (CMSG editorial office). | ||||||
| Percutaneous surgery plus steroid injection versus steroid injection for treating trigger finger | ||||||
| Patient or population: patients with trigger finger | ||||||
| Outcomes | Illustrative comparative risks* (95% CI) | Relative effect | No of Participants | Quality of the evidence | Comments | |
| Assumed risk | Corresponding risk | |||||
| Steroid injection | Percutaneous surgery plus steroid injection | |||||
| Resolution of symptoms (after 1 or more injections) Follow up: range 6 to 42 months | 590 per 1000 | 891 per 1000 | RR 1.51 | 127 | ⊕⊝⊝⊝ | Absolute difference: 30% more had resolution of symptoms with percutaneous surgery plus steroid injection (16% to 45% more); relative change: 51% more (21% to 90% more). NNTB 4 (95% CI 3 to 6). |
| Pain (short‐term) Not measured | See comment | See comment | See comment | ‐ | See comment | Pain in follow‐up of 2 weeks was assessed by visual analogue scale (VAS: 0 to 10 points; where 0 means no pain and 10 severe pain), but the authors failed to report any measurement of variance: standard deviation, standard errors, P values, or confidence intervals. The VAS score was 0.4 point in percutaneous surgery plus steroid injection group, and 0.3 point in steroid injection group; it translates to absolute worsening of 0.1 point in the percutaneous surgery plus steroid injection group. This is not a clinically significant difference. |
| Function Not measured | See comment | See comment | See comment | ‐ | See comment | Not measured in any trial. |
| Participant global assessment of success Not measured | See comment | See comment | See comment | ‐ | See comment | Not measured in any trial. |
| Recurrence Not measured | See comment | See comment | See comment | ‐ | See comment | Not measured in any trial. |
| Adverse events (infection, partial loss of movement) Follow‐up: range 6 to 42 months | 33 per 1000 | 30 per 1000 | RR 0.92 | 127 (1 RCT) | ⊕⊝⊝⊝ | Absolute risk difference: 0% (6% fewer to 6% more); relative percentage change: 8% fewer (536% fewer to 87% more). The NNTB n/a3. |
| Neurovascular injury Follow‐up: range 6 to 42 months | 16 per 1000 | 15 per 1000 | RR 0.92 | 127 | ⊕⊝⊝⊝ | Absolute risk difference: 0% (4% fewer to 4% more); relative percentage change: 8% fewer (1346% fewer to 94% more). The NNTB n/a3. |
| *The basis for the assumed risk (e.g. the median control group risk across studies) is provided in footnotes. The corresponding risk (and its 95% confidence interval) is based on the assumed risk in the comparison group and the relative effect of the intervention (and its 95% CI). | ||||||
| GRADE Working Group grades of evidence | ||||||
| 1The trial had methodological flaws; it did not describe how random sequence generation was created and whether allocation concealment was done; the outcome assessor was not blinded and it had selective reporting. We opted by double downgrade. 2Imprecision: the total number of events was small, or the 95% confidence interval includes both percutaneous surgery plus steroid injection, and steroid injection groups. 3Number needed to treat to benefit (NNTB), or harm (NNTH) not applicable (n/a) when result is not statistically significant. NNT for dichotomous outcomes calculated using Cates NNT calculator (http://www.nntonline.net/visualrx/). NNT for continuous outcomes calculated using Wells Calculator (CMSG editorial office). | ||||||
| Percutaneous surgery versus open surgery for treating trigger finger | ||||||
| Patient or population: patients with trigger finger | ||||||
| Outcomes | Illustrative comparative risks* (95% CI) | Relative effect | No of Participants | Quality of the evidence | Comments | |
| Assumed risk | Corresponding risk | |||||
| Open surgery | Percutaneous surgery | |||||
| Resolution of symptoms Follow‐up: range 2 to 6 months | 995 per 1000 | 995 per 1000 | RR 1.00 | 429 | ⊕⊕⊝⊝ | Absolute risk difference: 0% (3% fewer to 2% more); relative percentage change: 0% (3% fewer to 2% more). NNTB n/a2. |
| Pain (1 to 6 scale) Follow‐up: 1 week | The mean pain short term (1 to 6 scale) in the control group was 2.5 | The mean pain short term (1 to 6 scale) in the intervention group was 0.3 higher (0.34 lower to 0.94 higher) | ‐ | 36 | ⊕⊝⊝⊝ | Absolute risk difference: 6% increase in pain with percutaneous surgery (7% reduction to 19% increase), and the relative percent change translates to worsening of 7% (22% worse to 8% better)5. NNTH n/a2. The difference of 0.3 points in the pain score (pain score: 1 to 6 points; where 1 means no pain and 6 extreme pain) is not clinically significant. |
| Function Not measured | See comment | See comment | See comment | ‐ | See comment | Not measured in any trial. |
| Participant global assessment of success Not measured | See comment | See comment | See comment | ‐ | See comment | Not measured in any trial. |
| Recurrence Follow‐up: range 2 to 6 months | 5 per 1000 | 1 per 1000 | RR 0.28 | 397 | ⊕⊕⊝⊝ | Absolute risk difference: 0% (2% fewer to 2% more); relative percentage change: 72% fewer (583% fewer to 99% more). The NNTB n/a2. |
| Adverse events (infection, partial loss of movement, tendon or pulley injury, oedema or inflammation or hematoma, adherence) Follow‐up: range 2 to 6 months | 14 per 1000 | 11 per 1000 | RR 0.80 | 429 | ⊕⊝⊝⊝ | Absolute risk difference: 0% (2% fewer to 2% more); relative percentage change: 20% fewer (268% fewer to 83% more). The NNTB n/a2. |
| Neurovascular injury Follow‐up: range 2 to 6 months | 0 per 1000 | 0 per 1000 | Could not be estimated | 397 | ⊕⊝⊝⊝ | There was no injury in both groups. |
| *The basis for the assumed risk (e.g. the median control group risk across studies) is provided in footnotes. The corresponding risk (and its 95% confidence interval) is based on the assumed risk in the comparison group and the relative effect of the intervention (and its 95% CI). | ||||||
| GRADE Working Group grades of evidence | ||||||
| 1All five trials had methodological flaws; one was quasi‐randomised; three had adequate concealed treatment allocation, and one did not describe how this allocation concealment was done; the subjective outcomes assessor was blinded in one, and no trial blinded the objective outcomes assessor; selective reporting was observed in three trials. We choe to double downgrade. 2Number needed to treat to benefit (NNTB), or harm (NNTH) not applicable (n/a) when result is not statistically significant. NNT for dichotomous outcomes calculated using Cates NNT calculator (www.nntonline.net/visualrx/). NNT for continuous outcomes calculated using Wells Calculator (CMSG editorial office). 3This quasi‐randomised trial had bias in the random sequence generation and allocation concealment; the outcome assessor was not blinded, and it had selective reporting. We opted by double downgrade. 4Imprecision: the total number of events was small, or the 95% confidence interval includes both no clinical effect and "appreciable benefit" in favour of the open surgery group, or the 95% confidence interval includes both percutaneous and open surgery. 5Basis for assumed risk was the mean baseline risk from the study in the meta‐analysis. 6 The four trials had methodological flaws; one was quasi‐randomised; only two had adequate concealed treatment allocation, and one did not describe how this allocation concealment was done; the outcome assessor was not blinded and three had selective reporting in the trial. We opted by double downgrade. | ||||||
| Endoscopic surgery versus open surgery for treating trigger finger | ||||||
| Patient or population: patients with trigger finger | ||||||
| Outcomes | Illustrative comparative risks* (95% CI) | Relative effect | No of Participants | Quality of the evidence | Comments | |
| Assumed risk | Corresponding risk | |||||
| Open surgery | Endoscopic surgery | |||||
| Resolution of symptoms Follow‐up: 3 months | 1000 per 1000 | 1000 per 1000 | RR 1.00 | 231 | ⊕⊝⊝⊝ | Absolute risk difference: 0% (2% fewer to 2% more); relative percentage change: 0% (2% fewer to 2% more).The NNTB n/a3. |
| Pain (short‐term) Not measured | See comment | See comment | See comment | ‐ | See comment | Not measured in any trial. |
| Function Not measured | See comment | See comment | See comment | ‐ | See comment | Not measured in any trial. |
| Participant global assessment of success Not measured | See comment | See comment | See comment | ‐ | See comment | Not measured in any trial. |
| Recurrence Not measured | See comment | See comment | See comment | ‐ | See comment | Not measured in any trial. |
| Adverse events (infection, dysaesthesia) Follow‐up: 3 months | 26 per 1000 | 70 per 1000 | RR 2.74 | 231 | ⊕⊝⊝⊝ | Absolute risk difference: 4% more people had adverse events with endoscopic surgery (1% fewer to 10% more), and the relative percent change translates to worsening of 174% (906% worse to 26% better). The NNTH n/a3. |
| Neurovascular injury Follow‐up: 3 months | 0 per 1000 | 0 per 1000 | RR 3.08 | 231 | ⊕⊝⊝⊝ | Absolute difference: 1% more had neurovascular injury with endoscopic surgery (2% fewer to 3% more); relative change: 208% more (87% fewer to 7379% more). The NNTH n/a3. |
| *The basis for the assumed risk (e.g. the median control group risk across studies) is provided in footnotes. The corresponding risk (and its 95% confidence interval) is based on the assumed risk in the comparison group and the relative effect of the intervention (and its 95% CI). | ||||||
| GRADE Working Group grades of evidence | ||||||
| 1The trial had methodological flaws; the authors did not describe how randomisation sequence was created and whether allocation concealment was done; the outcome assessor was not blinded and the trial had selective reporting. We chose to double downgrade. 2Imprecision: the total number of events was small, or the 95% confidence interval includes both open surgery and endoscopic surgery groups. 3Number needed to treat for an additional beneficial outcome (NNTB), or for an additional harmful outcome (NNTH) not applicable (n/a) when result is not statistically significant. NNT for dichotomous outcomes calculated using Cates NNT calculator (www.nntonline.net/visualrx/). NNT for continuous outcomes calculated using Wells Calculator (CMSG editorial office). | ||||||
| Open surgery by transverse incision of the skin about 2–3 mm distally from distal palmar crease compared to open surgery by longitudinal incision of the skin for trigger finger | ||||||
| Patient or population: patients with trigger finger | ||||||
| Outcomes | Illustrative comparative risks* (95% CI) | Relative effect | № of participants | Quality of the evidence | Comments | |
| Assumed risk | Corresponding risk | |||||
| Open surgery by longitudinal incision of the skin | Open surgery by transverse incision of the skin about 2–3 mm distally from distal palmar crease | |||||
| Resolution of symptoms Not measured | See comment | See comment | ‐ | See comment | Not measured in any trial. | |
| Pain (short‐term) Not measured | See comment | See comment | ‐ | See comment | Not measured in any trial. | |
| Function (DASH score: 0 to 100 points) Follow‐up: 12 months | The mean DASH score in the control group was 15.3 | The mean DASH score in the intervention group was 8.9 lower (23.35 lower to 5.55 higher) | ‐ | 21 | ⊕⊝⊝⊝ | Absolute risk difference: 8.9% increase in hand function with open surgery by transverse incision of the skin about 2–3 mm distally from the distal palmar crease (23.35% increase to 5.55% reduction), and the relative percentage change translates to improvement of 21.7% (13.54% worse to 56.95% better)3. NNTH n/a4. The difference of 8.9 points in the DASH score (DASH: 0 to 100 points; where 0 means no disability and 100 means the most severe disability) is not clinically significant. |
| Participant global assessment of success Not measured | See comment | See comment | ‐ | See comment | Not measured in any trial. | |
| Recurrence Not measured | See comment | See comment | ‐ | See comment | Not measured in any trial. | |
| Adverse events Not measured | See comment | See comment | ‐ | See comment | Not measured in any trial. | |
| Neurovascular injury Not measured | See comment | See comment | ‐ | See comment | Not measured in any trial. | |
| *The risk in the intervention group (and its 95% confidence interval) is based on the assumed risk in the comparison group and the relative effect of the intervention (and its 95% CI). | ||||||
| GRADE Working Group grades of evidence | ||||||
| 1 The trial had methodological flaws; the authors did not describe how randomisation sequence was created and whether allocation concealment was done; the outcome assessor was not blinded and the trial had selective reporting. We opted by double downgrade. 2 Imprecision: the total number of events was small, or the 95% confidence interval includes both groups (transverse incision of the skin about 2–3 mm distally from distal palmar crease and longitudinal incision of the skin). 3Basis for assumed risk was the mean baseline risk from the study in the meta‐analysis. 4Number needed to treat to benefit (NNTB), or harm (NNTH) not applicable (n/a) when result is not statistically significant. NNT for dichotomous outcomes calculated using Cates NNT calculator (www.nntonline.net/visualrx/). NNT for continuous outcomes calculated using Wells Calculator (CMSG editorial office). | ||||||
| Open surgery by transverse incision of the skin in the distal palmar crease compared to open surgery by longitudinal incision of the skin for trigger finger | ||||||
| Patient or population: patients with trigger finger | ||||||
| Outcomes | Illustrative comparative risks* (95% CI) | Relative effect | № of participants | Quality of the evidence | Comments | |
| Assumed risk | Corresponding risk | |||||
| Open surgery by longitudinal incision of the skin | Open surgery by transverse incision of the skin in the distal palmar crease | |||||
| Resolution of symptoms Not measured | See comment | See comment | ‐ | See comment | Not measured in any trial. | |
| Pain (short‐term) Not measured | See comment | See comment | ‐ | See comment | Not measured in any trial. | |
| Function (DASH score: 0 to 100 points) Follow‐up: 12 months | The mean DASH score in the control group was 15.3 | The mean DASH score in the intervention group was 3.1 higher (21.28 lower to 27.48 higher) | ‐ | 22 | ⊕⊝⊝⊝ | Absolute reduction: 3.1% function reduction with open surgery by transverse incision of the skin in the distal palmar crease (27.48% reduction to 21.28% increase), and the relative percent change translates to worsening of 7.56% (67.02% worse to 51.9% better)3. NNTB n/a4. The difference of 3.1 points in the DASH score (DASH: 0 to 100 points; where 0 means no disability and 100 means the most severe disability) is not clinically significant. |
| Participant global assessment of success Not measured | See comment | See comment | Not estimable | ‐ | See comment | Not measured in any trial. |
| Recurrence Not measured | See comment | See comment | Not estimable | ‐ | See comment | Not measured in any trial. |
| Adverse events Not measured | See comment | See comment | Not estimable | ‐ | See comment | Not measured in any trial. |
| Neurovascular injury Not measured | See comment | See comment | Not estimable | ‐ | See comment | Not measured in any trial. |
| *The risk in the intervention group (and its 95% confidence interval) is based on the assumed risk in the comparison group and the relative effect of the intervention (and its 95% CI). | ||||||
| GRADE Working Group grades of evidence | ||||||
| 1 The trial had methodological flaws; the authors did not describe how randomisation sequence was created and whether allocation concealment was done; the outcome assessor was not blinded and the trial had selective reporting. We chose to double downgrade. 2 Imprecision: the total number of events was small, or the 95% confidence interval includes both groups (transverse incision of the skin in the distal palmar crease and longitudinal incision of the skin). 3Basis for assumed risk was the mean baseline risk from the study in the meta‐analysis. 4Number needed to treat to benefit (NNTB), or harm (NNTH) not applicable (n/a) when result is not statistically significant. NNT for dichotomous outcomes calculated using Cates NNT calculator (www.nntonline.net/visualrx/). NNT for continuous outcomes calculated using Wells Calculator (CMSG editorial office). | ||||||
| Open surgery by transverse incision of the skin in the distal palmar crease compared to open surgery by transverse incision of the skin about 2–3 mm distally from distal palmar crease for trigger finger | ||||||
| Patient or population: patients with trigger finger | ||||||
| Outcomes | Illustrative comparative risks* (95% CI) | Relative effect | № of participants | Quality of the evidence | Comments | |
| Assumed risk | Corresponding risk | |||||
| Open surgery by transverse incision of the skin about 2–3 mm distally from distal palmar crease | Open surgery by transverse incision of the skin in the distal palmar crease | |||||
| Resolution of symptoms Not measured | See comment | See comment | ‐ | See comment | Not measured in any trial. | |
| Pain (short‐term) Not measured | See comment | See comment | ‐ | See comment | Not measured in any trial. | |
| Function (DASH score: 0 to 100 points) Follow‐up: 12 months | The mean DASH score in the control group was 6.4 | The mean DASH score in the intervention group was 12 higher | ‐ | 21 | ⊕⊝⊝⊝ | Absolute risk difference: 12% decrease in function with open surgery by transverse incision of the skin in the distal palmar crease (32.84% reduction to 8.84% increase), and the relative percentage change translates to worsening of 61.22% (167.55% worse to 45.1% better)3. NNTH n/a4. Although an increase of 12 in the DASH score (DASH: 0 to 100 points; where 0 means no disability and 100 means the most severe disability) may correspond to clinical worsening, there was no statistical difference between the groups and some participants' hand function improved). |
| Participant global assessment of success Not measured | See comment | See comment | ‐ | See comment | Not measured in any trial. | |
| Recurrence Not measured | See comment | See comment | ‐ | See comment | Not measured in any trial. | |
| Adverse events Not measured | See comment | See comment | ‐ | See comment | Not measured in any trial. | |
| Neurovascular injury Not measured | See comment | See comment | ‐ | See comment | Not measured in any trial. | |
| *The risk in the intervention group (and its 95% confidence interval) is based on the assumed risk in the comparison group and the relative effect of the intervention (and its 95% CI). | ||||||
| GRADE Working Group grades of evidence | ||||||
| 1 The trial had methodological flaws; the authors did not describe how randomisation sequence was created and whether allocation concealment was done; the outcome assessor was not blinded and the trial had selective reporting. We chose to double downgrade. 2 Imprecision: the total number of events was small, or the 95% confidence interval includes both groups (transverse incision of the skin in the distal palmar crease and transverse incision of the skin about 2–3 mm distally from distal palmar crease). 3Basis for assumed risk was the mean baseline risk from the study in the meta‐analysis. 4Number needed to treat to benefit (NNTB), or harm (NNTH) not applicable (n/a) when result is not statistically significant. NNT for dichotomous outcomes calculated using Cates NNT calculator (www.nntonline.net/visualrx/). NNT for continuous outcomes calculated using Wells Calculator (CMSG editorial office). | ||||||
| Outcome or subgroup title | No. of studies | No. of participants | Statistical method | Effect size |
| 1 Resolution of trigger finger Show forest plot | 2 | Risk Ratio (M‐H, Random, 95% CI) | Subtotals only | |
| 1.1 Resolution of symptoms after one or more injections (six to 12 months) | 2 | 270 | Risk Ratio (M‐H, Random, 95% CI) | 1.48 [0.79, 2.76] |
| 2 Pain on the palm of the hand Show forest plot | 1 | Risk Ratio (M‐H, Random, 95% CI) | Subtotals only | |
| 2.1 Pain short‐term (one week) | 1 | 105 | Risk Ratio (M‐H, Random, 95% CI) | 3.69 [1.99, 6.85] |
| 2.2 Pain intermediate‐term (six months) | 1 | 105 | Risk Ratio (M‐H, Random, 95% CI) | 0.10 [0.01, 1.77] |
| 3 Pain (1 to 10 scale) Show forest plot | 1 | Mean Difference (IV, Random, 95% CI) | Subtotals only | |
| 3.1 Pain short‐term (three months) | 1 | 156 | Mean Difference (IV, Random, 95% CI) | 0.0 [‐0.23, 0.23] |
| 3.2 Pain long‐term (12 months) | 1 | 153 | Mean Difference (IV, Random, 95% CI) | ‐2.0 [‐2.68, ‐1.32] |
| 4 Frequency of recurrence Show forest plot | 2 | Risk Ratio (M‐H, Random, 95% CI) | Subtotals only | |
| 4.1 Recurrence (range six to 12 months) | 2 | 270 | Risk Ratio (M‐H, Random, 95% CI) | 0.17 [0.09, 0.33] |
| 5 Adverse events Show forest plot | 2 | Risk Ratio (M‐H, Random, 95% CI) | Subtotals only | |
| 5.1 Infection | 2 | 270 | Risk Ratio (M‐H, Random, 95% CI) | 2.65 [0.88, 7.99] |
| 5.2 Tendon or pulley injury | 1 | 105 | Risk Ratio (M‐H, Random, 95% CI) | 0.0 [0.0, 0.0] |
| 5.3 Flare around procedure site | 1 | 165 | Risk Ratio (M‐H, Random, 95% CI) | 0.51 [0.23, 1.15] |
| 5.4 Cutaneous discomfort around procedure site (after 12 months) | 1 | 165 | Risk Ratio (M‐H, Random, 95% CI) | 3.62 [1.25, 10.44] |
| 5.5 Fat necrosis at the procedure site | 1 | 165 | Risk Ratio (M‐H, Random, 95% CI) | 1.29 [0.47, 3.54] |
| 5.6 Total adverse events | 2 | 270 | Risk Ratio (M‐H, Random, 95% CI) | 1.02 [0.57, 1.84] |
| 6 Neurovascular injury Show forest plot | 2 | Risk Ratio (M‐H, Random, 95% CI) | Subtotals only | |
| 6.1 Neurovascular injury | 2 | 270 | Risk Ratio (M‐H, Random, 95% CI) | 2.17 [0.70, 6.77] |
| 7 Subgroup analyses for resolution Show forest plot | 2 | Risk Ratio (M‐H, Random, 95% CI) | Subtotals only | |
| 7.1 Resolution short‐term | 1 | 165 | Risk Ratio (M‐H, Random, 95% CI) | 1.08 [0.96, 1.21] |
| 7.2 Resolution intermediate‐term | 1 | 105 | Risk Ratio (M‐H, Random, 95% CI) | 1.17 [1.04, 1.31] |
| 7.3 Resolution long‐term | 1 | 165 | Risk Ratio (M‐H, Random, 95% CI) | 1.90 [1.49, 2.43] |
| 8 Subgroup analyses for recurrence Show forest plot | 2 | Risk Ratio (M‐H, Random, 95% CI) | Subtotals only | |
| 8.1 Recurrence intermediate‐term (six months) | 1 | 105 | Risk Ratio (M‐H, Random, 95% CI) | 0.06 [0.00, 1.00] |
| 8.2 Recurrence long‐term (12 months) | 1 | 165 | Risk Ratio (M‐H, Random, 95% CI) | 0.18 [0.09, 0.36] |
| Outcome or subgroup title | No. of studies | No. of participants | Statistical method | Effect size |
| 1 Resolution of trigger finger Show forest plot | 2 | Risk Ratio (M‐H, Random, 95% CI) | Subtotals only | |
| 1.1 Resolution of symptoms after one or more injections (six to 12 months) | 2 | 191 | Risk Ratio (M‐H, Random, 95% CI) | 2.11 [0.31, 14.51] |
| 2 Pain (VAS: 0 to 10 scale) Show forest plot | 2 | Mean Difference (IV, Random, 95% CI) | Subtotals only | |
| 2.1 Pain short‐term (one month) | 2 | 198 | Mean Difference (IV, Random, 95% CI) | ‐1.80 [‐5.72, 2.12] |
| 2.2 Pain long‐term (12 months) | 1 | 93 | Mean Difference (IV, Random, 95% CI) | ‐6.5 [‐7.25, ‐5.75] |
| 3 Pain on the palm of the hand Show forest plot | 1 | Risk Ratio (M‐H, Random, 95% CI) | Subtotals only | |
| 3.1 Pain short‐term (one week) | 1 | 94 | Risk Ratio (M‐H, Random, 95% CI) | 3.63 [1.94, 6.78] |
| 3.2 Pain intermediate‐term (six months) | 1 | 94 | Risk Ratio (M‐H, Random, 95% CI) | 0.12 [0.01, 2.18] |
| 4 Frequency of recurrence Show forest plot | 5 | Risk Ratio (M‐H, Random, 95% CI) | Subtotals only | |
| 4.1 Recurrence (range six to 12 months) | 5 | 392 | Risk Ratio (M‐H, Random, 95% CI) | 0.57 [0.21, 1.59] |
| 5 Adverse events Show forest plot | 5 | Risk Ratio (M‐H, Random, 95% CI) | Subtotals only | |
| 5.1 Infection | 2 | 191 | Risk Ratio (M‐H, Random, 95% CI) | 0.35 [0.04, 3.29] |
| 5.2 Partial loss of movement | 3 | 201 | Risk Ratio (M‐H, Random, 95% CI) | 3.09 [0.87, 10.97] |
| 5.3 Tendon or pulley injury | 4 | 267 | Risk Ratio (M‐H, Random, 95% CI) | 1.00 [0.21, 4.81] |
| 5.4 Dysaesthesia | 2 | 76 | Risk Ratio (M‐H, Random, 95% CI) | 0.20 [0.02, 1.67] |
| 5.5 Skin atrophy or hypopigmentation | 1 | 50 | Risk Ratio (M‐H, Random, 95% CI) | 0.14 [0.01, 2.63] |
| 5.6 Total adverse events | 5 | 392 | Risk Ratio (M‐H, Random, 95% CI) | 1.58 [0.91, 2.75] |
| 6 Neurovascular injury Show forest plot | 2 | Risk Ratio (M‐H, Random, 95% CI) | Subtotals only | |
| 6.1 Neurovascular injury | 2 | 191 | Risk Ratio (M‐H, Random, 95% CI) | 0.35 [0.04, 3.29] |
| 7 Subgroup analyses for resolution Show forest plot | 2 | Risk Ratio (M‐H, Random, 95% CI) | Subtotals only | |
| 7.1 Resolution short‐term | 1 | 97 | Risk Ratio (M‐H, Random, 95% CI) | 2.18 [1.55, 3.05] |
| 7.2 Resolution intermediate‐term | 1 | 94 | Risk Ratio (M‐H, Random, 95% CI) | 1.16 [1.03, 1.31] |
| 7.3 Resolution long‐term | 1 | 97 | Risk Ratio (M‐H, Random, 95% CI) | 3.90 [2.37, 6.42] |
| 8 Subgroup analyses for recurrence Show forest plot | 5 | Risk Ratio (M‐H, Random, 95% CI) | Subtotals only | |
| 8.1 Recurrence short‐term (one month) | 1 | 125 | Risk Ratio (M‐H, Random, 95% CI) | 1.73 [0.76, 3.94] |
| 8.2 Recurrence intermediate‐term (six months) | 2 | 219 | Risk Ratio (M‐H, Random, 95% CI) | 0.37 [0.02, 5.50] |
| 8.3 Recurrence long‐term (range nine to 12 months) | 3 | 173 | Risk Ratio (M‐H, Random, 95% CI) | 0.55 [0.10, 2.99] |
| Outcome or subgroup title | No. of studies | No. of participants | Statistical method | Effect size |
| 1 Resolution of trigger finger Show forest plot | 1 | Risk Ratio (M‐H, Random, 95% CI) | Subtotals only | |
| 1.1 Resolution of symptoms long‐term (12 months) | 1 | 30 | Risk Ratio (M‐H, Random, 95% CI) | 1.35 [0.98, 1.85] |
| 1.2 Resolution of symptoms intermediate‐term (six month) | 1 | 30 | Risk Ratio (M‐H, Random, 95% CI) | 1.07 [0.89, 1.28] |
| 2 Frequency of recurrence Show forest plot | 1 | Risk Ratio (M‐H, Random, 95% CI) | Subtotals only | |
| 2.1 Recurrence long‐term (12 months) | 1 | 30 | Risk Ratio (M‐H, Random, 95% CI) | 0.14 [0.01, 2.55] |
| 2.2 Recurrence intermediate‐term (six months) | 1 | 30 | Risk Ratio (M‐H, Random, 95% CI) | 0.0 [0.0, 0.0] |
| 3 Adverse events Show forest plot | 1 | Risk Ratio (M‐H, Random, 95% CI) | Subtotals only | |
| 3.1 Partial loss of movement | 1 | 30 | Risk Ratio (M‐H, Random, 95% CI) | 2.0 [0.20, 19.78] |
| 3.2 Algodystrophic syndrome | 1 | 30 | Risk Ratio (M‐H, Random, 95% CI) | 3.0 [0.13, 68.26] |
| 3.3 Total adverse events | 1 | 30 | Risk Ratio (M‐H, Random, 95% CI) | 3.0 [0.35, 25.68] |
| Outcome or subgroup title | No. of studies | No. of participants | Statistical method | Effect size |
| 1 Resolution of trigger finger Show forest plot | 1 | Risk Ratio (M‐H, Random, 95% CI) | Subtotals only | |
| 1.1 Resolution of symptoms after one or more injections (range 6 to 42 months) | 1 | 127 | Risk Ratio (M‐H, Random, 95% CI) | 1.51 [1.21, 1.90] |
| 2 Adverse events Show forest plot | 1 | Risk Ratio (M‐H, Random, 95% CI) | Subtotals only | |
| 2.1 Infection | 1 | 127 | Risk Ratio (M‐H, Random, 95% CI) | 0.46 [0.04, 4.97] |
| 2.2 Partial loss of movement | 1 | 127 | Risk Ratio (M‐H, Random, 95% CI) | 1.85 [0.17, 19.87] |
| 2.3 Total adverse events | 1 | 127 | Risk Ratio (M‐H, Random, 95% CI) | 0.92 [0.13, 6.36] |
| 3 Neurovascular injury Show forest plot | 1 | Risk Ratio (M‐H, Random, 95% CI) | Subtotals only | |
| 3.1 Neurovascular injury | 1 | 127 | Risk Ratio (M‐H, Random, 95% CI) | 0.92 [0.06, 14.46] |
| Outcome or subgroup title | No. of studies | No. of participants | Statistical method | Effect size |
| 1 Resolution of trigger finger Show forest plot | 5 | Risk Ratio (M‐H, Random, 95% CI) | Subtotals only | |
| 1.1 Resolution of symptoms (range 2 to 6 months) | 5 | 429 | Risk Ratio (M‐H, Random, 95% CI) | 1.00 [0.97, 1.02] |
| 2 Pain (1 to 6 scale) Show forest plot | 1 | Mean Difference (IV, Random, 95% CI) | Subtotals only | |
| 2.1 Pain short‐term (1 week) | 1 | 36 | Mean Difference (IV, Random, 95% CI) | 0.30 [‐0.34, 0.94] |
| 2.2 Pain short‐term (12 weeks) | 1 | 36 | Mean Difference (IV, Random, 95% CI) | 0.0 [‐0.52, 0.52] |
| 3 Pain on the palm of the hand Show forest plot | 1 | Risk Ratio (M‐H, Random, 95% CI) | Subtotals only | |
| 3.1 Pain short‐term (one week) | 1 | 101 | Risk Ratio (M‐H, Random, 95% CI) | 0.98 [0.75, 1.29] |
| 3.2 Pain intermediate‐term (six months) | 1 | 101 | Risk Ratio (M‐H, Random, 95% CI) | 0.0 [0.0, 0.0] |
| 4 Frequency of recurrence Show forest plot | 4 | Risk Ratio (M‐H, Random, 95% CI) | Subtotals only | |
| 4.1 Recurrence (range 2 to 6 months) | 4 | 397 | Risk Ratio (M‐H, Random, 95% CI) | 0.28 [0.01, 6.83] |
| 5 Adverse events Show forest plot | 5 | Risk Ratio (M‐H, Random, 95% CI) | Subtotals only | |
| 5.1 Infection | 2 | 133 | Risk Ratio (M‐H, Random, 95% CI) | 0.0 [0.0, 0.0] |
| 5.2 Partial loss of movement | 1 | 32 | Risk Ratio (M‐H, Random, 95% CI) | 0.0 [0.0, 0.0] |
| 5.3 Tendon or pulley injury | 2 | 261 | Risk Ratio (M‐H, Random, 95% CI) | 0.0 [0.0, 0.0] |
| 5.4 Edema or inflammation or hematoma | 2 | 136 | Risk Ratio (M‐H, Random, 95% CI) | 0.80 [0.12, 5.30] |
| 5.5 Adherence | 1 | 100 | Risk Ratio (M‐H, Random, 95% CI) | 0.28 [0.01, 6.83] |
| 5.6 Others (it did not specified) | 1 | 100 | Risk Ratio (M‐H, Random, 95% CI) | 2.56 [0.11, 61.45] |
| 5.7 Total adverse events | 5 | 429 | Risk Ratio (M‐H, Random, 95% CI) | 0.80 [0.17, 3.68] |
| 6 Subgroup analyses for resolution Show forest plot | 5 | Risk Ratio (M‐H, Random, 95% CI) | Subtotals only | |
| 6.1 Resolution of symptoms (short‐term) | 4 | 328 | Risk Ratio (M‐H, Random, 95% CI) | 1.00 [0.97, 1.02] |
| 6.2 Resolution of symptoms (intermediate‐term) | 1 | 101 | Risk Ratio (M‐H, Random, 95% CI) | 1.0 [0.96, 1.04] |
| 7 Subgroup analyses for recurrence Show forest plot | 4 | Risk Ratio (M‐H, Random, 95% CI) | Subtotals only | |
| 7.1 Recurrence short‐term (eight to 12 weeks) | 3 | 296 | Risk Ratio (M‐H, Random, 95% CI) | 0.28 [0.01, 6.83] |
| 7.2 Recurrence intermediate‐term (six months) | 1 | 101 | Risk Ratio (M‐H, Random, 95% CI) | 0.0 [0.0, 0.0] |
| Outcome or subgroup title | No. of studies | No. of participants | Statistical method | Effect size |
| 1 Resolution of trigger finger Show forest plot | 1 | Risk Ratio (M‐H, Random, 95% CI) | Subtotals only | |
| 1.1 Resolution of symptoms (three months) | 1 | 231 | Risk Ratio (M‐H, Random, 95% CI) | 1.0 [0.98, 1.02] |
| 2 Adverse events Show forest plot | 1 | Risk Ratio (M‐H, Random, 95% CI) | Subtotals only | |
| 2.1 Infection | 1 | 231 | Risk Ratio (M‐H, Random, 95% CI) | 0.0 [0.0, 0.0] |
| 2.2 Dysesthesia | 1 | 231 | Risk Ratio (M‐H, Random, 95% CI) | 2.74 [0.74, 10.06] |
| 2.3 Total adverse events | 1 | 231 | Risk Ratio (M‐H, Random, 95% CI) | 2.74 [0.74, 10.06] |
| 3 Neurovascular injury Show forest plot | 1 | Risk Ratio (M‐H, Random, 95% CI) | Subtotals only | |
| 3.1 Neurovascular injury | 1 | 231 | Risk Ratio (M‐H, Random, 95% CI) | 3.08 [0.13, 74.79] |
| Outcome or subgroup title | No. of studies | No. of participants | Statistical method | Effect size |
| 1 DASH score Show forest plot | 1 | Mean Difference (IV, Random, 95% CI) | Subtotals only | |
| 1.1 DASH score short‐term (one month) | 1 | 21 | Mean Difference (IV, Random, 95% CI) | ‐1.5 [‐19.19, 16.19] |
| 1.2 DASH score short‐term (three months) | 1 | 21 | Mean Difference (IV, Random, 95% CI) | ‐2.0 [‐16.45, 12.45] |
| 1.3 DASH score long‐term (12 months) | 1 | 21 | Mean Difference (IV, Random, 95% CI) | ‐8.9 [‐23.35, 5.55] |
| Outcome or subgroup title | No. of studies | No. of participants | Statistical method | Effect size |
| 1 DASH score Show forest plot | 1 | Mean Difference (IV, Random, 95% CI) | Subtotals only | |
| 1.1 DASH score short‐term (one month) | 1 | 22 | Mean Difference (IV, Random, 95% CI) | 5.20 [‐16.67, 27.07] |
| 1.2 DASH score short‐term (three months) | 1 | 22 | Mean Difference (IV, Random, 95% CI) | 1.60 [‐15.27, 18.47] |
| 1.3 DASH score long‐term (12 months) | 1 | 22 | Mean Difference (IV, Random, 95% CI) | 3.10 [‐21.28, 27.48] |
| Outcome or subgroup title | No. of studies | No. of participants | Statistical method | Effect size |
| 1 DASH score Show forest plot | 1 | Mean Difference (IV, Random, 95% CI) | Subtotals only | |
| 1.1 DASH score short‐term (one month) | 1 | 21 | Mean Difference (IV, Random, 95% CI) | 6.70 [‐13.67, 27.07] |
| 1.2 DASH score short‐term (three months) | 1 | 21 | Mean Difference (IV, Random, 95% CI) | 3.60 [‐12.84, 20.04] |
| 1.3 DASH score long‐term (12 months) | 1 | 21 | Mean Difference (IV, Random, 95% CI) | 12.00 [‐8.84, 32.84] |