Dieta de estilo mediterráneo para la prevención primaria y secundaria de las enfermedades cardiovasculares
Resumen
Antecedentes
El estudio Seven Countries de los años sesenta indicó que las poblaciones de la región mediterránea presentaron menor mortalidad por enfermedades cardiovasculares (CC), probablemente como resultado de diferentes hábitos alimentarios. Los estudios observacionales posteriores han confirmado los beneficios de la adherencia a un hábito dietético mediterráneo en los factores de riesgo de enfermedades cardiovasculares aunque la evidencia de los ensayos clínicos (EC) es más limitada.
Objetivos
Determinar la efectividad de una dieta de estilo mediterráneo para la prevención primaria y secundaria de ECV.
Métodos de búsqueda
Se hicieron búsquedas en las siguientes bases de datos electrónicas: Registro Cochrane Central de Ensayos Controlados (Cochrane Central Register of Controlled Trials (CENTRAL; 2018, número 9); MEDLINE (Ovid, 1946 hasta 25 septiembre 2018); Embase (Ovid, 1980 hasta 2018, semana 39); Web of Science Core Collection (Thomson Reuters, 1900 hasta 26 septiembre 2018); DARE, número 2 de 4, 2015 (Cochrane Library); HTA, número 4 de 4, 2016 (Cochrane Library); NHS EED, número 2 de 4, 2015 (Cochrane Library). Se realizaron búsquedas en registros de ensayos y no se aplicaron restricciones de idioma.
Criterios de selección
Se seleccionaron los ensayos controlados aleatorios (ECA) en adultos sanos y adultos en alto riesgo de ECV (prevención primaria) y pacientes con ECV establecida (prevención secundaria). Se requirieron los siguientes componentes clave para cumplir con la definición de una dieta de estilo mediterráneo: cociente alto de grasas monoinsaturadas/saturadas (uso de aceite de oliva como principal ingrediente al cocinar o consumo de otros alimentos tradicionales con alto contenido de grasas monoinsaturadas como frutos secos) y una ingesta alta de alimentos vegetales, incluidas las frutas, las hortalizas y las legumbres. Los componentes adicionales fueron: el consumo bajo a moderado de vino tinto; el consumo alto de granos enteros y cereales; el consumo bajo de carnes y productos derivados y el mayor consumo de pescado; el consumo moderado de leche y productos lácteos. La intervención podía ser asesoramiento dietético, provisión de alimentos relevantes o ambos. El grupo de comparación recibió ninguna intervención, una intervención mínima, atención habitual u otra intervención dietética. Los resultados incluyeron eventos clínicos y factores de riesgo de ECV. Se incluyeron sólo los estudios con períodos de seguimiento de tres meses o más definidos como el período de intervención más el seguimiento posintervención.
Obtención y análisis de los datos
Dos autores de la revisión, de forma independiente, evaluaron los estudios para inclusión, extrajeron los datos y evaluaron el riesgo de sesgo. Se consideraron cuatro comparaciones principales:
1. Intervención dietética mediterránea versus ninguna intervención o intervención mínima para la prevención primaria;
2. Intervención dietética mediterránea versus otra intervención dietética para la prevención primaria;
3. Intervención dietética mediterránea versus la atención habitual para la prevención secundaria;
4. Intervención dietética mediterránea versus otra intervención dietética para la prevención secundaria.
Resultados principales
En esta importante actualización de la revisión, 30 ECA (49 artículos) (12 461 participantes asignados al azar) y siete ensayos en curso cumplieron con los criterios de inclusión. La mayoría de los ensayos contribuyeron a la prevención primaria: comparaciones 1 (nueve ensayos) y 2 (13 ensayos). Los ensayos de prevención secundaria estuvieron incluidos para la comparación 3 (dos ensayos) y la comparación 4 (cuatro ensayos más dos ensayos adicionales que fueron excluidos de los análisis principales debido a las inquietudes publicadas con respecto a la confiabilidad de los datos).
Dos ensayos informaron los eventos adversos y se indicó que los mismos estuvieron ausentes o eran menores (evidencia de calidad baja a moderada). Ningún ensayo informó los costos ni la calidad de vida relacionada con la salud.
Prevención primaria
Los estudios incluidos para la comparación 1 no informaron las variables de evaluación clínicas (mortalidad por ECV, mortalidad total o variables de evaluación no mortales como infarto de miocardio o accidente cerebrovascular). El ensayo PREDIMED (incluido en la comparación 2) se retiró y se volvió a analizar tras ciertas inquietudes con respecto a la asignación al azar en dos de 11 sitios. La evidencia de calidad baja muestra poco o ningún efecto de la intervención PREDIMED (7747 asignados al azar) (asesoramiento para seguir una dieta mediterránea más aceite de oliva extra virgen suplementario o frutos secos) en comparación con una dieta con bajo contenido de grasas en la mortalidad por ECV (cociente de riesgos instantáneos [CRI] 0,81; intervalo de confianza [IC] del 95%: 0,50 a 1,32) o la mortalidad total (CRI 1,0; IC del 95%: 0,81 a 1,24) luego de 4,8 años. Sin embargo, hubo una reducción de la cantidad de accidentes cerebrovasculares con la intervención PREDIMED (CRI 0,60; IC del 95%: 0,45 a 0,80), una disminución de 24/1000 a 14/1000 (IC del 95%: 11 a 19; evidencia de calidad moderada). Para los factores de riesgo de ECV para la comparación 1 hubo evidencia de calidad baja de una reducción pequeña posible en el colesterol total (‐0,16 mmol/L, IC del 95% de ‐0,32 a 0,00) y evidencia de calidad moderada de una reducción de la presión arterial sistólica (‐2,99 mmHg [IC del 95%: ‐3,45 a ‐2,53) y diastólica (‐2,0 mmHg, IC del 95%: ‐2,29 a ‐1,71), con evidencia de calidad baja o muy baja de poco o ningún efecto sobre el colesterol LDL o HDL o los triglicéridos. Para la comparación 2 hubo evidencia de calidad moderada de una reducción pequeña posible del colesterol LDL (‐0,15 mmol/L, IC del 95%: ‐0,27 a ‐0,02) y los triglicéridos (‐0,09 mmol/L, IC del 95%: ‐0,16 a ‐0,01) con evidencia de calidad moderada o baja de poco o ningún efecto sobre el colesterol total o HDL o la presión arterial.
Prevención secundaria
Para la prevención secundaria, el Lyon Diet Heart Study (comparación 3) examinó el efecto del asesoramiento para seguir una dieta mediterránea y margarina de canola suplementaria en comparación con la atención habitual en 605 pacientes con CC durante 46 meses y hubo evidencia de calidad baja de una reducción de los cálculos ajustados para la mortalidad por ECV (CRI 0,35; IC del 95%: 0,15 a 0,82) y la mortalidad total (CRI 0,44; IC del 95%: 0,21 a 0,92) con la intervención. Sólo un ensayo pequeño (101 participantes) proporcionó cálculos no ajustados para las variables de evaluación clínicas compuestas para la comparación 4 (evidencia de muy baja calidad de un efecto incierto). Para la comparación 3 hubo evidencia de calidad baja de poco o ningún efecto de una dieta de estilo mediterráneo sobre los niveles de lípidos y evidencia de muy baja calidad para la presión arterial. De manera similar, para la comparación 4 donde sólo dos ensayos contribuyeron a los análisis hubo evidencia de calidad baja o muy baja de poco o ningún efecto de la intervención en los niveles de lípidos o la presión arterial.
Conclusiones de los autores
A pesar del número relativamente grande de estudios incluidos en esta revisión, todavía hay incertidumbre con respecto a los efectos de una dieta de estilo mediterráneo sobre las variables de evaluación clínicas y los factores de riesgo de ECV para la prevención primaria y secundaria. La certeza de la evidencia en cuanto a los beneficios moderados en los factores de riesgo de ECV en la prevención primaria es baja o moderada y hubo una cantidad pequeña de estudios que informaron efectos perjudiciales mínimos. Hay una escasez de evidencia en cuanto a la prevención secundaria. Los estudios en curso pueden proporcionar más certeza en el futuro.
PICO
Resumen en términos sencillos
Dieta de estilo mediterráneo para la prevención de enfermedades cardiovasculares
Está bien establecido que la dieta desempeña una función principal en el riesgo de enfermedades cardiovasculares. El hábito dietético mediterráneo tradicional es de interés particular debido a las observaciones desde los años sesenta de que las poblaciones de los países de la región mediterránea como Grecia e Italia, tenían una baja mortalidad por enfermedades cardiovasculares comparadas con las poblaciones del norte de Europa o de los EE.UU., probablemente como resultado de diferentes hábitos alimentarios.
Esta revisión evaluó los efectos de la provisión de asesoramiento dietético para seguir una dieta de estilo mediterráneo o de la provisión de alimentos relevantes a la dieta (o ambos) en los adultos sanos, pacientes con mayor riesgo de enfermedades cardiovasculares y pacientes con enfermedades cardiovasculares, para prevenir la aparición o la recurrencia de enfermedades cardiovasculares y reducir los factores de riesgo asociados con las mismas. Las definiciones de un hábito dietético mediterráneo varían y solo se incluyeron ensayos controlados aleatorios (ECA) de intervenciones que informaron los dos componentes centrales siguientes: un cociente alto de grasas monoinsaturadas/saturadas (uso de aceite de oliva como ingrediente principal para cocinar o consumo de otros alimentos tradicionales con alto contenido de grasas monoinsaturadas como frutos secos) y una ingesta alta de alimentos vegetales, incluidas las frutas, las hortalizas y las legumbres. Los componentes adicionales fueron: el consumo bajo a moderado de vino tinto; el consumo alto de granos enteros y cereales; el consumo bajo de carnes y productos derivados y el mayor consumo de pescado; el consumo moderado de leche y productos lácteos. El grupo de control fue de ninguna intervención o una intervención mínima, atención habitual u otra intervención dietética. Se encontraron 30 ECA (49 artículos) que cumplieron estos criterios. Los ensayos variaron de forma importante en cuanto a los participantes reclutados y las diferentes intervenciones dietéticas. Se agruparon los estudios para considerar los efectos de seguir una dieta de estilo mediterráneo en las siguientes cuatro categorías para ayudar en la interpretación de los resultados:
1. Intervención dietética mediterránea en comparación con ninguna intervención o una intervención mínima para prevenir la aparición de enfermedades cardiovasculares;
2. Intervención dietética mediterránea en comparación con otra intervención dietética para prevenir la aparición de enfermedades cardiovasculares;
3. Intervención dietética mediterránea en comparación con atención habitual en los pacientes con enfermedades cardiovasculares para prevenir la recurrencia;
4. Intervención dietética mediterránea en comparación con otra intervención dietética para los pacientes con enfermedades cardiovasculares para prevenir la recurrencia.
Pocos ensayos informaron de la aparición de enfermedades cardiovasculares en las personas con o sin enfermedades en un primer momento. Un ensayo amplio en pacientes en alto riesgo de enfermedades cardiovasculares encontró un beneficio de la intervención dietética mediterránea en comparación con una dieta con bajo contenido de grasas en el riesgo de accidente cerebrovascular, pero no en los ataques cardíacos, la muerte por cardiopatía u otras causas. Un estudio adicional en pacientes con enfermedades cardiovasculares encontró un beneficio de la intervención dietética mediterránea en la muerte por cardiopatía u otras causas. Se consideró que estos dos estudios proporcionaron evidencia de calidad baja a moderada. Debieron excluirse dos estudios de los análisis debido a que se plantearon inquietudes en cuanto a que los datos eran poco fiables. Los otros ensayos de la revisión midieron los factores de riesgo de enfermedades cardiovasculares. Hubo evidencia de calidad baja a moderada de algunos cambios beneficiosos en los niveles de lípidos y la presión arterial con una dieta de estilo mediterráneo en los pacientes sin enfermedades. En pacientes que ya presentaban enfermedades cardiovasculares hubo evidencia de muy baja calidad de ningún efecto a partir de la administración de una dieta de estilo mediterráneo en los factores de riesgo. Dos ensayos informaron los efectos secundarios de la dieta, los cuales estuvieron ausentes o fueron menores.
La revisión establece la conclusión de que, a pesar del gran número de ensayos incluidos, todavía hay incertidumbre con respecto a los efectos de una dieta de estilo mediterráneo sobre la aparición de enfermedades cardiovasculares y los factores de riesgo en pacientes con o sin enfermedades cardiovasculares hasta el momento. Se encontraron siete estudios aún en curso y cuando los resultados de los mismos estén disponibles se los incorporará a la revisión para ayudar a reducir la incertidumbre.
Conclusiones de los autores
Summary of findings
| Mediterranean dietary intervention compared to no intervention or minimal intervention for the primary prevention of cardiovascular disease | ||||||
| Patient or population: adults without cardiovascular disease | ||||||
| Outcomes | Anticipated absolute effects* (95% CI) | Relative effect | № of participants | Certainty of the evidence | Comments | |
| Risk with no intervention or minimal intervention | Risk with Mediterranean dietary intervention | |||||
| CVD mortality | — | — | — | — | — | Not reported |
| Total mortality | — | — | — | — | — | Not reported |
| Total cholesterol (mmol/L), change from baseline | The mean total cholesterol change from baseline ranged from ‐0.003 to ‐0.2 mmol/L | MD 0.16 mmol/L lower | — | 569 | ⊕⊕⊝⊝ | — |
| LDL cholesterol (mmol/L), change from baseline | The mean LDL cholesterol change from baseline ranged from ‐0.2 to 0.05 mmol/L | MD 0.08 mmol/L lower | — | 389 | ⊕⊝⊝⊝ | — |
| HDL cholesterol (mmol/L), change from baseline | The mean HDL cholesterol change from baseline ranged from ‐0.07 to 0.03 mmol/L | MD 0.02 mmol/L higher | — | 569 | ⊕⊕⊝⊝ | — |
| Triglycerides (mmol/L), change from baseline | See comment | See comment | — | 480 | ⊕⊕⊝⊝ | Studies were not pooled statistically due to substantial heterogeneity (I2 = 92%) |
| Systolic blood pressure (mmHg), change from baseline | The mean systolic blood pressure change from baseline ranged from ‐1 to 1.4 mmHg | MD 2.99 mmHg lower | — | 269 | ⊕⊕⊕⊝ | — |
| Diastolic blood pressure (mmHg), change from baseline | The mean diastolic blood pressure change from baseline ranged from ‐1 to 1.7 mmHg | MD 2.00 mmHg lower | — | 269 | ⊕⊕⊕⊝ | — |
| Adverse events | — | — | — | — | — | Not reported |
| *The risk in the intervention group (and its 95% confidence interval) is based on the assumed risk in the comparison group and the relative effect of the intervention (and its 95% CI). | ||||||
| GRADE Working Group grades of evidence | ||||||
| 1Downgraded by one level for risk of bias. Majority of studies were at unclear risk of selection bias or attrition bias, or both. 2Downgraded by one level for inconsistency. Forest plot shows different directions of effect and I2 value is very high. 3Downgraded by one level for imprecision due to small number of participants (< 400). 4Downgraded one level for inconsistency. Studies could not be pooled due to very high heterogeneity, and forest plots show different directions of effect. | ||||||
| Mediterranean dietary intervention compared to another dietary intervention for the primary of cardiovascular disease | ||||||
| Patient or population: adults without cardiovascular disease | ||||||
| Outcomes | Anticipated absolute effects* (95% CI) | Relative effect | № of participants | Certainty of the evidence | Comments | |
| Risk with another dietary intervention | Risk with Mediterranean dietary intervention | |||||
| CVD mortality | Study population | HR 0.81 | 7447 | ⊕⊕⊝⊝ | — | |
| 12 per 1000 | 10 per 1000 | |||||
| Total mortality | Study population | HR 1.00 | 7447 | ⊕⊕⊝⊝ | — | |
| 47 per 1000 | 47 per 1000 | |||||
| Myocardial infarction | Study population | HR 0.79 | 7447 | ⊕⊕⊝⊝ | — | |
| 16 per 1000 | 12 per 1000 | |||||
| Stroke | Study population | HR 0.60 | 7447 | ⊕⊕⊕⊝ | — | |
| 24 per 1000 | 14 per 1000 | |||||
| Peripheral arterial disease | Study population | HR 0.42 | 7447 | ⊕⊕⊕⊝ | — | |
| 18 per 1000 | 8 per 1000 | |||||
| Total cholesterol (mmol/L), change from baseline | The mean total cholesterol change from baseline was ‐0.29 to 0.51 mmol/L | MD 0.13 mmol/L lower | — | 939 | ⊕⊕⊝⊝ | — |
| LDL cholesterol (mmol/L), change from baseline | The mean LDL cholesterol change from baseline ranged from ‐0.18 to 0.27 mmol/L | MD 0.15 mmol/L lower | — | 947 | ⊕⊕⊕⊝ | — |
| HDL cholesterol (mmol/L), change from baseline | The mean HDL cholesterol change from baseline ranged from ‐0.02 to 0.16 mmol/L | MD 0.02 mmol/L higher | — | 891 | ⊕⊕⊕⊝ | — |
| Triglycerides (mmol/L), change from baseline | The mean triglycerides change from baseline ranged from ‐0.44 to 1.32 mmol/L | MD 0.09 mmol/L lower | — | 939 | ⊕⊕⊕⊝ | — |
| Systolic blood pressure (mmHg), change from baseline | The mean systolic blood pressure change from baseline ranged from ‐10.4 to 6.9 mmHg | MD 1.5 mmHg lower | — | 448 | ⊕⊕⊝⊝ | — |
| Diastolic blood pressure (mmHg), change from baseline | The mean diastolic blood pressure change from baseline ranged from ‐8.1 to 5.3 mmHg | MD 0.26 mmHg lower | — | 448 | ⊕⊕⊝⊝ | — |
| Adverse events | Adverse effects were reported by only one RCT ‐ no adverse events were noted for either dietary intervention in the PREDIMED trial. | — | 7447 | ⊕⊕⊕⊝ | — | |
| *The risk in the intervention group (and its 95% confidence interval) is based on the assumed risk in the comparison group and the relative effect of the intervention (and its 95% CI). | ||||||
| GRADE Working Group grades of evidence | ||||||
| 1Downgraded by one level for imprecision. Confidence interval is wide enough to include both an important increase or decrease in the outcome. 2Downgraded by one level for risk of bias. The only included study was the PREDIMED trial, which was retracted due to methodological issues with randomisation, re‐analysed and republished. 3Downgraded by one level for risk of bias. Majority of studies are at unclear risk of selection bias, attrition bias, or both. 4Downgraded by one level for inconsistency. High I2 and forest plots shows different directions of effect. | ||||||
| Mediterranean dietary intervention compared to usual care for secondary prevention of cardiovascular disease | ||||||
| Patient or population: adults with established cardiovascular disease | ||||||
| Outcomes | Anticipated absolute effects* (95% CI) | Relative effect | № of participants | Certainty of the evidence | Comments | |
| Risk with usual care | Risk with Mediterranean dietary intervention | |||||
| CVD mortality | Study population | RR 0.35 | 605 | ⊕⊕⊝⊝ | — | |
| 63 per 1000 | 22 per 1000 | |||||
| Total mortality | Study population | RR 0.44 | 605 | ⊕⊕⊝⊝ | — | |
| 79 per 1000 | 35 per 1000 | |||||
| Total cholesterol (mmol/L), change from baseline | The mean total cholesterol change from baseline ranged from ‐0.22 to ‐0.31 mmol/L | MD 0.07 mmol/L higher | — | 441 | ⊕⊕⊝⊝ | — |
| LDL cholesterol (mmol/L), change from baseline | The mean LDL cholesterol change from baseline ranged from ‐0.26 to ‐0.41 | MD 0.11 higher | — | 441 | ⊕⊕⊝⊝ | — |
| HDL cholesterol (mmol/L), change from baseline | The mean HDL cholesterol change from baseline ranged from 0 to 0.15 mmol/L | MD 0.01 mmol/L lower | — | 441 | ⊕⊕⊝⊝ | — |
| Triglycerides (mmol/L), change from baseline | The mean triglycerides change from baseline ranged from ‐0.02 to ‐0.08 mmol/L | MD 0.14 mmol/L lower | — | 441 | ⊕⊕⊝⊝ | — |
| Systolic blood pressure (mmHg), change from baseline | The mean systolic blood pressure change from baseline was 9 mmHg | MD 2 mmHg lower | — | 339 | ⊕⊝⊝⊝ | — |
| Diastolic blood pressure (mmHg), change from baseline | The mean diastolic blood pressure change from baseline was 5 mmHg | MD 1 mmHg lower | — | 339 | ⊕⊝⊝⊝ | — |
| Adverse events | Adverse effects were reported in only one RCT. Two of 302 CHD patients noted margarine‐related side effects of colitis and diarrhoea in The Lyon Diet Heart Study. | — | 605 | ⊕⊕⊝⊝ | — | |
| *The risk in the intervention group (and its 95% confidence interval) is based on the assumed risk in the comparison group and the relative effect of the intervention (and its 95% CI). | ||||||
| GRADE Working Group grades of evidence | ||||||
| 1Downgraded by two levels for risk of bias. The only included study had an unclear randomisation method and the modified Zelen design may have introduced other biases, although the study was at low risk of bias for allocation concealment and attrition. 2Downgraded by two levels for risk of bias as both included studies were at unclear risk of selection bias or attrition bias, or both, and the majority weight in the meta‐analysis was for the study with a modified Zelen design. 3Downgraded by one level for imprecision due to small number of participants (N < 400). 4Downgraded by two levels for imprecision due to small number of participants and wide CI that includes both important increases and decreases in the outcome. | ||||||
| Mediterranean dietary intervention compared to another dietary intervention for the secondary prevention of cardiovascular disease | ||||||
| Patient or population: adults with established cardiovascular disease | ||||||
| Outcomes | Anticipated absolute effects* (95% CI) | Relative effect | № of participants | Certainty of the evidence | Comments | |
| Risk with another dietary intervention | Risk with Mediterranean dietary intervention | |||||
| Total cardiac endpoints (all‐cause and cardiac deaths, myocardial infarction, hospital admissions for heart failure, unstable angina or stroke, unadjusted) | Study population | RR 0.98 | 101 | ⊕⊝⊝⊝ | Total cardiac endpoints was used instead of the 2 individual outcomes cardiovascular mortality and total mortality because this was the format used in the only trial reporting this. | |
| 160 per 1000 | 157 per 1000 | |||||
| Total cholesterol (mmol/L), change from baseline (sensitivity analysis without Singh studies) | See comment | See comment | — | (0 RCTs) | — | None of the included studies measured this outcome when Singh studies were removed in sensitivity analyses. |
| LDL cholesterol (mmol/L), change from baseline (sensitivity analysis without Singh studies) | The mean LDL cholesterol change from baseline was 0.13 mmol/L | MD 0.08 mmol/L higher | — | 71 | ⊕⊝⊝⊝ | — |
| HDL cholesterol (mmol/L), change from baseline (sensitivity analysis without Singh studies) Follow‐up: 2 years | The mean HDL cholesterol change from baseline was 0.10 mmol/L | MD 0.05 mmol/L lower | — | 71 | ⊕⊕⊝⊝ | — |
| Triglycerides (mmol/L), change from baseline (sensitivity analysis without Singh studies) Follow‐up: 2 years | The mean triglycerides change from baseline was ‐0.63 mmol/L | MD 0.46 mmol/L higher | — | 71 | ⊕⊝⊝⊝ | — |
| Systolic blood pressure (mmHg), change from baseline (sensitivity analysis without Singh studies) Follow‐up range: 12 weeks to 2 years | The mean systolic blood pressure change from baseline ranged from 4 to ‐9.33 mmHg | MD 1.76 mmHg higher | — | 150 | ⊕⊝⊝⊝ | — |
| Diastolic blood pressure (mmHg), change from baseline (sensitivity analysis without Singh studies) Follow‐up range: 12 weeks to 2 years | The mean diastolic blood pressure change from baseline ranged from 1 to ‐9.23 mmHg | MD 0.98 mmHg higher | — | 150 | ⊕⊝⊝⊝ | — |
| Adverse events | — | — | — | — | — | Not reported |
| *The risk in the intervention group (and its 95% confidence interval) is based on the assumed risk in the comparison group and the relative effect of the intervention (and its 95% CI). | ||||||
| GRADE Working Group grades of evidence | ||||||
| 1Downgraded by one level for risk of bias. Only included study had unclear random sequence generation and unclear attrition. 2Downgraded by two levels for imprecision due to small sample size and wide confidence interval that crosses the null. 3Downgraded by one level for imprecision due to small sample size. Although CI includes the null, it is reasonably narrow. 4Downgraded by one level for risk of bias. Both studies had unclear randomisation method, although allocation was concealed. One study was at low risk of attrition bias, the other at unclear risk of attrition bias. | ||||||
Antecedentes
Descripción de la afección
Las enfermedades cardiovasculares (ECV) son actualmente la causa principal de mortalidad en todo el mundo y causan un tercio de las muertes a nivel global (Roth 2017). En 2015 hubo más de 400 000 000 de individuos viviendo con ECV y casi 18 000 000 de muertes por ECV en todo el mundo, sobre la base de los cálculos más recientes del consorcio de la Global Burden of Disease (GBD) (Roth 2017). Es importante destacar que los datos indican que las tendencias de mortalidad por ECV ya no están descendiendo en las regiones de ingresos altos, mientras que los países de ingresos bajos y medios están experimentando un aumento de la carga de muertes relacionadas con las ECV (Roth 2017). Según los cálculos de la Organización Mundial de la Salud, más de un 80% de las muertes debido a ECV ocurren en países de ingresos bajos y medios y se espera que la cantidad de muertes debido a ECV aumente a 23 300 000 para 2030; con lo cual la ECV sigue siendo la única causa principal de mortalidad a nivel mundial (Mathers 2006; WHO 2011).
En Europa, más de 85 000 000 de personas actualmente (2015) viven con ECV, que causa casi 4 000 000 de muertes anualmente, lo cual representa un 45% de la carga de mortalidad general. Las tasas de mortalidad por cardiopatía isquémica (CI) y por accidente cerebrovascular en general son mayores en la zona central y oriental de Europa que en las zonas norte, sur y occidental de Europa (European Heart Network 2017).
La carga social de ECV es apreciable, en cuanto a los costos directos y a los costos indirectos de asistencia sanitaria como las pérdidas de productividad y la atención informal de los pacientes con ECV. Por ejemplo, se calcula que las ECV representan un costo de €210 000 000 000 para la economía de la Unión Europea por año (European Heart Network 2017).
Además de la función de las características genéticas, demográficas y socioeconómicas, los factores de riesgo modificables de ECV, como la hipertensión, el colesterol alto, el tabaco, la obesidad y la dieta deficiente ahora están generalizados en todo el mundo y representan una gran parte de la carga general de ECV (Roth 2017). Lo anterior exige estrategias preventivas efectivas en función de los costos para considerar estos factores de riesgo en primer lugar.
Específicamente, hay un reconocimiento de larga data de que la dieta desempeña una función principal en la etiología de muchas enfermedades crónicas y de ese modo contribuye a las variaciones geográficas significativas en las tasas de morbilidad y de mortalidad por enfermedades crónicas en diferentes países y poblaciones a nivel mundial (WHO 2003). Por ejemplo, se calcula que los factores dietéticos son responsables de la contribución más grande, entre todos los factores de riesgo conductuales, al riesgo de mortalidad por ECV a nivel de la población a través de Europa (European Heart Network 2017).
En particular, el hábito dietético mediterráneo se ha investigado por mucho tiempo por sus posibles efectos beneficiosos sobre un rango de resultados de enfermedades crónicas, comenzando por los datos ecológicos en el contexto del estudio Seven Countries en los años sesenta (Keys 1986). Varios estudios observacionales han revelado una mayor longevidad y calidad de vida, así como una reducción de la mortalidad y la morbilidad por ECV, el cáncer y otras enfermedades relacionadas con la nutrición con una mayor adherencia a un hábito dietético mediterráneo (Benetou 2008; Buckland 2009; Feart 2009; Fung 2009; Knoops 2004; Lagiou 2006; Mitrou 2007; Trichopoulou 1995; Trichopoulou 2003; Trichopoulou 2007). Las revisiones sistemáticas de los estudios prospectivos observacionales han confirmado que la mayor adherencia a una dieta mediterránea se asocia con una mejoría significativa en el estado de salud y una reducción significativa de la mortalidad global, así como en la morbilidad y la mortalidad por ECV y otras enfermedades crónicas graves (Dinu 2018; Grosso 2017; Rosato 2017; Sofi 2008; Sofi 2010; Sofi 2014). Por ejemplo, en un metanálisis integral de los estudios prospectivos observacionales que incluyó a 4 172 412 participantes, un aumento de dos puntos en la puntuación de la adherencia a la dieta mediterránea se asoció con una reducción del 8% en la mortalidad global y una reducción del 10% en el riesgo de ECV (Sofi 2014). Estos resultados se corroboraron de forma adicional en un resumen reciente de la evidencia de los metanálisis de los estudios observacionales y los ensayos clínicos aleatorios (Dinu 2018). Esta última revisión aporta evidencia consistente que apoya los efectos beneficiosos de una mayor adherencia a la dieta mediterránea sobre un rango de resultados de salud, incluida la mortalidad global, la ECV, la cardiopatía coronaria y el infarto de miocardio (Dinu 2018). Además, la dieta mediterránea se ha asociado con efectos favorables sobre los factores de riesgo de ECV grave. Por ejemplo, los estudios han documentado una disminución de la incidencia de hipertensión, diabetes mellitus y síndrome metabólico en conjunto con una mayor adherencia a un hábito dietético mediterráneo (Martinez‐Gonzalez 2008; Nunez‐Cordoba 2009; Psaltopoulou 2004; Rumawas 2009; Sánchez‐Taínta 2008). Estos resultados han sido corroborados por revisiones sistemáticas que apoyan los efectos beneficiosos de la dieta mediterránea sobre el síndrome metabólico y sus componentes individuales (Buckland 2008; Kastorini 2011).
En comparación con el gran conjunto de estudios observacionales epidemiológicos, hay menos evidencia de ensayos controlados aleatorios (ECA) bien realizados y con un poder estadístico suficiente, en especial con respecto a la eficacia potencial de la dieta mediterránea en la prevención primaria de la ECV (Serra‐Majem 2006). La mayoría de los ECA consideró el efecto de un tipo de dieta mediterránea sobre la aparición de complicaciones y los eventos recurrentes en pacientes con ECV existente y mostró efectos favorables en la prevención secundaria de las ECV (Barzi 2003; de Lorgeril 1994; de Lorgeril 1996; de Lorgeril 1999; de Lorgeril 2011; Panagiotakos 2016). También hay una considerable variabilidad en la definición y la duración de las intervenciones evaluadas.
La evidencia reciente del estudio PREDIMED (Prevención con Dieta Mediterránea), un ensayo amplio de prevención primaria (N = 7447) en individuos de alto riesgo de España, indicó que una dieta mediterránea modificada complementada con aceite de oliva extra virgen o frutos secos se asoció con beneficios cardiovasculares importantes (Estruch 2013). Específicamente, ambos grupos de intervención experimentaron una reducción de aproximadamente un 30% en la tasa de eventos cardiovasculares graves (infarto de miocardio, accidente cerebrovascular o muerte por causas cardiovasculares) en comparación con el grupo de dieta de control (asesoramiento para reducir la grasa en la dieta), después de un seguimiento mediano de 4,8 años (Estruch 2013). Este ensayo recientemente se ha retirado y se volvió a analizar debido a que surgieron problemas metodológicos en cuanto a la asignación al azar para dos de los 11 sitios y la inclusión de segundos miembros de la familia no asignados al azar. La nueva publicación realizó un control de los mismos en los análisis y ha realizado una serie de análisis de sensibilidad que excluyen estos sitios en los que se han encontrado resultados similares para las variables principales de evaluación clínicas (Estruch 2018).
Descripción de la intervención
El tipo original de dieta mediterránea refleja el hábito dietético común de las comunidades en los países de la región mediterránea a comienzos de los años sesenta (Keys 1986), que era una expresión de las raíces comunes culturales e históricas, y un conjunto compartido de hábitos del modo de vida y alimentarios en lugar de un mero surtido de micro y macronutrientes específicos (Trichopoulou 1997). Se ha definido la dieta mediterránea (Helsing 1989; Nestle 1995; Serra‐Majem 1993; Willett 1995), e incluye los siguientes factores dietéticos: un consumo alto de alimentos vegetales que comprendían principalmente frutas y hortalizas, cereales y panes de fibras enteras, frijoles, frutos secos y semillas; alimentos cultivados localmente, frescos y estacionales, no procesados; cantidades grandes de frutas frescas consumidas diariamente mientras que el azúcar concentrada o la miel se consumen unas pocas veces por semana en cantidades más pequeñas; aceite de oliva como un ingrediente principal al cocinar y una fuente de grasa; cantidades pequeñas a moderadas de queso y yogur; cantidades pequeñas de carne roja y cantidades mayores de pescado; y cantidades pequeñas a moderadas de vino tinto a menudo acompañando las comidas principales.
La intervención bajo investigación para la revisión actual fue el asesoramiento dietético para seguir una dieta de estilo mediterráneo o la provisión de alimentos relevantes a la dieta mediterránea o ambos. Se requirieron al menos dos componentes clave para cumplir con la definición de una dieta de estilo mediterráneo (Helsing 1989; Nestle 1995; Serra‐Majem 1993; Willett 1995).
Éstos incluyen:
1. cociente alto de grasas monoinsaturadas/saturadas (uso de aceite de oliva como ingrediente principal al cocinar o consumo de otros alimentos tradicionales con alto contenido de grasas monoinsaturadas como los frutos secos);
2. consumo alto de alimentos vegetales, incluidas las frutas, las hortalizas y las legumbres.
La justificación de esta definición se basa en el trabajo reciente (Grosso 2017; Martínez‐González 2017), que recalca que los efectos protectores de la dieta parecen ser más atribuibles al aceite de oliva, las frutas, las hortalizas y las legumbres. Se eligieron al menos dos de los componentes activos principales debido a que la definición de una dieta de estilo mediterráneo como un componente no constituye un hábito dietético.
Los componentes adicionales incluyen:
3. consumo bajo a moderado de vino tinto;
4. consumo alto de granos enteros y cereales;
5. consumo bajo de carnes y productos derivados y mayor consumo de pescado;
6. consumo moderado de leche y productos lácteos.
La dieta mediterránea tradicional no tiene un contenido bajo de grasa aunque se caracteriza por un aumento relativo de las grasas monoinsaturadas en forma de aceite de oliva y frutos secos en comparación con las grasas saturadas.
De qué manera podría funcionar la intervención
Hay una gran cantidad de evidencia de observación y experimental que apoya mecanismos potenciales para explicar el efecto beneficioso de la dieta mediterránea sobre la salud cardiovascular (Serra‐Majem 2006). Por ejemplo, hay evidencia de efectos favorables de la dieta mediterránea sobre la resistencia a la insulina y la vasorreactividad dependiente del endotelio, así como de efectos antioxidantes y antiinflamatorios de la dieta mediterránea y sus componentes individuales como las frutas y las hortalizas, el aceite de oliva, los frutos secos, las fibras enteras, el pescado y el vino tinto (Chrysohoou 2004; Dai 2008; Estruch 2010; Pitsavos 2005; Ryan 2000). Además, el hábito dietético mediterráneo se ha asociado con efectos beneficiosos sobre muchos factores de riesgo cardiovasculares, incluidas las lipoproteínas, la obesidad, la diabetes mellitus y la hipertensión (Buckland 2008; Kastorini 2011; Martinez‐Gonzalez 2008; Nunez‐Cordoba 2009; Psaltopoulou 2004; Rumawas 2009; Sánchez‐Taínta 2008). Además hay una gran cantidad de evidencia epidemiológica consistente que apoya la noción de que una ingesta leve a moderada de vino tinto (una o dos bebidas/día), y el consumo moderado de bebidas alcohólicas en general, se asocia con una reducción de la mortalidad por todas las causas y cardiovascular y de la morbilidad y tiene efectos beneficiosos sobre los factores de riesgo cardiovasculares, en comparación con la abstención y el consumo en exceso (Brien 2011; Corrao 2000; Di Castelnuovo 2002; Di Castelnuovo 2006; Ronksley 2011). Por el contrario, el consumo excesivo de bebidas alcohólicas se asocia con un mayor riesgo de mortalidad y morbilidad cardiovascular, principalmente a través del mayor riesgo de hipertensión y accidente cerebrovascular (Stranges 2004; Taylor 2009).
La evidencia de los ensayos recientes también sugiere efectos antiinflamatorios de la dieta mediterránea y también beneficios potenciales en la función endotelial (Estruch 2010; Schwingshackl 2014). En términos generales, los efectos protectores de la dieta mediterránea sobre los resultados de salud probablemente se derivan de las interacciones sinérgicas entre diferentes componentes como un hábito dietético en su totalidad en lugar de los efectos relativos de grupos alimentarios específicos (Grosso 2017).
Por qué es importante realizar esta revisión
La modificación de los factores dietéticos forma una parte integral de la prevención primaria de las enfermedades cardiovasculares, así como de su tratamiento clínico (prevención secundaria). Un hábito dietético de estilo mediterráneo probablemente produce un efecto beneficioso sobre la aparición de varias enfermedades crónicas, principalmente las ECV, que están estrechamente vinculadas a los hábitos del modo de vida y alimentarios. Esta noción es corrobora en las recomendaciones alimentarias de varias asociaciones científicas para la prevención de las enfermedades crónicas graves (AHA 2006; WHO 2003). Se procuró actualizar y ampliar la revisión sistemática anterior (New Reference), para examinar la efectividad de una dieta de estilo mediterráneo en la prevención primaria y secundaria de las ECV, por lo que los resultados son útiles para una audiencia más amplia, y para explorar la heterogeneidad aún más con un mayor número de estudios incluidos. Se incluyó a participantes en riesgo así como a pacientes con ECV establecida para informar las guías para la prevención y para el tratamiento de las ECV. También se consideró cualquier grupo de control y se estratificaron los resultados basado en lo anterior.
Objetivos
Determinar la efectividad de una dieta de estilo mediterráneo para la prevención primaria y secundaria de ECV.
Métodos
Criterios de inclusión de estudios para esta revisión
Tipos de estudios
Ensayos controlados aleatorios (ECA).
Tipos de participantes
Adultos de todas las edades (18 años o más) sin ECV establecida para examinar los efectos de una dieta de estilo mediterráneo en la prevención primaria de las ECV y pacientes con ECV establecida para determinar los efectos de la intervención en la prevención secundaria. La ECV establecida se definió como pacientes que habían presentado un infarto de miocardio (IM) anterior, un accidente cerebrovascular, un procedimiento de revascularización (injerto de derivación de arterias coronarias [IDAC] o angioplastia coronaria transluminal percutánea [ACTP]), pacientes con angina, o CC definida mediante angiografía, enfermedad cerebrovascular (accidente cerebrovascular) y enfermedad arterial periférica. Para los participantes sin ECV establecida se incluyeron los de la población en general y las personas en mayor riesgo de ECV. Se excluyeron los estudios realizados exclusivamente en pacientes con diabetes tipo 2 (DMT2) debido a que aunque la DMT2 es un factor de riesgo principal de ECV, los pacientes con DMT2 forman un grupo específico y las intervenciones para la diabetes están cubiertas específicamente por el grupo de revisión Cochrane de Trastornos Metabólicos y Endocrinos. Se realizaron análisis estratificados para examinar los efectos de una dieta de estilo mediterráneo sobre las personas con y sin ECV establecida.
Tipos de intervenciones
La intervención bajo investigación para la revisión actual fue el asesoramiento dietético para seguir una dieta de estilo mediterráneo o la provisión de alimentos relevantes a la dieta mediterránea, o ambos. Se requirieron al menos dos componentes clave para cumplir con la definición de una dieta de estilo mediterráneo (Helsing 1989; Nestle 1995; Serra‐Majem 1993; Willett 1995).
Éstos incluyen:
1. cociente alto de grasas monoinsaturadas/saturadas (uso de aceite de oliva como principal ingrediente al cocinar o consumo de otros alimentos tradicionales con alto contenido de grasas monoinsaturadas como los frutos secos);
2. consumo alto de alimentos vegetales, incluidas las frutas, las hortalizas y las legumbres.
La justificación de esta definición se basa en el trabajo reciente (Grosso 2017; Martínez‐González 2017), que recalca que los efectos protectores de la dieta parecen ser más atribuibles al aceite de oliva, las frutas, las hortalizas y las legumbres. Se eligieron al menos dos de los componentes activos principales debido a que la definición de una dieta de estilo mediterráneo como un componente no constituye un hábito dietético.
Los componentes adicionales incluyen:
3. consumo bajo a moderado de vino tinto;
4. alto consumo alto de granos enteros y cereales;
5. consumo bajo de carnes y productos derivados y mayor consumo de pescado;
6. consumo moderado de leche y productos lácteos.
La dieta mediterránea tradicional no tiene un contenido bajo de grasa aunque se caracteriza por un aumento relativo de las grasas monoinsaturadas en forma de aceite de oliva y frutos secos en comparación con las grasas saturadas.
El interés se centró en el estudio de los efectos de una dieta de estilo mediterráneo por lo cual se excluyeron los estudios con intervenciones multicomponentes incluidas otras intervenciones alimentarias o intervenciones del modo de vida como el ejercicio a menos que los efectos de la dieta de estilo mediterráneo se informaran por separado.
Se incluyeron sólo los estudios con períodos de seguimiento de tres meses o más definidos como el período de intervención más el seguimiento posintervención. Se consideraron los ensayos en los que el grupo de comparación era ninguna intervención o una intervención mínima (p.ej. volante para seguir un hábito dietético sin intervención persona a persona ni refuerzo) y también otras intervenciones alimentarias.
En el análisis principal no se combinaron los estudios de prevención primaria y secundaria ni diferentes grupos comparadores debido a este procedimiento habría dado lugar a que la interpretación de los resultados sea difícil debido a la heterogeneidad; en cambio se realizaron cuatro análisis principales:
-
Intervención dietética mediterránea versus ninguna intervención o intervención mínima para la prevención primaria;
-
Intervención dietética mediterránea versus otra intervención dietética para la prevención primaria;
-
Intervención dietética mediterránea versus la atención habitual para la prevención secundaria;
-
Intervención dietética mediterránea versus otra intervención dietética para la prevención secundaria.
Tipos de medida de resultado
Se midieron las variables principales de evaluación mediante medidas validadas.
Resultados primarios
-
Mortalidad cardiovascular.
-
Mortalidad por todas las causas.
-
Variables de evaluación no mortales como IM, IDAC, ICP, angina o CC definida mediante angiografía, accidente cerebrovascular, endarterectomía carótida y enfermedad arterial periférica (EAP).
Resultados secundarios
-
Cambios en los lípidos sanguíneos (colesterol total, colesterol de lipoproteínas de alta densidad [HDL, por sus siglas en inglés], colesterol de lipoproteínas de baja densidad [LDL, por sus siglas en inglés], triglicéridos) y presión arterial (presión arterial sistólica y diastólica).
-
Aparición de diabetes tipo 2 como factor de riesgo de ECV grave.
-
Calidad de vida relacionada con la salud.
-
Efectos adversos (tal como los definieron los autores de los ensayos incluidos).
-
Costes.
Métodos de búsqueda para la identificación de los estudios
Búsquedas electrónicas
We searched the following electronic databases:
-
Cochrane Central Register of Controlled Trials (CENTRAL; 2018, Issue 9) in the Cochrane Library (searched 26 September 2018);
-
MEDLINE Daily and MEDLINE Epub Ahead of Print, In‐Process & Other Non‐Indexed Citations (Ovid, 1946 to 25 September 2018) (searched 26 September 2018);
-
Embase (Ovid, 1980 to 2018 week 39) (searched 26 September 2018);
-
Web of Science Core Collection (Thomson Reuters, 1900 to 26 September 2018) (searched 26 September 2018);
-
DARE Issue 2 of 4, 2015 (Cochrane Library) – no longer updated (searched 26 June 2017);
-
HTA Issue 4 of 4, 2016 (Cochrane Library) – no longer updated (searched 26 June 2017);
-
NHS EED Issue 2 of 4, 2015 (Cochrane Library) – no longer updated (searched 26 June 2017).
We used medical subject headings (MeSH) or equivalent and text word terms and the Cochrane sensitivity‐maximising RCT filter for MEDLINE (Lefebvre 2011), and adaptations of it for Embase and Web of Science. We applied no language restrictions. We tailored searches to individual databases (Appendix 1).
Búsqueda de otros recursos
In addition, we checked reference lists of reviews for additional studies.
We searched ClinicalTrials.gov (www.clinicaltrials.gov) and the World Health Organization (WHO) International Clinical Trials Registry Platform (ICTRP) (apps.who.int/trialsearch/) for ongoing trials. The the metaRegister of controlled trials (mRCT) (www.controlled‐trials.com/mrct) is no longer available and was searched last for the previous review publication (Rees 2013).
We contacted authors where necessary for additional information. We will continue to monitor retraction statements for included studies.
Obtención y análisis de los datos
Selección de los estudios
Two review authors (of KR, NM, AT, LE, DW, AV, AD) independently screened titles and abstracts for inclusion of all the potential studies identified as a result of the searches and coded them as 'retrieve' (eligible or potentially eligible/unclear) or 'do not retrieve'. We combined the responses from each of the two review authors and retrieved the full‐text study reports/publication. Two review authors (of KR, NM, AT, LE, DW, AV, AD, LH) independently screened the full text and identified studies for inclusion and exclusion using the pre‐specified inclusion criteria. In the case of any disagreements, a third author arbitrated (KR). We identified and excluded duplicates and collated multiple reports of the same study so that each study rather than each report was the unit of interest in the review. We recorded the selection process in sufficient detail to complete a PRISMA flow diagram.
Extracción y manejo de los datos
We used a data collection form for study characteristics and outcome data, which we had piloted. Two review authors (of KR, LE, DW, AV, AD, LH) extracted the following characteristics from included studies:
-
Methods: study design, total duration of study, number of study centres and location, study setting and date of study.
-
Participants: N randomised, N lost to follow‐up/withdrawn, N analysed, mean age, age range, gender, primary or secondary prevention (at increased risk of CVD, or established CVD), inclusion criteria and exclusion criteria.
-
Interventions: intervention, comparison, concomitant treatments/medications.
-
Outcomes: primary and secondary outcomes specified and collected, and time points reported.
-
Additional notes, e.g. conflicts of interest of trial authors.
Disagreements were resolved by consensus or by involving a third person (KR). One review author (KR) transferred data into the Review Manager (RevMan 2014) file (RevMan 2014). We double‐checked that data were entered correctly by comparing the data presented in the systematic review with the data extraction form.
Evaluación del riesgo de sesgo de los estudios incluidos
Two review authors (of KR, LE, DW, AV, AD, LH) independently assessed risk of bias for each study using the criteria outlined in the Cochrane Handbook for Systematic Reviews of Interventions (Higgins 2011). We resolved any disagreements by discussion or by involving another author (KR). We assessed the risk of bias according to the following domains.
-
Random sequence generation.
-
Allocation concealment.
-
Blinding of participants and personnel.
-
Blinding of outcome assessment.
-
Incomplete outcome data.
-
Selective outcome reporting.
-
Other bias.
We graded each potential source of bias as high, low or unclear and provided a quote from the study report together with a justification for our judgement in the 'Risk of bias' table. We summarised the risk of bias judgements across different studies for each of the domains listed. We expected blinding of participants and personnel to be difficult to achieve and unlikely for trials of dietary interventions and so we have not recorded this as high risk but unclear.
For cluster‐randomised trials we intended to follow the guidance in section 16.3.2 of the Cochrane Handbook for Systematic Reviews of Interventions (Higgins 2011), and to explore the following: recruitment bias, baseline imbalance, loss of clusters, incorrect analysis and comparability with individually randomised trials. However, no cluster‐randomised trials met our inclusion criteria.
When considering treatment effects, we took into account the risk of bias for the studies that contribute to that outcome.
Medidas del efecto del tratamiento
We processed data in accordance with the Cochrane Handbook for Systematic Reviews of Interventions (Higgins 2011). We expressed dichotomous outcomes as risk ratios (RR) with 95% confidence intervals (CI). Where available we have used adjusted estimates of treatment effect as hazard ratios, and used the inverse variance method to pool these statistically. For continuous variables, we compared net changes (i.e. intervention group minus control group differences) and calculated mean differences (MD) and 95% CIs for each study. We intended to use standardised mean difference (SMD) where different scales had been used to measure the same outcome (e.g. quality of life) and to test the robustness of using this and MD using sensitivity analyses. However, none of the included studies reported these outcomes. We narratively described skewed data reported as medians and interquartile ranges.
Cuestiones relativas a la unidad de análisis
We intended to analyse cluster‐randomised trials in accordance with guidance in section 16.3.2 of the Cochrane Handbook for Systematic Reviews of Interventions (Higgins 2011), however no cluster‐RCTs met the inclusion criteria. For trials with multiple arms we divided the control group N by the number of arms to avoid double‐counting in meta‐analyses. We analysed outcomes at the longest period of follow‐up where multiple measurements had been taken unless there was significant (> 30%) attrition.
Manejo de los datos faltantes
Where standard deviations (SD) for outcomes were not reported, other variance measures such as standard errors and confidence intervals were not available to derive SDs from and we were unable to obtain information from study authors, we imputed these following the methods presented in the Cochrane Handbook for Systematic Reviews of Interventions (Higgins 2011). Where studies did not report results as change from baseline for continuous outcomes, we calculated these and the SD differences following the methods presented in the Cochrane Handbook for Systematic Reviews of Interventions for imputing these (Section 16.1.3.2 Imputing standard deviations for changes from baseline; Higgins 2011), and assumed a correlation of 0.5 between baseline and follow‐up measures as suggested by Follman 1992.
Evaluación de la heterogeneidad
We used the I² statistic to measure heterogeneity among the trials in each analysis. When we identified substantial heterogeneity (50% to 90%) we reported it and explored possible causes by prespecified subgroup analysis. Where heterogeneity was considerable (75% to 100%), we did not pool studies statistically but presented them in forest plots and suppressed the summary effect estimate.
Evaluación de los sesgos de notificación
For outcomes where we were able to pool more than 10 trials, we created and examined a funnel plot to explore possible publication bias and these fed into the GRADE assessment (see below).
Síntesis de los datos
We undertook meta‐analyses only where this was meaningful, i.e. if the treatments, participants and the underlying clinical question were similar enough for pooling to make sense. We used a random‐effects model as we cannot assume that all studies in the meta‐analysis are estimating the same intervention effect, but rather are estimating intervention effects that follow a distribution across studies.
'Summary of findings' table
We created a 'Summary of findings' tables using the following outcomes:
-
Cardiovascular mortality.
-
All‐cause mortality.
-
Non‐fatal endpoints such as MI, CABG, PTCA, angina or angiographically defined CHD, stroke, carotid endarterectomy or peripheral arterial disease (PAD).
-
Changes in blood lipids (total cholesterol, high‐density lipoprotein (HDL) cholesterol, low‐density lipoprotein (LDL) cholesterol, triglycerides) and blood pressure (systolic and diastolic blood pressure).
-
Adverse events.
We used the five GRADE considerations (study limitations, consistency of effect, imprecision, indirectness and publication bias) to assess the quality of a body of evidence as it relates to the studies that contribute data to the meta‐analyses for the prespecified outcomes. We used methods and recommendations described in Section 8.5 and Chapter 12 of the Cochrane Handbook for Systematic Reviews of Interventions (Higgins 2011), using GRADEpro software (https://gradepro.org/). We created a separate 'Summary of findings' table for each comparison:
-
Mediterranean dietary intervention versus no intervention or minimal intervention for primary prevention;
-
Mediterranean dietary intervention versus another dietary intervention for primary prevention;
-
Mediterranean dietary intervention versus usual care for secondary prevention;
-
Mediterranean dietary intervention versus another dietary intervention for secondary prevention.
We justified all decisions to downgrade the quality of studies using footnotes and made comments to aid the reader's understanding of the review where necessary.
Two review authors (AT, NM) working independently made judgements about evidence quality, with disagreements resolved by discussion or involving a third author (KR). We justified, documented and incorporated the judgements into reporting of results for each outcome.
Análisis de subgrupos e investigación de la heterogeneidad
We have stratified the main analyses for the following comparisons, to address heterogeneity and aid interpretation of findings:
-
Mediterranean dietary intervention versus no intervention or minimal intervention for primary prevention;
-
Mediterranean dietary intervention versus another dietary intervention for primary prevention;
-
Mediterranean dietary intervention versus usual care for secondary prevention;
-
Mediterranean dietary intervention versus another dietary intervention for secondary prevention.
We have also performed subgroup analyses to examine the effect of interventions described as the Mediterranean diet or style of diet or those including both of the core components of increased fruit and vegetable consumption and exchange of saturated fat for monounsaturated fat, compared with other interventions meeting our criteria.
Análisis de sensibilidad
We excluded two studies from the main analysis in sensitivity analyses where concerns have been publicly made as to the reliability of the data (Singh 1992; Singh 2002).
We intended to conduct sensitivity analyses including only studies at low risk of bias in the domains of random sequence generation, allocation concealment and incomplete outcome data, but for the majority of studies these domains were rated as unclear.
Reaching conclusions
We based our conclusions only on findings from the quantitative and narrative synthesis of included studies for this review. We avoided making recommendations for practice and our implications for research suggest priorities for future research and outline what the remaining uncertainties are in the area.
Results
Description of studies
Results of the search
The original review explored the effects of a Mediterranean‐style diet compared to no intervention or minimal intervention for the primary prevention of CVD and included 11 RCTs (New Reference). The current review represents a substantive update and expansion in scope to include also secondary prevention in those with established CVD and other dietary interventions as comparison groups.
The previous review, New Reference, identified 11 RCTs and one ongoing trial and six of these RCTs are included in the current review. Five studies in the previous review were excluded from this update as the definition of a Mediterranean‐style diet has been refined further following expert review and recent evidence suggesting the most likely active components (see Types of interventions). Searching to September 2018 identified a further 12,133 references, which reduced to 9483 after de‐duplication. We also re‐screened the database from the original review given the expansion in scope in terms of both participants and comparison groups. From the updated searching we shortlisted 187 studies and these went forward for formal inclusion and exclusion. From re‐screening the original database we shortlisted 77 studies and these went forward for formal inclusion and exclusion. Following full‐text review and collation of multiple papers for individual studies 30 RCTs (49 papers) and seven ongoing trials met the inclusion criteria. The flow of studies throughout the review is presented in the PRISMA diagram in Figure 1.

Study flow diagram.
Included studies
Details of the methods, participants, intervention, comparison group and outcome measures for each of the studies included in the review are shown in the Characteristics of included studies table. A summary of the description of included studies is presented below for each comparison group for clarity.
1. Mediterranean dietary intervention versus no intervention or minimal intervention for primary prevention
Nine trials (11 papers) were included with 1337 participants randomised.
The health status of participants varied between studies. The majority of participants were classified as healthy and were recruited by three of the trials (Castagnetta 2002; Djuric 2009; Konstantinidou 2010), with two further trials recruiting elderly people (Clements 2017; Davis 2017). The remaining four trials recruited previously untreated hypercholesteraemic participants (Wardle 2000), elderly participants with long‐standing hypercholesterolaemia (Lindman 2004), and sedentary people with metabolic syndrome (Esposito 2004) or metabolic disease (Chasapidou 2014). Two trials recruited only women: one recruited only postmenopausal women (Castagnetta 2002), and the other trial recruited women aged 25 to 65 years (Djuric 2009). In contrast, one trial recruited only men (Lindman 2004), and the remaining six recruited both men and women (Chasapidou 2014; Clements 2017; Davis 2017; Esposito 2004; Konstantinidou 2010; Wardle 2000). The trials were conducted in the US (Djuric 2009), Italy (Castagnetta 2002; Esposito 2004), Spain (Konstantinidou 2010), Greece (Chasapidou 2014), Norway (Lindman 2004), Australia (Davis 2017) and the UK (Clements 2017; Wardle 2000). The duration of the intervention and follow‐up periods varied: three months (Konstantinidou 2010; Wardle 2000), six months (Castagnetta 2002; Chasapidou 2014; Davis 2017; Djuric 2009; Lindman 2004), one year (Clements 2017), and two years (Esposito 2004).
We identified four ongoing trials (Hardman 2015; NCT03053843; NCT03129048; Sotos‐Prieto 2017) (see Characteristics of ongoing studies table). All describe the intervention as a Mediterranean diet. Three will report CVD risk factors in an elderly Australian population (Hardman 2015), older obese adults from the US (NCT03129048), and firefighters from the US (Sotos‐Prieto 2017), and one will report quality of life in patients with atrial fibrillation (NCT03053843).
2. Mediterranean dietary intervention versus another dietary intervention for primary prevention
Thirteen trials (25 papers) were included with 8687 participants randomised. The majority of participants were enrolled in one large multicentre trial (7747 participants, PREDIMED).
The health status of participants varied between studies. The majority of participants were described as at increased risk of CVD (Dinu 2017; PREDIMED; Sofi 2018; Vincent‐Baudry 2005), with specific diagnoses of hypertension (Lapetra 2018), central obesity (Bajerska 2018), hypercholesterolaemia (Athyros 2011), non‐alcoholic fatty liver disease (NAFLD) (Misciagna 2017; Properzi 2018), HIV (Ng 2011; Stradling 2018), and heart or lung transplant recipients (Entwistle 2018). One study recruited women with breast cancer (Skouroliakou 2017). Two trials recruited only women (Bajerska 2018; Skouroliakou 2017), the remainder recruiting both men and women. The trials were conducted in Spain (Lapetra 2018; PREDIMED), Italy (Dinu 2017; Misciagna 2017; Sofi 2018), Greece (Athyros 2011; Skouroliakou 2017), France (Vincent‐Baudry 2005), the UK (Entwistle 2018; Stradling 2018), Poland (Bajerska 2018), Australia (Properzi 2018), and China (Ng 2011). The duration of the intervention and follow‐up periods varied: three months (Dinu 2017; Properzi 2018; Sofi 2018; Vincent‐Baudry 2005), four months (Athyros 2011; Bajerska 2018), six months (Misciagna 2017; Skouroliakou 2017), one year (Entwistle 2018; Ng 2011; Stradling 2018), two years (Lapetra 2018), and up to five years (PREDIMED).
The dietary interventions in the comparison group varied, including low‐fat (Athyros 2011; Entwistle 2018; Lapetra 2018; Ng 2011; PREDIMED; Properzi 2018; Stradling 2018; Vincent‐Baudry 2005), the traditional diet of that country (Bajerska 2018), national recommendations/disease‐specific guidance (Misciagna 2017; Skouroliakou 2017), and vegetarian (Dinu 2017; Sofi 2018).
We identified one ongoing trial (Papamiltiadous 2016) (see Characteristics of ongoing studies table) looking at the effects of a Mediterranean diet compared to a low‐fat moderate carbohydrate diet on CVD risk factors in NAFLD.
3. Mediterranean dietary intervention versus usual care for secondary prevention
Two trials (four papers) were included with 706 participants randomised.
Both trials recruited patients with CVD, one in men and women with CHD (Michalsen 2006), and the other in men and women who had experienced a myocardial infarction within six months (The Lyon Diet Heart Study). Participants were recruited from Germany (Michalsen 2006) and France (The Lyon Diet Heart Study). The duration of the intervention and follow‐up periods varied from 12 months (Michalsen 2006) to 24 and 46 months (The Lyon Diet Heart Study).
No ongoing trials have been identified to date for this comparison group.
4. Mediterranean dietary intervention versus another dietary intervention for secondary prevention
Six trials (10 papers) were included with 1731 participants randomised. An expression of concern has been published about the reliability of two of the studies in this comparison group (Singh 1992; Singh 2002), and we have conducted sensitivity analyses excluding these studies from all analyses. These were also the trials with the majority of participants (1406 participants, Singh 1992; Singh 2002).
All trials recruited patients with CVD. Three trials recruited men and women with CHD (Colquhoun 2000; Mayr 2018; Weber 2012), one after a first myocardial infarction (Tuttle 2008) and one with acute myocardial infarction or unstable angina (Singh 1992). One trial recruited patients with established CHD or those at high risk of CHD, although the majority of participants had established disease (58% in the intervention group and 59% in the comparison group) so this study has been analysed as a secondary prevention study (Singh 2002). Participants were recruited from Australia (Colquhoun 2000; Mayr 2018), the US (Tuttle 2008), Brazil (Weber 2012), and India (Singh 1992; Singh 2002). The duration of the intervention and follow‐up periods varied: three months (Colquhoun 2000; Weber 2012), six months (Mayr 2018), and two years (Singh 1992; Singh 2002; Tuttle 2008).
In a pilot trial, the comparison group comprised foods typical of the Mediterranean diet and the intervention was a Brazilian cardioprotective diet following the principles of the Mediterranean dietary pattern but with local foods to enhance adherence (Weber 2012). We have used the Mediterranean diet as the intervention group in our analyses.
The dietary interventions in the comparison group varied, including low‐fat (Colquhoun 2000; Mayr 2018; Tuttle 2008) and national recommendations/disease‐specific guidance (Singh 1992; Singh 2002; Weber 2012).
We identified two ongoing trials (Delgado‐Lista 2016; Itsiopoulos 2018) (see Characteristics of ongoing studies table) in patients with CHD and all will report on clinical endpoints.
Excluded studies
Details and reasons for exclusion for the studies that most closely missed the inclusion criteria are presented in the Characteristics of excluded studies table. The majority of studies were excluded on the basis of the intervention not meeting the two core criteria of a Mediterranean‐style diet (see Types of interventions) or studies were short‐term (less than 12 weeks).
Risk of bias in included studies
Details are provided for each of the included studies in the 'Risk of bias' section of the Characteristics of included studies table and summaries are presented in Figure 2 and Figure 3. We assessed risk of bias as 'low', 'high' or 'unclear'. A summary of the risk of bias of the included studies is presented below for each comparison group for clarity.

'Risk of bias' graph: review authors' judgements about each risk of bias item presented as percentages across all included studies.
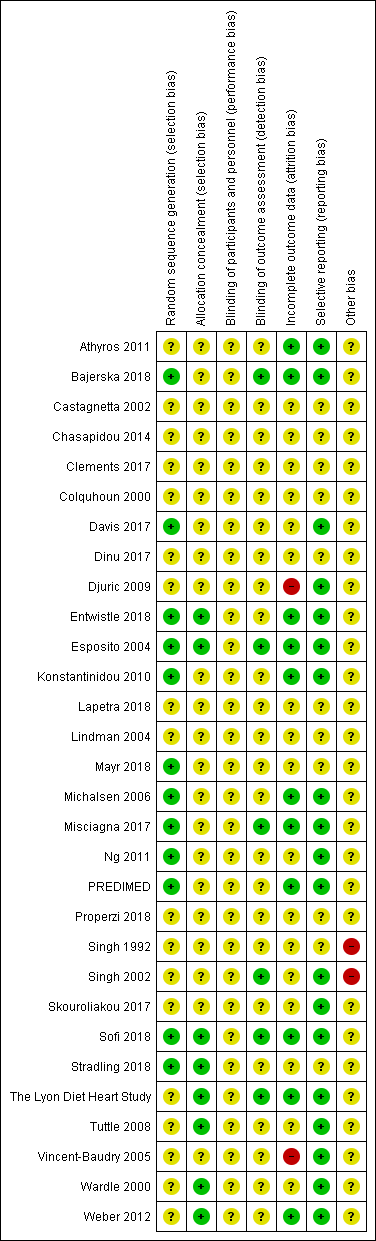
'Risk of bias' summary: review authors' judgements about each risk of bias item for each included study.
Allocation
1. Mediterranean dietary intervention versus no intervention or minimal intervention for primary prevention
The methods of random sequence generation were unclear in six of the nine included studies (Castagnetta 2002; Chasapidou 2014; Clements 2017; Djuric 2009; Lindman 2004; Wardle 2000). In the three studies where this was clear, we judged the methods used to be at low risk of bias (Davis 2017; Esposito 2004; Konstantinidou 2010). The methods of allocation concealment were unclear in seven of the nine included studies. Where this was clear, we judged the methods used to be at low risk of bias (Esposito 2004; Wardle 2000).
2. Mediterranean dietary intervention versus another dietary intervention for primary prevention
The methods of random sequence generation were unclear in six of the 13 included studies (Athyros 2011; Lapetra 2018; Dinu 2017; Properzi 2018; Skouroliakou 2017; Vincent‐Baudry 2005). In the seven studies where this was clear, we judged the methods used to be at low risk of bias (Bajerska 2018; Entwistle 2018; Misciagna 2017; Ng 2011; PREDIMED; Sofi 2018; Stradling 2018). The methods of allocation concealment were unclear in 10 of the 13 included studies. Where this was clear, we judged the methods used to be at low risk of bias (Entwistle 2018; Sofi 2018; Stradling 2018).
3. Mediterranean dietary intervention versus usual care for secondary prevention
The methods of random sequence generation were unclear in one of the two included studies (The Lyon Diet Heart Study), and in the other we judged the methods used to be at low risk of bias (Michalsen 2006). The methods of allocation concealment were unclear in one study (Michalsen 2006) and in the other we judged the methods used to be at low risk of bias (The Lyon Diet Heart Study).
4. Mediterranean dietary intervention versus another dietary intervention for secondary prevention
The methods of random sequence generation were unclear in five of the six included studies (Colquhoun 2000; Singh 1992; Singh 2002; Tuttle 2008; Weber 2012), and in the one study where this was clear, we judged the methods used to be at low risk of bias (Mayr 2018). The methods of allocation concealment were unclear in four of the six included studies. Where this was clear, we judged the methods used to be at low risk of bias (Tuttle 2008; Weber 2012).
Blinding
The blinding of participants and personnel for behavioural interventions is difficult, if not impossible, in most cases and so we have not judged this as a high risk of bias. We rated this domain as unclear for all trials in all four comparison groups.
1. Mediterranean dietary intervention versus no intervention or minimal intervention for primary prevention
The blinding of participants and personnel was unclear in all nine trials. Blinding of outcome assessment was unclear in eight of the nine trials (Castagnetta 2002; Chasapidou 2014; Clements 2017; Davis 2017; Djuric 2009; Konstantinidou 2010; Lindman 2004; Wardle 2000). In the remaining trial, outcome assessments were made blind to the group assignment and we judged this to be at low risk of bias (Esposito 2004).
2. Mediterranean dietary intervention versus another dietary intervention for primary prevention
The blinding of participants and personnel was unclear in all 13 trials. Blinding of outcome assessment was unclear in 10 of the 13 trials (Athyros 2011; Entwistle 2018; Lapetra 2018; Dinu 2017; Ng 2011; PREDIMED; Properzi 2018; Skouroliakou 2017; Stradling 2018; Vincent‐Baudry 2005). In the remaining three trials, outcome assessments were made blind to the group assignment and we judged this to be at low risk of bias (Bajerska 2018; Misciagna 2017; Sofi 2018).
3. Mediterranean dietary intervention versus usual care for secondary prevention
The blinding of participants and personnel was unclear in both trials. Blinding of outcome assessment was unclear in one trial (Michalsen 2006). In the remaining trial, outcome assessments were made blind to the group assignment and we judged this to be at low risk of bias (The Lyon Diet Heart Study).
4. Mediterranean dietary intervention versus another dietary intervention for secondary prevention
The blinding of participants and personnel was unclear in all six trials. Blinding of outcome assessment was unclear in five of the six trials (Colquhoun 2000; Mayr 2018; Singh 1992; Tuttle 2008; Weber 2012). In the remaining trial, outcome assessments were made blind to the group assignment and we judged this to be at low risk of bias (Singh 2002).
Incomplete outcome data
1. Mediterranean dietary intervention versus no intervention or minimal intervention for primary prevention
We judged three of the nine trials to be at low risk of bias as loss to follow‐up was low and reasons provided or intention‐to‐treat (ITT) analyses were performed, or both (Esposito 2004; Konstantinidou 2010; Wardle 2000). We judged one study to be at high risk of bias as there was differential loss to follow‐up that exceeded 20% in the intervention group (Djuric 2009). For the remaining trials, we judged the risk of bias as unclear.
2. Mediterranean dietary intervention versus another dietary intervention for primary prevention
We judged six of the 13 trials to be at low risk of bias as loss to follow‐up was absent or low and reasons provided or ITT analyses were performed, or both (Athyros 2011; Bajerska 2018; Entwistle 2018; Misciagna 2017; PREDIMED; Sofi 2018). We judged one study to be at high risk of bias for attrition due to differential loss to follow‐up between the intervention and comparison groups with loss to follow‐up at 36% in the comparison diet (Vincent‐Baudry 2005). For the remaining trials, we judged the risk of bias as unclear.
3. Mediterranean dietary intervention versus usual care for secondary prevention
We judged both trials to be at low risk of bias as loss to follow‐up was low and reasons provided or ITT analyses were performed (Michalsen 2006; The Lyon Diet Heart Study).
4. Mediterranean dietary intervention versus another dietary intervention for secondary prevention
For all six trials (Colquhoun 2000; Mayr 2018; Singh 1992; Singh 2002; Tuttle 2008; Weber 2012), we judged the risk of attrition bias as unclear.
Selective reporting
1. Mediterranean dietary intervention versus no intervention or minimal intervention for primary prevention
For four studies we judged the risk of bias associated with selective reporting as unclear (Castagnetta 2002; Chasapidou 2014; Clements 2017; Lindman 2004). The remaining five studies clearly stated the primary and secondary outcomes and reported the results for these and were therefore judged to be of low risk of bias in this domain (Davis 2017; Djuric 2009; Esposito 2004; Konstantinidou 2010; Wardle 2000).
2. Mediterranean dietary intervention versus another dietary intervention for primary prevention
For four studies we judged the risk of bias associated with selective reporting as unclear (Dinu 2017; Lapetra 2018; Properzi 2018; Stradling 2018). The remaining nine studies clearly stated the primary and secondary outcomes and reported the results for these and were therefore judged to be of low risk of bias in this domain (Athyros 2011; Bajerska 2018; Entwistle 2018; Misciagna 2017; Ng 2011; PREDIMED; Skouroliakou 2017; Sofi 2018; Vincent‐Baudry 2005).
3. Mediterranean dietary intervention versus usual care for secondary prevention
Both studies clearly stated the primary and secondary outcomes and reported the results for these and were therefore judged to be of low risk of bias (Michalsen 2006; The Lyon Diet Heart Study).
4. Mediterranean dietary intervention versus another dietary intervention for secondary prevention
For three studies we judged the risk of bias associated with selective reporting as unclear (Colquhoun 2000; Mayr 2018; Singh 1992). The remaining three studies clearly stated the primary and secondary outcomes and reported the results for these and were therefore judged to be of low risk of bias in this domain (Singh 2002; Tuttle 2008; Weber 2012).
Other potential sources of bias
1. Mediterranean dietary intervention versus no intervention or minimal intervention for primary prevention
There was insufficient information to judge the risk of other sources of bias and we categorised all nine studies as unclear (Castagnetta 2002; Chasapidou 2014; Clements 2017; Davis 2017; Djuric 2009; Esposito 2004; Konstantinidou 2010; Lindman 2004; Wardle 2000).
2. Mediterranean dietary intervention versus another dietary intervention for primary prevention
There was insufficient information to judge the risk of other sources of bias and we categorised all 13 studies as unclear (Athyros 2011; Bajerska 2018; Dinu 2017; Entwistle 2018; Lapetra 2018; Misciagna 2017; Ng 2011; PREDIMED; Properzi 2018; Skouroliakou 2017; Sofi 2018; Stradling 2018; Vincent‐Baudry 2005).
3. Mediterranean dietary intervention versus usual care for secondary prevention
There was insufficient information to judge the risk of other sources of bias and we categorised both studies as unclear (Michalsen 2006; The Lyon Diet Heart Study).
4. Mediterranean dietary intervention versus another dietary intervention for secondary prevention
An expression of concern has been published about the reliability of two of the studies in this comparison group (Singh 1992; Singh 2002). We have conducted sensitivity analyses excluding these studies from all analyses. We regarded these two studies as at high risk of other bias. We judged the remaining four studies as at unclear risk of other sources of bias as there was insufficient information to make a judgement (Colquhoun 2000; Mayr 2018; Tuttle 2008; Weber 2012).
Effects of interventions
See: Summary of findings for the main comparison Mediterranean dietary intervention compared to no intervention or minimal intervention for the primary prevention of cardiovascular disease; Summary of findings 2 Mediterranean dietary intervention compared to another dietary intervention for the primary of cardiovascular disease; Summary of findings 3 Mediterranean dietary intervention compared to usual care for secondary prevention of cardiovascular disease; Summary of findings 4 Mediterranean dietary intervention compared to another dietary intervention for the secondary prevention of cardiovascular disease
See: summary of findings Table for the main comparison; summary of findings Table 2; summary of findings Table 3; summary of findings Table 4.
Data are presented in the analyses by primary and secondary prevention of CVD and by comparison group ‐ no intervention/usual care/minimal intervention versus another dietary intervention.
As an expression of concern has been published about the reliability of the studies Singh 1992 and Singh 2002, we conducted sensitivity analyses excluding these studies. This affects the following outcomes in the Mediterranean dietary intervention versus another dietary intervention for secondary prevention comparisons: non‐fatal MI, fatal MI, sudden cardiac death, total cardiac endpoints, lipid levels and blood pressure.
Clinical events (primary outcomes: cardiovascular mortality, all‐cause mortality and other non‐fatal endpoints)
1. Mediterranean dietary intervention versus no intervention or minimal intervention for primary prevention
None of the nine included studies reported on clinical events. Trials were relatively small (numbers randomised ranged from 60 to 384) and short‐term (three months to two years).
2. Mediterranean dietary intervention versus another dietary intervention for primary prevention
The PREDIMED trial was the only trial reporting clinical events for this comparison. PREDIMED comprised two dietary interventions: the PREDIMED intervention plus supplementation with extra‐virgin olive oil and the PREDIMED intervention plus supplementation with tree nuts, and compared these to a low‐fat diet. The trial included 7447 men and women from 11 sites in Spain at increased risk of CVD. The trial was stopped early as clear benefits of the Mediterranean diet over the low‐fat diet were seen for the primary outcome at 4.8 years. The original trial, Estruch 2013, was retracted and re‐analysed when methodological issues concerning randomisation came to light for two sites, and the inclusion of non‐randomised second household members. The new publication controlled for these in the analyses and conducted a series of sensitivity analyses excluding these sites (Estruch 2018).
The new publication reports on the composite clinical outcome, CVD and total mortality, MI and stroke where an effect of the PREDIMED intervention compared to a low‐fat diet on composite clinical endpoints was found (hazard ratio (HR) 0.70, 95% confidence interval (CI) 0.58 to 0.85) (Analysis 2.1). In sensitivity analyses, the hazard ratio for this outcome in 6405 participants compared to control was 0.65 (95% CI 0.50 to 0.85) when excluding participants from site D and second household members, and 0.69 (95% CI 0.53 to 0.92) in 5859 participants when excluding participants also from site B.
The re‐analysed paper also reports clinical endpoints separately where there was little or no effect of the PREDIMED intervention compared to a low‐fat diet on total mortality (HR 1.0, 95% CI 0.81 to 1.24, low‐quality evidence) (Analysis 2.3), CVD mortality (HR 0.81, 95% CI 0.50 to 1.32, low‐quality evidence) (Analysis 2.2) or myocardial infarction (HR 0.79, 95% CI 0.57 to 1.10, low‐quality evidence) (Analysis 2.4), but moderate‐quality evidence for a reduction in the number of strokes with the intervention (HR 0.60, 95% CI 0.45 to 0.80) (Analysis 2.5). Reductions in the numbers of participants experiencing peripheral arterial disease were also observed with the PREDIMED intervention (HR 0.42, 95% CI 0.28 to 0.61, moderate‐quality evidence) (Analysis 2.6), but these data are less certain as they were not re‐analysed in the recent paper (Estruch 2018), but come from earlier reports of the trial.
One small trial (N = 180) comparing the Mediterranean diet to a low‐fat diet in hypertensive patients reported unadjusted estimates for stroke of risk ratio (RR) 0.33, 95% CI 0.04 to 3.14) over two years of follow‐up (Analysis 2.8) (Lapetra 2018).
3. Mediterranean dietary intervention versus usual care for secondary prevention
One study reports clinical endpoints for this comparison group (The Lyon Diet Heart Study). This study recruited 605 patients within six months of a myocardial infarction, aged less than 70 years, the majority of whom were men (90%) from secondary care in France (The Lyon Diet Heart Study).
The Lyon Diet Heart Study examined the effect of a Mediterranean diet compared to usual care over 46 months and found reductions in adjusted estimates for a composite endpoint of CVD deaths and non‐fatal myocardial infarction (HR 0.28, 95% CI 0.15 to 0.52) (Analysis 3.3), CVD mortality (HR 0.35, 95% CI 0.15 to 0.82, low‐quality evidence) (Analysis 3.2) and total mortality (HR 0.44, 95% CI 0.21 to 0.92, moderate‐quality evidence) (Analysis 3.1) with the intervention (The Lyon Diet Heart Study).
4. Mediterranean dietary intervention versus another dietary intervention for secondary prevention
Three studies report clinical endpoints for this comparison group (Singh 1992; Singh 2002; Tuttle 2008), and two of these have been excluded in sensitivity analyses from all main analyses due to published concerns regarding the reliability of the data (Singh 1992; Singh 2002). For all analyses for comparison 4, forest plots are provided including and excluding these two studies, and we report in the text the results of sensitivity analyses excluding these studies. For the adjusted outcomes non‐fatal myocardial infarction, fatal myocardial infarction, sudden cardiac death, total cardiac endpoints, total mortality and CVD mortality, no other studies were identified after removing the Singh 1992 and Singh 2002 studies so these forest plots are empty and could not be shown.
One small study from the US in 101 patients randomised six weeks post myocardial infarction, following a Mediterranean diet or low‐fat diet, provided unadjusted estimates for total cardiac endpoints (all‐cause and cardiac deaths, myocardial infarction, hospital admissions for heart failure, unstable angina or stroke (RR 0.98, 95% CI 0.40 to 2.41, very low‐quality evidence) (Analysis 4.13), showing considerable uncertainty in the effect size (Tuttle 2008).
Two further ongoing trials will report clinical endpoints in CHD patients randomised to the Mediterranean dietary intervention compared to other dietary interventions (Delgado‐Lista 2016; Itsiopoulos 2018). One is conducted in Spain and randomising 1002 patients with an estimated completion date of September 2019 (Delgado‐Lista 2016). The other is conducted in Australia and randomising 1032 patients with anticipated last enrolment in October 2018 (Itsiopoulos 2018).
Cardiovascular risk factors (secondary outcomes: changes in blood lipids and blood pressure, and occurrence of type 2 diabetes)
Lipid levels
Total cholesterol
1. Mediterranean dietary intervention versus no intervention or minimal intervention for primary prevention
Five trials (569 participants randomised) measured total cholesterol levels and reported data that could be used in meta‐analyses (Davis 2017; Djuric 2009; Esposito 2004; Konstantinidou 2010; Wardle 2000). We assessed the overall quality of evidence as low and it showed a possible reduction in total cholesterol of ‐0.16 mmol/L (95% CI ‐0.32 to 0.00, 5 trials, 569 participants, I² = 73%) (Analysis 1.1).
Two trials measured total cholesterol but did not provide data in a useable format for meta‐analyses (Castagnetta 2002; Clements 2017). One trial reported a significant reduction in total cholesterol levels with the dietary intervention (Castagnetta 2002), and the other reported that total cholesterol was unaffected by both the Mediterranean diet and minimal dietary intervention (Clements 2017).
2. Mediterranean dietary intervention versus another dietary intervention for primary prevention
Seven trials (939 participants randomised) measured total cholesterol and provided data that could be pooled in a meta‐analysis (Athyros 2011; Bajerska 2018; Ng 2011; PREDIMED; Skouroliakou 2017; Sofi 2018; Vincent‐Baudry 2005). For the PREDIMED trial data on lipids were reported for two study sites rather than all 11 sites, but these were not the two sites where methodological issues arose. There was low‐quality evidence that the Mediterranean diet produced a possible small reduction in total cholesterol (mean difference (MD) ‐0.13 mmol/L, 95% CI ‐0.30 to 0.04, I² = 70%) (Analysis 2.9).
Two further trials measured total cholesterol but did not provide data in a useable format for meta‐analyses. Preliminary results from the CARDIOVEG study showed that the vegetarian diet was more effective in reducing total cholesterol (‐2.9%) with no significant change in the Mediterranean group (Dinu 2017). In a preliminary report of a trial comparing the Mediterranean diet and a low‐fat diet in patients with NAFLD to reduce CVD risk, significant within‐group improvements were seen for total cholesterol in the Mediterranean diet group but not the low‐fat diet group (P < 0.05) (Properzi 2018).
3. Mediterranean dietary intervention versus usual care for secondary prevention
Two trials (441 participants randomised) measured total cholesterol and provided data that could be pooled in a meta‐analysis (Michalsen 2006; The Lyon Diet Heart Study). There was low‐quality evidence that the Mediterranean diet produced little or no effect on total cholesterol levels (MD 0.07 mmol/L, 95% CI ‐0.19 to 0.33, I² = 19%) (Analysis 3.4).
4. Mediterranean dietary intervention versus another dietary intervention for secondary prevention
Two studies with a published expression of concern report total cholesterol for this comparison group with data in a useable format for meta‐analyses (Singh 1992; Singh 2002). Both of these studies have published concerns regarding the reliability of the data and have been excluded in sensitivity analyses from all main analyses (Singh 1992; Singh 2002). No other studies were identified after removing the Singh 1992 and Singh 2002 studies so these forest plots are empty and could not be shown.
Two further studies reported on lipid levels overall. One study reported as a conference proceeding compared effects of the Mediterranean diet with a low‐fat diet on lipid levels in CHD patients on statin therapy (Colquhoun 2000). We were unable to pool these data statistically as no measures of variance were available. The authors found no differences between the two diets at three months follow‐up. In a preliminary analysis of the AUSMED trial the authors report that compared to the low‐fat diet, the MedDiet did not change the lipid profile (P > 0.05) (Mayr 2018). The variables were not measured in a later analysis of the full cohort.
Low‐density lipoprotein cholesterol
1. Mediterranean dietary intervention versus no intervention or minimal intervention for primary prevention
Four trials (389 participants randomised) measured LDL cholesterol and provided data that could be pooled in a meta‐analysis (Davis 2017; Djuric 2009; Konstantinidou 2010; Wardle 2000). There was very low‐quality evidence that the Mediterranean diet produced little or no effect on levels of LDL cholesterol (MD ‐0.08 mmol/L, 95% CI ‐0.26 to 0.09, I² = 54%) (Analysis 1.2).
Two trials measured LDL cholesterol but did not provide data in a useable format for meta‐analyses. Preliminary analysis of an ongoing study reported a change in LDL cholesterol levels of 0.39 mmol/L between baseline and follow‐up of six months in 181 patients with metabolic disease following Mediterranean dietary advice, with a difference between the intervention and control group who received no advice of ‐7.9% (P = 0.05) (Chasapidou 2014). Another trial reported that LDL cholesterol was unaffected by both the Mediterranean diet and minimal dietary intervention (Clements 2017).
2. Mediterranean dietary intervention versus another dietary intervention for primary prevention
Seven trials (947 participants randomised) measured LDL cholesterol and provided data that could be pooled in a meta‐analysis (Athyros 2011; Bajerska 2018; PREDIMED; Skouroliakou 2017; Sofi 2018; Stradling 2018; Vincent‐Baudry 2005). For the PREDIMED trial data on lipids were reported for two study sites rather than all 11 sites, but these were not the two sites where methodological issues arose. There was moderate‐quality evidence that the Mediterranean diet produced a small reduction in LDL cholesterol (MD ‐0.15 mmol/L, 95% CI ‐0.27 to ‐0.02, I² = 46%) (Analysis 2.10).
One further trial measured LDL cholesterol but did not provide data in a useable format for meta‐analyses. Preliminary results from the CARDIOVEG study show that the vegetarian diet was more effective in reducing LDL cholesterol (‐5.1%) with no significant change in the Mediterranean diet group (Dinu 2017).
3. Mediterranean dietary intervention versus usual care for secondary prevention
Two trials (441 participants randomised) measured LDL cholesterol and provided data that could be pooled in a meta‐analysis (Michalsen 2006; The Lyon Diet Heart Study). There was low‐quality evidence that the Mediterranean diet produced little or no effect on LDL cholesterol levels (MD 0.11 mmol/L, 95% CI ‐0.09 to 0.31, I² = 0%) (Analysis 3.5).
4. Mediterranean dietary intervention versus another dietary intervention for secondary prevention
Three studies report LDL cholesterol for this comparison group with data in a useable format for meta‐analyses (Singh 1992; Singh 2002; Tuttle 2008). Two of the studies have been excluded in sensitivity analyses from all main analyses due to published concerns regarding the reliability of the data (Singh 1992; Singh 2002). For all analyses for comparison 4, forest plots are provided including and excluding these two studies, and we report in the text the results of the sensitivity analyses excluding these studies. In the remaining study, Tuttle 2008, there was very low‐quality evidence of little or no effect of the Mediterranean diet on LDL cholesterol levels (MD 0.08 mmol/L, 95% CI ‐0.26 to 0.42) (Analysis 4.17).
High‐density lipoprotein cholesterol
1. Mediterranean dietary intervention versus no intervention or minimal intervention for primary prevention
Five trials (569 participants randomised) measured HDL cholesterol levels and reported data that could be used in meta‐analyses (Davis 2017; Djuric 2009; Esposito 2004; Konstantinidou 2010; Wardle 2000). There was low‐quality evidence of little or no effect of the intervention on HDL levels (MD 0.02 mmol/L, 95% CI ‐0.04 to 0.08, I² = 70%) (Analysis 1.3).
One trial measured HDL cholesterol but did not provide data in a useable format for meta‐analyses (Clements 2017). This trial reported that HDL cholesterol was unaffected by both the Mediterranean diet and minimal dietary intervention (Clements 2017).
2. Mediterranean dietary intervention versus another dietary intervention for primary prevention
Six trials (891 participants randomised) measured HDL cholesterol and provided data that could be pooled in a meta‐analysis (Athyros 2011; Bajerska 2018; PREDIMED; Skouroliakou 2017; Sofi 2018; Vincent‐Baudry 2005). For the PREDIMED trial data on lipids were reported for two study sites rather than all 11 sites, but these were not the two sites where methodological issues arose. There was moderate‐quality evidence showing little or no effect of the Mediterranean diet on HDL cholesterol levels (MD 0.02 mmol/L, 95% CI ‐0.01 to 0.04), I² = 0%) (Analysis 2.11).
One study in patients with NAFLD reported lipid levels at baseline and follow‐up as normal or altered rather than actual values and variance. They found that lower levels of HDL cholesterol were observed only in the low glycaemic Mediterranean diet group after six months (Misciagna 2017).
3. Mediterranean dietary intervention versus usual care for secondary prevention
Two trials (441 participants randomised) measured HDL cholesterol and provided data that could be pooled in a meta‐analysis (Michalsen 2006; The Lyon Diet Heart Study). There was low‐quality evidence that the Mediterranean diet produced little or no effect on HDL cholesterol levels (MD ‐0.01 mmol/L, 95% CI ‐0.08 to 0.07, I² = 13%) (Analysis 3.6).
4. Mediterranean dietary intervention versus another dietary intervention for secondary prevention
Three studies report HDL cholesterol for this comparison group with data in a useable format for meta‐analyses (Singh 1992; Singh 2002; Tuttle 2008). Two of the studies have been excluded in sensitivity analyses from all main analyses due to published concerns regarding the reliability of the data (Singh 1992; Singh 2002). For all analyses for comparison 4, forest plots are provided including and excluding these two studies, and we report in the text the results of the sensitivity analyses excluding these studies. In the remaining study, Tuttle 2008, there was low‐quality evidence of little or no effect of the Mediterranean diet on HDL cholesterol levels (MD ‐0.05 mmol/L, 95% CI ‐0.17 to 0.06) (Analysis 4.19).
Triglycerides
1. Mediterranean dietary intervention versus no intervention or minimal intervention for primary prevention
Four trials (480 participants randomised) measured triglyceride levels and reported data that could be used in meta‐analyses (Davis 2017; Djuric 2009; Esposito 2004; Wardle 2000). There was considerable heterogeneity between trials (I² = 92%) and so we did not pool the studies statistically (Analysis 1.4). Two trials reported beneficial effects of the Mediterranean diet (Davis 2017; Esposito 2004), one reported no effect (Djuric 2009), and the other favoured the control (Wardle 2000).
Three trials measured triglyceride levels but did not provide data in a useable format for meta‐analyses (Clements 2017), or provided data as medians (with 25th and 75th percentiles) (Konstantinidou 2010; Lindman 2004). One trial reported that triglyceride levels were unaffected by both the Mediterranean diet and minimal dietary intervention (Clements 2017). In the two trials reporting medians, no effect of the diet on triglyceride levels was observed (Konstantinidou 2010; Lindman 2004).
2. Mediterranean dietary intervention versus another dietary intervention for primary prevention
Seven trials (939 participants randomised) measured triglyceride levels and provided data that could be pooled in a meta‐analysis (Athyros 2011; Bajerska 2018; Ng 2011; PREDIMED; Skouroliakou 2017; Sofi 2018; Vincent‐Baudry 2005). For the PREDIMED trial data on lipids were reported for two study sites rather than all 11 sites, but these were not the two sites where methodological issues arose. There was moderate‐quality evidence that the Mediterranean diet produced a possible small reduction in triglyceride levels (MD ‐0.09 mmol/L, 95% CI ‐0.16 to ‐0.01, I² = 15%) (Analysis 2.12).
Four further trials measured triglyceride levels but did not provide data in a useable format for meta‐analyses. In a study of Mediterranean diet versus low‐fat diet in heart and lung transplant recipients, the serum triglycerides levels declined in both groups over 12 months: Mediterranean diet −0.17 mmol/L (mean −9%, 95% CI –20 to 4); low‐fat diet −0.44 mmol/L (mean −21%, 95% CI –33 to −7) (Entwistle 2018). In a preliminary report of a trial comparing the Mediterranean diet and a low‐fat diet in patients with NAFLD to reduce CVD risk, significant within‐group improvements were seen for serum triglycerides in the Mediterranean diet group but not the low‐fat diet group (P < 0.05) (Properzi 2018). Preliminary results from the CARDIOVEG study comparing the effects of a Mediterranean diet and vegetarian diet on CVD risk factors found a significant reduction in triglycerides (‐8.9%) only after the Mediterranean period (Dinu 2017). Another study in patients with NAFLD reported lipid levels at baseline and follow‐up as normal or altered rather than actual values and variance. The authors found lower levels of triglycerides in both the intervention and control groups after six months (Misciagna 2017).
3. Mediterranean dietary intervention versus usual care for secondary prevention
Two trials (441 participants randomised) measured triglyceride levels and provided data that could be pooled in a meta‐analysis (Michalsen 2006; The Lyon Diet Heart Study). There was low‐quality evidence that the Mediterranean diet produced little or no effect on triglyceride levels (MD ‐0.14 mmol/L, 95% CI ‐0.38 to 0.10, I² = 0%) (Analysis 3.7).
4. Mediterranean dietary intervention versus another dietary intervention for secondary prevention
Three studies reported triglyceride levels for this comparison group with data in a useable format for meta‐analyses (Singh 1992; Singh 2002; Tuttle 2008). Two of the studies have been excluded in sensitivity analyses from all main analyses due to published concerns regarding the reliability of the data (Singh 1992; Singh 2002). For all analyses for comparison 4, forest plots are provided including and excluding these two studies, and we report in the text the results of the sensitivity analyses excluding these studies. In the remaining study, Tuttle 2008, there was very low‐quality evidence of little or no effect of the Mediterranean diet on triglyceride levels (MD 0.46 mmol/L, 95% CI ‐0.24 to 1.16) (Analysis 4.21).
Blood pressure
1. Mediterranean dietary intervention versus no intervention or minimal intervention for primary prevention
Two trials (269 participants randomised) measured systolic blood pressure and reported data that could be used in meta‐analyses (Davis 2017; Esposito 2004). There was moderate‐quality evidence of a reduction in systolic blood pressure with the intervention (MD ‐2.99 mmHg, 95% CI ‐3.45 to ‐2.53, I² = 0%) (Analysis 1.5).
One trial measured systolic blood pressure but did not provide data in a useable format for meta‐analyses (Chasapidou 2014). Preliminary analysis of an ongoing study reported a change in systolic blood pressure of 2.6 mmHg between baseline and follow‐up of six months in 181 patients with metabolic disease following Mediterranean dietary advice, with a difference between the intervention and control group who received no advice of ‐5.1% (P < 0.05) (Chasapidou 2014).
Two trials (269 participants randomised) measured diastolic blood pressure and reported data that could be used in meta‐analyses (Davis 2017; Esposito 2004). There was moderate‐quality evidence of a reduction in diastolic blood pressure with the intervention (MD ‐2.0 mmHg, 95% CI ‐2.29 to ‐1.71, I² = 0%) (Analysis 1.6).
2. Mediterranean dietary intervention versus another dietary intervention for primary prevention
Four trials (448 participants randomised) measured systolic blood pressure and provided data that could be pooled in a meta‐analysis (Athyros 2011; Bajerska 2018; Stradling 2018; Vincent‐Baudry 2005). For the PREDIMED trial, blood pressure was analysed in multivariate analyses and these are reported separately below. There was low‐quality evidence that the Mediterranean diet had little or no effect on systolic blood pressure levels (MD ‐1.5 mmHg, 95% CI ‐3.92 to 0.92, I² = 16%) (Analysis 2.13).
Four trials (448 participants randomised) measured diastolic blood pressure and provided data that could be pooled in a meta‐analysis (Athyros 2011; Bajerska 2018; Stradling 2018; Vincent‐Baudry 2005). For the PREDIMED trial, blood pressure was analysed in multivariate analyses and these are reported separately below. There was low‐quality evidence that the Mediterranean diet had little or no effect on diastolic blood pressure levels (MD ‐0.26 mmHg, 95% CI ‐2.41 to 1.9, I² = 37%) (Analysis 2.14).
The PREDIMED study used multivariate adjusted analyses controlling for centre, age, sex and diabetes, baseline blood pressure and antihypertensive drugs. Mean differences in systolic blood pressure changes (mmHg) in the two intervention groups versus the control group after a median follow‐up of 3.8 years were 0.39 (‐0.48 to 1.26) for PREDIMED + extra virgin olive oil (EVOO) versus control (P=0.38) and ‐ 0.72 (‐1.58 to 0.13) for PREDIMED + nuts versus control (P = 0.10). Mean differences in diastolic blood pressure changes (mmHg) in the two intervention groups versus the control group after a median follow‐up of 3.8 years were ‐1.53 (‐2.01 to ‐1.04) for PREDIMED + EVOO versus control (P < 0.001) and ‐0.65 (‐1.15 to ‐0.15) for PREDIMED + nuts versus control (P = 0.01).
3. Mediterranean dietary intervention versus usual care for secondary prevention
One trial (556 participants randomised) measured blood pressure (The Lyon Diet Heart Study). There was very low‐quality evidence that the Mediterranean diet produced little or no effect on either systolic (MD ‐2.00 mmHg, 95% CI ‐5.29 to 1.29) (Analysis 3.8) or diastolic blood pressure (MD ‐1.00 mmHg, 95% CI ‐4.29 to 2.29) (Analysis 3.9).
4. Mediterranean dietary intervention versus another dietary intervention for secondary prevention
Four studies report blood pressure for this comparison group with data in a useable format for meta‐analyses (Singh 1992; Singh 2002; Tuttle 2008; Weber 2012). Two of the studies have been excluded in sensitivity analyses from all main analyses due to published concerns regarding the reliability of the data (Singh 1992; Singh 2002). For all analyses for comparison 4, forest plots are provided including and excluding these two studies, and we report in the text the results of the sensitivity analyses excluding these studies. In the remaining two studies, Tuttle 2008 and Weber 2012, there was very low‐quality evidence of little or no effect of the Mediterranean diet on systolic blood pressure levels (MD 1.76 mmHg, 95% CI ‐2.80 to 6.33, I² = 0%) (Analysis 4.23) or diastolic blood pressure levels (MD 0.98 mmHg, 95% CI ‐1.97 to 3.93, I² = 0%) (Analysis 4.25).
In a further study and preliminary analysis of the AUSMED trial the authors report that compared to the low‐fat diet, the MedDiet did not change the blood pressure profile (P > 0.05) (Mayr 2018). The variables were not measured in a later analysis of the full cohort.
Type 2 diabetes
One study, which examined the effect of the Mediterranean dietary pattern for primary prevention, reported on incident diabetes (PREDIMED).
The PREDIMED trial reports on incident diabetes over 4.8 years of follow‐up in an earlier publication (Salas‐Salvado 2014), before the re‐analysis of the main paper (Estruch 2018). However, a recent report states that data for the incidence of type 2 diabetes has been re‐analysed to take account of the clustering and shows very similar estimates to the original analysis (Anonymous 2018). The PREDIMED intervention is described as a Mediterranean diet supplemented with extra‐virgin olive oil or tree nuts compared to a low‐fat diet control group. The authors found a statistically significant reduction in the incidence of type 2 diabetes with the PREDIMED intervention (HR 0.71, 95% CI 0.52 to 0.96).
Health‐related quality of life, adverse effects or costs
None of the trials in any of the four main comparison groups reported on health‐related quality of life or costs.
Adverse effects were reported in only two trials where no adverse events were noted for either dietary intervention in the PREDIMED trial (Ros 2014), and two of 302 CHD patients noted margarine‐related side effects of colitis and diarrhoea in The Lyon Diet Heart Study.
Discusión
El objetivo de esta revisión era evaluar la efectividad del asesoramiento dietético para seguir una dieta de estilo mediterráneo o la provisión de alimentos relevantes a la dieta mediterránea para la prevención primaria y secundaria de la ECV. Además de las variables de evaluación clínicas, también se examinaron los efectos de una dieta de estilo mediterráneo en los factores de riesgo cardiovascular principales incluidos los lípidos sanguíneos, la presión arterial y la aparición de diabetes tipo 2 en participantes con y sin ECV establecida.
Resumen de los resultados principales
En esta importante actualización de la revisión, 30 ECA (49 artículos) y siete ensayos en curso cumplieron con los criterios de inclusión. Se usaron cuatro grupos de comparación predeterminados para analizar los datos y considerar la heterogeneidad entre los participantes y los grupos de comparación y ayudar en la interpretación de los resultados. Los grupos de comparación y la cantidad de ensayos y participantes que contribuyeron a cada una se presentan a continuación:
-
Comparación 1: Intervención dietética mediterránea versus ninguna intervención o intervención mínima para la prevención primaria, nueve ensayos (1337 participantes asignados al azar).
-
Comparación 2: Intervención dietética mediterránea versus otra intervención dietética para la prevención primaria, 13 ensayos (8687 participantes asignados al azar, 7747 de los cuales eran del ensayo PREDIMED).
-
Comparación 3: Intervención dietética mediterránea versus atención habitual para la prevención secundaria, dos ensayos (706 participantes asignados al azar).
-
Comparación 4: Intervención dietética mediterránea versus otra intervención dietética para la prevención secundaria, seis ensayos (1731 participantes asignados al azar, 1406 de los cuales contribuyeron a dos ensayos excluidos en el análisis de sensibilidad de los análisis principales debido a las inquietudes publicadas con respecto a la confiabilidad de los datos) (Singh 1992; Singh 2002).
Las variables de evaluación clínicas se midieron en sólo un ensayo amplio de prevención primaria (PREDIMED), y un ensayo pequeño que informó los cálculos no ajustados para el accidente cerebrovascular en pacientes hipertensos (Lapetra 2018). El ensayo PREDIMED contribuyó a la comparación 2 y examinó el asesoramiento dietético para seguir un hábito dietético mediterráneo más aceite de oliva extra virgen suplementario o frutos secos en comparación con una dieta con bajo contenido de grasas para la prevención primaria de las ECV. El ensayo se realizó en España y asignó al azar a 7747 hombres y mujeres en mayor riesgo de ECV y los observó durante 4,8 años de seguimiento. El informe original del ensayo PREDIMED, Estruch 2013; se retiró y se volvió a analizar cuando surgieron problemas metodológicos. La publicación reciente se ajusta a los mismos y los datos que se volvieron a analizar se informan aquí (Estruch 2018). La intervención PREDIMED en comparación con una dieta con bajo contenido de grasas muestra un efecto sobre las variables de evaluación clínicas compuestas (CRI 0,70; IC del 95%: 0,58 a 0,85). El documento que se analizó nuevamente también informa las variables de evaluación clínicas por separado en el que hubo evidencia de calidad baja de poco o ningún efecto de la intervención de PREDIMED en comparación con una dieta con bajo contenido de grasas en la mortalidad total, la mortalidad por ECV o el infarto de miocardio, aunque se observó evidencia de calidad moderada de una reducción de la cantidad de accidentes cerebrovasculares con la intervención (CRI 0,60; IC del 95%: 0,45 a 0,80). También se observaron reducciones en los números de participantes que experimentaron EAP con la intervención de PREDIMED (CRI 0,42; IC del 95%: 0,28 a 0,61; evidencia de calidad moderada), aunque estos datos son menos certeros debido a que no se volvieron a analizar en el documento reciente (Estruch 2018), aunque provienen de los informes anteriores del ensayo.
Las variables de evaluación clínicas se midieron en los ensayos de prevención secundaria que contribuyeron a las comparaciones 3 y 4. Un ensayo contribuyó a la comparación 3 (The Lyon Diet Heart Study). El Lyon Diet Heart Study examinó el efecto del asesoramiento para seguir una dieta mediterránea más margarina de canola suplementaria en comparación con la atención habitual en 605 pacientes con CC durante 46 meses y encontró reducciones en los cálculos ajustados para un resultado compuesto de las muertes por ECV y el infarto de miocardio no mortal (CRI 0,28; IC del 95%: 0,15 a 0,52), la mortalidad por ECV (CRI 0,35; IC del 95%: 0,15 a 0,82; evidencia de calidad baja) y la mortalidad total (CRI 0,44; IC del 95%: 0,21 a 0,92; evidencia de calidad moderada) con la intervención (The Lyon Diet Heart Study). Para la comparación 4; tres estudios informan las variables de evaluación clínicas (Singh 1992; Singh 2002; Tuttle 2008). Dos de los mismos se excluyeron en los análisis de sensibilidad de todos los análisis principales debido a las inquietudes publicadas con respecto a la confiabilidad de los datos (Singh 1992; Singh 2002). Un estudio pequeño de los EE.UU. en 101 pacientes luego de sufrir un infarto de miocardio, que siguió una dieta mediterránea o una dieta con bajo contenido de grasas, proporcionó cálculos no ajustados para las variables de evaluación cardíacas totales, con evidencia de muy baja calidad que muestra una considerable incertidumbre en cuanto al tamaño del efecto. Dos ensayos en curso adicionales informarán sobre las variables de evaluación clínicas en pacientes con CC asignados al azar a la intervención dietética mediterránea en comparación con otras intervenciones alimentarias (Delgado‐Lista 2016; Itsiopoulos 2018), lo cual se agregará a la base de evidencia.
Los factores de riesgo de ECV incluidos los niveles de lípidos y la presión arterial se informaron en los cuatro grupos de comparación. Para la comparación 1 hubo evidencia de calidad baja de una reducción pequeña posible en el colesterol total (‐0,16 mmol/L, IC del 95%: ‐0,32 a 0,00) y evidencia de calidad moderada de una reducción en la presión arterial sistólica (‐2,99 mmHg, IC del 95%: ‐3,45 a ‐2,53) y diastólica (‐2,0 mmHg, IC del 95%: ‐2,29 a ‐1,71), con evidencia de calidad baja o muy baja de poco o ningún efecto de la intervención sobre el colesterol LDL o HDL o los triglicéridos. Para la comparación 2 hubo evidencia de calidad moderada de una reducción pequeña posible del colesterol LDL (‐0,15 mmol/L, IC del 95%: ‐0,27 a ‐0,02) y los triglicéridos (‐0,09 mmol/L, IC del 95%: ‐0,16 a ‐0,01) con evidencia de calidad baja o moderada de poco o ningún efecto de la intervención en el colesterol total o HDL o la presión arterial. Para la comparación 3 hubo evidencia de calidad baja de poco o ningún efecto de la dieta mediterránea sobre los niveles de lípidos y evidencia de muy baja calidad de poco o ningún efecto sobre la presión arterial. Asimismo, para la comparación 4 donde sólo dos ensayos contribuyeron a los análisis hubo evidencia de calidad baja o muy baja de poco o ningún efecto de la intervención en los niveles de lípidos o la presión arterial.
El ensayo más amplio informó la incidencia de diabetes tipo 2 en la prevención primaria (PREDIMED), donde hubo una reducción de la incidencia con la intervención PREDIMED (CRI 0,71; IC del 95%: 0,52 a 0,96). Dos ensayos informaron sobre los eventos adversos y se indicó que los mismos estaban ausentes (Ros 2014) o eran menores (The Lyon Diet Heart Study). Ningún ensayo informó sobre la calidad de vida relacionada con la salud ni los costes.
Compleción y aplicabilidad general de las pruebas
En esta importante actualización se expandieron los criterios de inclusión de la revisión original, que se centraron sólo en la prevención primaria y en ninguna intervención/intervención mínima como grupos de comparación de la dieta de estilo mediterráneo (New Reference). La expansión en cuanto al alcance estuvo diseñada para que la revisión fuese de relevancia para la prevención secundaria pero también para permitir comparaciones de la dieta mediterránea con otros hábitos alimentarios para la salud cardiovascular. También se ha refinado la definición de los componentes centrales de una dieta de estilo mediterráneo sobre la base de la revisión extensiva y los informes recientes de los componentes probablemente más activos (Grosso 2017; Martínez‐González 2017, ver Tipos de intervenciones). Se estratificaron los análisis por prevención primaria y secundaria y por grupo de comparación en un intento por considerar la heterogeneidad y ayudar en la interpretación de los resultados para hacer que la revisión sea lo más útil posible.
Ahora hay un número mayor de ensayos incluidos (30 ensayos, 12 461 participantes asignados al azar), aunque pocos informan las variables de evaluación clínicas, el resultado primario, y la mayoría de los ensayos informan sobre los factores de riesgo de ECV para la prevención primaria.
Las definiciones de la dieta mediterránea difirieron aunque todas comprendían al menos los dos componentes centrales de un cociente alto de grasas monoinsaturadas/saturadas (uso de aceite de oliva como el ingrediente principal al cocinar o el consumo de otros alimentos tradicionales con alto contenido de grasas monoinsaturadas como los frutos secos) y el consumo alto de alimentos vegetales, incluidas las frutas, las hortalizas y las legumbres.
Asimismo, los grupos de comparación alimentarios difirieron en los ensayos. La mayoría de los regímenes dietéticos de comparación fueron, sin embargo, dietas con bajo contenido de grasas u orientación sobre la salud cardíaca con excepciones notables de las dietas vegetarianas. No se ha explorado de manera formal el efecto de diferentes grupos de comparación alimentarios debido a un número insuficiente de estudios para hacerlo.
Según se observó anteriormente hubo datos limitados sobre las variables de evaluación clínicas, el resultado primario. Dos estudios fueron excluidos de todos los análisis principales en los análisis de sensibilidad debido a las inquietudes publicadas con respecto a la confiabilidad de los datos (Singh 1992; Singh 2002). Sólo un ensayo informó las variables de evaluación clínicas para la prevención primaria y este estudio experimentó problemas metodológicos con respecto a la asignación al azar y el informe posteriormente se retiró y se volvió a analizar (PREDIMED). Los resultados en cuanto a la prevención secundaria se basan en un ensayo más antiguo que informó cálculos del efecto muy amplios mediante un diseño de Zelen modificado (The Lyon Diet Heart Study). Además, el ensayo PREDIMED y el The Lyon Diet Heart Study proporcionaron alimentos suplementarios así como asesoramiento dietético para seguir una dieta de estilo mediterráneo por lo que las implicaciones de política de los resultados de estos ensayos están poco claras (Appel 2013).
La cantidad de ensayos que informaron los resultados primario y secundarios para la prevención secundaria fue limitada, sin embargo algunos ensayos en curso están explorando los efectos de la dieta mediterránea en las variables de evaluación clínicas en pacientes con ECV por lo cual los mismos se agregarán a la base de evidencia. No se observó ningún efecto en los factores de riesgo de ECV en el número limitado de ensayos que los informaron, aunque este hecho puede deberse al tratamiento farmacológico óptimo en los que las mejorías adicionales en los niveles de lípidos y la presión arterial pueden ser improbables, en particular en los ensayos más recientes. No se han explorado los efectos de la medicación sobre los resultados en la prevención secundaria debido al número reducido de estudios incluidos, o en los pacientes en alto riesgo en la prevención primaria, aunque este tema se explorará en las actualizaciones futuras.
La adherencia a los hábitos alimentarios tanto en los grupos de intervención como de comparación tendrá una repercusión sobre su efectividad. No se midió la adherencia ni el cumplimiento de las intervenciones alimentarias en esta revisión. Otras revisiones sistemáticas han indicado que una mayor adherencia a una dieta de estilo mediterránea se asocia con una mejoría significativa en el estado de salud y una reducción significativa de la mortalidad global, así como en la morbilidad y la mortalidad por ECV y otras enfermedades crónicas graves (Sofi 2008; Sofi 2010). En un metanálisis de los estudios de cohortes prospectivos, un aumento de dos puntos (escala de 0 a 7‐9 puntos) en la adherencia a un hábito dietético mediterráneo se asoció con una reducción del 8% de la mortalidad por todas las causas y una reducción del 10% de la incidencia de ECV o mortalidad (Sofi 2010).
La duración de la intervención y los períodos de seguimiento varió mucho entre los estudios, y varió de ensayos a corto plazo (tres a seis meses) a intervenciones a largo plazo (hasta cinco años). Los efectos sobre la salud a corto y a largo plazo de las intervenciones alimentarias son posibles en cuanto a la salud cardiovascular, debido a la respuesta relativamente rápida de los factores de riesgo cardiovasculares como los lípidos sanguíneos y la presión arterial a las modificaciones del modo de vida y alimentarias (AHA 2006; Appel 1997; Appel 2001; Appel 2006). Sin embargo, es probable que los efectos beneficiosos potenciales de las intervenciones alimentarias para la prevención de las variables de evaluación de enfermedades crónicas graves, como la mortalidad, la ECV y la diabetes tipo 2 deban representar el resultado de un proceso a largo plazo vinculado a la interacción de los hábitos alimentarios con los factores genéticos y ambientales. Además, la sostenibilidad del modo de vida a largo plazo y las modificaciones alimentarias es desafiante. Por lo tanto, la relevancia para la salud pública de los ensayos con intervenciones alimentarias o períodos de seguimiento a muy corto plazo en este contexto es dudosa.
Calidad de la evidencia
Debido a la amplitud de la pregunta de revisión, la heterogeneidad en cuanto a los participantes, las intervenciones y los comparadores fue alta y se ha intentado reducirla mediante la realización de los análisis principales en cuatro grupos de comparación para la prevención primaria y secundaria y diferentes comparadores, y también se exploró la heterogeneidad de las intervenciones en los análisis de subgrupos.
La mayoría de los estudios incluidos en esta revisión estuvo en riesgo poco claro de sesgo para muchos de los dominios del riesgo de sesgo por lo cual los resultados deben interpretarse con cautela. Se observó un alto riesgo de sesgo para las tasas de desgaste diferenciales entre los grupos de intervención y de control en dos ensayos (Djuric 2009; Vincent‐Baudry 2005), y un alto riesgo de otros sesgos en dos ensayos en los que hay inquietudes publicadas con respecto a la confiabilidad de los datos (Singh 1992; Singh 2002). Estos dos estudios han sido excluidos de los análisis principales y la evaluación GRADE. Las tablas de “Resumen de resultados” proporcionan la evaluación GRADE de la calidad general del estudio para cada uno de los cuatro grupos de comparación:
Para la comparación 1; la evaluación GRADE de los resultados ha dado lugar a la disminución de la calidad de los ensayos debido al riesgo poco claro de sesgo de selección o el sesgo de desgaste para la mayoría de los estudios, la inconsistencia debido a la heterogeneidad alta cuando los estudios no se agruparon y la imprecisión debido al tamaño de la muestra reducido.
Para la comparación 2; la evaluación GRADE de los resultados ha dado lugar a la disminución de la calidad de los ensayos debido al riesgo poco claro de sesgo de selección o el sesgo de desgaste para la mayoría de los estudios, la imprecisión donde un intervalo de confianza grande incluye tanto un aumento como una disminución importante en el resultado, y la inconsistencia donde los diagramas de bosque muestran diferentes niveles del efecto. El estudio PREDIMED se ha disminuido debido a cuestiones metodológicas con respecto a la asignación al azar y el retiro del informe original, que luego posteriormente se volvió a analizar y a publicar.
Para la comparación 3; la evaluación GRADE de los resultados ha dado lugar a la disminución de la calidad de los ensayos debido al riesgo poco claro de sesgo de selección o el sesgo de desgaste o ambos, y la imprecisión debido al tamaño de la muestra pequeño y los intervalos de confianza grandes que incluyen tanto un aumento como una disminución importante en el resultado. El Lyon Diet Heart Study se ha disminuido por tener un método de asignación al azar poco claro y usar el método de Zelen modificado, lo cual puede haber introducido otros sesgos.
Para la comparación 4; la evaluación GRADE de los resultados ha dado lugar a la disminución de la calidad los ensayos por tener un método poco claro de asignación al azar y desgaste e imprecisión.
Sesgos potenciales en el proceso de revisión
Se realizó una búsqueda exhaustiva en las bases de datos principales de intervenciones que incluyeran la dieta mediterránea. Dos autores de la revisión, de forma independiente, seleccionaron y evaluaron los ensayos para la inclusión mediante criterios predeterminados, extrajeron los datos y evaluaron la calidad de los ensayos para disminuir los sesgos potenciales en los procesos de revisión.
Hubo un grado alto de heterogeneidad en los ensayos de diferentes fuentes (participantes, naturaleza y duración de la intervención, grupos de comparación, seguimiento, datos de resultado), lo cual impidió el agrupamiento estadístico para algunos resultados. Se predeterminaron cuatro grupos de comparación principales para el análisis para considerar la heterogeneidad probable que se encontraría al expandir el alcance de la revisión, por prevención primaria y secundaria y por grupos de comparación.
No todos los datos de todos los estudios se informaron en un formato utilizable para contribuir con los metanálisis. Se intentó establecer contacto con los autores cuando fue posible para obtener estos datos y muchos informan los resultados preliminares en las actas de congresos. En los casos en los que los datos se informaron de manera narrativa no fue posible agruparlos.
Se tomó la decisión de excluir dos ensayos de los análisis principales y de la evaluación GRADE cuando hubo inquietudes públicas acerca de la integridad y la confiabilidad de los datos (Singh 1992; Singh 2002). Estos dos ensayos informaron sobre 1406 participantes y presentan las variables de evaluación clínicas y los factores de riesgo de ECV relevantes a la prevención secundaria (Comparación 4) por lo cual su exclusión limitó los resultados. El ensayo PREDIMED se retiró debido a cuestiones metodológicas en cuanto a la asignación al azar para dos de los 11 sitios de estudio, y la inclusión de segundos miembros de la familia no asignados al azar, aunque estos datos se han vuelto a analizar realizando el ajuste y se volvieron a publicar. La nueva publicación ha realizado una serie de análisis de sensibilidad que excluyen estos sitios y se han encontrado resultados similares para las variables de evaluación clínicas (Estruch 2018). La nueva publicación informa sobre el resultado clínico compuesto, la ECV y la mortalidad total, el infarto de miocardio y el accidente cerebrovascular. Otros informes de PREDIMED se han usado para los factores de riesgo de ECV y la EAP, que no se informaron en la nueva publicación (Estruch 2018), y por lo tanto no se realizó el ajuste.
La decisión de restringir esta revisión a las intervenciones que sólo se centraron en la efectividad de una dieta de estilo mediterráneo per se evitó los efectos de confusión potenciales de otras intervenciones conductuales sobre los resultados, p.ej. las que incluyen el aumento del ejercicio o la pérdida de peso en el contexto de los ensayos multifactoriales. La decisión de excluir los ensayos en pacientes con diabetes que están en mayor riesgo de ECV también dio lugar a la omisión de estudios relevantes, aunque las intervenciones para el tratamiento de la diabetes son cubiertas por el Grupo Cochrane de Trastornos Metabólicos y Endocrinos y no se encuentran dentro del propósito del Grupo Cochrane de Corazón.
La definición del hábito dietético mediterráneo no es homogénea y puede variar a través de diferentes contextos geográficos y culturales (Helsing 1989; Nestle 1995; Serra‐Majem 1993; Serra‐Majem 2006; Willett 1995). La elección de usar un sistema de clasificación en lugar de incluir sólo los estudios que describen la intervención como una dieta mediterránea intentó considerar esta heterogeneidad, y debido a que los estudios suficientes permitirían la exploración adicional de los componentes activos. Los componentes requeridos para cumplir con la definición de un hábito dietético mediterráneo se basaron en las definiciones anteriores (Helsing 1989; Nestle 1995; Serra‐Majem 1993; Serra‐Majem 2006; Willett 1995), y requirieron al menos los siguientes dos componentes centrales: cociente alto de grasas monoinsaturadas/saturadas (uso de aceite de oliva como principal ingrediente al cocinar o consumo de otros alimentos tradicionales con alto contenido de grasas monoinsaturadas como los frutos secos) y consumo alto de alimentos vegetales, incluidas las frutas, las hortalizas y las legumbres. La justificación de esta definición se basa en el trabajo reciente (Grosso 2017; Martínez‐González 2017), lo cual recalca que los efectos protectores de la dieta parecen ser sumamente atribuibles al aceite de oliva, las frutas, las hortalizas y las legumbres.
Acuerdos y desacuerdos con otros estudios o revisiones
Varias revisiones sistemáticas y resúmenes recientes de las revisiones informaron los efectos de la dieta mediterránea sobre la salud cardiovascular.
Un resumen narrativo reciente de los estudios observacionales prospectivos y los ECA establece la conclusión de que la dieta mediterránea tiene algunos efectos beneficiosos para la prevención de las ECV aunque los efectos son inconsistentes entre los estudios; pocos estudios se informaron en los metanálisis y se necesitan más ensayos de alta calidad que consideren las inconsistencias (Salas‐Salvado 2018). Lo anterior está de acuerdo con los resultados de la revisión actual que informa evidencia proveniente de ECA. Una revisión general de las revisiones sistemáticas informa 13 metanálisis de los estudios observacionales y 16 metanálisis de los ECA que investigan la asociación entre la adherencia a la dieta mediterránea y algunos resultados de salud diferentes (Dinu 2018). Los autores encontraron evidencia consistente de una mayor adherencia a la dieta mediterránea y un riesgo reducido de mortalidad global, enfermedades cardiovasculares, cardiopatía coronaria, infarto de miocardio y diabetes sin evidencia en cuanto a los niveles de colesterol LDL. La adherencia a la dieta mediterránea no se midió específicamente en la revisión actual, lo cual se ha registrado como una limitación potencial. Con las actualizaciones adicionales de esta revisión se considerará la posibilidad de explorar el efecto de la adherencia sobre los resultados.
Una revisión sistemática reciente incluyó ensayos de prevención primaria y secundaria y agrupó las variables de evaluación clínicas para los mismos (Liyanage 2016). La selección de ensayos fue diferente de la revisión actual en el período de búsqueda de ambos, en cuanto a que se excluyeron los ensayos de la diabetes tipo 2 (Toobert 2003), y no informó la mortalidad total en un ensayo en pacientes con VIH en el que las muertes se asociaron con complicaciones relacionadas con el SIDA (Ng 2011). Los análisis de sensibilidad se realizaron de manera similar y excluyeron un estudio con datos poco fiables (Singh 2002). Un ensayo adicional que cumplió con los criterios de inclusión que informó las variables de evaluación clínicas también fue excluido de los análisis (Tuttle 2008), así como otro ensayo con datos poco fiables (Singh 1992). El agrupamiento de los estudios para la prevención primaria y secundaria mostró efectos beneficiosos para los eventos vasculares graves (cociente de riesgos [CR] 0,69; IC del 95%: 0,55 a 0,86) y el accidente cerebrovascular (CR 0,66; IC del 95%: 0,48 a 0,92) (Liyanage 2016).
Una revisión sistemática que comparó los efectos de una dieta mediterránea con dietas con bajo contenido de grasas en los factores de riesgo de ECV en pacientes en alto riesgo o con enfermedades establecidas encontró efectos favorables aunque moderados de la dieta mediterránea en una gama amplia de factores de riesgo cardiovasculares y marcadores inflamatorios, como el peso corporal, la presión arterial sistólica y diastólica, la glucosa en plasma en ayunas, el colesterol total y la proteína C reactiva de alta sensibilidad (Nordmann 2011). Otras revisiones sistemáticas han agrupado la evidencia de los estudios observacionales y de los ECA sobre los efectos del hábito dietético mediterráneo sobre el síndrome metabólico y los factores de riesgo cardiovasculares individuales, y apoyaron los efectos favorables de la dieta mediterránea sobre los factores de riesgo cardiometabólicos (Buckland 2008; Kastorini 2011). Los resultados de la revisión actual de los ECA muestran inconsistencias entre los estudios aunque cuando fue posible realizar metanálisis hubo efectos beneficiosos pequeños sobre algunos factores de riesgo de ECV para la prevención primaria.

Study flow diagram.
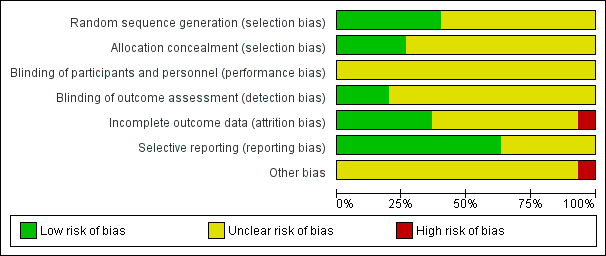
'Risk of bias' graph: review authors' judgements about each risk of bias item presented as percentages across all included studies.

'Risk of bias' summary: review authors' judgements about each risk of bias item for each included study.

Comparison 1 Mediterranean dietary intervention versus no intervention or minimal intervention for primary prevention, Outcome 1 Total cholesterol (mmol/L), change from baseline.

Comparison 1 Mediterranean dietary intervention versus no intervention or minimal intervention for primary prevention, Outcome 2 LDL cholesterol (mmol/L), change from baseline.

Comparison 1 Mediterranean dietary intervention versus no intervention or minimal intervention for primary prevention, Outcome 3 HDL cholesterol (mmol/L), change from baseline.

Comparison 1 Mediterranean dietary intervention versus no intervention or minimal intervention for primary prevention, Outcome 4 Triglycerides (mmol/L), change from baseline.

Comparison 1 Mediterranean dietary intervention versus no intervention or minimal intervention for primary prevention, Outcome 5 Systolic blood pressure (mmHg), change from baseline.

Comparison 1 Mediterranean dietary intervention versus no intervention or minimal intervention for primary prevention, Outcome 6 Diastolic blood pressure (mmHg), change from baseline.

Comparison 2 Mediterranean dietary intervention versus another dietary intervention for primary prevention, Outcome 1 Composite clinical events (CVD death, stroke, MI).
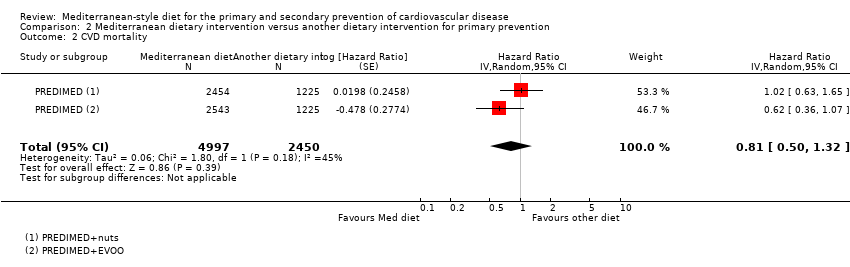
Comparison 2 Mediterranean dietary intervention versus another dietary intervention for primary prevention, Outcome 2 CVD mortality.

Comparison 2 Mediterranean dietary intervention versus another dietary intervention for primary prevention, Outcome 3 Total mortality.

Comparison 2 Mediterranean dietary intervention versus another dietary intervention for primary prevention, Outcome 4 Myocardial infarction.
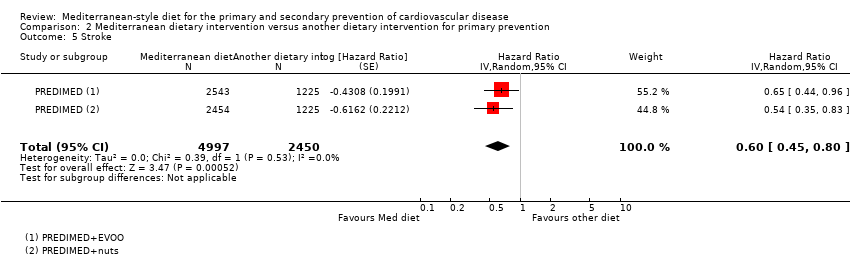
Comparison 2 Mediterranean dietary intervention versus another dietary intervention for primary prevention, Outcome 5 Stroke.
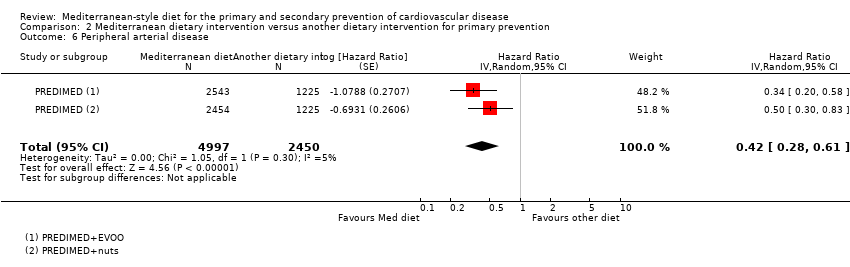
Comparison 2 Mediterranean dietary intervention versus another dietary intervention for primary prevention, Outcome 6 Peripheral arterial disease.
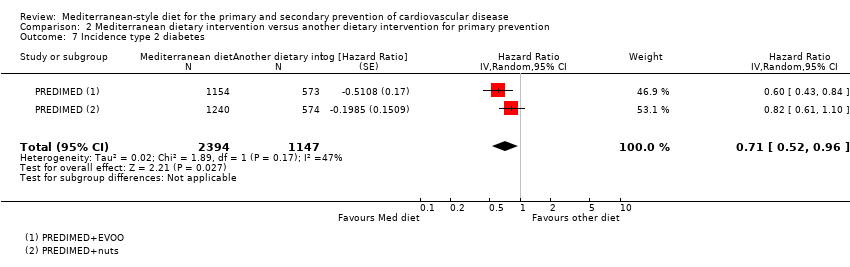
Comparison 2 Mediterranean dietary intervention versus another dietary intervention for primary prevention, Outcome 7 Incidence type 2 diabetes.
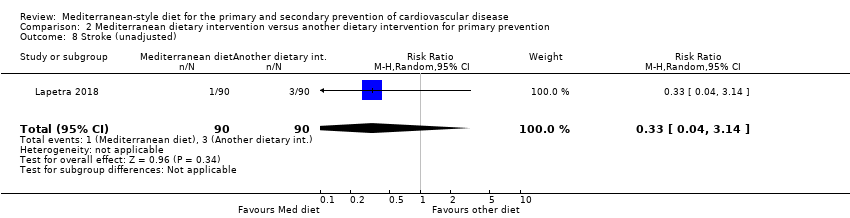
Comparison 2 Mediterranean dietary intervention versus another dietary intervention for primary prevention, Outcome 8 Stroke (unadjusted).
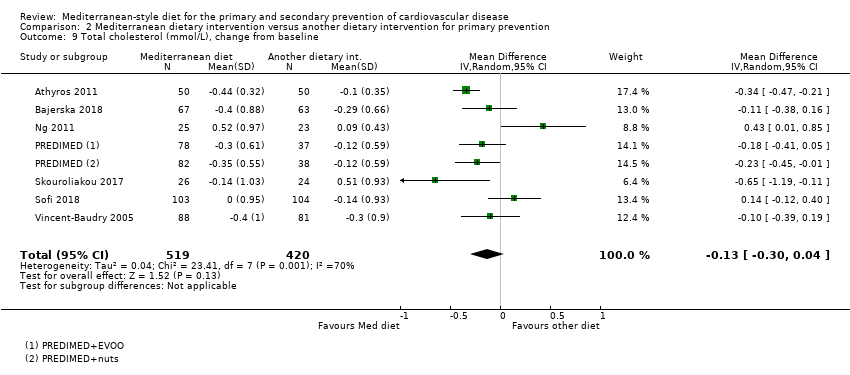
Comparison 2 Mediterranean dietary intervention versus another dietary intervention for primary prevention, Outcome 9 Total cholesterol (mmol/L), change from baseline.

Comparison 2 Mediterranean dietary intervention versus another dietary intervention for primary prevention, Outcome 10 LDL cholesterol (mmol/L), change from baseline.
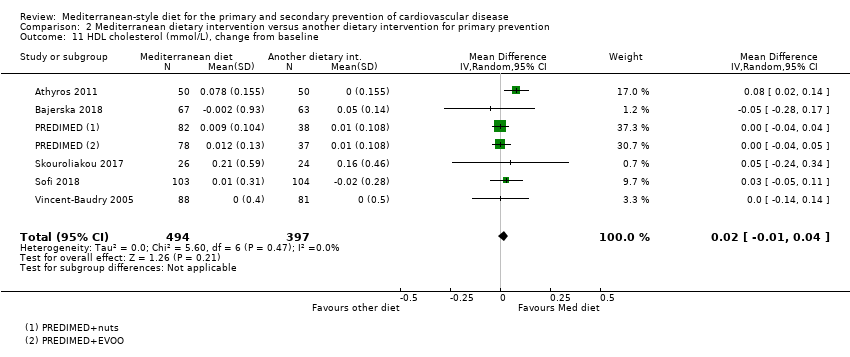
Comparison 2 Mediterranean dietary intervention versus another dietary intervention for primary prevention, Outcome 11 HDL cholesterol (mmol/L), change from baseline.

Comparison 2 Mediterranean dietary intervention versus another dietary intervention for primary prevention, Outcome 12 Triglycerides (mmol/L), change from baseline.

Comparison 2 Mediterranean dietary intervention versus another dietary intervention for primary prevention, Outcome 13 Systolic blood pressure (mmHg), change from baseline.
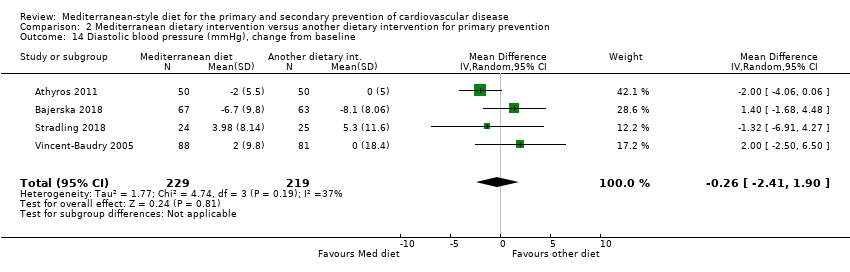
Comparison 2 Mediterranean dietary intervention versus another dietary intervention for primary prevention, Outcome 14 Diastolic blood pressure (mmHg), change from baseline.
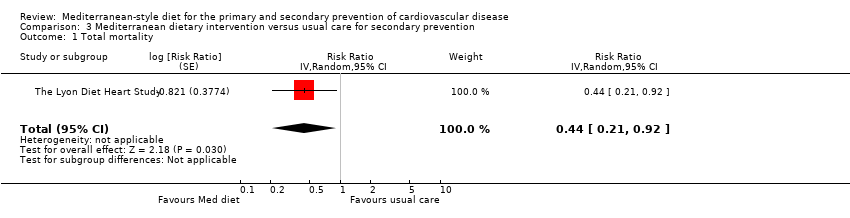
Comparison 3 Mediterranean dietary intervention versus usual care for secondary prevention, Outcome 1 Total mortality.

Comparison 3 Mediterranean dietary intervention versus usual care for secondary prevention, Outcome 2 CVD mortality.

Comparison 3 Mediterranean dietary intervention versus usual care for secondary prevention, Outcome 3 CVD death plus non‐fatal MI.

Comparison 3 Mediterranean dietary intervention versus usual care for secondary prevention, Outcome 4 Total cholesterol (mmol/L), change from baseline.

Comparison 3 Mediterranean dietary intervention versus usual care for secondary prevention, Outcome 5 LDL cholesterol (mmol/L), change from baseline.

Comparison 3 Mediterranean dietary intervention versus usual care for secondary prevention, Outcome 6 HDL cholesterol (mmol/L), change from baseline.

Comparison 3 Mediterranean dietary intervention versus usual care for secondary prevention, Outcome 7 Triglycerides (mmol/L), change from baseline.
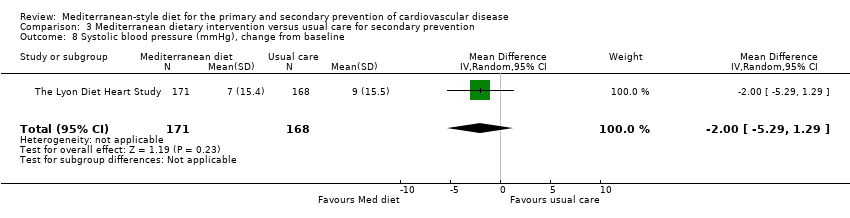
Comparison 3 Mediterranean dietary intervention versus usual care for secondary prevention, Outcome 8 Systolic blood pressure (mmHg), change from baseline.

Comparison 3 Mediterranean dietary intervention versus usual care for secondary prevention, Outcome 9 Diastolic blood pressure (mmHg), change from baseline.
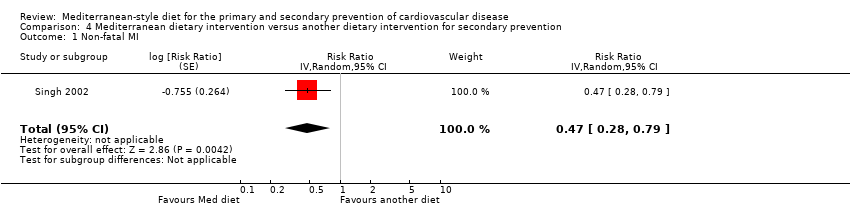
Comparison 4 Mediterranean dietary intervention versus another dietary intervention for secondary prevention, Outcome 1 Non‐fatal MI.

Comparison 4 Mediterranean dietary intervention versus another dietary intervention for secondary prevention, Outcome 3 Fatal MI.
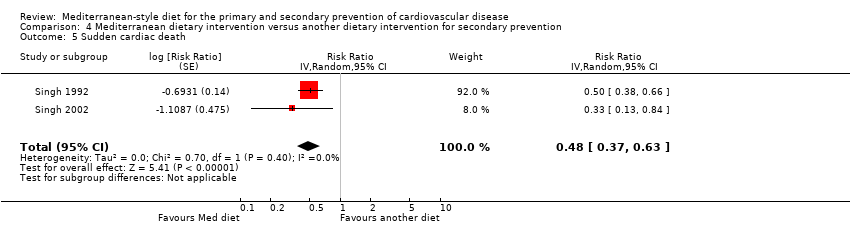
Comparison 4 Mediterranean dietary intervention versus another dietary intervention for secondary prevention, Outcome 5 Sudden cardiac death.

Comparison 4 Mediterranean dietary intervention versus another dietary intervention for secondary prevention, Outcome 7 Total cardiac endpoints (fatal and non‐fatal MI, sudden cardiac death).

Comparison 4 Mediterranean dietary intervention versus another dietary intervention for secondary prevention, Outcome 9 Total mortality.
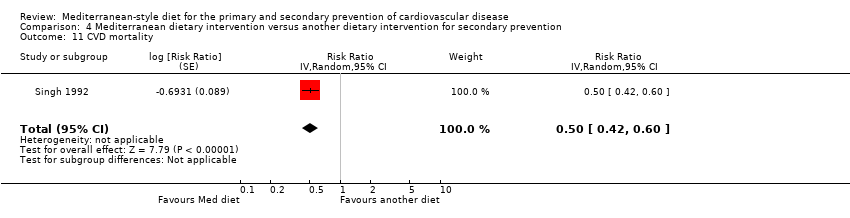
Comparison 4 Mediterranean dietary intervention versus another dietary intervention for secondary prevention, Outcome 11 CVD mortality.
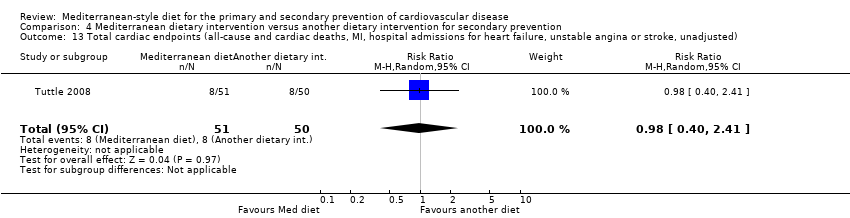
Comparison 4 Mediterranean dietary intervention versus another dietary intervention for secondary prevention, Outcome 13 Total cardiac endpoints (all‐cause and cardiac deaths, MI, hospital admissions for heart failure, unstable angina or stroke, unadjusted).
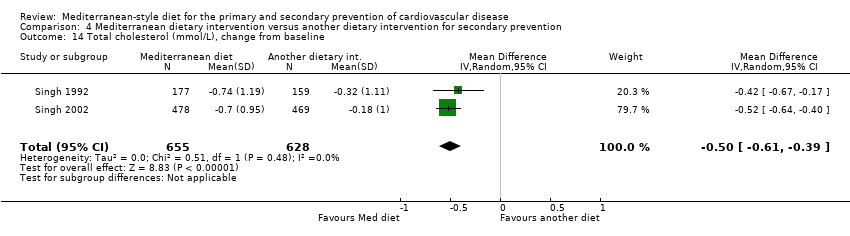
Comparison 4 Mediterranean dietary intervention versus another dietary intervention for secondary prevention, Outcome 14 Total cholesterol (mmol/L), change from baseline.

Comparison 4 Mediterranean dietary intervention versus another dietary intervention for secondary prevention, Outcome 16 LDL cholesterol (mmol/L), change from baseline.

Comparison 4 Mediterranean dietary intervention versus another dietary intervention for secondary prevention, Outcome 17 LDL cholesterol (mmol/L), change from baseline (sensitivity analysis without Singh studies).

Comparison 4 Mediterranean dietary intervention versus another dietary intervention for secondary prevention, Outcome 18 HDL cholesterol (mmol/L), change from baseline.
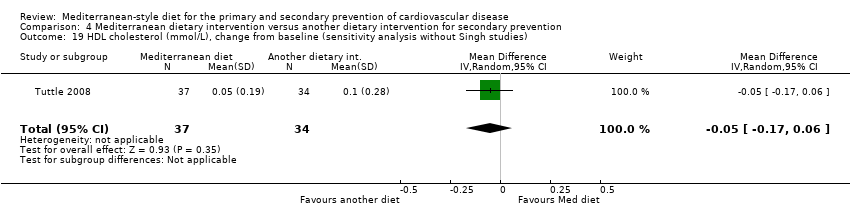
Comparison 4 Mediterranean dietary intervention versus another dietary intervention for secondary prevention, Outcome 19 HDL cholesterol (mmol/L), change from baseline (sensitivity analysis without Singh studies).
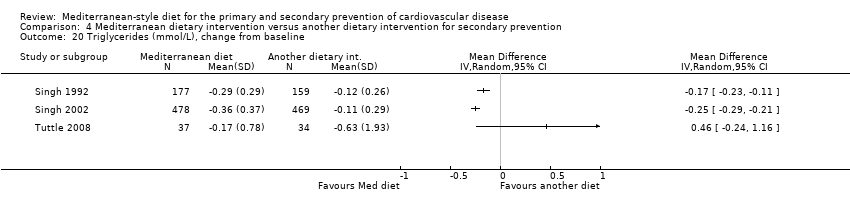
Comparison 4 Mediterranean dietary intervention versus another dietary intervention for secondary prevention, Outcome 20 Triglycerides (mmol/L), change from baseline.
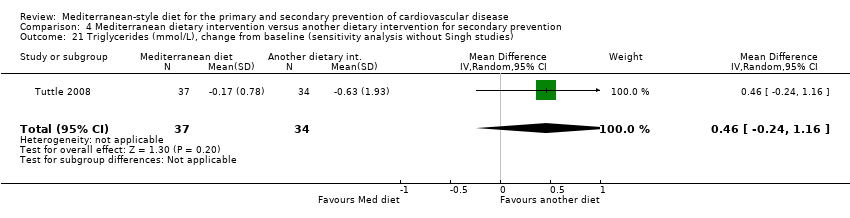
Comparison 4 Mediterranean dietary intervention versus another dietary intervention for secondary prevention, Outcome 21 Triglycerides (mmol/L), change from baseline (sensitivity analysis without Singh studies).

Comparison 4 Mediterranean dietary intervention versus another dietary intervention for secondary prevention, Outcome 22 Systolic blood pressure (mmHg), change from baseline.
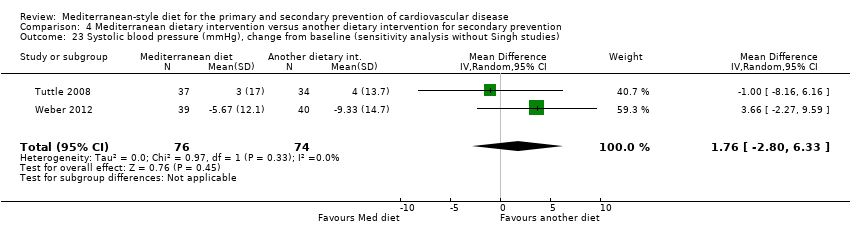
Comparison 4 Mediterranean dietary intervention versus another dietary intervention for secondary prevention, Outcome 23 Systolic blood pressure (mmHg), change from baseline (sensitivity analysis without Singh studies).
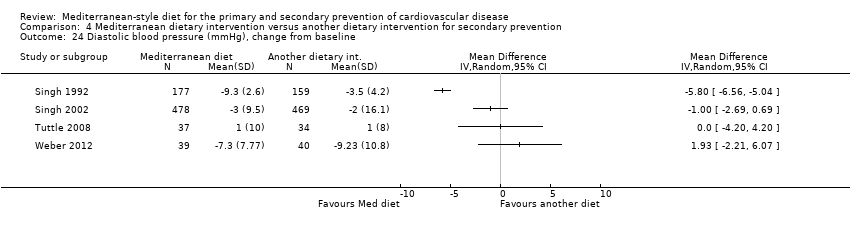
Comparison 4 Mediterranean dietary intervention versus another dietary intervention for secondary prevention, Outcome 24 Diastolic blood pressure (mmHg), change from baseline.

Comparison 4 Mediterranean dietary intervention versus another dietary intervention for secondary prevention, Outcome 25 Diastolic blood pressure (mmHg), change from baseline (sensitivity analysis without Singh studies).
| Mediterranean dietary intervention compared to no intervention or minimal intervention for the primary prevention of cardiovascular disease | ||||||
| Patient or population: adults without cardiovascular disease | ||||||
| Outcomes | Anticipated absolute effects* (95% CI) | Relative effect | № of participants | Certainty of the evidence | Comments | |
| Risk with no intervention or minimal intervention | Risk with Mediterranean dietary intervention | |||||
| CVD mortality | — | — | — | — | — | Not reported |
| Total mortality | — | — | — | — | — | Not reported |
| Total cholesterol (mmol/L), change from baseline | The mean total cholesterol change from baseline ranged from ‐0.003 to ‐0.2 mmol/L | MD 0.16 mmol/L lower | — | 569 | ⊕⊕⊝⊝ | — |
| LDL cholesterol (mmol/L), change from baseline | The mean LDL cholesterol change from baseline ranged from ‐0.2 to 0.05 mmol/L | MD 0.08 mmol/L lower | — | 389 | ⊕⊝⊝⊝ | — |
| HDL cholesterol (mmol/L), change from baseline | The mean HDL cholesterol change from baseline ranged from ‐0.07 to 0.03 mmol/L | MD 0.02 mmol/L higher | — | 569 | ⊕⊕⊝⊝ | — |
| Triglycerides (mmol/L), change from baseline | See comment | See comment | — | 480 | ⊕⊕⊝⊝ | Studies were not pooled statistically due to substantial heterogeneity (I2 = 92%) |
| Systolic blood pressure (mmHg), change from baseline | The mean systolic blood pressure change from baseline ranged from ‐1 to 1.4 mmHg | MD 2.99 mmHg lower | — | 269 | ⊕⊕⊕⊝ | — |
| Diastolic blood pressure (mmHg), change from baseline | The mean diastolic blood pressure change from baseline ranged from ‐1 to 1.7 mmHg | MD 2.00 mmHg lower | — | 269 | ⊕⊕⊕⊝ | — |
| Adverse events | — | — | — | — | — | Not reported |
| *The risk in the intervention group (and its 95% confidence interval) is based on the assumed risk in the comparison group and the relative effect of the intervention (and its 95% CI). | ||||||
| GRADE Working Group grades of evidence | ||||||
| 1Downgraded by one level for risk of bias. Majority of studies were at unclear risk of selection bias or attrition bias, or both. 2Downgraded by one level for inconsistency. Forest plot shows different directions of effect and I2 value is very high. 3Downgraded by one level for imprecision due to small number of participants (< 400). 4Downgraded one level for inconsistency. Studies could not be pooled due to very high heterogeneity, and forest plots show different directions of effect. | ||||||
| Mediterranean dietary intervention compared to another dietary intervention for the primary of cardiovascular disease | ||||||
| Patient or population: adults without cardiovascular disease | ||||||
| Outcomes | Anticipated absolute effects* (95% CI) | Relative effect | № of participants | Certainty of the evidence | Comments | |
| Risk with another dietary intervention | Risk with Mediterranean dietary intervention | |||||
| CVD mortality | Study population | HR 0.81 | 7447 | ⊕⊕⊝⊝ | — | |
| 12 per 1000 | 10 per 1000 | |||||
| Total mortality | Study population | HR 1.00 | 7447 | ⊕⊕⊝⊝ | — | |
| 47 per 1000 | 47 per 1000 | |||||
| Myocardial infarction | Study population | HR 0.79 | 7447 | ⊕⊕⊝⊝ | — | |
| 16 per 1000 | 12 per 1000 | |||||
| Stroke | Study population | HR 0.60 | 7447 | ⊕⊕⊕⊝ | — | |
| 24 per 1000 | 14 per 1000 | |||||
| Peripheral arterial disease | Study population | HR 0.42 | 7447 | ⊕⊕⊕⊝ | — | |
| 18 per 1000 | 8 per 1000 | |||||
| Total cholesterol (mmol/L), change from baseline | The mean total cholesterol change from baseline was ‐0.29 to 0.51 mmol/L | MD 0.13 mmol/L lower | — | 939 | ⊕⊕⊝⊝ | — |
| LDL cholesterol (mmol/L), change from baseline | The mean LDL cholesterol change from baseline ranged from ‐0.18 to 0.27 mmol/L | MD 0.15 mmol/L lower | — | 947 | ⊕⊕⊕⊝ | — |
| HDL cholesterol (mmol/L), change from baseline | The mean HDL cholesterol change from baseline ranged from ‐0.02 to 0.16 mmol/L | MD 0.02 mmol/L higher | — | 891 | ⊕⊕⊕⊝ | — |
| Triglycerides (mmol/L), change from baseline | The mean triglycerides change from baseline ranged from ‐0.44 to 1.32 mmol/L | MD 0.09 mmol/L lower | — | 939 | ⊕⊕⊕⊝ | — |
| Systolic blood pressure (mmHg), change from baseline | The mean systolic blood pressure change from baseline ranged from ‐10.4 to 6.9 mmHg | MD 1.5 mmHg lower | — | 448 | ⊕⊕⊝⊝ | — |
| Diastolic blood pressure (mmHg), change from baseline | The mean diastolic blood pressure change from baseline ranged from ‐8.1 to 5.3 mmHg | MD 0.26 mmHg lower | — | 448 | ⊕⊕⊝⊝ | — |
| Adverse events | Adverse effects were reported by only one RCT ‐ no adverse events were noted for either dietary intervention in the PREDIMED trial. | — | 7447 | ⊕⊕⊕⊝ | — | |
| *The risk in the intervention group (and its 95% confidence interval) is based on the assumed risk in the comparison group and the relative effect of the intervention (and its 95% CI). | ||||||
| GRADE Working Group grades of evidence | ||||||
| 1Downgraded by one level for imprecision. Confidence interval is wide enough to include both an important increase or decrease in the outcome. 2Downgraded by one level for risk of bias. The only included study was the PREDIMED trial, which was retracted due to methodological issues with randomisation, re‐analysed and republished. 3Downgraded by one level for risk of bias. Majority of studies are at unclear risk of selection bias, attrition bias, or both. 4Downgraded by one level for inconsistency. High I2 and forest plots shows different directions of effect. | ||||||
| Mediterranean dietary intervention compared to usual care for secondary prevention of cardiovascular disease | ||||||
| Patient or population: adults with established cardiovascular disease | ||||||
| Outcomes | Anticipated absolute effects* (95% CI) | Relative effect | № of participants | Certainty of the evidence | Comments | |
| Risk with usual care | Risk with Mediterranean dietary intervention | |||||
| CVD mortality | Study population | RR 0.35 | 605 | ⊕⊕⊝⊝ | — | |
| 63 per 1000 | 22 per 1000 | |||||
| Total mortality | Study population | RR 0.44 | 605 | ⊕⊕⊝⊝ | — | |
| 79 per 1000 | 35 per 1000 | |||||
| Total cholesterol (mmol/L), change from baseline | The mean total cholesterol change from baseline ranged from ‐0.22 to ‐0.31 mmol/L | MD 0.07 mmol/L higher | — | 441 | ⊕⊕⊝⊝ | — |
| LDL cholesterol (mmol/L), change from baseline | The mean LDL cholesterol change from baseline ranged from ‐0.26 to ‐0.41 | MD 0.11 higher | — | 441 | ⊕⊕⊝⊝ | — |
| HDL cholesterol (mmol/L), change from baseline | The mean HDL cholesterol change from baseline ranged from 0 to 0.15 mmol/L | MD 0.01 mmol/L lower | — | 441 | ⊕⊕⊝⊝ | — |
| Triglycerides (mmol/L), change from baseline | The mean triglycerides change from baseline ranged from ‐0.02 to ‐0.08 mmol/L | MD 0.14 mmol/L lower | — | 441 | ⊕⊕⊝⊝ | — |
| Systolic blood pressure (mmHg), change from baseline | The mean systolic blood pressure change from baseline was 9 mmHg | MD 2 mmHg lower | — | 339 | ⊕⊝⊝⊝ | — |
| Diastolic blood pressure (mmHg), change from baseline | The mean diastolic blood pressure change from baseline was 5 mmHg | MD 1 mmHg lower | — | 339 | ⊕⊝⊝⊝ | — |
| Adverse events | Adverse effects were reported in only one RCT. Two of 302 CHD patients noted margarine‐related side effects of colitis and diarrhoea in The Lyon Diet Heart Study. | — | 605 | ⊕⊕⊝⊝ | — | |
| *The risk in the intervention group (and its 95% confidence interval) is based on the assumed risk in the comparison group and the relative effect of the intervention (and its 95% CI). | ||||||
| GRADE Working Group grades of evidence | ||||||
| 1Downgraded by two levels for risk of bias. The only included study had an unclear randomisation method and the modified Zelen design may have introduced other biases, although the study was at low risk of bias for allocation concealment and attrition. 2Downgraded by two levels for risk of bias as both included studies were at unclear risk of selection bias or attrition bias, or both, and the majority weight in the meta‐analysis was for the study with a modified Zelen design. 3Downgraded by one level for imprecision due to small number of participants (N < 400). 4Downgraded by two levels for imprecision due to small number of participants and wide CI that includes both important increases and decreases in the outcome. | ||||||
| Mediterranean dietary intervention compared to another dietary intervention for the secondary prevention of cardiovascular disease | ||||||
| Patient or population: adults with established cardiovascular disease | ||||||
| Outcomes | Anticipated absolute effects* (95% CI) | Relative effect | № of participants | Certainty of the evidence | Comments | |
| Risk with another dietary intervention | Risk with Mediterranean dietary intervention | |||||
| Total cardiac endpoints (all‐cause and cardiac deaths, myocardial infarction, hospital admissions for heart failure, unstable angina or stroke, unadjusted) | Study population | RR 0.98 | 101 | ⊕⊝⊝⊝ | Total cardiac endpoints was used instead of the 2 individual outcomes cardiovascular mortality and total mortality because this was the format used in the only trial reporting this. | |
| 160 per 1000 | 157 per 1000 | |||||
| Total cholesterol (mmol/L), change from baseline (sensitivity analysis without Singh studies) | See comment | See comment | — | (0 RCTs) | — | None of the included studies measured this outcome when Singh studies were removed in sensitivity analyses. |
| LDL cholesterol (mmol/L), change from baseline (sensitivity analysis without Singh studies) | The mean LDL cholesterol change from baseline was 0.13 mmol/L | MD 0.08 mmol/L higher | — | 71 | ⊕⊝⊝⊝ | — |
| HDL cholesterol (mmol/L), change from baseline (sensitivity analysis without Singh studies) Follow‐up: 2 years | The mean HDL cholesterol change from baseline was 0.10 mmol/L | MD 0.05 mmol/L lower | — | 71 | ⊕⊕⊝⊝ | — |
| Triglycerides (mmol/L), change from baseline (sensitivity analysis without Singh studies) Follow‐up: 2 years | The mean triglycerides change from baseline was ‐0.63 mmol/L | MD 0.46 mmol/L higher | — | 71 | ⊕⊝⊝⊝ | — |
| Systolic blood pressure (mmHg), change from baseline (sensitivity analysis without Singh studies) Follow‐up range: 12 weeks to 2 years | The mean systolic blood pressure change from baseline ranged from 4 to ‐9.33 mmHg | MD 1.76 mmHg higher | — | 150 | ⊕⊝⊝⊝ | — |
| Diastolic blood pressure (mmHg), change from baseline (sensitivity analysis without Singh studies) Follow‐up range: 12 weeks to 2 years | The mean diastolic blood pressure change from baseline ranged from 1 to ‐9.23 mmHg | MD 0.98 mmHg higher | — | 150 | ⊕⊝⊝⊝ | — |
| Adverse events | — | — | — | — | — | Not reported |
| *The risk in the intervention group (and its 95% confidence interval) is based on the assumed risk in the comparison group and the relative effect of the intervention (and its 95% CI). | ||||||
| GRADE Working Group grades of evidence | ||||||
| 1Downgraded by one level for risk of bias. Only included study had unclear random sequence generation and unclear attrition. 2Downgraded by two levels for imprecision due to small sample size and wide confidence interval that crosses the null. 3Downgraded by one level for imprecision due to small sample size. Although CI includes the null, it is reasonably narrow. 4Downgraded by one level for risk of bias. Both studies had unclear randomisation method, although allocation was concealed. One study was at low risk of attrition bias, the other at unclear risk of attrition bias. | ||||||
| Outcome or subgroup title | No. of studies | No. of participants | Statistical method | Effect size |
| 1 Total cholesterol (mmol/L), change from baseline Show forest plot | 5 | 569 | Mean Difference (IV, Random, 95% CI) | ‐0.16 [‐0.32, 0.00] |
| 2 LDL cholesterol (mmol/L), change from baseline Show forest plot | 4 | 389 | Mean Difference (IV, Random, 95% CI) | ‐0.08 [‐0.26, 0.09] |
| 3 HDL cholesterol (mmol/L), change from baseline Show forest plot | 5 | 569 | Mean Difference (IV, Random, 95% CI) | 0.02 [‐0.04, 0.08] |
| 4 Triglycerides (mmol/L), change from baseline Show forest plot | 4 | Mean Difference (IV, Random, 95% CI) | Totals not selected | |
| 5 Systolic blood pressure (mmHg), change from baseline Show forest plot | 2 | 269 | Mean Difference (IV, Random, 95% CI) | ‐2.99 [‐3.45, ‐2.53] |
| 6 Diastolic blood pressure (mmHg), change from baseline Show forest plot | 2 | 269 | Mean Difference (IV, Random, 95% CI) | 0.00 [‐2.29, ‐1.71] |
| Outcome or subgroup title | No. of studies | No. of participants | Statistical method | Effect size |
| 1 Composite clinical events (CVD death, stroke, MI) Show forest plot | 1 | 7447 | Hazard Ratio (Random, 95% CI) | 0.70 [0.58, 0.85] |
| 2 CVD mortality Show forest plot | 1 | 7447 | Hazard Ratio (Random, 95% CI) | 0.81 [0.50, 1.32] |
| 3 Total mortality Show forest plot | 1 | 7447 | Hazard Ratio (Random, 95% CI) | 1.00 [0.81, 1.24] |
| 4 Myocardial infarction Show forest plot | 1 | 7447 | Hazard Ratio (Random, 95% CI) | 0.79 [0.57, 1.10] |
| 5 Stroke Show forest plot | 1 | 7447 | Hazard Ratio (Random, 95% CI) | 0.60 [0.45, 0.80] |
| 6 Peripheral arterial disease Show forest plot | 1 | 7447 | Hazard Ratio (Random, 95% CI) | 0.42 [0.28, 0.61] |
| 7 Incidence type 2 diabetes Show forest plot | 1 | 3541 | Hazard Ratio (Random, 95% CI) | 0.71 [0.52, 0.96] |
| 8 Stroke (unadjusted) Show forest plot | 1 | 180 | Risk Ratio (M‐H, Random, 95% CI) | 0.33 [0.04, 3.14] |
| 9 Total cholesterol (mmol/L), change from baseline Show forest plot | 7 | 939 | Mean Difference (IV, Random, 95% CI) | ‐0.13 [‐0.30, 0.04] |
| 10 LDL cholesterol (mmol/L), change from baseline Show forest plot | 7 | 947 | Mean Difference (IV, Random, 95% CI) | ‐0.15 [‐0.27, ‐0.02] |
| 11 HDL cholesterol (mmol/L), change from baseline Show forest plot | 6 | 891 | Mean Difference (IV, Random, 95% CI) | 0.02 [‐0.01, 0.04] |
| 12 Triglycerides (mmol/L), change from baseline Show forest plot | 7 | 939 | Mean Difference (IV, Random, 95% CI) | ‐0.09 [‐0.16, ‐0.01] |
| 13 Systolic blood pressure (mmHg), change from baseline Show forest plot | 4 | 448 | Mean Difference (IV, Random, 95% CI) | ‐1.50 [‐3.92, 0.92] |
| 14 Diastolic blood pressure (mmHg), change from baseline Show forest plot | 4 | 448 | Mean Difference (IV, Random, 95% CI) | ‐0.26 [‐2.41, 1.90] |
| Outcome or subgroup title | No. of studies | No. of participants | Statistical method | Effect size |
| 1 Total mortality Show forest plot | 1 | Risk Ratio (Random, 95% CI) | 0.44 [0.21, 0.92] | |
| 2 CVD mortality Show forest plot | 1 | Risk Ratio (Random, 95% CI) | 0.35 [0.15, 0.82] | |
| 3 CVD death plus non‐fatal MI Show forest plot | 1 | Hazard Ratio (Random, 95% CI) | 0.28 [0.15, 0.52] | |
| 4 Total cholesterol (mmol/L), change from baseline Show forest plot | 2 | 441 | Mean Difference (IV, Random, 95% CI) | 0.07 [‐0.19, 0.33] |
| 5 LDL cholesterol (mmol/L), change from baseline Show forest plot | 2 | 441 | Mean Difference (IV, Random, 95% CI) | 0.11 [‐0.09, 0.31] |
| 6 HDL cholesterol (mmol/L), change from baseline Show forest plot | 2 | 441 | Mean Difference (IV, Random, 95% CI) | ‐0.01 [‐0.08, 0.07] |
| 7 Triglycerides (mmol/L), change from baseline Show forest plot | 2 | 441 | Mean Difference (IV, Random, 95% CI) | ‐0.14 [‐0.38, 0.10] |
| 8 Systolic blood pressure (mmHg), change from baseline Show forest plot | 1 | 339 | Mean Difference (IV, Random, 95% CI) | ‐2.0 [‐5.29, 1.29] |
| 9 Diastolic blood pressure (mmHg), change from baseline Show forest plot | 1 | 339 | Mean Difference (IV, Random, 95% CI) | ‐1.0 [‐4.29, 2.29] |
| Outcome or subgroup title | No. of studies | No. of participants | Statistical method | Effect size |
| 1 Non‐fatal MI Show forest plot | 1 | Risk Ratio (Random, 95% CI) | 0.47 [0.28, 0.79] | |
| 2 Non‐fatal MI (sensitivity analysis without Singh studies) | 0 | Risk Ratio (Random, 95% CI) | 0.0 [0.0, 0.0] | |
| 3 Fatal MI Show forest plot | 2 | Risk Ratio (Random, 95% CI) | 0.66 [0.61, 0.71] | |
| 4 Fatal MI (sensitivity analysis without Singh studies) | 0 | Risk Ratio (Random, 95% CI) | 0.0 [0.0, 0.0] | |
| 5 Sudden cardiac death Show forest plot | 2 | Risk Ratio (Random, 95% CI) | 0.48 [0.37, 0.63] | |
| 6 Sudden cardiac death (sensitivity analysis without Singh studies) | 0 | Risk Ratio (Random, 95% CI) | 0.0 [0.0, 0.0] | |
| 7 Total cardiac endpoints (fatal and non‐fatal MI, sudden cardiac death) Show forest plot | 2 | Risk Ratio (Random, 95% CI) | 0.59 [0.44, 0.80] | |
| 8 Total cardiac endpoints (fatal and non‐fatal MI, sudden cardiac death) (sensitivity analysis without Singh studies) | 0 | Risk Ratio (Random, 95% CI) | 0.0 [0.0, 0.0] | |
| 9 Total mortality Show forest plot | 1 | Risk Ratio (Random, 95% CI) | 0.59 [0.51, 0.68] | |
| 10 Total mortality (sensitivity analysis without Singh studies) | 0 | Risk Ratio (Random, 95% CI) | 0.0 [0.0, 0.0] | |
| 11 CVD mortality Show forest plot | 1 | Risk Ratio (Random, 95% CI) | 0.50 [0.42, 0.60] | |
| 12 CVD mortality (sensitivity analysis without Singh studies) | 0 | Risk Ratio (Random, 95% CI) | 0.0 [0.0, 0.0] | |
| 13 Total cardiac endpoints (all‐cause and cardiac deaths, MI, hospital admissions for heart failure, unstable angina or stroke, unadjusted) Show forest plot | 1 | 101 | Risk Ratio (M‐H, Random, 95% CI) | 0.98 [0.40, 2.41] |
| 14 Total cholesterol (mmol/L), change from baseline Show forest plot | 2 | 1283 | Mean Difference (IV, Random, 95% CI) | ‐0.50 [‐0.61, ‐0.39] |
| 15 Total cholesterol (mmol/L), change from baseline (sensitivity analysis without Singh studies) | 0 | 0 | Mean Difference (IV, Random, 95% CI) | 0.0 [0.0, 0.0] |
| 16 LDL cholesterol (mmol/L), change from baseline Show forest plot | 3 | Mean Difference (IV, Random, 95% CI) | Totals not selected | |
| 17 LDL cholesterol (mmol/L), change from baseline (sensitivity analysis without Singh studies) Show forest plot | 1 | 71 | Mean Difference (IV, Random, 95% CI) | 0.08 [‐0.26, 0.42] |
| 18 HDL cholesterol (mmol/L), change from baseline Show forest plot | 3 | 1354 | Mean Difference (IV, Random, 95% CI) | 0.06 [‐0.01, 0.12] |
| 19 HDL cholesterol (mmol/L), change from baseline (sensitivity analysis without Singh studies) Show forest plot | 1 | 71 | Mean Difference (IV, Random, 95% CI) | ‐0.05 [‐0.17, 0.06] |
| 20 Triglycerides (mmol/L), change from baseline Show forest plot | 3 | Mean Difference (IV, Random, 95% CI) | Totals not selected | |
| 21 Triglycerides (mmol/L), change from baseline (sensitivity analysis without Singh studies) Show forest plot | 1 | 71 | Mean Difference (IV, Random, 95% CI) | 0.46 [‐0.24, 1.16] |
| 22 Systolic blood pressure (mmHg), change from baseline Show forest plot | 4 | Mean Difference (IV, Random, 95% CI) | Totals not selected | |
| 23 Systolic blood pressure (mmHg), change from baseline (sensitivity analysis without Singh studies) Show forest plot | 2 | 150 | Mean Difference (IV, Random, 95% CI) | 1.76 [‐2.80, 6.33] |
| 24 Diastolic blood pressure (mmHg), change from baseline Show forest plot | 4 | Mean Difference (IV, Random, 95% CI) | Totals not selected | |
| 25 Diastolic blood pressure (mmHg), change from baseline (sensitivity analysis without Singh studies) Show forest plot | 2 | 150 | Mean Difference (IV, Random, 95% CI) | 0.98 [‐1.97, 3.93] |