Latrepirdine for Alzheimer's disease
Información
- DOI:
- https://doi.org/10.1002/14651858.CD009524.pub2Copiar DOI

- Base de datos:
-
- Cochrane Database of Systematic Reviews
- Versión publicada:
-
- 21 abril 2015see what's new
- Tipo:
-
- Intervention
- Etapa:
-
- Review
- Grupo Editorial Cochrane:
-
Grupo Cochrane de Demencia y trastornos cognitivos
- Copyright:
-
- Copyright © 2015 The Cochrane Collaboration. Published by John Wiley & Sons, Ltd.
Cifras del artículo
Altmetric:
Citado por:
Autores
Contributions of authors
KLL and NH developed the protocol. JJC, SAC and MR performed the search. SAC and MR extracted the data and assessed risk of bias. KLL, NH, SAC and MR selected studies for inclusion. SAC performed the analyses and KLL, NH and MR checked for accuracy.
Sources of support
Internal sources
-
No sources of support supplied
External sources
-
NIHR, UK.
This review was supported by the National Institute for Health Research, via Cochrane Infrastructure funding to the Cochrane Dementia and Cognitive Improvement group. The views and opinions expressed therein are those of the authors and do not necessarily reflect those of the Systematic Reviews Programme, NIHR, NHS or the Department of Health
Declarations of interest
KLL is the executive director of the Medical Outcomes and Research in Economics (MORE) Research group, receives research funding from Abbott Laboratories, Sonexa Therapeutics Inc. and Lundbeck Canada, is funded by grants from the National Institute of Health, Canadian Institute of Health Research, the Alzheimer's Society of Canada, the Heart and Stroke Foundation and Physician's Services Incorporated Foundation.
NH receives research funding from Sonexa Therapeutics Inc., Sanofi‐Aventis, Elan and Lundbeck Canada Inc., and holds grants from the National Institute of Health, the Canadian Institute of Health Research, Alzheimer's Society of Canada, Alzheimer’s Drug Discovery Foundation, Heart and Stroke Foundation and Physicians’ Services Incorporated Foundation. NH receives speaker's honoraria from Lundbeck, Pfizer, Janssen Ortho and Novartis, and has participated in an advisory board meeting for Pfizer regarding latrepirdine.
Version history
| Published | Title | Stage | Authors | Version |
| 2015 Apr 21 | Latrepirdine for Alzheimer's disease | Review | Sarah Chau, Nathan Herrmann, Myuri T Ruthirakuhan, Jinghan Jenny Chen, Krista L Lanctôt | |
| 2011 Dec 07 | Dimebon for Alzheimer's disease | Protocol | Nathan Herrmann, Sarah Chau, Julia M Hussman, Krista L Lanctôt | |
Differences between protocol and review
There were some differences between the protocol and review.
1) RR was used rather than OR for the measurement of treatment effect.
2) Use of the GRADE system for assessing quality of evidence of all our outcome measures was added.
3) For studies reporting several different time points, we used the primary endpoint specified by the study authors in our primary pooled analysis of treatment effect. Additional time points were used in subgroup analyses.
4) For dealing with missing data, we did not perform statistical calculations to complete missing information. Instead, we included data from the study reports which had used LOCF to handle non‐completers.
5) For the assessment of reporting biases, a funnel plot could not be generated as there was an insufficient number of studies included in the review.
6) For subgroup analysis, we did not have sufficient data to conduct analyses for different dosage and AD severity groups.
7) We did not conduct sensitivity analyses in our review as there was an insufficient number of studies included.
Keywords
MeSH
Medical Subject Headings (MeSH) Keywords
Medical Subject Headings Check Words
Humans;
PICO
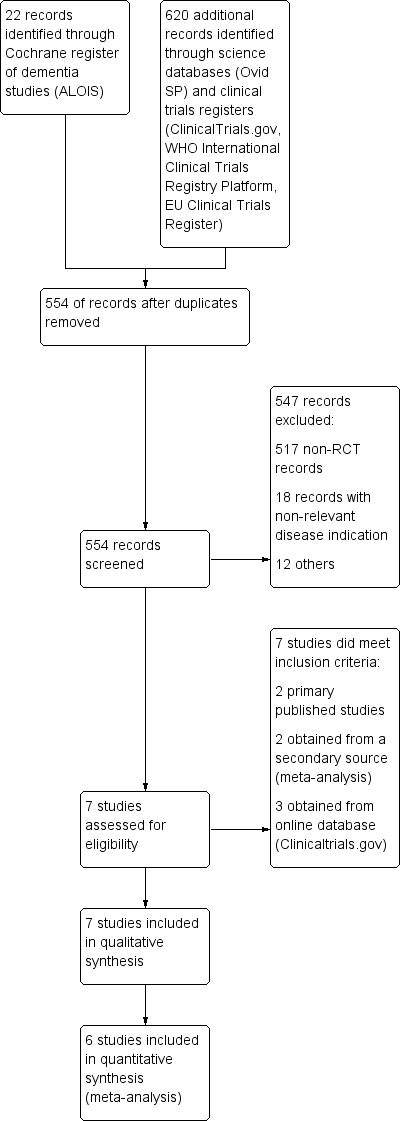
Study flow diagram.
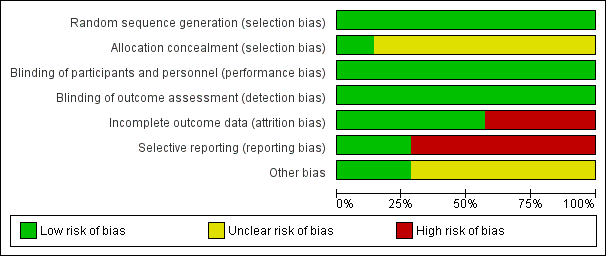
Risk of bias graph: review authors' judgements about each risk of bias item presented as percentages across all included studies.
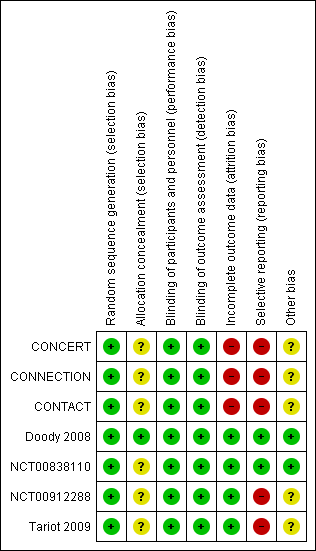
Risk of bias summary: review authors' judgements about each risk of bias item for each included study.
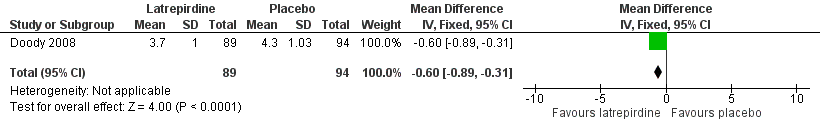
Forest plot of comparison: 1 Clinical global impression of change, outcome: 1.1 CIBIC‐Plus (change from baseline at 26 weeks).

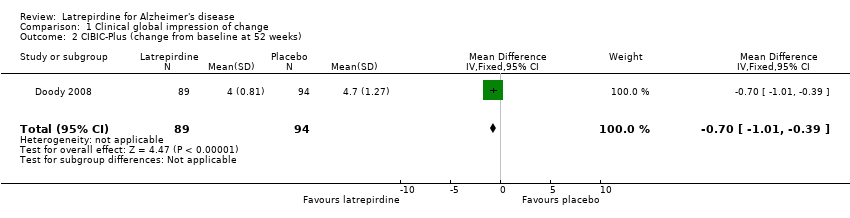
Forest plot of comparison: 1 Clinical global impression of change, outcome: 1.2 CIBIC‐Plus (change from baseline at 52 weeks).
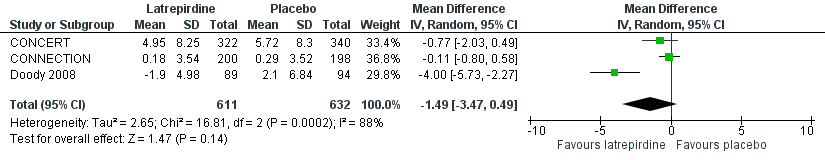
Forest plot of comparison: 2 Cognition, outcome: 2.1 ADAS‐Cog (change from baseline).
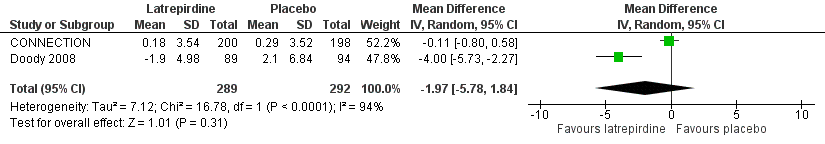
Forest plot of comparison: 2 Cognition, outcome: 2.2 ADAS‐Cog (change from baseline at 26 weeks).

Forest plot of comparison: 2 Cognition, outcome: 2.3 ADAS‐Cog (change from baseline at 52 weeks).
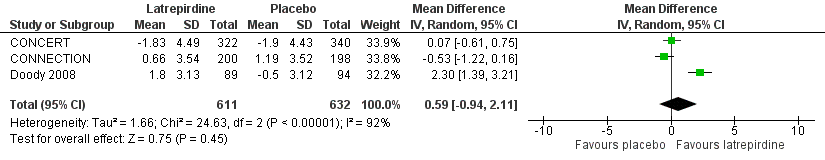
Forest plot of comparison: 2 Cognition, outcome: 2.4 MMSE (change from baseline).

Forest plot of comparison: 2 Cognition, outcome: 2.5 MMSE (change from baseline at 26 weeks).
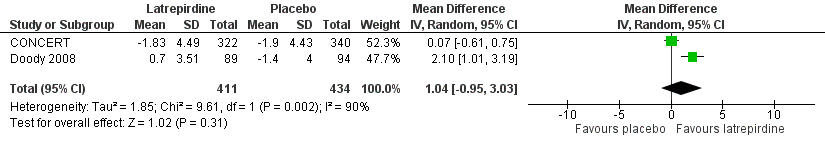
Forest plot of comparison: 2 Cognition, outcome: 2.6 MMSE (change from baseline at 52 weeks).

Forest plot of comparison: 3 Function, outcome: 3.1 ADCS‐ADL (change from baseline).

Forest plot of comparison: 3 Function, outcome: 3.2 ADCS‐ADL (change from baseline at 26 weeks).
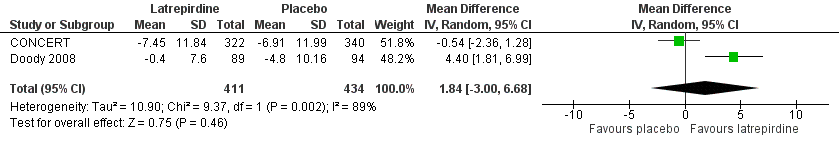
Forest plot of comparison: 3 Function, outcome: 3.3 ADCS‐ADL (change from baseline at 52 weeks).

Forest plot of comparison: 4 Behaviour, outcome: 4.1 NPI (change from baseline).

Forest plot of comparison: 4 Behaviour, outcome: 4.2 NPI (change from baseline at 26 weeks).
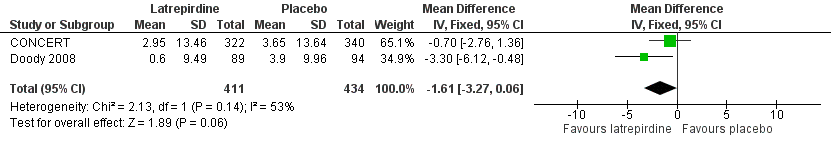
Forest plot of comparison: 4 Behaviour, outcome: 4.3 NPI (change from baseline at 52 weeks).

Forest plot of comparison: 5 Adverse events, outcome: 5.1 Adverse events.

Forest plot of comparison: 5 Adverse events, outcome: 5.2 Serious adverse events.

Forest plot of comparison: 6 Dropouts, outcome: 6.1 Total dropouts.
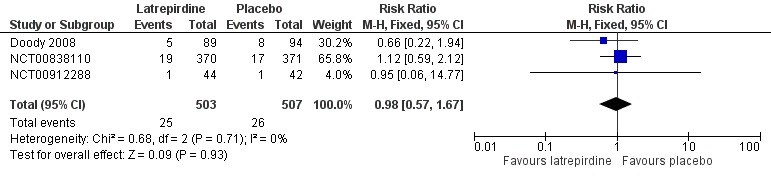
Forest plot of comparison: 6 Dropouts, outcome: 6.2 Dropouts due to adverse events.

Comparison 1 Clinical global impression of change, Outcome 1 CIBIC‐Plus (change from baseline at 26 weeks).
Comparison 1 Clinical global impression of change, Outcome 2 CIBIC‐Plus (change from baseline at 52 weeks).

Comparison 2 Cognition, Outcome 1 ADAS‐Cog (change from baseline).

Comparison 2 Cognition, Outcome 2 ADAS‐Cog (change from baseline at 26 weeks).

Comparison 2 Cognition, Outcome 3 ADAS‐Cog (change from baseline at 52 weeks).

Comparison 2 Cognition, Outcome 4 MMSE (change from baseline).
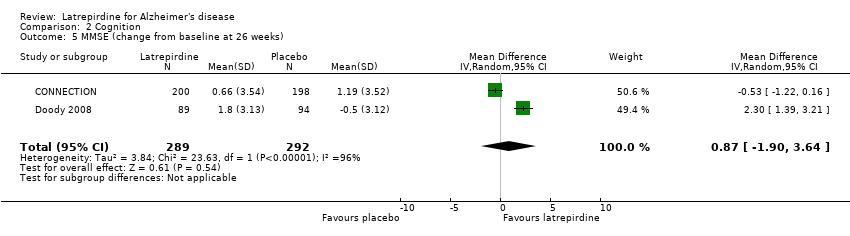
Comparison 2 Cognition, Outcome 5 MMSE (change from baseline at 26 weeks).

Comparison 2 Cognition, Outcome 6 MMSE (change from baseline at 52 weeks).

Comparison 3 Function, Outcome 1 ADCS‐ADL (change from baseline).
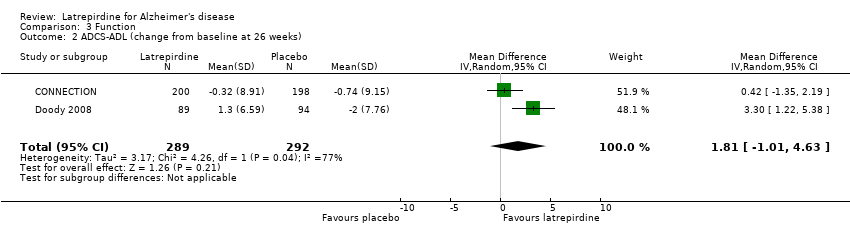
Comparison 3 Function, Outcome 2 ADCS‐ADL (change from baseline at 26 weeks).

Comparison 3 Function, Outcome 3 ADCS‐ADL (change from baseline at 52 weeks).
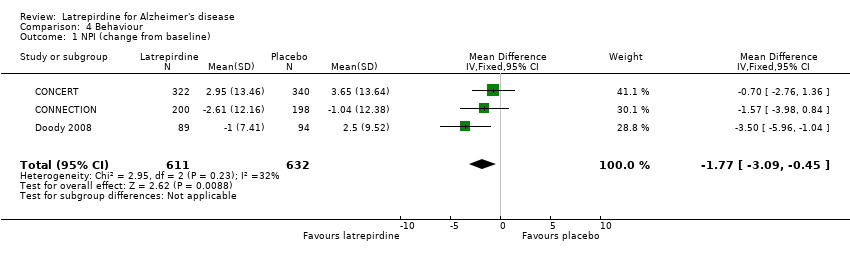
Comparison 4 Behaviour, Outcome 1 NPI (change from baseline).

Comparison 4 Behaviour, Outcome 2 NPI (change from baseline at 26 weeks).
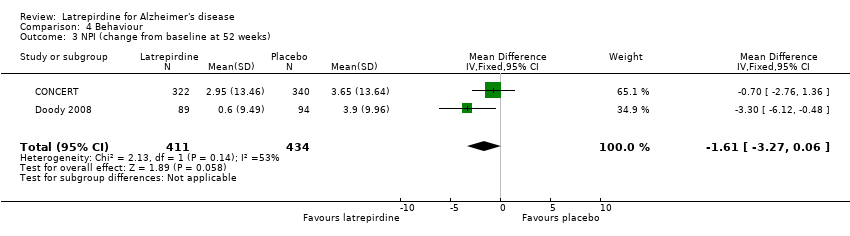
Comparison 4 Behaviour, Outcome 3 NPI (change from baseline at 52 weeks).

Comparison 5 Adverse events, Outcome 1 Adverse Events.

Comparison 5 Adverse events, Outcome 2 Serious Adverse Events.

Comparison 6 Dropouts, Outcome 1 Total Drop‐out.
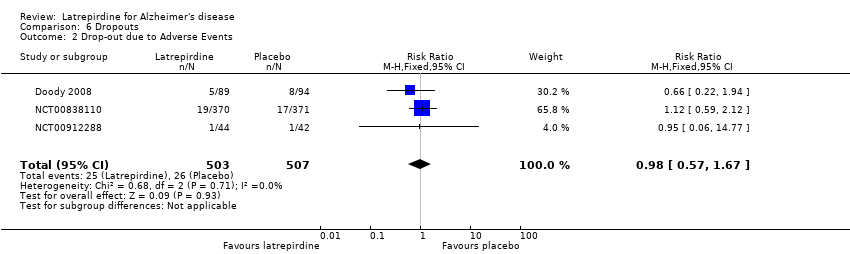
Comparison 6 Dropouts, Outcome 2 Drop‐out due to Adverse Events.
| Latrepirdine compared with placebo in Alzheimer's disease | ||||||
| Patient or population: patients with Alzheimer's disease | ||||||
| Outcomes | Illustrative comparative risks* (95% CI) | Relative effect | No of Participants | Quality of the evidence | Comments | |
| Assumed risk | Corresponding risk | |||||
| Control | Latrepirdine | |||||
| CIBIC‐Plus (change from baseline at 26 weeks) | The mean CIBIC‐Plus (change from baseline at 26 weeks) in the control groups was 4.30 | The mean CIBIC‐Plus (change from baseline at 26 weeks) in the intervention groups was | 183 | ⊕⊕⊝⊝ | ||
| ADAS‐Cog | The mean change from baseline in ADAS‐Cog ranged across control groups from | The mean change from baseline in ADAS‐Cog in the intervention groups was 1.49 lower (95% CI ‐3.47 to 0.49) | 1243 | ⊕⊕⊝⊝ | 3 to 4 point change suggested to be clinically significant | |
| MMSE | The mean change from baseline in MMSE ranged across control groups from ‐1.90 to 1.19 | The mean change from baseline in MMSE in the intervention groups was 0.59 higher (95% CI ‐0.94 to 2.11) | 1243 | ⊕⊕⊝⊝ | 2 to 4 point change suggested to be clinically significant | |
| ADCS‐ADL | The mean change from baseline in ADCS‐ADL ranged across control groups from ‐6.91 to ‐0.74 | The mean change from baseline in ADCS‐ADL in the intervention groups was 1.00 higher (95% CI ‐1.15 to 3.15) | 1243 | ⊕⊕⊝⊝ | Limited data on clinically meaningful changes | |
| NPI | The mean change from baseline in NPI ranged across control groups from ‐1.04 to 3.65 | The mean change from baseline in NPI in the intervention groups was 1.77 lower (95% CI 3.09 to ‐0.45) | 1243 | ⊕⊕⊕⊕ | 4‐point change suggested to be clinically significant | |
| *The basis for the assumed risk (e.g. the median control group risk across studies) is provided in footnotes. The corresponding risk (and its 95% confidence interval) is based on the assumed risk in the comparison group and the relative effect of the intervention (and its 95% CI). | ||||||
| GRADE Working Group grades of evidence | ||||||
| 1 significant imprecision 3 significant heterogeneity across studies | ||||||
| Latrepirdine compared with placebo in measures of safety and tolerability in Alzheimer's disease | ||||||
| Patient or population: patients with Alzheimer's disease | ||||||
| Outcomes | Illustrative comparative risks* (95% CI) | Relative effect | No of Participants | Quality of the evidence | Comments | |
| Assumed risk | Corresponding risk | |||||
| Control | Latrepirdine | |||||
| Adverse events | Study population | RR 1.03 | 1034 | ⊕⊕⊕⊝ | ||
| 583 per 1000 | 601 per 1000 | |||||
| Moderate | ||||||
| 569 per 1000 | 586 per 1000 | |||||
| Serious adverse events | Study population | RR 0.86 | 1034 | ⊕⊕⊕⊝ | ||
| 74 per 1000 | 63 per 1000 | |||||
| Moderate | ||||||
| 73 per 1000 | 63 per 1000 | |||||
| Total dropouts | Study population | RR 0.91 | 1034 | ⊕⊕⊕⊝ | ||
| 122 per 1000 | 111 per 1000 | |||||
| Moderate | ||||||
| 115 per 1000 | 105 per 1000 | |||||
| Dropouts due to adverse events | Study population | RR 0.98 | 1010 | ⊕⊕⊕⊝ | ||
| 51 per 1000 | 50 per 1000 | |||||
| Moderate | ||||||
| 46 per 1000 | 45 per 1000 | |||||
| *The basis for the assumed risk (e.g. the median control group risk across studies) is provided in footnotes. The corresponding risk (and its 95% confidence interval) is based on the assumed risk in the comparison group and the relative effect of the intervention (and its 95% CI). | ||||||
| GRADE Working Group grades of evidence | ||||||
| 1 publication bias | ||||||
| Source | Search Strategy |
| Medline (Ovid SP) | 1. latriperdine.mp. 2. dimebon.mp. 3. dimebolin.mp. 4. 2,3,4,5‐tetrahydro‐2,8‐dimethyl‐5‐(2‐(6‐methyl‐3‐pyridyl)ethyl)‐1H‐pyrido(4,3‐b)indole.mp. 5. (1 OR 2 OR 3 OR 4) 6. (Alzheimer* OR AD).mp. 7. Alzheimer Disease/ 8. Dement*.mp. 9. (6 OR 7 OR 8) 10. (5 AND 9) 11. randomized controlled trial.pt. 12. controlled clinical trial.pt. 13. randomized.ab. 14. "randomized controlled trial".tw. 15. placebo.ab. 16. drug therapy.fs. 17. randomly.ab. 18. trial.ab. 19. groups.ab. 20. (11 OR 12 OR 13 OR 14 OR 15 OR 16 OR 17 OR 18 OR 19) 21. humans.sh. 22. (20 AND 21) 23. (10 AND 22) |
| Outcome or subgroup title | No. of studies | No. of participants | Statistical method | Effect size |
| 1 CIBIC‐Plus (change from baseline at 26 weeks) Show forest plot | 1 | 183 | Mean Difference (IV, Fixed, 95% CI) | ‐0.60 [‐0.89, ‐0.31] |
| 2 CIBIC‐Plus (change from baseline at 52 weeks) Show forest plot | 1 | 183 | Mean Difference (IV, Fixed, 95% CI) | ‐0.70 [‐1.01, ‐0.39] |
| Outcome or subgroup title | No. of studies | No. of participants | Statistical method | Effect size |
| 1 ADAS‐Cog (change from baseline) Show forest plot | 3 | 1243 | Mean Difference (IV, Random, 95% CI) | ‐1.49 [‐3.47, 0.49] |
| 2 ADAS‐Cog (change from baseline at 26 weeks) Show forest plot | 2 | 581 | Mean Difference (IV, Random, 95% CI) | ‐1.97 [‐5.78, 1.84] |
| 3 ADAS‐Cog (change from baseline at 52 weeks) Show forest plot | 2 | 845 | Mean Difference (IV, Random, 95% CI) | ‐3.07 [‐7.70, 1.57] |
| 4 MMSE (change from baseline) Show forest plot | 3 | 1243 | Mean Difference (IV, Random, 95% CI) | 0.59 [‐0.94, 2.11] |
| 5 MMSE (change from baseline at 26 weeks) Show forest plot | 2 | 581 | Mean Difference (IV, Random, 95% CI) | 0.87 [‐1.90, 3.64] |
| 6 MMSE (change from baseline at 52 weeks) Show forest plot | 2 | 845 | Mean Difference (IV, Random, 95% CI) | 1.04 [‐0.95, 3.03] |
| Outcome or subgroup title | No. of studies | No. of participants | Statistical method | Effect size |
| 1 ADCS‐ADL (change from baseline) Show forest plot | 3 | 1243 | Mean Difference (IV, Random, 95% CI) | 1.00 [‐1.15, 3.15] |
| 2 ADCS‐ADL (change from baseline at 26 weeks) Show forest plot | 2 | 581 | Mean Difference (IV, Random, 95% CI) | 1.81 [‐1.01, 4.63] |
| 3 ADCS‐ADL (change from baseline at 52 weeks) Show forest plot | 2 | 845 | Mean Difference (IV, Random, 95% CI) | 1.84 [‐1.00, 6.68] |
| Outcome or subgroup title | No. of studies | No. of participants | Statistical method | Effect size |
| 1 NPI (change from baseline) Show forest plot | 3 | 1243 | Mean Difference (IV, Fixed, 95% CI) | ‐1.77 [‐3.09, ‐0.45] |
| 2 NPI (change from baseline at 26 weeks) Show forest plot | 2 | 581 | Mean Difference (IV, Fixed, 95% CI) | ‐2.51 [‐4.24, ‐0.79] |
| 3 NPI (change from baseline at 52 weeks) Show forest plot | 2 | 845 | Mean Difference (IV, Fixed, 95% CI) | ‐1.61 [‐3.27, 0.06] |
| Outcome or subgroup title | No. of studies | No. of participants | Statistical method | Effect size |
| 1 Adverse Events Show forest plot | 4 | 1034 | Risk Ratio (M‐H, Fixed, 95% CI) | 1.03 [0.93, 1.14] |
| 2 Serious Adverse Events Show forest plot | 4 | 1034 | Risk Ratio (M‐H, Fixed, 95% CI) | 0.86 [0.55, 1.35] |
| Outcome or subgroup title | No. of studies | No. of participants | Statistical method | Effect size |
| 1 Total Drop‐out Show forest plot | 4 | 1034 | Risk Ratio (M‐H, Fixed, 95% CI) | 0.91 [0.65, 1.27] |
| 2 Drop‐out due to Adverse Events Show forest plot | 3 | 1010 | Risk Ratio (M‐H, Fixed, 95% CI) | 0.98 [0.57, 1.67] |