Scolaris Content Display Scolaris Content Display

Study flow diagram.
Figuras y tablas -
Figure 1

Study flow diagram.

Risk of bias graph: review authors' judgements about each risk of bias item presented as percentages across all included studies.
Figuras y tablas -
Figure 2

Risk of bias graph: review authors' judgements about each risk of bias item presented as percentages across all included studies.

Risk of bias summary: review authors' judgements about each risk of bias item for each included study.
Figuras y tablas -
Figure 3

Risk of bias summary: review authors' judgements about each risk of bias item for each included study.

Forest plot of comparison: 1 Mass media vs. control (main comparison), outcome: 1.1 Discrimination (Immediate).
Figuras y tablas -
Figure 4

Forest plot of comparison: 1 Mass media vs. control (main comparison), outcome: 1.1 Discrimination (Immediate).

Forest plot of comparison: 1 Mass media vs. control (main comparison): outcome 1.2 Discrimination.
Figuras y tablas -
Figure 5

Forest plot of comparison: 1 Mass media vs. control (main comparison): outcome 1.2 Discrimination.

Forest plot of comparison: 1 Mass media vs. control (main comparison), outcome: 1.3 Prejudice.
Figuras y tablas -
Figure 6

Forest plot of comparison: 1 Mass media vs. control (main comparison), outcome: 1.3 Prejudice.

Forest plot of comparison: 1 Mass media vs. control (main comparison), outcome: 1.4 Prejudice.
Figuras y tablas -
Figure 7

Forest plot of comparison: 1 Mass media vs. control (main comparison), outcome: 1.4 Prejudice.

Forest plot of comparison: 5 Mass media vs. control by presence of narratives, outcome: 5.1 Prejudice (at earliest follow‐up time point).
Figuras y tablas -
Figure 8

Forest plot of comparison: 5 Mass media vs. control by presence of narratives, outcome: 5.1 Prejudice (at earliest follow‐up time point).

Forest plot of comparison: 6 Mass media vs. control by celebrity narratives, outcome: 6.1 Prejudice (at earliest follow‐up time point).
Figuras y tablas -
Figure 9

Forest plot of comparison: 6 Mass media vs. control by celebrity narratives, outcome: 6.1 Prejudice (at earliest follow‐up time point).

Forest plot of comparison: 7 Mass media vs. control by fictional narratives, outcome: 7.1 Prejudice (at earliest follow‐up time point).
Figuras y tablas -
Figure 10

Forest plot of comparison: 7 Mass media vs. control by fictional narratives, outcome: 7.1 Prejudice (at earliest follow‐up time point).

Forest plot of comparison: 8 Mass media vs. control by type of message, outcome: 8.1 Prejudice (at earliest follow‐up time point).
Figuras y tablas -
Figure 11

Forest plot of comparison: 8 Mass media vs. control by type of message, outcome: 8.1 Prejudice (at earliest follow‐up time point).

Forest plot of comparison: 9 Mass media vs. control by type of media, outcome: 9.1 Prejudice (at earliest follow‐up time point)).
Figuras y tablas -
Figure 12

Forest plot of comparison: 9 Mass media vs. control by type of media, outcome: 9.1 Prejudice (at earliest follow‐up time point)).

Comparison 1 Mass media vs. control: main comparison, Outcome 1 Discrimination (Immediate).
Figuras y tablas -
Analysis 1.1

Comparison 1 Mass media vs. control: main comparison, Outcome 1 Discrimination (Immediate).

Comparison 1 Mass media vs. control: main comparison, Outcome 2 Discrimination.
Figuras y tablas -
Analysis 1.2

Comparison 1 Mass media vs. control: main comparison, Outcome 2 Discrimination.

Comparison 1 Mass media vs. control: main comparison, Outcome 3 Prejudice.
Figuras y tablas -
Analysis 1.3

Comparison 1 Mass media vs. control: main comparison, Outcome 3 Prejudice.

Comparison 1 Mass media vs. control: main comparison, Outcome 4 Prejudice.
Figuras y tablas -
Analysis 1.4

Comparison 1 Mass media vs. control: main comparison, Outcome 4 Prejudice.

Comparison 2 Mass media vs. control by income of country, Outcome 1 Prejudice (at earliest follow‐up time point).
Figuras y tablas -
Analysis 2.1

Comparison 2 Mass media vs. control by income of country, Outcome 1 Prejudice (at earliest follow‐up time point).

Comparison 3 Mass media vs. control by number of mass media components, Outcome 1 Prejudice (at earliest follow‐up time point).
Figuras y tablas -
Analysis 3.1

Comparison 3 Mass media vs. control by number of mass media components, Outcome 1 Prejudice (at earliest follow‐up time point).

Comparison 4 Mass media vs. control by whether combined with non‐mass media, Outcome 1 Prejudice (at earliest follow‐up time point).
Figuras y tablas -
Analysis 4.1

Comparison 4 Mass media vs. control by whether combined with non‐mass media, Outcome 1 Prejudice (at earliest follow‐up time point).

Comparison 5 Mass media vs. control by presence of narratives, Outcome 1 Prejudice (at earliest follow‐up time point).
Figuras y tablas -
Analysis 5.1

Comparison 5 Mass media vs. control by presence of narratives, Outcome 1 Prejudice (at earliest follow‐up time point).

Comparison 6 Mass media vs. control by celebrity narratives, Outcome 1 Prejudice (at earliest follow‐up time point).
Figuras y tablas -
Analysis 6.1

Comparison 6 Mass media vs. control by celebrity narratives, Outcome 1 Prejudice (at earliest follow‐up time point).

Comparison 7 Mass media vs. control by fictional narratives, Outcome 1 Prejudice.
Figuras y tablas -
Analysis 7.1

Comparison 7 Mass media vs. control by fictional narratives, Outcome 1 Prejudice.

Comparison 8 Mass media vs. control by type of message, Outcome 1 Prejudice (at earliest follow‐up time point).
Figuras y tablas -
Analysis 8.1

Comparison 8 Mass media vs. control by type of message, Outcome 1 Prejudice (at earliest follow‐up time point).

Comparison 9 Mass media vs. control by type of media, Outcome 1 Prejudice (at earliest follow‐up time point)).
Figuras y tablas -
Analysis 9.1

Comparison 9 Mass media vs. control by type of media, Outcome 1 Prejudice (at earliest follow‐up time point)).

Mass media compared with inactive control for reducing mental health‐related stigma

Patient or population: General public or any of its constituent groups (excluding groups comprising solely of people with mental ill health)

Settings: Any

Intervention: Mass media

Comparison: Inactive control

Outcomes

Relative effect
(95% CI)7

No of Participants
(studies)

Quality of the evidence
(GRADE)

Comments

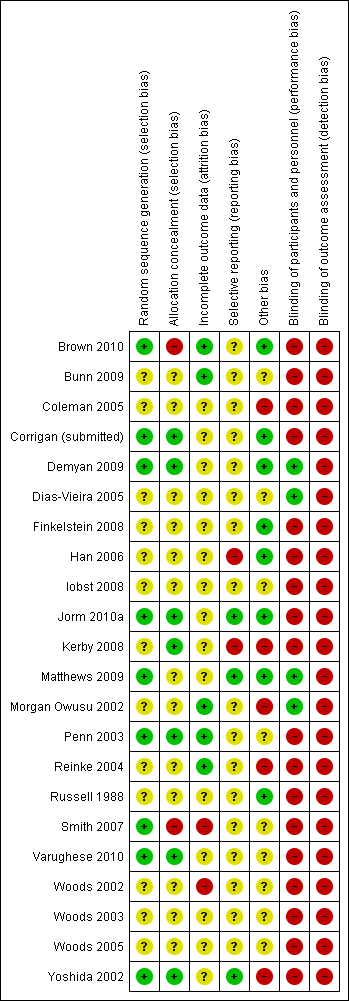
Discrimination

(i) not registering to attend focus group with people with schizophrenia (immediate)1

(ii) not visiting sheltered workshop for people with mental illness (9 months)2

(iii) distance placed between chairs when anticipating meeting with person with Tourette's syndrome3

ORs (802 participants, 2 studies)

(i) 1.30 (0.53 to 3.19)

(i) 1.19 (0.85 to 1.65)

SMDs (394 participants, 3 studies)

(iii) median SMD ‐0.25

Range of SMDs ‐0.85 (‐1.39 to ‐0.31) to ‐0.17 (‐0.53 to 0.20)

1196 (5)

⊕⊕⊝⊝
low

Quality of evidence downgraded for study limitations (risk of bias) and indirectness of measures (see Quality of the evidence for full details)

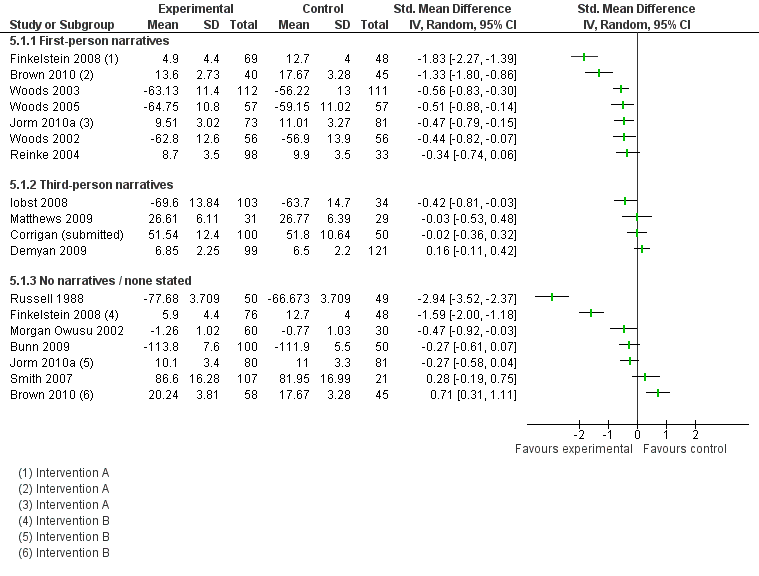
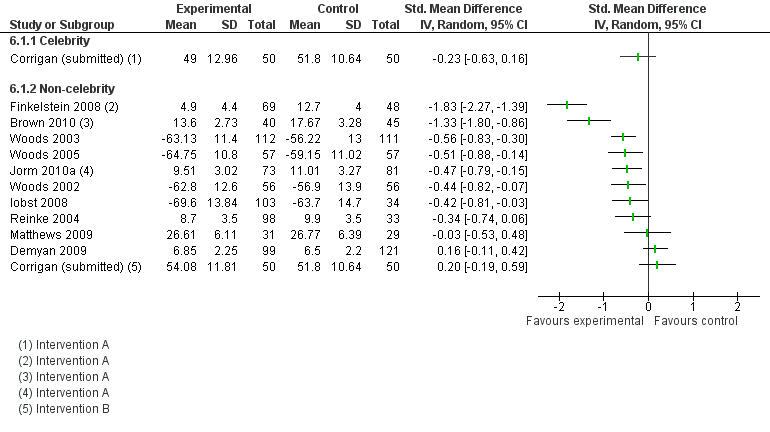
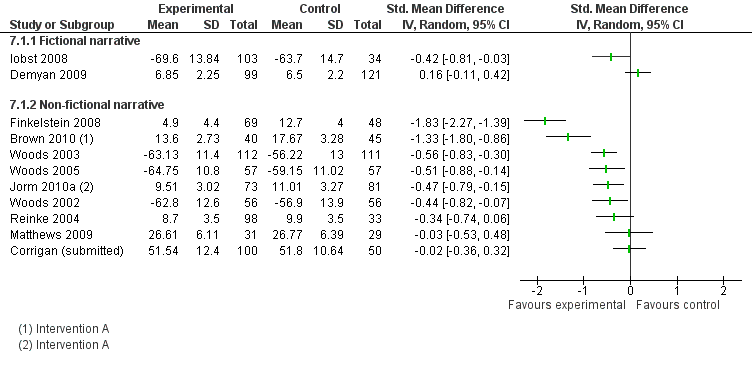
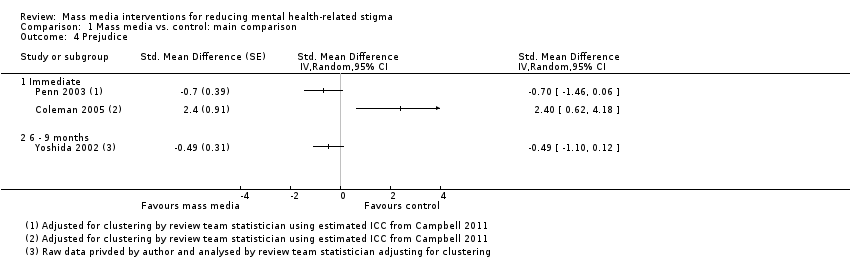
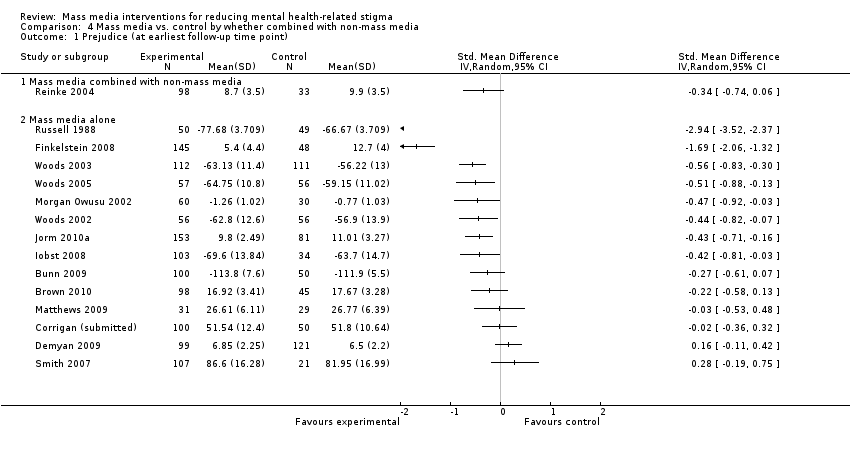
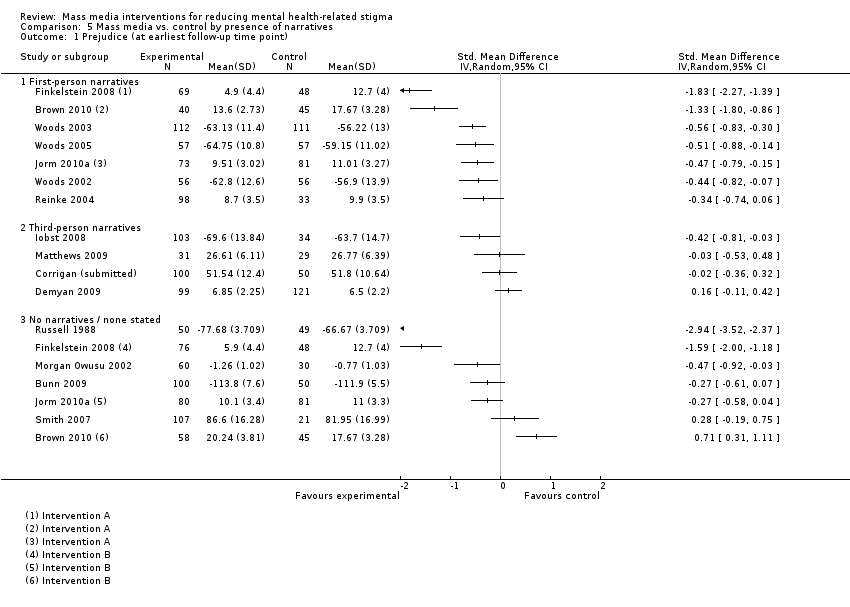
Prejudice

Multiple scales4

Follow‐up

(i) Immediate5

(ii) 1 week to 2 months6

(iii) 6 to 9 months7

Median SMD

(i) ‐0.38

(ii) ‐0.38

(iii) ‐0.49

Range of SMDs

‐2.94 (‐3.52 to ‐2.37) to 2.40 (0.62 to 4.18)

Median SMDs are equivalent to reductions of 0.22, 0.22 and 0.29 points on the 1 to 4 point SDS scale [7], which is equivalent to reducing the level of prejudice from that associated with symptoms of schizophrenia to the level associated with symptoms of major depression8

3176 (19)

⊕⊕⊝⊝
low

Quality of evidence downgraded for study limitations (risk of bias) and indirectness of populations (see Quality of the evidence for full details)

Cost

(i) Audiovisual public service announcement

(ii) a) CD‐ROM b) printed manual

(iii) magazine article

Relative costs

(i) 100 US dollars (equivalent to £64 GBP) vs. nil

(ii) a) 35,000 Australian dollars (£22,404 GBP) for 250 e‐learning CDs @ 140 dollars per CD (ii) b) 7,140 Australian dollars(£4,570 GBP) for 238 manuals @ 30 dollars per manual vs. nil

(iii) 'printing costs' vs 'printing costs'

416 (3)

⊕⊝⊝⊝
very low

Quality of evidence downgraded for inconsistency of results, imprecision, and 'other' (data only being available on request, lack of cost‐effectiveness data) (see Quality of the evidence for full details)

Unforeseen adverse effects

Statements in two studies: (i) ‘Given that this was an educational intervention with a non‐clinical sample, there was no formal enquiry about adverse events. Informally, no adverse events were reported'; (ii) ‘No adverse effects, such as an increase in stigma as a result of the intervention, were identified’

2 (455)

⊕⊕⊝⊝
low

Quality of evidence downgraded for study limitations (risk of bias) and imprecision (see Quality of the evidence for full details)

CI: Confidence interval; OR: Odds ratio; SMD: Standardised mean difference

GRADE Working Group grades of evidence
High quality: Further research is very unlikely to change our confidence in the estimate of effect.
Moderate quality: Further research is likely to have an important impact on our confidence in the estimate of effect and may change the estimate.
Low quality: Further research is very likely to have an important impact on our confidence in the estimate of effect and is likely to change the estimate.
Very low quality: We are very uncertain about the estimate.

[1] Penn 2003

[2] Yoshida 2002

[3] Woods 2002; Woods 2003; Woods 2005

[4] 28 different measures were used (see Characteristics of included studies)

[5] Brown 2010; Bunn 2009; Coleman 2005; Corrigan (submitted); Finkelstein 2008; Iobst 2008; Matthews 2009; Morgan Owusu 2002; Penn 2003; Smith 2007; Woods 2002; Woods 2003; Woods 2005; Yoshida 2002

[6] Russell 1988; Demyan 2009; Brown 2010; Jorm 2010a

[7] Yoshida 2002; Finkelstein 2008; Jorm 2010a [OR:1 indicated decreased stigma, > 1 indicates increased stigma; SMD < 0 indicates decreased stigma, > 0 indicates increased stigma]

[8] Link 1999 This reference for the scale also reports a population standard deviation of 0.59 for social distance in relation to schizophrenia using the SDS from the observational study, General Social Survey 1996, USA.  It gives SDS scores for different mental health conditions which are used for further interpretation.

Figuras y tablas -
Table 1. Narrative synthesis and interpretation: Discrimination

Comparison

No. of comparisons with positive direct of effect1

Median effect size across all comparisons2

Median effect size across all comparisons without unit of analysis errors3

No. of comparisons showing statistically significant effects4

Interpretation of median effect size across all comparisons5

Mass media vs. control

Immediate follow‐up

3/4

SMD = ‐0.25

OR = 1.30

SMD = ‐0.25

1/4 (+)

Small/negligible

6 to 9 months follow‐up

0/1

OR = 1.19

OR = 1.19

0/1

Negligible

Mass media vs. control by if 2+ mass media components

2+ mass media components

0/1

OR = 1.19

OR = 1.19

0/1

Negligible

One mass media component

3/4

SMD = ‐0.25

OR = 1.30

SMD = ‐0.25

1/4 (+)

Small/negligible

Mass media vs. control by presence of narratives

First‐person narratives

3/4

SMD = ‐0.25

OR = 1.30

SMD = ‐0.25

1/4 (+)

Small/negligible

Third‐person narratives

0/1

OR = 1.19

OR = 1.19

0/1

Negligible

Mass media vs. control by type of primary message

Recovery‐oriented

0/1

OR = 1.19

OR = 1.19

0/1

Negligible

Not to blame

3/3

SMD = ‐0.25

SMD = ‐0.25

1/3

Small

Multiple

0/1

OR = 1.30

0/1

Negligible

Mass media vs. control by fictional narratives

Fictional narratives

0/1

OR = 1.19

OR = 1.19

0/1

Negligible

Non‐fictional narratives

3/4

SMD = ‐0.25

OR = 1.30

SMD = ‐0.25

1/4 (+)

Small/negligible

Mass media vs. control by type of media

Audiovisual

3/4

SMD = ‐0.25

OR = 1.30

SMD = ‐0.25

1/4 (+)

Small/negligible

Print

0/1

OR = 1.19

OR = 1.19

0/1

Negligible

[1] Stigma‐reducing

[2] When there was an even number of effect sizes the median reported is the mean of the two middle values.

[3] This excludes cluster trials not adjusted for study design by the authors and without a study‐derived intra‐class correlation co‐efficient (Penn 2003)

[4] (+) means in stigma‐reducing direction, (‐) means in stigma increasing direction

[5] SMDs large ≥ 0.8; medium ≥ 0.5, small ≥ 0.2, negligible < 0.2; and for ORs large ≥ 4.3; medium ≥ 2.5, small ≥ 1.5, negligible < 1.5, based on Cohen’s (Cohen 1988) rule of thumb, and using a pragmatic decision about how to treat intermediate values

Figuras y tablas -
Table 1. Narrative synthesis and interpretation: Discrimination
Table 2. Narrative synthesis and interpretation: Prejudice

Comparison

No. of comparisons with positive direct of effect1

Median effect size across all comparisons2

Median effect size across all comparisons without unit of analysis errors3

No. of comparisons showing statistically significant effects4

Interpretation of median effect size across all comparisons ( Cohen 1988)5

Mass media vs. control

Immediate follow‐up

12/15

‐0.38

‐0.38

6/15 (+), 1/15 (‐)

Small

1 to 8 weeks follow‐up

3/5

‐0.38

‐0.38

2/5 (+)

Small

6 to 9 months follow‐up

3/3

‐0.49

‐0.49

1/3 (+)

Small‐to‐medium

Mass media vs. control by income of country

Upper middle income

1/1

‐1.69

‐1.69

1/1

Large

High income

14/18

‐0.42

‐0.42

7/18 (+) 1/18 (‐)

Small

Mass media vs. control by if 2+ mass media components 

2+ mass media components

4/6

‐0.49

‐0.49

3/6 (+)

Small‐to‐medium

One mass media component

12/13

‐0.34

‐0.34

5/13 (+) 1/13 (‐)

Small

Mass media vs. control by if combined with non‐mass media

With non‐mass media

2/2

‐0.42

‐0.42

0/2

Small

Mass media alone

13/17

‐0.43

‐0.43

8/17 (+) 1/17 (‐)

Small

Mass media vs. control by presence of narratives

First‐person narratives

8/10

‐0.51

‐0.51

6/10 (+) 1/10 (‐)

Medium

Third‐person narratives

4/5

‐0.03

‐0.03

2/5 (+)

Negligible

No narratives

5/7

‐0.27

‐0.27

3/7 (+) 1/7 (‐)

Small

Mass media vs. control by celebrity narratives

Celebrity narratives

1/1

‐0.23

‐0.23

0/1

Small

Non‐celebrity narratives

11/15

‐0.48

‐0.44

7/15 (+) 1/15 (‐)

Small

Mass media vs. control by fictional narratives

Fictional narratives

2/3

‐0.42

‐0.42

1/3 (+)

Small

Non‐fictional narratives

10/12

‐0.47

‐0.47

6/12 (+) 1/12 (‐)

Small

Mass media vs. control by type of message 

Biomedical

1/2

0.99

‐0.42

1/2 (+) 1/2 (‐)

Large

Social inclusion/human rights

1/1

‐2.94

‐2.94

1/1 (+)

Large

Recovery‐oriented

5/5

‐0.30

‐0.30

1/5 (+)

Small

Negative impact of mental illness

1/2

‐0.13

‐0.13

0/2

Negligible

Seek professional care

2/3

‐0.43

‐0.43

2/3 (+)

Small

Not to blame

3/3

‐0.51

‐0.51

3/3 (+)

Medium

Hallucinatory experience

1/2

0.22

0.22

1/2 (‐)

Small

Multiple messages

3/4

‐0.70

‐0.71

1/4 (+)

Medium

Mass media vs. control by type of media 

Internet

3/4

‐0.30

‐0.30

2/4 (+)

Small

Audiovisual

7/10

‐0.47

‐0.47

5/10 (+) 1/10 (‐)

Small

Audio

1/2

0.22

0.22

1/2 (‐)

Small

Print

6/6

‐0.46

‐0.46

4/5 (+)

Small

[1] Stigma‐reducing

[2] Excluding study with median and IQR data only (Kerby 2008). When there was an even number of effect sizes the median reported is the mean of the two middle values.

[3] This excludes cluster trials not adjusted for study design by the authors and without a study‐derived intra‐class correlation co‐efficient (Penn 2003; Coleman 2005)

[4] (+) means in stigma‐reducing direction, (‐) means in stigma increasing direction. Excluding study with median and IQR data only (Kerby 2008)

[5] SMDs large ≥ 0.8; medium ≥ 0.5, small ≥ 0.2, negligible < 0.2, based on Cohen’s (Cohen 1988) rule of thumb, and using a pragmatic decision about how to treat intermediate values

Figuras y tablas -
Table 2. Narrative synthesis and interpretation: Prejudice
Table 3. Mass media vs. control: Knowledge

Study ID


Measure

Intervention arm

Intervention group summary statistic

N(I)

Control group summary statistic

N(C)

Effect estimate/test statistic and P value/95% CI

Finkelstein 20081 


Psychiatric Knowledge Survey  

A (Internet education)

Immediate follow‐up: 90.5% items correct

Six‐months follow‐up: 65.6% items correct

69

43.9% items correct

48  

Pre‐post Χ2 P value < 0.0001

B (Printed documents)

Immediate follow‐up: 56.3% items correct

Six‐months follow‐up: 49.6% items correct

76

43.9% items correct

48

Pre‐post Χ2 P value < 0.0001

Jorm 2010a2

Four knowledge items, beliefs about depression treatments selected

A (CD‐ROM)

65.8%

73

52.4%


82

OR for pre‐post intervention interactions = 2.11
(95% CI 0.61 to 7.3)

B (manual)

67.9%

83

52.4%

82

OR for pre‐post intervention interactions = 3.64
(95% CI 1.01 to 13.09)

Morgan Owusu 20023

Seven knowledge items, item 1 (what is mental illness) selected

A (standard video)

96.6% (29/30)

30

76.7% (23/30)

30

OR = 8.83 (95% CI 1.01 to 76.96)

B (culturally specific video)

96.6% (29/30)

30

76.7% (23/30)

30

OR  = 8.83 (95% CI 1.01 to 76.96)

Yoshida 20024

Knowledge of Mental Illness scale

Booklet

3.22 (1.48)

301

3.03 (1.41)

391

Adjusted mean difference = 0.20, 95% CI ‐0.06 to 0.46, P = 0.133)

[1] Outcome measure used in two previous studies (Jorm 1997; Griffiths 2004); control group same for both intervention arms; statistic from paper, OR or SMD not calculable.

[2] Four items, if recognised depression/schizophrenia from vignettes of person portrayed as meeting DSM‐IV‐TR criteria for the conditions DSM (Jorm 1997); two items developed for study: beliefs about treatments for schizophrenia/depression (% of all type treatments deemed by authors to be helpful endorsed by respondent; outcome for review as specified per protocol (Brennan 2009); data from earliest follow‐up time point (1 month). N assumed from consort diagram as not stated.

[3] Items developed for study, dichotomous (correct or not); item 1 selected as knowledge outcome for review as specified per protocol [Grimshaw 2003]

[4] Six‐item scale developed for study; continuous scale; linear regression model fitted including a random effect for clustering by sampling design (19 areas, average observations per cluster 36); from authors dataset; results presented are unadjusted means (SD) by arm along with the adjusted mean difference between arms, corresponding 95% confidence interval and P value.

Figuras y tablas -
Table 3. Mass media vs. control: Knowledge
Table 4. Audience reactions to interventions

Finkelstein 2008

Intervention A (Internet education)

%, n = 69

Intervention B (printed articles)

%, n = 76

Liked educational experience in general (yes/probably yes)

97.1

89.3

Topic is important (yes/probably yes)

100

97.4

Content is useful (y) (yes/probably yes)

98.6

90.7

Content is interesting (y) (yes/probably yes)

100

86.8

Content is unpleasant (no/probably no)

81.2

73.3

Content is difficult to understand (no/probably no)

89.9

61.8

Liked way information is presented (y) (yes/probably yes)

87.0

60.5

Jorm 2010a

Intervention A (CD‐ROM)

%, n = 63 to 64

Intervention B (manual)

%, n = 62 to 66

Read most/all of material

95.3

100.0

Material was easy/very easy to understand

96.9

97.0

Learnt a great deal/a fair bit from material

90.6

90.1

Material was useful/very useful

93.8

98.4

Will use intervention in future

73.0

90.3

Would probably/definitely recommend intervention to others

96.9

98.4

Yoshida 2002 (N = 106)1,2

Mean (SD)


Favourability rating (1 to 5)

3.67 (0.85)

Looking forward to next issue of booklet rating (1 to 5)

3.67 (1.04)

Recommendation to others rating (1 to 5)

3.29 (0.78)

[1] Among participants who were aware of the intervention

[2] High rating indicates a positive audience reaction

Figuras y tablas -
Table 4. Audience reactions to interventions
Comparison 1. Mass media vs. control: main comparison

Outcome or subgroup title

No. of studies

No. of participants

Statistical method

Effect size

1 Discrimination (Immediate) Show forest plot

3

Std. Mean Difference (IV, Random, 95% CI)

Totals not selected

2 Discrimination Show forest plot

2

Odds Ratio (Random, 95% CI)

Totals not selected

2.1 Immediate

1

Odds Ratio (Random, 95% CI)

0.0 [0.0, 0.0]

2.2 6 ‐ 9 months

1

Odds Ratio (Random, 95% CI)

0.0 [0.0, 0.0]

3 Prejudice Show forest plot

15

Std. Mean Difference (IV, Random, 95% CI)

Totals not selected

3.1 Immediate

12

Std. Mean Difference (IV, Random, 95% CI)

0.0 [0.0, 0.0]

3.2 1 week ‐ 2 months

4

Std. Mean Difference (IV, Random, 95% CI)

0.0 [0.0, 0.0]

3.3 6 ‐ 9 months

2

Std. Mean Difference (IV, Random, 95% CI)

0.0 [0.0, 0.0]

4 Prejudice Show forest plot

3

Std. Mean Difference (Random, 95% CI)

Totals not selected

4.1 Immediate

2

Std. Mean Difference (Random, 95% CI)

0.0 [0.0, 0.0]

4.2 6 ‐ 9 months

1

Std. Mean Difference (Random, 95% CI)

0.0 [0.0, 0.0]

Figuras y tablas -
Comparison 1. Mass media vs. control: main comparison
Comparison 2. Mass media vs. control by income of country

Outcome or subgroup title

No. of studies

No. of participants

Statistical method

Effect size

1 Prejudice (at earliest follow‐up time point) Show forest plot

15

Std. Mean Difference (IV, Random, 95% CI)

Totals not selected

1.1 Upper‐middle income

1

Std. Mean Difference (IV, Random, 95% CI)

0.0 [0.0, 0.0]

1.2 High income

14

Std. Mean Difference (IV, Random, 95% CI)

0.0 [0.0, 0.0]

Figuras y tablas -
Comparison 2. Mass media vs. control by income of country
Comparison 3. Mass media vs. control by number of mass media components

Outcome or subgroup title

No. of studies

No. of participants

Statistical method

Effect size

1 Prejudice (at earliest follow‐up time point) Show forest plot

15

Std. Mean Difference (IV, Random, 95% CI)

Totals not selected

1.1 Multiple mass media components

4

Std. Mean Difference (IV, Random, 95% CI)

0.0 [0.0, 0.0]

1.2 One mass media component

11

Std. Mean Difference (IV, Random, 95% CI)

0.0 [0.0, 0.0]

Figuras y tablas -
Comparison 3. Mass media vs. control by number of mass media components
Comparison 4. Mass media vs. control by whether combined with non‐mass media

Outcome or subgroup title

No. of studies

No. of participants

Statistical method

Effect size

1 Prejudice (at earliest follow‐up time point) Show forest plot

15

Std. Mean Difference (IV, Random, 95% CI)

Totals not selected

1.1 Mass media combined with non‐mass media

1

Std. Mean Difference (IV, Random, 95% CI)

0.0 [0.0, 0.0]

1.2 Mass media alone

14

Std. Mean Difference (IV, Random, 95% CI)

0.0 [0.0, 0.0]

Figuras y tablas -
Comparison 4. Mass media vs. control by whether combined with non‐mass media
Comparison 5. Mass media vs. control by presence of narratives

Outcome or subgroup title

No. of studies

No. of participants

Statistical method

Effect size

1 Prejudice (at earliest follow‐up time point) Show forest plot

15

Std. Mean Difference (IV, Random, 95% CI)

Totals not selected

1.1 First‐person narratives

7

Std. Mean Difference (IV, Random, 95% CI)

0.0 [0.0, 0.0]

1.2 Third‐person narratives

4

Std. Mean Difference (IV, Random, 95% CI)

0.0 [0.0, 0.0]

1.3 No narratives / none stated

7

Std. Mean Difference (IV, Random, 95% CI)

0.0 [0.0, 0.0]

Figuras y tablas -
Comparison 5. Mass media vs. control by presence of narratives
Comparison 6. Mass media vs. control by celebrity narratives

Outcome or subgroup title

No. of studies

No. of participants

Statistical method

Effect size

1 Prejudice (at earliest follow‐up time point) Show forest plot

11

Std. Mean Difference (IV, Random, 95% CI)

Totals not selected

1.1 Celebrity

1

Std. Mean Difference (IV, Random, 95% CI)

0.0 [0.0, 0.0]

1.2 Non‐celebrity

11

Std. Mean Difference (IV, Random, 95% CI)

0.0 [0.0, 0.0]

Figuras y tablas -
Comparison 6. Mass media vs. control by celebrity narratives
Comparison 7. Mass media vs. control by fictional narratives

Outcome or subgroup title

No. of studies

No. of participants

Statistical method

Effect size

1 Prejudice Show forest plot

11

Std. Mean Difference (IV, Random, 95% CI)

Totals not selected

1.1 Fictional narrative

2

Std. Mean Difference (IV, Random, 95% CI)

0.0 [0.0, 0.0]

1.2 Non‐fictional narrative

9

Std. Mean Difference (IV, Random, 95% CI)

0.0 [0.0, 0.0]

Figuras y tablas -
Comparison 7. Mass media vs. control by fictional narratives
Comparison 8. Mass media vs. control by type of message

Outcome or subgroup title

No. of studies

No. of participants

Statistical method

Effect size

1 Prejudice (at earliest follow‐up time point) Show forest plot

15

Std. Mean Difference (IV, Fixed, 95% CI)

Totals not selected

1.1 Biomedical

1

Std. Mean Difference (IV, Fixed, 95% CI)

0.0 [0.0, 0.0]

1.2 Social inclusion / human rights

1

Std. Mean Difference (IV, Fixed, 95% CI)

0.0 [0.0, 0.0]

1.3 Recovery‐oriented

4

Std. Mean Difference (IV, Fixed, 95% CI)

0.0 [0.0, 0.0]

1.4 Negative impact of mental illness

2

Std. Mean Difference (IV, Fixed, 95% CI)

0.0 [0.0, 0.0]

1.5 Seek professional care

3

Std. Mean Difference (IV, Fixed, 95% CI)

0.0 [0.0, 0.0]

1.6 Not to blame

3

Std. Mean Difference (IV, Fixed, 95% CI)

0.0 [0.0, 0.0]

1.7 This is hallucinatory experience

2

Std. Mean Difference (IV, Fixed, 95% CI)

0.0 [0.0, 0.0]

1.8 Multiple primary messages

2

Std. Mean Difference (IV, Fixed, 95% CI)

0.0 [0.0, 0.0]

Figuras y tablas -
Comparison 8. Mass media vs. control by type of message
Comparison 9. Mass media vs. control by type of media

Outcome or subgroup title

No. of studies

No. of participants

Statistical method

Effect size

1 Prejudice (at earliest follow‐up time point)) Show forest plot

15

Std. Mean Difference (IV, Random, 95% CI)

Totals not selected

1.1 Internet (also includes CD‐ROM)

4

Std. Mean Difference (IV, Random, 95% CI)

0.0 [0.0, 0.0]

1.2 Recorded ‐ audiovisual

7

Std. Mean Difference (IV, Random, 95% CI)

0.0 [0.0, 0.0]

1.3 Recorded ‐ audio

2

Std. Mean Difference (IV, Random, 95% CI)

0.0 [0.0, 0.0]

1.4 Print

5

Std. Mean Difference (IV, Random, 95% CI)

0.0 [0.0, 0.0]

Figuras y tablas -
Comparison 9. Mass media vs. control by type of media