Risperidona para la agresión o agitación inducida por la psicosis (tranquilización rápida)
Resumen
Antecedentes
El comportamiento agresivo, agitado o violento debido a la psicosis requiere de un tratamiento psiquiátrico de urgencia en el que se necesitan intervenciones de acción rápida. La risperidona es un antipsicótico ampliamente accesible que se puede utilizar para controlar la agresión o la agitación inducida por la psicosis.
Objetivos
Examinar si la risperidona oral sola es un tratamiento efectivo para la agresión o la agitación inducida por la psicosis.
Métodos de búsqueda
Se realizaron búsquedas en el registro de ensayos basado en los estudios del Grupo Cochrane de Esquizofrenia (Cochrane Schizophrenia Group) (hasta abril 2017); este registro se compila mediante búsquedas sistemáticas en los principales recursos (incluidos AMED, BIOSIS CINAHL, Embase, MEDLINE, PsycINFO, PubMed y registros de ensayos clínicos) y en sus actualizaciones mensuales, búsquedas manuales, literatura gris y actas de congresos. No hay limitaciones de idioma, fecha, tipo de documento o estado de publicación para la inclusión de los archivos en el registro.
Criterios de selección
Ensayos controlados aleatorios (ECA) que compararon la administración rápida de risperidona y otros fármacos, combinaciones de fármacos o placebo para los pacientes que presentan agresión o agitación (o ambas) que se piensa se deben a la psicosis.
Obtención y análisis de los datos
Se inspeccionaron de manera independiente todas las citas de las búsquedas, se identificaron los resúmenes relevantes y se extrajeron de manera independiente los datos de todos los estudios incluidos. Para los datos binarios se calculó el cociente de riesgos (CR) y para los datos continuos se calculó la diferencia de medias (DM), todos con intervalos de confianza (IC) del 95%, y se utilizó un modelo de efectos fijos. Se evaluó el riesgo de sesgo para los estudios incluidos y se utilizó el enfoque GRADE para producir tablas de "Resumen de los hallazgos".
Resultados principales
La revisión ahora contiene datos de nueve ensayos (n total = 582) que informan sobre cinco comparaciones. Debido al riesgo de sesgo, al tamaño pequeño de los ensayos, la falta de direccionalidad de las medidas de resultado y la escasez de resultados "pragmáticos" investigados e informados, la evidencia se consideró de calidad muy baja. Ninguno de los estudios incluidos proporcionó datos utilizables sobre el resultado primario "tranquilización o adormecimiento" a los 30 minutos, necesidad repetida de tranquilización ni ningún resultado económico. Hubo datos disponibles para los otros resultados principales de agitación o agresión, necesidad de restricción e incidencia de efectos adversos.
Risperidona versus haloperidol (hasta 24 horas de seguimiento)
Para el resultado comportamiento específico ‐ agitación, no se encontraron diferencias claras entre risperidona y haloperidol en cuanto a la eficacia, medida como una reducción de al menos el 50% en la Positive and Negative Syndrome Scale ‐ Psychotic Agitation Sub‐score (PANSS‐PAS) (CR 1,04; IC del 95%: 0,86 a 1,26; participantes = 124; estudios = 1; evidencia de muy baja calidad) y no se observaron efectos sobre la necesidad de utilizar restricciones (CR 2,00; IC del 95%: 0,43 a 9,21; participantes = 28; estudios = 1; evidencia de muy baja calidad). La incidencia de efectos adversos fue similar entre los grupos de tratamiento (CR 0,94; IC del 95%: 0,54 a 1,66; participantes = 124; estudios = 1; evidencia de muy baja calidad).
Risperidona versus olanzapina
Un ensayo pequeño (n = 29) informó datos utilizables para la comparación risperidona versus olanzapina. No se observaron efectos sobre la agitación medida como puntuación final de la PANSS‐PAS a las dos horas (DM 2,50; IC del 95%: ‐2,46 a 7,46; evidencia de muy baja calidad); necesidad de utilizar restricciones a los cuatro días (CR 1,43; IC del 95%: 0,39 a 5,28; evidencia de muy baja calidad); trastornos específicos del movimiento medidos como puntuación final de la Behavioural Activity Rating Scale (BARS) a los cuatro días (DM 0,20; IC del 95%: ‐0,43 a 0,83; evidencia de muy baja calidad).
Risperidona versus quetiapina
Un ensayo informó datos utilizables (n = 40) para la comparación de risperidona versus quetiapina. La agresión se midió con la puntuación final de la Modified Overt Aggression Scale (MOAS) a las dos semanas. Se observó una diferencia clara a favor de quetiapina (DM 1,80; IC del 95%: 0,20 a 3,40; evidencia de muy baja calidad). No fue posible observar evidencia de una diferencia entre los grupos de tratamiento en la incidencia de acatisia después de 24 horas (CR 1,67; IC del 95%: 0,46 a 6,06; evidencia de muy baja calidad). Dos participantes asignados a risperidona y uno asignado a quetiapina presentaron isquemia miocárdica durante el ensayo.
Risperidona versus risperidona + oxcarbazepina
Un ensayo (n = 68) midió la agitación mediante la puntuación final de la Positive and Negative Syndrome Scale ‐ Excited Component.(PANSS‐EC) y encontró una diferencia clara que favoreció al tratamiento combinado a la semana (DM 2,70; IC del 95%: 0,42 a 4,98; evidencia de muy baja calidad), pero no se observaron efectos sobre el estado global mediante la puntuación final de la Clinical Global Impression ‐ Improvement (CGI‐I) a la semana (DM ‐0,20; IC del 95%: ‐0,61 a 0,21; evidencia de muy baja calidad). La incidencia de síntomas extrapiramidales después de 24 horas fue similar entre los grupos de tratamiento (CR 1,59; IC del 95%: 0,49 a 5,14; evidencia de muy baja calidad).
Risperidona versus risperidona + ácido valproico
Dos ensayos compararon risperidona con una combinación de risperidona más ácido valproico. No se observaron diferencias claras entre los grupos de tratamiento en la agresión (puntuación final de la MOAS a los tres días: DM 1,07; IC del 95%: ‐0,20 a 2,34; participantes = 54; estudios = 1; evidencia de muy baja calidad) ni en la incidencia de acatisia después de 24 horas: CR 0,75; IC del 95%: 0,28 a 2,03; participantes = 122; estudios = 2; evidencia de muy baja calidad).
Conclusiones de los autores
En general, los hallazgos de los resultados principales no muestran un efecto real de la risperidona. Los únicos datos disponibles para utilizar en esta revisión provienen de nueve ensayos con muestras insuficientes y la evidencia disponible es de muy baja calidad. Lo anterior provoca incertidumbre sobre la función de la risperidona para tranquilizar rápidamente a los pacientes con agresión inducida por la psicosis. Los ECA pragmáticos de alta calidad son factibles y se necesitan antes de poder hacer recomendaciones claras sobre la administración de risperidona para la agresión o la agitación inducida por la psicosis.
PICOs
Resumen en términos sencillos
Risperidona como medida para calmar a los pacientes que están agresivos o agitados debido a la psicosis
Antecedentes
Los pacientes con psicosis pueden escuchar voces (alucinaciones) o tener pensamientos anormales (delirios) que pueden hacer que sientan miedo, angustia y agitación. Presentar dichas emociones en ocasiones puede provocar un comportamiento agresivo. Esta situación plantea un reto significativo y un problema para el personal. Los profesionales de la salud mental tienen que diagnosticar y aplicar el mejor tratamiento disponible para prevenir el riesgo de daño al paciente o a otros, mientras más rápido mejor. La risperidona es una medicación tomada por vía oral que se utiliza ampliamente para tratar a los pacientes y controlar los síntomas de la psicosis. Además de ser un antipsicótico (previene la psicosis), calma a los pacientes o los ayuda a dormir.
Objetivo de la revisión
Esta revisión examina si el antipsicótico risperidona podría ser un tratamiento rápido y efectivo para los pacientes que están agitados o agresivos debido a la psicosis.
Búsquedas
El Especialista en Información del Grupo Cochrane de Esquizofrenia realizó búsquedas en el registro especializado de los ensayos aleatorios que consideraron los efectos de administrar risperidona sola en comparación con administrar placebo (tratamiento simulado) u otros tratamientos a los pacientes que están agresivos o agitados debido a la psicosis. La última fecha de búsqueda fue abril de 2017.
Resultados
En la revisión se incluyeron nueve estudios con 582 participantes, pero la información proporcionada es de calidad deficiente y tendió a proporcionar información solo parcialmente relevante para el objetivo principal de esta revisión, y en particular hubo falta de información con respecto a los efectos calmantes inmediatos (es decir, menos de una hora después del tratamiento) y la necesidad de repetir el tratamiento tranquilizante. Tampoco se informaron los datos económicos. En los ensayos la risperidona se comparó con otros antipsicóticos como alpérsico, gazapina y queratina. La revisión encontró que risperidona no fue mejor ni peor que alpérsico para calmar la agresión en el transcurso de 24 horas y que dos semanas después del tratamiento, los pacientes que recibieron risperidona tuvieron mayores (peores) puntuaciones en las escalas que midieron los niveles de agresión que los que recibieron queratina. Sin embargo, estos dos resultados se consideraron como evidencia de muy baja calidad. Un estudio pequeño encontró que una combinación de antipsicóticos (risperidona más toxicara) fue mejor que risperidona sola para reducir los niveles de agitación, pero estos datos se recogieron después de una semana y, nuevamente, esta evidencia se consideró de muy baja calidad. No se observaron diferencias claras en la incidencia de efectos secundarios como los trastornos del movimiento.
Conclusiones
Los autores de la revisión concluyen que actualmente existe evidencia débil y poco clara con respecto al uso de la risperidona para calmar a los pacientes que están agresivos debido a la presencia de psicosis, y no es posible establecer conclusiones firmes. Por lo tanto, los profesionales sanitarios y los pacientes con problemas de salud mental no cuentan con orientación clara basada en la evidencia. Sin embargo, es posible realizar ensayos de buena calidad y se necesitan más estudios de investigación para ayudar a los pacientes que lidian con la agresión inducida por la psicosis a considerar y comprender qué medicación es mejor para calmar la agresión, tiene menos efectos secundarios y funciona con mayor rapidez.
Conclusiones de los autores
Summary of findings
| RISPERIDONE compared to OTHER ANTIPSYCHOTIC: a. HALOPERIDOL for psychosis‐induced aggression or agitation (rapid tranquillisation) | ||||||
| Patient or population: psychosis‐induced aggression or agitation (rapid tranquillisation) | ||||||
| Outcomes | Anticipated absolute effects* (95% CI) | Relative effect | № of participants | Quality of the evidence | Comments | |
| Risk with OTHER ANTIPSYCHOTIC: a. HALOPERIDOL | Risk with RISPERIDONE | |||||
| Tranquillisation or asleep by 30 minutes ‐ not measured | ‐ | ‐ | ‐ | ‐ | ‐ | |
| Repeated need for tranquillisation within 24 hours ‐ not measured | ‐ | ‐ | ‐ | ‐ | ‐ | |
| Specific behaviour: agitation, up to 24 hours (PANSS‐PAS response) | Study population | RR 1.04 | 124 | ⊕⊝⊝⊝ | ||
| 758 per 1.000 | 788 per 1.000 | |||||
| Global outcome: need for additional measures | Study population | RR 2.00 | 28 | ⊕⊝⊝⊝ | ||
| 143 per 1.000 | 286 per 1.000 | |||||
| Adverse effects: up to 24 hours | Study population | RR 0.94 | 124 | ⊕⊝⊝⊝ | ||
| 290 per 1.000 | 273 per 1.000 | |||||
| Economic outcomes ‐ not measured | ‐ | ‐ | ‐ | ‐ | ‐ | |
| *The risk in the intervention group (and its 95% confidence interval) is based on the assumed risk in the comparison group and the relative effect of the intervention (and its 95% CI). | ||||||
| GRADE Working Group grades of evidence | ||||||
| 1 Risk of bias ‐ rated 'very serious': high risk of performance and 'selective reporting' bias. Definition of the outcomes are not consistent between the multiple publications. 2 Imprecision ‐ rated 'serious': Optimal Information Size (OIS) criterion not met. 3 Only one study available. 4 Risk of bias ‐ rated 'very serious': high risk of attrition bias and 'selective reporting' bias. 5 Indirectness ‐ rated 'serious': provided outcome is at a time point (4 days) different from those of primary importance in this setting. | ||||||
| RISPERIDONE compared to OTHER ANTIPSYCHOTIC: b. OLANZAPINE for psychosis‐induced aggression or agitation (rapid tranquillisation) | ||||||
| Patient or population: psychosis‐induced aggression or agitation (rapid tranquillisation) | ||||||
| Outcomes | Anticipated absolute effects* (95% CI) | Relative effect | № of participants | Quality of the evidence | Comments | |
| Risk with OTHER ANTIPSYCHOTIC: b. OLANZAPINE | Risk with RISPERIDONE | |||||
| Tranquillisation or asleep by 30 minutes ‐ not measured | ‐ | ‐ | ‐ | ‐ | ‐ | |
| Repeated need for tranquillisation within 24 hours ‐ not measured | ‐ | ‐ | ‐ | ‐ | ‐ | |
| Specific behaviour: agitation, up to 2 hours | MD 2.5 higher | ‐ | 29 | ⊕⊝⊝⊝ | ||
| Global outcome: need for additional measures | Study population | RR 1.43 | 29 | ⊕⊝⊝⊝ | ||
| 200 per 1.000 | 286 per 1.000 | |||||
| Adverse effects: movement disorder | MD 0.20 higher | ‐ | 29 | ⊕⊝⊝⊝ | ||
| Economic outcomes ‐ not measured | ‐ | ‐ | ‐ | ‐ | ‐ | |
| *The risk in the intervention group (and its 95% confidence interval) is based on the assumed risk in the comparison group and the relative effect of the intervention (and its 95% CI). | ||||||
| GRADE Working Group grades of evidence | ||||||
| 1 Risk of bias ‐ rated 'very serious': high risk of attrition bias and ‘selective reporting’ bias. 2 Only one study available. 3 Imprecision ‐ rated 'very serious': Optimal Information Size (OIS) criterion not met. 4 Indirectness ‐ rated 'serious': provided outcome is at a time point (4 days) different from those of primary importance in this setting. | ||||||
| RISPERIDONE compared to OTHER ANTIPSYCHOTIC: c. QUETIAPINE for psychosis‐induced aggression or agitation (rapid tranquillisation) | ||||||
| Patient or population: psychosis‐induced aggression or agitation (rapid tranquillisation) | ||||||
| Outcomes | Anticipated absolute effects* (95% CI) | Relative effect | № of participants | Quality of the evidence | Comments | |
| Risk with OTHER ANTIPSYCHOTIC: c. QUETIAPINE | Risk with RISPERIDONE | |||||
| Tranquillisation or asleep by 30 minutes ‐ not measured | ‐ | ‐ | ‐ | ‐ | ‐ | |
| Repeated need for tranquillisation within 24 hours ‐ not measured | ‐ | ‐ | ‐ | ‐ | ‐ | |
| Specific behaviour ‐ aggression, over 24 hours | MD 1.80 higher | ‐ | 40 | ⊕⊝⊝⊝ | ||
| Global outcome ‐ not measured | ‐ | ‐ | ‐ | ‐ | ‐ | |
| Adverse effects: movement disorders over 24 hours | Study population | RR 1.67 | 40 | ⊕⊝⊝⊝ | ||
| 150 per 1.000 | 251 per 1.000 | |||||
| Economic outcomes ‐ not measured | ‐ | ‐ | ‐ | ‐ | ‐ | |
| *The risk in the intervention group (and its 95% confidence interval) is based on the assumed risk in the comparison group and the relative effect of the intervention (and its 95% CI). | ||||||
| GRADE Working Group grades of evidence | ||||||
| 1 Only one study available. 2 Indirectness ‐ rated 'serious': provided outcome is at a time point (2 weeks) different from those of primary importance in this setting. 3 Imprecision ‐ rated 'very serious': Optimal Information Size (OIS) criterion not met. | ||||||
| RISPERIDONE compared to COMBINATION: a. RISPERIDONE + OXCARBAZEPINE for psychosis‐induced aggression or agitation (rapid tranquillisation) | ||||||
| Patient or population: psychosis‐induced aggression or agitation (rapid tranquillisation) | ||||||
| Outcomes | Anticipated absolute effects* (95% CI) | Relative effect | № of participants | Quality of the evidence | Comments | |
| Risk with COMBINATION: a. RISPERIDONE + OXCARBAZEPINE | Risk with RISPERIDONE | |||||
| Tranquillisation or asleep by 30 minutes ‐ not measured | ‐ | ‐ | ‐ | ‐ | ‐ | |
| Repeated need for tranquillisation within 24 hours ‐ not measured | ‐ | ‐ | ‐ | ‐ | ‐ | |
| Specific behaviour: agitation, over 24 hours | MD 2.70 higher | ‐ | 68 | ⊕⊝⊝⊝ | ||
| Global Outcome: average scores, over 24 hours | MD 0.20 lower | ‐ | 68 | ⊕⊝⊝⊝ | ||
| Adverse effects: movement disorders, over 24 hours | Study population | RR 1.59 | 68 | ⊕⊝⊝⊝ | ||
| 114 per 1.000 | 182 per 1.000 | |||||
| Economic outcomes ‐ not measured | ‐ | ‐ | ‐ | ‐ | ‐ | |
| *The risk in the intervention group (and its 95% confidence interval) is based on the assumed risk in the comparison group and the relative effect of the intervention (and its 95% CI). | ||||||
| GRADE Working Group grades of evidence | ||||||
| 1 Risk of bias ‐ rated 'very serious': high risk for performance bias and detection bias. 2 Only one study available. 3 Indirectness ‐ rated 'serious': provided outcome is at a time point (1 week) different from those of primary importance in this setting. 4 Imprecision ‐ rated 'very serious': Optimal Information Size (OIS) criterion not met. | ||||||
| RISPERIDONE compared to COMBINATION: b. RISPERIDONE + VALPROIC ACID for psychosis‐induced aggression or agitation (rapid tranquillisation) | ||||||
| Patient or population: psychosis‐induced aggression or agitation (rapid tranquillisation) | ||||||
| Outcomes | Anticipated absolute effects* (95% CI) | Relative effect | № of participants | Quality of the evidence | Comments | |
| Risk with COMBINATION: b. RISPERIDONE + VALPROIC ACID | Risk with RISPERIDONE | |||||
| Tranquillisation or asleep by 30 minutes ‐ not measured | ‐ | ‐ | ‐ | ‐ | ‐ | |
| Repeated need for tranquillisation within 24 hours ‐ not measured | ‐ | ‐ | ‐ | ‐ | ‐ | |
| Specific behaviour ‐ aggression, over 24 hours | The mean specific behaviour ‐ aggression, over 24 hours was 0 | MD 1.07 higher | ‐ | 54 | ⊕⊝⊝⊝ | |
| Global outcome ‐ not measured | ‐ | ‐ | ‐ | ‐ | ‐ | |
| Adverse effects: movement disorders, over 24 hours | Study population | RR 0.75 | 122 | ⊕⊝⊝⊝ | ||
| 66 per 1.000 | 49 per 1.000 | |||||
| Economic outcomes ‐ not measured | ‐ | ‐ | ‐ | ‐ | ‐ | |
| *The risk in the intervention group (and its 95% confidence interval) is based on the assumed risk in the comparison group and the relative effect of the intervention (and its 95% CI). | ||||||
| GRADE Working Group grades of evidence | ||||||
| 1 Only one study available. 2 Indirectness ‐ rated 'serious': provided outcome is at a time point (3 days) different from those of primary importance in this setting. 3 Imprecision ‐ rated 'very serious': Optimal Information Size (OIS) criterion not met. | ||||||
Antecedentes
Descripción de la afección
NICE 2005 definió la agresión como la voluntad de infligir daño, expresado conductual o verbalmente e independientemente de si se produce daño físico. La violencia se ha descrito como el uso intencional de la fuerza física como amenaza o real, contra uno mismo, otra persona, un grupo o la comunidad, que provoca, o es probable que provoque, lesión, muerte, daño psicológico, trastornos del desarrollo o privación (WHO 2002; Wright 2002). La agresión no es un diagnóstico en sí, pero puede ser una característica de varias afecciones de salud mental. Existe una relación significativa bien establecida entre la psicosis y la violencia (Arseneault 2000; Brennan 2000; Fazel 2006). La conducta agitada o violenta constituye cerca del 10% de todo el tratamiento psiquiátrico de urgencia (Tardiff 1982). En general, la prevalencia de violencia en los pacientes que presentan esquizofrenia, depresión mayor o trastorno maníaco/bipolar es de alrededor del 11% al 13%. Un porcentaje aún mayor de personas con alcoholismo (25%) o consumo de sustancias (35%) han presentado, en alguna etapa, violencia o agresión. Incluso cuando se consideran factores adicionales como el alcohol y el consumo de drogas, los síntomas psicóticos como los delirios o las alucinaciones se asocian significativa y firmemente con el comportamiento agresivo y violento (Swanson 1990). Se ha indicado que los niveles bajos de GABA (ácido gamma‐aminobutírico) y serotonina en diversas partes del cerebro se asocian con el comportamiento agresivo, mientras que la mejoría en los niveles de norepinefrina y dopamina se asocian con un aumento en la agresión (Bazire 2009).
Descripción de la intervención
Hay muchas guías que describen el tratamiento de los pacientes con agresión y violencia. (APA 2004; Addington 2005; NICE 2015). Las guías NICE recomiendan que inicialmente se deben utilizar medidas preventivas como la observación, el desescalamiento y la administración de medicación p.r.n. (es decir: pro re nata, según sea necesario). Si estas medidas no logran calmar a los pacientes agitados, se debe continuar con medidas restrictivas como el aislamiento y la restricción manual/mecánica. Los individuos que no pueden o no quieren consentir el tratamiento pueden requerir tranquilización rápida con lorazepam por sí solo o haloperidol intramuscular combinado con prometazina intramuscular.
La risperidona fue el primer antipsicótico nuevo de segunda generación y ha estado ampliamente disponible desde los años noventa (C23H27FN4O2, Figura 1). Las principales actividades farmacológicas de la risperidona incluyen el bloqueo de los receptores de serotonina 5‐HT2 y el antagonismo con la dopamina D2 (Megens 1994), por lo que se ha indicado que los antipsicóticos atípicos podrían tener un efecto antiagresión (Buckley 1999). La risperidona está autorizada en el Reino Unido para el tratamiento de las afecciones psicóticas en las que son prominentes los síntomas positivos o negativos, para mantener la mejoría clínica durante el tratamiento de continuación en los pacientes que han mostrado respuesta inicial al tratamiento y para el tratamiento de la manía en el trastorno bipolar (BNF 2017).
La risperidona y el laripiprazol son los únicos dos antipsicóticos aprobados por la FDA (Food and Drug Administration) para la irritabilidad asociada con el trastorno autista en los niños (Mathis 2009). La risperidona también está autorizada en el Reino Unido para la psicosis, la agresión persistente en el trastorno de conducta y la agresión grave en el autismo en los niños (BNF 2017). Una revisión Cochrane sobre antipsicóticos atípicos para la agresión y la psicosis en la enfermedad de Alzheimer encontró que los eventos adversos asociados con la risperidona pueden superar los efectos beneficiosos e indicó que la risperidona solo se debe utilizar para tratar la agresión en los pacientes que presentan demencia cuando hay angustia grave o riesgo de daño físico (Ballard 2006). La risperidona está autorizada actualmente en el Reino Unido a dosis baja para el tratamiento a corto plazo de la agresión en la demencia de Alzheimer que no responde a las intervenciones no farmacológicas (BNF 2017). Katz 1999 también encontró que 1 mg/día de risperidona fue útil para el control de la agresión en la demencia grave.
La risperidona tiene propiedades atípicas especialmente a dosis inferiores, pero puede tornarse más "convencional" a dosis altas (Stahl 2008). Se ha encontrado que la risperidona se asocia con más efectos adversos como efectos secundarios extrapiramidales, hiperprolactinemia y disfunción sexual que otros antipsicóticos (Tran 1997). Un estudio doble ciego que examinó la administración de risperidona en la esquizofrenia encontró que, aunque la hiperprolactinemia se asocia de forma significativa con la administración de risperidona a largo plazo, los síntomas relacionados con los niveles altos de prolactina son poco frecuentes (Conley 2001). Se ha encontrado que la risperidona causa aumento de peso, pero el vínculo no es tan significativo como con la olanzapina (Conley 2001) y la clozapina (Wirshing 1999). La risperidona puede causar un aumento desproporcionado en el aumento de peso en los adolescentes en comparación con los adultos, lo que es un área clave en la falta de cumplimiento en este grupo (Fleischhaker 2007). La risperidona fue el primer antipsicótico atípico que estuvo disponible en una formulación inyectable de depósito a largo plazo que dura dos semanas. Estas formulaciones de dosis pueden mejorar el cumplimiento y la mejoría en el cumplimiento puede dar lugar a mejores resultados a largo plazo. La dificultad es que los pacientes voluntarios son en general cooperadores, por lo que los estudios no abordan la eficacia de la inyección de depósito en la población de pacientes que no cumplen con el tratamiento. (Sampson 2016).
De qué manera podría funcionar la intervención
Entre los antipsicóticos atípicos, la risperidona tiene uno de los perfiles farmacológicos más sencillos y se acerca más a un antagonista de serotonina‐dopamina. La risperidona es un derivado benzisoxazole que bloquea los receptores de dopamina2 y los receptores 5HT2 (con un cociente alto de bloqueo de los receptores de serotonina/D2). También bloquea los receptores H1 y adrenérgicos alfa1 y alfa2, y no tiene efecto sobre los receptores betaadrenérgicos, colinérgicos muscarínicos o peptidérgicos (Janssen 1988). Se considera que la psicosis está asociada con trastornos en la actividad de los neurotransmisores, en particular la dopamina, en el cerebro. Por lo tanto, se ha indicado que la risperidona funciona mediante el bloqueo de los receptores en el cerebro sobre los cuales actúa la dopamina, lo que previene la actividad excesiva de la dopamina y ayuda a controlar la agresión o la agitación. Czobor 1995 indicó que la combinación de risperidona en los sistemas serotoninérgico y dopaminérgico puede ser la base del efecto de la risperidona sobre la hostilidad.
Aleman 2001 encontró alguna evidencia de que la risperidona es útil para la reducción de la agresión en la esquizofrenia; aunque hay alguna evidencia contradictoria, la risperidona puede tener menos efecto sedante que los antipsicóticos convencionales, lo que a su vez indica que los efectos antiagresivos de la risperidona no están mediados por la sedación. En comparación con los antipsicóticos convencionales como el haloperidol, la risperidona produce algunos resultados significativamente mejores según las puntuaciones de la Positive and Negative Syndrome Scale (PANSS) (Hunter 2003).
Por qué es importante realizar esta revisión
Los problemas de salud mental imponen una carga significativa en los países en desarrollo (Shah 2000). Debido a que cerca del 1% de cualquier población presenta esquizofrenia (Sartorius 1972) y alrededor del 80% del mundo vive en los países en desarrollo (CIA 2008), la mayor parte de la atención de los pacientes con enfermedades mentales graves como la esquizofrenia debe ocurrir en estos países de ingresos bajos y medios. No existe evidencia de que la prevalencia de las urgencias psiquiátricas difiera en todo el mundo y parece razonable suponer que la mayoría de los episodios de agresión y agitación graves en los pacientes con problemas de salud mental graves ocurren en países de ingresos bajos y medios. En muchos de estos países pueden haber fármacos antipsicóticos costosos disponibles, pero en general no son asequibles (WPA 2008).
Aronson 1997 realizó una revisión que examinó la relación entre costo y efectividad y la calidad de vida de los pacientes antes y después de comenzar el tratamiento con risperidona y encontró que la risperidona mejoró los síntomas de la psicosis, redujo la necesidad de hospitalización y mejoró la calidad de vida. Viale 1997 también investigó la relación entre costo y efectividad de la risperidona antes y después de comenzar el tratamiento en pacientes con esquizofrenia y encontró que los días en el hospital se redujeron en el 26%, pero hubo un aumento del 3,4% en los costos totales de la asistencia sanitaria psiquiátrica.
La formulación de comprimidos de risperidona que se disuelven rápidamente puede ser útil para asegurar su administración. Estos comprimidos "bucodispersables" son una opción en la psicosis con agitación aguda (Normann 2006) y pueden ser efectivos como una alternativa a los antipsicóticos intramusculares (Currier 2001). A pesar de que habitualmente se utilizan para el tratamiento de la agitación inducida por la psicosis, no se sabe de alguna revisión sistemática sobre la administración de risperidona en situaciones de urgencia. Esta revisión es parte de una serie de revisiones relacionadas (Tabla 1).
Objetivos
Examinar si la risperidona es un tratamiento efectivo para la agresión o la agitación inducida por la psicosis.
Métodos
Criterios de inclusión de estudios para esta revisión
Tipos de estudios
Se incluyeron todos los ensayos controlados aleatorios (ECA) pertinentes. Si un ensayo se había descrito como "doble ciego" pero había implicado la asignación al azar y los detalles demográficos de cada grupo habían sido similares, se habría incluido. Se excluyeron los estudios cuasialeatorios, como los que se asignaron por días alternados de la semana.
Tipos de participantes
Pacientes que presentaban agresión o agitación (o ambas) que se consideró que se debían a psicosis, independientemente de la edad y el sexo. Los estudios que también involucraron a pacientes con otros diagnósticos como intoxicación por drogas o alcohol, problemas orgánicos que incluyen demencia, enfermedades mentales no psicóticas o discapacidades en el aprendizaje, se incluyeron siempre que la mayoría de los participantes (> 50%) presentaran psicosis.
Se deseaba asegurar que la información fuera tan relevante como fuera posible para la atención actual de los pacientes con esquizofrenia, por lo que, si se informó, se señalaría claramente el estado clínico (agudo, posagudo inmediato, remisión parcial, remisión) así como el estadio (prodrómico, primer episodio, enfermedad incipiente, persistente). Además, de ser posible, se informaría si los estudios se centraron principalmente en pacientes con problemas particulares (p.ej. síntomas negativos, enfermedades resistentes al tratamiento).
Tipos de intervenciones
1. Risperidona
Administrada sola, cualquier dosis y forma de administración.
2. Otros fármacos antipsicóticos
Administrados solos, cualquier dosis y forma de administración.
3. Placebo
Activo o no activo.
Tipos de medida de resultado
De ser posible, los resultados se agruparon por tiempo: a los 30 minutos, hasta dos horas, hasta cuatro horas, hasta 24 horas y más de 24 horas.
Resultados primarios
1. Ni calmado ni dormido
1.1 Ni calmado ni dormido ‐ hasta 30 minutos
2. Eventos adversos.
Resultados secundarios
1. Tranquilización o adormecimiento
1.1 No tranquilo
1.2 No dormido
1.3 Tiempo hasta lograr la tranquilización/el adormecimiento
1.4 Tiempo hasta lograr la tranquilización
1.5 Tiempo hasta lograr el adormecimiento
2. Conductas específicas
2.1 Daño autoinfligido, incluido el suicidio
2.2 Daño a otros
2.3 Agitación
2.3.1 Otro episodio de agitación a las 24 horas
2.3.2 Sin cambios clínicamente importantes en la agitación
2.3.3 Cualquier cambio en la agitación
2.4 Agresión
2.4.1 Otro episodio de agresión a las 24 horas
2.4.2 Sin cambios clínicamente importantes en la agresión
2.4.3 Ningún cambio en la agresión
2.4.4 Puntuación promedio de la agresión al final del estudio
2.4.5 Cambio promedio en las puntuaciones de la agresión
3. Resultados globales
3.1 Sin mejoría general
3.2 Uso de medicación adicional
3.3 Uso de restricciones o aislamiento
3.4 Recurrencia: según se definió en cada estudio
3.5 Recurrencia de los incidentes violentos
3.6 Necesidad de visitas adicionales del médico
3.7 Rechazo de la medicación oral
3.8 Sin aceptación del tratamiento
3.9 Puntuación promedio final
3.10 Puntuación de cambio promedio
3.11 Dosis promedio del fármaco
4. Resultados de los servicios
4.1 Duración de la estancia hospitalaria
4.2 Reingreso
4.3 Ningún compromiso clínicamente importante de los servicios
4.4 Compromiso con el servicio
4.5 Puntuación final promedio de compromiso
4.6 Cambio promedio en las puntuaciones del compromiso
5. Estado mental
5.1 Sin cambios clínicamente importantes en el estado mental general
5.2 Ningún cambio en el estado mental general
5.3 Puntuación final promedio del estado mental general
5.4 Cambio promedio en las puntuaciones del estado de salud mental general
6. Efectos adversos
6.1 Muerte
6.2 Cualquier efecto adverso general
6.3 Cualquier evento adverso específico grave
6.4 Puntuación final promedio de los efectos adversos generales
6.5 Cambio promedio en las puntuaciones de efectos adversos generales
6.6 Cambio clínicamente importante en los efectos adversos específicos
6.7 Cualquier cambio en los efectos adversos específicos
6.8 Puntuación final promedio de los efectos adversos específicos
6.9 Cambio promedio en los efectos adversos específicos
7. Abandono temprano del estudio
7.1 Por razones específicas
7.2 Por razones generales
8. Satisfacción con el tratamiento
8.1 El receptor del tratamiento no estuvo satisfecho con el tratamiento
8.2 Puntuación de satisfacción promedio del receptor del tratamiento
8.3 Cambio promedio en las puntuaciones de satisfacción del receptor del tratamiento
8.4 Prestador informal del tratamiento no satisfecho con el tratamiento
8.5 Puntuación promedio de la satisfacción de los prestadores informales del tratamiento
8.6 Cambio promedio en las puntuaciones de satisfacción del prestador informal del tratamiento
8.7 Prestadores profesionales no satisfechos con el tratamiento
8.8 Puntuación promedio de la satisfacción de los prestadores profesionales
8.9 Cambio promedio en las puntuaciones de satisfacción de los prestadores profesionales
9. Aceptación del tratamiento
9.1 Sin aceptación del tratamiento
9.2 Puntuación promedio de aceptación al final del estudio
9.3 Cambio promedio en la puntuación de aceptación
10. Calidad de vida
10.1 Sin cambio clínicamente importante en la calidad de vida
10.2 Ningún cambio en la calidad de vida
10.3 Puntuación final promedio de la calidad de vida
10.4 Cambio promedio de las puntuaciones de calidad de vida
10.5 Sin cambios clínicamente importantes de los aspectos específicos de la calidad de vida
10.6 Sin cambio en los aspectos específicos de la calidad de vida
10.7 Promedio de los aspectos específicos de la calidad de vida al final del estudio
10.8 Cambio promedio en aspectos específicos de la calidad de vida
11. Resultados económicos
11.1 Costes directos
11.2 Costes indirectos
Resultados utilizados para la tabla "Resumen de los hallazgos"
Se utilizó el enfoque GRADE para interpretar los hallazgos (Schünemann 2011) y se usó GRADEpro GDT para crear las tablas 'Resumen de los hallazgos". Estas tablas proporcionan información específica de los resultados en cuanto a la calidad general de la evidencia de cada estudio incluido en la comparación, la magnitud del efecto de las intervenciones examinadas y la suma de los datos disponibles sobre todos los resultados que se consideraron importantes para la atención del paciente y la toma de decisiones. Se incluyeron los siguientes resultados en la tabla "Resumen de los hallazgos":
-
tranquilización o adormecimiento ‐ a los 30 minutos;
-
necesidad repetida de tranquilización rápida ‐ en el transcurso de 24 horas;
-
comportamientos específicos ‐ agitación o agresión;
-
estado global ‐ necesidad de restricciones o aislamiento;
-
eventos adversos ‐ efectos adversos graves (no muerte);
-
resultados económicos.
En las evaluaciones de la calidad general de la evidencia de cada resultado que incluyó datos agrupados de ECA solamente, la calidad de la evidencia de "alta calidad" se disminuyó un nivel por limitaciones graves de los estudios (o dos niveles por limitaciones muy graves) (riesgo de sesgo), falta de direccionalidad de la evidencia, inconsistencia, imprecisión de las estimaciones del efecto o posible sesgo de publicación.
Métodos de búsqueda para la identificación de los estudios
No language restriction was applied within the limitations of the search tools.
Búsquedas electrónicas
Cochrane Schizophrenia Group Study‐Based Register of Trials
The Information Specialist searched the register (up to 12 April 2017) using the following phrase:
(*rispe* or *9‐OH‐risperid* or *r 64766* in intervention of STUDY) AND (*aggress* or *violen* or *agitation* or *tranq* in title, abstract, index terms of REFERENCE or intervention of STUDY)
In such a study‐based register, searching the major concept retrieves all the synonyms and relevant studies because all the studies have already been organised based on their interventions and linked to the relevant topics.
This register is compiled by systematic searches of major resources (including AMED, BIOSIS, CINAHL, Embase, MEDLINE, PsycINFO, PubMed, and registries of clinical trials) and their monthly updates, handsearches, grey literature, and conference proceedings (see Group’s Module). There are no language, date, document type, or publication status limitations for inclusion of records into the register.
Búsqueda de otros recursos
1. Reference searching
We inspected references of all included studies for further relevant studies.
2. Personal contact
Where necessary, we contacted the first author of each included study for information regarding unpublished trials.
Obtención y análisis de los datos
Selección de los estudios
1. 2017 search
Review authors EGO and MH independently inspected all abstracts of studies identified as above to identify potentially relevant reports. Where disagreement occurred, we resolved it by discussion, or where there was still doubt, we acquired the full article for further inspection and further discussion with CEA. We acquired the full articles of relevant reports for re‐assessment and to make a final decision on inclusion (see Criteria for considering studies for this review for this review). Once we had obtained the full articles, EGO and MH independently inspected all reports and independently decided whether they met the inclusion criteria. EGO and MH were not blinded to the names of the authors, institutions or journal of publication. Where difficulties or disputes arose, we discussed them with CEA and if a decision could not be reached, we added these studies to those awaiting assessment and contacted the authors of the papers for clarification.
2. 2015 search
Review author KM independently inspected all records identified in the search for potential relevance. Where difficulties or disputes arose, KM discussed them with CEA .
3. 2011 and 2013 searches
Review authors UA and FR independently inspected all abstracts of studies identified as above to identify potentially relevant reports. In addition, to ensure reliability, HJ (see Acknowledgements) inspected a random sample of these abstracts, comprising 10% of the total. Where disagreement occurred, we resolved it by discussion, or where there was still doubt, we acquired the full article for further inspection and further discussion with CEA. We acquired the full articles of relevant reports for re‐assessment and to make a final decision on inclusion (see Criteria for considering studies for this review for this review). Once we had obtained the full articles, UA and FR independently inspected all reports and independently decided whether they met the inclusion criteria. UA and FR were not blinded to the names of the authors, institutions or journal of publication. Where difficulties or disputes arose, we discussed them with HJ and CEA and if we had been unable to reach a decision, we would have added these studies to those awaiting assessment and contacted the authors of the papers for clarification.
Extracción y manejo de los datos
1. Extraction
1.1 2017 search
Review authors EGO and MH independently extracted data from all included studies. Again, any disagreement was discussed, decisions documented and, if necessary, we contacted the authors of studies for clarification. If there had been any remaining problems, we would have consulted with CEA to help clarify issues and these final decisions would have been documented. We extracted data presented only in graphs and figures whenever possible, but we only included the data if both EGO and MH independently had the same result; we used Plot Digitizer open source software for data extraction from figures, following instructions provided by Kadic 2016. We attempted to contact authors through an open‐ended request in order to obtain missing information or for clarification whenever necessary. If studies had been multi‐centre, where possible, we would have extracted data relevant to each component centre separately.
1.2 2011 and 2013 searches
Review authors UA and FR independently extracted data from all included studies. In addition, to ensure reliability, HJ independently extracted data from a random sample of these studies. Again, we discussed any disagreement, documented decisions and, if necessary, we contacted the authors of studies for clarification. With any remaining problems, CA helped to clarify issues and we documented these final decisions. The need did not arise, but we had planned to extract data presented only in graphs and figures whenever possible while only including the data if two review authors independently had the same result. We had also planned to attempt to contact authors through an open‐ended request in order to obtain missing information or for clarification whenever necessary, and to extract data relevant to each component of multi‐centre studies separately if we had found such studies.
2. Management
2.1 Forms
We extracted data onto standard, pre‐designed, simple forms.
2.2 Scale‐derived data
We included continuous data from rating scales only if:
a) the psychometric properties of the measuring instrument have been described in a peer‐reviewed journal (Marshall 2000);
b) the measuring instrument has not been written or modified by one of the trialists for that particular trial; and
c) the instrument should be a global assessment of an area of functioning and not sub‐scores which are not, in themselves, validated or shown to be reliable. However there are exceptions, we included sub‐scores from mental state scales measuring positive and negative symptoms of schizophrenia.
Ideally, the measuring instrument should either be i. a self‐report or ii. completed by an independent rater or relative (not the therapist). We realise that this is not often reported clearly; in Description of studies we noted if this was the case or not.
2.3 Endpoint versus change data
There are advantages of both endpoint and change data: change data can remove a component of between‐person variability from the analysis; however, calculation of change needs two assessments (baseline and endpoint), which can be difficult to obtain in unstable and difficult‐to‐measure conditions such as schizophrenia. We decided primarily to use endpoint data, and only use change data if the former were not available. If necessary, we combined endpoint and change data in the analysis, as we preferred to use mean differences (MDs) rather than standardised mean differences (SMDs) throughout (Deeks 2011).
2.4 Skewed data
Continuous data on clinical and social outcomes are often not normally distributed. To avoid the pitfall of applying parametric tests to non‐parametric data, we applied the following standards to relevant continuous data before inclusion.
For endpoint data from studies including fewer than 200 participants:
a) when a scale started from the finite number zero, we subtracted the lowest possible value from the mean, and divided this by the standard deviation (SD). If this value was lower than one, it strongly suggests that the data are skewed. We excluded these data and entered them as 'other data'. If this ratio was higher than one but less than two, there is suggestion that the data are skewed: we entered these data and tested whether their inclusion or exclusion would change the results substantially. If such data changed the results we entered them as 'other data'; if they did not change the results substantially, we used these data in the analyses. Finally, if the ratio was larger than two, we included these data, because it is less likely that they are skewed (Altman 1996; Higgins 2011).
b) if a scale starts from a positive value (such as the Positive and Negative Syndrome Scale (PANSS), which can have values from 30 to 210 (Kay 1986)), we modified the calculation described above to take the scale starting point into account. In these cases skewed data are present if 2 SD > (S − S min), where S is the mean score and 'S min' is the minimum score.
Please note: we planned to enter all relevant data from studies of more than 200 participants in the analysis irrespective of the above rules, because skewed data pose less of a problem in large studies. We entered all relevant change data, as when continuous data are presented on a scale that includes a possibility of negative values (such as change data), it is difficult to tell whether or not data are skewed.
2.5 Common measurement
To facilitate comparison between trials we aimed, where relevant, to convert variables that can be reported in different metrics, such as days in hospital (mean days per year, per week or per month) to a common metric (e.g. mean days per month).
2.6 Conversion of continuous to binary
Where possible, we made efforts to convert outcome measures to dichotomous data. This can be done by identifying cut‐off points on rating scales and dividing participants accordingly into 'clinically improved' or 'not clinically improved'. It is generally assumed that if there is a 50% reduction in a scale‐derived score such as the Brief Psychiatric Rating Scale (BPRS) (Overall 1962), or the PANSS (Kay 1986), this could be considered as a clinically significant response (Leucht 2005; Leucht 2005a). If data based on these thresholds were not available, we used the primary cut‐off presented by the original authors.
2.7 Direction of graphs
Where possible, we entered data in such a way that the area to the left of the line of no effect indicates a favourable outcome for risperidone. Where keeping to this made it impossible to avoid outcome titles with double‐negatives (e.g. 'Not un‐improved'), we reported data where the left of the line indicated an unfavourable outcome. If needed in order to improve readability, we switched labels on the X axis and stated it in a note accompanying the graph.
Evaluación del riesgo de sesgo de los estudios incluidos
For the 2017 search review authors EGO and MH independently assessed risk of bias within the included studies by using criteria described in the Cochrane Handbook for Systematic Reviews of Interventions to assess trial quality (Higgins 2011a). This set of criteria is based on evidence of associations between overestimate of effect and high risk of bias of the article such as sequence generation, allocation concealment, blinding, incomplete outcome data, and selective reporting.
If the raters had disagreed, we would have made the final rating by consensus, with the involvement of CEA. Where inadequate details of randomisation and other characteristics of trials were provided, we attempted to contact authors of the studies in order to obtain further information. If non‐concurrence had occurred, we would have reported this.
We noted the level of risk of bias in the text of the review and in the text and 'Summary of findings' tables.
For the 2011 and 2013 searches, UA and FR undertook assessment of risk of bias as above.
Medidas del efecto del tratamiento
1. Binary data
For binary outcomes we calculated a standard estimation of the risk ratio (RR) and its 95% confidence interval (CI), as it has been shown that RR is more intuitive than odds ratios (Boissel 1999); and that odds ratios tend to be interpreted as RR by clinicians (Deeks 2000). Although the number needed to treat for an additional beneficial outcome (NNTB) and the number needed to treat for an additional harmful outcome (NNTH), with their CIs are intuitively attractive to clinicians, they are problematic to calculate and interpret in meta‐analyses (Hutton 2009). For binary data presented in the 'Summary of findings' tables we, where possible, we calculated illustrative comparative risks.
2. Continuous data
For continuous outcomes we estimated the mean difference (MD) between groups. We preferred not to calculate effect size measures (standardised mean difference (SMD)). However if scales of very considerable similarity were used, we presumed there was a small difference in measurement, and we calculated effect size and transformed the effect back to the units of one or more of the specific instruments.
Cuestiones relativas a la unidad de análisis
1. Cluster trials
Studies increasingly employ 'cluster randomisation' (such as randomisation by clinician or practice) but analysis and pooling of clustered data poses problems. Firstly, authors often fail to account for intra‐class correlation (ICC) in clustered studies, leading to a 'unit of analysis' error (Divine 1992) whereby P values are spuriously low, CIs unduly narrow and statistical significance overestimated. This causes type I errors (Bland 1997; Gulliford 1999).
If clustering had not been accounted for in primary studies, we would have presented data in a table, with a (*) symbol to indicate the presence of a probable unit of analysis error. We would have attempted to contact the first authors of studies to obtain intra‐class correlation coefficients (ICCs) for their clustered data and to adjust for this by using accepted methods (Gulliford 1999). If clustering had been incorporated into the analysis of primary studies, we would have presented these data as if from a non‐cluster randomised study, but adjusted for the clustering effect. We have sought statistical advice and have been advised that the binary data as presented in a report should be divided by a ’design‐effect’. This is calculated using the mean number of participants per cluster (m) and the ICC [Design effect = 1+(m‐1)*ICC] (Donner 2002). If the ICC was not reported it was assumed to be 0.1 (Ukoumunne 1999). If cluster studies had been appropriately analysed taking into account ICCs and relevant data documented in the report, synthesis with other studies would have been possible using the generic inverse variance technique.
2. Cross‐over trials
A major concern of cross‐over trials is the carry‐over effect. It occurs if an effect (e.g. pharmacological, physiological or psychological) of the treatment in the first phase is carried over to the second phase. As a consequence, on entry to the second phase the participants can differ systematically from their initial state despite a wash‐out phase. For the same reason cross‐over trials are not appropriate if the condition of interest is unstable (Elbourne 2002). As both effects are very likely in severe mental illness, if we had included cross‐over studies, we would only have used data from the first phase of cross‐over studies.
Manejo de los datos faltantes
1. Overall loss of credibility
At some degree of loss of follow‐up, data must lose credibility (Xia 2009). We chose that, for any particular outcome, should more than 50% of data be unaccounted for we would not reproduce these data or use them within analyses. If, however, more than 50% of those in one arm of a study were lost, but the total loss was less than 50%, we would address this within the 'Summary of findings' tables by down‐rating quality. Finally, we would also downgraded quality within the 'Summary of findings' tables should the loss be 25% to 50% in total.
2. Binary
In the case where attrition for a binary outcome was between 0% and 50% and where these data were not clearly described, we presented data on a 'once‐randomised‐always‐analyse' basis (an intention‐to‐treat (ITT) analysis). Those leaving the study early were all assumed to have the same rates of negative outcome as those who completed. We used the rate of those who stayed in the study ‐ in that particular arm of the trial ‐ and applied this also to those who did not. We undertook a sensitivity analysis to test how prone the primary outcomes were to change when data only from people who completed the study to that point were compared to the ITT analysis using the above assumptions.
3. Continuous
3.1 Attrition
We used data where attrition for a continuous outcome was between 0% and 50%, and data only from people who completed the study to that point were reported.
3.2 Standard deviations
If standard deviations (SDs) were not reported, we tried to obtain the missing values from the authors. If these were not available, where there were missing measures of variance for continuous data, but an exact standard error (SE) and CIs available for group means, and either P value or t value available for differences in mean, we could calculate SDs according to the rules described in the Cochrane Handbook for Systematic Reviews of Interventions (Higgins 2011). When only the SE is reported, SDs are calculated by the formula SD = SE * √(n). The Cochrane Handbook for Systematic Reviews of Interventions presents detailed formulae for estimating SDs from P, t or F values, CIs, ranges or other statistics (Higgins 2011). If these formulae do not apply, we could calculate the SDs according to a validated imputation method which is based on the SDs of the other included studies (Furukawa 2006). Although some of these imputation strategies can introduce error, the alternative would be to exclude a given study’s outcome and thus to lose information. Nevertheless, we would have examined the validity of the imputations in a sensitivity analysis that excludes imputed values.
3.3 Assumptions about participants who left the trials early or were lost to follow‐up
Various methods are available to account for participants who left the trials early or were lost to follow‐up. Some trials just present the results of study completers; others use the method of last observation carried forward (LOCF); while more recently, methods such as multiple imputation or mixed‐effects models for repeated measurements (MMRM) have become more of a standard. While the latter methods seem to be somewhat better than LOCF (Leon 2006), we feel that the high percentage of participants leaving the studies early and differences between groups in their reasons for doing so is often the core problem in randomised schizophrenia trials. We therefore determined not to exclude studies based on the statistical approach used. However, by preference we planned to use the more sophisticated approaches, i.e. we would have used MMRM or multiple‐imputation to LOCF, and would only have presented completer analyses if some kind of ITT data were not available at all. Moreover, we planned to address this issue in the item 'Incomplete outcome data' of the 'Risk of bias' tool.
Evaluación de la heterogeneidad
1. Clinical heterogeneity
We considered all included studies initially, without seeing comparison data, to judge clinical heterogeneity. We simply inspected all studies for clearly outlying situations or people which we had not predicted would arise. Where such situations or participant groups arose, we fully discussed these.
2. Methodological heterogeneity
We considered all included studies initially, without seeing comparison data, to judge methodological heterogeneity. We simply inspected all studies for clearly outlying methods which we had not predicted would arise. Where such methodological outliers arose, we fully discussed these.
3. Statistical heterogeneity
3.1 Visual inspection
We visually inspected graphs to investigate the possibility of statistical heterogeneity.
3.2 Employing the I2 statistic
We investigated heterogeneity between studies by considering the I2 statistic alongside the Chi2 P value. The I2 statistic provides an estimate of the percentage of inconsistency thought to be due to chance (Higgins 2003). The importance of the observed value of I2 depends on i. magnitude and direction of effects and ii. strength of evidence for heterogeneity (e.g. P value from Chi2 test, or a CI for I2). An I2 estimate greater than or equal to 50% accompanied by a statistically significant Chi2 statistic, was interpreted as evidence of substantial levels of heterogeneity (Deeks 2011). Where substantial levels of heterogeneity were found in the primary outcome, we explored reasons for the heterogeneity (Subgroup analysis and investigation of heterogeneity).
Evaluación de los sesgos de notificación
Reporting biases arise when the dissemination of research findings is influenced by the nature and direction of results ( Egger 1997). These are described in Chapter 10 of the Cochrane Handbook for Systematic Reviews of Interventions (Sterne 2011).
1. Protocol versus full study
We tried to locate protocols of included randomised trials. If the protocol was available, we compared outcomes in the protocol and in the published report. If the protocol was not available, we compared outcomes listed in the methods section of the trial report with actually reported results.
2. Funnel plot
We are aware that funnel plots may be useful in investigating reporting biases but are of limited power to detect small‐study effects. We decided not to use funnel plots for outcomes where there were 10 or fewer studies, or where all studies were of similar size. In future versions of this review, if funnel plots are possible, we will seek statistical advice in their interpretation.
Síntesis de los datos
We understand that there is no closed argument for preference for use of fixed‐effect or random‐effects models. The random‐effects method incorporates an assumption that the different studies are estimating different, yet related, intervention effects. This often seems to be true to us and the random‐effects model takes into account differences between studies even if there is no statistically significant heterogeneity. There is, however, a disadvantage to the random‐effects model. It puts added weight onto small studies which often are the most biased ones. Depending on the direction of effect, these studies can either inflate or deflate the effect size. We chose the fixed‐effect model for analyses.
Análisis de subgrupos e investigación de la heterogeneidad
1. Subgroup analyses
We did not anticipate any subgroup analyses.
2. Investigation of heterogeneity
If inconsistency was high, we reported it. First, we investigated whether data were entered correctly. Second, if data were correct, we visually inspected the graph and successively removed outlying studies to see if homogeneity was restored. For this review, we decided that should this occur with data contributing to the summary finding of no more than around 10% of the total weighting, we would present the data. If not, we would not pool data but would discuss the issues. We know of no supporting research for this 10% cut‐off but are investigating the use of prediction intervals as an alternative to this unsatisfactory state.
When unanticipated clinical or methodological heterogeneity were obvious, we stated hypotheses regarding these for future reviews or versions of this review. We did not anticipate undertaking analyses relating to these.
Análisis de sensibilidad
We planned that if there were substantial differences in the direction or precision of effect estimates in any of the sensitivity analyses listed below, we would not add data from the lower‐quality studies to the results of the higher‐quality trials, but would present these data within a subcategory. If their inclusion did not result in a substantive difference, they would remain in the analyses.
1. Implication of randomisation
We aimed to include trials in a sensitivity analysis if they had been described in some way as to imply randomisation. For the primary outcomes we would have included these studies, and if there was no substantive difference when these implied randomised studies were added to those with better description of randomisation, then we would have used all data from the implied studies.
2. Assumptions for lost binary data
Where assumptions had to be made regarding people lost to follow‐up (see Dealing with missing data), we compared the findings of the primary outcomes where we used our assumption compared with completer data only. If there was a substantial difference, we reported results and discussed them but continued to employ our assumption.
Where assumptions had to be made regarding missing SDs data (see Dealing with missing data), we compared the findings on primary outcomes where we used our assumption compared with complete data only. We undertook a sensitivity analysis to test how prone results were to change when completer data only were compared with the imputed data using the above assumption. If there was a substantial difference, we reported results and discussed them but continued to employ our assumption.
3. Risk of bias
We analysed the effects of excluding trials that were judged to be at high risk of bias across one or more of the domains of randomisation (see Assessment of risk of bias in included studies) for the meta‐analysis of the primary outcome/s. If the exclusion of trials at high risk of bias did not substantially alter the direction of effect or the precision of the effect estimates, then we included data from these trials in the analysis.
4. Imputed values
We also would have undertaken a sensitivity analysis to assess the effects of including data from trials where we used imputed values for ICC in calculating the design effect in cluster‐randomised trials if included. If substantial differences had been noted in the direction or precision of effect estimates in any of the sensitivity analyses listed above, we would not pool data from the excluded trials with the other trials contributing to the outcome, but would have presented them separately.
5. Fixed and random effects
We synthesised data using a fixed‐effect model; however, we also synthesised data for the primary outcomes using a random‐effects model to evaluate whether this altered the significance of the result.
Results
Description of studies
For substantive descriptions of studies please see the Characteristics of included studies, Characteristics of studies awaiting classification, and Characteristics of excluded studies.
Results of the search
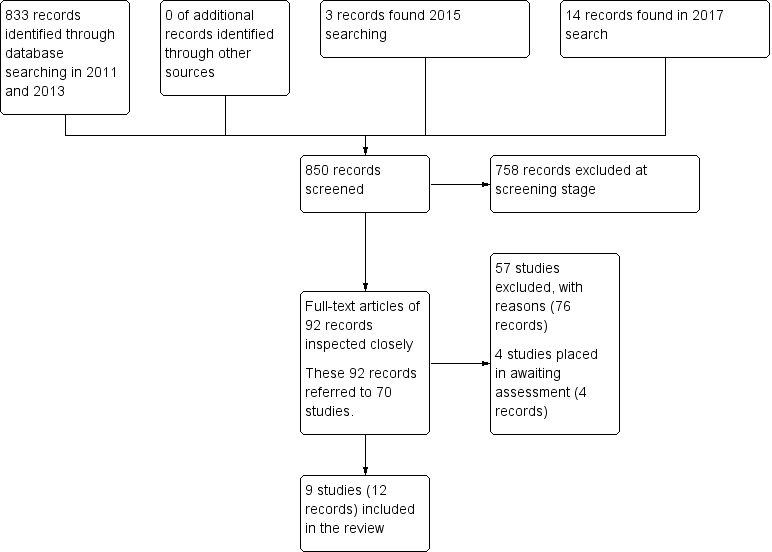
Electronic searches up to April 2017 identified 850 records of potentially eligible studies. After an initial screening of these records (checking titles and abstracts), the full‐text articles of 92 records (referring to 70 studies) were obtained. From these 70 studies, 57 (76 records) were excluded with reasons, four studies (four records were placed in awaiting assessment) and nine studies (12 records) were included. Please see Figure 2 for summary of the searches up to April 2017.
Search results ‐ up to April 2017
Included studies
Details of the included studies in the review are provided in the Characteristics of included studies table. Searches undertaken between 2011 and 2015 identified three studies for inclusion (Lim 2010; Walther 2014; Yao 2010). In 2017, we identified six additional studies for inclusion (Dai 2012; Jin 2013; Li 2013; Wang 2012; Wang 2013; Zhou 2013).
1. Length of studies
The duration of the studies ranged from 24 hours (Lim 2010) to eight weeks (Dai 2012; Li 2013; Yao 2010).
2. Participants
2.1 Clinical state
Participants presented with acute exacerbation of psychotic symptoms. All the studies focused on people whose psychosis had primarily triggered agitation (Lim 2010; Walther 2014; Wang 2012; Zhou 2013) or aggressive behaviour (Dai 2012; Jin 2013; Li 2013; Wang 2013; Yao 2010).
2.2 Diagnosis
Eighty‐nine per cent of participants (n = 520) had a diagnosis of schizophrenia. Other diagnosis included schizoaffective disorder (n = 6, 1%), bipolar I disorder with or without psychotic symptoms (n = 43, 7%), schizophreniform disorder (n = 10, 2%), and psychotic disorder not otherwise specified (n = 3, 1%).
2.3 Exclusions
Reported exclusion criteria included pregnant or lactating women, people with serious medical illnesses, people who had used certain medications (e.g. antipsychotics, long‐acting antipsychotics, benzodiazepines) within a specified period prior to enrolment, people with a known allergy or hypersensitivity to the study drugs, and people with alcohol or psychoactive substance use disorder.
2.4 Age
Six studies reported age range and a mean age (Dai 2012; Jin 2013; Li 2013; Walther 2014; Wang 2012; Yao 2010), one study reported an age range (Lim 2010), and two studies reported a mean age (Wang 2013; Zhou 2013). Age ranges varied from the narrowest being 20‐30 years (Dai 2012) to the largest one being of 18‐65 (Jin 2013; Lim 2010); mean ages varied from the lowest being of 25.3 (Dai 2012) years to the highest 39.4 years (Jin 2013).
2.5 Sex
The studies included a total of 353 male participants and 229 female participants.
3. Study size
The study sizes varied with the smallest study having 40 participants (Dai 2012) and the largest randomising 124 people (Lim 2010).
4. Setting
In all the included studies, participants presented at psychiatric emergency departments and were newly admitted inpatients.
5. Interventions
A total of five comparisons were identified in the included studies: three comparisons involved a single drug whilst the other two comparisons involved a combination. Unfortunately, only two comparisons ('risperidone versus haloperidol', and 'risperidone versus valproic acid') could benefit from more than one study as source of data; moreover, as for the first comparison this held true for a single outcome only ('leaving the study early').
Involved daily doses of risperidone started from 1 mg (Dai 2012; Li 2013; Wang 2013; Yao 2010) or 2 mg (Lim 2010; Walther 2014) to a maximum of 4 mg (Zhou 2013) or 6 mg (Dai 2012; Li 2013; Lim 2010; Walther 2014; Wang 2013; Yao 2010). In one study (Wang 2012), authors declared a titration without a specification on the intended doses, reporting only a mean daily administered dose (4.2 mg ± 0.35mg). In Jin 2013 dosages were not specified.
5.1 Versus antipsychotics
Haloperidol intramuscular (IM) dose was in the 5 mg to 15 mg range (Lim 2010), whilst as for the oral formulation it was a fixed dose of 15 mg (Walther 2014). Olanzapine was given as a fixed dose of 20 mg, oral (Walther 2014). Quetiapine flexible dose started from 100 mg/day and then increased to 400 mg to 500 mg/day with a maximum dose of 750 mg/day (Dai 2012).
5.2 Versus combinations
In the risperidone + oxcarbazepine comparison (Wang 2012), daily administered dose of risperidone and oxcarbazepine were, respectively, of 4.1 mg ± 0.4 mg (oral formulation) and 1.20 g ± 0.42 g (oral formulation).
As for the risperidone + valproic acid comparison, magnesium valproate was administered at 500 mg/day (Yao 2010), within the 750 mg to 1000 mg/day range (Jin 2013; Li 2013), or with a mean dose of 800 mg ± 50 mg/day (Li 2013); sodium valproate daily administered dose was in the 600 mg to 1200 mg/day range (Wang 2013) or of 400 mg twice daily (intravenous formulation (Zhou 2013).
6. Outcomes
The majority of the included studies provided binary data with respect to "specific behaviour ‐ agitation" outcome, "global state" outcome, "mental state" outcome, "adverse effects" outcome, and "leaving the study early" outcome. The majority of trials that employed continuous scales measured "specific behaviour ‐ agitation" outcome, "specific behaviour ‐ aggression" outcome, "mental state" outcome, and "adverse effects ‐ movement disorders" outcome.
The various rating scales, from which we were able to obtain usable data, are listed below.
6.1 Specific behaviour ‐ agitation
a. Positive and Negative Syndrome Scale ‐ Excited Component (PANSS‐EC)
The PANSS‐EC is a five‐item scale (excitement, tension, hostility, uncooperativeness, and poor impulse control). The items are rated from one (not present) to seven (extremely severe). Scores range from five to 35, with mean scores ≥ 20 indicating agitation. A high score indicates high levels of agitation (Montoya 2011).
b. Positive and Negative Syndrome Scale ‐ Psychotic Agitation Subscale (PANSS‐PAS)
The PANSS‐PAS is a five‐item scale (excitement, hallucinatory behaviour, hostility, uncooperativeness, and poor impulse control). The items are rated from one (not present) to seven (extremely severe), with total scores ranging from five to 35. A high score indicates high levels of psychotic agitation (Currier 2000).
6.2 Specific behaviour ‐ aggression
a. Modified Overt Aggression Scale (MOAS)
The OAS (Yudofsky 1986) is a 16‐item rating scale which aims to measure the intensity of verbal and physical aggression. Clinicians are required to comment on the duration of the aggressive incident as well as the intervention required to control it. High scores are indicative of higher levels of aggression.
6.3 Global state
a. Clinical Global Impression (CGI)
The CGl (Guy 1976) is not a diagnostic tool but rather, enables clinicians to quantify the severity of symptoms of any mental health problem at one point in time. Clinicians are then able to use this to track whether there has been any improvement or worsening of symptoms over time. A seven‐point rating scale is used with high scores indicating increased severity or less recovery.
b. Clinical Global Impression ‐ Improvement (CGI‐I)
The CGI‐I (Guy 1976) enables clinicians to assess whether a per‐ son’s symptoms have improved or worsened following an intervention. Based on the clinicians judgement, a rating on a seven‐ point scale is given from one (very much improved) to seven (very much worse). Low scores indicate greater improvement.
c. Clinical Global Impression ‐ Severity (CGI‐S)
The CGI‐S (Guy 1976) requires clinicians to consider the severity of a person’s symptoms in relation to the clinicians past experience of people with the same diagnosis. Clinicians then have to give a rating from one (normal) to seven (extremely ill). High scores indicate increased severity.
6.4 Mental state
a. Brief Psychiatric Rating Scale (BPRS)
The Brief Psychiatric Rating Scale was originally developed by Overall and Gorham (Overall 1962) as a 14‐item scale to measure the severity of a range of psychiatric symptoms, including psychosis. This rating scale items evolved over time and now consists of 24 items which can be rated on a seven‐point scale from ‘not present’ to ‘extremely severe’. A high score would suggest poor mental health. It is not clear for the majority of the studies included in this review, which version of the BPRS was used.
b. Positive and Negative Syndrome Scale (PANSS)
The PANSS was developed and published by Kay, Flszbein and Opler (Kay 1986). The PANSS is designed as a brief interview, whereby the severity of 30 symptoms of schizophrenia can be assessed on a scale of one to seven. A high score would indicate more severe symptoms. The PANSS can be divided into separate sub scales by focusing on the statements relating to positive symptoms (e.g. hallucinations), negative symptoms (e.g. social withdrawal) or general psychopathology (e.g. anxiety and uncooperativeness).
6.5 Adverse effects
a. Abnormal Involuntary Movement Scale (AIMS)
The AIMS (Guy 1976) is a 12‐items scale which records the occurrence of tardive dyskinesia. The first 10 items are rated from one to five, whilst the last two items are dichotomous items (yes, no).
b. Barnes Akathisia Scale (BAS)
The BAS scale was developed by Barnes 1989 and includes items which aim to rate both the observable symptoms which characterise akathisia such as restless movements and also the person’s subjective experience, including any distress. The items are rated from zero = normal to three = severe. There is also an item for rating global severity from zero (absent) to five (severe). A high score indicates high levels of akathisia.
c. Simpson‐Angus Scale (SAS)
The SAS (Simpson 1970) is a 10‐item scale which measures drug induced parkinsonism (extrapyramidal side effects). Each item is scored from zero to four. A high score would indicate increased levels of parkinsonism.
d. Treatment Emergent Symptom Scale (TESS)
The TESS (Guy 1976) is a six‐item scale which is used to assess the occurrence and intensity of treatment‐related adverse effects. A high score indicates worse symptoms.
7. Missing outcomes
Not one of the studies evaluated tranquillisation within 30 minutes, satisfaction with care, acceptance of treatment, quality of life, or economic outcomes.
8. Funders
One of the nine included studies received sponsorship from a pharmaceutical company.
Excluded studies
In total 59 studies had to be excluded: 12 studies were excluded based on their method of allocation (Beck 1997; Buckley 1997; Currier 2000; Greenspan 2005; Hatta 2008; Hovens 2005; Lewis 2006; Li 2014; Pei 2009; Potkin 2005; Schooler 2003; Villari 2008); 35 studies were excluded based on the characteristics of their participants, who were not experiencing a psychosis‐induced aggression or agitation (Belenkaya 2005; Citrome 2001; Briken 2002; Buitelaar 2001; Citrome 2004; Chan 2013; Czobor 1995; Francey 2007; Han 2005; He 2005; Huaqiang 2009; ISRCTN11736448 2003; Kane 2003; Kirwan 2002; Kolivakis 2002; Lieberman 2001; Liu 2010; NCT00174200 2005; NCT00203775 2005; NCT00205699 2005; Citrome 2007; NCT00485498 2003; Ou 2007; Peng 2009; Swanson 2008; Tang 2007; Temputrn 2007; Tosic Golubovic Suzana 2009; Veser 2006; Wan 2005; Wang 2004; Wang 2006; Wei 2010; Xi 2010; Xuan 2007). For 11 studies the intervention under investigation did not meet our inclusion criteria (Conde 2011; Currier 2004; Fang 2012; Hong 2014; Hou 2011; Jiang 2012; Liu 2012; Wang 2015; Zhang 2012; Zheng 2010; Zhou 2012); one study was excluded because the study terminated too early due to difficulties in recruiting participants (NCT00418873 2007).
Risk of bias in included studies
Please see the relevant 'Risk of bias' tables in the Characteristics of included studies, Figure 3 and Figure 4.
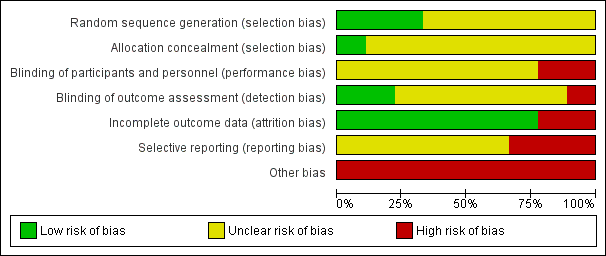
'Risk of bias' graph: review authors' judgements about each risk of bias item presented as percentages across all included studies.

'Risk of bias' summary: review authors' judgements about each risk of bias item for each included study.
Allocation
All nine studies were reported as randomised. In Dai 2012, Jin 2013, Li 2013, Wang 2013, Yao 2010, and Zhou 2013 randomisation is stated but no informations on randomisation procedures and allocation process were given. For the studies that did report further details, methods are described as random number sequence (Wang 2012), pre‐defined randomisation code (Lim 2010), and randomisation in blocks (Walther 2014).
Blinding
None of the studies were double‐blind with two studies (Lim 2010 and Wang 2012) reporting to be open‐label . Only two studies reported being rater‐blind (Lim 2010; Walther 2014).
Incomplete outcome data
There was no evidence of attrition bias for seven studies (Dai 2012; Li 2013; Lim 2010; Wang 2012; Wang 2013; Yao 2010; Zhou 2013). In Jin 2013, two participants left the study early due to adverse effects (without any procedure in order to take into account attrition bias), whilst in Walther 2014, nine people were excluded due to refusal to provide post‐hoc consent.
Selective reporting
In Lim 2010, Walther 2014 and Yao 2010, there was evidence of selective reporting, since several outcomes ‐ despite being stated in the methods ‐ are not reported or reported only partially.
Other potential sources of bias
A study being sponsored by a pharmaceutical company does not automatically indicate bias, but indicates a level of risk for uncertainty. One study was sponsored by Janssen Phamaceutica Korea (Lim 2010). Although Walther 2014 stated that their study was unfunded, several authors were affiliated with Novartis, AstraZeneca, Bristol‐Myers Squibb, Janssen, Servier, Eli Lilly, Zeller Medical, and Sandoz. Eight out of the nine studies had a very small sample size (Dai 2012; Jin 2013; Li 2013; Walther 2014; Wang 2012; Wang 2013; Yao 2010; Zhou 2013).
Effects of interventions
See: Summary of findings for the main comparison RISPERIDONE compared to OTHER ANTIPSYCHOTIC: a. HALOPERIDOL for psychosis‐induced aggression or agitation (rapid tranquillisation); Summary of findings 2 RISPERIDONE compared to OTHER ANTIPSYCHOTIC: b. OLANZAPINE for psychosis‐induced aggression or agitation (rapid tranquillisation); Summary of findings 3 RISPERIDONE compared to OTHER ANTIPSYCHOTIC: c. QUETIAPINE for psychosis‐induced aggression or agitation (rapid tranquillisation); Summary of findings 4 RISPERIDONE compared to COMBINATION: a. RISPERIDONE + OXCARBAZEPINE for psychosis‐induced aggression or agitation (rapid tranquillisation); Summary of findings 5 RISPERIDONE compared to COMBINATION: b. RISPERIDONE + VALPROIC ACID for psychosis‐induced aggression or agitation (rapid tranquillisation)
See: summary of findings Table for the main comparison; summary of findings Table 2; summary of findings Table 3; summary of findings Table 4; summary of findings Table 5.
1. COMPARISON 1: RISPERIDONE versus OTHER ANTIPSYCHOTIC: a. HALOPERIDOL
Two studies (n = 152) compared risperidone with haloperidol (Lim 2010; Walther 2014).
1.1 Specific behaviour ‐ agitation
There were no clear differences in terms of Positive And Negative Syndrome Scale ‐ Psychotic Agitation Sub‐score (PANSS‐PAS) response rate up to 24 hours (risk ratio (RR) 1.04, 95% confidence interval (CI) 0.86 to 1.26; participants = 124; studies = 1; Analysis 1.1) and PANSS‐PAS rating scales up to two hours (mean difference (MD) 0.40, 95% CI ‐4.42 to 5.22; participants = 28; studies = 1; Analysis 1.2), up to 24 hours (MD 0.20, 95% CI ‐3.96 to 4.36; participants = 28; studies = 1; Analysis 1.3), and over 24 hours (at 48 hours, MD 1.50, 95% CI ‐1.36 to 4.36; participants = 28; studies = 1; at 72 hours, MD 1.40, 95% CI ‐1.62 to 4.42; participants = 28; studies = 1; at 96 hours, MD 2.90, 95% CI ‐0.34 to 6.14; participants = 28; studies = 1; Analysis 1.4).
1.2 Global outcome
No clear differences were identified in terms of need for benzodiazepines (RR 0.88, 95% CI 0.34 to 2.27; participants = 124; studies = 1), need for seclusion room (RR 0.33, 95% CI 0.01 to 7.55; participants = 28; studies = 1), and use of restraints (RR 2.00, 95% CI 0.43 to 9.21; participants = 28; studies = 1; Analysis 1.5).
1.3 Adverse effects
A similar proportion of participants experienced one or more adverse effects, thus resulting in no clear differences between treatment groups (RR 0.94, 95% CI 0.54 to 1.66; participants = 124; studies = 1; Analysis 1.7).
More people allocated to risperidone experienced insomnia, without clear differences (RR 13.00, 95% CI 0.75 to 225.90; participants = 124; studies = 1), while a similar number of patients experienced somnolence (RR 1.29, 95% CI 0.51 to 3.24; participants = 124; studies = 1; Analysis 1.8).
No clear differences resulted between risperidone and haloperidol in terms of movement disorders, both when considering the proportion of people experiencing extrapyramidal symptoms up to 24 hours (RR 0.63, 95% CI 0.22 to 1.80; participants = 124; studies = 1; Analysis 1.9), or continuous scale scores such as Behavioural Activity Rating Scale (BARS) (MD ‐0.60, 95% CI ‐1.56 to 0.36; participants = 28; studies = 1) and SAS (MD ‐0.40, 95% CI ‐3.00 to 2.20; participants = 28; studies = 1; Analysis 1.11).
Risperidone and haloperidol were similar for adverse events such as headache (RR 0.75, 95% CI 0.18 to 3.21; participants = 124; studies = 1) and dizziness (RR 1.00, 95% CI 0.26 to 3.82; participants = 124; studies = 1) up to 24 hours (Analysis 1.12).
1.4 Leaving the study early
A comparable proportion of participants left the study early due to any reason (RR 2.20, 95% CI 0.51 to 9.48; participants = 152; studies = 2; I2 = 59%), due to adverse effects (RR 0.50, 95% CI 0.05 to 5.37; participants = 124; studies = 1), or due to lack of efficacy (RR 9.00, 95% CI 0.53 to 152.93; participants = 28; studies = 1; Analysis 1.13).
2. COMPARISON 2: RISPERIDONE versus OTHER ANTIPSYCHOTIC: b. OLANZAPINE
One study (n = 29) compared risperidone with olanzapine (Walther 2014). Unsurprisingly with such a small study, no difference between the compared drugs for any of the considered outcomes could be observed.
2.1 Specific behaviour ‐ agitation
There were no clear differences in PANSS‐PAS endpoint scores up to two hours (MD 2.50, 95% CI ‐2.46 to 7.46; participants = 29; studies = 1; Analysis 2.1), up to 24 hours (MD 0.90, 95% CI ‐3.40 to 5.20; participants = 29; studies = 1; Analysis 2.2), and over 24 hours (at 48 hours, MD ‐1.20, 95% CI ‐5.15 to 2.75; participants = 29; studies = 1; at 72 hours, MD ‐0.30, 95% CI ‐4.47 to 3.87; participants = 29; studies = 1; at 96 hours, MD 2.10, 95% CI ‐1.41 to 5.61; participants = 29; studies = 1; Analysis 2.3).
2.2 Global outcome
No clear differences were found when comparing risperidone and olanzapine in terms of need for seclusion room (RR 0.36, 95% CI 0.02 to 8.07; participants = 29; studies = 1) and use of restraints (RR 1.43, 95% CI 0.39 to 5.28; participants = 29; studies = 1; Analysis 2.4).
2.3 Adverse effects
Comparison in terms of BARS (MD 0.20, 95% CI ‐0.43 to 0.83; participants = 29; studies = 1) and SAS scores (MD 1.80, 95% CI ‐0.63 to 4.23; participants = 29; studies = 1) resulted in no clear difference (Analysis 2.6).
2.4 Leaving the study early
More people allocated to risperidone left the study early due to lack of efficacy, but there was no clear difference between treatment groups for this outcome (RR 2.14, 95% CI 0.46 to 9.93; participants = 29; studies = 1; Analysis 2.7).
3. COMPARISON 3: RISPERIDONE versus OTHER ANTIPSYCHOTIC: c. QUETIAPINE
One study (n = 40) compared risperidone with quetiapine (Dai 2012).
3.1 Specific behaviour ‐ aggression
A clear difference at Modified Overt Aggression Scale (MOAS) endpoint score could be seen at two weeks favouring participants allocated to quetiapine (MD 1.80, 95% CI 0.20 to 3.40; participants = 40; studies = 1), whilst this was not the case at four weeks (MD 0.90, 95% CI ‐0.44 to 2.24; participants = 40; studies = 1), at six weeks (MD 0.70, 95% CI ‐0.29 to 1.69; participants = 40; studies = 1), and at eight weeks (MD 0.55, 95% CI ‐0.40 to 1.50; participants = 40; studies = 1). (Analysis 3.1).
3.2 Mental state
There was no clear difference observed in the 'no response' outcome of the PANSS rating scale at eight weeks (RR 1.00, 95% CI 0.16 to 6.42; participants = 40; studies = 1; Analysis 3.2). No clear differences were found as for the other dichotomous outcome (Analysis 3.3).
PANSS total endpoint scores and sub‐scale endpoint scores (positive symptoms, negative symptoms, general psychopathology) were collected at two, four, six and eight weeks. Only PANSS positive symptoms sub‐scale endpoint scores at four weeks resulted in a clear difference in favour of quetiapine (MD 1.70, 95% CI 0.01 to 3.39; participants = 40; studies = 1; Analysis 3.4).
3.3 Adverse effects
No clear differences could be observed between risperidone and quetiapine for a list of different adverse effects: blurred vision (RR 0.50, 95% CI 0.10 to 2.43; participants = 40; studies = 1; Analysis 3.5), somnolence (RR 0.60, 95% CI 0.17 to 2.18; participants = 40; studies = 1; Analysis 3.6), tachycardia (RR 4.00, 95% CI 0.49 to 32.72; participants = 40; studies = 1; Analysis 3.7), nausea and vomiting (RR 1.00, 95% CI 0.07 to 14.90; participants = 40; studies = 1; Analysis 3.8), akathisia (RR 1.67, 95% CI 0.46 to 6.06; participants = 40; studies = 1), hypermyotonia (RR 7.00, 95% CI 0.95 to 51.80; participants = 40; studies = 1; Analysis 3.9), headache (RR 1.00, 95% CI 0.16 to 6.42; participants = 40; studies = 1), liver function tests (LFTs) elevation (RR 1.00, 95% CI 0.07 to 14.90; participants = 40; studies = 1), weight gain (RR 4.00, 95% CI 0.49 to 32.72; participants = 40; studies = 1), and agitation (RR 3.50, 95% CI 0.83 to 14.83; participants = 40; studies = 1; Analysis 3.10).
4. COMPARISON 4: RISPERIDONE versus COMBINATION: a. RISPERIDONE + OXCARBAZEPINE
One study (n = 68) compared risperidone with the 'risperidone + oxcarbazepine' combination (Wang 2012).
4.1 Specific behaviour ‐ agitation
There was a clear difference in the Positive And Negative Syndrome Scale ‐ Excited Component (PANSS‐EC) endpoint scores at one week (MD 2.70, 95% CI 0.42 to 4.98; participants = 68; studies = 1; Analysis 4.1) in favour of the combination.
4.2 Global outcome
Comparison at one week in terms of Clinical Global Impression ‐ Improvement (CGI‐I) (MD ‐0.20, 95% CI ‐0.61 to 0.21; participants = 68; studies = 1) and Clinical Global Impression ‐ Severity (CGI‐S) endpoint scores (MD 0.20, 95% CI ‐0.25 to 0.65; participants = 68; studies = 1) resulted in no clear difference (Analysis 4.2).
4.3 Mental state
There was a clear difference between Brief Psychiatric Rating Scale (BPRS) endpoint scores at one week (MD 5.20, 95% CI 1.04 to 9.36; participants = 68; studies = 1) in favour of the combination (Analysis 4.5).
4.4 Adverse effects
In the combination group a total number of 47 adverse effects were registered compared to a total of 40 adverse effects in participants allocated to risperidone. (Analysis 4.6).
There was a clear difference in the number of participants experiencing excessive sedation in favour of risperidone. (RR 0.06, 95% CI 0.00 to 0.92; participants = 68; studies = 1; Analysis 4.8).
Risperidone and combination groups were comparable in terms of the number of participants that were experiencing various adverse effects at four weeks: dry mouth (RR 2.12, 95% CI 0.81 to 5.55; participants = 68; studies = 1) and constipation at four weeks (RR 1.30, 95% CI 0.62 to 2.72; participants = 68; studies = 1) (Analysis 4.7); tachycardia (RR 1.24, 95% CI 0.46 to 3.30; participants = 68; studies = 1; Analysis 4.9); nausea (RR 2.12, 95% CI 0.20 to 22.31; participants = 68; studies = 1; Analysis 4.10), extrapyramidal symptoms (EPS) (RR 1.59, 95% CI 0.49 to 5.14; participants = 68; studies = 1) and tremor (RR 0.85, 95% CI 0.25 to 2.89; participants = 68; studies = 1) (Analysis 4.11); headache (RR 0.07, 95% CI 0.00 to 1.19; participants = 68; studies = 1) and skin rash (RR 0.35, 95% CI 0.01 to 8.37; participants = 68; studies = 1) (Analysis 4.12).
5. COMPARISON 5: RISPERIDONE versus COMBINATION: b. RISPERIDONE + VALPROIC ACID
Five studies (n = 307) compared risperidone with the 'risperidone + valproic acid' combination (Jin 2013; Li 2013; Wang 2013; Yao 2010; Zhou 2013).
5.1 Specific behaviour ‐ agitation
PANSS‐EC endpoint scores were comparable between risperidone and combination at three days (MD ‐0.11, 95% CI ‐2.98 to 2.76; participants = 54; studies = 1); a clear difference in favour of the combination was identified at five days (MD 5.47, 95% CI 2.64 to 8.30; participants = 54; studies = 1) and seven days (MD 5.11, 95% CI 2.51 to 7.71; participants = 54; studies = 1; Analysis 5.1).
Endpoint scores at PANSS‐EC at two weeks (MD 0.09, 95% CI ‐0.90 to 1.08; participants = 63; studies = 1) and at four weeks (MD 0.17, 95% CI ‐0.85 to 1.19; participants = 63; studies = 1) could not show a difference between the compared drugs (Analysis 5.2).
5.2 Specific behaviour ‐ aggression
Risperidone and 'risperidone + valproic acid' combination were comparable both at three days (MD 1.07, 95% CI ‐0.20 to 2.34; participants = 54; studies = 1) and five days (MD 0.38, 95% CI ‐0.83 to 1.59; participants = 54; studies = 1) in terms of Modified Overt Aggression Scale (MOAS) endpoint scores. A clear difference in favour of the combination could be identified at seven days (MD 3.32, 95% CI 2.07 to 4.57; participants = 54; studies = 1), at two weeks (MD 1.13, 95% CI 0.23 to 2.02; participants = 128; studies = 2; I2 = 25%), at four weeks (MD 1.57, 95% CI 0.75 to 2.39; participants = 128; studies = 2; I2 = 0%), and at six weeks (MD 1.47, 95% CI 0.83 to 2.11; participants = 68; studies = 1), whilst being comparable at eight weeks (MD 1.00, 95% CI ‐0.11 to 2.11; participants = 60; studies = 1;Analysis 5.2).
5.3 Mental state
Five participants allocated to risperidone and three participants allocated to the combination showed no clinical response based on the PANSS score (< 30% reduction from baseline score) at eight weeks (RR 1.67, 95% CI 0.44 to 6.38; participants = 62; studies = 1; Analysis 5.3).
However, when looking at PANSS endpoint scores, a clear difference favouring the combination could be seen at two weeks (MD 3.48, 95% CI 1.88 to 5.08; participants = 253; studies = 4; I2 = 80%), at four weeks (MD 5.45, 95% CI 3.81 to 7.08; participants = 253; studies = 4; I2 = 70%), at six weeks (MD 9.90, 95% CI 7.42 to 12.37; participants = 130; studies = 2; I2 = 92%) and at eight weeks (MD 5.83, 95% CI 4.12 to 7.54; participants = 122; studies = 2; I2 = 58%).
High I2 values that should be translated into inconsistency of findings between the studies; data at two, four and six weeks had Chi2 P values statistically significant, showing evidence of substantial levels of heterogeneity (Assessment of heterogeneity; Section 9.5.2, Higgins 2011). We investigated for input errors and found that data were entered correctly. At the visual inspection of the forest plots we identified Wang 2013 as an outlying study for the two and four weeks pooled data analyses and removed it to see if homogeneity was restored. PANSS endpoint scores at two weeks (MD 2.50, 95% CI 0.78 to 4.21; participants = 185; studies = 3; I2 = 62%, Chi2 = 5.23, P = 0.07) showed a I2 value > 50% with a Chi2 P value non statistically significant, whilst at four weeks (MD 4.52, 95% CI 2.76 to 6.29; participants = 185; studies = 3; I2 = 21%, Chi2 = 2.55, P = 0.28) I2 value resulted being <50% accompanied by a non statistically significant Chi2 P value. Given the concordance of direction of effects, the summary effect resulting statistically significant even by removal of the outlying study, and that the relative weights of this last were 13.3% and 14.2%, (respectively, two and four weeks), we decided to present the pooled data (Subgroup analysis and investigation of heterogeneity).
Sub‐scale continuous data showed a clear difference at PANSS positive symptoms sub‐scale in favour of the combination at four weeks (MD 2.75, 95% CI 1.86 to 3.64; participants = 191; studies = 3; I2 = 76%), six weeks (MD 4.40, 95% CI 1.40 to 7.40; participants = 68; studies = 1), and eight weeks (MD 1.70, 95% CI 0.71 to 2.69; participants = 60; studies = 1), despite being comparable at two weeks (MD 0.64, 95% CI ‐0.24 to 1.53; participants = 191; studies = 3; I2 = 81%; Analysis 5.4).
Again, we investigated for input errors and that data were entered correctly. At the visual inspection of the graphs, Li 2013 could be identified as an hypothetical outlying study. By removing it, I2 values resulted < 50% and Chi2 P values resulted non statistically significant (two weeks: I2 = 2%, Chi2 = 1.02, P = 0.31; four weeks: I2 = 0%, Chi2 = 0.36, P = 0.55). Given the relative weights of the outlying study being 68.8% at two weeks and 69.8% at four weeks, we decided not to consider pooled data and wait for more studies and data.
PANSS negative symptoms sub‐scale could not show clear differences at two weeks (MD 0.29, 95% CI ‐0.57 to 1.15; participants = 128; studies = 2; I2 = 65%), four weeks (MD 1.23, 95% CI ‐0.16 to 2.62; participants = 128; studies = 2; I2 = 59%), and eight weeks (MD 1.30, 95% CI ‐0.02 to 2.62; participants = 60; studies = 1); a clear difference was observed at six weeks only, favouring the combination (MD 3.80, 95% CI 1.07 to 6.53; participants = 68; studies = 1).
PANSS general psychopathology sub‐scale showed clear differences in favour of the combination at four weeks (MD 1.14, 95% CI 0.04 to 2.23; participants = 128; studies = 2; I2 = 50%), six weeks (MD 6.50, 95% CI 4.06 to 8.94; participants = 68; studies = 1), and eight weeks (MD 1.60, 95% CI 0.43 to 2.77; participants = 60; studies = 1); at two weeks data did not show a clear difference between the compared drugs (MD 0.93, 95% CI ‐0.07 to 1.93; participants = 128; studies = 2; I2 = 66%) (Analysis 5.4).
5.4 Adverse effects
In the combination group a total number of 20 adverse effects were registered, compared to the 16 total adverse effects experienced by participants allocated to risperidone (Analysis 5.5).
Two participants allocated to risperidone and one allocated to the combination suffered from myocardial ischaemia (RR 2.00, 95% CI 0.19 to 20.93; participants = 62; studies = 1; Analysis 5.6).
Risperidone and combination groups resulted in comparable in terms of probability of experiencing blurred vision (RR 1.00, 95% CI 0.37 to 2.68; participants = 122; studies = 2; I2 = 0%), dry mouth (RR 1.64, 95% CI 0.76 to 3.54; participants = 129; studies = 2; I2 = 78%; Analysis 5.7); insomnia (RR 2.00, 95% CI 0.19 to 20.77; participants = 54; studies = 1), somnolence (RR 0.85, 95% CI 0.44 to 1.63; participants = 121; studies = 2; I2 = 0%; Analysis 5.8); decreased blood pressure (RR 0.75, 95% CI 0.18 to 3.10; participants = 68; studies = 1), tachycardia (RR 1.48, 95% CI 0.83 to 2.67; participants = 251; studies = 4; I2 = 35%), T‐wave changes in ECG (RR 2.00, 95% CI 0.19 to 20.77; participants = 54; studies = 1; Analysis 5.9); constipation (RR 1.11, 95% CI 0.70 to 1.76; participants = 189; studies = 3; I2 = 6%), nausea (RR 0.70, 95% CI 0.29 to 1.71; participants = 122; studies = 2; I2 = 0%; Analysis 5.10); EPS (RR 1.35, 95% CI 0.76 to 2.39; participants = 121; studies = 2; I2 = 91%), akathisia (RR 0.75, 95% CI 0.28 to 2.03; participants = 122; studies = 2; I2 = 0%), tremor (RR 1.20, 95% CI 0.40 to 3.56; participants = 68; studies = 1; Analysis 5.11); headache (RR 0.94, 95% CI 0.53 to 1.68; participants = 243; studies = 4; I2 = 0%), weight gain (RR 1.50, 95% CI 0.47 to 4.78; participants = 60; studies = 1), oedema (RR 0.34, 95% CI 0.01 to 8.13; participants = 63; studies = 1), leukopenia (RR 0.34, 95% CI 0.01 to 8.13; participants = 63; studies = 1), and liver function tests elevation (RR 0.60, 95% CI 0.15 to 2.40; participants = 116; studies = 2; I2 = 0%; Analysis 5.13).
Treatment Emergent Symptom Scale (TESS) endpoint scores did not find a clear difference in movement disorders between the compared groups at three days (MD ‐0.04, 95% CI ‐1.35 to 1.27; participants = 54; studies = 1), five days (MD ‐0.11, 95% CI ‐1.55 to 1.33; participants = 54; studies = 1), and at seven days (MD ‐0.51, 95% CI ‐1.88 to 0.86; participants = 54; studies = 1; Analysis 5.12).
5.5 Leaving the study early
Two participants allocated to the combination and none of those allocated to risperidone left the study early due to adverse effects (RR 0.21, 95% CI 0.01 to 4.13; participants = 63; studies = 1; Analysis 5.14).
Discusión
Resumen de los resultados principales
1. COMPARACIÓN 1: RISPERIDONA versus OTRO ANTIPSICÓTICO: a. HALOPERIDOL
Se incluyeron dos estudios (Lim 2010; Walther 2014),con un número total de 152 participantes (risperidona, n = 76; haloperidol, n = 76); aunque hubo dos posibles fuentes de datos disponibles, solo un resultado se pudo beneficiar de ambas ("abandono temprano del estudio"). Se esperaba encontrar más estudios relevantes porque el haloperidol tiene una función histórica en los estudios de investigación de desarrollo de fármacos y todavía es posible que se señale como el "comparador habitual" al diseñar los ensayos controlados aleatorios (ECA). Además, los resultados disponibles se consideraron de muy baja calidad (Tabla 1 Resumen de los hallazgos), debido al alto riesgo de sesgo de desgaste e "informe selectivo", el tamaño pequeño de la muestra y la falta de direccionalidad de las medidas de resultado. No hubo datos disponibles en cuanto a los resultados "tranquilización o adormecimiento", necesidad repetida de tranquilización y económicos.
1.1 Agitación, resultado global
Risperidona y haloperidol mostraron resultados similares en las escalas de medición de la agitación y en resultados globales como la necesidad de benzodiazepinas, necesidad de cuartos de aislamiento o uso de restricciones.
Es interesante señalar que los datos dicotómicos sobre los resultados de eficacia no proporcionaron evidencia sólida de una diferencia entre la administración de risperidona oral y de haloperidol intramuscular; incluso si se necesita evidencia de más alta calidad para establecer cualquier conclusión firme, la preferencia y el mejor interés de los pacientes se debe considerar cuando se toman decisiones sobre el tratamiento al aplicar un tratamiento adaptado.
1.2 Efectos adversos
Los análisis no proporcionaron evidencia sólida de que la intervención produjo diferencias en cuanto a los efectos adversos.
1.3 Abandono temprano del estudio
Un número equivalente de participantes asignados a risperidona o haloperidol abandonó el estudio temprano.
2. COMPARACIÓN 2: RISPERIDONA versus OTRO ANTIPSICÓTICO: b. OLANZAPINA
Solo se incluyó un estudio (Walther 2014), con un número total de 29 participantes (risperidona, n = 14; olanzapina, n = 15). Debido al alto riesgo de sesgo de desgaste e "informe selectivo", el tamaño pequeño de la muestra y la falta de direccionalidad de las medidas de resultado, los resultados disponibles se consideraron de muy baja calidad (Tabla 2 Resumen de los hallazgos). No hubo datos disponibles sobre los resultados "tranquilización o adormecimiento", necesidad repetida de tranquilización rápida y económicos.
Los análisis no proporcionaron evidencia sólida de que la risperidona tiene un efecto diferente al de la olanzapina en ninguno de los resultados considerados: "comportamiento específico ‐ agitación", "resultado global", "efectos adversos", "abandono temprano del estudio".
3. COMPARACIÓN 3: RISPERIDONA versus OTRO ANTIPSICÓTICO: c. QUETIAPINA
Solo se incluyó un estudio (Dai 2012), con un número total de 40 participantes (risperidona, n = 20; quetiapina, n = 20). Debido al tamaño pequeño de la muestra y a la falta de direccionalidad de las medidas de resultado, los resultados disponibles se consideraron de muy baja calidad (Tabla 3 Resumen de los hallazgos). No hubo datos disponibles sobre los resultados "tranquilización o adormecimiento", necesidad repetida de tranquilización rápida, "estado global" y económicos. No hubo datos disponibles sobre el aspecto "tranquilización rápida": el primer punto temporal en el que se recogieron datos fue a las dos semanas.
Los análisis de los datos no proporcionaron evidencia sólida de que la risperidona tiene un efecto clínica y significativamente diferente de la quetiapina en casi todos los resultados: "comportamiento específico ‐ agresión", "estado mental", "efectos adversos".
4. COMPARACIÓN 4: RISPERIDONA versus COMBINACIÓN: a. RISPERIDONA + OXCARBAZEPINA
Solo se incluyó un estudio (Wang 2012), con un número total de 68 participantes (risperidona, n = 33; risperidona + oxcarbazepina, n = 35). Debido al alto riesgo de sesgo de realización y de detección, el tamaño pequeño de la muestra y la falta de direccionalidad de las medidas de resultado, los resultados disponibles se consideraron de muy baja calidad (tabla 4 Resumen de los hallazgos); no hubo datos disponibles en cuanto a los resultados "tranquilización o adormecimiento", necesidad repetida de tranquilización y económicos.
4.1 Agitación, resultado global, estado mental
En cuanto a los resultados disponibles "agitación" y "estado mental" (puntuaciones finales de las PANSS‐CE y BPRS, respectivamente), fue posible encontrar evidencia de diferencias a favor de la combinación, sin evidencia sólida de diferencias en el "resultado global". Sin embargo, se debe señalar que los datos disponibles se recopilaron a los siete días, un momento demasiado tardío para que fuera informativo con respecto al aspecto "tranquilización rápida". Además, la calidad de la evidencia fue muy baja debido a los riesgos ya mencionados.
4.2 Efectos adversos
Se encontró evidencia de muy baja calidad de que la combinación "risperidona + oxcarbazepina" produjo un número mayor de eventos adversos de "sedación excesiva" (ocurrieron cero eventos en el grupo de risperidona, aunque se informaron nueve eventos en el grupo de combinación; Análisis 4.8). Es interesante señalar que, debido a que no hay detalles adicionales sobre los datos y los últimos no se obtuvieron en múltiples puntos temporales, no fue posible excluir que esta evidencia sea solo otra manera de leer una eficacia mayor (Análisis 4.1; Análisis 4.5).
El concepto ideal de "tranquilización" es encontrar una manera para conseguir calmar a los pacientes sin causar sedación. Aunque esto último podría ser necesario en las primeras horas, puede no estar justificado en los días posteriores (si no ocurren otros episodios de agresión o agitación).
No fue posible observar evidencia sólida de ninguna diferencia en cuanto a los otros eventos adversos recogidos.
5. COMPARACIÓN 5: RISPERIDONA versus COMBINACIÓN: b. RISPERIDONA + ÁCIDO VALPROICO
Se incluyeron cinco estudios (Jin 2013; Li 2013; Wang 2013; Yao 2010; Zhou 2013), con un número total de 307 participantes (risperidona, n = 153; risperidona + ácido valproico, n = 154). Los resultados disponibles se consideraron de muy baja calidad (Tabla 5 Resumen de los hallazgos), debido al tamaño pequeño de la muestra y a la falta de direccionalidad de las medidas de resultado. No hubo datos disponibles en cuanto a los resultados "tranquilización o adormecimiento", necesidad repetida de tranquilización y económicos.
5.1 Agitación, agresión
Al igual que en los resultados de eficacia disponibles sobre la agitación, los análisis de los datos continuos no proporcionaron evidencia sólida de eficacia diferente entre la risperidona y la combinación "risperidona + ácido valproico" a los tres días; cuando el análisis se centró en puntos temporales más tardíos fue posible observar una diferencia clara a favor de la combinación a los cinco y a los siete días, pero no a las dos y a las cuatro semanas.
En cuanto a los datos continuos sobre la agresión, fue posible observar una diferencia clara a favor de la combinación a los cinco y a los siete días, y a las dos, cuatro y seis semanas. Sin embargo, se deben tener en cuenta la diferencia de medias (DM) y los valores del intervalo de confianza (IC) para evaluar la significación clínica. No fue posible proporcionar evidencia sólida de ninugna diferencia entre los fármacos en comparación a las ocho semanas.
5.2 Estado mental
Fue posible observar evidencia de muy baja calidad de una diferencia clara en las puntuaciones finales de la PANSS que favorecen la combinación (se realizaron análisis de subgrupos para los datos de las puntuaciones finales de la PANSS a las dos y a las cuatro semanas); lo anterior fue válido para los puntos temporales más tardíos (principalmente a las seis y ocho semanas) de las subescalas de los síntomas positivos, los síntomas negativos y la psicopatología general; No fue posible agrupar las puntuaciones finales de la subescala de síntomas positivos de la PANSS a las dos y a las cuatro semanas debido a la alta heterogeneidad.
Se debe destacar, sin embargo, que la medición de los datos disponibles se hizo a partir de la segunda semana: no fue posible encontrar evidencia con respecto a los puntos temporales relevantes para el aspecto "tranquilización rápida".
5.3 Efectos adversos
Los análisis de los datos no proporcionan evidencia sólida de ninguna diferencia en cuanto a los efectos adversos entre la risperidona y la combinación "risperidona + ácido valproico". Sin embargo, en un estudio (Yao 2010) se observaron tres episodios de isquemia miocárdica: no fue posible encontrar una asociación entre la administración del fármaco y el evento en los artículos relevantes, ni más información acerca del riesgo cardiovascular inicial (probablemente no fue alto porque el rango de edad de los participantes reclutados en el estudio estuvo entre 17 y 42 años, con una edad promedio de 26,9 años).
5.4 Abandono temprano del estudio
No fue posible observar evidencia sólida de cualquier diferencia en cuanto al resultado "abandono temprano del estudio".
Compleción y aplicabilidad general de las pruebas
1. Completitud
Se identificaron nueve estudios relevantes y todos informaron solo unos pocos resultados: solo dos comparaciones se pudieron beneficiar de más de un estudio como fuente de los datos y, aún más sorprendente, para la comparación de haloperidol lo anterior fue válido solo para un único resultado; la comparación más representada es la que comparó risperidona con la combinación "risperidona + ácido valproico" (cinco estudios). Ningún estudio informó datos con respecto al resultado "tranquilización o adormecimiento", los resultados del servicio, la satisfacción con el tratamiento, la aceptación del tratamiento, la calidad de vida ni los resultados económicos. Tres estudios incluidos presentaron sesgo de "informe selectivo", lo que limitó de manera adicional los datos disponibles. Los protocolos no estuvieron disponibles para los estudios incluidos.
2. Aplicabilidad
Todos los estudios incluidos fueron más de tipo explicativo que de tipo práctico/pragmático y fácilmente aplicables a la práctica del mundo real (Thorpe 2009).
Los estudios incluidos se realizaron en tres países diferentes (China, siete; Corea, uno; Suiza, uno) y en contextos de enfermos psiquiátricos hospitalizados e ingreso de urgencia.
La tranquilización rápida a menudo se utiliza para lograr una resolución rápida de dicho estado clínico que de otro modo podría dar lugar a lesión del propio paciente o a otros, y que por lo tanto evita la restricción física prolongada de los pacientes, que se debe ver como el último recurso disponible. Por lo tanto, es sorprendente y decepcionante que pocos estudios midieran los resultados agitación y agresión en puntos temporales que se asociarían con "tranquilización rápida". El primer punto temporal disponible es a las dos horas (Walther 2014), y siete estudios establecieron puntos temporales mayores de 24 horas (tres días, Zhou 2013; una semana, Wang 2012; dos semanas, Dai 2012; Jin 2013; Li 2013; Wang 2013; Yao 2010). En Lim 2010 se señala que los resultados se midieron tan temprano como a los 30 minutos pero, desafortunadamente, solo se proporcionaron mediciones a las 24 horas.
Calidad de la evidencia
1. Generales
Todos los estudios incluidos se publicaron después de la primera guía http://www.consort‐statement.org (1996); ningún estudio cumplió con esta guía internacionalmente acordada. Fue decepcionante comprobar que una gran parte de los datos no fueron utilizables, lo que se podría haber evitado si los ensayos se hubieran informado mejor.
2. Específicas
Los nueve estudios fueron aleatorios, pero los detalles se informaron de manera poco precisa y ninguno fue doble ciego. Tres estudios presentaron sesgo de "informe selectivo". Los datos de más de una fuente solo estuvieron disponibles para dos comparaciones. Estos factores limitan firmemente la calidad de la evidencia disponible, lo que se puede evidenciar en las tablas "Riesgo de sesgo" y "Resumen de los hallazgos"; todos los resultados seleccionados para ser incluidos en la tabla "Resumen de los hallazgos" se consideraron de calidad "muy baja".
Sesgos potenciales en el proceso de revisión
Se siguió el protocolo, se realizó una búsqueda minuciosa y hubo adherencia a los criterios de inclusión y exclusión preespecificados cuando se inspeccionaron las citas. Es posible que no se haya logrado identificar estudios relevantes pequeños, pero se considera que es poco probable que se hayan pasado por alto estudios grandes que lograrían una diferencia significativa en los resultados de esta revisión. Debido al escaso número de estudios incluidos, los autores de la revisión EGO y MH inspeccionaron de manera independiente todas las citas obtenidas a partir de la búsqueda y extrajeron los datos para disminuir el sesgo.
Con el objetivo de limitar de manera adicional el riesgo de posibles sesgos y mejorar la calidad general del trabajo, se siguieron las recomendaciones del Programa de Cribado de la Unidad Editorial Cochrane (Cochrane Editorial Unit [CEU] Screening Programme) del Dr. Nuala Livingstone y las Expectativas Metodológicas de las Revisiones Cochrane de Intervenciones (Methodological Expectations of Cochrane Intervention Reviews) (MECIR; Higgins 2016); la revisión sistemática se verificó mediante el uso de los ítems de la Herramienta de Cribado de la CEU (CEU Screening Tool). Los estudios previamente excluidos se verificaron para la presencia de sesgo de exclusión NROD (por sus siglas en inglés) (sin sesgo de exclusión de datos de resultado relevantes; Higgins 2016; Kirkham 2010): se recuperó un estudio.
Acuerdos y desacuerdos con otros estudios o revisiones
Los autores de la revisión no conocen ningún otro estudio ni revisión sistemática que se haya centrado exclusivamente en la administración de risperidona sola para los pacientes que presentan agitación o agresión debido a enfermedades mentales graves.

Search results ‐ up to April 2017
'Risk of bias' graph: review authors' judgements about each risk of bias item presented as percentages across all included studies.
'Risk of bias' summary: review authors' judgements about each risk of bias item for each included study.

Comparison 1 RISPERIDONE vs OTHER ANTIPSYCHOTIC: a. HALOPERIDOL, Outcome 1 Specific behaviour: 1a. Agitation ‐ Various measures.

Comparison 1 RISPERIDONE vs OTHER ANTIPSYCHOTIC: a. HALOPERIDOL, Outcome 2 Specific behaviour: 1b. Agitation ‐ Average scores ‐ i. up to 2 hours.

Comparison 1 RISPERIDONE vs OTHER ANTIPSYCHOTIC: a. HALOPERIDOL, Outcome 3 Specific behaviour: 1c. Agitation ‐ Average scores ‐ ii. up to 24 hours.

Comparison 1 RISPERIDONE vs OTHER ANTIPSYCHOTIC: a. HALOPERIDOL, Outcome 4 Specific behaviour: 1d. Agitation ‐ Average scores ‐ iii. over 24 hours.

Comparison 1 RISPERIDONE vs OTHER ANTIPSYCHOTIC: a. HALOPERIDOL, Outcome 5 Global outcome: 1a. General ‐ Need for additional measures.
| Study | Intervention | Mean | SD | N |
| Walther 2014 | Risperidone | 92.9 | 86.8 | 14 |
| Walther 2014 | Haloperidol | 71.1 | 70.4 | 14 |
Comparison 1 RISPERIDONE vs OTHER ANTIPSYCHOTIC: a. HALOPERIDOL, Outcome 6 Global outcome: 1b. General ‐ Need for additional medication (skewed data).

Comparison 1 RISPERIDONE vs OTHER ANTIPSYCHOTIC: a. HALOPERIDOL, Outcome 7 Adverse effects: 1. General.

Comparison 1 RISPERIDONE vs OTHER ANTIPSYCHOTIC: a. HALOPERIDOL, Outcome 8 Adverse effects: 2a. Specific ‐ Arousal level.

Comparison 1 RISPERIDONE vs OTHER ANTIPSYCHOTIC: a. HALOPERIDOL, Outcome 9 Adverse effects: 2b. Specific ‐ Movement disorder ‐ i. Various.
| Study | Intervention | Mean | SD | N |
| Walther 2014 | Risperidone | 4.1 | 7.3 | 14 |
| Walther 2014 | Haloperidol | 5.2 | 8.3 | 14 |
Comparison 1 RISPERIDONE vs OTHER ANTIPSYCHOTIC: a. HALOPERIDOL, Outcome 10 Adverse effects: 2b. Specific ‐ Movement disorder ‐ ii. Need for biperiden.

Comparison 1 RISPERIDONE vs OTHER ANTIPSYCHOTIC: a. HALOPERIDOL, Outcome 11 Adverse effects: 2b. Specific ‐ Movement disorder ‐ iii. Average scores (skewed data).

Comparison 1 RISPERIDONE vs OTHER ANTIPSYCHOTIC: a. HALOPERIDOL, Outcome 12 Adverse effects: 2c. Specific ‐ Miscellaneous.

Comparison 1 RISPERIDONE vs OTHER ANTIPSYCHOTIC: a. HALOPERIDOL, Outcome 13 Leaving the study early.

Comparison 2 RISPERIDONE vs OTHER ANTIPSYCHOTIC: b. OLANZAPINE, Outcome 1 Specific behaviour: 1. Agitation ‐ Average scores ‐ i. Up to 2 hours.
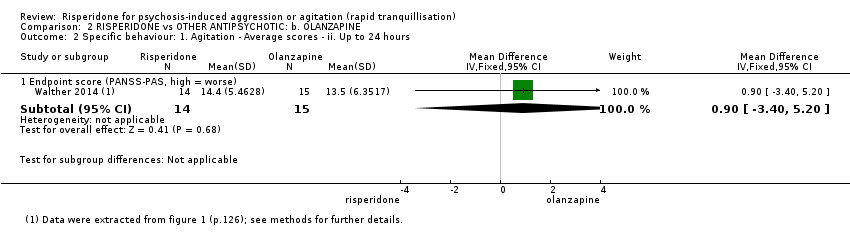
Comparison 2 RISPERIDONE vs OTHER ANTIPSYCHOTIC: b. OLANZAPINE, Outcome 2 Specific behaviour: 1. Agitation ‐ Average scores ‐ ii. Up to 24 hours.
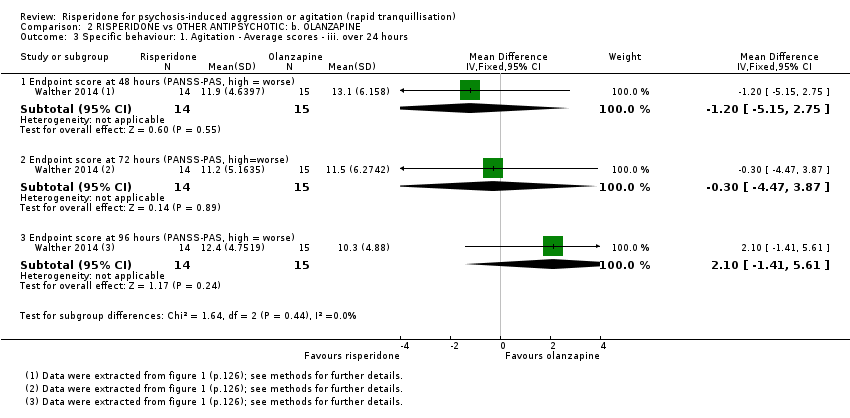
Comparison 2 RISPERIDONE vs OTHER ANTIPSYCHOTIC: b. OLANZAPINE, Outcome 3 Specific behaviour: 1. Agitation ‐ Average scores ‐ iii. over 24 hours.

Comparison 2 RISPERIDONE vs OTHER ANTIPSYCHOTIC: b. OLANZAPINE, Outcome 4 Global outcome: 1a. General ‐ Need for additional measures.
| Study | Intervention | Mean | SD | N |
| Walther 2014 | Risperidone | 92.9 | 86.8 | 14 |
| Walther 2014 | Olanzapine | 114.0 | 79.5 | 15 |
Comparison 2 RISPERIDONE vs OTHER ANTIPSYCHOTIC: b. OLANZAPINE, Outcome 5 Global outcome: 1b. General ‐ Need for additional medication (skewed data).
| Study | Intervention | Mean | SD | N |
| Walther 2014 | Risperidone | 4.1 | 7.3 | 14 |
| Walther 2014 | Olanzapine | 0.7 | 2.6 | 15 |
Comparison 2 RISPERIDONE vs OTHER ANTIPSYCHOTIC: b. OLANZAPINE, Outcome 6 Adverse effects: 1a. Specific ‐ Movement disorder ‐ i. Meed for biperiden.

Comparison 2 RISPERIDONE vs OTHER ANTIPSYCHOTIC: b. OLANZAPINE, Outcome 7 Adverse effects: 1b. Specific ‐ Movement disorder ‐ ii. Average scores (skewed data).

Comparison 2 RISPERIDONE vs OTHER ANTIPSYCHOTIC: b. OLANZAPINE, Outcome 8 Leaving the study early.

Comparison 3 RISPERIDONE vs OTHER ANTIPSYCHOTIC: c. QUETIAPINE, Outcome 1 Specific behaviour: 1. Aggression ‐ Average scores ‐ i. Over 24 hours.

Comparison 3 RISPERIDONE vs OTHER ANTIPSYCHOTIC: c. QUETIAPINE, Outcome 2 Mental state: 1a. No change in general mental state.
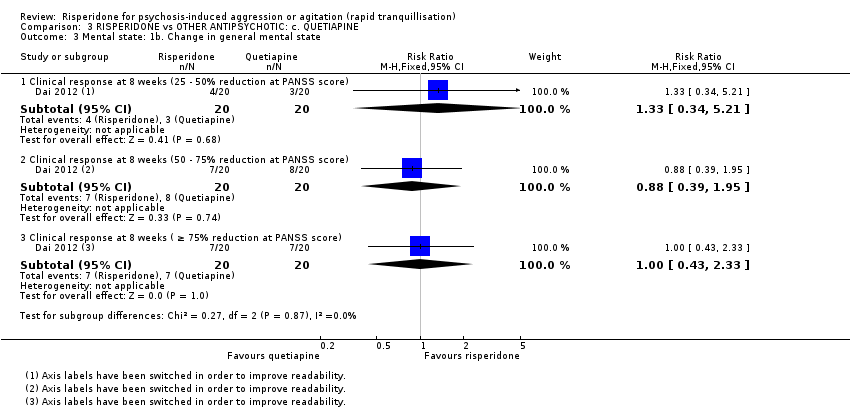
Comparison 3 RISPERIDONE vs OTHER ANTIPSYCHOTIC: c. QUETIAPINE, Outcome 3 Mental state: 1b. Change in general mental state.
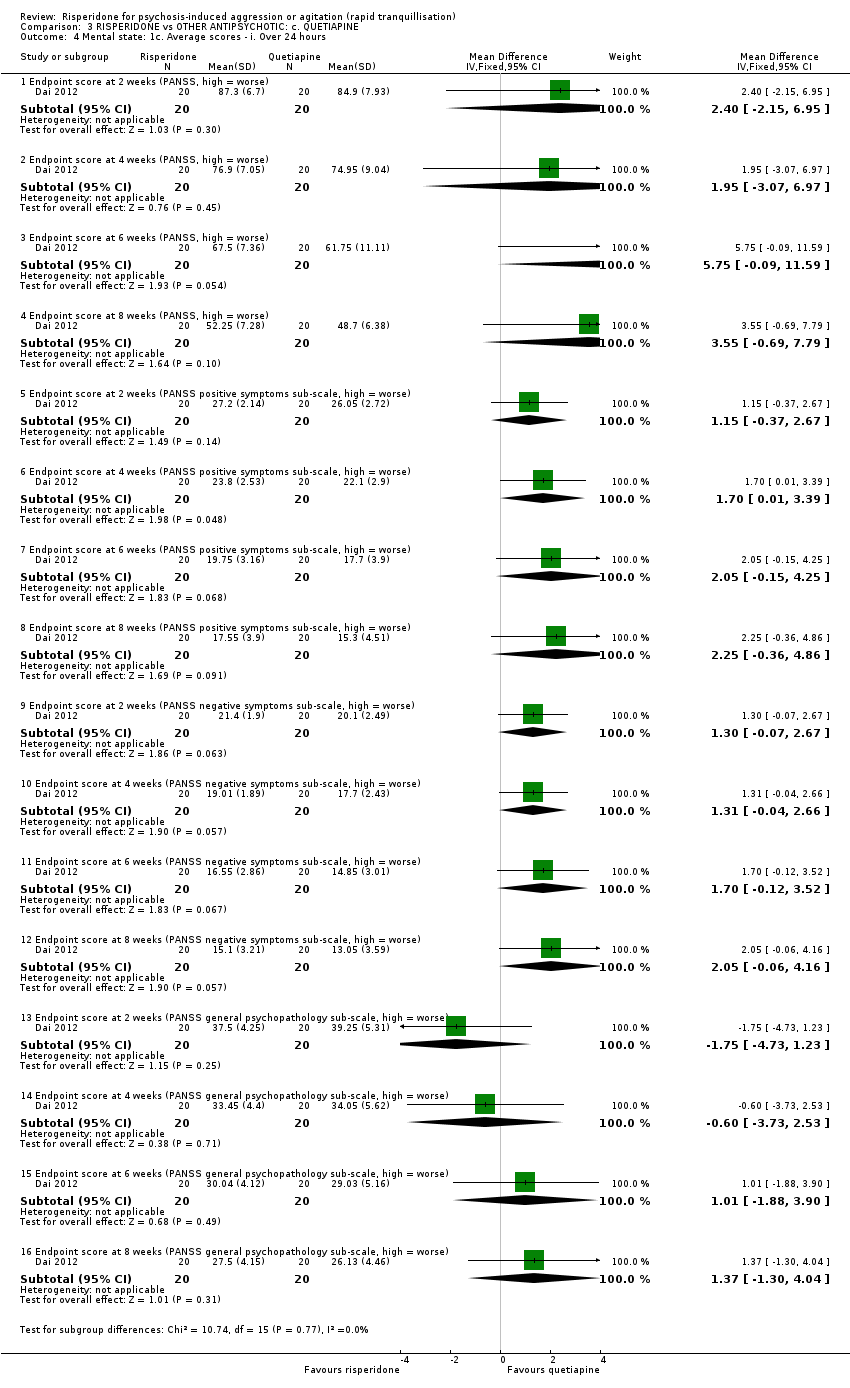
Comparison 3 RISPERIDONE vs OTHER ANTIPSYCHOTIC: c. QUETIAPINE, Outcome 4 Mental state: 1c. Average scores ‐ i. Over 24 hours.

Comparison 3 RISPERIDONE vs OTHER ANTIPSYCHOTIC: c. QUETIAPINE, Outcome 5 Adverse effects: 1a. Specific ‐ Anticholinergic.

Comparison 3 RISPERIDONE vs OTHER ANTIPSYCHOTIC: c. QUETIAPINE, Outcome 6 Adverse effects: 1b. Specific ‐ Arousal.

Comparison 3 RISPERIDONE vs OTHER ANTIPSYCHOTIC: c. QUETIAPINE, Outcome 7 Adverse effects: 1c. Specific ‐ Cardiovascular.

Comparison 3 RISPERIDONE vs OTHER ANTIPSYCHOTIC: c. QUETIAPINE, Outcome 8 Adverse effects: 1d. Specific ‐ Gastrointestinal.

Comparison 3 RISPERIDONE vs OTHER ANTIPSYCHOTIC: c. QUETIAPINE, Outcome 9 Adverse effects: 1e. Specific ‐ Movement disorders.

Comparison 3 RISPERIDONE vs OTHER ANTIPSYCHOTIC: c. QUETIAPINE, Outcome 10 Adverse effects: 1f. Specific ‐ Miscellaneous.

Comparison 4 RISPERIDONE vs COMBINATION: a. RISPERIDONE + OXCARBAZEPINE, Outcome 1 Specific behaviour: 1. Agitation ‐ Average scores ‐ i. over 24 hours.

Comparison 4 RISPERIDONE vs COMBINATION: a. RISPERIDONE + OXCARBAZEPINE, Outcome 2 Global Outcome: 1. Average scores ‐ i. Over 24 hours.

Comparison 4 RISPERIDONE vs COMBINATION: a. RISPERIDONE + OXCARBAZEPINE, Outcome 3 Mental state: 1a. No change in general mental state.

Comparison 4 RISPERIDONE vs COMBINATION: a. RISPERIDONE + OXCARBAZEPINE, Outcome 4 Mental state: 1b. Change in general mental state.

Comparison 4 RISPERIDONE vs COMBINATION: a. RISPERIDONE + OXCARBAZEPINE, Outcome 5 Mental state: 1c. Average scores ‐ i. Over 24 hours.
| Study | AEs (n), risperidone | patients (n), risperidone | AEs (n), combination | patients (n), combination |
| Wang 2012 | 40 | 33 | 47 | 35 |
Comparison 4 RISPERIDONE vs COMBINATION: a. RISPERIDONE + OXCARBAZEPINE, Outcome 6 Adverse effects: 1. General ‐ Total number of AEs.

Comparison 4 RISPERIDONE vs COMBINATION: a. RISPERIDONE + OXCARBAZEPINE, Outcome 7 Adverse effects: 2a. Specific ‐ Anticholinergic.

Comparison 4 RISPERIDONE vs COMBINATION: a. RISPERIDONE + OXCARBAZEPINE, Outcome 8 Adverse effects: 2b. Specific ‐ Arousal.

Comparison 4 RISPERIDONE vs COMBINATION: a. RISPERIDONE + OXCARBAZEPINE, Outcome 9 Adverse effects: 2c. Specific ‐ Cardiovascular.

Comparison 4 RISPERIDONE vs COMBINATION: a. RISPERIDONE + OXCARBAZEPINE, Outcome 10 Adverse effects: 2d. Specific ‐ Gastrointestinal.

Comparison 4 RISPERIDONE vs COMBINATION: a. RISPERIDONE + OXCARBAZEPINE, Outcome 11 Adverse effects: 2e. Specific ‐ Movement disorders.

Comparison 4 RISPERIDONE vs COMBINATION: a. RISPERIDONE + OXCARBAZEPINE, Outcome 12 Adverse effects: 2f. Specific ‐ Miscellaneous.
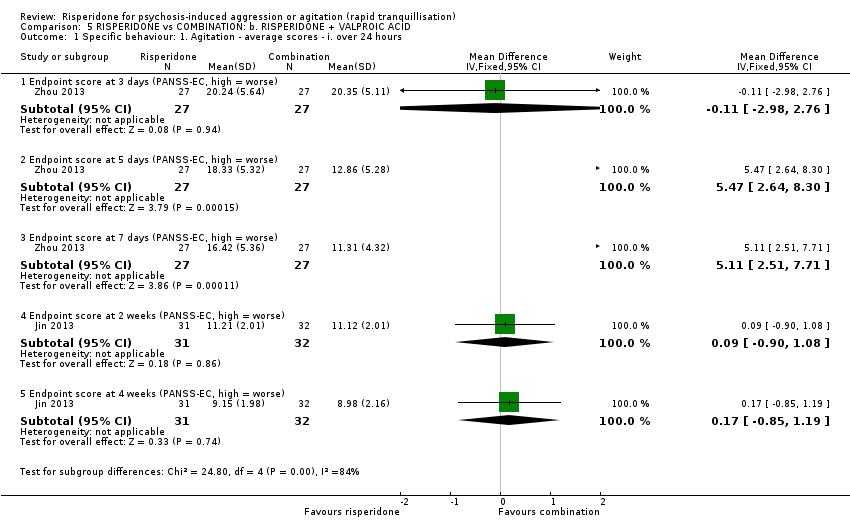
Comparison 5 RISPERIDONE vs COMBINATION: b. RISPERIDONE + VALPROIC ACID, Outcome 1 Specific behaviour: 1. Agitation ‐ average scores ‐ i. over 24 hours.

Comparison 5 RISPERIDONE vs COMBINATION: b. RISPERIDONE + VALPROIC ACID, Outcome 2 Specific behaviour: 1. Aggression ‐ Average scores ‐ i. over 24 hours.

Comparison 5 RISPERIDONE vs COMBINATION: b. RISPERIDONE + VALPROIC ACID, Outcome 3 Mental state: 1. No change in general mental state.

Comparison 5 RISPERIDONE vs COMBINATION: b. RISPERIDONE + VALPROIC ACID, Outcome 4 Mental state: 2. Average scores ‐ i. over 24 hours.
| Study | AEs (n), risperidone | patients (n), risperidone | AEs (n), combination | patients (n), combination |
| Wang 2012 | 16 | 27 | 20 | 27 |
Comparison 5 RISPERIDONE vs COMBINATION: b. RISPERIDONE + VALPROIC ACID, Outcome 5 Adverse effects: 1a. General ‐ Total number of AEs.

Comparison 5 RISPERIDONE vs COMBINATION: b. RISPERIDONE + VALPROIC ACID, Outcome 6 Adverse effects: 1b. General ‐ Serious.

Comparison 5 RISPERIDONE vs COMBINATION: b. RISPERIDONE + VALPROIC ACID, Outcome 7 Adverse effects: 2a. Specific ‐ Anticholinergic.

Comparison 5 RISPERIDONE vs COMBINATION: b. RISPERIDONE + VALPROIC ACID, Outcome 8 Adverse effects: 2b. Specific ‐ Arousal.

Comparison 5 RISPERIDONE vs COMBINATION: b. RISPERIDONE + VALPROIC ACID, Outcome 9 Adverse effects: 2c. Specific ‐ Cardiovascular.

Comparison 5 RISPERIDONE vs COMBINATION: b. RISPERIDONE + VALPROIC ACID, Outcome 10 Adverse effects: 2d. Specific ‐ Gastrointestinal.

Comparison 5 RISPERIDONE vs COMBINATION: b. RISPERIDONE + VALPROIC ACID, Outcome 11 Adverse effects: 2e. Specific ‐ Movement disorders.

Comparison 5 RISPERIDONE vs COMBINATION: b. RISPERIDONE + VALPROIC ACID, Outcome 12 Adverse effects: 2f. Specific ‐ Movement disorders ‐ Average scores ‐ i. Over 24 hours.
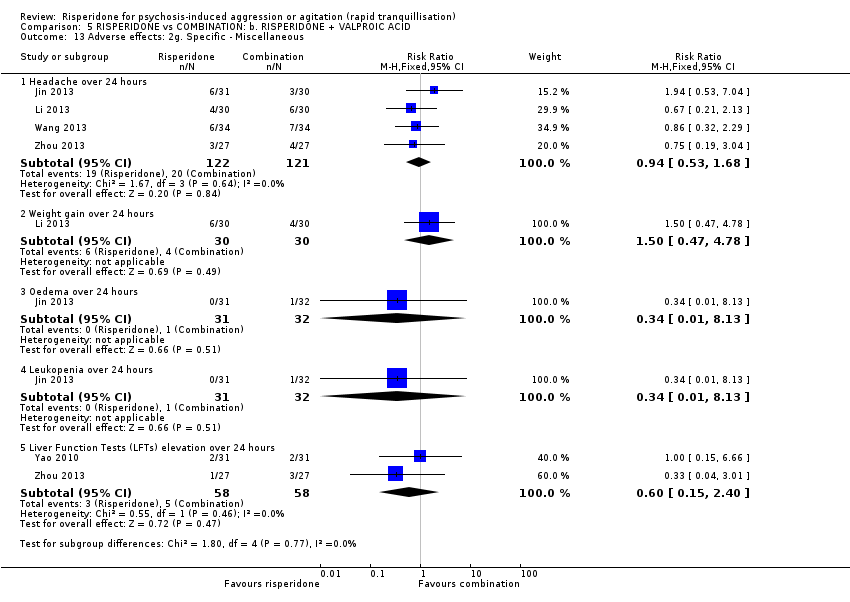
Comparison 5 RISPERIDONE vs COMBINATION: b. RISPERIDONE + VALPROIC ACID, Outcome 13 Adverse effects: 2g. Specific ‐ Miscellaneous.

Comparison 5 RISPERIDONE vs COMBINATION: b. RISPERIDONE + VALPROIC ACID, Outcome 14 Leaving the study early.
| Methods | Allocation: randomised, clearly described and concealed. |
| Participants | Diagnosis: thought to be psychosis. |
| Interventions | 1. Risperidone: dose flexible within recommended limits. N = 150. |
| Outcomes | All outcomes are grouped by time: by 30 minutes, up to two hours, up to four hours, up to 24 hours, and over 24 hours. First outcome of interest could be as early as 20 minutes. Tranquillisation or asleep ‐ tranquil; asleep. Repeated need for tranquillisation ‐ needing additional injections. Specific behaviours ‐ self‐harm, including suicide, injury to others. Global outcomes ‐ patient satisfaction; use of restraint or seclusion. Service outcomes ‐ length of hospitalisation; readmission rate. Mental state ‐ effect of medication on mental state. Adverse effects ‐ medication significant side effects. Leaving the study early ‐ detailed reasons provided. Quality of life outcomes. Economic outcomes. |
| Notes | * Enough power to be able to identify a difference of ˜20% between groups for primary outcome with adequate degree of certainty. |
| RISPERIDONE compared to OTHER ANTIPSYCHOTIC: a. HALOPERIDOL for psychosis‐induced aggression or agitation (rapid tranquillisation) | ||||||
| Patient or population: psychosis‐induced aggression or agitation (rapid tranquillisation) | ||||||
| Outcomes | Anticipated absolute effects* (95% CI) | Relative effect | № of participants | Quality of the evidence | Comments | |
| Risk with OTHER ANTIPSYCHOTIC: a. HALOPERIDOL | Risk with RISPERIDONE | |||||
| Tranquillisation or asleep by 30 minutes ‐ not measured | ‐ | ‐ | ‐ | ‐ | ‐ | |
| Repeated need for tranquillisation within 24 hours ‐ not measured | ‐ | ‐ | ‐ | ‐ | ‐ | |
| Specific behaviour: agitation, up to 24 hours (PANSS‐PAS response) | Study population | RR 1.04 | 124 | ⊕⊝⊝⊝ | ||
| 758 per 1.000 | 788 per 1.000 | |||||
| Global outcome: need for additional measures | Study population | RR 2.00 | 28 | ⊕⊝⊝⊝ | ||
| 143 per 1.000 | 286 per 1.000 | |||||
| Adverse effects: up to 24 hours | Study population | RR 0.94 | 124 | ⊕⊝⊝⊝ | ||
| 290 per 1.000 | 273 per 1.000 | |||||
| Economic outcomes ‐ not measured | ‐ | ‐ | ‐ | ‐ | ‐ | |
| *The risk in the intervention group (and its 95% confidence interval) is based on the assumed risk in the comparison group and the relative effect of the intervention (and its 95% CI). | ||||||
| GRADE Working Group grades of evidence | ||||||
| 1 Risk of bias ‐ rated 'very serious': high risk of performance and 'selective reporting' bias. Definition of the outcomes are not consistent between the multiple publications. 2 Imprecision ‐ rated 'serious': Optimal Information Size (OIS) criterion not met. 3 Only one study available. 4 Risk of bias ‐ rated 'very serious': high risk of attrition bias and 'selective reporting' bias. 5 Indirectness ‐ rated 'serious': provided outcome is at a time point (4 days) different from those of primary importance in this setting. | ||||||
| RISPERIDONE compared to OTHER ANTIPSYCHOTIC: b. OLANZAPINE for psychosis‐induced aggression or agitation (rapid tranquillisation) | ||||||
| Patient or population: psychosis‐induced aggression or agitation (rapid tranquillisation) | ||||||
| Outcomes | Anticipated absolute effects* (95% CI) | Relative effect | № of participants | Quality of the evidence | Comments | |
| Risk with OTHER ANTIPSYCHOTIC: b. OLANZAPINE | Risk with RISPERIDONE | |||||
| Tranquillisation or asleep by 30 minutes ‐ not measured | ‐ | ‐ | ‐ | ‐ | ‐ | |
| Repeated need for tranquillisation within 24 hours ‐ not measured | ‐ | ‐ | ‐ | ‐ | ‐ | |
| Specific behaviour: agitation, up to 2 hours | MD 2.5 higher | ‐ | 29 | ⊕⊝⊝⊝ | ||
| Global outcome: need for additional measures | Study population | RR 1.43 | 29 | ⊕⊝⊝⊝ | ||
| 200 per 1.000 | 286 per 1.000 | |||||
| Adverse effects: movement disorder | MD 0.20 higher | ‐ | 29 | ⊕⊝⊝⊝ | ||
| Economic outcomes ‐ not measured | ‐ | ‐ | ‐ | ‐ | ‐ | |
| *The risk in the intervention group (and its 95% confidence interval) is based on the assumed risk in the comparison group and the relative effect of the intervention (and its 95% CI). | ||||||
| GRADE Working Group grades of evidence | ||||||
| 1 Risk of bias ‐ rated 'very serious': high risk of attrition bias and ‘selective reporting’ bias. 2 Only one study available. 3 Imprecision ‐ rated 'very serious': Optimal Information Size (OIS) criterion not met. 4 Indirectness ‐ rated 'serious': provided outcome is at a time point (4 days) different from those of primary importance in this setting. | ||||||
| RISPERIDONE compared to OTHER ANTIPSYCHOTIC: c. QUETIAPINE for psychosis‐induced aggression or agitation (rapid tranquillisation) | ||||||
| Patient or population: psychosis‐induced aggression or agitation (rapid tranquillisation) | ||||||
| Outcomes | Anticipated absolute effects* (95% CI) | Relative effect | № of participants | Quality of the evidence | Comments | |
| Risk with OTHER ANTIPSYCHOTIC: c. QUETIAPINE | Risk with RISPERIDONE | |||||
| Tranquillisation or asleep by 30 minutes ‐ not measured | ‐ | ‐ | ‐ | ‐ | ‐ | |
| Repeated need for tranquillisation within 24 hours ‐ not measured | ‐ | ‐ | ‐ | ‐ | ‐ | |
| Specific behaviour ‐ aggression, over 24 hours | MD 1.80 higher | ‐ | 40 | ⊕⊝⊝⊝ | ||
| Global outcome ‐ not measured | ‐ | ‐ | ‐ | ‐ | ‐ | |
| Adverse effects: movement disorders over 24 hours | Study population | RR 1.67 | 40 | ⊕⊝⊝⊝ | ||
| 150 per 1.000 | 251 per 1.000 | |||||
| Economic outcomes ‐ not measured | ‐ | ‐ | ‐ | ‐ | ‐ | |
| *The risk in the intervention group (and its 95% confidence interval) is based on the assumed risk in the comparison group and the relative effect of the intervention (and its 95% CI). | ||||||
| GRADE Working Group grades of evidence | ||||||
| 1 Only one study available. 2 Indirectness ‐ rated 'serious': provided outcome is at a time point (2 weeks) different from those of primary importance in this setting. 3 Imprecision ‐ rated 'very serious': Optimal Information Size (OIS) criterion not met. | ||||||
| RISPERIDONE compared to COMBINATION: a. RISPERIDONE + OXCARBAZEPINE for psychosis‐induced aggression or agitation (rapid tranquillisation) | ||||||
| Patient or population: psychosis‐induced aggression or agitation (rapid tranquillisation) | ||||||
| Outcomes | Anticipated absolute effects* (95% CI) | Relative effect | № of participants | Quality of the evidence | Comments | |
| Risk with COMBINATION: a. RISPERIDONE + OXCARBAZEPINE | Risk with RISPERIDONE | |||||
| Tranquillisation or asleep by 30 minutes ‐ not measured | ‐ | ‐ | ‐ | ‐ | ‐ | |
| Repeated need for tranquillisation within 24 hours ‐ not measured | ‐ | ‐ | ‐ | ‐ | ‐ | |
| Specific behaviour: agitation, over 24 hours | MD 2.70 higher | ‐ | 68 | ⊕⊝⊝⊝ | ||
| Global Outcome: average scores, over 24 hours | MD 0.20 lower | ‐ | 68 | ⊕⊝⊝⊝ | ||
| Adverse effects: movement disorders, over 24 hours | Study population | RR 1.59 | 68 | ⊕⊝⊝⊝ | ||
| 114 per 1.000 | 182 per 1.000 | |||||
| Economic outcomes ‐ not measured | ‐ | ‐ | ‐ | ‐ | ‐ | |
| *The risk in the intervention group (and its 95% confidence interval) is based on the assumed risk in the comparison group and the relative effect of the intervention (and its 95% CI). | ||||||
| GRADE Working Group grades of evidence | ||||||
| 1 Risk of bias ‐ rated 'very serious': high risk for performance bias and detection bias. 2 Only one study available. 3 Indirectness ‐ rated 'serious': provided outcome is at a time point (1 week) different from those of primary importance in this setting. 4 Imprecision ‐ rated 'very serious': Optimal Information Size (OIS) criterion not met. | ||||||
| RISPERIDONE compared to COMBINATION: b. RISPERIDONE + VALPROIC ACID for psychosis‐induced aggression or agitation (rapid tranquillisation) | ||||||
| Patient or population: psychosis‐induced aggression or agitation (rapid tranquillisation) | ||||||
| Outcomes | Anticipated absolute effects* (95% CI) | Relative effect | № of participants | Quality of the evidence | Comments | |
| Risk with COMBINATION: b. RISPERIDONE + VALPROIC ACID | Risk with RISPERIDONE | |||||
| Tranquillisation or asleep by 30 minutes ‐ not measured | ‐ | ‐ | ‐ | ‐ | ‐ | |
| Repeated need for tranquillisation within 24 hours ‐ not measured | ‐ | ‐ | ‐ | ‐ | ‐ | |
| Specific behaviour ‐ aggression, over 24 hours | The mean specific behaviour ‐ aggression, over 24 hours was 0 | MD 1.07 higher | ‐ | 54 | ⊕⊝⊝⊝ | |
| Global outcome ‐ not measured | ‐ | ‐ | ‐ | ‐ | ‐ | |
| Adverse effects: movement disorders, over 24 hours | Study population | RR 0.75 | 122 | ⊕⊝⊝⊝ | ||
| 66 per 1.000 | 49 per 1.000 | |||||
| Economic outcomes ‐ not measured | ‐ | ‐ | ‐ | ‐ | ‐ | |
| *The risk in the intervention group (and its 95% confidence interval) is based on the assumed risk in the comparison group and the relative effect of the intervention (and its 95% CI). | ||||||
| GRADE Working Group grades of evidence | ||||||
| 1 Only one study available. 2 Indirectness ‐ rated 'serious': provided outcome is at a time point (3 days) different from those of primary importance in this setting. 3 Imprecision ‐ rated 'very serious': Optimal Information Size (OIS) criterion not met. | ||||||
| Focus of review | Reference |
| Completed and maintained reviews | |
| Aripiprazole (intramuscular) for psychosis‐induced aggression or agitation (rapid tranquillisation) | |
| Benzodiazepines for psychosis‐induced aggression or agitation | |
| Chlorpromazine for psychosis‐induced aggression or agitation | |
| Containment strategies for people with serious mental illness | |
| De‐escalation techniques for psychosis‐induced aggression or agitation | |
| Droperidol for psychosis‐induced aggression or agitation | |
| Haloperidol for psychosis‐induced aggression or agitation (rapid tranquillisation) | |
| Haloperidol plus promethazine for psychosis‐induced aggression | |
| Olanzapine IM or velotab for acutely disturbed/agitated people with suspected serious mental illnesses | |
| Zuclopenthixol acetate for acute schizophrenia and similar serious mental illnesses | |
| Reviews in the process of being completed | |
| Loxapine inhaler for psychosis‐induced aggression | |
| Quetiapine for psychosis‐induced aggression |
| Outcome or subgroup title | No. of studies | No. of participants | Statistical method | Effect size |
| 1 Specific behaviour: 1a. Agitation ‐ Various measures Show forest plot | 1 | Risk Ratio (M‐H, Fixed, 95% CI) | Subtotals only | |
| 1.1 PANSS‐PAS response up to 24 hours ( ≥ 50% reduction at PANSS‐PAS score) | 1 | 124 | Risk Ratio (M‐H, Fixed, 95% CI) | 1.04 [0.86, 1.26] |
| 2 Specific behaviour: 1b. Agitation ‐ Average scores ‐ i. up to 2 hours Show forest plot | 1 | Mean Difference (IV, Fixed, 95% CI) | Subtotals only | |
| 2.1 Endpoint score (PANSS‐PAS, high = worse) | 1 | 28 | Mean Difference (IV, Fixed, 95% CI) | 0.40 [‐4.42, 5.22] |
| 3 Specific behaviour: 1c. Agitation ‐ Average scores ‐ ii. up to 24 hours Show forest plot | 1 | Mean Difference (IV, Fixed, 95% CI) | Subtotals only | |
| 3.1 Endpoint score (PANSS‐PAS, high = worse) | 1 | 28 | Mean Difference (IV, Fixed, 95% CI) | 0.20 [‐3.96, 4.36] |
| 4 Specific behaviour: 1d. Agitation ‐ Average scores ‐ iii. over 24 hours Show forest plot | 1 | Mean Difference (IV, Fixed, 95% CI) | Subtotals only | |
| 4.1 Endpoint score at 48 hours (PANSS‐PAS, high = worse) | 1 | 28 | Mean Difference (IV, Fixed, 95% CI) | 1.5 [‐1.36, 4.36] |
| 4.2 Endpoint score at 72 hours (PANSS‐PAS, high = worse) | 1 | 28 | Mean Difference (IV, Fixed, 95% CI) | 1.40 [‐1.62, 4.42] |
| 4.3 Endpoint score at 96 hours (PANSS‐PAS, high = worse) | 1 | 28 | Mean Difference (IV, Fixed, 95% CI) | 2.90 [‐0.34, 6.14] |
| 5 Global outcome: 1a. General ‐ Need for additional measures Show forest plot | 2 | Risk Ratio (M‐H, Fixed, 95% CI) | Subtotals only | |
| 5.1 Need for benzodiazepine up to 24 hours | 1 | 124 | Risk Ratio (M‐H, Fixed, 95% CI) | 0.88 [0.34, 2.27] |
| 5.2 Need for seclusion room | 1 | 28 | Risk Ratio (M‐H, Fixed, 95% CI) | 0.33 [0.01, 7.55] |
| 5.3 Use of restraints | 1 | 28 | Risk Ratio (M‐H, Fixed, 95% CI) | 2.0 [0.43, 9.21] |
| 6 Global outcome: 1b. General ‐ Need for additional medication (skewed data) Show forest plot | Other data | No numeric data | ||
| 7 Adverse effects: 1. General Show forest plot | 1 | Risk Ratio (M‐H, Fixed, 95% CI) | Subtotals only | |
| 7.1 One or more AEs up to 24 hours | 1 | 124 | Risk Ratio (M‐H, Fixed, 95% CI) | 0.94 [0.54, 1.66] |
| 8 Adverse effects: 2a. Specific ‐ Arousal level Show forest plot | 1 | Risk Ratio (M‐H, Fixed, 95% CI) | Subtotals only | |
| 8.1 Insomnia up to 24 hours | 1 | 124 | Risk Ratio (M‐H, Fixed, 95% CI) | 13.0 [0.75, 225.90] |
| 8.2 Somnolence up to 24 hours | 1 | 124 | Risk Ratio (M‐H, Fixed, 95% CI) | 1.29 [0.51, 3.24] |
| 9 Adverse effects: 2b. Specific ‐ Movement disorder ‐ i. Various Show forest plot | 1 | Risk Ratio (M‐H, Fixed, 95% CI) | Subtotals only | |
| 9.1 EPS up to 24 hours | 1 | 124 | Risk Ratio (M‐H, Fixed, 95% CI) | 0.63 [0.22, 1.80] |
| 10 Adverse effects: 2b. Specific ‐ Movement disorder ‐ ii. Need for biperiden Show forest plot | Other data | No numeric data | ||
| 11 Adverse effects: 2b. Specific ‐ Movement disorder ‐ iii. Average scores (skewed data) Show forest plot | 1 | Mean Difference (IV, Fixed, 95% CI) | Subtotals only | |
| 11.1 Endpoint scores at 96 hours (AIMS, high = worse) | 1 | 28 | Mean Difference (IV, Fixed, 95% CI) | 0.0 [0.0, 0.0] |
| 11.2 Endpoint scores at 96 hours (BARS, high = worse) | 1 | 28 | Mean Difference (IV, Fixed, 95% CI) | ‐0.60 [‐1.56, 0.36] |
| 11.3 Endpoint scores at 96 hours (SAS, high = worse) | 1 | 28 | Mean Difference (IV, Fixed, 95% CI) | ‐0.40 [‐1.00, 2.20] |
| 12 Adverse effects: 2c. Specific ‐ Miscellaneous Show forest plot | 1 | Risk Ratio (M‐H, Fixed, 95% CI) | Subtotals only | |
| 12.1 Headache up to 24 hours | 1 | 124 | Risk Ratio (M‐H, Fixed, 95% CI) | 0.75 [0.18, 3.21] |
| 12.2 Dizziness up to 24 hours | 1 | 124 | Risk Ratio (M‐H, Fixed, 95% CI) | 1.0 [0.26, 3.82] |
| 13 Leaving the study early Show forest plot | 2 | Risk Ratio (M‐H, Fixed, 95% CI) | Subtotals only | |
| 13.1 For any reason | 2 | 152 | Risk Ratio (M‐H, Fixed, 95% CI) | 2.2 [0.51, 9.48] |
| 13.2 Due to adverse effects | 1 | 124 | Risk Ratio (M‐H, Fixed, 95% CI) | 0.5 [0.05, 5.37] |
| 13.3 Lack of efficacy | 1 | 28 | Risk Ratio (M‐H, Fixed, 95% CI) | 9.0 [0.53, 152.93] |
| Outcome or subgroup title | No. of studies | No. of participants | Statistical method | Effect size |
| 1 Specific behaviour: 1. Agitation ‐ Average scores ‐ i. Up to 2 hours Show forest plot | 1 | Mean Difference (IV, Fixed, 95% CI) | Subtotals only | |
| 1.1 Endpoint score (PANSS‐PAS, high = worse) | 1 | 29 | Mean Difference (IV, Fixed, 95% CI) | 2.5 [‐2.46, 7.46] |
| 2 Specific behaviour: 1. Agitation ‐ Average scores ‐ ii. Up to 24 hours Show forest plot | 1 | Mean Difference (IV, Fixed, 95% CI) | Subtotals only | |
| 2.1 Endpoint score (PANSS‐PAS, high = worse) | 1 | 29 | Mean Difference (IV, Fixed, 95% CI) | 0.90 [‐3.40, 5.20] |
| 3 Specific behaviour: 1. Agitation ‐ Average scores ‐ iii. over 24 hours Show forest plot | 1 | Mean Difference (IV, Fixed, 95% CI) | Subtotals only | |
| 3.1 Endpoint score at 48 hours (PANSS‐PAS, high = worse) | 1 | 29 | Mean Difference (IV, Fixed, 95% CI) | ‐1.20 [‐5.15, 2.75] |
| 3.2 Endpoint score at 72 hours (PANSS‐PAS, high=worse) | 1 | 29 | Mean Difference (IV, Fixed, 95% CI) | ‐0.30 [‐4.47, 3.87] |
| 3.3 Endpoint score at 96 hours (PANSS‐PAS, high = worse) | 1 | 29 | Mean Difference (IV, Fixed, 95% CI) | 2.10 [‐1.41, 5.61] |
| 4 Global outcome: 1a. General ‐ Need for additional measures Show forest plot | 1 | Risk Ratio (M‐H, Fixed, 95% CI) | Subtotals only | |
| 4.1 Need for seclusion room | 1 | 29 | Risk Ratio (M‐H, Fixed, 95% CI) | 0.36 [0.02, 8.07] |
| 4.2 Use of restraints | 1 | 29 | Risk Ratio (M‐H, Fixed, 95% CI) | 1.43 [0.39, 5.28] |
| 5 Global outcome: 1b. General ‐ Need for additional medication (skewed data) Show forest plot | Other data | No numeric data | ||
| 6 Adverse effects: 1a. Specific ‐ Movement disorder ‐ i. Meed for biperiden Show forest plot | Other data | No numeric data | ||
| 7 Adverse effects: 1b. Specific ‐ Movement disorder ‐ ii. Average scores (skewed data) Show forest plot | 1 | Mean Difference (IV, Fixed, 95% CI) | Subtotals only | |
| 7.1 Endpoint score (BARS, high = worse) | 1 | 29 | Mean Difference (IV, Fixed, 95% CI) | 0.20 [‐0.43, 0.83] |
| 7.2 Endpoint score (SAS, high = worse) | 1 | 29 | Mean Difference (IV, Fixed, 95% CI) | 1.80 [‐0.63, 4.23] |
| 8 Leaving the study early Show forest plot | 1 | Risk Ratio (M‐H, Fixed, 95% CI) | Subtotals only | |
| 8.1 Lack of efficacy | 1 | 29 | Risk Ratio (M‐H, Fixed, 95% CI) | 2.14 [0.46, 9.93] |
| Outcome or subgroup title | No. of studies | No. of participants | Statistical method | Effect size |
| 1 Specific behaviour: 1. Aggression ‐ Average scores ‐ i. Over 24 hours Show forest plot | 1 | Mean Difference (IV, Fixed, 95% CI) | Subtotals only | |
| 1.1 Endpoint score at 2 weeks (MOAS, high = worse) | 1 | 40 | Mean Difference (IV, Fixed, 95% CI) | 1.80 [0.20, 3.40] |
| 1.2 Endpoint score at 4 weeks (MOAS, high = worse) | 1 | 40 | Mean Difference (IV, Fixed, 95% CI) | 0.90 [‐0.44, 2.24] |
| 1.3 Endpoint score at 6 weeks (MOAS, high = worse) | 1 | 40 | Mean Difference (IV, Fixed, 95% CI) | 0.70 [‐0.29, 1.69] |
| 1.4 Endpoint score at 8 weeks (MOAS, high = worse) | 1 | 40 | Mean Difference (IV, Fixed, 95% CI) | 0.55 [‐0.40, 1.50] |
| 2 Mental state: 1a. No change in general mental state Show forest plot | 1 | Risk Ratio (M‐H, Fixed, 95% CI) | Subtotals only | |
| 2.1 No response at 8 weeks ( ≤ 25% reduction at PANSS score) | 1 | 40 | Risk Ratio (M‐H, Fixed, 95% CI) | 1.0 [0.16, 6.42] |
| 3 Mental state: 1b. Change in general mental state Show forest plot | 1 | Risk Ratio (M‐H, Fixed, 95% CI) | Subtotals only | |
| 3.1 Clinical response at 8 weeks (25 ‐ 50% reduction at PANSS score) | 1 | 40 | Risk Ratio (M‐H, Fixed, 95% CI) | 1.33 [0.34, 5.21] |
| 3.2 Clinical response at 8 weeks (50 ‐ 75% reduction at PANSS score) | 1 | 40 | Risk Ratio (M‐H, Fixed, 95% CI) | 0.88 [0.39, 1.95] |
| 3.3 Clinical response at 8 weeks ( ≥ 75% reduction at PANSS score) | 1 | 40 | Risk Ratio (M‐H, Fixed, 95% CI) | 1.0 [0.43, 2.33] |
| 4 Mental state: 1c. Average scores ‐ i. Over 24 hours Show forest plot | 1 | Mean Difference (IV, Fixed, 95% CI) | Subtotals only | |
| 4.1 Endpoint score at 2 weeks (PANSS, high = worse) | 1 | 40 | Mean Difference (IV, Fixed, 95% CI) | 2.40 [‐2.15, 6.95] |
| 4.2 Endpoint score at 4 weeks (PANSS, high = worse) | 1 | 40 | Mean Difference (IV, Fixed, 95% CI) | 1.95 [‐3.07, 6.97] |
| 4.3 Endpoint score at 6 weeks (PANSS, high = worse) | 1 | 40 | Mean Difference (IV, Fixed, 95% CI) | 5.75 [‐0.09, 11.59] |
| 4.4 Endpoint score at 8 weeks (PANSS, high = worse) | 1 | 40 | Mean Difference (IV, Fixed, 95% CI) | 3.55 [‐0.69, 7.79] |
| 4.5 Endpoint score at 2 weeks (PANSS positive symptoms sub‐scale, high = worse) | 1 | 40 | Mean Difference (IV, Fixed, 95% CI) | 1.15 [‐0.37, 2.67] |
| 4.6 Endpoint score at 4 weeks (PANSS positive symptoms sub‐scale, high = worse) | 1 | 40 | Mean Difference (IV, Fixed, 95% CI) | 1.70 [0.01, 3.39] |
| 4.7 Endpoint score at 6 weeks (PANSS positive symptoms sub‐scale, high = worse) | 1 | 40 | Mean Difference (IV, Fixed, 95% CI) | 2.05 [‐0.15, 4.25] |
| 4.8 Endpoint score at 8 weeks (PANSS positive symptoms sub‐scale, high = worse) | 1 | 40 | Mean Difference (IV, Fixed, 95% CI) | 2.25 [‐0.36, 4.86] |
| 4.9 Endpoint score at 2 weeks (PANSS negative symptoms sub‐scale, high = worse) | 1 | 40 | Mean Difference (IV, Fixed, 95% CI) | 1.30 [‐0.07, 2.67] |
| 4.10 Endpoint score at 4 weeks (PANSS negative symptoms sub‐scale, high = worse) | 1 | 40 | Mean Difference (IV, Fixed, 95% CI) | 1.31 [‐0.04, 2.66] |
| 4.11 Endpoint score at 6 weeks (PANSS negative symptoms sub‐scale, high = worse) | 1 | 40 | Mean Difference (IV, Fixed, 95% CI) | 1.70 [‐0.12, 3.52] |
| 4.12 Endpoint score at 8 weeks (PANSS negative symptoms sub‐scale, high = worse) | 1 | 40 | Mean Difference (IV, Fixed, 95% CI) | 2.05 [‐0.06, 4.16] |
| 4.13 Endpoint score at 2 weeks (PANSS general psychopathology sub‐scale, high = worse) | 1 | 40 | Mean Difference (IV, Fixed, 95% CI) | ‐1.75 [‐4.73, 1.23] |
| 4.14 Endpoint score at 4 weeks (PANSS general psychopathology sub‐scale, high = worse) | 1 | 40 | Mean Difference (IV, Fixed, 95% CI) | ‐0.60 [‐3.73, 2.53] |
| 4.15 Endpoint score at 6 weeks (PANSS general psychopathology sub‐scale, high = worse) | 1 | 40 | Mean Difference (IV, Fixed, 95% CI) | 1.01 [‐1.88, 3.90] |
| 4.16 Endpoint score at 8 weeks (PANSS general psychopathology sub‐scale, high = worse) | 1 | 40 | Mean Difference (IV, Fixed, 95% CI) | 1.37 [‐1.30, 4.04] |
| 5 Adverse effects: 1a. Specific ‐ Anticholinergic Show forest plot | 1 | Risk Ratio (M‐H, Fixed, 95% CI) | Subtotals only | |
| 5.1 Blurred vision over 24 hours | 1 | 40 | Risk Ratio (M‐H, Fixed, 95% CI) | 0.5 [0.10, 2.43] |
| 6 Adverse effects: 1b. Specific ‐ Arousal Show forest plot | 1 | Risk Ratio (M‐H, Fixed, 95% CI) | Subtotals only | |
| 6.1 Somnolence over 24 hours | 1 | 40 | Risk Ratio (M‐H, Fixed, 95% CI) | 0.6 [0.17, 2.18] |
| 7 Adverse effects: 1c. Specific ‐ Cardiovascular Show forest plot | 1 | Risk Ratio (M‐H, Fixed, 95% CI) | Subtotals only | |
| 7.1 Tachycardia over 24 hours | 1 | 40 | Risk Ratio (M‐H, Fixed, 95% CI) | 4.0 [0.49, 32.72] |
| 8 Adverse effects: 1d. Specific ‐ Gastrointestinal Show forest plot | 1 | Risk Ratio (M‐H, Fixed, 95% CI) | Subtotals only | |
| 8.1 Nausea and vomiting over 24 hours | 1 | 40 | Risk Ratio (M‐H, Fixed, 95% CI) | 1.0 [0.07, 14.90] |
| 9 Adverse effects: 1e. Specific ‐ Movement disorders Show forest plot | 1 | Risk Ratio (M‐H, Fixed, 95% CI) | Subtotals only | |
| 9.1 Akathisia over 24 hours | 1 | 40 | Risk Ratio (M‐H, Fixed, 95% CI) | 1.67 [0.46, 6.06] |
| 9.2 Hypermyotonia over 24 hours | 1 | 40 | Risk Ratio (M‐H, Fixed, 95% CI) | 7.0 [0.95, 51.80] |
| 10 Adverse effects: 1f. Specific ‐ Miscellaneous Show forest plot | 1 | Risk Ratio (M‐H, Fixed, 95% CI) | Subtotals only | |
| 10.1 Headache over 24 hours | 1 | 40 | Risk Ratio (M‐H, Fixed, 95% CI) | 1.0 [0.16, 6.42] |
| 10.2 Liver Function Tests (LFTs) elevation over 24 hours | 1 | 40 | Risk Ratio (M‐H, Fixed, 95% CI) | 1.0 [0.07, 14.90] |
| 10.3 Weight gain over 24 hours | 1 | 40 | Risk Ratio (M‐H, Fixed, 95% CI) | 4.0 [0.49, 32.72] |
| 10.4 Agitation over 24 hours | 1 | 40 | Risk Ratio (M‐H, Fixed, 95% CI) | 3.5 [0.83, 14.83] |
| Outcome or subgroup title | No. of studies | No. of participants | Statistical method | Effect size |
| 1 Specific behaviour: 1. Agitation ‐ Average scores ‐ i. over 24 hours Show forest plot | 1 | Mean Difference (IV, Fixed, 95% CI) | Subtotals only | |
| 1.1 Endpoint score at 1 week (PANSS‐EC, high = worse) | 1 | 68 | Mean Difference (IV, Fixed, 95% CI) | 2.70 [0.42, 4.98] |
| 1.2 Endpoint score at 2 weeks (PANSS‐EC, high = worse) | 1 | 68 | Mean Difference (IV, Fixed, 95% CI) | 2.40 [0.32, 4.48] |
| 1.3 Endpoint score at 4 weeks (PANSS‐EC, high = worse) | 1 | 68 | Mean Difference (IV, Fixed, 95% CI) | 2.40 [0.53, 4.27] |
| 2 Global Outcome: 1. Average scores ‐ i. Over 24 hours Show forest plot | 1 | Mean Difference (IV, Fixed, 95% CI) | Subtotals only | |
| 2.1 Endpoint score at 1 week (CGI‐I, high = worse) | 1 | 68 | Mean Difference (IV, Fixed, 95% CI) | ‐0.20 [‐0.61, 0.21] |
| 2.2 Endpoint score at 2 weeks (CGI‐I, high = worse) | 1 | 68 | Mean Difference (IV, Fixed, 95% CI) | 0.5 [0.07, 0.93] |
| 2.3 Endpoint score at 4 weeks (CGI‐I, high = worse) | 1 | 68 | Mean Difference (IV, Fixed, 95% CI) | 0.50 [0.14, 0.86] |
| 2.4 Endpoint score at 1 week (CGI‐S, high = worse) | 1 | 68 | Mean Difference (IV, Fixed, 95% CI) | 0.20 [‐0.25, 0.65] |
| 2.5 Endpoint score at 2 weeks (CGI‐S, high = worse) | 1 | 68 | Mean Difference (IV, Fixed, 95% CI) | 0.5 [0.07, 0.93] |
| 2.6 Endpoint score at 4 weeks (CGI‐S, high = worse) | 1 | 68 | Mean Difference (IV, Fixed, 95% CI) | 0.5 [0.14, 0.86] |
| 3 Mental state: 1a. No change in general mental state Show forest plot | 1 | Risk Ratio (M‐H, Fixed, 95% CI) | Subtotals only | |
| 3.1 No response at 4 weeks ( < 50% reduction BPRS score) | 1 | 68 | Risk Ratio (M‐H, Fixed, 95% CI) | 10.61 [1.44, 78.36] |
| 4 Mental state: 1b. Change in general mental state Show forest plot | 1 | Risk Ratio (M‐H, Fixed, 95% CI) | Subtotals only | |
| 4.1 Clinical response at 4 weeks (50 ‐ 75% reduction at BPRS score) | 1 | 68 | Risk Ratio (M‐H, Fixed, 95% CI) | 0.69 [0.50, 0.97] |
| 4.2 Clinical response at 4 weeks ( ≥ 75% reduction at BPRS score) | 1 | 68 | Risk Ratio (M‐H, Fixed, 95% CI) | 0.85 [0.25, 2.89] |
| 5 Mental state: 1c. Average scores ‐ i. Over 24 hours Show forest plot | 1 | Mean Difference (IV, Fixed, 95% CI) | Subtotals only | |
| 5.1 Endpoint score at 1 week (BPRS, high = worse) | 1 | 68 | Mean Difference (IV, Fixed, 95% CI) | 5.20 [1.04, 9.36] |
| 5.2 Endpoint score at 2 weeks (BPRS, high = worse) | 1 | 68 | Mean Difference (IV, Fixed, 95% CI) | 6.20 [2.48, 9.92] |
| 5.3 Endpoint score at 4 weeks (BPRS, high = worse) | 1 | 68 | Mean Difference (IV, Fixed, 95% CI) | 5.40 [1.84, 8.96] |
| 6 Adverse effects: 1. General ‐ Total number of AEs Show forest plot | Other data | No numeric data | ||
| 7 Adverse effects: 2a. Specific ‐ Anticholinergic Show forest plot | 1 | Risk Ratio (M‐H, Fixed, 95% CI) | Subtotals only | |
| 7.1 Dry mouth over 24 hours | 1 | 68 | Risk Ratio (M‐H, Fixed, 95% CI) | 2.12 [0.81, 5.55] |
| 7.2 Constipation over 24 hours | 1 | 68 | Risk Ratio (M‐H, Fixed, 95% CI) | 1.30 [0.62, 2.72] |
| 8 Adverse effects: 2b. Specific ‐ Arousal Show forest plot | 1 | Risk Ratio (M‐H, Fixed, 95% CI) | Subtotals only | |
| 8.1 Excessive sedation over 24 hours | 1 | 68 | Risk Ratio (M‐H, Fixed, 95% CI) | 0.06 [0.00, 0.92] |
| 9 Adverse effects: 2c. Specific ‐ Cardiovascular Show forest plot | 1 | Risk Ratio (M‐H, Fixed, 95% CI) | Subtotals only | |
| 9.1 Tachycardia over 24 hours | 1 | 68 | Risk Ratio (M‐H, Fixed, 95% CI) | 1.24 [0.46, 3.30] |
| 10 Adverse effects: 2d. Specific ‐ Gastrointestinal Show forest plot | 1 | Risk Ratio (M‐H, Fixed, 95% CI) | Subtotals only | |
| 10.1 Nausea over 24 hours | 1 | 68 | Risk Ratio (M‐H, Fixed, 95% CI) | 2.12 [0.20, 22.31] |
| 11 Adverse effects: 2e. Specific ‐ Movement disorders Show forest plot | 1 | Risk Ratio (M‐H, Fixed, 95% CI) | Subtotals only | |
| 11.1 EPS over 24 hours | 1 | 68 | Risk Ratio (M‐H, Fixed, 95% CI) | 1.59 [0.49, 5.14] |
| 11.2 Tremor over 24 hours | 1 | 68 | Risk Ratio (M‐H, Fixed, 95% CI) | 0.85 [0.25, 2.89] |
| 12 Adverse effects: 2f. Specific ‐ Miscellaneous Show forest plot | 1 | Risk Ratio (M‐H, Fixed, 95% CI) | Subtotals only | |
| 12.1 Headache over 24 hours | 1 | 68 | Risk Ratio (M‐H, Fixed, 95% CI) | 0.07 [0.00, 1.19] |
| 12.2 Skin rash over 24 hours | 1 | 68 | Risk Ratio (M‐H, Fixed, 95% CI) | 0.35 [0.01, 8.37] |
| Outcome or subgroup title | No. of studies | No. of participants | Statistical method | Effect size |
| 1 Specific behaviour: 1. Agitation ‐ average scores ‐ i. over 24 hours Show forest plot | 2 | Mean Difference (IV, Fixed, 95% CI) | Subtotals only | |
| 1.1 Endpoint score at 3 days (PANSS‐EC, high = worse) | 1 | 54 | Mean Difference (IV, Fixed, 95% CI) | ‐0.11 [‐2.98, 2.76] |
| 1.2 Endpoint score at 5 days (PANSS‐EC, high = worse) | 1 | 54 | Mean Difference (IV, Fixed, 95% CI) | 5.47 [2.64, 8.30] |
| 1.3 Endpoint score at 7 days (PANSS‐EC, high = worse) | 1 | 54 | Mean Difference (IV, Fixed, 95% CI) | 5.11 [2.51, 7.71] |
| 1.4 Endpoint score at 2 weeks (PANSS‐EC, high = worse) | 1 | 63 | Mean Difference (IV, Fixed, 95% CI) | 0.09 [‐0.90, 1.08] |
| 1.5 Endpoint score at 4 weeks (PANSS‐EC, high = worse) | 1 | 63 | Mean Difference (IV, Fixed, 95% CI) | 0.17 [‐0.85, 1.19] |
| 2 Specific behaviour: 1. Aggression ‐ Average scores ‐ i. over 24 hours Show forest plot | 3 | Mean Difference (IV, Fixed, 95% CI) | Subtotals only | |
| 2.1 Endpoint score at 3 days (MOAS, high = worse) | 1 | 54 | Mean Difference (IV, Fixed, 95% CI) | 1.07 [‐0.20, 2.34] |
| 2.2 Endpoint score at 5 days (MOAS, high = worse) | 1 | 54 | Mean Difference (IV, Fixed, 95% CI) | 0.38 [‐0.83, 1.59] |
| 2.3 Endpoint score at 7 days (MOAS, high = worse) | 1 | 54 | Mean Difference (IV, Fixed, 95% CI) | 3.32 [2.07, 4.57] |
| 2.4 Endpoint score at 2 weeks (MOAS, high = worse) | 2 | 128 | Mean Difference (IV, Fixed, 95% CI) | 1.13 [0.23, 2.02] |
| 2.5 Endpoint score at 4 weeks (MOAS, high = worse) | 2 | 128 | Mean Difference (IV, Fixed, 95% CI) | 1.57 [0.75, 2.39] |
| 2.6 Endpoint score at 6 weeks (MOAS, high = worse) | 1 | 68 | Mean Difference (IV, Fixed, 95% CI) | 1.47 [0.83, 2.11] |
| 2.7 Endpoint score at 8 weeks (MOAS, high = worse) | 1 | 60 | Mean Difference (IV, Fixed, 95% CI) | 1.00 [‐0.11, 2.11] |
| 3 Mental state: 1. No change in general mental state Show forest plot | 1 | Risk Ratio (M‐H, Fixed, 95% CI) | Subtotals only | |
| 3.1 No clinical response at 8 weeks ( < 30% reduction at PANSS score) | 1 | 62 | Risk Ratio (M‐H, Fixed, 95% CI) | 1.67 [0.44, 6.38] |
| 4 Mental state: 2. Average scores ‐ i. over 24 hours Show forest plot | 4 | Mean Difference (IV, Fixed, 95% CI) | Subtotals only | |
| 4.1 Endpoint score at 2 weeks (PANSS, high = worse) | 4 | 253 | Mean Difference (IV, Fixed, 95% CI) | 3.48 [1.88, 5.08] |
| 4.2 Sub‐group analysis: Endpoint score at 2 weeks (PANSS, high = worse) | 3 | 185 | Mean Difference (IV, Fixed, 95% CI) | 2.50 [0.78, 4.21] |
| 4.3 Endpoint score at 4 weeks (PANSS, high = worse) | 4 | 253 | Mean Difference (IV, Fixed, 95% CI) | 5.45 [3.81, 7.08] |
| 4.4 Sub‐group analysis: Endpoint score at 4 weeks (PANSS, high = worse) | 3 | 185 | Mean Difference (IV, Fixed, 95% CI) | 4.52 [2.76, 6.29] |
| 4.5 Endpoint score at 6 weeks (PANSS, high = worse) | 2 | 130 | Mean Difference (IV, Fixed, 95% CI) | 9.90 [7.42, 12.37] |
| 4.6 Endpoint score at 8 weeks (PANSS, high = worse) | 2 | 122 | Mean Difference (IV, Fixed, 95% CI) | 5.83 [4.12, 7.54] |
| 4.7 Endpoint score at 2 weeks (PANSS positive symptoms sub‐scale, high = worse) | 3 | 191 | Mean Difference (IV, Fixed, 95% CI) | 0.64 [‐0.24, 1.53] |
| 4.8 Endpoint score at 4 weeks (PANSS positive symptoms sub‐scale, high = worse) | 3 | 191 | Mean Difference (IV, Fixed, 95% CI) | 2.75 [1.86, 3.64] |
| 4.9 Endpoint score at 6 weeks (PANSS positive symptoms sub‐scale, high = worse) | 1 | 68 | Mean Difference (IV, Fixed, 95% CI) | 4.4 [1.40, 7.40] |
| 4.10 Endpoint score at 8 weeks (PANSS positive symptoms sub‐scale, high = worse) | 1 | 60 | Mean Difference (IV, Fixed, 95% CI) | 1.70 [0.71, 2.69] |
| 4.11 Endpoint score at 2 weeks (PANSS negative symptoms sub‐scale, high = worse) | 2 | 128 | Mean Difference (IV, Fixed, 95% CI) | 0.29 [‐0.57, 1.15] |
| 4.12 Endpoint score at 4 weeks (PANSS negative symptoms sub‐scale, high = worse) | 2 | 128 | Mean Difference (IV, Fixed, 95% CI) | 1.23 [‐0.16, 2.62] |
| 4.13 Endpoint score at 6 weeks (PANSS negative symptoms sub‐scale, high = worse) | 1 | 68 | Mean Difference (IV, Fixed, 95% CI) | 3.80 [1.07, 6.53] |
| 4.14 Endpoint score at 8 weeks (PANSS negative symptoms sub‐scale, high = worse) | 1 | 60 | Mean Difference (IV, Fixed, 95% CI) | 1.30 [‐0.02, 2.62] |
| 4.15 Endpoint score at 2 weeks (PANSS general psychopathology sub‐scale, high = worse) | 2 | 128 | Mean Difference (IV, Fixed, 95% CI) | 0.93 [‐0.07, 1.93] |
| 4.16 Endpoint score at 4 weeks (PANSS general psychopathology sub‐scale, high = worse) | 2 | 128 | Mean Difference (IV, Fixed, 95% CI) | 1.14 [0.04, 2.23] |
| 4.17 Endpoint score at 6 weeks (PANSS general psychopathology sub‐scale, high = worse) | 1 | 68 | Mean Difference (IV, Fixed, 95% CI) | 6.5 [4.06, 8.94] |
| 4.18 Endpoint score at 8 weeks (PANSS general psychopathology sub‐scale, high = worse) | 1 | 60 | Mean Difference (IV, Fixed, 95% CI) | 1.60 [0.43, 2.77] |
| 5 Adverse effects: 1a. General ‐ Total number of AEs Show forest plot | Other data | No numeric data | ||
| 6 Adverse effects: 1b. General ‐ Serious Show forest plot | 1 | Risk Ratio (M‐H, Fixed, 95% CI) | Subtotals only | |
| 6.1 myocardial ischaemia (at 8 weeks) | 1 | 62 | Risk Ratio (M‐H, Fixed, 95% CI) | 2.0 [0.19, 20.93] |
| 7 Adverse effects: 2a. Specific ‐ Anticholinergic Show forest plot | 3 | Risk Ratio (M‐H, Fixed, 95% CI) | Subtotals only | |
| 7.1 Blurred vision over 24 hours | 2 | 122 | Risk Ratio (M‐H, Fixed, 95% CI) | 1.0 [0.37, 2.68] |
| 7.2 Dry mouth over 24 hours | 2 | 129 | Risk Ratio (M‐H, Fixed, 95% CI) | 1.64 [0.76, 3.54] |
| 8 Adverse effects: 2b. Specific ‐ Arousal Show forest plot | 3 | Risk Ratio (M‐H, Fixed, 95% CI) | Subtotals only | |
| 8.1 Insomnia over 24 hours | 1 | 54 | Risk Ratio (M‐H, Fixed, 95% CI) | 2.0 [0.19, 20.77] |
| 8.2 Somnolence over 24 hours | 2 | 121 | Risk Ratio (M‐H, Fixed, 95% CI) | 0.85 [0.44, 1.63] |
| 9 Adverse effects: 2c. Specific ‐ Cardiovascular Show forest plot | 5 | Risk Ratio (M‐H, Fixed, 95% CI) | Subtotals only | |
| 9.1 Decreased blood pressure over 24 hours | 1 | 68 | Risk Ratio (M‐H, Fixed, 95% CI) | 0.75 [0.18, 3.10] |
| 9.2 Tachycardia over 24 hours | 4 | 251 | Risk Ratio (M‐H, Fixed, 95% CI) | 1.48 [0.83, 2.67] |
| 9.3 T‐wave changes in ECG over 24 hours | 1 | 54 | Risk Ratio (M‐H, Fixed, 95% CI) | 2.0 [0.19, 20.77] |
| 10 Adverse effects: 2d. Specific ‐ Gastrointestinal Show forest plot | 4 | Risk Ratio (M‐H, Fixed, 95% CI) | Subtotals only | |
| 10.1 Constipation over 24 hours | 3 | 189 | Risk Ratio (M‐H, Fixed, 95% CI) | 1.11 [0.70, 1.76] |
| 10.2 Nausea over 24 hours | 2 | 122 | Risk Ratio (M‐H, Fixed, 95% CI) | 0.7 [0.29, 1.71] |
| 11 Adverse effects: 2e. Specific ‐ Movement disorders Show forest plot | 4 | Risk Ratio (M‐H, Fixed, 95% CI) | Subtotals only | |
| 11.1 EPS over 24 hours | 2 | 121 | Risk Ratio (M‐H, Fixed, 95% CI) | 1.35 [0.76, 2.39] |
| 11.2 Akathisia over 24 hours | 2 | 122 | Risk Ratio (M‐H, Fixed, 95% CI) | 0.75 [0.28, 2.03] |
| 11.3 Tremor over 24 hours | 1 | 68 | Risk Ratio (M‐H, Fixed, 95% CI) | 1.2 [0.40, 3.56] |
| 12 Adverse effects: 2f. Specific ‐ Movement disorders ‐ Average scores ‐ i. Over 24 hours Show forest plot | 1 | Mean Difference (IV, Fixed, 95% CI) | Subtotals only | |
| 12.1 Endpoint score at 3 days (TESS, high = worse) | 1 | 54 | Mean Difference (IV, Fixed, 95% CI) | ‐0.04 [‐1.35, 1.27] |
| 12.2 Endpoint score at 5 days (TESS, high = worse) | 1 | 54 | Mean Difference (IV, Fixed, 95% CI) | ‐0.11 [‐1.55, 1.33] |
| 12.3 Endpoint score at 7 days (TESS, high = worse) | 1 | 54 | Mean Difference (IV, Fixed, 95% CI) | ‐0.51 [‐1.88, 0.86] |
| 13 Adverse effects: 2g. Specific ‐ Miscellaneous Show forest plot | 5 | Risk Ratio (M‐H, Fixed, 95% CI) | Subtotals only | |
| 13.1 Headache over 24 hours | 4 | 243 | Risk Ratio (M‐H, Fixed, 95% CI) | 0.94 [0.53, 1.68] |
| 13.2 Weight gain over 24 hours | 1 | 60 | Risk Ratio (M‐H, Fixed, 95% CI) | 1.5 [0.47, 4.78] |
| 13.3 Oedema over 24 hours | 1 | 63 | Risk Ratio (M‐H, Fixed, 95% CI) | 0.34 [0.01, 8.13] |
| 13.4 Leukopenia over 24 hours | 1 | 63 | Risk Ratio (M‐H, Fixed, 95% CI) | 0.34 [0.01, 8.13] |
| 13.5 Liver Function Tests (LFTs) elevation over 24 hours | 2 | 116 | Risk Ratio (M‐H, Fixed, 95% CI) | 0.6 [0.15, 2.40] |
| 14 Leaving the study early Show forest plot | 1 | Risk Ratio (M‐H, Fixed, 95% CI) | Subtotals only | |
| 14.1 For any reason | 1 | 63 | Risk Ratio (M‐H, Fixed, 95% CI) | 0.21 [0.01, 4.13] |
| 14.2 Due to adverse effects | 1 | 63 | Risk Ratio (M‐H, Fixed, 95% CI) | 0.21 [0.01, 4.13] |