Ejercicio físico aeróbico para pacientes adultos con neoplasias hematológicas malignas
Resumen
Antecedentes
Aunque los pacientes con neoplasias hematológicas malignas se tienen que enfrentar a fases prolongadas de tratamiento e inmovilidad que disminuyen su nivel de rendimiento físico, la recomendación de descansar y evitar ejercicios intensivos todavía es una práctica habitual. Esta recomendación se debe en parte a la anemia grave y la trombocitopenia que presentan muchos pacientes. La incapacidad para realizar las actividades cotidianas los limita, disminuye su calidad de vida y puede influir en el tratamiento médico.
Objetivos
En esta actualización de la revisión original (publicada en 2014) el objetivo principal fue volver a evaluar la eficacia, la seguridad y la viabilidad del ejercicio físico aeróbico en pacientes adultos que presentan neoplasias hematológicas, malignas según el estado actual de los conocimientos.
Métodos de búsqueda
Se realizaron búsquedas en el Registro Cochrane Central de Ensayos Controlados (Cochrane Central Register of Controlled Trials, CENTRAL) (the Cochrane Library, 2018, número 7) y en MEDLINE (1950 a julio de 2018), en los registros de ensayos (ISRCTN, EU clinical trials register y clinicaltrials.gov) y en los resúmenes de congresos. No se aplicaron restricciones de idioma. Dos autores de la revisión, de forma independiente, examinaron los resultados de la búsqueda y los desacuerdos se resolvieron mediante discusión.
Criterios de selección
Se incluyeron los ECA que compararon una intervención con ejercicio físico aeróbico, dirigida a mejorar el sistema de oxigenación, como complemento a la atención estándar versus atención estándar solamente en pacientes adultos con neoplasias hematológicas malignas. También se incluyeron los estudios que evaluaron el ejercicio aeróbico además del entrenamiento de fuerza. Se excluyeron los estudios que investigaron el efecto de los programas de entrenamiento compuestos por yoga, tai chi chuan, qigong o tipos de ejercicio similares. También se excluyeron los estudios que exploraron la influencia del entrenamiento de fuerza sin ejercicios aeróbicos adicionales, así como los estudios que evaluaron resultados sin ninguna repercusión clínica.
Obtención y análisis de los datos
Dos autores de la revisión, de forma independiente, examinaron los resultados de la búsqueda, extrajeron los datos y evaluaron la calidad de los ensayos. Se utilizaron los riesgos relativos (RR) para los eventos adversos, la mortalidad y la supervivencia a los 100 días, las diferencias de medias estandarizadas (DME) para la calidad de vida (CdV), la fatiga y el rendimiento físico y las diferencias de medias (DM) para las mediciones antropométricas.
Resultados principales
En esta actualización fue posible añadir nueve ensayos a los nueve ensayos de la primera versión de la revisión, por lo que se incluyeron 18 ECA con 1892 participantes. Dos de estos estudios (65 participantes) no proporcionaron datos para los resultados clave de esta revisión (analizaron sólo los valores de laboratorio) y un estudio (40 pacientes) no se pudo incluir en los metanálisis, ya que los resultados se presentaron sólo como puntuaciones de cambio y no como puntuaciones finales. Un ensayo (17 pacientes) no informó de errores estándar y tampoco se pudo incluir en los metanálisis. El riesgo de sesgo potencial en estos ensayos no está claro debido al informe deficiente.
La mayoría de los participantes presentaba leucemia linfoblástica aguda (LLA), leucemia mieloide aguda (LMA), linfoma maligno y mieloma múltiple y ocho ensayos asignaron al azar a pacientes sometidos a trasplante de células madre. En su mayoría, la intervención con ejercicio consistió en diversos programas de intervención con caminata con diferente duración y niveles de intensidad.
La principal variable de evaluación de esta revisión, la supervivencia general (SG), sólo se informó en uno de estos estudios. Los autores del estudio no encontraron evidencia de una diferencia entre ambos brazos (RR 0,67; p = 0,112). Seis ensayos (un ensayo con cuatro brazos, analizados como dos subestudios) informaron sobre el número de participantes fallecidos durante el curso del estudio o durante los primeros 100 a 180 días. Para el resultado de mortalidad, no hay evidencia de una diferencia entre los participantes del grupo de ejercicio y los del grupo control (RR 1,10; IC del 95%: 0,79 a 1,52; p = 0,59; 1172 participantes, evidencia de certeza baja).
Para los siguientes resultados, los números más altos indican mejores resultados, siendo 1 el mejor resultado para las diferencias de medias estandarizadas. Ocho estudios analizaron la influencia de la intervención con ejercicios en la calidad de vida (CdV). Sigue sin estar claro si el ejercicio físico mejora la calidad de vida (DME 0,11; IC del 95%: ‐0,03 a 0,24; 1259 participantes, evidencia de certeza baja). Tampoco hay evidencia de una diferencia en las subescalas de funcionamiento físico (DME 0,15; IC del 95%: ‐0,01 a 0,32; ocho ensayos, 1329 participantes, evidencia de certeza baja) ni ansiedad (DME 0,03; IC del 95%: ‐0,30 a 0,36; seis ensayos, 445 participantes, evidencia de certeza muy baja). La depresión podría mejorar ligeramente con el ejercicio (DME 0,19; IC del 95%: 0,0 a 0,38; seis ensayos, 445 participantes, evidencia de certeza baja). Hay evidencia de certeza moderada de que el ejercicio probablemente mejora la fatiga (DME 0,31; IC del 95%: 0,13 a 0,48; nueve ensayos, 826 pacientes).
Seis ensayos (435 participantes) investigaron los eventos adversos graves. No está claro si el ejercicio adicional produce eventos adversos más graves (RR 1,39; IC del 95%: 0,94 a 2,06), sobre la base de evidencia de certeza muy baja.
Además, se tuvo conocimiento de cuatro ensayos en curso. Sin embargo, ninguno de esos ensayos indicó cuántos pacientes reclutarían ni cuándo se darían por terminados los estudios, por lo que sigue sin estar clara la posible influencia de esos ensayos en los análisis actuales.
Conclusiones de los autores
Dieciocho ECA, en su mayoría pequeños, no identificaron evidencia de una diferencia en términos de mortalidad. El ejercicio físico agregado a las atención estándar podría mejorar la fatiga y la depresión. Actualmente, no hay evidencia concluyente con respecto a la calidad de vida, el funcionamiento físico, la ansiedad ni los eventos adversos graves.
Se necesitan ensayos adicionales con más participantes y períodos de seguimiento más prolongados para evaluar los efectos de la intervención con ejercicio en pacientes que presentan neoplasias hematológicas malignas. Para mejorar la comparabilidad de los datos de los estudios, sería útil el desarrollo y la aplicación de conjuntos básicos de dispositivos de medición.
PICO
Resumen en términos sencillos
Función del ejercicio físico aeróbico en pacientes adultos con neoplasias hematológicas malignas
¿Cuál fue el objetivo de esta revisión?
El objetivo de esta revisión Cochrane fue determinar si el ejercicio físico aeróbico puede mejorar la salud o desempeñar una función de apoyo en los pacientes adultos que presentan neoplasias hematológicas malignas. Se recopilaron y analizaron todos los estudios relevantes para responder a esta pregunta y se encontraron 18 estudios pertinentes, de los cuales 14 informaron de los resultados relevantes para los pacientes predeterminados en esta revisión.
Mensajes clave
El ejercicio físico aeróbico probablemente tiene un efecto positivo en la fatiga y la depresión de los pacientes con enfermedades hematológicas malignas. Todavía no está clara la evidencia relacionada con la mortalidad, la calidad de vida ni los efectos adversos graves.
¿Qué se estudió en la revisión?
Las neoplasias hematológicas malignas son tumores del sistema hematológico, como linfomas, leucemias, mielomas, síndromes mielodisplásicos y enfermedades mieloproliferativas. Estas enfermedades representan aproximadamente el 7% de los nuevos diagnósticos de cáncer en todo el mundo. Las estrategias de tratamiento incluyen enfoques de conducta expectante, quimioterapia, radioterapia, inmunoterapia y trasplante de células madre, así como cuidados de apoyo para prevenir, controlar o tratar las complicaciones y los efectos secundarios.
Aunque los pacientes con neoplasias hematológicas malignas se tienen que enfrentar a fases prolongadas de tratamiento e inmovilidad que reducen su nivel de rendimiento físico, la recomendación de descansar y evitar los ejercicios intensivos todavía es una práctica habitual.
Hay varios estudios y enfoques que tratan de establecer otra estrategia e incluir el ejercicio físico, especialmente el ejercicio físico aeróbico, en la estrategia de tratamiento de los tumores hematológicos malignos. En concreto, estos programas de ejercicio consisten en componentes aeróbicos, de resistencia y flexibilidad, en parte realizados en el domicilio. Algunos prefieren que se integren en la vida cotidiana. Un método habitual es también el uso de herramientas como bicicletas ergométricas o bandas elásticas, así como los ejercicios de caminata. El ejercicio físico aeróbico podría mejorar el suministro de oxígeno a los músculos y tejidos del cuerpo.
¿Cuáles son los principales resultados de la revisión?
Los autores de esta actualización de la revisión identificaron nueve nuevos ensayos que se podrían añadir a los nueve ensayos de la primera versión de esta revisión. De esos 18 ensayos, 14 proporcionaron datos suficientes para el metanálisis. Aunque seis ensayos informaron sobre el número de participantes que murieron durante el período de estudio o durante los primeros 100 días, no hay evidencia de que existan diferencias en este resultado entre el grupo de ejercicio y el grupo control.
Ocho ensayos midieron la calidad de vida, el funcionamiento físico y la ansiedad y no mostraron evidencia de una diferencia entre el ejercicio adicional y la atención habitual. Es posible que hubiera un beneficio en el grupo de ejercicio en términos de fatiga y depresión.
La evidencia de los efectos adversos graves es de certeza muy baja, por lo que los resultados todavía no están claros.
Además, se tuvo conocimiento de cuatro ensayos en curso. Sin embargo, ninguno de esos ensayos indicó cuántos pacientes reclutarían ni cuándo se darían por terminados los estudios, por lo que sigue sin estar clara la posible influencia de esos ensayos en los análisis actuales.
¿Cuál es el grado de actualización de la revisión?
Los autores de la revisión buscaron estudios que se habían publicado hasta julio 2018.
Authors' conclusions
Summary of findings
| Physical exercise versus no physical exercise for adults with haematological malignancies | ||||||
| Patient or population: Adults with haematological malignancies | ||||||
| Outcomes | Illustrative comparative risks* (95% CI) | Relative effect | No of Participants | Quality of the evidence | Comments | |
| Assumed risk | Corresponding risk | |||||
| Control group without exercise | Physical exercise | |||||
| Mortality | 149 per 1.000 | 164 per 1.000 (117 to 226) | RR 1.10 (0.79 to 1.52) | 1172 | ⊕⊕⊝⊝ | |
| Quality of Life | The mean QoL score in the intervention group was | SMD 0.11 higher | 1259 (8 RCTs) | ⊕⊕⊝⊝ | ||
| Physical functioning/QoL with 1 indicating best outcome | The mean physical functioning/QoL score in the intervention group was 0.15 higher (better) | SMD 0.15 higher | 1329 | ⊕⊕⊝⊝ | ||
| Depression/QoL with 1 indicating best outcome | The mean depression/QoL score in the intervention group was 0.19 higher (better) | SMD 0.19 higher | 445 | ⊕⊕⊝⊝ | ||
| Anxiety/QoL with 1 indicating best outcome | The mean anxiety/QoL score in the intervention group was 0.03 higher (better) | SMD 0.03 higher | 445 | ⊕⊝⊝⊝ | ||
| Fatigue with 1 indicating best outcome | The mean fatigue score in the intervention group was 0.31 higher (better) (0.13 higher to 0.48 higher) | SMD 0.31 higher (0.13 higher to 0.48 higher) | 826 | ⊕⊕⊕⊝ | ||
| Serious adverse events | 174 per 1.000 | 242 per 1.000 (164 to 359) | RR 1.39 (0.94 to 2.06) | 435 | ⊕⊝⊝⊝ | |
| *The basis for the assumed risk (e.g. the median control group risk across studies) is provided in footnotes. The corresponding risk (and its 95% confidence interval) is based on the assumed risk in the comparison group and the relative effect of the intervention (and its 95% CI). | ||||||
| GRADE Working Group grades of evidence | ||||||
| 1Small number of participants/events leads to downgrading (1 point) for imprecision. 2Confidence interval including clinically relevant benefits or harms leads to downgrading (1 point) for imprecision. 3Outcome assessor (participant) not blinded in participant‐reported outcome (QoL questionnaires) leads to downgrading by one point for risk of bias. 4 High heterogeneity leads to downgrading by one point due to inconsistency. 5 Baseline imbalances, especially usage of erythropoietin and thalidomide unknown in both intervention arms leads to downgrading by one point due to inconsistency. 6Very small number of participants and events, very wide confidence interval to downgrading (2 points) for imprecision. | ||||||
Background
Description of the condition
A haematological malignancy is a tumour of the myeloid or lymphatic cell lines affecting blood, bone marrow or the lymph nodes with possible involvement of other organs. Lymphomas, leukaemias, myelomas, myelodysplastic syndromes and myeloproliferative diseases are all haematological malignancies and account for nearly 10% of new cancer diagnoses in the USA (Howlader 2012). The global age‐adjusted incidence rate of haematological malignancies is 40.3 new cases per 100,000 men and women per year. Individual scores are leukaemia (12.6), lymphoma (22.4) and myeloma (5.6) with all their various subcategories (Altekruse 2009).
Depending on the type and stage of the neoplastic disease, the clinical course can be indolent or aggressive with different patterns of treatment behaviour and treatment response. Various treatment options are available for people with haematological malignancies, extending from watch‐and‐wait approaches to single‐ or multi‐agent chemotherapy, radiotherapy, immunotherapy and autologous or allogeneic stem cell transplantation. Best supportive care is provided to make people more comfortable and to prevent, control or treat complications and side effects (Cullen 2001).
The prevailing advice for patients is to rest and avoid intensive exercise, without taking note of the unfavourable consequences of omitting physical exertion. This advice is mainly based on the properties of cytopenia (reduction in the numbers of any of the blood cell elements) from which most patients suffer. A low performance status due to severe anaemia and thrombocytopenia can potentially lead to haemorrhages, while the reduced immune status due to leukopenia increases the risk for infections (Tosetto 2009).
Description of the intervention
One important challenge in treating people with haematological cancer is physical deconditioning. It is highly prevalent in this population and is the result of various circumstances such as the oncologist’s advice to rest, cardiotoxic, neurotoxic or pulmo‐toxic anti‐cancer therapy, anaemia, thrombocytopenia or cachexia. Exercise has been introduced to improve physical functioning and to increase the ability to cope with activities of daily living. Some evidence suggests that physical exercise, especially aerobic exercise that aims to improve the oxygen system, increases cardiorespiratory fitness, muscle strength and physical well‐being in people with haematological cancer (Coleman 2012; Courneya 2009; Moyer‐Mileur 2009; Thorsen 2005).
People undergoing intensive chemotherapy suffer from unintended effects of the therapy such as inflammation due to long‐lasting immunosuppression and leukopenia. Apart from this, the inability to perform normal physical activity is a decisive limiting factor in the treatment of people with haematological malignancies. For them, this implies detrimental effects on their quality of life, as several studies have shown (Broers 2000; Fife 2000). Nevertheless, physical exercise programmes still occupy a minor role in the treatment concepts of haematological malignancies. Furthermore, we lack reliable data from randomised controlled trials (RCTs) about risk factors, feasibility and outcomes of exercise in people with haematological malignancies, particularly with regard to overall survival (OS).
The first study of therapeutic exercise in the follow‐up treatment of people suffering from breast cancer explicitly showed a positive physical and psychological effect (Schule 1983). Owing to the positive impact of this and further studies, exercise therapy has become a part of oncological treatment concepts (Dimeo 1996; Mock 1994; Peters 1994). The former opinion that exercise as part of health‐orientated therapy, concomitant with or immediately after medical therapy, could be harmful and should not be started before complete remission is achieved, has proved to be incorrect (Andrykowski 1989; Dimeo 1996). The most intensively investigated types of cancer are breast, colorectal and prostate cancers, where large prospective phase III trials are active and clear recommendations for activity were given (Courneya 2013; Dieli‐Conwright 2014; Doyle 2006). Important factors such as quality of life, physical functioning, depression and many other factors could be improved in those patients performing exercise (McCullough 2014).
Another essential burden for people with cancer is cancer‐related fatigue. It is defined as debilitating symptoms of physical, emotional and cognitive tiredness or exhaustion related to cancer or cancer treatment (NCCN 2014). Cancer‐related fatigue is very common during or after treatment and is reported by 60% to 90% of people with cancer (Wagner 2004). In recent meta‐analyses physical exercise has resulted in some reduction of cancer‐related fatigue in people with solid tumours (Velthuis 2010).
Aside from this recent development, the extent of physical exercise for people suffering from blood cancers remains unclear. Previous studies suggest that aerobic exercise can be safely carried out immediately after high‐dose chemotherapy and can partially prevent loss of physical performance (Dimeo 1996; Dimeo 1997). Data from Dimeo 1997 suggest that exercise mediates better maximal physical performance at discharge and shorter durations of neutropenia, thrombopenia and hospitalisation.
How the intervention might work
There is some evidence for a protective role of physical activity for cancer, in particular colon, breast (postmenopausal) and endometrial cancers (Parent 2011). A 20% to 40% reduced risk of several cancer types is reported in the current literature (Parent 2011). The precise/further underlying mechanisms for physical activity in reducing cancer risk remain to be elucidated. Several biological mechanisms have been suggested, which could equally apply to many cancer entities (Friedenreich 2001). These include a decrease in obesity and central adiposity, hormone level and growth factor modulation, modification of carcinogen activation and improvement in immune function (Li 2010a). Li 2010b reported immunomodulation due to physical activity as an increase of human natural killer activity and enhanced expression of intracellular anti‐cancer proteins in lymphocytes.
Why it is important to do this review
This is the updated version of the first systematic review taking into consideration the evidence from randomised comparisons on the impact of physical exercise in adults with haematological malignancies. The main question stated is whether physical exercise in addition to standard care is beneficial regarding OS, fatigue and quality of life compared to standard care alone. Further questions elucidate the role of physical exercise in terms of physical strength, well‐being and adverse effects.
In order to obtain conclusive evidence on the impact of physical exercise, we have performed a systematic review and meta‐analysis. A summary of all results will help us to choose the best available physical exercise approach and to reach conclusions about safety and effectiveness.
Objectives
To evaluate the efficacy, safety and feasibility of aerobic physical exercise for adults suffering from haematological malignancies.
Methods
Criteria for considering studies for this review
Types of studies
We considered only randomised controlled trials (RCTs) for inclusion. We included both full‐text and abstract publications.
Types of participants
We included trials on adults (18 years and over) with confirmed diagnoses of haematological malignancies. We did not apply gender or ethnicity restrictions. We considered all subtypes and stages of haematological malignancies, including newly‐diagnosed patients and those with relapsed or drug‐resistant disease. If trials had consisted of mixed populations with different conditions or types of cancer, we would have used data only from the haematological malignancy subgroups. If subgroup data for these participants had not been provided (after contacting the authors of the trial), we would have excluded the trial if fewer than 80% of participants had haematological malignancies.
Types of interventions
The main intervention was aerobic physical exercise in addition to standard care, compared to standard care alone. We only included studies that evaluated the response of the participant to aerobic exercise, intending to improve the oxygen system. Accordingly, we included studies that chose exercise interventions such as moderate cycling, walking, Nordic walking, running, swimming and other related forms of sport. These kinds of sports are easy to regulate with regards to load control. We also included studies that analysed further physical exercise programmes, such as moderate strength training in addition to the aerobic exercise programme. We did not include training programmes that were composed of yoga, tai chi chuan, qigong and similar types of exercise. We also excluded studies solely exploring the influence of strength training. Additionally, we excluded studies assessing outcomes without any clinical impact.
Types of outcome measures
We included all trials fitting the above mentioned inclusion criteria, irrespective of outcomes reported
Primary outcomes
We predefined overall survival (OS) as the primary efficacy outcome. As this outcome was reported in one trial only, but mortality was reported in six trials, we also evaluated mortality.
Secondary outcomes
We analysed the following outcomes as secondary outcomes:
-
quality of life;
-
fatigue;
-
physical performance (e.g. aerobic capacity, cardiovascular fitness);
-
anthropometric measurements (e.g. weight, body mass index);
-
adverse events.
Search methods for identification of studies
Electronic searches
We adapted the search strategies as suggested in the Cochrane Handbook for Systematic Reviews of Interventions (Lefebvre 2011). We applied no language restriction, to reduce the language bias. There were no restrictions by date or by publication status (e.g. abstract, conference proceedings, unpublished data, dissertations, etc).
We searched the following databases and sources.
-
Databases of medical literature:
-
Cochrane Central Register of Controlled Trials (CENTRAL) (the Cochrane Library, 2018, Issue 7) (for search strategy, see Appendix 1);
-
MEDLINE (1950 to 30 July, 2018) (for search strategy, see Appendix 2).
-
-
Conference proceedings of annual meetings (1990 to 2018) of the following societies for abstracts if not included in CENTRAL:
-
American Society of Hematology (ASH) (2011 to 2017);
-
American Society of Clinical Oncology (ASCO) (2011 to 2018);
-
European Hematology Association (2011 to 2018).
-
-
Databases of ongoing trials:
-
for the original version of the review:
-
meta‐register of controlled trials: www.controlled‐trials.com/mrct/.
-
-
for the update: we electronically searched in the database of ongoing trials up to 01 July 2018
-
ISRCTN: http://www.isrctn.com;
-
EU clinical trials register: https://www.clinicaltrialsregister.eu/ctr‐search/search;
-
Clinicaltrials.gov: https://clinicaltrials.gov/.
-
-
Searching other resources
-
Handsearching of references:
-
-
we checked references of all identified trials and relevant review articles for further literature.
-
Data collection and analysis
Selection of studies
Three review authors (LK, NS; NB and NS for the first version of the review) independently screened the results of the search strategies for eligibility for this review by reading relevant abstracts. In case of disagreement, we obtained the full‐text publication (Higgins 2011b).
We documented the study selection process in a flow chart as recommended in the PRISMA statement (Moher 2009) showing the total numbers of retrieved references and the numbers of included and excluded studies.
Data extraction and management
Two review authors (LK, NS; NB and NS for the first version of the review) independently extracted the data according to the guidelines proposed by Cochrane (Higgins 2011b). We used a standardised data extraction form containing the following items.
-
General information: author, title, source, publication date, country, language, duplicate publications.
-
Quality assessment: sequence generation, allocation concealment, blinding (participants, personnel, outcome assessors), incomplete outcome data, selective outcome reporting, other potential sources of bias.
-
Study characteristics: trial design, aims, setting and dates, source of participants, inclusion and exclusion criteria, comparability of groups, subgroup analysis, statistical methods, power calculations, treatment cross‐overs, compliance with assigned treatment, length of follow‐up, time point of randomisation.
-
Participant characteristics: underlying disease, stage of disease, histological subtype, additional diagnoses; age, gender, ethnicity; number of participants recruited, allocated, evaluated; participants lost to follow‐up; type of treatment (multi‐agent chemotherapy, intensity of regimen, number of cycles), additional radiotherapy, type and dosage of monoclonal antibodies, bone marrow transplantation.
-
Interventions: type, duration and intensity of physical exercise; standard care; duration of follow‐up.
-
Outcomes: OS, aerobic capacity, cardiovascular fitness, anthropometric measurements, quality of life, fatigue, adverse events.
We used both full‐text versions and abstracts including additional information (for example slides) of eligible studies to retrieve the data. We extracted trials reported in more than one publication on one form only. Where these sources did not provide sufficient information, we had planned to contact the authors for additional details.
Assessment of risk of bias in included studies
To assess quality and risk of bias, two review authors (NS, LK) independently assessed the risk of bias for each study using the following criteria outlined in Chapter 8 of the Cochrane Handbook for Systematic Reviews of Interventions (Higgins 2011a):
-
Sequence generation
-
Allocation concealment
-
Blinding (participants, personnel, outcome assessors)
-
Incomplete outcome data
-
Selective outcome reporting
-
Other potential sources of bias.
For every criterion, we made a judgement using one of three categories.
-
'Low risk': if the criterion was adequately fulfilled in the study, i.e. the study was at a low risk of bias for the given criterion;
-
'High risk': if the criterion was not fulfilled in the study, i.e. the study was at high risk of bias for the given criterion;
-
'Unclear': if the study report did not provide sufficient information to allow for a judgement of 'Yes' or 'No' or if the risk of bias was unknown for one of the criteria listed above.
Measures of treatment effect
We estimated treatment effect measures of individual studies as relative effect measures (RR) with 95% confidence intervals (CI) for dichotomous data. For survival data, we estimated treatment effects by extracting hazard ratios (HR) of individual studies and analysing these using the methods described by Parmar (Parmar 1998) and Tierney (Tierney 2007).We calculated continuous outcomes as mean differences (MD) or in case of different scales in various studies as standardised mean differences (SMDs) with 95% CIs for each trial.
Dealing with missing data
As suggested in chapter 16 of the Cochrane Handbook for Systematic Reviews of Interventions (Higgins 2011c), there were many potential sources of missing data which we had to take into account, at a study level, outcome level, and summary data level. Firstly, it was important to distinguish between 'missing at random' and 'not missing at random'. We did not identify any missing data.
Assessment of heterogeneity
In meta‐analyses with at least three trials, we assessed heterogeneity of treatment effects between trials using a Chi² test with a significance level at P < 0.1. In that case, we used the I² statistic to quantify possible heterogeneity (I² > 30% moderate heterogeneity, I² > 75% considerable heterogeneity) (Deeks 2011). We explored potential causes of heterogeneity by sensitivity and subgroup analyses where possible.
Assessment of reporting biases
In a meta‐analysis with at least 10 trials, we would have explored potential reporting bias by generating a funnel plot and statistically testing this by conducting a linear regression test (Sterne 2011). A P value less than 0.1 would have been considered significant for this test. However, we only included maximum nine trials in one meta‐analysis, so this test was not performed.
Data synthesis
We performed analyses according to the recommendations of chapter nine of the Cochrane Handbook for Systematic Reviews of Interventions (Deeks 2011). We used aggregated data for analysis. For statistical analysis, we entered data into the Cochrane statistical package Review Manager (RevMan) 5.3. One review author entered data into RevMan software and an another review author checked it for accuracy. Due to variation of types of haematological malignancies of participants and the different duration and intensity of the physical intervention, we performed meta‐analyses using a random‐effects model.
If appropriate, we calculated the number needed to treat for an additional beneficial outcome (NNTB) and the number needed to treat for an additional harmful outcome (NNTH).
We used the software GRADEpro 3.2 to create 'Summary of Finding' tables as suggested in the Cochrane Handbook for Systematic Reviews of Interventions (Schunemann 2011).
We ranked the following outcomes as the most patient‐relevant outcomes and presented them in the 'Summary of findings' table: overall survival (OS)/mortality, quality of life, physical functioning/quality of life (QoL), depression/QoL, anxiety/QoL, fatigue, serious adverse events.
Subgroup analysis and investigation of heterogeneity
We considered the following characteristics for subgroup analyses, but data were too sparse to perform subgroup analyses.
-
Age of included patients
-
Type of therapy of underlying disease (chemotherapy versus radiotherapy versus no treatment)
-
Type, duration, intensity of physical exercise
We analysed subgroups for patients receiving stem cell transplantation versus non stem cell transplantation as treatment of their underlying disease.
Sensitivity analysis
We analysed quality components (high risk of bias versus low risk of bias). We considered analysing full‐text publications versus abstract publications, but all the included trials were reported as full texts.
Results
Description of studies
Results of the search
Our literature search led to 4314 new publications to screen for this update. We excluded 4231 publications because they did not correspond with our inclusion criteria or were duplicates. We retrieved the remaining 51 publications as full‐text or abstract publications for further evaluation. Of these 72 publications, we finally excluded 34. At the end of our screening procedure, nine new studies (17 publications) could be added to the nine studies (21 references) from the first version of the review, leading to 18 studies with 38 publications in total.
We did not meta‐analyse data from four of these 18 included trials, which evaluated outcomes that are not patient‐relevant (laboratory values only) (Cunningham 1986; Kim 2006), or reported data in a way that could not be included in the meta‐analysis (Alibhai 2014; Bryant 2018). Cunningham 1986 investigated the influence of training on muscle strength or muscle protein status. Kim 2006 investigated the effect of physical exercises on lymphocyte and T‐cell subsets. One trial (40 patients) reported change‐scores only (Alibhai 2014); another trial evaluating 17 patients did not report standard difference or standard error (Bryant 2018), therefore both trials could not be included in meta‐analyses.
For the first version of the review, nine studies with 20 publications were included in the analysis of the review.
Additionally, currently four RCTs are ongoing (Abildgaard 2018; Courneya 2017; Oberste 2016; Walsh 2005). As the authors of these trials do not report, how many participants they will recruit and when the trial will be terminated, the potential influence of these trials for the current analyses is unclear. The study by Walsh 2005 and colleagues started in 2005 and according to the study registry, clinicaltrials.gov it still seems to be active and recruiting patients. One study has been published as an abstract only and is awaiting classification as it remains unclear, due to missing information, whether this trial fits our pre‐defined inclusion criteria (Wehrle 2018).
The overall number of references screened, identified, selected, excluded and included is documented according to the PRISMA flow diagram (Figure 1).

Flow diagram.
Included studies
Eighteen trials in 38 publications, including a total of 1892 participants (range 18 to 711), fulfilled the inclusion criteria (Alibhai 2014; Baumann 2010; Bryant 2018; Chang 2008; Coleman 2003; Coleman 2012; Courneya 2009; Cunningham 1986; DeFor 2007; Furzer 2016; Jacobsen 2014; Jarden 2016; Kim 2006; Knols 2011; Mello 2003; Persoon 2017; Streckmann 2014; Wiskemann 2015).
We did not meta‐analyse two (65 participants) of these 18 RCTs because they evaluated laboratory values only and did not report the pre‐specified outcomes of this review (Cunningham 1986; Kim 2006). One further trial (17 participants) did not provide data in a sufficient way to be meta‐analysed (without confidence intervals or standard deviations) (Bryant 2018). Another trial (40 participants) reported change scores instead of endpoint scores, prohibiting data to be meta‐analysed (Alibhai 2014).
We summarise the features of the included trials in the Characteristics of included studies table.
Nine trials reported no periods for trial recruitment. The earliest trial started recruitment in 2002 (Baumann 2010) until 2004, and the latest trials stopped in 2015 (Bryant 2018). All trials were published as full‐text publications.
Design
Sixteen of the included trials were two‐armed randomised controlled trials (RCTs), one was a three‐armed RCT (Cunningham 1986) and one was a four‐armed RCT (Jacobsen 2014). In order to include this last trial into our review, we divided it into two subgroups and analysed it correspondingly. One subgroup (Jacobsen 2014a) included participants with the goal to exercise three to five times a week for 20 to 30 minutes at 50% to 75% of estimated heart rate reserve compared with participants offered usual care, without any structured or supervised training and without encouragement to do physical exercise. The other subgroup (Jacobsen 2014b) evaluated participants with the advice to exercise three to five times a week for 20 to 30 minutes at 50% to 75% of estimated heart rate reserve and to perform stress management training consisting of paced abdominal breathing, progressive muscle relaxation with guided imagery, and coping self‐statements. Participants in the control group received usual care and performed only the stress management training.
Sample sizes
The smallest trial (Mello 2003) randomised 18 participants and the largest trial 711 participants (Jacobsen 2014). Seven trials provided sample size calculation (Alibhai 2014; Coleman 2012; Jacobsen 2014; Jarden 2016; Kim 2006; Knols 2011; Streckmann 2014). However, Coleman 2012 provided different calculations in various publications and Streckmann 2014 was stopped early due to slow recruitment.
Location
Six trials were conducted in the USA (Bryant 2018; Coleman 2003; Coleman 2012; Cunningham 1986; DeFor 2007; Jacobsen 2014); two trials were conducted in Canada (Alibhai 2014; Courneya 2009), one in Taiwan (Chang 2008), one in Switzerland (Knols 2011), one in Australia (Furzer 2016), one in Denmark (Jarden 2016), one in the Netherlands (Persoon 2017), one in Brazil (Mello 2003), one in South Korea (Kim 2006) and three in Germany (Baumann 2010; Streckmann 2014; Wiskemann 2015).
Participants
A total of 1892 men and women with haematological malignancies were randomly allocated either to a physical exercise group plus standard care or to a standard care alone group. The type of underlying haematological malignancy differed between studies. Two studies only included people with acute myeloid leukaemia (Alibhai 2014; Chang 2008). Three studies involved people with acute leukaemia (Bryant 2018; Cunningham 1986; Jarden 2016). In two studies all evaluated participants suffered from multiple myeloma (Coleman 2003; Coleman 2012). Two studies randomised participants with lymphomas (Courneya 2009; Streckmann 2014), one study included explored people with multiple myeloma or lymphomas (Persoon 2017). In the trials by Baumann 2010, DeFor 2007, Furzer 2016, Jacobsen 2014, Kim 2006, Knols 2011, Mello 2003 and Wiskemann 2015, participants suffered from various haematological diseases (mainly acute myeloid leukaemia or acute lymphatic leukaemia).
In nine trials, participants received stem cell transplantation (Alibhai 2014; Baumann 2010; Coleman 2003; Coleman 2012; Cunningham 1986; DeFor 2007; Knols 2011; Mello 2003; Wiskemann 2015). In three trials, participants received autologous blood stem cell transplantation (Coleman 2003; Coleman 2012; Persoon 2017), and in another four trials participants received allogeneic stem cell transplantation (Cunningham 1986; DeFor 2007; Mello 2003; Wiskemann 2015). In two trials, participants received either autologous or allogeneic transplantation, depending on the underlying disease and donor availability (Baumann 2010; Knols 2011). In one trial, only some of the participants received stem cell transplantation (Jarden 2016).
Interventions
In all included trials, physical exercise was performed in addition to standard care and compared with standard care alone. The intensity and the extent of the physical exercise intervention differed between the studies.
Alibhai 2014: participants in the exercise group were offered home‐based exercise three to five days per week. Training was supposed to be performed at a moderate intensity for 30 minutes per session. It consisted of aerobic, resistance and flexibility components and required no or minimal equipment, such as a stability ball and resistance bands, which were provided. Additionally, participants were invited to attend weekly group‐based booster sessions.
Baumann 2010: participants in the exercise arm were offered endurance training on a bicycle ergometer, for 10 to 20 minutes twice a day. Moreover, they participated twice a day in training activities for daily living to maintain mobility. Mostly, this training consisted of walking, stepping and stretching. The exercise programme started six days before transplantation, for five days a week, and lasted until one day before hospital discharge. People in the control group attended a low‐intensity programme of active and passive mobilisation, starting one day after transplantation until hospital discharge.
Bryant 2018: participants in the exercise arm took part in an individualised prescriptive exercise intervention two to four times per week for a period of the induction chemotherapy/in‐hospital recovery. Each session was divided into two parts, of which one took part in the morning, the other one in the afternoon. There was a break of at least 36 hours between sessions.
Chang 2008: the exercise intervention consisted of a three‐week walking programme of 12 minutes walking for five days a week. The control group did not perform any physical exercise programme. All participants in both arms received chemotherapy with cytarabine and idarubicin.
Coleman 2003: exercise consisted of an aerobic component (usually walking, but depending on the fitness and preferences of the participant, perhaps running or cycling) and strength resistance training (using exercise stretch bands). This programme was home‐based. The exercise programme started three months before and ended three months after stem cell transplantation. The control group received best‐practice usual care in terms of activity and rest provided by their physician.
Coleman 2012: participants in the exercise group received individualised exercise and a set of exercise stretch bands with varying resistance. Strength resistance training was included to strengthen muscles so participants could improve the aerobic component of the exercise programme. People in the control group were advised to remain as active as possible and to try to walk 20 minutes a day. Duration of this short‐term study was 15 weeks. The first 70 participants who were eligible for long‐term participation (i.e. response to erythropoietin) continued in the study for an additional 15 weeks. Participants in both groups (exercise and control) received chemotherapy with an intensive treatment protocol (called Total Therapy II) and stem cell transplantation. Fifty per cent of all participants were randomised to receive additionally thalidomide (400 mg daily) during induction, after transplantation consolidation, and maintenance therapy. Furthermore, 76% (N = 102 participants) received erythropoietin.
Courneya 2009: the exercise programme consisted of bicycle ergometer training three times a week for 12 weeks. Intensity began at 60% of the peak power output and was increased by 5% each week to 75% by the fourth week. Duration began at 15 to 20 minutes for the first four weeks and increased by five minutes a week to 40 to 45 minutes in the ninth week. Additionally, participants in the physical exercise group performed one session a week of interval training. Participants in the control group were asked not to increase exercise above baseline. In both groups, some participants received chemotherapy. These participants may have started treatment before enrolment, but needed to have at least eight weeks of planned treatment remaining. Some participants had already received chemotherapy and some were off treatment.
Cunningham 1986: the exercise programme consisted of the following exercise: 15 repetitions of bicep‐tricep curls, bench press, shoulder retractors, straight leg raises, hip extension, hip abduction and sit ups. This was performed three or five times a week, depending on the assignment to one of the exercise groups, for a period of 35 days.
DeFor 2007: participants in the exercise group were asked to walk for at least 15 minutes twice a day on a treadmill that was placed in their hospital room. After discharge, participants in the exercise group were asked to walk once a day for at least 30 minutes. Participants were told to walk at a comfortable speed and to discontinue the workout if they felt any discomfort or dizziness or if the medical staff advised them to do so. This regimen continued until 100 days post transplant. Participants in the control group were not asked to perform any formal exercise, and were not provided with a treadmill unless the participant or staff requested it. In both arms, there was a subset of participants receiving non‐myeloablative conditioning and a subset receiving myeloablative conditioning before allogeneic stem cell transplantation. The authors reported that the activity level prior to transplantation did not differ between the two arms (P = 0.45), but that more participants in the intervention arm (93%) exercised during hospital stay compared to the control arm (58%; P = 0.01).
Furzer 2016: participants in the exercise group were asked to attend a mixed training consisting of cardiovascular training and endurance training. Each session included warm‐up and cool‐down prior to cardiovascular training at 50% of heart rate max, with a maximum duration of 30 minutes per session. Participants used monitors to maintain prescribed heart rate. Exercise progression was achieved by 1) increasing heart rate intensity (up to 70% heart rate max) and 2) decreasing duration (10‐15 minutes) while additionally increasing heart rate intensity (up to 85% hear ratio max). The endurance component consisted of eight exercises targeting the major muscle groups (three sets of 10‐15 repetitions), a progression in weight was possible.
Jacobsen 2014: see Jacobsen 2014a; Jacobsen 2014b
Jacobsen 2014a: Participants randomised to the exercise arm were given a packet of materials, including a videotape, a brochure, a workbook and an electronic step counter in order to be able to perform and track a home‐based exercise program with an emphasis on walking. The intervention was carried out before a planned haematopoietic cell transplantation (HCT). The goal was to exercise 3 to 5 times a week for 20 to 30 minutes per session at 50% to 75% of estimated heart rate reserve. Trained site personnel served as interventionists and introduced the program as well as giving advice concerning proper technique and overcoming potential barriers.
Jacobsen 2014b: participants randomised to the interventional arm were given an packet of materials, including a videotape, a brochure, a workbook and an electronic step counter in order to be able to perform and track a home‐based exercise program with an emphasis on walking. Additionally, they were given a relaxation CD. The intervention was carried out before a planned HCT. Concerning the exercise program, the goal was to exercise three to five times a week for 20 to 30 minutes per session at 50% to 75% of estimated heart rate reserve. Trained site personnel served as interventionists and introduced the program as well as giving advice concerning proper technique and overcoming potential barriers. The stress‐management goal targeted paced abdominal breathing, progressive muscle relaxation with guided imagery, and coping self‐statements to decrease and manage stress.
Jarden 2016: participants allocated to the exercise arm received a 12‐week exercise program, three times week, for 60 to 70 minutes per session. Sessions consisted of stationary cycling for 20‐25 minutes, six dynamic resistance exercises using hand weights in two sets of 12 repetitions and nutrition support. Additionally, counselling sessions were conducted at week zero, six and 12.
Kim 2006: participants randomised to the exercise group performed an exercise program every day for thirty minutes over a period of six weeks. Sessions consisted of preliminary exercise for 10 minutes, relaxation breathing for 10 minutes and finish exercise for 10 minutes. The preliminary exercises were performed in this sequence: concentrate the attention on lower abdomen for three minutes; put left ankle on right knee for three minutes; put right ankle on left knee for two minutes; and bend both knees for two minutes. The finishing exercises were performed in this sequence: resting and relaxing of body and mind for two minutes; stroking down hair and face for two minutes; right and left rotating of both ankles for two minutes; stretching of legs and arms for two minutes; and stretching out on a bed for two minutes.
Knols 2011: participants were randomised to a 12‐week outpatient programme of physical exercise, consisting of supervised aerobic and strength exercises, or to a usual care group without any advice for physical exercise. The physical exercise was performed twice weekly in a physiotherapy practice or fitness centre. Participants started with 10 minutes ergometer cycling or walking treadmill, followed by progressive resistance training.
Mello 2003: participants allocated to the exercise arm received a six‐week exercise program, carried out five times a week for 40 minutes. It involved exercises for shoulder, elbow, hip, knee and ankle, as well as stretching exercises and a treadmill walking program. Participants allocated to the control group received usual care.
Persoon 2017: participants were randomised to a 18‐week exercise programme consisting of high‐intensity resistance and interval training. Participants did training on specialised resistance training equipment and bicycle ergometers. In weeks one to 12, participants performed resistance and interval training twice a week for 60 minutes per training session. In weeks 13 to 18, the intensity of exercise was decreased to one session a week with a duration of 60 minutes. Participants in the control group received usual care.
Streckmann 2014: participants in the exercise arm attended an aerobic endurance training programme, consisting of cardiovascular activation on a bicycle dynamometer and 10 to 30 minutes walk on a treadmill or bicycle ergometer at the end of the training. Participants were also offered sensorimotor training, progressively increasing in task difficulty, and a strength training of four resistance exercises carried out for one minute. Participants in the control group received physiotherapy.
Wiskemann 2015: participants started the exercise intervention on an outpatient basis before allogeneic haematopoietic stem cell transplantation (in general one to four weeks before admission to the hospital), proceeded during the inpatient period and continued the intervention until six to eight weeks after discharge from the hospital. The outpatient intervention was continued as a self‐directed activity at home, whereas the inpatient period was partly supervised twice a week and adapted to the conditions of an isolation unit. The intervention consisted of three endurance training sessions (up to five during hospitalisation) and two resistance training sessions a week. Endurance training in the outpatient setting was recommended as rapid walking for 20 to 40 minutes. In the inpatient setting the participants performed bicycling and treadmill walking instead of the walking intervention. Additionally, participants performed strength training with and without stretch bands. Participants in the control group were told that moderate physical activity is favourable during the treatment process, without further advice. During the inpatient period, physiotherapy was offered up to three sessions a week (average duration of one session: 30 minutes). For this period, the control group had the same access to stationary bicycles and treadmills as the intervention group (not reported, how many participants exercised). All participants received allogeneic stem cell transplantation.
Outcomes
Primary outcome measure
Our primary outcome OS was only reported in one of the included trials (Wiskemann 2015). Mortality was reported by six trials. One of them assessed 180‐day mortality (Jacobsen 2014). One study assessed 100‐day mortality (DeFor 2007). Baumann 2010 and Wiskemann 2015 reported the number of participants who died during hospital stay; all deaths occurred as a transplant‐related complication. Mello 2003 reported that ten patients died but did not provide any data in which arm the patients died.
Secondary outcome measures
Nine studies reported quality of life (QoL) (Alibhai 2014; Baumann 2010; Courneya 2009; Furzer 2016; Jacobsen 2014; Jarden 2016; Persoon 2017; Streckmann 2014; Wiskemann 2015). Eleven studies mentioned fatigue (Alibhai 2014; Baumann 2010; Chang 2008; Coleman 2012; Courneya 2009; Furzer 2016; Jarden 2016; Knols 2011; Persoon 2017; Streckmann 2014; Wiskemann 2015), however only eight reported data in a similar way to be combined for QoL and nine to be analysed for fatigue. Thirteen trials assessed physical performance data (Alibhai 2014; Baumann 2010; Chang 2008; Coleman 2003; Coleman 2012; Courneya 2009; Furzer 2016; Jarden 2016; Knols 2011; Mello 2003; Persoon 2017; Streckmann 2014; Wiskemann 2015). Anthropometric measurements were captured by three studies (Courneya 2009; Furzer 2016; Knols 2011). Six trials reported serious adverse events or adverse events (Chang 2008; Coleman 2012; Courneya 2009; Jarden 2016; Persoon 2017; Streckmann 2014). Some studies explored further outcomes that are irrelevant for this systematic review, but could be partly relevant for clinical practice. Baumann 2010 reported lung function, Chang 2008 explored the time to recovery after transplantation, DeFor 2007 investigated physical and emotional well‐being at discharge and 100 days posttransplant, and Streckmann 2014 reported movement co‐ordination and balance control (see Characteristics of included studies).
Conflict of interest
One study was supported by the Lance Armstrong Foundation (Courneya 2009), one study by the National Heart, Lung, and Blood Institute and the National Cancer Institute (Jacobsen 2014), one study by the SolarisCare foundation (Furzer 2016), one study by The Center for Integrated Rehabilitation of Cancer Patients, The Novo Nordic Foundation, The University Hospitals’ Centre for Health Research (UCSF), The Lundbeck Foundation, The Novo Nordic Foundation for Clinical Nursing Research and The Danish Cancer Society (Jarden 2016), one by the Zurich cancer league and the Federal Authorities of the Swiss Confederation, Federal Department of Defence, Civil Protection and Sport (Knols 2011), and one study by AMGEN (Streckmann 2014).
Excluded studies
In total, we excluded 31 studies (36 references). Four studies included participants younger than 18 years (Hartman 2009; Marchese 2004; Moyer‐Mileur 2009; Tanir 2013). We excluded four studies because exercise was offered in both arms (PETRA study; Schumacher 2015a; Shelton 2009; Vallerand 2018). In one trial, a multimodal intervention was offered, including a structured exercise programme, progressive relaxation, and psycho‐education (Jarden 2009). We excluded 15 studies because of the involvement of participants suffering from non‐haematological cancers, such as breast cancer, testicular cancer or gynaecological cancer did not report subgroup data (Broderick 2013; Forbes 2017; Grabenbauer 2016; Kampshoff 2015; Kanera 2017; Midtgaard 2013; Oechsle 2014; Peoples 2017; Stacey 2016; Thorsen 2005; Toohey 2016; Tran 2016; Valle 2013; van Waart 2015; Zimmer 2014). We excluded one study because it remained unclear which types of malignancies involved participants had been diagnosed with (Mayo 2014).
We excluded five studies because the applied exercise interventions did not correspond to our inclusion criteria (Cohen 2004; Hacker 2011; Hacker 2016; Prinsen 2013; Yeh 2016). Cohen 2004 explored the influence of a Tibetan yoga intervention on psychological adjustment and sleep quality. Hacker 2011 and Hacker 2016 explored the effect of strength training on physical activity, muscle strength, health status perception, and quality of life. Prinsen 2013 explored the influence of cognitive behavioural therapy on physical activity, physical fitness and fatigue. Yeh 2016 and colleagues evaluated qigong for patients with non‐Hodgkin lymphoma.
Risk of bias in included studies
Overall, the risks of bias were unclear. For detailed information see the 'Risk of bias' tables of included trials and Figure 2 and Figure 3.

'Risk of bias' graph: review authors' judgements about each risk of bias item presented as percentages across all included studies.

'Risk of bias' summary: review authors' judgements about each risk of bias item for each included study.
Allocation
For one study, Mello 2003, we judged both, sequence generation and allocation concealment as high, as it remains unclear when and how patients have been randomised.
For 12 studies, we rated the random sequence generation as adequate (Alibhai 2014; Baumann 2010; Bryant 2018; Courneya 2009; Cunningham 1986; Furzer 2016; Jarden 2016; Kim 2006; Knols 2011; Persoon 2017; Streckmann 2014; Wiskemann 2015), thus we judged the potential risk of bias as 'low'. Five studies reported randomisation procedure, but did not give details, therefore we judged risk of bias as unclear for five studies (Chang 2008; Coleman 2003; Coleman 2012; DeFor 2007; Jacobsen 2014).
Allocation concealment was adequate for 10 trials (Alibhai 2014; Baumann 2010; Bryant 2018; Courneya 2009; Cunningham 1986; Furzer 2016; Jarden 2016; Kim 2006; Knols 2011; Persoon 2017), and unclear for seven studies (Chang 2008; Coleman 2003; Coleman 2012; DeFor 2007; Jacobsen 2014; Streckmann 2014; Wiskemann 2015).
Blinding
Performance bias
When exploring the influence of physical exercise intervention on people suffering from haemological malignancies, it is not feasible to blind participants or physicians. Consequently, in all 18 studies we judged the potential risk of bias for blinding of participants and physicians as 'high'.
Detection bias
As the outcome of mortality is not influenced by the outcome assessor, we judged risk of bias for outcome assessor blinding for as low.
Thirteen studies measured participant‐reported outcomes for quality of life or fatigue. As it is not feasible to blind the intervention exercise, the participants were aware of the assigned intervention when they filled out the questionnaires. We therefore judged the risk of bias for outcome assessor blinding for those trials that assessed participant‐reported outcomes as high (Alibhai 2014; Baumann 2010; Bryant 2018; Chang 2008; Coleman 2012; Courneya 2009; Furzer 2016; Jacobsen 2014; Jarden 2016; Knols 2011; Mello 2003: Persoon 2017; Streckmann 2014; Wiskemann 2015).
Eleven studies did not report whether the outcome assessors for physical performance or adverse events were blinded, so we judged their risk of bias as 'unclear' (Baumann 2010; Bryant 2018; Chang 2008; Coleman 2003; Coleman 2012; Furzer 2016; Jacobsen 2014; Knols 2011; Mello 2003; Persoon 2017; Streckmann 2014). Two studies did not report outcomes or interest but laboratory values only; risk of bias for these trials is unclear (Cunningham 1986; Kim 2006).
In three studies we judged the assessor bias at 'high' risk (Alibhai 2014; Courneya 2009; Wiskemann 2015), as these trials explicitly stated that outcome assessors were not blinded. In Courneya 2009, the outcome assessors were not always blinded to group assignment, but they were trained in standardising testing procedures. In Wiskemann 2015, the assessors were not blinded to randomisation.
In two studies, the assessor was unaware of the randomised assignment (DeFor 2007; Jarden 2016), and we therefore judged the risk of bias as 'low'.
Incomplete outcome data
For two studies, we judged the risk of attrition bias as 'unclear' as they did not report whether all randomised participants were analysed (Coleman 2003; DeFor 2007). In 10 studies not all the randomised participants were considered in the outcome analysis. Consequently, we judged the risk of attrition bias as 'high' (Alibhai 2014; Bryant 2018; Chang 2008; Coleman 2012; Furzer 2016; Jarden 2016; Kim 2006; Mello 2003; Persoon 2017; Wiskemann 2015). In six studies we could not detect any risk of attrition bias, with all randomised participants analysed in the arm to which they were assigned, so we judged the risk of attrition bias as 'low' for these studies (Baumann 2010; Courneya 2009; Cunningham 1986; Jacobsen 2014; Knols 2011; Streckmann 2014).
Selective reporting
For 12 of the 18 included studies, there is no protocol available at www.controlled‐trials.com/mrct/, so we were not able to judge the potential risk of reporting bias (Baumann 2010; Chang 2008; Coleman 2003; Courneya 2009; Cunningham 1986; DeFor 2007; Kim 2006; Knols 2011; Mello 2003; Persoon 2017; Streckmann 2014; Wiskemann 2015), and we therefore rated the potential risk of reporting bias as 'unclear'. For six studies, a protocol was registered (Alibhai 2014; Bryant 2018; Coleman 2012; Furzer 2016; Jacobsen 2014; Jarden 2016). All planned outcomes are reported. According to this, we judged the potential for reporting bias as 'low'.
Other potential sources of bias
In one study the distribution of participants between exercise and control group is unbalanced due to five out of 17 allocated to the control immediately crossing over to the exercise group (Alibhai 2014), we judge risk of other bias as high.
In Chang 2008, the distribution of gender is unbalanced in the exercise and in the control group. In consequence of this distribution, we judged the potential risk of bias as 'high'; however, the unequal distribution could be due to the small number of participants randomised.
In Coleman 2012, 50% of participants received thalidomide. It is was neither reported whether the thalidomide administration was equally distributed between both arms, nor were subgroup analyses provided for participants receiving or not receiving thalidomide. We therefore judged the potential risk of bias as 'high'. Moreover, in an abstract publication of the trial, Coleman 2012 reported that all participants (in both the exercise and control group) received erythropoietin. In the study description published as full text, the authors reported that erythropoietin was administered to only 102 of 135 study participants, meaning that some participants did not receive erythropoietin therapy. We therefore judged the potential risk of bias as 'high'.
Streckmann 2014: due to a slow recruitment rate, the trial was stopped early. The authors planned to randomise 240 people, but randomised only 61 participants. They argued that physiological parameters are more important than the primary outcome (QoL). We therefore judged the potential risk of bias as 'high'. Moreover, there is a serious baseline imbalance for the outcome of QoL, favouring the control group. We therefore excluded this trial for the outcome QoL in a sensitivity analysis.
Six studies received financial support by various organisations. After evaluating and reviewing we do not expect any bias due to this (Courneya 2009; Furzer 2016; Jacobsen 2014; Jarden 2016; Knols 2011; Persoon 2017).
One study was finalised before the last six participants were enrolled (Coleman 2003). This premature termination was due to time and funding constraints. There is no indication that the premature stopping could have been due to other reasons. On the basis of this abandonment, we judged the potential risk of bias as 'unclear'.
For the remaining studies we do not have any hint for or against other bias and judged potential risk of bias as unclear (Baumann 2010; Cunningham 1986; DeFor 2007; Kim 2006; Mello 2003; Wiskemann 2015).
Effects of interventions
We did not include two trials in the meta‐analyses which evaluated outcomes which are not patient‐relevant and did not report the pre‐specified outcomes of this review (Cunningham 1986; Kim 2006). These trials reported laboratory values only. One trial involving 40 patients reported change‐scores instead of endpoint scores (Alibhai 2014), another trial with 17 patients did not report standard difference or standard error (Bryant 2018), therefore both trials could not be included in meta‐analyses.
Overall survival (OS)/mortality
The only study investigating our primary outcome OS was Wiskemann 2015. The study authors did not find evidence for participants exercising compared to participants receiving usual care only (risk ratio (RR) = 0.67, P = 0.112). As this was the only trial investigating survival there were no data to pool, therefore a meta‐analysis was not conducted.
Instead, six trials (N = 1172) which reported the number of deceased participants (Baumann 2010; Courneya 2009; DeFor 2007; Jacobsen 2014; Jarden 2016; Wiskemann 2015) were meta‐analysed. We found no statistically significant difference between exercise and control arms (RR 1.10; 95% confidence interval (CI) 0.79 to 1.52; P = 0.59; Analysis 1.2). Heterogeneity is small (I² = 29%) (see Figure 4). The certainty of the evidence is low, because of the small number of patients with an event and a confidence interval that includes both: clinically relevant benefits and harms. We downgraded two points for imprecision.

Forest plot of comparison: 1 Physical exercise versus no physical exercise, outcome: 1.2 Mortality.
The subgroup analysis for stem cell transplantation versus chemotherapy only (Analysis 1.1) and the sensitivity analysis for high versus low risk of overall bias (Analysis 1.3) did not provide any evidence for differences between those groups (test for subgroup differences not significant).
Quality of life (QoL)
Eight studies measured the outcome quality of life in a comparable way. One of them (Jacobsen 2014) evaluated QoL using the SF‐36 survey, its Mental Component Summary score (MCS) was incorporated in our review as an indicator for general QoL.
We found no evidence for a difference (standardised mean difference (SMD) 0.11, 95% CI ‐0.03 to 0.24; 1259 participants; Analysis 1.4) with small heterogeneity (I² = 26%) (see Figure 5). We found no indications of subgroup differences between participants receiving stem cell transplantation (SCT) or chemotherapy only (Analysis 1.5). Moreover, the sensitivity analysis for high versus low risk of overall bias (Analysis 1.6) did not provide any evidence for differences between these groups. The certainty of the evidence is low, due to a confidence interval that includes both, improvement and worsening of QoL (one point downgraded for imprecision) and unblinded outcome assessors (participants) for the participant‐reported outcome (QoL questionnaires) (one point downgraded for risk of bias).

Forest plot of comparison: 1 Physical exercise versus no physical exercise, outcome: 1.4 Quality of life (QoL).
Subscale physical functioning
Eight trials with 1329 participants evaluated physical functioning. There is no significant advantage for participants in the exercise arm (SMD 0.15, 95% CI ‐0.01 to 0.32; Analysis 1.7). Heterogenity is moderate (I² = 48%). The subgroup analysis for stem cell transplantation versus chemotherapy only (Analysis 1.8) and the sensitivity analysis for high versus low risk of overall bias (Analysis 1.9) did not provide any evidence for differences between those groups. Again, the certainty of the evidence is judged to be low, because of the confidence interval that includes both, improvement and worsening of physical functioning (one point downgraded for imprecision) and unblinded outcome assessors (participants) for the participant‐reported outcome (one point downgraded for risk of bias).
Subscale depression
The pooled result of six trials (N = 445) for depression show a small effect for patients exercising (SMD 0.19, 95% CI 0.0 to 0.38; I2 = 0%; Analysis 1.10), without any hints for heterogeneity. The subgroup analysis for stem cell transplantation versus chemotherapy only (Analysis 1.11) and the sensitivity analysis for high versus low risk of overall bias (Analysis 1.12) did not provide any evidence for differences between those groups. As for QoL and the subscale physical functioning, the certainty of the evidence for the outcome depression is low: we downgraded one point for imprecision because of the small number of participants (445) and potential risk of bias (one point downgraded) because of the unblinded outcome assessor (participants for the participant‐reported outcomes).
Subscale anxiety
Anxiety was evaluated by six trials with 445 participants. There is substantial heterogeneity for this analysis (I² = 63%), but no evidence for differences between the exercise arm and the standard treatment arm (SMD 0.03, 95% CI ‐0.30 to 0.36; Analysis 1.13). The subgroup analysis for stem cell transplantation versus chemotherapy only (Analysis 1.14) and the sensitivity analysis for high versus low risk of overall bias (Analysis 1.16) did not provide any evidence for differences between those groups. As for the aforementioned outcomes, we downgraded certainty of the evidence for a confidence interval including both, potential benefit and harm (one point downgraded for imprecision) and potential risk of bias (one point downgraded for risk of bias) because of the unblinded outcome assessor (participants for the participant‐reported outcomes) and in addition, one point downgraded for inconsistency (high statistical heterogeneity). This results in a very low certainty of the evidence.
One trial (Alibhai 2014) delivered data for QoL, physical functioning and depression, but had to be excluded from the meta‐analysis due to the fact that only chance values were reported instead of endpoint values. There were no relevant differences between the results of this and the aforementioned meta‐analysed outcomes.
Fatigue
Nine studies (N = 826) assessed fatigue and found a statistically significant advantage for those participants exercising (SMD 0.31, 95% CI 0.13 to 0.48; P = 0.0005; Analysis 1.15), with moderate heterogeneity (I² = 31%) (see Figure 6). The subgroup analysis for stem cell transplantation versus chemotherapy only (Analysis 1.17) and the sensitivity analysis for high versus low risk of overall bias (Analysis 1.18) did not provide any evidence for differences between those groups. The certainty of the evidence is moderate, as we downgraded one point for risk of bias due to the unblinded outcome assessment.

Forest plot of comparison: 1 Physical exercise versus no physical exercise, outcome: 1.15 Fatigue.
Alibhai 2014 had to be excluded from the meta‐analysis because of reporting of chance scores instead of endpoint values. There was no hint for different results of this trial compared to the pooled analysis.
Physical performance (e.g. aerobic capacity, cardiovascular fitness)
Thirteen studies evaluated physical performance (Alibhai 2014; Baumann 2010; Chang 2008; Coleman 2003; Coleman 2012; Courneya 2009; Furzer 2016; Jarden 2016; Knols 2011; Mello 2003; Persoon 2017; Streckmann 2014; Wiskemann 2015). However, all studies used different concepts, measuring instruments and outcome definitions, and we therefore have not pooled the data.
Alibhai 2014 assessed functional endurance using the six‐minute walk test. Endurance improved in both exercise and control group over the course of the intervention. There were no significant differences reported between the groups for the six‐minute walk test (mean difference (MD) 34.6; P = 0.99), as well as for grip strength (MD 0.16 kg; P = 0.56) and sit and reach test (MD 1.3 cm; P = 0.29).
Baumann 2010 reported statistically significant differences in the inter‐group comparison for repeated measurements for endurance (P = 0.004), endurance time (P = 0.004) and relative endurance (P = 0.031) between the exercise and the control group, favouring the exercise arm. There were no statistically significant intra‐group changes in the exercise arm between admission and discharge, but there were significant changes between these data in the control group. Endurance between these two time points decreased from 86.5 Watt (W) to 60 W (P = 0.001) and endurance time reduced from 5.4 minutes to 3.3 minutes (P < 0.001) in the control group.
Chang 2008 assessed physical performance by a 12‐minute walking test. In this test, participants were encouraged to walk at a speed to reach their specific heart rate, predefined by the study protocol. At baseline there were no statistically significant differences between the two study arms.The authors reported a statistically significant decrease in 12‐minute walking distance for the control group (estimate ‐119.1 metre (m); 95% CI ‐207.1 to ‐31.0 m; P = 0.008). On the other hand, the 12‐minute walking distance for participants in the exercise programme increased over time.
Coleman 2003 investigated the outcomes strength changes and treadmill minutes. Strength changes were tested by four strength tests using Keiser pneumatic equipment. Treadmill minutes, in detail the measurement of aerobic exercise capacity, were measured by a modified Balke protocol. Comparison between exercise and control groups did not achieve statistical significance, either for strength change or for treadmill minutes. The authors provided no further data.
In Coleman 2012 all participants performed a six‐minutes walking test before and after intervention. The mean values for the walking test showed a tendency for improved performance in the short‐term exercise group, but not in the short‐term control group. Aerobic capacity, measured by the six‐minute walking test, decreased over time in both arms, but less so in the exercise group. No further precise data were published for this outcome.
Courneya 2009 measured VO₂ peak power output, VO₂ peak (mL/kg/min) and ventilatory threshold (L/min). In all three measures, the exercise group was statistically significantly superior to the control group.
Furzer 2016 measured cardiovascular fitness and muscle strength. Significant improvements for both measures were found from baseline to 12 weeks (P ≤ 0.001) comparing exercise group to usual care. Additionally, after usual care participants had started exercising from week 12 to week 24, the usual care group showed significantly improved cardiovascular fitness (P = 0.018) and MS (P ≤ 0.001), too.
Jarden 2016 assessed physical capacity and functional performance by measuring six‐minute walking distance, VO2 max, sit‐to‐stand test and biceps curls. Improvements in all measures found in the intervention group differed significantly from the usual care group in favour of the intervention group (P ≤ 0.001)
Knols 2011 reported statistically significantly improved six‐minute walking test results (P = 0.011), increased walking speed (P = 0.000) and improved knee extension for the exercise arm compared to the standard care arm from baseline to follow‐up examination three months after programme completion. The authors found no difference for grip strength between the two arms (P = 0.624).
Mello 2003 reported a significant benefit for the exercise arm measuring maximal isometric voluntary strength from four muscle groups of the upper limbs and five muscle groups of the lower limbs.
Persoon 2017 reported improvements in fitness and reduced levels of fatigue for both the exercise and control group without significant differences between the groups.
Streckmann 2014 reported that the aerobic performance level increased statistically significantly in the exercise group over time compared to the control group with deteriorating activity levels (P = 0.03). This is true for balance control, with improving balance control in the exercise arm and reducing control in the standard arm (dynamic control P = 0.007; static control P = 0.02).
In the trial by Wiskemann 2015, participants in the exercise group achieved statistically significantly more metres in the six‐minute walking test six to eight weeks after discharge; no more detailed data was published.
Anthropometric measurements
Three studies (N = 964) provided data for body weight (Courneya 2009; Jacobsen 2014; Knols 2011). There was no significant difference between exercise and control groups (MD 0.44 kg; 95% CI ‐1,94 to 2,82; P = 0.72; Analysis 1.19), without evidence for heterogeneity (I2 = 0%). The subgroup analysis for stem cell transplantation versus chemotherapy only (Analysis 1.20) and the sensitivity analysis for high versus low risk of overall bias (Analysis 1.21) did not provide any evidence for differences between those groups.
Alibhai 2014 had to be excluded from the meta‐analysis due to reporting change values instead of endpoint values for the outcome body weight. No significant differences between the groups were reported.
Three studies (Courneya 2009; Furzer 2016; Knols 2011, N = 290) measured lean body mass. There was no statistically significant difference between the groups for this outcome (MD 1.26 kg; 95% CI ‐1,22 to 3,74; P = 0.69; I2 = 0%; Analysis 1.22). The subgroup analysis for stem cell transplantation versus chemotherapy only (Analysis 1.23) and the sensitivity analysis for high versus low risk of overall bias (Analysis 1.24) did not provide any evidence for differences between those groups.
Adverse events
Six studies (435 participants) reported serious adverse events (SAEs) (Alibhai 2014; Chang 2008; Coleman 2012; Courneya 2009; Furzer 2016; Persoon 2017) and were pooled in one analysis. There is uncertain evidence whether exercise is related to more serious adverse events (RR 1.39; 95% CI 0.94 to 2.06; P = 0.10; I2 = 0%); Analysis 1.25), without heterogeneity. The certainty of the evidence is very low as we downgraded one point for inconsistency because of baseline imbalances, especially usage of erythropoietin and thalidomide remains unknown in both study arms of one included study. In addition, we downgraded two points for imprecision, as only a very small number of SAEs were observed, leading to very wide confidence intervals.
The subgroup analysis for stem cell transplantation versus chemotherapy only (Analysis 1.26) and the sensitivity analysis for high versus low risk of overall bias (Analysis 1.27) did not provide any evidence for differences between those groups.
Chang 2008 reported that one participant in each arm (8%) dropped out of the study due to a SAE. The participant in the exercise group experienced severe bleeding, and the participant in the control group a severe infection.
In the trial by Coleman 2012, the most common SAEs were fever, hyponatraemia, pneumonia, hyperglycaemia, deep vein thrombosis, infection and neutropenia. In the short‐term groups, 15 out of 23 participants (65%) experienced one or more SAEs, while the corresponding rate in the control group was eight out of 28 participants (28%).
Regarding the long‐term study group, 15 out of 35 participants (43%) in the exercise group experienced at least one SAE and 14 out of 34 (41%) in the control group. As the authors reported variations in cancer treatment between both study arms (whether erythropoietin or thalidomide, or both were administered or not), the reasons for the differences between study arms remain unclear.
Courneya 2009 reported that no SAE occurred in either arm, but three (5%) adverse events (back, hip and knee pain) related to the exercise programme. One participant with knee pain withdrew from the exercise programme, and the other two participants proceeded with a modified exercise programme. In the control group (N = 62) no adverse events were reported (RR 7.23; 95% CI 0.38 to 137.05; P = 0.19).
Alibhai 2014 and Furzer 2016 each reported that no SAE occurred in either arm.
Persoon 2017 reported four SAEs in each arm.
Streckmann 2014 (61 participants) reported that the number of cancer‐related side effects was statistically significantly reduced in the exercise group by 2.1 compared to baseline (P = 0.043). In the control group, the side effects were reduced by only 0.4 (P = 0.514).
Discussion
Summary of main results
For this review we evaluated the safety, feasibility and efficacy of aerobic physical exercise for adults with haematological malignancies. We included 18 randomised controlled trials (RCTs) of which 14 could be included in the analyses with the following results.
-
Only one small trial (105 participants) reported overall survival (OS), without any evidence for a difference between both arms. Additionally, instead of measuring the OS, six trials evaluated mortality (1172 patients). For this outcome there is no evidence for a difference between the exercise and control arms.
-
The quality of life (QoL) was measured in eight studies, but it remains uncertain, whether physical exercise improves QoL (1259 participants). There is no evidence for a difference between participants exercising and those participants receiving standard care only for the subscales physical functioning (1329 participants) and anxiety (445 participants).
-
Nine trials evaluated fatigue (826 participants). There is moderate‐quality evidence that exercise has a positive effect on fatigue. Additionally, there is low‐certainty evidence, that exercise might improve depression (subscale from QoL instruments).
-
Thirteen trials evaluated physical performance. Since they used different concepts, measuring instruments and outcomes, the data could not be pooled. Eight trials reported significant benefits for the exercise arm.
-
Four studies reported anthropometric measurements, without delivering evidence for differences in body weight (964 participants) and lean body mass (290 participants).
-
Serious adverse events (SAEs) were evaluated in six trials (435 participants). Due to very low‐certainty evidence, it remains unclear, whether there is a disadvantage for participants in the exercise arm.
-
Two trials could not be analysed as they did not report any of our pre‐specified patient‐relevant outcomes but laboratory values only. One trial (40 participants) had to be excluded from the meta‐analysis for the endpoints QoL with subscales, fatigue and body weight due to reporting change scores instead of endpoint scores, another trial (17 patients) did not report standard differences or errors.
Overall completeness and applicability of evidence
Interpreting the results of this meta‐analysis, the following aspects should be considered.
-
The 18 included studies, consisting of 1892 participants, may not be adequately powered to detect small differences, especially concerning outcomes with few events.
-
Two of these trials reported laboratory values only, two further trials of this set of included trials could not be meta‐analysed due to missing standard differences or errors or reporting of change scores only.
-
Data appear deficient, in particular for the outcome OS. We noticed a lack of data, which requires further research.
-
The differences in exercise programme (type, duration and follow‐up), supportive care and medical treatment between studies could have influenced the outcomes.
-
Four RCTs are currently ongoing, but as the authors of these trials do not report how many participants they will recruit and when the trial will be terminated, the potential influence of these trials for the current analyses remains uncertain. One of these studies started in 2003 and according to the study registry, clinicaltrials.gov it still seems to be active and recruiting patients.
-
Although there are statistical differences in the fatigue and depression scores, especially the clinical significance for the outcome depression remains uncertain, as the confidence interval of the standardised mean difference (SMD) is very close to the zero effect. As the outcome fatigue was measured with different instruments in various RCTs, we had to meta‐analyse the SMD instead of the mean difference. (MD) The clinical meaning of an advantage in the SMD is always difficult to interpret, because no clinically relevant minimal important difference is known for the standardised value. However, as the effect is quite large, we assume the effect is clinically meaningful.
Quality of the evidence
Overall, we judged the potential risk of bias of the 18 included trials as unclear. All the included trials were reported as randomised and as open‐label studies. In seven of the 18 included studies, the scientific quality of allocation concealment remained unclear. The open‐label design and unclear allocation concealment could lead to selection, performance or detection biases. In the included studies, blinding of participants as well as blinding of physicians in the context of physical exercise was impossible. Consequently, we judged the risk of performance bias as high for all studies. As the outcome mortality is not influenced by the outcome assessor, we judged risk of detection bias for this outcome as low. As it is not feasible to blind the intervention exercise, we judged the risk of detection bias for participant‐reported outcomes as high. For the other reported outcomes, most studies did not report whether outcome assessors were blinded, and we therefore judged risk of detection bias for these outcomes as unclear. For seven trials we judged the potential risk of attrition bias as high, because not all participants randomised were analysed.
We judged the certainty of the evidence body as low to moderate for most outcomes, because of an open‐label design, unblinded outcome assessment and a small number of events, leading to wide confidence intervals and imprecision of the results. For the outcome anxiety, we judged the certainty of the evidence body as very low, due to the aforementioned reasons and additionally high statistical heterogeneity, leading to relevant inconsistency. For SAEs, we also judged the certainty as very low, because of baseline imbalances. Especially the usage of erythropoietin and thalidomide was unknown for both arms of one trial and both agents are known to have a high potential for SAEs. This led to downgrading by one point for inconsistency. In addition, very wide confidence intervals led to downgrading (two points) for imprecision.
Potential biases in the review process
We tried to avoid bias by doing all relevant processes in duplicate. We are not aware of any obvious deficiencies in our process of conducting the review. With sensitive search strategies and handsearching of conference proceedings, we tried to avoid retrieval bias.
As the number of included studies is too low to perform tests for publication bias, we cannot be sure that we obtained all relevant studies. Moreover, as this type of intervention, aerobic physical exercise, is usually evaluated in investigator‐initiated trials, there is no manufacturer or company available to ask for missing data. Additionally, for an intervention like physical exercise there might be less need to be registered in advance in clinical trials registries, as this applies more cogently to RCTs of pharmaceutical interventions. We included four trials in the review, but without sufficient data to be used in the meta‐analyses. Two of these trials reported laboratory values only, the other two trials reported data without confidence intervals or standard deviations. Addtionally, the four RCTs which are currently ongoing did not report when they will be terminated and how many participants they plan to recruit. Thus, the potential influence of these trials for the current meta‐analyses remains unclear. One of these four studies if of special concern, as it started in 2003 and according to the study registry, clinicaltrials.gov, it still seems to be active and recruiting patients (last access 9 September 2018). All these points could have induced publication bias.
Agreements and disagreements with other studies or reviews
This is the update of a review published first in 2014, based on RCTs assessing the efficacy, safety and feasibility of aerobic exercise for adult patients suffering from haematological malignancies.
We identified two recent systematic reviews and meta‐analyses which are comparable to our analyses, as they also included patients with haematological malignancies and evaluated exercise interventions.
Zhou 2016 and colleagues investigated the effects of exercise in paediatric or adult patients with acute leukaemia. The authors included nine trials with 314 participants (eight RCTs and one quasi‐experimental design).Two of these trials have been conducted in adults and were also included in this review update (Alibhai 2014; Chang 2008), the remaining trials evaluated children. The review authors came to the conclusion that exercise compared to no exercise has positive effects on cardiorespiratory fitness, muscle strength and functional mobility. However, as they did not assess the certainty of the evidence, they did not take the very small number of participants, the mixed participant population (children and adults) and the clinical and statistical heterogeneity into account while interpreting their data. As the review authors came to their conclusions because of significant P values only, they might have overrated their results. The review did not find significant results for participants exercising for the outcomes fatigue, anxiety, depression or quality of life and concluded that these outcomes are not improved. Again, the interpretation of results based on P values only could be misleading, as a non‐significant P value in such a small population could be explained by the small sample size which is not large enough to detect significant differences.
Liang 2018 and colleagues assessed the effect of exercise for participants with haematological malignancies who were also haematopoietic stem cell transplantation recipients. The authors included RCTs only and included 10 trials with 607 participants. Eight of these trials are also included in the current version of this review update, two trials they included have been excluded in our review, as patients did not practice aerobic exercise, but strength training only (Hacker 2011; Hacker 2016). As discussed before, these review authors also interpreted their findings based on significant or non‐significant P values only, which might overestimate an imprecise, indirect or inconsistent effect. Liang 2018's results for the outcome fatigue are in line with our review, showing an advantage for those patients exercising compared to them not exercising. They also concluded that muscle strength and quality of life is improved for participants exercising. We did not find evidence for improved quality of life, due to the small sample size. However, as the effect estimate in our analysis is in favour for participants exercising, further studies and a larger number of included participants might change the currently non‐significant result to a significant result favouring the exercise arm. As mentioned before, Liang 2018's conclusion that exercise has no effect on participants' cardiorespiratory fitness, upper muscle strength, psychosocial fitness and adverse events could be misleading, as no effect is not the same as no evidence for a difference and could be explained by a small sample population only.


'Risk of bias' graph: review authors' judgements about each risk of bias item presented as percentages across all included studies.

'Risk of bias' summary: review authors' judgements about each risk of bias item for each included study.

Forest plot of comparison: 1 Physical exercise versus no physical exercise, outcome: 1.2 Mortality.
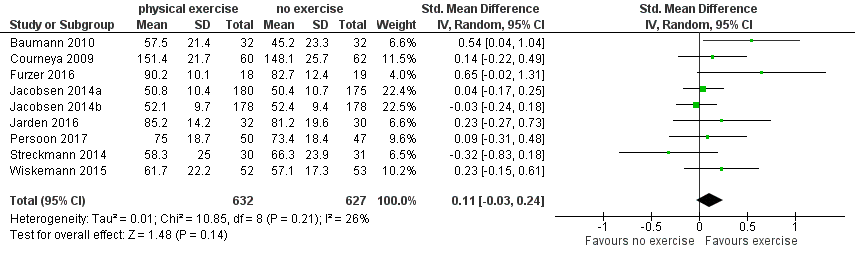
Forest plot of comparison: 1 Physical exercise versus no physical exercise, outcome: 1.4 Quality of life (QoL).

Forest plot of comparison: 1 Physical exercise versus no physical exercise, outcome: 1.15 Fatigue.
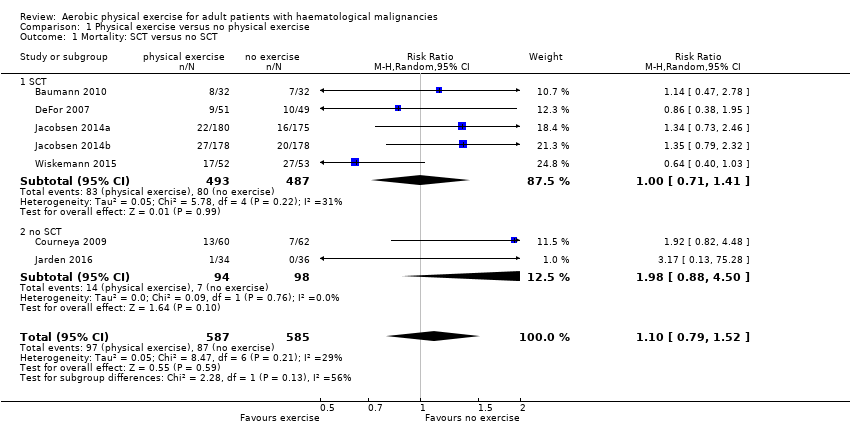
Comparison 1 Physical exercise versus no physical exercise, Outcome 1 Mortality: SCT versus no SCT.

Comparison 1 Physical exercise versus no physical exercise, Outcome 2 Mortality.

Comparison 1 Physical exercise versus no physical exercise, Outcome 3 Mortality sensitivity analysis: high risk of bias versus low risk of bias.

Comparison 1 Physical exercise versus no physical exercise, Outcome 4 Quality of life (QoL).

Comparison 1 Physical exercise versus no physical exercise, Outcome 5 QoL: SCT versus no SCT.

Comparison 1 Physical exercise versus no physical exercise, Outcome 6 QoL sensitivity analysis: high risk of bias versus low risk of bias.

Comparison 1 Physical exercise versus no physical exercise, Outcome 7 Physical functioning/QoL.

Comparison 1 Physical exercise versus no physical exercise, Outcome 8 Physical functioning/QoL: SCT versus no SCT.
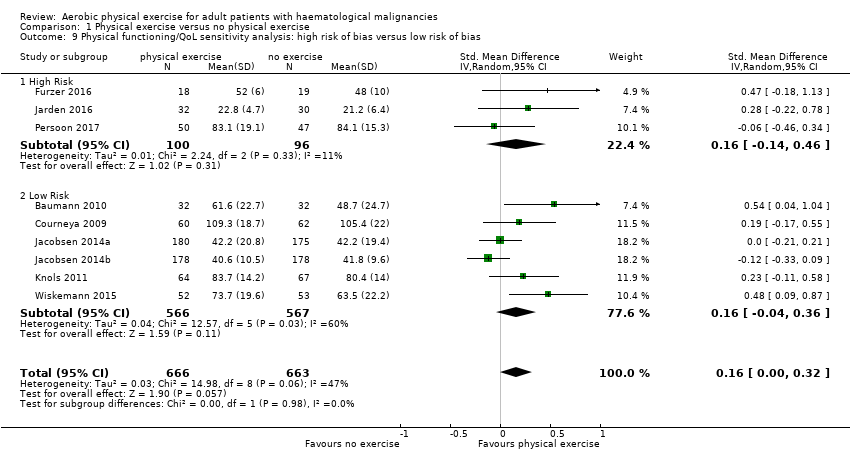
Comparison 1 Physical exercise versus no physical exercise, Outcome 9 Physical functioning/QoL sensitivity analysis: high risk of bias versus low risk of bias.

Comparison 1 Physical exercise versus no physical exercise, Outcome 10 Depression/QoL.

Comparison 1 Physical exercise versus no physical exercise, Outcome 11 Depression/QoL: SCT versus no SCT.

Comparison 1 Physical exercise versus no physical exercise, Outcome 12 Depression/QoL sensitivity analysis: high risk of bias versus low risk of bias.
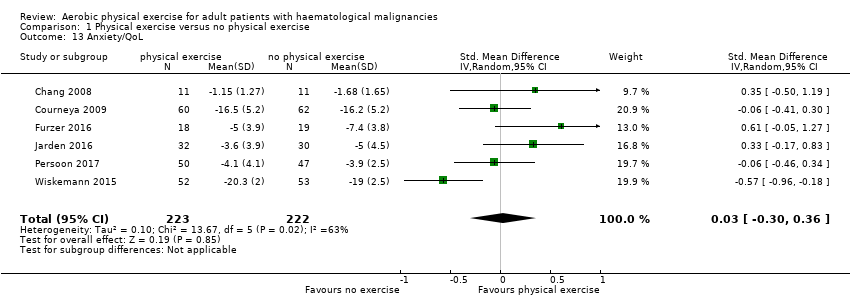
Comparison 1 Physical exercise versus no physical exercise, Outcome 13 Anxiety/QoL.
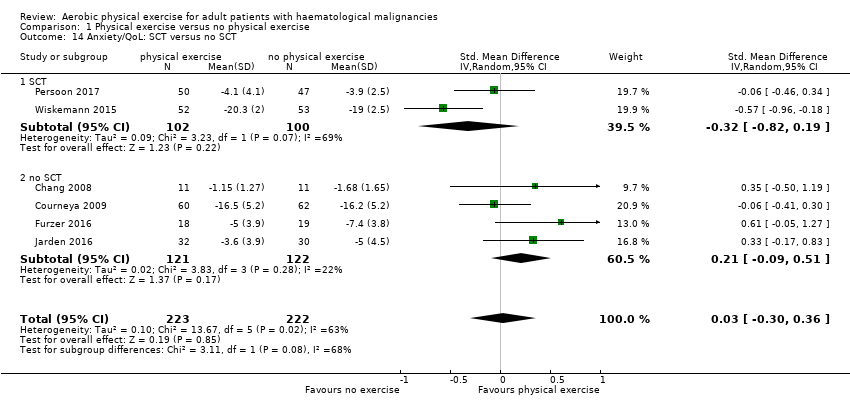
Comparison 1 Physical exercise versus no physical exercise, Outcome 14 Anxiety/QoL: SCT versus no SCT.
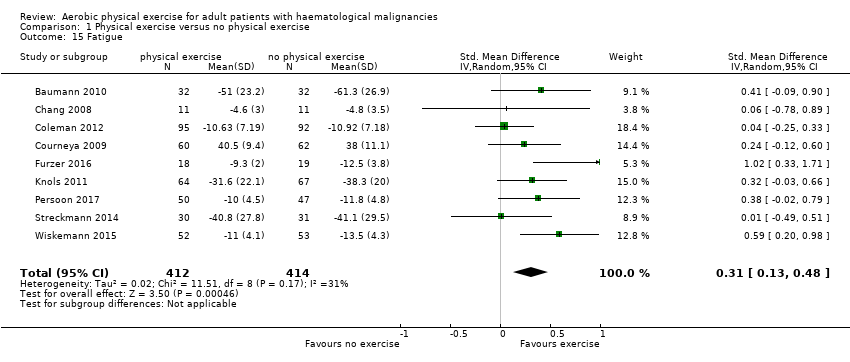
Comparison 1 Physical exercise versus no physical exercise, Outcome 15 Fatigue.

Comparison 1 Physical exercise versus no physical exercise, Outcome 16 Anxiety/QoL sensitivity analysis: high risk of bias versus low risk of bias.

Comparison 1 Physical exercise versus no physical exercise, Outcome 17 Fatigue: SCT versus no SCT.

Comparison 1 Physical exercise versus no physical exercise, Outcome 18 Fatigue sensitivity analysis: high risk of bias versus low risk of bias.
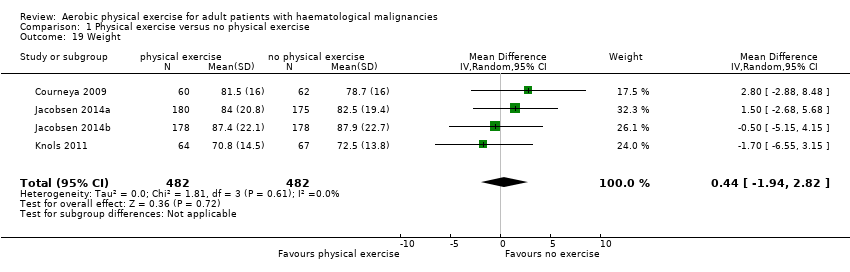
Comparison 1 Physical exercise versus no physical exercise, Outcome 19 Weight.
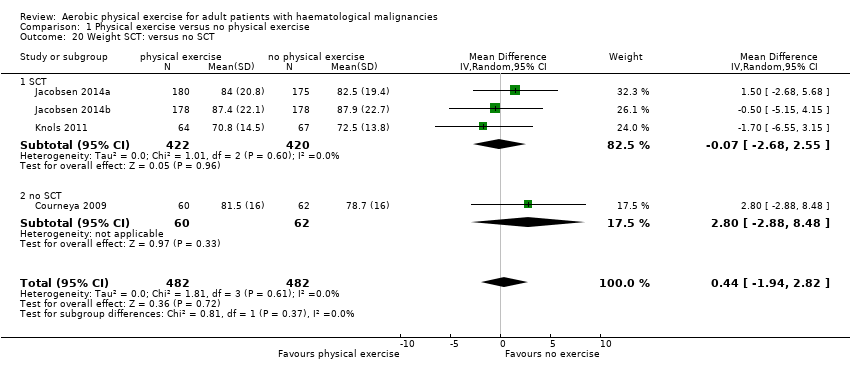
Comparison 1 Physical exercise versus no physical exercise, Outcome 20 Weight SCT: versus no SCT.

Comparison 1 Physical exercise versus no physical exercise, Outcome 21 Weight sensitivity analysis: high risk of bias versus low risk of bias.
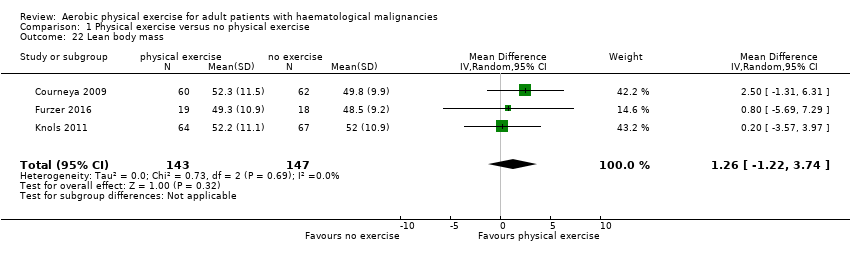
Comparison 1 Physical exercise versus no physical exercise, Outcome 22 Lean body mass.

Comparison 1 Physical exercise versus no physical exercise, Outcome 23 Lean body mass: SCT versus no SCT.

Comparison 1 Physical exercise versus no physical exercise, Outcome 24 Lean body mass sensitivity analysis: high risk of bias versus low risk of bias.

Comparison 1 Physical exercise versus no physical exercise, Outcome 25 Serious adverse events (SAEs).

Comparison 1 Physical exercise versus no physical exercise, Outcome 26 Serious adverse events (SAEs): SCT versus no SCT.

Comparison 1 Physical exercise versus no physical exercise, Outcome 27 Serious adverse events (SAEs) sensitivity analysis: high risk of bias versus low risk of bias.
| Physical exercise versus no physical exercise for adults with haematological malignancies | ||||||
| Patient or population: Adults with haematological malignancies | ||||||
| Outcomes | Illustrative comparative risks* (95% CI) | Relative effect | No of Participants | Quality of the evidence | Comments | |
| Assumed risk | Corresponding risk | |||||
| Control group without exercise | Physical exercise | |||||
| Mortality | 149 per 1.000 | 164 per 1.000 (117 to 226) | RR 1.10 (0.79 to 1.52) | 1172 | ⊕⊕⊝⊝ | |
| Quality of Life | The mean QoL score in the intervention group was | SMD 0.11 higher | 1259 (8 RCTs) | ⊕⊕⊝⊝ | ||
| Physical functioning/QoL with 1 indicating best outcome | The mean physical functioning/QoL score in the intervention group was 0.15 higher (better) | SMD 0.15 higher | 1329 | ⊕⊕⊝⊝ | ||
| Depression/QoL with 1 indicating best outcome | The mean depression/QoL score in the intervention group was 0.19 higher (better) | SMD 0.19 higher | 445 | ⊕⊕⊝⊝ | ||
| Anxiety/QoL with 1 indicating best outcome | The mean anxiety/QoL score in the intervention group was 0.03 higher (better) | SMD 0.03 higher | 445 | ⊕⊝⊝⊝ | ||
| Fatigue with 1 indicating best outcome | The mean fatigue score in the intervention group was 0.31 higher (better) (0.13 higher to 0.48 higher) | SMD 0.31 higher (0.13 higher to 0.48 higher) | 826 | ⊕⊕⊕⊝ | ||
| Serious adverse events | 174 per 1.000 | 242 per 1.000 (164 to 359) | RR 1.39 (0.94 to 2.06) | 435 | ⊕⊝⊝⊝ | |
| *The basis for the assumed risk (e.g. the median control group risk across studies) is provided in footnotes. The corresponding risk (and its 95% confidence interval) is based on the assumed risk in the comparison group and the relative effect of the intervention (and its 95% CI). | ||||||
| GRADE Working Group grades of evidence | ||||||
| 1Small number of participants/events leads to downgrading (1 point) for imprecision. 2Confidence interval including clinically relevant benefits or harms leads to downgrading (1 point) for imprecision. 3Outcome assessor (participant) not blinded in participant‐reported outcome (QoL questionnaires) leads to downgrading by one point for risk of bias. 4 High heterogeneity leads to downgrading by one point due to inconsistency. 5 Baseline imbalances, especially usage of erythropoietin and thalidomide unknown in both intervention arms leads to downgrading by one point due to inconsistency. 6Very small number of participants and events, very wide confidence interval to downgrading (2 points) for imprecision. | ||||||
| Outcome or subgroup title | No. of studies | No. of participants | Statistical method | Effect size |
| 1 Mortality: SCT versus no SCT Show forest plot | 7 | 1172 | Risk Ratio (M‐H, Random, 95% CI) | 1.10 [0.79, 1.52] |
| 1.1 SCT | 5 | 980 | Risk Ratio (M‐H, Random, 95% CI) | 1.00 [0.71, 1.41] |
| 1.2 no SCT | 2 | 192 | Risk Ratio (M‐H, Random, 95% CI) | 1.98 [0.88, 4.50] |
| 2 Mortality Show forest plot | 7 | 1172 | Risk Ratio (M‐H, Random, 95% CI) | 1.10 [0.79, 1.52] |
| 3 Mortality sensitivity analysis: high risk of bias versus low risk of bias Show forest plot | 7 | 1172 | Risk Ratio (M‐H, Random, 95% CI) | 1.10 [0.79, 1.52] |
| 3.1 High Risk | 1 | 70 | Risk Ratio (M‐H, Random, 95% CI) | 3.17 [0.13, 75.28] |
| 3.2 Low Risk | 6 | 1102 | Risk Ratio (M‐H, Random, 95% CI) | 1.09 [0.77, 1.53] |
| 4 Quality of life (QoL) Show forest plot | 9 | 1259 | Std. Mean Difference (IV, Random, 95% CI) | 0.11 [‐0.03, 0.24] |
| 5 QoL: SCT versus no SCT Show forest plot | 9 | 1259 | Std. Mean Difference (IV, Random, 95% CI) | 0.11 [‐0.03, 0.24] |
| 5.1 SCT | 5 | 977 | Std. Mean Difference (IV, Random, 95% CI) | 0.09 [‐0.06, 0.24] |
| 5.2 no SCT | 4 | 282 | Std. Mean Difference (IV, Random, 95% CI) | 0.14 [‐0.20, 0.47] |
| 6 QoL sensitivity analysis: high risk of bias versus low risk of bias Show forest plot | 9 | 1259 | Std. Mean Difference (IV, Random, 95% CI) | 0.11 [‐0.03, 0.24] |
| 6.1 High Risk | 4 | 257 | Std. Mean Difference (IV, Random, 95% CI) | 0.12 [‐0.22, 0.47] |
| 6.2 Low Risk | 5 | 1002 | Std. Mean Difference (IV, Random, 95% CI) | 0.10 [‐0.05, 0.25] |
| 7 Physical functioning/QoL Show forest plot | 9 | 1329 | Std. Mean Difference (IV, Random, 95% CI) | 0.15 [‐0.01, 0.32] |
| 8 Physical functioning/QoL: SCT versus no SCT Show forest plot | 9 | 1329 | Std. Mean Difference (IV, Random, 95% CI) | 0.16 [‐0.00, 0.32] |
| 8.1 SCT | 6 | 1108 | Std. Mean Difference (IV, Random, 95% CI) | 0.13 [‐0.07, 0.33] |
| 8.2 no SCT | 3 | 221 | Std. Mean Difference (IV, Random, 95% CI) | 0.26 [‐0.00, 0.53] |
| 9 Physical functioning/QoL sensitivity analysis: high risk of bias versus low risk of bias Show forest plot | 9 | 1329 | Std. Mean Difference (IV, Random, 95% CI) | 0.16 [‐0.00, 0.32] |
| 9.1 High Risk | 3 | 196 | Std. Mean Difference (IV, Random, 95% CI) | 0.16 [‐0.14, 0.46] |
| 9.2 Low Risk | 6 | 1133 | Std. Mean Difference (IV, Random, 95% CI) | 0.16 [‐0.04, 0.36] |
| 10 Depression/QoL Show forest plot | 6 | 445 | Std. Mean Difference (IV, Random, 95% CI) | 0.19 [0.00, 0.38] |
| 11 Depression/QoL: SCT versus no SCT Show forest plot | 6 | 445 | Std. Mean Difference (IV, Random, 95% CI) | 0.19 [0.00, 0.38] |
| 11.1 SCT | 2 | 202 | Std. Mean Difference (IV, Random, 95% CI) | 0.15 [‐0.32, 0.63] |
| 11.2 no SCT | 4 | 243 | Std. Mean Difference (IV, Random, 95% CI) | 0.22 [‐0.04, 0.47] |
| 12 Depression/QoL sensitivity analysis: high risk of bias versus low risk of bias Show forest plot | 6 | 445 | Std. Mean Difference (IV, Random, 95% CI) | 0.19 [0.00, 0.38] |
| 12.1 High Risk | 4 | 218 | Std. Mean Difference (IV, Random, 95% CI) | 0.12 [‐0.15, 0.38] |
| 12.2 Low Risk | 2 | 227 | Std. Mean Difference (IV, Random, 95% CI) | 0.26 [‐0.00, 0.52] |
| 13 Anxiety/QoL Show forest plot | 6 | 445 | Std. Mean Difference (IV, Random, 95% CI) | 0.03 [‐0.30, 0.36] |
| 14 Anxiety/QoL: SCT versus no SCT Show forest plot | 6 | 445 | Std. Mean Difference (IV, Random, 95% CI) | 0.03 [‐0.30, 0.36] |
| 14.1 SCT | 2 | 202 | Std. Mean Difference (IV, Random, 95% CI) | ‐0.32 [‐0.82, 0.19] |
| 14.2 no SCT | 4 | 243 | Std. Mean Difference (IV, Random, 95% CI) | 0.21 [‐0.09, 0.51] |
| 15 Fatigue Show forest plot | 9 | 826 | Std. Mean Difference (IV, Random, 95% CI) | 0.31 [0.13, 0.48] |
| 16 Anxiety/QoL sensitivity analysis: high risk of bias versus low risk of bias Show forest plot | 6 | 445 | Std. Mean Difference (IV, Random, 95% CI) | 0.03 [‐0.30, 0.36] |
| 16.1 High Risk | 4 | 218 | Std. Mean Difference (IV, Random, 95% CI) | 0.22 [‐0.08, 0.51] |
| 16.2 Low Risk | 2 | 227 | Std. Mean Difference (IV, Random, 95% CI) | ‐0.31 [‐0.81, 0.20] |
| 17 Fatigue: SCT versus no SCT Show forest plot | 9 | 826 | Std. Mean Difference (IV, Random, 95% CI) | 0.31 [0.13, 0.48] |
| 17.1 SCT | 5 | 584 | Std. Mean Difference (IV, Random, 95% CI) | 0.31 [0.12, 0.51] |
| 17.2 no SCT | 4 | 242 | Std. Mean Difference (IV, Random, 95% CI) | 0.30 [‐0.09, 0.69] |
| 18 Fatigue sensitivity analysis: high risk of bias versus low risk of bias Show forest plot | 9 | 826 | Std. Mean Difference (IV, Random, 95% CI) | 0.31 [0.13, 0.48] |
| 18.1 High Risk | 5 | 404 | Std. Mean Difference (IV, Random, 95% CI) | 0.26 [‐0.06, 0.57] |
| 18.2 Low Risk | 4 | 422 | Std. Mean Difference (IV, Random, 95% CI) | 0.37 [0.18, 0.57] |
| 19 Weight Show forest plot | 4 | 964 | Mean Difference (IV, Random, 95% CI) | 0.44 [‐1.94, 2.82] |
| 20 Weight SCT: versus no SCT Show forest plot | 4 | 964 | Mean Difference (IV, Random, 95% CI) | 0.44 [‐1.94, 2.82] |
| 20.1 SCT | 3 | 842 | Mean Difference (IV, Random, 95% CI) | ‐0.07 [‐2.68, 2.55] |
| 20.2 no SCT | 1 | 122 | Mean Difference (IV, Random, 95% CI) | 2.80 [‐2.88, 8.48] |
| 21 Weight sensitivity analysis: high risk of bias versus low risk of bias Show forest plot | 4 | 964 | Mean Difference (IV, Random, 95% CI) | 0.44 [‐1.94, 2.82] |
| 21.1 Low Risk | 4 | 964 | Mean Difference (IV, Random, 95% CI) | 0.44 [‐1.94, 2.82] |
| 21.2 High Risk | 0 | 0 | Mean Difference (IV, Random, 95% CI) | 0.0 [0.0, 0.0] |
| 22 Lean body mass Show forest plot | 3 | 290 | Mean Difference (IV, Random, 95% CI) | 1.26 [‐1.22, 3.74] |
| 23 Lean body mass: SCT versus no SCT Show forest plot | 3 | 290 | Mean Difference (IV, Random, 95% CI) | 1.26 [‐1.22, 3.74] |
| 23.1 SCT | 1 | 131 | Mean Difference (IV, Random, 95% CI) | 0.20 [‐3.57, 3.97] |
| 23.2 no SCT | 2 | 159 | Mean Difference (IV, Random, 95% CI) | 2.06 [‐1.22, 5.35] |
| 24 Lean body mass sensitivity analysis: high risk of bias versus low risk of bias Show forest plot | 3 | 290 | Mean Difference (IV, Random, 95% CI) | 1.26 [‐1.22, 3.74] |
| 24.1 High Risk | 1 | 37 | Mean Difference (IV, Random, 95% CI) | 0.80 [‐5.69, 7.29] |
| 24.2 Low Risk | 2 | 253 | Mean Difference (IV, Random, 95% CI) | 1.34 [‐1.34, 4.02] |
| 25 Serious adverse events (SAEs) Show forest plot | 6 | 435 | Risk Ratio (M‐H, Random, 95% CI) | 1.39 [0.94, 2.06] |
| 26 Serious adverse events (SAEs): SCT versus no SCT Show forest plot | 6 | 435 | Risk Ratio (M‐H, Random, 95% CI) | 1.39 [0.94, 2.06] |
| 26.1 SCT | 3 | 254 | Risk Ratio (M‐H, Random, 95% CI) | 1.40 [0.94, 2.09] |
| 26.2 no SCT | 3 | 181 | Risk Ratio (M‐H, Random, 95% CI) | 1.0 [0.07, 14.21] |
| 27 Serious adverse events (SAEs) sensitivity analysis: high risk of bias versus low risk of bias Show forest plot | 6 | 435 | Risk Ratio (M‐H, Random, 95% CI) | 1.39 [0.94, 2.06] |
| 27.1 High Risk | 5 | 313 | Risk Ratio (M‐H, Random, 95% CI) | 1.39 [0.94, 2.06] |
| 27.2 Low Risk | 1 | 122 | Risk Ratio (M‐H, Random, 95% CI) | 0.0 [0.0, 0.0] |