Vacunación profiláctica contra el virus del papiloma humano para prevenir el cáncer de cuello uterino y sus precursores
Resumen
Antecedentes
La infección persistente con los tipos de virus del papiloma humano de alto riesgo (VPH‐AR) se relaciona de manera causal con el desarrollo del precáncer y el cáncer de cuello uterino. Los tipos de VPH 16 y 18 causan aproximadamente el 70% de los cánceres de cuello uterino en todo el mundo.
Objetivos
Evaluar los daños y la protección de las vacunas profilácticas contra el virus del papiloma humano (VPH) contra el precáncer de cuello uterino y la infección por VPH16/18 en las adolescentes y las mujeres.
Métodos de búsqueda
Se hicieron búsquedas en MEDLINE, el Registro Cochrane Central de Ensayos Controlados (Cochrane Central Register of Controlled Trials) (CENTRAL) y en Embase (junio 2017) para obtener informes de los ensayos sobre los efectos. Se realizaron búsquedas en los registros de ensayos y en los registros de resultados de las empresas para identificar datos no publicados sobre la mortalidad y los eventos adversos graves.
Criterios de selección
Ensayos controlados aleatorizados que compararon la eficacia y la seguridad en mujeres a las que se les ofrece la vacuna contra el VPH con placebo (adyuvantes de la vacuna u otra vacuna control).
Obtención y análisis de los datos
Se utilizó la metodología Cochrane y los criterios GRADE para calificar la certeza de la evidencia para la protección contra el precáncer cervical (neoplasia intraepitelial cervical de grado 2 y superior [NIC2+], NIC de grado 3 y superior [NIC3+], y adenocarcinoma in situ [AIS]), y para los daños. Se diferenciaron los efectos de las vacunas según el estado inicial del ADN del VPH de las participantes. Los resultados fueron precáncer asociado a los tipos de VPH de la vacuna y precáncer independiente del tipo de VPH. Los resultados se presentan como riesgos en los grupos control y de vacunación y riesgos relativos (RR), con los intervalos de confianza del 95% entre paréntesis.
Resultados principales
Se incluyeron 26 ensayos (73 428 participantes). Diez ensayos, con un seguimiento de 1,3 a ocho años, abordaron la protección contra la NIC/AIS. La seguridad de la vacuna se evaluó durante un período de seis meses a siete años en 23 estudios. Los estudios no fueron suficientemente grandes ni de suficiente duración como para evaluar los resultados del cáncer de cuello uterino. Todos los ensayos menos uno fueron financiados por los fabricantes de la vacuna. Se consideró que la mayoría de los ensayos incluidos tuvieron bajo riesgo de sesgo. Los estudios incluyeron vacunas monovalentes (n = 1), bivalentes (n = 18) y cuatrivalentes (n = 7). La mayoría de las mujeres eran menores de 26 años. Tres ensayos reclutaron mujeres de 25 años o más. Se resumieron los efectos de las vacunas en las participantes que recibieron al menos una inmunización.
Variables principales de evaluación de eficacia según el estado inicial del ADN del VPH
Negativo a HPV de alto riesgo
Las vacunas contra el VPH reducen la NIC2+, la NIC3+ y el AIS asociados al VPH16/18, en comparación con placebo, en las adolescentes y mujeres de 15 a 26 años. Hay evidencia de certeza alta de que las vacunas disminuyen la NIC2+ de 164 a 2/10 000 (RR 0,01 [0 a 0,05]) y la NIC3+ de 70 a 0/10 000 (RR 0,01 [0,00 a 0,10]). Hay evidencia de certeza moderada de que las vacunas reducen el riesgo de AIS de 9 a 0/10 000 (RR 0,10 ([0,01 a 0,82]).
Las vacunas contra el VPH reducen el riesgo de cualquier NIC2+ de 287 a 106/10 000 (RR 0,37 [0,25 a 0,55], certeza alta) y probablemente reducen cualquier lesión de AIS de 10 a 0/10 000 (RR 0,1 [0,01 a 0,76], certeza moderada). El tamaño de la reducción de la NIC3+ con las vacunas difirió entre las vacunas bivalentes y las cuatrivalentes (bivalentes: RR 0,08 [0,03 a 0,23], certeza alta; cuatrivalentes: RR 0,54 [0,36 a 0,82], certeza moderada). Los datos de las mujeres de más edad no estuvieron disponibles para esta comparación.
HPV16/18 negativo
En las personas de 15 a 26 años de edad, las vacunas reducen la NIC2+ asociada al VPH16/18 de 113 a 6 /10 000 (RR 0,05 [0,03 a 0,10]). En las mujeres de 24 años o más, la reducción absoluta y relativa del riesgo de estas lesiones es menor (de 45 a 14/10 000; RR 0,30 [0,11 a 0,81], certeza moderada). Las vacunas contra el VPH reducen el riesgo de NIC3+ y AIS asociado al VPH16/18 en mujeres jóvenes (RR 0,05 [0,02 a 0,14], certeza alta y RR 0,09 [0,01 a 0,72], certeza moderada, respectivamente). Ningún ensayo en mujeres de más edad ha medido estos resultados.
Las vacunas reducen cualquier NIC2+ de 231 a 95/10 000 (RR 0,41 [0,32 a 0,52]) en mujeres jóvenes. No se han informado datos sobre lesiones más graves.
Independientemente del estado del ADN del VPH
En las mujeres más jóvenes, las vacunas contra el VPH reducen el riesgo de NIC2+ asociado con el VPH16/18 de 341 a 157/10 000 (RR 0,46 [0,37 a 0,57], certeza alta). Se observaron reducciones similares del riesgo para la NIC3+ asociada con el VPH16/18 (certeza alta). El número de mujeres con AIS asociado al VPH16/18 se reduce de 14 a 5/10 000 con las vacunas contra el VPH (certeza alta).
Las vacunas contra el VPH reducen cualquier NIC2+ de 559 a 391/10 000 (RR 0,70 [0,58 a 0,85]; certeza alta) y cualquier AIS de 17 a 5/10 000 (RR 0,32 [0,15 a 0,67]; certeza alta). La reducción de cualquier NIC3+ difirió según el tipo de vacuna (vacuna bivalente: RR 0,55 [0,43 a 0,71]; vacuna cuatrivalente: RR 0,81 [0,69 a 0,96]).
En las mujeres vacunadas entre los 24 y los 45 años de edad, hay evidencia de certeza moderada de que los riesgos de NIC2+ asociados con el VPH16/18 y cualquier NIC2+ son similares entre las mujeres vacunadas y las no vacunadas (RR 0,74 [0,52 a 1,05] y RR 1,04 [0,83 a 1,30] respectivamente). No hay datos en este grupo de edad para la NIC3+ o el AIS.
Efectos adversos
El riesgo de eventos adversos graves es similar entre el control y las vacunas contra el VPH en mujeres de todas las edades (669 frente a 656/10 000; RR 0,98 [0,92 a 1,05], certeza alta). La mortalidad fue 11/10 000 en los grupos control, en comparación con 14/10 000 (9 a 22) con la vacuna contra el VPH (RR 1,29 [0,85 a 1,98]; certeza baja). El número de muertes fue bajo en general, pero hay un mayor número de muertes en las mujeres de más edad. No se ha establecido un patrón en cuanto a la causa o el momento de la muerte.
Resultados del embarazo
Entre las que se quedaron embarazadas durante los estudios, no se encontró un mayor riesgo de aborto (1618 versus 1424/10 000, RR 0,88 [0,68 a 1,14], certeza alta) ni de interrupción del embarazo (931 versus 838/10 000 RR 0,90 [0,80 a 1,02], certeza alta). Los efectos sobre las anomalías congénitas y los mortinatos son inciertos (RR 1,22 [0,88 a 1,69], certeza moderada; y RR 1,12 [0,68 a 1,83], certeza moderada, respectivamente).
Conclusiones de los autores
Hay evidencia de certeza alta de que las vacunas contra el VPH protegen contra el precáncer del cuello uterino en las adolescentes y las mujeres jóvenes de 15 a 26 años. El efecto es mayor en las lesiones asociadas con el VPH16/18 que en las lesiones independientemente del tipo de VPH. El efecto es mayor en las mujeres negativas para el VPH de alto riesgo o el ADN del VPH16/18 en el momento del reclutamiento, en comparación con las que no se seleccionaron según el estado del ADN del VPH. Hay evidencia de certeza moderada de que las vacunas contra el VPH reducen la NIC2+ en las mujeres de más edad VPH16/18 negativas, pero no cuando no se seleccionan según el estado del ADN del VPH.
No se encontró un mayor riesgo de efectos adversos graves. Aunque el número de muertes es bajo en general, hubo más muertes entre las mujeres mayores de 25 años que recibieron la vacuna. Se ha considerado que las muertes informadas en los estudios no están relacionadas con la vacuna. No es posible excluir un riesgo mayor de resultados adversos del embarazo después de la vacunación contra el VPH, aunque el riesgo de aborto espontáneo y de interrupción del embarazo son similares entre los brazos de ensayo. Se necesita un seguimiento a largo plazo para monitorizar la repercusión sobre el cáncer de cuello uterino, la aparición de daños poco frecuentes y los resultados del embarazo.
PICO
Resumen en términos sencillos
Vacunación contra el VPH para prevenir el cáncer y los cambios precancerosos del cuello uterino
Antecedentes
Algunos tipos de VPH se transmiten sexualmente y son frecuentes en los jóvenes. Normalmente los elimina el sistema inmunológico. Sin embargo, cuando los tipos de alto riesgo persisten, pueden causar el desarrollo de células cervicales anormales, que se denominan precáncer de cuello uterino, si se afectan al menos dos tercios de la capa superficial del cuello uterino. El precáncer se puede convertir en cáncer de cuello uterino después de varios años. No todas las personas que tienen un precáncer de cuello de útero desarrollan cáncer de cuello de útero, pero predecir quién lo hará es difícil. Hay un número de diferentes tipos de VPH que pueden causar un precáncer y cáncer de cuello uterino. Los VPH 16 y 18 son los tipos de alto riesgo más importantes, ya que causan alrededor del 70% de los cánceres de cuello uterino en todo el mundo. La vacunación preventiva, mediante la inyección de partículas similares al virus del VPH en el músculo, desencadena la producción de anticuerpos que protegen contra futuras infecciones de VPH.
Pregunta de la revisión
¿La vacuna contra el VPH previene el desarrollo de un precáncer o cáncer cervical?, y ¿cuáles son los daños?
Resultados principales
Se incluyeron 26 estudios en los que participaron 73 428 adolescentes y mujeres. Todos los ensayos evaluaron la seguridad de la vacuna durante un período de 0,5 a siete años, y diez ensayos, con un seguimiento de 3,5 a ocho años, abordaron la protección contra el precáncer. No se dispone de los resultados del cáncer de cuello uterino. La mayoría de las participantes reclutadas eran menores de 26 años de edad. Tres ensayos reclutaron mujeres de entre 25 y 45 años. Los estudios compararon la vacuna contra el VPH con una vacuna simulada.
Se evaluó la protección contra el precáncer en mujeres que no presentaban VPH ni VPH16/18, o en las que tenían o no infección por VPH en el momento de la vacunación. Se evaluó por separado el precáncer asociado al VPH16/18 y cualquier otro precáncer.
Protección contra el precáncer cervical
1) Mujeres sin VPH‐AR
Los resultados solo se midieron en el grupo de edad más joven para esta comparación (15 a 25 años). Las vacunas contra el VPH reducen el riesgo de precáncer de cuello uterino asociado al VPH16/18 de 164 a 2/10 000 mujeres (certeza alta). También reducen cualquier pre‐cáncer de 287 a 106/10 000 (certeza alta).
2) Mujeres sin VPH16/18
El efecto de las vacunas contra el VPH sobre el riesgo de precáncer difiere según el grupo de edad. En las mujeres más jóvenes, las vacunas contra el VPH reducen el riesgo de precáncer asociado al VPH16/18 de 113 a 6/10 000 mujeres (certeza alta). Las vacunas contra el VPH disminuyen el número de mujeres con cualquier precáncer de 231 a 95/10 000 (certeza alta). En las mujeres mayores de 25 años, las vacunas reducen el número de casos de precáncer asociados al VPH16/18 de 45 a 14/10 000 (certeza moderada).
3) Todas las mujeres con o sin infección de VPH
En las personas vacunadas entre 15 y 26 años de edad, la vacunación contra el VPH reduce el riesgo de precáncer asociado con el VPH16/18 de 341 a 157/10 000 (certeza alta) y cualquier precáncer de 559 a 391/10 000 (certeza alta).
En las mujeres mayores, vacunadas entre 25 y 45 años, los efectos de la vacuna contra el VPH en el precáncer son menores, lo que se puede deber a una exposición previa al VPH. El riesgo de precáncer asociado con el VPH16/18 se reduce probablemente de 145/10 000 en las mujeres no vacunadas a 107/10 000 mujeres tras la vacunación contra el VPH (certeza moderada). El riesgo de cualquier precáncer es probablemente similar entre las mujeres no vacunadas y las vacunadas (343 versus 356/10 000, certeza moderada).
Efectos adversos
El riesgo de eventos adversos graves es similar con las vacunas para el VPH y las vacunas control (placebo o vacuna contra otra infección que el VPH) (certeza alta). La tasa de mortalidad es similar en general (11/10 000 en el grupo control, 14/10 000 en el grupo de vacuna contra el VPH) (certeza baja). El número de muertes en general es bajo, aunque se observó un mayor número de muertes en mujeres de edad avanzada. No se ha establecido un patrón en cuanto a la causa o el momento de la muerte.
Resultados del embarazo
Las vacunas contra el VPH no aumentaron el riesgo de aborto ni de interrupción del embarazo. No hay suficientes datos para tener certeza sobre el riesgo de mortinatos y de recién nacidos con malformaciones (certeza moderada).
Conclusión
Hay evidencia de certeza alta de que las vacunas contra el VPH protegen contra el precáncer del cuello uterino en las adolescentes y las mujeres que se vacunan entre los 15 y los 26 años de edad. La protección es menor cuando una parte de la población ya está infectada con el VPH. Se necesita un seguimiento a largo plazo para evaluar la repercusión sobre el cáncer de cuello uterino. Las vacunas no incrementan el riesgo de eventos adversos graves, aborto o interrupción del embarazo. Los datos de los ensayos del efecto de las vacunas sobre las muertes, los mortinatos y los recién nacidos con malformaciones son limitados.
Authors' conclusions
Summary of findings
| HPV vaccine effects on cervical lesions in adolescent girls and women who are hrHPV DNA negative at baseline | ||||||
| Patient or population: adolescent girls and women aged 15 to 26 years who are hrHPV negative before vaccination Setting: Europe, Asia Pacific countries, South & North America Comparison: Placebo | ||||||
| Outcomes | Anticipated absolute effects* (95% CI) | Relative effect | № of participants | Certainty of the evidence | Comments | |
| Risk with placebo | Risk with HPV vaccination1 | |||||
| Cervical cancer ‐ not measured | ‐ | ‐ | ‐ | ‐ | ‐ | |
| CIN2+ associated with HPV16/18. Follow‐up: 3 to 5 years | 164 per 10,000 | 2 per 10,000 | RR 0.01 | 23,676 | ⊕⊕⊕⊕ | |
| CIN3+ associated with HPV16/18 Follow‐up: 3 to 5 years | 70 per 10,000 | 0 per 10,000 | RR 0.01 | 20,214 | ⊕⊕⊕⊕ | Continuity correction |
| AIS associated with HPV16/18 Follow‐up: 3 to 5 years | 9 per 10,000 | 0 per 10,000 | RR 0.10 | 20,214 | ⊕⊕⊕⊝ | Continuity correction |
| Any CIN2+ irrespective of HPV type, bivalent or quadrivalent vaccine Follow‐up: 2 to 6 years | 287 per 10,000 | 106 per 10,000 | RR 0.37 | 25,180 | ⊕⊕⊕⊕ | Substantial subgroup heterogeneity was observed (I2= 84.3%) for bi‐ and quadrivalent vaccines. So results are reported separately for the 2 vaccines (see next 2 rows). |
| Any CIN2+ irrespective of HPV type Follow‐up (bivalent): 3.5 to 6 years Follow‐up (quadrivalent): 3.5 years | Bivalent vaccine | RR 0.33 (0.25 to 0.43) | 15,884 (4 RCTs) | ⊕⊕⊕⊕ | ||
| 285 per 10,000 | 94 per 10,000 (71 to 122) | |||||
| Quadrivalent vaccine | RR 0.57 (0.44 to 0.76) | 9296 (1 RCT) | ⊕⊕⊕⊝ | |||
| 291 per 10,000 | 166 per 10,000 (128 to 221) | |||||
| Any CIN3+ irrespective of HPV type, bivalent or quadrivalent vaccine Follow‐up: 3.5 to 4 years | 109 per 10,000 | 23 per 10,000 | RR 0.21 | 20,719 | ⊕⊕⊕⊝ | Substantial subgroup heterogeneity was observed (I2 = 84.3%) for bi‐ and quadrivalent vaccines. So results are reported separately for the 2 vaccines (see next 2 rows). |
| Any CIN3+ irrespective of HPV type Follow‐up (bivalent): 4 years Follow‐up (quadrivalent): 3.5 years | Bivalent vaccine | RR 0.08 (0.03 to 0.23) | 11,423 (2 RCTs) | ⊕⊕⊕⊕ | ||
| 81 per 10,000 | 6 per 10,000 (3 to 19) | |||||
| Quadrivalent vaccine | RR 0.54 (0.36 to 0.82) | 9296 (1 RCT) | ⊕⊕⊕⊝ | |||
| 143 per 10,000 | 77 per 10,000 (51 to 117 ) | |||||
| Any AIS irrespective of HPV type | 10 per 10,000 | 0 per 10,000 | RR 0.10 | 20,214 | ⊕⊕⊕⊝ | Continuity correction |
| 1The risk in the intervention group (and its 95% confidence interval) is based on the assumed risk in the comparison group and the relative effect of the intervention (and its 95% CI). When risk in vaccine group is zero, the 95% CI is computed using an exact binomial method. | ||||||
| GRADE Working Group grades of evidence | ||||||
| 1 Assumed risk calculated from the sum of control group event rates. 2 Downgraded due to serious imprecision in effect estimate (width 95% CI around RR > 0.6). 3 Downgraded one level due to serious imprecision. Few events observed in the two studies (9 in placebo arms and 0 in vaccination arms for the outcome of AIS HPV16/18 and 7 in placebo arms and 0 in vaccination arms for outcome of AIS of any type). | ||||||
| HPV vaccine effects on cervical lesions in adolescent girls and women negative for HPV16/18 DNA at baseline | ||||||
| Patient or population: adolescent girls and women aged 15 to 45 years who were HPV16/18 negative before vaccination | ||||||
| Outcomes | Anticipated absolute effects* (95% CI) | Relative effect | № of participants | Certainty of the evidence | Comments | |
| Risk with placebo | Risk with HPV vaccination1 | |||||
| Cervical cancer ‐ not measured | ‐ | ‐ | ‐ | ‐ | ‐ | |
| CIN2+ associated with HPV16/18 Follow‐up (age 15 to 26 years): 1 to 8.5 years Follow‐up (age 24 to 45 years): 4 to 6 years | 15 to 26 years | RR 0.05 | 34,478 | ⊕⊕⊕⊕ | ||
| 113 per 10,000 | 6 per 10,000 | |||||
| 24 to 45 years | RR 0.30 (0.11 to 0.81) | 7552 (2 RCTs) | ⊕⊕⊕⊝ MODERATE 2 | |||
| 45 per 10,000 | 14 per 10,000 (5 to 37) | |||||
| CIN3+ associated with HPV16/18 (age 15 to 26 years) Follow‐up: 3 years | 57 per 10,000 | 3 per 10,000 (1 to 8) | RR 0.05 (0.02 to 0.14) | 33,199 (3 studies) | ⊕⊕⊕⊕ | |
| AIS associated with HPV16/18 or 6/11/16/18 (age 15 to 26 years) Follow‐up: 3 years | 12 per 10,000 | 0 per 10,000 | RR 0.09 | 17,079 | ⊕⊕⊕⊝ MODERATE 2 | Continuity correction |
| Any CIN2+ irrespective of HPV type (age 15 to 26 years) Follow‐up: 2 to 6.5 years | 231 per 10,000 | 95 per 10,000 | RR 0.41 | 19,143 | ⊕⊕⊕⊕ | |
| Any CIN3+ irrespective of HPV type ‐ not measured | ‐ | ‐ | ‐ | ‐ | ‐ | |
| Any AIS irrespective of HPV type ‐ not measured | ‐ | ‐ | ||||
| 1The risk in the intervention group (and its 95% confidence interval) is based on the assumed risk in the comparison group and the relative effect of the intervention (and its 95% CI). Exception: when risk in vaccine group is zero, the 95% CI is computed using an exact binomial method.. | ||||||
| GRADE Working Group grades of evidence | ||||||
| 1 Assumed risk calculated from the sum of control group event rates. 2 Downgraded due to serious imprecision in effect estimate (width 95% CI around RR > 0.6). | ||||||
| HPV vaccine effects on cervical lesions in adolescent girls and women unselected for HPV DNA status at baseline | ||||||
| Patient or population: adolescent girls and women aged 15 to 45 years regardless of HPV DNA status at baseline | ||||||
| Outcomes | Anticipated absolute effects* (95% CI) | Relative effect | № of participants | Certainty of the evidence | Comments | |
| Risk with placebo | Risk with HPV vaccination1 | |||||
| Cervical cancer ‐ not measured | ‐ | ‐ | ‐ | ‐ | ‐ | |
| CIN2+ associated with HPV16/18 Follow‐up (age 15 to 26 years): 3.5 to 8.5 years Follow‐up (age 24 to 45 years): 3.5 years | 15 to 26 years | RR 0.46 (0.37 to 0.57 | 34,852 | ⊕⊕⊕⊕ | ||
| 341 per 10,000 | 157 per 10,000 | |||||
| 24 to 45 years | RR 0.74 (0.52 to 1.05) | 9200 (2 studies) | ⊕⊕⊕⊝ | |||
| 145 per 10,000 | 107 per 10,000 (76 to 152) | |||||
| CIN3+ associated with HPV16/18 Follow‐up: 3.5 years | 165 per 10,000 | 91 per 10,000 (74 to 127) | RR 0.55 (0.45 to 0.67) | 34,562 (2 RCTs) | ⊕⊕⊕⊕ | |
| Adeno carcinoma in situ (AIS) associated with HPV16/18 Follow‐up: 3.5 years | 14 per 10,000 | 5 per 10,000 | RR 0.36 | 34,562 | ⊕⊕⊕⊕ | |
| Any CIN2+ irrespective of HPV type Follow‐up (age 15 to 26 years): 3.5 to 8.5 years Follow‐up (age 24 to 45 years): 3.5 to 6 years | 15 to 26 years | RR 0.70 | 35,779 | ⊕⊕⊕⊕ | ||
| 559 per 10,000 | 391 per 10,000 | |||||
| 24 to 45 years | RR 1.04 | 9287 | ⊕⊕⊕⊝ | |||
| 343 per 10,000 | 356 per 10,000 | |||||
| Any CIN3+ irrespective of HPV type (age 15 to 26 years) Follow‐up: 3.5 to 4 years | 266 per 10,000 | 178 per 10,000 (231 to 247) | RR 0.67 (0.49 to 0.93) | 35,489 (3 RCTs) | ⊕⊕⊕⊝ | Substantial subgroup heterogeneity was observed (I2 = 84.3%) for bivalent and quadrivalent vaccines. So results are reported separately for two vaccines. |
| Any CIN3+ irrespective of HPV type (age 15 to 26 years), Follow‐up (bivalent): 3.5 to 4 years Follow‐up (quadrivalent): 3.5 years | Bivalent vaccine | RR 0.55 (0.43 to 0.71) | 18,329 (2 RCTs) | ⊕⊕⊕⊕ | ||
| 188 per 10,000 | 104 per 10,000 (81 to 134) | |||||
| Quadrivalent vaccine | 0.81 (0.69 to 0.96) | 17,160 (1 RCT) | ⊕⊕⊕⊝ | |||
| 349 per 10,000 | 283 per 10,000 (241 to 335) | |||||
| Any AIS irrespective of HPV type (age 15 to 26 years) Follow‐up: 3.5 years | 17 per 10,000 | 5 per 10,000 | RR 0.32 | 34,562 | ⊕⊕⊕⊕ | |
| Serious adverse events Follow‐up: 6 months to 7 years | 669 per 10,000 | 656 per 10,000 | RR 0.98 | 71,597 | ⊕⊕⊕⊕ | |
| Deaths Follow‐up: 7 months to 10 years. Most of the information in the analysis comes from studies with follow‐up ranging from 5‐10 years. | 11 per 10,000 | 14 per 10,000 | RR 1.29 | 71,176 | ⊕⊕⊝⊝ | Older women had higher fatality rate (RR 2.36, 95% CI 1.10 to 5.03). Assessment of the deaths in the studies has not been able to identify a pattern in the cause or timing of death. |
| *The risk in the intervention group (and its 95% confidence interval) is based on the assumed risk in the comparison group and the relative effect of the intervention (and its 95% CI). | ||||||
| GRADE Working Group grades of evidence | ||||||
| 1 Assumed risk calculated from the sum of control group event rates for all outcomes unless otherwise stated. 2 Downgraded due to serious imprecision. Confidence interval is wide and includes large decrease and small increase in lesions with vaccination group in the older age group. 3 Downgraded one level due to serious inconsistency. Reduction in lesions was greater in younger women than in older women (RR 0.46 in 15 to 26 years versus RR 0.74 in 24 to 45 years; P = 0.02 for interaction). 4 Downgraded one level due to serious imprecision. Confidence interval includes potentially meaningful increase in risk of mortality. 5 Downgraded one level due to serious inconsistency. Despite limited evidence of statistical variation, sub grouping studies by age showed higher fatality rate with vaccines in older age group. There is no clear pattern in causes or timing of deaths. | ||||||
| HPV vaccine adverse pregnancy outcomes (regardless of DNA status and age) | ||||||
| Patient or population: adolescent girls and women aged 15 to 45 years who became pregnant during the study | ||||||
| Outcomes | Anticipated absolute effects* (95% CI) | Relative effect | № of participants | Certainty of the evidence | Comments | |
| Risk with placebo | Risk with HPV vaccines | |||||
| Spontaneous abortion/miscarriage Follow‐up: 1 to 7 years | Study population | RR 0.88 | 8618 | ⊕⊕⊕⊕ | ||
| 1618 per 10,000 | 1,424 per 10,000 | |||||
| Elective termination/induced abortion Follow‐up: 1 to 7 years | Study population | RR 0.90 | 10,909 | ⊕⊕⊕⊕ | ||
| 931 per 10,000 | 838 per 10,000 | |||||
| Stillbirth Follow‐up: 1 to 3.5 years | Study population | RR 1.12 | 8754 | ⊕⊕⊕⊝ | ||
| 70 per 10,000 | 78 per 10,000 | |||||
| Babies born with congenital malformations Follow‐up: 3 to 7 years | Study population | RR 1.22 | 9252 | ⊕⊕⊕⊝ | ||
| 205 per 10,000 | 250 per 10,000 | |||||
| *The risk in the intervention group (and its 95% confidence interval) is based on the assumed risk in the comparison group and the relative effect of the intervention (and its 95% CI). | ||||||
| GRADE Working Group grades of evidence | ||||||
| 1 Confidence interval rules out an increased risk of termination so there is no downgrade for imprecision. 2 Downgraded one level due to serious imprecision. Confidence intervals for both outcomes include meaningful increase and reduction in risk of stillbirth or abnormal infants following vaccination. | ||||||
Background
Description of the condition
Burden of cervical cancer
Cervical cancer is the fourth most common cancer in women worldwide. It is estimated that in 2012, approximately 528,000 women developed cervical cancer and that 266,000 died from the disease (Ferlay 2015). Eighty‐six per cent of cervical cancer cases occur in developing countries (Arbyn 2011). Cervical cancer is the predominant cancer in women in Eastern Africa, South‐Central Asia and Melanesia, where a woman's risk of developing this disease by age 75 years ranges between 2.3% and 3.9%. In many developed countries, the incidence of, and mortality from, squamous cervical cancer has dropped substantially over the last decades, as a consequence of population‐based screening programmes (Arbyn 2009; Bray 2005a; Ferlay 2015; IARC 2005). However, approximately 54,000 and 11,000 cases are reported each year in Europe and the USA, respectively (Arbyn 2011; Ferlay 2013), and screening with cytology is less effective at preventing cervical adenocarcinoma (Bray 2005; Smith 2000). In contrast to many other malignancies, cervical cancer primarily affects younger women, with the peak age of incidence in the UK now between 25 and 29 years; between 2012 and 2014, 52% of cancers occurred in those under 45 years of age (Cancer Research UK 2018). In the UK (2010 to 2011), despite a comprehensive screening programme, 37% of women with cervical cancer died from the disease within 10 years of diagnosis (Cancer Research UK 2018).
High‐grade cervical intraepithelial neoplasia (CIN2+) is treated by local destruction (ablation) or excision of neoplastic tissue (Jordan 2009). Therapeutic procedures are similarly effective (Martin‐Hirsch 2013), but are associated with an average risk of residual or recurrent CIN2+ of 7% (Arbyn 2017), and an increased risk of late miscarriage and premature labour (Kyrgiou 2017). Primary prevention of CIN lesions by prophylactic (an agent used to prevent disease) vaccination can therefore reduce the burden, costs and adverse effects associated with its treatment.
Association between human papillomavirus (HPV) infection and cervical cancer and other HPV‐related cancers and their precursors
Papillomaviruses are small, icosahedral DNA viruses, that consist of one single double‐stranded circular DNA molecule of approximately 8,000 base‐pairs, contained within a protein capsid. The capsid is composed of two structural proteins, both are encoded by the viral genome: L1 and L2 (IARC 2007). The natural history of HPV infection towards cervical precancer and finally invasive cancer is well documented (Bosch 2002; Castellsagué 2006; IARC 2007). The development of cervical cancer passes through a number of phases: (a) infection of the cervical epithelium with high‐risk human papillomaviruses (hrHPV); (b) persistence of the HPV infection; (c) progression to precancerous lesions with malignant transformation of infected cells; and (d) invasion of surrounding tissue. The steps prior to development of cancer, can regress spontaneously, although regression rates decrease with increasing severity of the precancerous lesion.
Twelve hrHPV types (HPV16, 18, 31, 33, 35, 39, 45, 51, 52, 56, 58, and 59) are causally linked with the development of cervical cancer (Bouvard 2009). HPV68 is considered as probably carcinogenic (Schiffman 2009). Some other HPV types may in rare occasions also cause cervical cancer (Arbyn 2014). HPV type 16, in particular, has a high potential for malignant transformation of infected cervical cells (Schiffman 2005). The HPV types 16 and 18 jointly cause seven out of 10 cervical cancers worldwide (Munoz 2004). The five next most important high‐risk HPV types (HPV31, HPV33, HPV45, HPV52, and HPV58) together with HPV16/18 are causally linked with approximately 90% of cervical cancers (de Sanjose 2010). HPV16 is also linked with rarer types of cancer, such as cancer of the vulva and vagina in women, penile cancer in men and anal and oropharyngeal cancer in women and men (Cogliano 2005; IARC 2007).
The low‐risk HPV types 6 and 11 cause approximately 90% of genital warts in women and men (Lacey 2006). They occur in low‐grade dysplastic cervical lesions, but are not associated with developing cervical cancer (IARC 2007). HPV types 6 and 11 cause recurrent respiratory papillomatosis, a rare but very serious disease of the upper airways often requiring repetitive surgical interventions (Lacey 2006).
The main route of HPV transmission is sexual contact. Infection usually occurs soon after the onset of sexual activity (Winer 2003; Winer 2008). The prevalence of HPV infection in women generally peaks in late teenage or early twenties (de Sanjose 2007). HPV infection is usually cleared by the immune system (Ho 1998). HPV infection can result in cervical precancer (cervical intraepithelial neoplasia (CIN)), which can be detected by cervical cytological screening. By microscopic inspection of a cervical smear (also known as a Papanicolaou or 'Pap' test, cervical lesions can be detected (atypical squamous cells of undetermined significance (ASC‐US), low‐grade squamous intraepithelial lesion (LSIL), high‐grade squamous intraepithelial lesion (HSIL),: atypical glandular cells (AGC); for a complete list of abbreviations used in the review, see Appendix 1), which can be confirmed histologically following a cervical biopsy at colposcopic examination (Jordan 2008). In some countries, cytological cervical cancer screening is being replaced by HPV‐based screening, because the latter is more effective at preventing future CIN3 or invasive cancer (Arbyn 2012; Ronco 2014).
A World Health Organization (WHO) expert group accepted a reduction in the incidence of high‐grade CIN (CIN2+) and cervical adenocarcinoma in situ (AIS) or worse as an acceptable surrogate outcome of HPV vaccination trials (Pagliusi 2004). This is because the reduction of the incidence of invasive cervical cancer would require large and very long‐term studies, which are unlikely to be undertaken. The progression of HPV infection to invasive cancer is thought to take a minimum of 10 years (IARC 2007). Although CIN can regress, from historical data, it has been estimated that CIN3 has a probability of progressing to invasive cancer of 12% to 30%, whereas for CIN2 this probability is substantially lower (McCredie 2008; Ostor 1993).
The recognition of the strong causal association between HPV infection and cervical cancer led to the development of molecular HPV assays to detect cervical cancer precursors (Iftner 2003), and of vaccines that prevent HPV infection (prophylactic vaccines) or that aim to treat present HPV infection or HPV‐induced lesions (therapeutic vaccines) (Frazer 2004; Galloway 2003; Schneider 2003). Therapeutic vaccines are still in early experimental phases and are not further considered in this review.
Throughout this review, we will use the 2001 Bethesda System to define cytologically‐defined neoplastic lesions of the cervical epithelium (Solomon 2002) and the CIN nomenclature to define histologically‐confirmed CIN (Richart 1973).
Description of the intervention
The intervention evaluated in this review is prophylactic vaccination against the most carcinogenic HPV types. Prophylactic HPV vaccines are composed of virus‐like particles (VLPs) of the L1 protein, which is the major protein of the capsid (shell) of the HPV virus. VLPs, do not contain viral DNA, and so are incapable of causing an active infection.
This review addresses evidence of three prophylactic HPV vaccines that have been clinically evaluated in randomised controlled trials (RCTs): a monovalent HPV16 vaccine (manufactured by Merck, Sharpe & Dome (Merck), Whitehouse Station, NJ, USA); a quadrivalent vaccine, containing the L1 protein of HPV6, HPV11, HPV16 and HPV18 (Gardasil®, produced by the same manufacturer as the monovalent vaccine); and a bivalent vaccine containing L1 of HPV types 16 and 18 (Cervarix®, produced by GlaxoSmithKline (GSK), Rixensart, Belgium). The vaccines produced by Merck contain amorphous aluminium hydroxyphosphate sulphate as an adjuvant, whereas the GSK vaccine contains aluminium salt and AS04 or monophosphoryl lipid A, which is an immunostimulating molecule (WHO 2009). Recently, a nona‐valent vaccine targeting nine HPV types (HPV types 6, 11, 16, 18, 31, 33, 35, 45, 52 and 58) has been developed by Merck. We did not include the nona‐valent vaccine in the current review, since the randomised trials assessing the efficacy of the nona‐valent vaccine did not incorporate an arm with a non‐HPV vaccine control, Nevertheless, data regarding the nona‐valent vaccine are included in the Discussion. More details about the prophylactic HPV vaccines used are described in Appendix 2.
How the intervention might work
Animal experiments have shown that neutralising antibodies, elicited by vaccination with papillomavirus VLPs, prevent type‐specific infection and subsequent development of lesions after viral challenge (Breitburd 1995; Ghim 2000; Stanley 2006). Vaccination by intramuscular injection of L1 VLPs in humans has been demonstrated to be highly immunogenic in phase I trials, which means that they induce high titres of anti‐HPV antibodies in serum which are considerably higher than after natural infection. (Ault 2004; Brown 2001; Evans 2001; Harro 2001). Serum anti‐L1 antibodies can transudate to the mucosa (cervical or other sites) where new HPV infection is impeded through virus‐neutralisation (Stanley 2012). Prophylactic HPV vaccines may also induce specific memory B‐lymphocytes which play a role in long‐term humoral immunity (Giannini 2006). Anti‐HPV antibodies do not trigger the elimination of an existing HPV infection. Cell‐mediated immunity is required for viral clearance and regression of CIN lesions (Stanley 2012).
Why it is important to do this review
Several phase II and III studies have been conducted to date and numerous reviews have tried to summarise the results (Ault 2007; Arbyn 2007; Harper 2009; Initiative 2009; Kahn 2009; Kjaer 2009; Koutsky 2006; Lu 2011; Medeiros 2009; Rambout 2007; Szarewski 2010). However, none of the reviews combined information on all the available endpoints. Our purpose was to pool efficacy outcomes only when outcomes were similarly defined, taking the timing of follow‐up into account. This review is also important since it provides a template for reporting future results of prophylactic vaccination trials according to the different outcomes (infections or cervical precancerous lesions, either associated with infection with vaccine types or irrespective of HPV infection) for different exposure groups (defined essentially by absence of hrHPV, absence of the HPV types included in the vaccine, or regardless of HPV infection at enrolment). Particular effort was undertaken to assess severe adverse effects in order to inform health professionals, stakeholders, adolescent girls and women, not only about the potential beneficial effects of HPV vaccines but also about possible harms.
Objectives
To evaluate the harms and protection of prophylactic human papillomaviruses (HPV) vaccines against cervical precancer and HPV16/18 infection in adolescent girls and women.
Methods
Criteria for considering studies for this review
Types of studies
We considered only phase II and phase III randomised controlled trials (RCTs).
Types of participants
We included studies enrolling female participants, without any age restriction, distinguishing:
-
female participants with no evidence of baseline infection with high‐risk human papillomaviruses (hrHPV) types (this group reflects the first target of basic vaccination programmes, i.e. girls before onset of sexual activity);
-
female participants with no evidence of baseline infection with HPV types included in the vaccines (per protocol population);
-
all female participants regardless of baseline infection with HPV (this group reflects the target of catch‐up vaccination programs, adolescents or young adult women aged 15 to 26 years, where a considerable proportion may already have been exposed to HPV infection).
The distinction of different participant categories by HPV status at enrolment is essential, since the trial outcomes are expected to differ in women who are already infected with HPV types included in the vaccine and those who are not infected, Further distinction was made by:
-
broad age group (adolescents and young adult women, aged 15 to 26 years) and mid‐adult women (25 to 45 years);
-
number of received doses: three doses in agreement with the trial protocol, at least one dose, and fewer than three doses (the latter analysis being a post‐hoc assessment);
-
type of vaccine received (mono‐, bi‐ or quadrivalent vaccine).
Studies with male participants or special target groups such as immunocompromised patients were not included. However, trials enrolling both female and male participants were potentially eligible under the condition that separate outcomes for female participants were reported or could be obtained from the authors.
Types of interventions
Intervention
Vaccination with prophylactic HPV vaccines containing virus‐like particles composed of the L1 capsid protein of HPV16 (monovalent vaccine), HPV16 and HPV18 (bivalent vaccine), or HPV6, HPV11, HPV16 and HPV18 (quadrivalent vaccine) (see Appendix 2). All vaccines were administered by intramuscular injection over a period of six months. The monovalent and quadrivalent vaccines were injected at zero, two and six months, whereas the bivalent vaccine was administered at zero, one and six months.
Comparison
Administration of placebo containing no active product or only the adjuvant of the HPV vaccine, without L1 VLP, or another non‐HPV vaccine.
In head‐to‐head trials comparing directly the bivalent with the quadrivalent vaccine, participants who received the bivalent vaccine constituted the experimental group and participants who received the quadrivalent vaccine were considered as the comparison group.
Types of outcome measures
Primary outcomes
-
Histologically‐confirmed high‐grade cervical intraepithelial neoplasia (CIN2, CIN3 and adenocarcinoma in situ (AIS)) or worse, associated with the HPV types included in the vaccine or any lesions irrespective of HPV type. Association between HPV types and a diagnosed lesion means that the particular type or types have been detected in that lesion. These primary outcomes were judged by WHO to be adequate endpoints (Pagliusi 2004).
-
Invasive cervical cancer.
-
Safety/occurrence of adverse effects:
-
-
-
local adverse effects (redness, swelling, pain, itching at the injection site);
-
mild systemic effects;
-
serious systemic effects;
-
mortality;
-
pregnancy outcomes observed during the trials, in particular occurrence of congenital anomalies.
-
-
Secondary outcomes
-
Incident infection with vaccine HPV types (HPV16 and HPV18, jointly; and HPV6, HPV11, HPV16 and HPV18 jointly).
-
Persistent infection (persisting during at least six months or at least 12 months) with vaccine HPV types.
Search methods for identification of studies
We searched for papers in all languages and translations were undertaken, if necessary.
Electronic searches
We retrieved published studies from the Cochrane Central Register of Controlled Trials (CENTRAL the Cochrane Library), MEDLINE and Embase.
Cochrane Central Register of Controlled Trials (CENTRAL 2002 to 2017, Issue 5).
MEDLINE (2002 to June Week 1 2017).
Embase (2002 to 2017 week 24).
The search strategies for MEDLINE, CENTRAL and Embase are listed in Appendix 3, Appendix 4 and Appendix 5.
The search string for MEDLINE was saved in My NCBI, an electronic search tool developed by the National Center for Biotechnology Information (NCBI) at the National Library of Medicine, which saves searches and automatically retrieves newer references not picked‐up at previous searches. An auto‐alert was set up in Embase.
The 'related articles' feature in PubMed was used, departing from the original included studies; similarly, Scopus was used to retrieve articles which cite the originally included studies.
We searched databases were searched from 2002 (the year of publication of the results of the first phase II trial) until June 2017.
Searching other resources
Registries of randomised trials
We searched the following registries to identify unpublished or ongoing trials: www.clinicaltrials.gov, www.isrctn.com, and www.cancer.gov/clinicaltrials.
Data on adverse effects published in the peer‐reviewed literature were complemented by searches in wwww.clinicaltrials.gov for the quadrivalent vaccine and on http://www.gsk‐clinicalstudyregister.com/ for the bivalent vaccine. We collected data for the outcomes of serious adverse events, all‐cause mortality and pregnancy outcomes from these sources and compared them with data extracted from the primary trial publications.
International public health organisations
We contacted international public health organisations that have investigated questions on HPV vaccine efficacy and safety or that have formulated recommendations on the use of HPV vaccines, to retrieve key documents. Concerned organisations included: the World Health Organization (WHO, Geneva), the US Centers for Disease Control and Prevention (CDC, Atlanta), the European Centre for Disease Prevention and Control (ECDC, Stockholm), and the International Agency for Research on Cancer (IARC, Lyon).
Handsearching
We handsearched the citation lists of included studies.
In addition, we searched the abstracts of the latest conferences of relevant scientific societies related to vaccination, virology (in particular the International Papillomavirus Society), paediatrics, and gynaecology for new or pending information not yet published in peer‐reviewed journals.
Correspondence
We contacted study authors to request results on effects separated by gender, if the reports only contained data combined for both genders.
Data collection and analysis
Selection of studies
We downloaded all titles and abstracts retrieved by electronic searching to a bibliographic database stored in Reference Manager. We added any references obtained by handsearching and removed any duplicates.
We (MA, CS and LX) independently verified inclusion and exclusion of eligible studies and discussed any disagreements. In case of doubt, the full‐text report was read. If no consensus could be reached, review author PMH was consulted. We documented reasons for exclusion.
Data extraction and management
For included studies, we extracted the following study characteristics and outcome data.
-
Study identification: first author, year of publication, journal, trial number.
-
Geographical area where the study was conducted.
-
Period when study was conducted.
-
Inclusion and exclusion criteria.
-
Characteristics of included participants (total number enrolled, age, number of previous sexual partners).
-
Initial HPV status (presence or absence of hrHPV DNA; presence or absence of DNA of the vaccine HPV types; serological status (presence of antibodies against vaccine HPV types) at enrolment). Differences in efficacy outcomes by initial HPV status will reflect protection in women or girls previously exposed, or not exposed to prior HPV infection.
-
Study design:
-
phase of the randomised trial (II or III);
-
type of vaccine evaluated (monovalent, bivalent, or quadrivalent);
-
control group: type of placebo or other vaccine administered;
-
time points (mean duration of follow‐up after first dose) at which outcomes were collected and reported;
-
study size at enrolment and at subsequent time points of follow‐up;
-
number of doses received;
-
scheduling of screening tests (HPV tests, cytology);
-
diagnostic algorithms used to confirm outcomes;
-
definition of study groups on which per‐protocol and intention‐to‐treat analyses were applied;
-
risk of bias in study design (see below: Assessment of risk of bias in included studies).
-
-
Outcomes, subdivided by (i) the association with vaccine HPV types and (ii) irrespective of HPV types:
-
outcome definition (including diagnostic criteria and assays);
-
results: number of participants allocated to each intervention group; number of missing values and absolute values required to compute effect measures (see Types of outcome measures);
-
data for the efficacy outcomes and short‐term adverse events relating to the injection procedures were collected from primary trial publications. For outcomes relating to serious adverse events, all‐cause mortality and pregnancy outcomes, data were cross‐checked between trial registries, study results websites, correspondence with investigators and the primary trial reports. The primary analysis used the data derived from the reports with the longest follow‐up time. A sensitivity analysis on serious adverse effects and mortality was restricted to data derived from reports published in peer‐reviewed journals.
-
-
Involvement of manufacturers.
We extracted data on outcomes as follows.
-
For dichotomous outcomes, we extracted the number of participants in each treatment arm who experienced the outcome of interest and the number of participants assessed at endpoint in order to estimate a risk ratio (RR) or risk difference (RD). Where possible, we also extracted the number of person‐years at risk in order to compute incidence rates and incidence rate ratios or differences.
We (MA, CS until 2011 and LX from 2012) independently extracted data onto a data abstraction form specially designed for the review. Differences between review authors were resolved by discussion or by appeal to a third review author (PMH) if necessary.
Assessment of risk of bias in included studies
We assessed the risk of bias in included RCTs using Cochrane's 'Risk of bias' tool and the criteria specified in chapter 8 of the Cochrane Handbook for Systematic Reviews of Interventions (Higgins 2011a). This included assessment of:
-
the method used for randomisation to generate the sequence of participants allocated to the treatment arms;
-
allocation concealment;
-
blinding (of participants, healthcare providers;
-
blinding of outcome assessment;
-
reporting of incomplete outcome data for each outcome;
-
selective reporting of outcomes.
We (MA, CS and LX) independently applied the Cochrane 'Risk of bias' tool and differences were resolved by discussion or by appeal to a third review author (PMH). Results were presented in both a 'Risk of bias' graph and a 'Risk of bias' summary. We interpreted the results of meta‐analyses in the light of the findings with respect to risk of bias.
Measures of treatment effect
We computed risk ratios (RR) from the ratio of proportions or rates of events among vaccine recipients versus placebo recipients. In the literature, protection against HPV infection or cervical precancer is usually presented as vaccine efficacy (VE), VE = (1‐RR)*100. However, pooling of VE is not supported by the Review Manager (RevMan) software (Review Manager 2014). Where perfect efficacy corresponds with VE = 100%, the corresponding RR = 0; VE = 0% or RR = 1 means absence of protection. Negative VE or RR exceeding unity reflect adverse protection (vaccinated participants are more at risk than non‐vaccinated participants). When the 95% confidence interval contains unity, the protective effect is statistically insignificant. The number of participants needed to vaccinate (NNV) to avoid one outcome event was computed from the risk difference (NNV = 1/RD).
To show vaccination effects at population level, Cates plots were drawn, showing effects in 1000 vaccinated and 1000 non‐vaccinated women (Cates 2015).
Dealing with missing data
We contacted study authors or data owners to request data on the outcomes, separated by gender, if the reports only contained data combined for both genders in trials where both women and men were enrolled. We did not impute missing outcome data.
Assessment of heterogeneity
We assessed heterogeneity between studies by visual inspection of forest plots, by estimation of the percentage heterogeneity between trials that could not be ascribed to sampling variation (Higgins 2003), by a formal statistical test of the significance of the heterogeneity (Deeks 2001) and, if possible, by subgroup analyses. If there was evidence of substantial heterogeneity, we investigated and reported the possible reasons.
In order to avoid heterogeneity, we did not combine data series from participants with different baseline HPV status (presence of hrHPV DNA, presence of DNA of the HPV vaccine types). Age group and sexual history were investigated as potential sources that could explain possible heterogeneity.
Assessment of reporting biases
We planned to construct funnel plots and to perform regression tests to identify asymmetry in the meta‐analysis (Harbord 2009). However, since each meta‐analysis contained seven or fewer studies, this was not feasible. Instead, we performed meta‐regression to identify possible small‐study effects grouping studies in two categories: large (> = 3000 participants) and small (< 3000 participants).
Data synthesis
Random‐effects models with inverse variance weighting were applied using the RevMan 5 (DerSimonian 1986). From the pooled RR, VE was computed (VE = 1‐RR). Pooled risk differences were computed also for the 'Summary of findings' tables.
Subgroup analysis and investigation of heterogeneity
We performed separate analyses determined by the participant's HPV status as defined by the result of an HPV DNA tests at enrolment. Three groups were distinguished: a) initially hrHPV DNA negative, b) initially HPV16/18 DNA negative, and c) regardless of initial HPV DNA test results. Subgroup meta‐analyses were performed, if possible, using vaccine type and age group as a stratifying variable. We distinguished younger (15 to 26 years) from mid‐adult women (24 to 45 years), which were the two age groups assessed in the available randomised trials. If efficacy estimates were not significantly different by vaccine type, jointly pooled estimates were retained. Only when significant heterogeneity by vaccine types was noted, were separate efficacy estimates by vaccine type pooled. We used meta‐regression to investigate sources of heterogeneity such as serological status, study design items, study size and sexual history (Sharp 1998; Thompson 1999). The log relative risk (vaccinated versus placebo recipients) was used as the dependent variable. The antilog of coefficients of the meta‐regression yielded relative risk ratios (RRR). 95% confidence intervals around the RRR excluding unity indicated a statistically influential factor.
We assessed the influence of covariates, which were not defined uniformly throughout the trials, by Poisson regression in each trial concerned, separately and using person‐years at risk as an offset.
A posteriori analysis was performed to investigate vaccine efficacy in women who had received fewer than three doses of vaccine, by subtraction of the number of events and total number of participants who had received three doses from those who had received at least one dose. This was the only possible approach, since outcomes stratified by number of doses received, were not usually reported in the published papers.
Sensitivity analysis
We assessed the robustness of data collected for serious adverse events, all‐cause mortality and pregnancy outcomes based on the source of data. The primary analysis for these outcomes included data that we considered to represent the most complete follow‐up. As a sensitivity analysis we used data for these same outcomes that had only been reported in the published trial reports.
'Summary of findings' tables
We created 'Summary of findings' tables for three populations of interest.
-
Adolescent girls and women who were negative for hrHPV DNA at baseline
-
Adolescent girls and women who were negative for HPV16/18 DNA at baseline
-
Adolescent girls and women regardless of HPV DNA status at baseline
We included findings for the following outcomes for each population.
-
Cervical cancer
-
CIN2+ or CIN3+ associated with HPV16/18; any CIN2+ or CIN3+, irrespective of HPV types
-
AIS associated with HPV/16/18; any AIS irrespective of HPV types
-
All‐cause mortality (in all enrolled women)
-
Serious adverse events (in all enrolled women)
We included a fourth table summarising pregnancy outcomes as follows.
-
Spontaneous abortion/miscarriage
-
Elective termination/induced abortion
-
Spontaneous miscarriage
-
Babies born with congenital malformations
Since only randomised clinical trials were included in the review, the rating for each outcome started as high‐quality evidence and was downgraded for the following considerations according to GRADE guidance (Higgins 2011b).
-
Risk of bias
-
Inconsistency (both quantitative and qualitative)
-
Imprecision (relating to the width of the 95% confidence interval and number of participants in the analysis)
-
Indirectness
-
Publication bias
Results
Description of studies
Results of the search
The search in MEDLINE, Embase and CENTRAL, conducted after the publication of the updated protocol (Arbyn 2013), was updated up on 15 June 2017, which resulted in 1685 records and was completed with 112 citations of previously published reviews retrieved from Scopus and reports from the personal CERVIX bibliographic database, yielding 1797 records. After eliminating 34 duplicates, 1763 references were considered from which 1617 could be excluded based on title or objectives described in the abstract. Full reading of the abstracts and materials of 146 papers allowed exclusion of 90 reports. Finally, 56 relevant references describing characteristics and results of 26 randomised trials were selected for this review (Characteristics of included studies). The retrieval and selection of studies is summarised in the PRISMA flow chart in Figure 1. In addition, we included two reports of pooled analyses of included randomised controlled trials (RCTs) with original data (FUT I/II trials (ph3,4v); PATRICIA & CVT (ph3,2v)).

Flow diagram summarising the retrieval, inclusion and exclusion of relevant reports of randomised trials assessing the safety and effects of prophylactic HPV vaccines.
Details about the completeness of publication of HPV vaccination trials, registered in www.clinicaltrials.gov, can be found in Appendix 6. No additional studies could be retrieved from www.isrctn.com or www.cancer.gov/clinicaltrials.
Included studies
Twenty‐six randomised trials were identified that contained data on vaccine efficacy and/or safety, which all together enrolled 73,428 women. One trial (Phase2 trial (ph2,1v)) evaluated effects of a monovalent HPV16 vaccine, 18 trials evaluated the bivalent vaccine (African_2 country trial (ph3,2v); Chinese trial (ph3,2v)_ adolescent; Chinese trial (ph3,2v)_mid‐adult; Chinese trial (ph3,2v)_young; Co‐vaccination_dTpa_IPV trial (ph3,2v); Co‐vaccination_HAB trial (Ph3, 2v); Co‐vaccination_HepB trial (ph3, 2v); CVT (ph3,2v); Hong Kong trial (ph3,2v); Immunobridging(ph3,2v); Indian trial (ph3,2v); Japanese trial (ph2,2v); Korean trial (ph3,2v); Korean trial (ph3b,2v); Malaysian trial (ph3,2v); PATRICIA trial (ph3,2v); Phase2 trial (ph2,2v); VIVIANE trial (ph3,2v)) and seven others the quadrivalent vaccine (African_3 country trial (ph3,4v); FUTURE III trial (ph3,4v); FUTURE II trial (ph3,4v); FUTURE I trial (ph3,4v); Japanese trial (ph2,4v); Korean trial (ph2,4v); Phase2 trial (ph2,4v)). Six studies were phase II trials and 20 others were phase III trials. No phase I trials were included.
All trials were funded by the respective manufacturers of the vaccines, except one trial, which was financed by the National Cancer Instituite (CVT (ph3,2v)). The study size varied between 98 (African_3 country trial (ph3,4v)) and 18,644 (PATRICIA trial (ph3,2v)). The smaller studies (<1000) essentially assessed safety and immunogenicity (not assessed in this review) or only addressed protection against infection with the HPV vaccine types, whereas the larger phase III trials assessed also protection against cervical precancer (CIN2+, CIN3+ and AIS+). A listing of the 26 studies ranked by valency of the vaccine, phase (II or III) and alphabetic order is provided in Table 1.
| Valency | Phase | Number of trials | Appelation | N | Outcomes | Main References |
| Monovalent | II | 1 | 2392 | Efficacy, safety | ||
| Bivalent | II | 2 | 1040 | Efficacy, safety | ||
| 1113 | Efficacy, safety | |||||
| III | 16 | 676 | Safety | |||
| 6051 | Efficacy, safety | |||||
| 750 | Safety | |||||
| 1212 | Safety | |||||
| 494 | Safety | |||||
| 494 | Safety | |||||
| 541 | Safety | |||||
| 7466 | Efficacy, safety | |||||
| 294 | Safety | |||||
| 2067 | Safety | |||||
| 354 | Safety | |||||
| 208 | Safety | |||||
| 321 | Safety | |||||
| 271 | Safety | |||||
| 18,644 | Efficacy, safety | |||||
| 5752 | Efficay, safety, | |||||
| Quadrivalent | II | 3 | 1021 | Safety | ||
| 176 | Safety | |||||
| 552 | Efficacy, safety | |||||
| III | 4 | 98 | Safety | |||
| 5455 | Efficacy, safety | |||||
| 12,167 | Efficacy, safety | |||||
| 3819 | Efficacy, safety | |||||
| Total | 26 | 73,428 |
Other characteristics which are not described in Characteristics of included studies, are presented in Appendix 7 and Appendix 8.
Excluded studies
A list of 90 excluded studies and reasons for exclusion can be found below (Characteristics of excluded studies). We excluded a Chinese study (Li 2012) and an immuno‐bridging study (Reisinger 2007), which contained safety and immunogenicity data reported jointly for men and women. We sent a request to the authors for separate data for women but we did not receive a reply from the former and an answer that gender‐separated data were not available from the latter.
Risk of bias in included studies
The assessment of the risk of possible bias present in the selected studies according to the six criteria incorporated in Cochrane's tool for assessing risk of bias in randomised trials (Higgins 2011b) is shown in Characteristics of included studies.
We judged the risk of bias related to the six Cochrane criteria as low in most of the included trials (Figure 2, Figure 3 and Figure 4). We judged the generation of a random sequence as adequate in 24/26 trials ( = 92%). In two studies, the system used for randomisation was insufficiently described (unclear risk of bias) (Japanese trial (ph2,4v); Japanese trial (ph2,2v)).
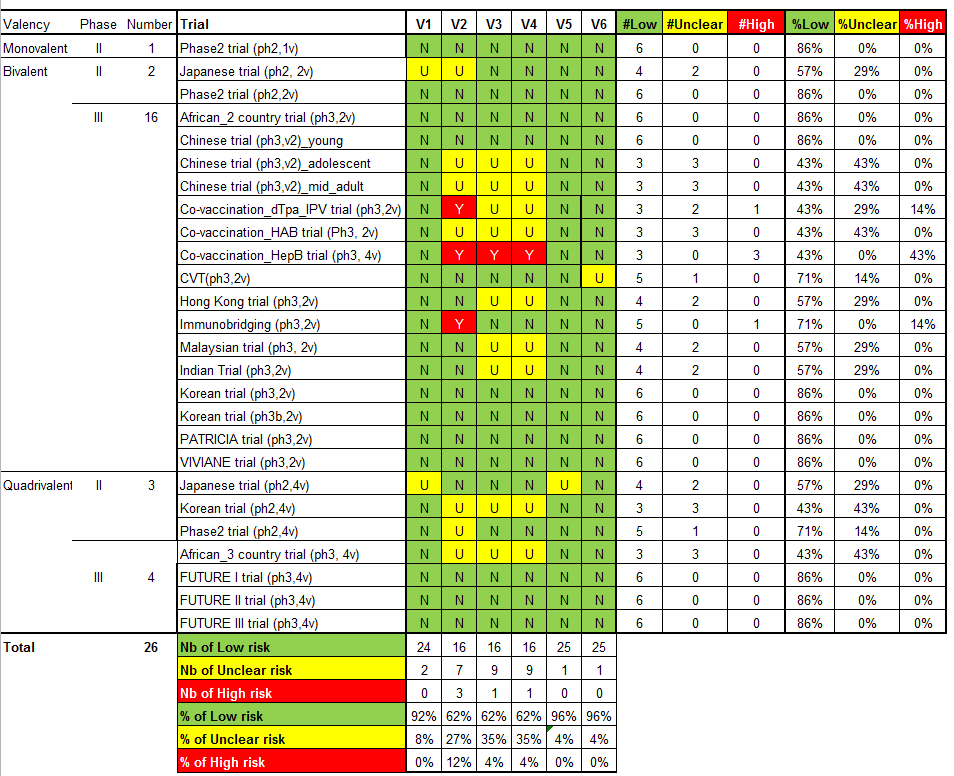
'Risk of bias' summary: review authors' judgements about each 'Risk of bias' item for each included study.
V1 = Random sequence generation; V2 = Allocation concealment; V3 = Blinding participants & personnel; V4 = Blinding of outcome assessment; V5 = Incomplete outcomes; V6 = Selective reporting.
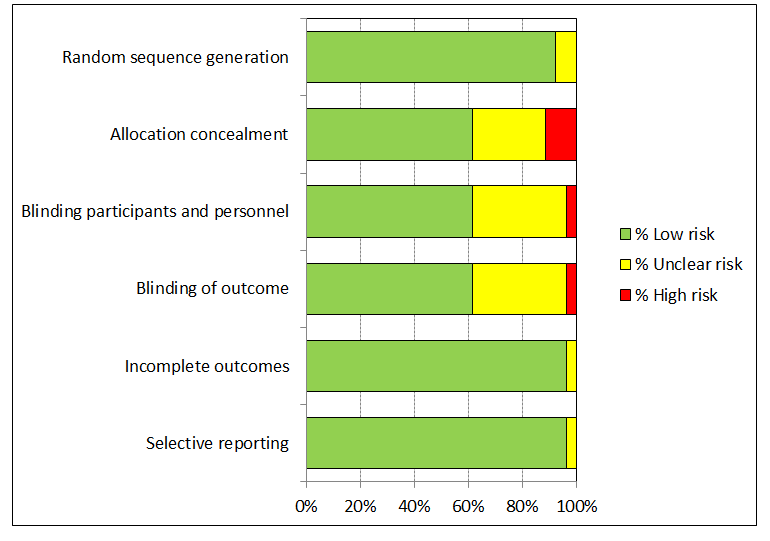
'Risk of bias' graph: review authors' judgements about each 'Risk of bias' item presented as percentages across all included studies.

'Risk of bias' summary: review authors' judgements about each 'Risk of bias' item for each included study.
The allocation of participants to the vaccine or placebo arm was clearly concealed in 16/26 (62%) trials. In three studies, randomisation was by design not concealed (Co‐vaccination_dTpa_IPV trial (ph3,2v)); Co‐vaccination_HepB trial (ph3, 2v); Immunobridging(ph3,2v)). These studies did not assess efficacy but compared immunogenicity and safety of HPV vaccines with other vaccines or combination of HPV vaccine and other vaccines that were visually distinguishable. Concealment of allocation was unclear in seven studies (African_3 country trial (ph3,4v); Chinese trial (ph3,2v)_ adolescent; Chinese trial (ph3,2v)_mid‐adult; Japanese trial (ph2,2v); Korean trial (ph2,4v); Phase2 trial (ph2,4v);Co‐vaccination_HAB trial (Ph3, 2v) ).
Blinding of study participants and medical personnel and blind assessment of outcomes were assured in 16 trials but were not clearly documented in nine trials (9/ 26 = 35% unclear risk). One trial assessing immunogenicity and safety of HPV vaccine only versus vaccination of HPV vaccine with other vaccines was by design unblinded (Co‐vaccination_HepB trial (ph3, 2v)). Drop out of enrolled participants, who did not follow the foreseen vaccination schedule, occurred in all trials, but the reasons for exclusion were well described in 25/26 (96%) and outcomes were presented separately for restricted per‐protocol groups and larger intention‐to‐treat groups in nearly all trials with one exception. In the Japanese trial (ph2,4v) only per‐protocol results were presented. All intended outcomes were reported according to pre‐published registered protocols in all included trials.
We did not judge any of the included trials assessing efficacy outcomes as having a high risk of bias. In eight of the included efficacy trials were considered to be at low risk of bias.
Only one study (CVT (ph3,2v)) was funded and conducted by an independent research institution.
Whether involvement of industry or other quality criteria influenced study outcomes will be explored below (Results, section 9.3).
Effects of interventions
See: Summary of findings for the main comparison HPV vaccine effects on cervical lesions in adolescent girls and women negative for hrHPV DNA at baseline; Summary of findings 2 HPV vaccine effects on cervical lesions in adolescent girls and women negative for HPV16/18 DNA at baseline; Summary of findings 3 HPV vaccine effects in adolescent girls and women regardless of HPV DNA status at baseline; Summary of findings 4 HPV vaccine effects on pregnancy outcomes
The duration of follow‐up post vaccination in the studies was too short to show effects on cervical cancer outcomes. The presentation of the results on vaccine efficacy focuses on protection against precancerous cervical lesions and of HPV16/18 infection. They are organised according to the following features (see summary of findings Table for the main comparison; summary of findings Table 2; summary of findings Table 3; Table 2):
| Outcomes and exposure subgroups | Absolute risk / per 10,000 | Relative risk | Vaccine efficacy (95% CI) | Risk difference/ per 10,000 (95% CI) | No of Participants | Certainty of evidence | |
| Placebo | Vaccinated | ||||||
| 1. High‐grade cervical lesions in women who were hrHPV DNA negative at baseline | |||||||
| Analysis 1.1 CIN2+ associated with HPV16/18, at least 1 dose, age 15‐26 years | 164 | 2 | 0.01 (0.00 to 0.05) | 99% (95% to 100%) | 162 (157 to 164) | 23,676 | ⊕⊕⊕⊕ high |
| Analysis 1.2 CIN2+ associated with HPV6/11/16/18, at least 1 dose, age 15‐26 years | 197 | 2 | 0.01 (0.00 to 0.09) | 99% (91% to 100%) | 195 (179 to 197) | 9296 (1 study) | ⊕⊕⊕⊝ |
| Analysis 1.3 CIN3+ associated with HPV16/18, at least 1 dose, age 15‐26 years | 70 | 0* | 0.01 (0.00 to 0.10) | 99% (90% to 100%) | 70 (63 to 70) | 20,214 (2 studies) | ⊕⊕⊕⊕ high |
| Analysis 1.4 CIN3+ associated with HPV6/11/16/18, at least 1 dose, age 15‐26 years | 94 | 0* | 0.01 (0.00 to 0.18) | 99% (82% to 100%) | 94 (77 to 94) | 9296 (1 study) | ⊕⊕⊕⊝ |
| Analysis 1.5 AIS associated with HPV16/18, at least 1 dose, age 15‐26 years | 9 | 0* | 0.10 (0.01 to 0.82) | 90% (18% to 99%) | 9 (2 to 9) | 20,214 | ⊕⊕⊕⊝ |
| Analysis 1.6 AIS associated with HPV6/11/16/18m at least 1 dose, age 15‐26 years | 6 | 0* | 0.14 (0.01 to 2.8) | 86% (‐180% to 99%) | 6 (‐12 to 6) | 9296 (1 study) | ⊕⊕⊕⊝ |
| Analysis 1.7.1 Any CIN2+ irrespective of HPV types, at least 1 dose of the bivalent vaccine, age 15‐26 years | 285 | 94 | 0.33 (0.25 to 0.43) | 67% (57% to 75%) | 191 (163 to 214) | 15,884 (4 studies) | ⊕⊕⊕⊕ high |
| Analysis 1.7.2 Any CIN2+ irrespective of HPV types, at least 1 dose of the quadrivalent vaccine, age 15‐26 years | 291 | 166 | 0.57 (0.44 to 0.76) | 43% (24 to 56%) | 125 (70 to 163) | 9296 (1 study) | ⊕⊕⊕⊝ |
| Analysis 1.8.1 Any CIN3+ irrespective of HPV types, at least 1 dose of the bivalent vaccine, age 15‐26 years | 81 | 6 | 0.08 (0.03 to 0.23) | 92% (77% to 97%) | 74 (62 to 78) | 11,423 (2 studies) | ⊕⊕⊕⊕ |
| Analysis 1.8.2 Any CIN3+ irrespective of HPV types, at least 1 dose of the quadrivalent vaccine, age 15‐26 years | 143 | 77 | 0.54 (0.36 to 0.82) | 46% (17% to 64%) | 66 (26 to 92) | 9296 (1 study) | ⊕⊕⊕⊝ |
| Analysis 1.9 Any AIS irrespective of HPV types, at least 1 dose | 10 | 0* | 0.10 (0.01 to 0.76) | 90% (24% to 99%) | 10 (2 to 10) | 20,214 | ⊕⊕⊕⊝ |
| 2. High‐grade cervical lesions in women who were HPV16/18 negative at baseline | |||||||
| Analysis 2.1.1 CIN2+ associated with HPV16/18, 3 doses, age 15‐26 years | 74 | 5 | 0.07 (0.03 to 0.15) | 93% (85% to 97%) | 69 (63 to 72) | 36,579 (6 studies) | ⊕⊕⊕⊕ high |
| Analysis 2.1.2 CIN2+ associated with HPV16/18, 3 doses, 24‐45 years | 36 | 6 | 0.16 (0.04 to 0.74) | 84% (26% to 96%) | 30 (9 to 34) | 6797 (2 studies) | ⊕⊕⊕⊝ |
| Analysis 2.2.1 CIN2+ associated with HPV16/18, at least 1 dose, 15‐26 years | 113 | 6 | 0.05 (0.03 to 0.10) | 95% (90% to 97%) | 107 (102 to 110) | 34,478 (6 studies) | ⊕⊕⊕⊕ high |
| Analysis 2.2.2 CIN2+ associated with HPV16/18, at least 1 dose, age 24‐45 years | 45 | 14 | 0.30 (0.11 to 0.81) | 70% (19% to 89%) | 32 (9 to 40) | 7552 (2 studies) | ⊕⊕⊕⊝ |
| Analysis 2.3.1 CIN2+ associated with HPV16/18, 1 or 2 doses, 15‐26 years*** | 436 | 44 | 0.10 (0.04 to 0.26) | 90% (74% to 96%) | 392 (323 to 418) | 2958 (5 studies) | ⊕⊕⊝⊝ low1$ |
| Analysis 2.3.2 CIN2+ associated with HPV16/18, 1 or 2 doses, age 24‐45 years*** | 134 | 82 | 0.61 (0.14 to 2.67) | 39% (‐167% to 86%) | 52 (‐2245 to 115) | 755 (2 studies) | ⊕⊝⊝⊝ |
| Analysis 2.4 CIN2+ associated with HPV6/11/16/18, 3 doses, age 15‐45 years | 99 | 6 | 0.06 (0.01 to 0.61) | 94% (39% to 99%) | 93 (39 to 98) | 7664 (2 studies) | ⊕⊕⊕⊝ |
| Analysis 2.4.1 CIN2+ associated with HPV6/11/16/18, 3 doses, age 15‐26 years | 142 | 0* | 0.02 (0.00 to 0.25) | 98% (75% to 100%) | 142 (93 to 190) | 4499 (1 study) | ⊕⊕⊕⊝ |
| Analysis 2.4.2 CIN2+ associated with HPV6/11/16/18, 3 doses, age 24‐45 years | 38 | 6 | 0.17 (0.02 to 1.39) | 83% (‐39% to 98%) | 32 (‐1 to 32) | 3165 (1 study) | ⊕⊕⊝⊝ |
| Analysis 2.5.1 CIN2+ associated with HPV6/11/16/18, at least 1 dose, age 15‐26 years | 160 | 0* | 0.01 (0.00 to 0.19) | 99% (81% to 100%) | 160 (130 to 159) | 5351 (1 study) | ⊕⊕⊕⊝ |
| Analysis 2.5.2 CIN2+ associated with HPV6/11/16/18, at least 1 dose, age 24‐45 years | 44 | 16 | 0.37 (0.10 to 1.41) | 63% (‐41% to 90%) | 28 (‐18 to 40) | 3629 (1 study) | ⊕⊕⊕⊝ |
| Analysis 2.6 CIN2+ associated with HPV6/11/16/18, 1 or 2 doses, age 15‐45 years*** | 199 | 48 | 0.24 (0.01 to 5) | 76% (‐400% to 99%) | 151 (‐795 to 197) | 1316 (2 studies) | ⊕⊝⊝⊝ |
| Analysis 2.6.1 CIN2+ associated with HPV6/11/16/18, 1 or 2 doses, age 15‐26 years*** | 258 | 0* | 0.04 (0.00 to 0.74) | 96% (26% to 100%)) | 258 (108 to 409) | 852 (1 study) | ⊕⊝⊝⊝ |
| Analysis 2.6.2 CIN2+ associated with HPV6/11/16/18, 1 or 2 doses, age 24‐45 years*** | 88 | 85 | 0.97 (0.14 to 6.80) | 3% (‐580% to 86%) | 3 (‐165 to 171) | 464 (1 study) | ⊕⊝⊝⊝ |
| Analysis 2.7 CIN3+ associated with HPV16/18, 3 doses, age 15‐26 years | 40 | 3 | 0.07 (0.02 to 0.29) | 93% (71% to 98%) | 37 (28 to 39) | 29,720 (3 studies) | ⊕⊕⊕⊕ |
| Analysis 2.8 CIN3+ associated with HPV16/18, at least 1 dose, age 15‐26 years | 57 | 3 | 0.05 (0.02 to 0.14) | 95% (86% to 98%) | 54 (49 to 56) | 33,199 (3 studies) | ⊕⊕⊕⊕ high |
| Analysis 2.9 CIN3+ associated with HPV16/18, 1 or 2 doses, age 15‐26 years*** | 200 | 12 | 0.06 (0.01 to 0.24) | 94% (26% to 100%) | 188 (152 to 198) | 3479 (3 studies) | ⊕⊕⊝⊝ low1$ |
| Analysis 2.10 AIS+ associated with HPV16/18, 3 doses, age 15‐26 years | 8 | 0* | 0.12 (0.02 to 0.70) | 88% (36% to 99%) | 8 (2 to 8) | 29,707 (3 studies) | ⊕⊕⊕⊝ |
| Analysis 2.11 AIS+ associated with HPV16/18, at least 1 dose, age 15‐26 years | 12 | 0* | 0.09 (0.01 to 0.72) | 81% (28% to 99%) | 12 (3 to 12) | 17,079 (2 studies) | ⊕⊕⊕⊝ |
| Analysis 2.12 AIS+ associated with HPV16/18 or HPV6/11/16/18, 1 or 2 doses, age 15‐26 years*** | 29 | 0* | 0.15 (0.01 to 2.97) | 85% (‐197% to 99%) | 29 (‐57 to 29) | 2015 (2 studies) | ⊕⊝⊝⊝ |
| Analysis 2.13 CIN2+ irrespective of HPV types, 3 doses, age 15‐26 years | 166 | 66 | 0.40 (0.25 to 0.64) | 60% (36% to 75%) | 99 (60 to 124) | 7320 (3 studies) | ⊕⊕⊕⊕ high |
| Analysis 2.14 CIN2+ irrespective of HPV types, at least 1 dose, age 15‐26 years | 231 | 95 | 0.41 (0.32 to 0.52) | 58% (46% to 67%) | 136 (111 to 157) | 19,143 (3 studies) | ⊕⊕⊕⊕ high |
| Analysis 2.15 CIN2+ irrespective of HPV types, 1 or 2 doses, age 20‐25 years*** | 1000 | 710 | 0.71 (0.15 to 3.38) | 29% (‐238% to 85%) | 290 (‐2,380 to 850) | 34 (1 study) | ⊕⊝⊝⊝ |
| 3. High‐grade cervical lesions in all women regardless of HPV DNA status at baseline** | |||||||
| Analysis 3.1.1 CIN2+ associated with HPV16/18, at least 1 dose, age 15‐26 years | 341 | 157 | 0.46 (0.37 to 0.57) | 54% (43% to 63%) | 184 (147 to 215) | 34,852 | ⊕⊕⊕⊕ high |
| Analysis 3.1.2 CIN2+ associated with HPV16/18, at least 1 dose, age 24‐45 years | 157 | 116 | 0.74 (0.52 to 1.05) | 26% (‐5% to 48%) | 41 (‐8 to 75) | 9200 (2 studies) | ⊕⊕⊕⊝ moderate4 |
| Analysis 3.2.1 CIN2+ associated with HPV6/11/16/18, at least 1 dose, age 15‐26 years | 436 | 217 | 0.50 (0.42 to 0.59) | 50% (41% to 58%) | 219 (166 to 272) | 17,160 (1 study) | ⊕⊕⊕⊝ |
| Analysis 3.2.2 CIN2+ associated with HPV6/11/16/18, at least 1 dose, age 24‐45 years | 145 | 113 | 0.78 (0.44 to 1.37) | 22% (‐37% to 56%) | 143 (72 to 204 | 3723 (1 study) | ⊕⊕⊕⊝ |
| Analysis 3.3 CIN3+ associated with HPV16/18, at least 1 dose, age 15‐26 years | 165 | 91 | 0.55 (0.43 to 0.68) | 74% (55% to 91%) | 74 (55 to 91) | 34,562 | ⊕⊕⊕⊕ high |
| Analysis 3.4 CIN3+ associated with HPV16/18, 1 or 2 doses, age 15‐26 years*** | 230 | 124 | 0.54 (0.43 to 0.68) | 46% (32% to 57%) | 106 (74 to 131) | 17,160 (1 study) | ⊕⊕⊝⊝ |
| Analysis 3.5 AIS associated with HPV16/18, at least 1 dose, age 15‐26 years | 14 | 5 | 0.36 (0.17 to 0.78) | 64% (22% to 83%) | 9 (3 to 12) | 34,562 | ⊕⊕⊕⊕ high |
| Analysis 3.6 AIS associated with HPV6/11/16/18, at least 1 dose, age 15‐45 years | 15 | 6 | 0.40 (0.16 to 0.98) | 60% (2% to 84%) | 9 (0 to 13) | 20,830 (1 study) | ⊕⊕⊕⊝ |
| Analysis 3.7.1 Any CIN2+ irrespective of HPV types, at least 1 dose, age 15‐26 years | 559 | 391 | 0.70 (0.58 to 0.85) | 30% (15% to 42%) | 168 (84 to 235) | 35,779 | ⊕⊕⊕⊕ high |
| Analysis 3.7 2 Any CIN2+ irrespective of HPV types, at least 1 dose, age 24‐45 years | 342 | 356 | 1.04 (0.83 to 1.30) | ‐4% (‐30% to 17%) | ‐14 (‐103 to 58) | 9287 (2 studies) | ⊕⊕⊝⊝ |
| Analysis 3.8 Any CIN3+ irrespective of HPV types, at least 1 dose, age 18‐26 years, bivalent vaccine | 188 | 103 | 0.55 (0.43 to 0.71) | 45% (29% to 57%) | 84 (54 to 1107) | 18,329 (2 studies) | ⊕⊕⊕⊕ high |
| Analysis 3.8 Any CIN3+ irrespective of HPV types, at least 1 dose, age 15‐26 years, quadrivalent vaccine | 349 | 283 | 0.81 (0.69 to 0.96) | 19% (4% to 31%) | 66 (14 to 108) | 17,160 (1 study) | ⊕⊕⊕⊝ |
| Analysis 3.9 Any AIS irrespective of HPV types, at least 1 dose, age 15‐26 years | 17 | 5 | 0.32 (0.15 to 0.67) | 68% (33% to 0.85%) | 11 (6 to 14) | 34,562 | ⊕⊕⊕⊕ high |
| 4. HPV16/18 infection in women who were hrHPV DNA negative at baseline | |||||||
| Analysis 4.1 Incident HPV16/18 infection, 3 doses, age 18‐26 years | 2,457 | 147 | 0.06 (0.02 to 0.20) | 94% (80% to 98%) | 2,310 (1,966 to 2,408) | 368 (1 study) | ⊕⊕⊕⊝ |
| Analysis 4.2 Persistent HPV16/18 infection(6M), 3 doses, age 15‐26 years | 971 | 29 | 0.02 (0.00 to 0.35) | 97% (57% to 100%) | 942 (554 to 971) | 368 (1 study) | ⊕⊕⊕⊝ |
| Analysis 4.3 Persistent HPV16/18 infection(6M), at least 1 dose, age 18‐25 years | 96 | 7 | 0.07 (0.05 to 0.09) | 93% (81% to 95%) | 90 (88 to 91) | 10,826 (1 study) | ⊕⊕⊕⊝ |
| Analysis 4.4 Persistent HPV16/18 infection(12M), 3 doses, age 15‐26 years | 571 | 23 | 0.04 (0.00 to 0.73) | 96% (27% to 100%) | 549 (154 to 571) | 368 (1 study) | ⊕⊕⊕⊝ |
| Analysis 4.5 Persistent HPV16/18 infection(12M), at least 1 dose, age 15‐26 years | 462 | 37 | 0.08 (0.05 to 0.12) | 92% (88% to 95%) | 425 (406 to 439) | 14,153 ( 2 studies) | ⊕⊕⊕⊕ high |
| 5. HPV16/18 infection in women who were HPV16/18 negative at baseline | |||||||
| Analysis 5.1 Incident HPV16/18 infection, 3 doses, age 15‐26 years | 474 | 81 | 0.17 (0.10 to 0.31) | 87% (78% to 92%) | 412 (369 to 436) | 8,034 (4 studies) | ⊕⊕⊕⊕ high |
| Analysis 5.2 Incident HPV16/18 infection, at least 1 dose, age 15‐26 years | 1,326 | 305 | 0.23 (0.14 to 0.37) | 81% (71% to 88%) | 1,074 (941 to 1,167) | 23,872 (5 studies) | ⊕⊕⊕⊕ high |
| Analysis 5.3 Incident HPV16/18 infection, 1 or 2 dose, age 15‐26 years*** | 2,568 | 1207 | 0.47 (0.26 to 0.84) | 74% (31% to 90%) | 1,901 (796 to 2,311) | 331 (3 studies) | ⊕⊕⊕⊝ moderate1 |
| Analysis 5.4.1 Persistent HPV16/18 infection (6M), 3 doses, age 15‐26 years | 581 | 35 | 0.06 (0.05 to 0.08) | 94% (91% to 95%) | 546 (534 to 552) | 27,385 (6 studies) | ⊕⊕⊕⊕ high |
| Analysis 5.4.2 Persistent HPV16/18 infection (6M), 3 doses, age 24‐45 years | 350 | 38 | 0.11 (0.06 to 0.20) | 89% (80% to 94%) | 311 (280 to 329) | 6728 (2 studies) | ⊕⊕⊕⊝ |
| Analysis 5.5.1 Persistent HPV16/18 infection (6M), at least 1 dose, age 15‐26 years | 657 | 66 | 0.10 (0.08 to 0.13) | 90% (87% to 92%) | 591 (572 to 605) | 22,803 (4 studies) | ⊕⊕⊕⊕ high |
| Analysis 5.5.2 Persistent HPV16/18 infection (6M), at least 1 dose, age 24‐45 years | 441 | 75 | 0.17 (0.10 to 0.29) | 83% (71% to 90%) | 366 (313 to 397) | 7520 (2 studies) | ⊕⊕⊕⊕ high |
| Analysis 5.6.1 Persistent HPV16/18 infection (6M), 1 or 2 doses, age 15‐26 years*** | 996 | 119 | 0.12 (0.03 to 0.42) | 88% (58% to 97%) | 876 (577 to 966) | 437 (2 studies) | ⊕⊕⊝⊝ |
| Analysis 5.6.2 Persistent HPV16/18 infection (6M), 1 or 2 doses, age 24‐45 years*** | 1,221 | 379 | 0.31 (0.18 to 0.54) | 69% (46% to 82%) | 843 (562 to 1002) | 792 (2 studies) | ⊕⊕⊕⊝ moderate1 |
| Analysis 5.7 Persistent HPV6/11/16/18 infection (6M), 3 doses | 518 | 62 | 0.12 (0.06 to 0.21) | 88% (79% to 94%) | 456 (409 to 487) | 4008 (2 studies) | ⊕⊕⊕⊕ high |
| Analysis 5.8 Persistent HPV6/11/16/18 infection (6M), at least 1 dose | 907 | 118 | 0.13 (0.05 to 0.37) | 87% (63% to 95%) | 789 (571 to 862) | 4129 (2 studies) | ⊕⊕⊕⊕ high |
| Analysis 5.9 Persistent HPV16/18 infection (12M), 3 doses | 297 | 27 | 0.09 (0.06 to 0.13) | 91% (87% to 94%) | 270 (258 to 279) | 22,267 (4 studies) | ⊕⊕⊕⊕ high |
| Analysis 5.10 Persistent HPV16/18 infection (12M), at least 1 dose | 365 | 58 | 0.16 (0.01 to 0.13) | 84% (87% to 99%) | 306 (292 to 361) | 29,464 (5 studies) | ⊕⊕⊕⊕ high |
| Analysis 5.11 Persistent HPV16/18 infection (12M), 1 or 2 doses*** | 205 | 27 | 0.13 (0.06 to 0.33) | 87% (67% to 94%) | 178 (137 to 193) | 3912 (3 studies) | ⊕⊕⊕⊝ moderate1 |
| 6. HPV16/18 infection regardless of HPV DNA status at baseline** | |||||||
| Analysis 6.1 Incident HPV16/18 infection, at least 1 dose, age 15‐26 years | 807 | 194 | 0.24 (0.17 to 0.33) | 76% (67% to 83%) | 613 (541 to 670) | 4210 (1 study) | ⊕⊕⊕⊝ |
| Analysis 6.2.1 Persistent HPV16/18 infection (6M), at least 1 dose, age 15‐26 years | 1,359 | 598 | 0.44 (0.38 to 0.51) | 56% (49% to 62%) | 761 (666 to 842) | 25,199 (2 studies) | ⊕⊕⊕⊕ high |
| Analysis 6.2.2 Persistent HPV16/18 infection (6M), at least 1 dose, age 24‐45 years | 642 | 366 | 0.57 (0.47 to 0.69) | 43% (31% to 53%) | 276 (199 to 341) | 8648 (2 studies) | ⊕⊕⊕⊕ high |
| Analysis 6.3 Persistent HPV6/11/16/18 infection (6M), at least 1 dose, age 24‐45 years | 1,136 | 591 | 0.52 (0.42 to 0.65) | 48% (35% to 58%) | 545 (398 to 659) | 3713 (1 study) | ⊕⊕⊕⊝ |
| Analysis 6.4 Persistent HPV16/18 infection (12M), at least 1 dose, age 15‐26 years | 861 | 396 | 0.46 (0.40 to 0.54) | 54% (46% to 60%) | 465 (396 to 516) | 24,785 (2 studies) | ⊕⊕⊕⊕ high |
| CI: Confidence interval; RR: Risk Ratio; | |||||||
| GRADE Working Group grades of evidence Moderate quality: Further research is likely to have an important impact on our confidence in the estimate of effect and may change the estimate. | |||||||
1In case of study flaws as assessed by the Cochrane Collaboration's tool for assessing risk of bias in randomised trials (Higgins 2011b), not observed but calculated outcome;
2 Substantial heterogeneity defined as I2 >30%, when multiple studies were available for the considered outcome;
3When only one study was retrieved for the outcome;
4Imprecision, when the width of the 95% confidence interval around RR >0.60.
0* When zero events occurred in the vaccine group a continuity correction was applied to compute the RR and its confidence interval. Nevertheless, in this case the absolute risks in the vaccine arms in Table 2 were computed considering an exact binomal distribution.
** Relative and absolute effects in women regardless of HPV DNA status at baseline (headings 3 and 6) must be interpreted with care since influenced by the prevalence of HPV infection at enrolment in the respective trials.
*** Post hoc analysis for women who received <3 doses.
$ For the precancer endpoints (CIN2/3 and AIS),a higher risk in the placebo arms was observed if <3 doses were received compared to those who received 3 doses Therefore the quality of evidence was downgraded to low or very low.
-
three types of exposure groups:
-
women with hrHPV DNA negative status at baseline
-
women with HPV16/18 DNA negative status at baseline
-
all women regardless of HPV DNA status at baseline
-
-
two main types of outcomes:
-
precancerous lesions (CIN2+, CIN3+ and AIS+)
-
associated with HPV vaccine types (HPV16/18 or HPV6/11/16/18)
-
irrespective of HPV type
-
-
infection by the HPV types included in the vaccine:
-
incident infection
-
persistent infection (observed over six months or over 12 months)
-
-
-
number of doses received: one, two, three, at least one, one or two ( = difference between the number of women having received at least one dose and three‐dose recipients which was the majority of enrolled women. All trials were designed as three‐dose trials; women who received fewer than three were those who did not complete the planned schedule. We could not assess risk of bias due to differences in fewer than three‐dose recipients and control groups in our analysis)
-
age group: 15 to 26 years; 24 to 45 years
1. Protection against high‐grade cervical lesions in women negative for hrHPV DNA at baseline
Data on the protection against CIN2+,CIN3+ and AIS+ associated with two HPV types included in the vaccines (HPV16 or 18) in adolescent girls and women aged 15 to 26 years could be extracted from three large phase III trials (CVT (ph3,2v); FUT I/II trials (ph3,4v); PATRICIA trial (ph3,2v)) for women having received at least one dose. The risk of CIN2+, CIN3+ and AIS+ was lower following both vaccines: for CIN2+ (risk ratio (RR) = 0.01, 95% confidence interval (CI) 0.00 to 0.05; participants = 23,676; studies = 3; I2 = 0%; Analysis 1.1), for CIN3+ (RR = 0.01, 95% CI 0.00 to 0.10; participants = 20,214; studies = 2; I2 = 0%; Analysis 1.3), and for AIS + (RR= 0.10, 95% CI 0.01 to 0.82; participants = 20,214; studies = 2; I2 = 0%; Analysis 1.5). We graded the evidence as high quality for the outcomes CIN2+ and CIN3+ and as moderate quality for AIS+ (downgraded for imprecision due to the rarity of the AIS+ outcome). The efficacy of the quadrivalent vaccine was similar when lesions associated with four vaccine types (HPV6/11/16/18) were considered (Analysis 1.2; Analysis 1.4 and Analysis 1.6).
Protection against any high‐grade cervical lesions, irrespective of HPV type, was substantially lower than for lesions caused by the HPV types included in the vaccine. The test for subgroup differences suggested that efficacy differed significantly according to valency of the vaccine (P values = 0.004 and 0.001, for CIN2+ and CIN3+, respectively). The bivalent vaccine showed higher efficacy than the quadrivalent vaccine for protection against CIN2+ (RR = 0.33, 95% CI 0.25 to 0.43; participants = 15,884; studies = 4; I2 = 0%) versus RR = 0.57 (95% CI 0.44 to 0.76; participants = 9296; studies = 1) see (Analysis 1.7), and against CIN3+ (RR = 0.08, 95% CI 0.03 to 0.23; participants = 11,423; studies = 2; I2 = 0%) versus RR = 0.54, (95% CI 0.36 to 0.82; participants = 9296; studies = 1; Analysis 1.8). We graded the quality of evidence regarding vaccine efficacy against any high‐grade CIN, irrespective of HPV type, as high for bivalent and moderate for the quadrivalent vaccine. Both vaccines were similarly efficacious regarding protection against any AIS, irrespective of HPV type (RR 0.10, 95% CI 0.01 to 0.76), P value for inter‐vaccine heterogeneity = 0.71, Analysis 1.9). We graded this evidence as moderate quality (downgraded for imprecision due to the rarity of the AIS+ outcome).
2. Protection against high‐grade cervical lesions in women negative for HPV16/18 DNA at baseline
Outcomes for women negative for HPV16/18 are more often reported as a per protocol analysis in vaccination trials. Some trials reported outcomes for women who received all three doses and for women who received at least one dose. This allows computation (by subtraction) of outcomes for women who receive one or two doses (see also Results section 9.4).
2.1. CIN2+ associated with HPV types included in the vaccine
In adolescent girls and women aged 15 to 26 years who received three vaccine doses, protection against CIN2+ associated with HPV16/18 was consistently high with a RR pooled from six trials, including the mono‐, bi‐ and quadrivalent vaccine of 0.07, (95% CI 0.03 to 0.15 ; participants = 36,579; studies = 6; I2 = 0%, Analysis 2.1.1). We judged this to be high‐quality evidence.
Among mid‐adult women, aged 24 to 45 years, vaccination with the bivalent or quadrivalent vaccine also showed protection (RR 0.16, 95% CI 0.04 to 0.74; participants = 6797; studies = 2; I2 = 0%); moderate‐quality evidence; Analysis 2.1.2). We downgraded this evidence due to the imprecision of the estimate. Protection in the mid‐adult age groups was not significantly lower than that in the younger groups (P value for inter‐group heterogeneity of 0.31, I2= 3.8%).
In women who received at least one dose, protection was also consistently high in adolescent girls and women aged 15 to 26 years: RR pooled from six trials of 0.05 (95% CI 0.03 to 0.10; participants = 34,478; studies = 6; I2 = 0%; high‐quality evidence; Analysis 2.2). In women aged 24 to 45 years, protection was lower than in the younger group (RR 0.30, 95% CI 0.11 to 0.81; participants = 7552; studies = 2; I2 = 0%; moderate‐quality evidence; Analysis 2.2.2). For efficacy from at least one dose, the difference in RR between age‐groups was significant (P value = for inter‐group heterogeneity of 0.005, I2= 87.1%).
Considering women who received just one or two doses, the risk of CIN2+ was lower after vaccination in the younger age groups (RR 0.10, 95% CI 0.04 to 0.26; participants = 2958; studies = 5; I2 = 0%, low‐quality evidence). The effect in mid‐adult women was uncertain (RR 0.61, 95% CI 0.14 to 2.67; participants = 755; studies = 2; I2 = 0%; low‐quality evidence) (Analysis 2.3). The quadrivalent vaccine conferred similar degrees of protection against CIN2+ associated with the four types HPV16/18/6/11 as to those associated with HPV16/18 (Analysis 2.4; Analysis 2.5; Analysis 2.6).
2.2. CIN3+ associated with HPV types included in the vaccine
Efficacy of vaccination against occurrence of CIN3+ associated with HPV16/18 or HPV16/18/6/11 was reported in three large phase III trials assessing the bivalent vaccine (PATRICIA trial (ph3,2v)) or quadrivalent vaccine (FUTURE I trial (ph3,4v); FUTURE II trial (ph3,4v)). Data were pooled in one outcome, given the similarity in direction and magnitude of effects. Protection with HPV vaccination was similarly high in women who received all three doses, (RR 0.07, 95% CI 0.02 to 0.29; participants = 29,720; studies = 3; I2 = 28%; high‐quality evidence; Analysis 2.7); in those who received at least one dose (RR 0.05, 95% CI 0.02 to 0.14; participants = 33,199; studies = 3; I2 = 0%; high‐quality evidence; Analysis 2.8); and in women who received only one or two doses (RR 0.06, 95% CI 0.01 to 0.24; participants = 3479; studies = 3; I2 = 0%; low‐quality evidence; Analysis 2.9).
2.3. AIS+ associated with HPV types included in the vaccine
Data were pooled for AIS+ associated with HPV16/18 or associated with HPV16/18/6/11 in one group, given the similarity in magnitude of protection and insignificance of heterogeneity.
In women receiving three doses of bivalent or quadrivalent vaccine, at least one dose of quadrivalent, or one or two doses of bivalent or quadrivalent vaccine, the pooled protective effect was 100% (zero excluded from the 95% CI). Applying a continuity correction gave pooled RRs of 0.12 for three doses (95% CI 0.02 to 0.70; participants = 29,707; studies = 3; I2 = 0%; moderate‐quality evidence; Analysis 2.10); 0.09 for at least one dose (95% CI 0.01 to 0.72; participants = 17,079; studies = 2; I2 = 0%; moderate‐quality evidence; Analysis 2.11); and 0.15 for one or two doses (95% CI 0.01 to 2.97; participants = 2015; studies = 2; I2 = 0%; very low‐quality evidence; Analysis 2.12).
2.4. Any CIN2+ irrespective of HPV type
Protection against CIN2+ irrespective of HPV types was reported in five trials (CVT (ph3,2v); Japanese trial (ph2,2v); PATRICIA trial (ph3,2v); Phase2 trial (ph2,1v); Phase2 trial (ph2,2v)). Vaccination with three doses reduced the risk of CIN2+ by 60% on average (RR 0.40, 95% CI 0.25 to 0.64; participants = 7,320; studies = 3; I2 = 0%; high‐quality evidence Analysis 2.13). Vaccination with at least one dose of the bivalent vaccine produced similar effects (RR 0.41, 95% CI 0.32 to 0.52; participants = 19,143; studies = 3; I2 = 0%; Analysis 2.14). We judged this to be high‐quality evidence. Protection generated from the vaccine of one or two doses was unclear since the quality of evidence was very low (RR 0.71, 95% CI 0.15 to 3.38; participants = 34; studies = 1), as this could only be assessed for one small trial (Analysis 2.15; Japanese trial (ph2,2v)).
No results were found for the outcomes any CIN3+ or AIS+ irrespective of HPV type.
3. Protection against high‐grade lesions in women regardless of baseline HPV DNA status
Data on the protection induced by HPV vaccination against high‐grade lesions in all enrolled women regardless of HPV DNA status at enrolment are reported only for those who received at least one dose.
3.1. CIN2+ associated with the vaccine HPV types
In adolescent girls and women aged 15 to 26, the reduction of risk of CIN2+ associated with the HPV types included in the vaccine was lower than in the hrHPV‐naive or HPV16/18 negative groups (discussed in results sections 1 and 2), but was still significant with limited variation between mono‐, bi‐ and quadrivalent vaccines (RR 0.46, 95% CI 0.37 to 0.57; participants = 34,852; studies = 3; I2 = 38%; high‐quality evidence) (Analysis 3.1.1 and Analysis 3.2.1). However, in mid‐adult women (24 to 45 years), the protection of the bi‐ and quadrivalent vaccine was not significant (RR 0.74, 95% CI 0.52 to 1.05; participants = 9200; studies = 2; I2 = 0%; moderate‐quality evidence) (Analysis 3.1.2). Similar findings were observed for the protection induced by the quadrivalent vaccine against CIN2+ associated with HPV16/18/6/11 (Analysis 3.2.2).
3.2. CIN3+ associated with HPV types included in the vaccine
Both the bivalent and quadrivalent vaccines protected against CIN3+ associated with HPV16/18 (RR 0.55, 95% CI 0.45 to 0.67; participants = 34,562; studies = 2; I2 = 0%) Analysis 3.3) with similar protection against CIN3+ associated with HPV16/18/6/11 (Analysis 3.4).
3.3. AIS+ associated with HPV types included in the vaccine
Both the bi‐ and quadrivalent vaccines offered protection against AIS+ associated with HPV16/18 (RR 0.36, 95% CI 0.17 to 0.78; participants = 34,562; studies = 2; I2 = 0%; moderate‐quality evidence; Analysis 3.5) and associated with HPV16/18/6/11 ((RR 0.40, 95% CI 0.16 to 0.98; participants = 20,830; studies = 2; I2 = 0%; moderate‐quality evidence; Analysis 3.6).
3.4. Any CIN2+ irrespective of HPV type
Limited protection against CIN2+ irrespective of HPV type was shown for the mono‐, bi‐, and quadrivalent vaccines in younger women aged 15 to 26 years (RR 0.70, 95% CI 0.58 to 0.85; participants = 35,779; studies = 4; high‐quality evidence; I2 = 31%, see Figure 5; Analysis 3.7.1), the efficacy did not vary by the valency of the vaccine (P value for subgroup difference = 0.24).

Protection against CIN2+ irrespective of presence of HPV types in women, aged 15‐26 years, regardless of their HPV DNA status at baseline, who received at least one dose.
In the mid‐adult group (24 to 45 years), HPV vaccination with the bi‐ or quadrivalent vaccine was not protective (RR 1.04, 95% CI 0.83 to 1.30; participants = 9287; studies = 2; I2 = 8%; Analysis 3.7.2).
3.5. Any CIN3+ irrespective of HPV type
The vaccines showed different results in protection against any CIN3+ irrespective of HPV type. Among young women (16 to 26 year) bivalent vaccines reduced the risk of CIN3+ (RR 0.55 (95% CI 0.43 to 0.71; participants = 18,329; studies = 2; I2 = 0%), and the quadrivalent vaccine gave a smaller degree of protection (RR 0.81 (95% CI 0.69 to 0.96, participants = 17,160, studies = 1) (Analysis 3.8). The interaction test for the subgroup differences gave a P value of 0.01.
No data were reported for mid‐adult women.
3.6. Any AIS+ irrespective of HPV type
The two vaccines reduced the risk of any AIS+ irrespective of hrHPV types in young women (age 16 to 26 years) (RR 0.32, 95% CI 0.15 to 0.67; participants = 34,562; studies = 2; I2 = 0%; high‐quality evidence; Analysis 3.9).
No data were reported for mid‐adult women.
4. Protection against infection with HPV types included in the vaccine in women negative for hrHPV DNA at baseline
Protection against HPV16/18 infection among women negative for hrHPV DNA at baseline, aged 15 to 26 years, was documented only for the bivalent vaccine. One phase II trial (Phase2 trial (ph2,2v) provided data for the outcome of incident infection ((RR 0.06, 95% CI 0.02 to 0.20; participants = 368; studies = 1) Analysis 4.1) and six‐ and 12‐month‐persisting infections among women who received three doses ((RR 0.02, 95% CI 0.00 to 0.35; participants = 368; studies = 1), Analysis 4.2); (RR 0.04, 95% CI 0.00 to 0.73; participants = 368; studies = 1; moderate‐quality evidence) (Analysis 4.4), respectively).
One large phase III trial (PATRICIA trial (ph3,2v)) assessed protection against 6‐ and 12‐month persisting infection among women who received at least one dose (RR 0.07, 95% CI 0.05 to 0.09; participants = 10,826; studies = 1; moderate‐quality evidence; Analysis 4.3); (RR 0.08, 95% CI 0.05 to 0.12; participants = 14,153; studies = 2; I2 = 0%; moderate‐quality evidence;(Analysis 4.5), respectively).
5. Protection against HPV16/18 infection in women negative for HPV16/18 DNA at baseline
In women who were initially HPV16/18 DNA negative at enrolment and who received three doses, protection against incident infection with HPV16/18 was consistently high in three trials assessing different vaccines and age groups: RR = 0.17, 95% CI 0.10 to 0.31; participants = 8034; studies = 4; I2 = 52%, high‐quality evidence; Analysis 5.1). HPV vaccines also reduced the risk of incident infection in those who received at least one dose (RR 0.23, 95% CI 0.14 to 0.37; participants = 23,872; studies = 5; I2 = 79%; high‐quality evidence; Analysis 5.2) or just one or two doses ((RR 0.47, 95% CI 0.26 to 0.84; participants = 331; studies = 3; I2 = 14%; moderate‐quality evidence; Analysis 5.3).
The reduction in risk of persistent HPV16/18 infection (lasting for at least six months) in women who received three doses was consistently high in younger women for all types of vaccine (RR 0.06, 95% CI 0.05 to 0.08; participants = 27,385; studies = 6; I2 = 0%; high‐quality evidence) and was also high in mid‐adult women aged 24 to 45 years who received three doses ((RR 0.11, 95% CI 0.06 to 0.20; participants = 6728; studies = 2; I2 = 0%); high‐quality evidence; Analysis 5.4). Similar protection was seen for the larger group of women who received at least one dose of bivalent or quadrivalent vaccine (RR 0.10, 95% CI 0.08 to 0.12; participants = 22,803; studies = 4; I2 = 0%; for younger women aged 15 to 26 years, and RR 0.17, 95% CI 0.10 to 0.29; participants = 7520; studies = 2; I2 = 43%) or mid‐adult women; high‐quality evidence; Analysis 5.5). In young and mid‐adult women, the reduction in risk following vaccination with one or two doses was 0.12 ( 95% CI 0.03 to 0.42; participants = 437; studies = 2; I2 = 0%; moderate‐quality evidence) and 0.31 (95% CI 0.18 to 0.54; participants = 792; studies = 2; I2 = 0%; high‐quality evidence), respectively. We did not have sufficient data to confirm the lower degree of protection associated with one or two doses in mid‐adult compared to young women. The number of events and participants is small and the difference was not statistically significant (P value for interaction test 0.18; Analysis 5.6).
Protection induced by the quadrivalent vaccine against six‐month persistent HPV infection with one of the four HPV types included in the vaccine was comparable with the protection against the two oncogenic types (Analysis 5.7 (after reception of three doses); Analysis 5.8 (after reception of at least one dose)).
Protection against 12‐month persistent HPV16/18 infection was only reported from trials assessing the bivalent vaccine. The efficacy was high if three doses were given (RR 0.09, 95% CI 0.06 to 0.13; participants = 22,267; studies = 4; I2 = 0%); high‐quality evidence; Analysis 5.9), and slightly lower with at least one dose (RR 0.16, 95% CI 0.12 to 0.20; participants = 29,464; studies = 5; I2 = 0%; high‐quality evidence; Analysis 5.10), or only one or two doses ((RR 0.13, 95% CI 0.06 to 0.33; participants = 3912; studies = 3; I2 = 0%) high‐quality evidence; Analysis 5.11).
6. Protection against infection with HPV types included in the vaccine in women regardless of HPV DNA status at baseline
Women aged 15 to 26 years, regardless of hrHPV DNA status, who received at least one dose of the bivalent vaccine were protected against incident HPV16/18 infection (RR 0.24, 95% CI 0.17 to 0.33; participants = 4210; studies = 1; moderate‐quality evidence; Analysis 6.1). In these women, bivalent and quadrivalent vaccines also protected against persistent HPV16/18 infection lasting for six months: RR = 0.44 (95% CI 0.38 to 0.51; participants = 25,199; studies = 2; I2 = 62%; high‐quality evidence). In mid‐adult women (24 to 45 years), the vaccine also provided significant protection (RR 0.57, 95% CI 0.47 to 0.69; participants = 8648; studies = 2; I2 = 0%; high‐quality evidence), but the protection was significantly lower compared to the younger women (P value for inter‐group heterogeneity = 0.03; Analysis 6.2). The protection against persistent HPV16/18/6/11 infection lasting for six months was similar: RR = 0.52 (95% CI 0.42 to 0.65; participants = 3713; studies = 1) (Analysis 6.3).
The bivalent vaccine significantly reduced the occurrence of 12‐month persistent HPV16/18 infection after administration of at least one dose: RR 0.46 (95% CI 0.40 to 0.54; participants = 24,785; studies = 2; I2 = 42%; high‐quality evidence; Analysis 6.4).
In a post hoc analysis, the Costa‐Rica Vaccination Trial (CVT (ph3,2v)) demonstrated that protection was not significantly different in women who had received one (RR = 0.05, 95% CI: 0 to 0.77), two (RR = 0.16, 95% CI: 0.05 to 0.54) or three doses (RR = 0.19, 95% CI: 0.13 to 0.29) of the bivalent vaccine (P value = 0.60, I2= 0%) (Analysis 6.5), however, it should be noted that these women were not randomised to one, two or three doses.
7. Summary of vaccine efficacy estimates
Before assessing the adverse effects, we summarise the main efficacy outcomes described in previous sections. In Figure 6, we present the pooled effects observed in women who received at least one dose of vaccine according to HPV DNA status at enrolment, i.e. hrHPV DNA negative (column A), HPV16/18 DNA negative (column B), and all enrolled regardless of baseline HPV DNA status (column C), separated by age group (15 to 26 years, 25 to 45 years). In each age group, we distinguish high grade lesions (CIN2+, CIN3+, AIS+) associated with HPV16/18 and all lesions irrespective of HPV type and six‐month persistent HPV16/18 infection. In each cell of the table, we provide the pooled RR and its 95% CI, a shading corresponding with the degree of protection, the level of evidence, the number of trials that contributed data and the reference to the respective analysis. Figure 7 provides a synthesis of the same outcomes in women who were HPV16/18 negative at enrolment according the number of vaccine doses received: three doses (column A), at least one dose (column B) and one or two doses (column C). A complete list of all outcomes can be found in Table 2. This table contains the absolute risks in the placebo and vaccination arms, the relative risks (risk vaccinated/risk placebo), the vaccine efficacy (VE = RR‐1) and the risk differences (RD = risk placebo ‐risk vaccinated, in %) and the level of evidence.
![Summary of vaccine efficacy estimates, by age group, outcome and HPV DNA status at enrolment (for women who received at least one dose). [REFS BETWEEN SQUARE BRACKETS MUST BE ADAPTED][](/cdsr/doi/10.1002/14651858.CD009069.pub3/media/CDSR/CD009069/image_n/nCD009069-AFig-FIG06.png)
Summary of vaccine efficacy estimates, by age group, outcome and HPV DNA status at enrolment (for women who received at least one dose). [REFS BETWEEN SQUARE BRACKETS MUST BE ADAPTED][
![Summary of vaccine efficacy estimates by age group, outcome and number of received doses (for women who were HPV16/18 DNA negative at enrolment). [REFS BETWEEN SQUARE BRACKETS MUST BE ADAPTED][](/cdsr/doi/10.1002/14651858.CD009069.pub3/media/CDSR/CD009069/image_n/nCD009069-AFig-FIG07.png)
Summary of vaccine efficacy estimates by age group, outcome and number of received doses (for women who were HPV16/18 DNA negative at enrolment). [REFS BETWEEN SQUARE BRACKETS MUST BE ADAPTED][
From a public health point of view, the two most relevant groups are: 1) hrHPV negative participants who reflect the naive unexposed group and 2) all vaccinated participants regardless of initial HPV DNA status.
In young women (15 to 26 years) who were hrHPV DNA negative and who received at least one dose of vaccine, the risk of CIN2+ associated with HPV16/18 was reduced on average from 164 to 2 per 10,000 women, a reduction or risk difference (RD) of 162 per 10,000 women vaccinated (Cates plot in Figure 8). The reduction in any CIN2+ irrespective of HPV type was from 287 to 106 per 10,000 women (RD 181 per 10,000 women vaccinated, see (Figure 9).
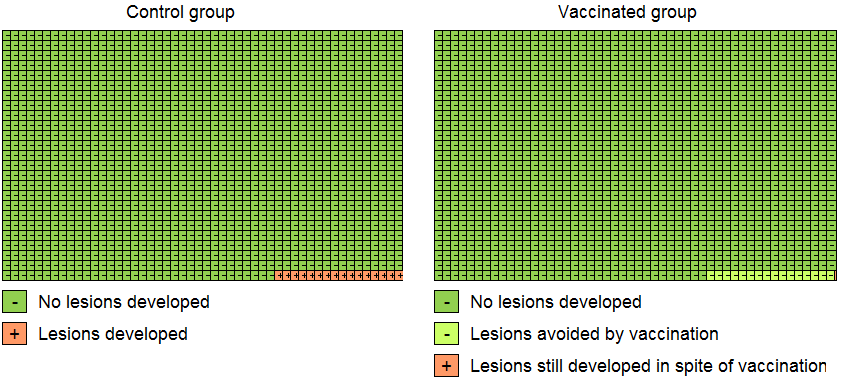
Modified Cates plot: Number of cases of CIN2+ associated with HPV16/18 occurring in women who were all hrHPV DNA negative at baseline. 16 out of 1000 non‐vaccinated women developed the lesion (left) whereas fewer than one (0.2) out 1000 vaccinated women developed the lesion (right). Relative risk= 0.01 (95% CI: 0.01 to 0.05).

Modified Cates plot: Number of cases of CIN2+ irrespective of HPV types occurring in women who were all hrHPV DNA negative at baseline. 28 out of 1000 non‐vaccinated women developed the lesion (left) whereas 11 out 1000 vaccinated women developed the lesion (right). Relative risk= 0.37 (95% CI: 0.25 to 0.55).
Among vaccinated women regardless of initial HPV DNA status, the risk reduction was from 341 to 157 per 10,000 women (RD 184 per 10,000 women vaccinated) and from 559 to 391 per 10,000 women (RD 168 per 10,000 women vaccinated), for CIN2+ associated with HPV16/18 or irrespective of HPV type, respectively (summary of findings Table 3).
The number needed to vaccinate was computed from the risk differences (NNV = 1/RD) (see Table 3). The number of women to be vaccinated to prevent one case of CIN2+, CIN3+ or AIS, associated with HPV16/18, in young women of age 15 to 26 years who were hrHPV negative at enrolment and who had received at least one dose of vaccine, was estimated to be 62, 204 and 1111, respectively. Although vaccine efficacy was lower in all participants regardless of initial HPV status, the NNVs were similar or slightly lower. Also, for lesions irrespective of HPV type, the NNVs were lower or similar. It must be noted that in populations where considerable exposure to HPV infection occurred prior to vaccination, the absolute risk of lesions in the vaccinated group is likely to be considerable.
| Outcome | Initial HPV status at enrolment | |
| hrHPV negative | Regardless of HPV status | |
| Lesions associated with HPV16/18 | NNV (95% CI) | NNV (95% CI) |
| CIN2+ | 62 (61 to 64) | 54 (46 to 68) |
| CIN3+ | 204 (149 to 333) | 135 (110 to 263) |
| AIS+ | 1111 (714 to 5000) | 1111 (625 to 3333) |
| Lesions irrespective of HPV types | NNV (95% CI) | NNV (95% CI) |
| CIN2+ | 60 (50 to 76) | 68 (52 to 97) |
| CIN3+ | 141 (106 to 208) | 133 (94 to 227) |
| AIS+ | 1000 (556 to 10,000) | 833 (526 to 2000) |
AIS: adenocarcinoma in situ, CIN: cervical intraepithelial neoplasia, CIN2+: CIN of degree II or worse, CIN3+: CIN of degree 3 or worse, hrHPV: high‐risk human papillomavirus types, NNV: number needed to vaccinate.
8. Adverse effects
Safety issues are summarised in Table 4. All the vaccines were consistently associated with short‐term local adverse effects (RR 1.18, 95% CI 1.16 to 1.20; participants = 18,113; studies = 8; I2 = 93%; moderate‐quality evidence; Analysis 7.1), such as pain at the injection site (RR 1.35, 95% CI 1.23 to 1.49; participants = 25,691; studies = 13; I2 = 98%; moderate‐quality evidence; Analysis 7.2), local swelling (RR 1.73, 95% CI 1.32 to 2.27; participants = 22,106; studies = 9; I2 = 95%; moderate‐quality evidence; Analysis 7.3) and redness (RR 1.72, 95% CI 1.50 to 1.97; participants = 19,996; studies = 6; I2 = 82%; moderate‐quality evidence; Analysis 7.4).
| Outcomes | Absolute risk/ per 10,000 | Relative effect | No of Participants | Quality of the evidence | |
| placebo | vaccinated | ||||
| Analysis 7.1Overall local/injection site adverse events | 6847 | 8080 | 1.18 (1.16 to 1.20) | 18,113 | ⊕⊕⊕⊝ |
| Analysis 7.2Pain at injection site | 6505 | 8782 | 1.35 (1.23 to 1.49) | 25,691 | ⊕⊕⊕⊝ |
| Analysis 7.3Swelling at injection site | 1582 | 2737 | 1.73 (1.32 to 2.27) | 22,106 | ⊕⊕⊕⊝ |
| Analysis 7.4Redness at injection site | 1938 | 3333 | 1.72 (1.50 to 1.97) | 19,996 | ⊕⊕⊕⊝ |
| Analysis 7.5Overall systematic event and general symptoms | 6102 | 6224 | 1.02 (0.98 to 1.07) | 18,191 | ⊕⊕⊕⊝ |
| Analysis 7.6Serious adverse events | 605 | 611 | 1.01 (0.95 to 1.07) | 6978 | ⊕⊕⊕⊕ |
| Analysis 7.7Deaths | 11 | 13 | 1.25 (0.81 to 1.93) | 71,452 (23 studies) | ⊕⊕⊝⊝ |
| Analysis 8.1Normal infant | 7171 | 7171 | 1.00 (0.97 to 1.02) | 8782 | ⊕⊕⊕⊕ |
| Analysis 8.2Spontaneous abortion/miscarriage | 1618 | 1424 | 0.88 (0.68 to 1.14) | 8618 | ⊕⊕⊕⊕ |
| Analysis 8.3Elective termination/induced abortion | 931 | 838 | 0.90 (0.80 to 1.02) | 10.909 | ⊕⊕⊕⊕ |
| Analysis 8.4Stillbirth | 70 | 78 | 1.12 (0.68 to 1.83) | 8754 | ⊕⊕⊕⊝4 |
| Analysis 8.5Abnormal infant | 205 | 250 | 1.22 (0.88 to 1.69) | 9252 | ⊕⊕⊕⊝4 |
| CI: Confidence interval; RR: Risk Ratio | |||||
| GRADE Working Group grades of evidence Moderate quality: Further research is likely to have an important impact on our confidence in the estimate of effect and may change the estimate. | |||||
1In case of study flaws as assessed by Cochrane's tool for assessing risk of bias in randomised trials (Higgins 2011b), not observed but calculated outcome
2 Substantial heterogeneity defined as I2 > 30%, when multiple studies were available for the considered outcome
3When only one study was retrieved for the outcome
4Imprecision, when the width of the 95% confidence interval around RR > 0.60
† inter‐age group heterogeneity, absence of pattern in causes of deaths
Systemic events with general mild symptoms were similarly frequent in vaccinated recipients and placebo or control vaccine recipients (RR 1.02, 95% CI 0.98 to 1.07; participants = 18,191; studies = 8; I2 = 72%; moderate‐quality evidence; Analysis 7.5). The risk of serious adverse effects was similar in those vaccinated and those who received placebo or control vaccine (RR 0.98, 95% CI 0.92 to 1.05; participants = 71,597; studies = 23; I2 = 6%)) high‐quality evidence). There was little or no difference between the different vaccines (P = 0.19; I2 = 39.7%, Analysis 7.6). Restriction to data extracted only from publications in peer‐reviewed journals yielded very similar results: RR 1.01, 95% CI 0.95 to 1.06; 71,452 participants; studies = 22, I2 = 0%, Figure 10), with very minor differences between the vaccine types (P = 0.83, I2 = 0%).
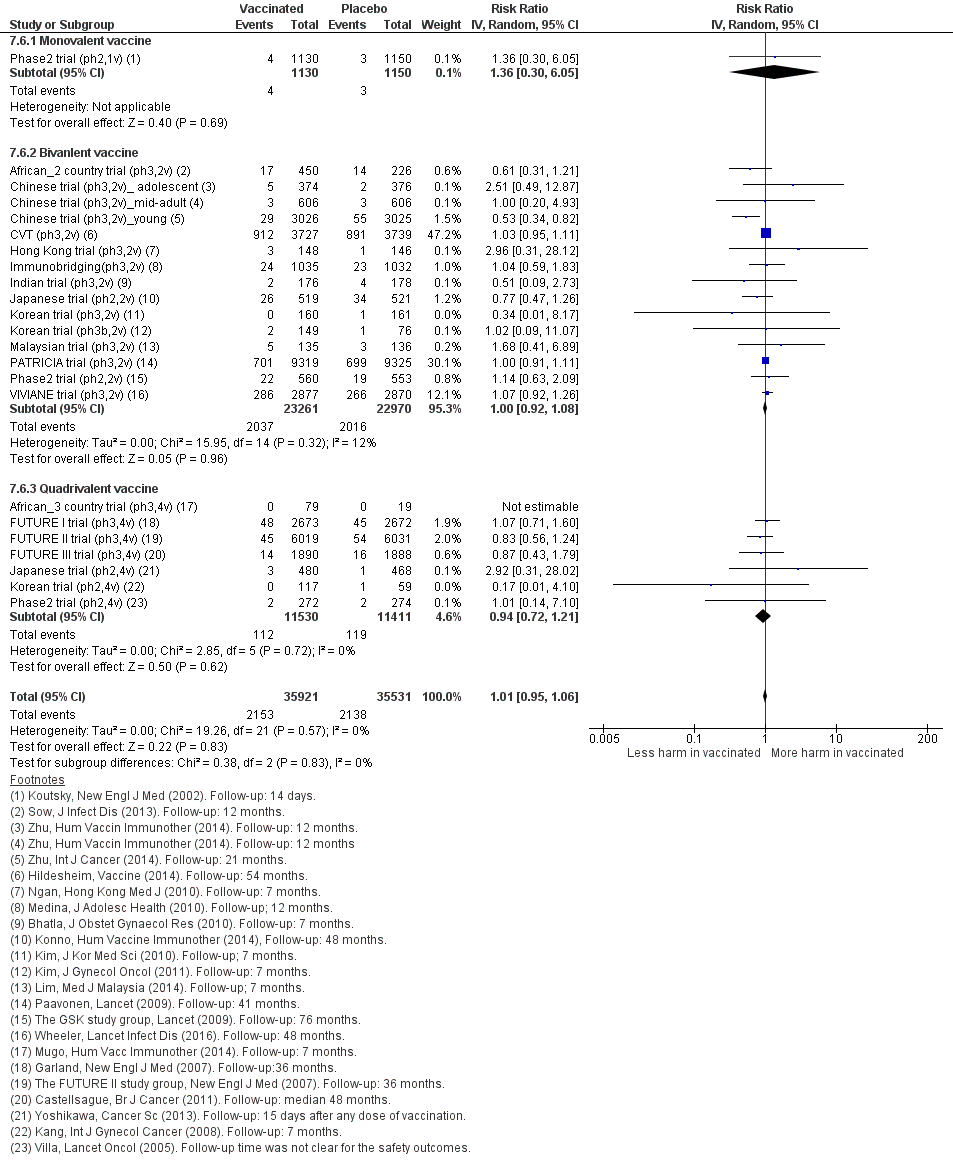
Sensitivity analysis of Analysis 7.6 on severe adverse effects restricting to data extracted from publications in peer‐reviewed journals.
Mortality during the study follow‐up period in HPV vaccine recipients and control or placebo groups was reported in 23 trials (Analysis 7.7). We could not exclude an increased risk of mortality among vaccinated women (RR 1.29, 95% CI 0.85 to 1.98; participants = 71,176; studies = 23; I2 = 0%). In absolute terms the rate of deaths in the control groups was 11 per 10,000 whereas in HPV vaccinated women the rate observed was between 9 and 22 women per 10,000. The difference between the bi‐ and quadrivalent vaccine was not significant (P = 0.62, I2 = 0%). Again, results were very similar when data extraction was restricted to peer‐reviewed published reports (RR 1.31, 95% CI 0.84 to 2.05; participants = 71,452; studies = 23; I2 = 0%, Figure 11). We downgraded the quality of evidence for mortality to low. This was due to imprecision from the wide confidence interval and inconsistency due to a statistically different risk between the two age cohorts, with a higher risk of mortality in older women (summary of findings Table 4).

Sensitivity analysis of Analysis 7.7 on deaths restricting to data extracted from publications in peer‐reviewed journals.
The higher number of deaths from both vaccination arms in the trials enrolling women older than 25 years may be expected due to the longer periods of follow‐up. In the FUTURE III trial (ph3,4v), eight deaths were observed within a period of 10 years of follow‐up among women who received the quadrivalent vaccine versus four among women who received the placebo (RR 2.00, 95% CI 0.60 to 6.62, pexact= 0.25) (https://clinicaltrials.gov/ct2/show/results/NCT00090220?sect=X30156#evnt). In the VIVIANE trial (ph3,2v), 13 women died among women who received the bivalent vaccine compared with five among women in the placebo arm within six years of follow‐up (RR 2.59, 95% CI 0.93 to 7.27, pexact = 0.09) (Wheeler 2016). In the smaller Chinese trial, where 606 mid‐adult women were vaccinated with the bivalent vaccine, during 12 months of follow‐up, one women died in the vaccine group whereas no deaths occurred in the control arm (Chinese trial (ph3,2v)_mid‐adult; Zhu 2014a). When all the deaths among mid‐adult women enrolled in the three trials are pooled, a higher case fatality rate was observed among those who received HPV vaccine compared to those who received placebo: (RR 2.36, 95% CI 1.10 to 5.03; participants = 10,737; studies = 3; I2 = 0%), with no differences between different HPV vaccines (P = 0.73).
An overview of the causes of deaths observed after administration of HPV vaccine or control in the FUTURE III trial (ph3,4v) and VIVIANE trial (ph3,2v) is shown in Table 5 and Table 6, respectively. In the smaller Chinese trial, one woman who was vaccinated died from intracranial haemorrhage (Zhu 2014a; https://www.gsk‐clinicalstudyregister.com/files2/ d6eb0c75‐b164‐41e6‐8295‐f2718bce6adc). The higher number of deaths in the vaccine arms among mid‐adult women may be a chance occurrence, since there was no pattern either in the causes of death, or in the timing of the occurrence of death (period between vaccine administration and date of death). In the study reports, none of the deaths were deemed to be related to vaccination (Castellsagué 2011; Skinner 2014; Wheeler 2016; https://www.gsk‐clinicalstudyregister.com/files2/ d6eb0c75‐b164‐41e6‐8295‐f2718bce6adc).
| ID | Group | Death causes |
| 1 | C | Pulmonary thromboembolism with background of acute lymphoblastic leukaemia |
| 2 | V | Breast cancer |
| 3 | V | Pulmonary tuberculosis |
| 4 | V | Thyrotoxicosis |
| 5 | V | Cerebral haemorrhage subsequent to hypertension |
| 6 | V | Pericarditis on a background of lupus erythematosus |
| 7 | V | Nasopharyngeal cancer with metastases to brain |
| 8 | V | Pulmonary embolism after intervention for uterine myoma |
| RR of deaths in vaccine vs placebo arm (7 over 1,890 vs 1 over 1888): RR = 6.99 (95% CI 0.86 to 56.78), 2‐sided pexact=0.070. The age at death varied between 29 and 45 years, seven of the deaths occurred in the Philippines and one in Columbia. All participants received three doses of HPV vaccine or placebo except one who received only two doses of vaccine. The time interval between last dose and date at death ranged between 6 and 37 months. | ||
Group:V = vaccinated against HPV, C = control group.
Source: end‐of‐study analysis after a median follow‐up of four years (Castellsagué 2011) and personal communication with Alfred Saah (MSD, 6/05/2016).
| Patient | Cause of death | Group | Age | Country | Source |
| 1 | Breast cancer metastatic | V | 47 | Canada | 1 |
| 2 | Suicide | V | 47 | Mexico | 1 |
| 3 | Lower respiratory tract infection and sepsis* | C | 55 | Mexico | 1 |
| 4 | Cervix cancer metastatic** | V | 45 | Mexico | 1 |
| 5 | Interstitial lung disease | V | 41 | Mexico | 1 |
| 6 | Breast cancer | *** | 32 | Mexico | 1*** |
| 7 | Suicide | V | 41 | Mexico | 1 |
| 8 | Cardiac valve disease and liver disorder* | C | 38 | Mexico | 1 |
| 9 | Drug hypersensitivity and acute renal failure* | V | 46 | Peru | 1 |
| 10 | Cardiorespiratory arrest | C | 44 | Phillipines | 1 |
| 11 | Acute myocardial infarction | V | 31 | Phillipines | 1 |
| 12 | Multiple myeloma and pulmonary embolism* | V | 50 | Phillipines | 1 |
| 13 | Homicide | V | 32 | Phillipines | 1 |
| 14 | Bronchopneumonia | V | 40 | Singapore | 1 |
| 15 | Lung neoplasm malignant | V | 41 | Thailand | 1 |
| 16 | Suicide | V | 28 | USA | 1 |
| 17 | Glioblastoma multiforme | V | 45 | USA | 1 |
| 18 | Anaplastic astrocytoma | C | 43 | **** | 2 |
| 19 | Nasopharyngeal cancer | C | 41 | **** | 2 |
| Remarks | |||||
| * | Multiple death causes | ||||
| ** | This woman had normal cytology but was HPV‐18 DNA‐positive at study entry (May 2006). At the next scheduled cytology testing at Month 12 (April 2007), the cytology finding was atypical squamous cells cannot exclude high‐grade squamous intraepithelial lesion. She was diagnosed with metastatic cervical cancer in May 2007 (approximately 7 months after receiving the third dose of vaccine or control) and died in July 2008 | ||||
| *** | One case of death due to breast cancer reported in the 48 month report (Skinner 2014) had to be excluded from the analysis (Wheeler 2016). | ||||
| **** | Two additional cases of death occurring in the control arm were reported in the 84‐month report (Wheeler 2016). The country for these two cases was not reported. | ||||
Source: 1) interim analysis after 48 months of follow‐up (Skinner 2014); 2) report at 84 months of follow‐up (Wheeler 2016)
The 84‐month follow‐up report revealed 13 deaths in the HPV arm (N = 2877) versus 5 (N = 2870), with death causes allocated to the trial arms (vaccine versus placebo arm) the RR was 2.59 (95% CI 0.93 to 7.27), 2‐sided pexact=0.0957. No pattern was noticed which could indicate a causal role attributed to HPV vaccination.
9. Pregnancy outcomes
Pregnancy outcomes were reported in a bivalent vaccine trial (VIVIANE trial (ph3,2v)) and also through two pooled analyses of trials evaluating the bivalent (PATRICIA & CVT (ph3,2v)) and quadrivalent vaccine (Pooled v4 trials), respectively (see Table 4).
Similar rates of normal term deliveries of a healthy infant were noted (RR 1.00, 95% CI 0.97 to 1.02; participants = 8782; studies = 8; I2 = 0%; Analysis 8.1). The risk of miscarriage also was similar between HPV vaccinees and control vaccinees (RR 0.88, 95% CI 0.68 to 1.14; participants = 8,618; studies = 9; I2 = 78%; Analysis 8.2), as was elective termination of pregnancy (RR 0.90, 95% CI 0.80 to 1.02; participants = 10,909; studies = 9; I2 = 0%; Analysis 8.3). Analyses of still births and abnormal infants lack sufficient power to rule out small increases or decreases in risk. The observed risk of stillbirth of 70 per 10,000 translates to a rate of 78 per 10,000 (48 to 128) based on the RR of 1.12 (95% CI 0.68 to 1.83; Analysis 8.4). The observed risk of an abnormal infant in the control groups was 205 per 10,000 and in the vaccination arms was 250 per 10,000 (180 to 346) based on the RR of 1.22 (0.88 to 1.69) (Analysis 8.5). We downgraded the quality of evidence for both of these outcomes to moderate due to imprecision. See further in summary of findings Table 4.
10. Role of covariates
10.1. Age
Most randomised trials assessing vaccine efficacy enrolled younger women, in the age range 15 to 26 years (Table 7). Only three randomised controlled trials (RCTs) evaluated the efficacy of the vaccines (FUTURE III trial (ph3,4v), VIVIANE trial (ph3,2v); Chinese trial (ph3,2v)_mid‐adult) in mid‐adult women (aged 24 to 45 years). A small overlap was noted (24 to 26 years) between the young and the mid‐adult groups.
| Trial | Target age group | Age category | Reported age sub‐groups |
| 16‐23 | younger | none | |
| 15‐25 | younger | none | |
| 16‐23 | younger | none | |
| 20‐25 | younger | none | |
| 15‐25 | younger | 15‐17, 18‐20, 21‐25 | |
| 18‐25 | younger | 18‐19, 20‐21, 22‐23, 24‐25 | |
| 26+ | older | 26‐35, 36‐45, 46+ | |
| 16‐24 | younger | none | |
| 15‐26 | younger | none | |
| 25‐45 | older | none |
No difference in protection (difference in RR <= 0.15 and P value for age effect non significant) was found between younger and mid‐adult women with respect to:
-
CIN2+ associated with HPV16/18 in women who were HPV16/18 negative at baseline and who received three doses (Analysis 2.1);
-
CIN2+ associated with HPV6/11/16/18 in women who were HPV16/18 negative at baseline and who received three doses (Analysis 2.4;.
-
six‐month persistent HPV16/18 infection in women who were HPV16/18 negative at baseline and who receivedthree3 doses (Analysis 5.4) or at least one dose (Analysis 5.5).
Lower protection was found in mid‐adult women compared to younger women with respect to:
-
CIN2+ associated with HPV16/18 in women who were HPV16/18 negative at baseline and who received one or two doses (Analysis 2.3) or at least one dose (Analysis 2.2);
-
CIN2+ associated with HPV6/11/16/18 in women who were HPV16/18 negative at baseline and who received at least one dose (Analysis 2.5);
-
CIN2+ associated with HPV16/18 in all women, regardless of their baseline hrHPV DNA status, who received at least one dose (Analysis 3.1);
-
six‐month persistent HPV16/18 infection in all women, regardless of their baseline hrHPV DNA status, who received at least one dose (Analysis 6.2).
Lower protection (difference in RR > 0.15) was found in mid‐adult women compared to younger women (RR, but the difference was not significant for the following outcomes:
-
CIN2+ associated with HPV6/11/16/18 in women who were HPV16/18 negative at baseline who received one or two doses (Analysis 2.6);
-
CIN2+ associated with HPV6/11/16/18 in all women, regardless of their baseline hrHPV DNA status, who received at least one dose (Analysis 3.2);
-
Any CIN2+ irrespective of hrHPV types in all women, regardless of their baseline hrHPV DNA status, who received at least one dose (Analysis 3.7);
-
six‐month persistent HPV16/18 infection in women who were HPV16/18 negative at baseline and who received one or two doses (Analysis 5.6).
For the bivalent vaccine, three trials (CVT (ph3,2v); PATRICIA trial (ph3,2v); VIVIANE trial (ph3,2v)) reported the efficacy within smaller age subgroups (Table 7). Since the age groups were not uniformly defined, age effects were assessed by Poisson regression for each trial separately. The P value corresponding with the hypothesis of decreasing efficacy with increasing age is shown in the last column in Table 8 (PATRICIA trial (ph3,2v)), Table 9 (CVT (ph3,2v) and Table 10 (VIVIANE trial (ph3,2v)). This P value corresponds with checking the significance of the incorporation of the interaction term "vaccine*age" in the Poisson regression, treating age as a continuous variable. The protection against CIN2+ and CIN3+, associated with HPV16/18 or irrespective of hrHPV type, as well as the protection against six‐month persistent HPV16/18 infection, decreased significantly by age in the intention‐to‐treat groups where women were enrolled regardless of baseline HPV DNA status. Within the per‐protocol groups, enrolling women who were HPV16/18 DNA negative at baseline, no significant linear age effects were observed. Only for the outcome of persistent six‐month HPV16/18 infection a slight decrease in protection was observed in the PATRICIA trial (PATRICIA trial (ph3,2v), P value = 0.042), but not in the Costa Rica trial (CVT (ph3,2v), P value = 0.145), and not in the VIVIANE trial (VIVIANE trial (ph3,2v), P value = 0.532).
| Outcome | Age | Event/N Vaccine | Event/N Placebo | Relative risk (95% CI) | Vaccine efficacy % (95% CI) | P value for linear effect of age |
| In women with hrHPV DNA negative status at baseline | ||||||
| CIN2+ associated with HPV16/18 | 15‐17 | 1/1997 | 53/2022 | 0.02 (0.00 to 0.14) | 98% (86 to 100%) | 0.995 |
| 18‐20 | 0/1096 | 27/1144 | 0.02 (0.00 to 0.32) | 98% (68 to 100%) | ||
| 21‐25 | 0/2363 | 17/2281 | 0.03 (0.00 to 0.47) | 97% (53 to 100%) | ||
| CIN2+ irrespective of HPV types | 15‐17 | 34/1997 | 101/2022 | 0.34 (0.23 to 0.50) | 66% (50 to 77%) | 0.355 |
| 18‐20 | 10/1096 | 38/1144 | 0.27 (0.14 to 0.55) | 73% (45 to 86%) | ||
| 21‐25 | 17/2363 | 33/2281 | 0.50 (0.28 to 0.89) | 50% (11 to 72%) | ||
| CIN3+ associated with HPV16/18 | 15‐17 | 0/1997 | 14/2022 | 0.04 (0.00 to 0.61) | 96% (39 to100%) | 1.000 |
| 18‐20 | 0/1096 | 8/1144 | 0.07 (0.00 to 1.13) | 93% (‐13 to 100%) | ||
| 21‐25 | 0/2363 | 5/2281 | 0.10 (0.00 to 1.74) | 90%(‐74 to 100%) | ||
| CIN3+ irrespective of HPV types | 15‐17 | 2/1997 | 24/2022 | 0.08 (0.02 to 0.36) | 92% (64 to 98%) | 0.488 |
| 18‐20 | 1/1096 | 11/1144 | 0.09 (0.01 to 0.73) | 91% (27 to 99%) | ||
| 21‐25 | 0/2363 | 9/2281 | 0.05 (0.00 to 0.92) | 95% (8 to 100%) | ||
| Persistent HPV16/18 infection (6M) | 15‐17 | 14/1989 | 303/2020 | 0.05 (0.03 to 0.08) | 95% (92 to 97%) | 0..042 |
| 18‐20 | 9/1090 | 110/1125 | 0.08 (0.04 to 0.17) | 92%(83 to 96%) | ||
| 21‐25 | 12/2338 | 108/2249 | 0.11 (0.06 to 0.19) | 89% (81 to 94%) | ||
| Regardless of women’s baseline HPV DNA status | ||||||
| CIN2+ associated with HPV16/18 | 15‐17 | 21/2882 | 100/2892 | 0.21 (0.13 to 0.24) | 79% (66 to 87%) | 0.000 |
| 18‐20 | 23/1871 | 66/1908 | 0.36 (0.22 to 0.57) | 64% (43 to 78%) | ||
| 21‐25 | 46/3929 | 62/3898 | 0.74 (0.50 to 1.08) | 26% (‐8 to 50%) | ||
| CIN2+ irrespective of HPV types | 15‐17 | 112/2882 | 200/2892 | 0.56 (0.45 to 0.70) | 44% (30 to 55%) | 0.006 |
| 18‐20 | 62/1871 | 105/1908 | 0.60 (0.44 to 0.82) | 40% (18 to 56%) | ||
| 21‐25 | 113/3929 | 123/3898 | 0.91 (0.09 to 1.17) | 9% (‐17 to 29%) | ||
| CIN3+ associated with HPV16/18 | 15‐17 | 7/2882 | 36/2892 | 0.20 (0.09 to 0.44) | 80% (56 to 91%) | 0.000 |
| 18‐20 | 13/1871 | 30/1908 | 0.44 (0.23 to 0.84) | 56% (16 to 77%) | ||
| 21‐25 | 31/3929 | 28/3898 | 1.10 (0.66 to 1.83) | ‐10% (‐83 to 34%) | ||
| CIN3+ irrespective of HPV types | 15‐17 | 21/2882 | 61/2892 | 0.35 (0.21 to 0.57) | 65% (43 to 79%) | 0.008 |
| 18‐20 | 22/1871 | 44/1908 | 0.51 (0.31 to 0.85) | 49% (15 to 69%) | ||
| 21‐25 | 43/3929 | 53/3898 | 0.80 (0.54 to 1.20) | 20% (‐20 to 46%) | ||
| Persistent HPV16/18 infection (6M) | 15‐17 | 167/2916 | 588/2920 | 0.28 (0.24 to 0.34) | 72% (66 to 76%) | 0.000 |
| 18‐20 | 143/1925 | 283/1961 | 0.51 (0.43 to 0.62) | 49% (38 to 57%) | ||
| 21‐25 | 194/4009 | 356/3979 | 0.54 (0.46 to 0.64) | 46% (36 to 54% ) | ||
Source: Lehtinen 2012.
CIN: cervical intraepithelial neoplasia, CIN2+: CIN of degree II or worse, CIN3+: CIN of degree 3 or worse, HPV: human papillomavirus types..
| Outcome | Age | Vaccine | Placebo | Relative risk (95% CI) | Vaccine efficacy (95% CI) | P value for linear effect of age |
| In women with HPV16/18 DNA negative status at baseline cohort | ||||||
| Persistent HPV16/18 infection (6M) | 18‐19 | 1/825 | 51/870 | 0.02 (0.00 to 0.10) | 98% (90% to 100%) | 0.145 |
| 20‐21 | 3/659 | 36/649 | 0.08 (0.02 to 0.24) | 92% (76% to 98%) | ||
| 22‐23 | 2/588 | 36/625 | 0.06 (0.00 to 0.20) | 94% (80% to 100%) | ||
| 24‐25 | 3/563 | 20/533 | 0.14 (0.03 to 0.44) | 86% (56% to 97%) | ||
| Regardless if women’s baseline HPV DNA status | ||||||
| Persistent HPV16/18 infection (6M) | 18‐19 | 47/1193 | 165/1,244 | 0.30 (0.21 to 0.41) | 70% (59% to 79%) | 0.000 |
| 20‐21 | 64/946 | 134/905 | 0.46 (0.34 to 0.61) | 54% (39% to 66%) | ||
| 22‐23 | 59/818 | 112/848 | 0.55 (0.40 to 0.75) | 45% (25% to 60%) | ||
| 24‐25 | 61/770 | 75/742 | 0.78 (0.56 to 1.99) | 22 %(‐9.9 to 44%) | ||
Source: Herrero 2011.
| Outcome | Age | Event/NVaccine | Event/NPlacebo | Relative risk (95% CI) | Vaccine efficacy (95% CI) | P value for linear effect of age |
| In women with HPV16/18 DNA negative status at baseline cohort | ||||||
| Persistent HPV16/18 infection (6M) | 26‐35 | 3/834 | 22/800 | 0.13 (0.04 to 0.44) | 87% (56% to 96%) | 0.532 |
| 36‐45 | 3/816 | 12/809 | 0.25 (0.07 to 0.88) | 75%(12% to 93%) | ||
| 46+ | 0/219 | 0/213 | N.A. | N.A. | ||
| Regardless if women’s baseline HPV DNA status | ||||||
| Persistent HPV16/18 infection (6M) | 26‐35 | 48/1221 | 78/1242 | 0.63 (0.44 to 0.89) | 37% (11% to 56%) | 0.177 |
| 36‐45 | 19/1244 | 43/1228 | 0.44 (0.26 to 0.74) | 56% (26% to 74%) | ||
| 46+ | 4/300 | 11/306 | 0.37 (0.12 to 1.15) | 63% (‐15% to 88%) | ||
Source: Skinner 2014.
10.2. Serological status
As described above, vaccine efficacy depends upon whether an hrHPV infection is present prior to vaccination, but could also potentially be influenced by prior hrHPV infection that cleared (as defined by being no longer detectable using a hrHPV DNA test), but with a positive hrHPV serology status. In Table 11, we pooled the relative risk of, and the vaccine efficacy against, CIN2+ associated with HPV16/18 stratified by initial hrHPV serology and DNA status from two phase III trials (FUTURE II trial (ph3,4v) and PATRICIA trial (ph3,2v)). In HPV16/18 DNA negative women, protection was strong, but varied by serology status: RR = 0.03 (95% CI 0.02 to 0.09) and 0.19 (95% CI 0.09 to 0.77) for HPV16/18 in seronegative and seropositive women, respectively. No significant protection was observed in the HPV16/18 DNA‐positive group, with RR being 0.79 (95% CI 0.60 to 1.05) and 1.10 (95% CI 0.88 to 1.36) for HPV16/18 seronegative and seropositive women, respectively.
| Initial HPV DNA/ status | Serology status | Vaccine | Placebo | Relative Risk (95% CI) | Relative Risk ratio |
| DNA(‐) | Sero‐ | 0/2,241 | 32/2258 | 0.00 (0.02 to 0.26) | 15.93 |
| Sero+ | 0/377 | 2/379 | 0.25 (0.01 to 5.20) | ||
| DNA(+) | Sero‐ | 27/232 | 31/213 | 0.80 (0.49 to 1.29) | 1.50 |
| Sero+ | 41/156 | 30/137 | 1.20 (0.80 to 1.81) | ||
| DNA(‐) | Sero‐ | 0/5,305 | 28/5260 | 0.02(0.00 to 0.14) | 7.41 |
| Sero+ | 0/498 | 4/524 | 0.13 (0.01 to 2.43) | ||
| DNA(+) | Sero‐ | 33/423 | 35/402 | 0.90 (0.57 to 1.41) | 1.12 |
| Sero+ | 47/298 | 52/332 | 1.01 (0.70 to 1.45 | ||
| DNA(‐) | Sero‐ | 5/8709 | 92/8112 | 0.05 (0.02 to 0.12) | 6.16 |
| Sero+ | 3/1710 | 10/1777 | 0.31 (0.09 to 1.13) | ||
| DNA(+) | Sero‐ | 20/309 | 29/293 | 0.65 (0.38 to 1.13) | 1.70 |
| Sero+ | 53/333 | 44/307 | 1.11 (0.77 to 1.61) | ||
| Pooled results for CIN2+ associated with HPV16/18 | |||||
| DNA(‐) | Sero‐ | 5/14,014 | 120/13,372 | 0.03 (0.02 to 0.09) | 5.85 (0.53 to 65.10) |
| Sero+ | 3/2205 | 14/2301 | 0.19 (0.09 t0 o.77) | ||
| DNA(+) | Sero‐ | 53/679 | 64/695 | 0.79 (0.60 to 1.05 | 1.37 (0.97 to 1.93) |
| Sero+ | 100/531 | 96/639 | 1.10 (0.88 to 1.36) | ||
*RR against HPV 6/11/16/18 related cervical lesions
** RR against HPV16/18 related CIN2+
*** Pooled only for FUTURE II and PATRIACIA, since, in the FUTURE I trial, the endpoints were cervical lesions and not CIN2+ associated with HPV16/18
The effect of the serology status was computed by meta‐regression as a relative risk ratio (RRR). This relative risk corresponds with RRsero+ / RRsero‐where RR is as usual the risk of lesions in vaccinated versus unvaccinated women. The RRRs were 5.85 (95% CI 0.53 to 65.10) for seropositive compared to seronegative women if HPV16/18 DNA‐negative and 1.37 (95% CI 0.97 to1.84) for seropositive compared to seronegative women if HPV16/18 DNA‐positive. Both RRRs were not statistically significantly different from unity. The RRRs were higher than unity, reflecting a tendency of higher risk of lesions or a lower vaccine efficacy in seropositive women. The effect of sero‐positivity was more pronounced in HPV DNA‐negative women, but even in this group, it was again not statistically significant. Whether the seropositivity effect is due to lower vaccine protection or presence of HPV virus prior to vaccination below the detection limit of the used HPV DNA test cannot be derived from the data.
10.3. Study quality and involvement of vaccine manufacturers
The impact of six study quality items (V1‐V6) (see Assessment of risk of bias in included studies; Characteristics of included studies) on the protection against six‐ and 12‐month persistent HPV16/18 infection was assessed by meta‐regression. No significant effects were observed: P values were all > 0.05 (see Table 12).
| Outcome | P value | ||||||
| V1 | V2 | V3 | V4 | V5 | V6 | V7 | |
| Persistent HPV16/18 infection (6M), in women being baseline HPV16/18 negative 3 doses | 0.70 | 0.60 | np | np | 0.90 | np | 0.42 |
| Persistent HPV16/18 infection (6M), in women being baseline HPV16/18 negative at least 1 dose | 0.56 | 0.56 | np | np | np | np | np |
| Persistent HPV16/18 infection (12M), in women being baseline HPV16/18 negative 3 doses | 0.94 | 0.94 | np | np | np | np | 0.73 |
| Persistent HPV16/18 infection (12M), in women being baseline HPV16/18 negative at least 1 dose | 0.67 | 0.67 | np | np | np | np | np |
Influence of study quality (items V1‐V6) and independence of the research team towards the vaccine manufacturer (V7) on protection against persistent HPV16/18 infection assessed by meta‐regression.
The P values correspond with the statistical significance of the incorporation of each item in the meta‐regression.
V1: Random sequence generation; V2: Allocation concealment; V3: Blinding participants and personnel; V4: Blinding of outcome; V5: Incomplete outcomes; V6: Selective reporting; V7: Involvement of manufacturer,
np: meta‐regression not possible because of collinearity.
The impact of the involvement of the vaccine manufacture in the trials was also assessed by meta‐regression. No significant effects were observed.
10.4. Number of administered doses
In a post hoc pooled analysis of the Costa‐Rica Vaccination Trial (CVT (ph3,2v)), it was demonstrated that efficacy against 12‐month incident persistent infection was no different (P value = 0.60, I2 = 0%) in women who had received one, (RR = 0.05, 95% CI 0.00 to 0.77), two (RR = 0.16, 95% CI 0.05 to 0.52), or three doses (RR = 0.19, 95% CI 0.12 to 0.29) of the bivalent vaccine (Analysis 6.5). More outcomes were assessed in a pooled analysis of the Costa Rica and PATRICIA trials (Kreimer 2015). Protection induced by the bivalent vaccine against incident and six‐ and 12‐month persistent HPV16/18 infection in 15 to 26 years old women, initially HPV16/18 or hrHPV negative, did not differ by number of received doses (Table 13). It is planned to continue the follow‐up in the Costa‐Rica Vaccination Trial (CVT (ph3,2v)) for 10 years, to verify the durability of protection afforded by fewer than three doses of the bivalent vaccine (Kreimer 2015b). Results up to 6.9 years show that the cumulative incidence of HPV16/18 infections among women who received one dose, or two doses (received at months zero and six, or at months zero and one) are similarly low compared to those who received the three doses (see Table 14; Safaeian 2018).
| Outcome | No. of doses | Vaccine arm | Placebo arm | Relative Risk (95%CI) | P value for linear dose‐effect relation |
| 12‐month persistent HPV16/18 infection in women being HPV16/18 negative at baseline | 3 | 84/11,104 | 627/11,203 | 0.135 (0.108 to 0.169) | 0.303 |
| 2 | 3/611 | 26/574 | 0.108 (0.033 to 0.356) | ||
| 1 | 1/292 | 17/249 | 0.050 (0.007 to 0.374) | ||
| 6‐month persistent HPV16/18 infection in women being HPV16/18 negative at baseline | 3 | 114/11,104 | 1000/11,209 | 0.115 (0.095 to 0.139) | 0.269 |
| 2 | 4/611 | 35/574 | 0.107 (0.038 to 0.300) | ||
| 1 | 1/292 | 24/250 | 0.036 (0.005 to 0.261) | ||
| Incident HPV16/18 infection in women being HPV16/18 negative at baseline | 3 | 529/11,110 | 2172/11,217 | 0.246 (0.224 to 0.269) | 0.337 |
| 2 | 22/611 | 82/574 | 0.252 (0.160 to 0.398) | ||
| 1 | 8/292 | 45/251 | 0.153 (0.073 to 0.318) | ||
| 12‐month persistent HPV16/18 infection in women being hrHPV negative at baseline | 3 | 27/6634 | 351/6656 | 0.077 (0.052 to 0.114) | 0.996 |
| 2 | 2/273 | 12/276 | 0.168 (0.038 to 0.746) | ||
| 1 | 0/138 | 5/99 | 0.071 (0.004 to 1.289) | ||
| 6‐month persistent HPV16/18 infection in women being hrHPV negative at baseline | 3 | 38/6634 | 567/6660 | 0.067 (0.049 to 0.093) | 0.809 |
| 2 | 2/273 | 16/276 | 0.126 (0.029 to 0.544) | ||
| 1 | 0/138 | 8/100 | 0.045 (0.003 to 0.774) | ||
| Incident HPV16/18 infection in women being hrHPV negative at baseline | 3 | 38/6634 | 567/6660 | 0.067 (0.049 to 0.093) | 0.809 |
| 2 | 2/273 | 16/276 | 0.126 (0.029 to 0.544) | ||
| 1 | 0/138 | 8/100 | 0.045 (0.003 to 0.774) |
Source: PATRICIA & CVT (ph3,2v) (Kreimer 2015).
| Outcome | No. of doses | n events | N vaccinated | % (95%CI) | P* for difference with 3 doses |
| Cumulative incidence HPV16/18 infections | 3 | 88 | 2023 | 4.3 (3.5 to 5.3) | ‐ |
| 2 (at months 0 & 6) | 3 | 78 | 3.8 (1.0 to 10.1) | 1.00 | |
| 2 (at months 0 & 1) | 7 | 192 | 3.6 (1.6 to 7.1) | 0.85 | |
| 1 | 2 | 133 | 1.5 (0.3 to 4.9) | 0.17 |
Source: Safaeian 2018.
* two‐sided exact test for difference between proportions.
For several trials, results were provided for the same outcome among women being initially HPV16/18 DNA negative and having received all three doses and at least one dose. This allowed us to compute, in a post‐hoc analysis, by simple subtraction the number of events and women at risk having received only one or two doses (Table 15).
| Outcomes | Age Group (years) | Studies | RR if 3 doses (95% CI) | RR if 1‐2 doses (95% CI) |
| CIN2+ due to HPV16/18 | 15‐26 | 5 (FUTURE II trial (ph3,4v); Japanese trial (ph2,2v); PATRICIA trial (ph3,2v); Phase2 trial (ph2,1v); Chinese trial (ph3,2v)_young) | 0.07 (0.03 to 0.14)* | 0.10 (0.04 to 0.26)* |
| 24‐45 | 0.14 (0.03 to 0.79)* | 0.98 (0.20 to 4.83) | ||
| CIN3+ due to HPV16/18 | 15‐26 | 0.20 (0.04 to 0.91)* | 0.04 (0.01 to 0.74)* | |
| Incident HPV16/18 infection | 15‐26 | 3 (Japanese trial (ph2,2v); Phase2 trial (ph2,1v);Chinese trial (ph3,2v)_young) | 0.20 (0.10 to 0.41)* | 0.47 (0.26 to 0.84)* |
| 6‐month persistent HPV16/18 infection | 15‐26 | 0.05 (0.01 to 0.27)* | 0.12 (0.03 to 0.42)* | |
| 24‐45 | 0.15 (0.09 to 0.27)* | 0.34 (0.19 to 0.61)* | ||
| 12‐month persistent HPV16/18 infection | 15‐26 | 3 (Japanese trial (ph2,2v);CVT (ph3,2v); Chinese trial (ph3,2v)_young) | 0.09 (0.05 to 0.19)* | 0.13 (0.06 to 0.33)* |
*Vaccine efficacy in women being HPV16/18 DNA negative at enrolment and having received all three or less than three doses (computed from trials where per‐protocol [all doses administered] and intention‐to‐treat analyses [at least one dose administered] are reported).
Significant protection was observed for women having received only one or two doses for the following outcomes:
-
CIN2+ associated with HPV16/18 in women aged 16 to 25 years (observation for mono‐,bi‐ and quadrivalent vaccines, Analysis 2.3);
-
CIN3+ associated with HPV16/18 in women aged 16 to 25 years (observation for the bivalent and the quadrivalent vaccine, Analysis 2.9);
-
Incident HPV16/18 infection in women aged 15 to 26 years (observation only for the mono, and the bivalent vaccine, Analysis 5.3);
-
six‐month persistent 16/18 infection in women aged 15 to 26 and 25 to 45 years (observation for the bivalent and quadrivalent vaccine, respectively, Analysis 5.6).
No protection against CIN2+ associated with HPV16/18 was observed in women aged 24 to 45 who received only one or two doses. (Analysis 2.3).
Protection against CIN2+ associated with HPV16/18 in women aged 15 to 26 years and were baseline HPV DNA 16/18 negative, no subgroup difference was observed for women having received three doses or only one or two doses (Figure 12).

Protection against CIN2+ associated with HPV16/18 in women, aged 15‐26 years, who were HPV DNA 16/18 negative at baseline, by number of doses.
10.5. Duration of follow‐up
The assessment of possible changes in vaccine efficacy over time was impeded due to uneven spacing of periodic reports. Efficacy was reported at several time points in two trials (FUTURE II trial (ph3,4v); PATRICIA trial (ph3,2v)), varying between 15 and 44 months on average. Protection against CIN2+ associated with HPV16/18 infection did not drop by longer follow‐up time, either in women who were HPV16/18 DNA negative, or for those enrolled regardless of their HPV DNA status (Table 16).
| Outcomes | Study | Report (duration of follow‐up) | Vaccine | Placebo | Relative Risk (95%CI) | P value for linear difference of follow‐up time effect |
| CIN2+ associated with HPV16/18 in women being HPV negative at baseline | PATRICIA | Paavonen 2007 14.8 moths | 2/7788 | 21/7838 | 0.096 (0.007 to 0.466) | 0.512 |
| Paavonen 2009 34.9 months | 5/8040 | 91/8080 | 0.054 (0.016 to 0.137) | |||
| Szarewski 2011 39.4 months | 5/8079 | 92/8112 | 0.054 (0.016 to 0.137) | |||
| Lehtinen 2011 43.7 months | 5/7338 | 97/7305 | 0.051 (0.016 to 0.123) | |||
| FUTURE | The FUTURE II study group 2007 36 months | 3/5865 | 87/5836 | 0.039 (0.011 to 0.109) | 0.994 | |
| Munoz 2010* 43 months | 0/4616 | 89/4680 | 0.006 (0.000 to 0.092) | |||
| CIN2+ irrespective of HPV types regardless of women’s initial HPV DNA status | PATRICIA | Paavonen 2009 34.9 months | 224/8667 | 322/8682 | 0.696 (0.579 to 0.8369) | 0.750 |
| Lehtinen 2011 43.7 months | 287/8694 | 428/8708 | 0.669 (0.574 to 0.778) | |||
| FUTURE | The FUTURE II study group 2007 36 months | 281/6087 | 361/6080 | 0.780 (0.668 to 0.905) | 0.665 | |
| Munoz 2010 43 months | 421/8562 | 520/8598 | 0.807 (0.690 to 0.943) |
Assessment of the influence of duration of follow‐up on study outcomes using meta‐regression. p‐values correspond with the statistical significance of incorporating average follow‐up time as a continuous variable.
10.6. Sexual history
The impact of sexual history on vaccine efficacy was assessed in only one trial (CVT (ph3,2v)) for the outcome protection against 12‐month persistent HPV16/18 infection. The number of sexual partners had no effect in the analysis limited to participants who were HPV16/18 DNA negative at enrolment (P value = 0.7448). However, in the group of women enrolled regardless of their baseline HPV DNA status, a very significant decrease in protection by increasing number of sexual partners was observed (P value < 0.00001) (see Table 17).
| Number of sex partners | Vaccine | Placebo | Relative Risk (95% CI) | P value of number of sexual partners effect |
| In women being HPV16/18 DNA negative at baseline cohort | ||||
| Virgin | 1/566 | 17/615 | 0.064 (0.003 to 0.352) | 0.7448 |
| 1 partner | 3/904 | 27/915 | 0.112 (0.007 to 0.335) | |
| 2 partners | 1/544 | 17/519 | 0.056 (0.003 to 0.309) | |
| 3+ partners | 3/621 | 28/628 | 0.108 (0.026 to 0.321) | |
| Regardless of women’s baseline HPV DNA status | ||||
| Virgin | 4/733 | 21/819 | 0.202 (0.059 to 0.551) | < 0.0001 |
| 1 partner | 40/1237 | 83/1256 | 0.489 (0.333 to 0.711) | |
| 2 partners | 38/777 | 81/753 | 0.455 (0.307 to 0.665) | |
| 3+ partners | 71/940 | 116/911 | 0.593 (0.440 to 0.796) | |
The influence of the number of lifetime sexual partners on vaccine efficacy was assessed by Poisson regression. The P value corresponds with the likelihood ratio test comparing a Poisson model with and without inclusion of the sexual history with 3 possible categories.
Source: CVT (ph3,2v) (Herrero 2011).
10.7. Study size
The vaccine efficacy did not vary between small or large trials (Table 18).
| Outcomes | Study | Number of participants | Study size | Vaccine | Placebo | Relative Risk (95%CI) | P value |
| CIN2+ associated with HPV16/18 in women being HPV16/18 negative at baseline | Phase2 trial (V1) | 2392 | S | 0/126 | 8/127 | 0.062* (0.004 to 1.071) | 0.598 |
| Phase2 trial (V2) | 1113 | S | 0/219 | 3/212 | 0.161* (0.008 to 3.091) | ||
| Japanese trial (ph2,2v) | 1040 | S | 0/422 | 2/427 | 0.252* (0.012 to 5.241) | ||
| PATRICIA trial (ph3,2v) | 18,644 | L | 5/8040 | 91/8080 | 0.055 (0.022 to 0.136) | ||
| FUTURE II trial (ph3, 4v) | 12,167 | L | 3/5865 | 87/5863 | 0.034 (0.011 to 0.109) | ||
| Chinese trial (ph3,2V) | 6051 | L | 0/2543 | 4/2554 | 0.125 (0.001 to 8.681) | ||
| CIN2+ irrespective of HPV types and regardless of women’s initial HPV DNA status | FUTURE I/II trial (ph3,4v) | 17,622 | L | 421/8562 | 520/8598 | 0.813 (0.718 to 0.921) | 0.703 |
| PATRICIA trial (ph3,2v) | 18,644 | L | 287/8694 | 428/8708 | 0.672 (0.582 to 0.778) | ||
| Phase2 trial (v1) | 2392 | S | 8/148 | 12/142 | 0.640 (0.269 to 1.568) |
Assesment of the influence of the study size on the protection against CIN2+ associated with HPV16/18 according to study size (S = small, < 3000 participants, L = large >= 3000 participants) in women aged 15‐26 years and received at least 1 dose.
* P values correspond with the statistical significance of a meta‐regression with vs without study size category.
Discussion
Summary of main results
1. Comments on main results
We included 26 randomised controlled trials (RCTs) involving 73,428 participants, ranging from 98 to 18,644 participants per trial. Studies involved monovalent (one trial), bivalent (18 trials), and quadrivalent vaccines (seven trials). Most trials recruited adolescent girls and women 15 to 26 years of age; three trials recruited women aged 24 to 45 years. We judged most included trials to be at a low risk of bias. All the trials, except one (CVT (ph3,2v), were funded by the vaccine manufacturers. However, vaccine efficacy and adverse effects were not different in trials funded by manufacturers and the one trial conducted with public resources.
Protection against persistent human papillomavirus (HPV)16/18 infection and associated cervical precancer
HPV vaccine efficacy was very high among young women (15 to 26 years) against six‐month and 12‐month persisting HPV16/18 infection (risk ratio (RR) ≤ 0.10) (high‐quality evidence). It is also high against cervical intraepithelial neoplasia grade 2 and above (CIN2+) and CIN grade 3 and above (CIN3+) (RR ≤ 0.10) and against adenocarcinoma in situ (AIS+) (RR ≤ 0.12) associated with these types when women were high‐risk human papillomavirus (hrHPV) negative or HPV16/18 negative at enrolment (high‐quality evidence for CIN2+ and CIN3+; moderate‐quality evidence for AIS+). Absolute reductions in risk further illustrate the relative effects. HPV vaccines reduce the risk of CIN2+ from 164 per 10,000 people to 2 per 10,000, and AIS from 9 per 10,000 to 0 per 10,000 in hrHPV negative women (summary of findings Table for the main comparison). While all trials were designed as randomised trials of 3‐dose schedules, we included also analyses of fewer than three doses. Protection against precancerous lesions and persistent infection was also strong (RR ≤ 0.15) when fewer than three doses were received. We were not able to determine possible bias in these analyses due to women who did not complete the three‐dose schedule having different risk factors to those who completed the vaccination schedule as per protocol. Among all vaccinated women regardless of their initial HPV DNA test results, protection against persistent HPV16/18 infection and associated precancerous lesions was weaker. The RR varied between 0.36 and 0.55, corresponding to differences in risk of 1.8% for CIN2+ and 0.09% for AIS associated with HPV16/18 (summary of findings Table 3). Follow‐up ranged between two and eight years, with most studies contributing data collected between three and five years post‐vaccination, limiting the potential to measure cervical cancer outcomes, which would require very long follow‐up periods.
Protection against persistent HPV16/18 infection and associated CIN2+ lesions (RR ≤ 0.15) was also observed in mid‐adult women (24 to 45 years) when they were HPV16/18 negative at baseline and received three doses of vaccine. Fewer than three doses offered some protection in HPV16/18 DNA negative mid‐adult women against persistent HPV16/18 infection (RR = 0.34), but not against CIN2+ associated with HPV16/18. When all vaccinated mid‐adult women were considered, regardless of their baseline HPV DNA status, vaccination offered some protection against six‐month persistent HPV16/18 infection (RR = 0.57), but not against CIN2+ associated with HPV16/18.
The quality of evidence was moderate to high and there was little evidence of heterogeneity by valency of the vaccine for most outcomes.
Protection against any cervical precancer, irrespective of HPV type
The efficacy of HPV vaccines was generally lower when any high‐grade squamous lesions, irrespective of HPV infection type, was considered compared to efficacy for HPV16/18‐associated lesions. The protection in hrHPV negative women following bivalent vaccination against development of CIN3+ (RR = 0.08; Analysis 1.8.1), was greater than that observed for the quadrivalent vaccine (RR = 0.54; Analysis 1.8.2). The three‐dose efficacy against CIN2+ (RR = 0.40; Analysis 2.13) was no different between the bi‐ and quadrivalent vaccines in women who were initially HPV16/18 negative. No significant difference in protection was observed when fewer than three doses were given (Analysis 2.14). The efficacy against CIN3+ of the bivalent vaccine (RR = 0.55; Analysis 3.8.1) was again greater than the quadrivalent vaccine among all enrolled women regardless of their initial HPV DNA status (RR = 0.81; Analysis 3.8.2). However, differences in the population HPV prevalence in the trial sites, or differences in study protocols and assays used, may explain the contrast in efficacy. The quality of evidence regarding protection against any precancer, irrespective of HPV type, among mid‐adult women is low (Table 2).
Vaccine safety
Short‐term local adverse events were more common in women who received the HPV vaccine compared to those in the control arms. The risk of mild or severe systemic adverse events were similar between intervention and control arms (high‐quality evidence for serious adverse events, see summary of findings Table 3). The deaths reported in the trials had an identified cause, and none were assessed to be due to vaccination. The risk in absolute terms was low in both trial arms. The rate of mortality was 11 per 10,000 in the control arms, and the confidence interval is wide enough to include a rate of between 9 and 22 per 10,000 following vaccination (moderate quality evidence). In trials enrolling mid‐adult women, a higher mortality rate in the HPV arms was observed. The deaths occurred months to years after vaccination. However, no pattern in the series of death causes was identified and study investigators did not establish a causal role of the HPV vaccines for any of the deaths.
We have insufficient evidence available from RCTs to know how vaccination affects women who become pregnant during the vaccination period. Pregnancy outcomes indicated similar risks of miscarriage and elective termination between vaccination and control (high‐quality evidence). Analysis of stillbirth and congenital abnormality outcomes do not yet have enough information to confidently exclude slightly higher or slightly lower risk with vaccination: stillbirths: 70 per 10,000 versus 78 (48 to 128) per 10,000 following HPV vaccination (moderate‐quality evidence); abnormal infants: 205 per 10,000 versus 250 (180 to 346) per 10,000 following HPV vaccination (see summary of findings Table 4).
2. Other important comments
2.1. Duration of protection
The longest duration of follow‐up for which vaccine efficacy data are reported was 102 months for the monovalent HPV16 vaccine (Rowhani‐Rahbar 2009), 113 months for the bivalent vaccine (Naud 2014), and 60 months for the quadrivalent vaccine (Villa 2006). For all the vaccines, continued protection was observed at the end of the follow‐up period (Table 19).
| Analysis | Endpoint | Initial HPV status | Doses | Relative Risk |
| Monovalent vaccine (Rowhani‐Rahbar, 2009): 102 months of follow‐up | ||||
| 3.1 | CIN2+ associated with HPV16 | HPV16‐ | 3 | 0.00 |
| 3.2 | CIN2+ associated with HPV16 | HPV16‐ | >= 1 | 0.00 |
| 3.3 | CIN2+ associated with HPV16 | HPV16‐ | 1‐2 | 0.00 |
| 4.1 | Incident HPV16 infection | HPV16‐ | 3 | 0.05 |
| 4.3 | Incident HPV16 infection | HPV16‐ | >= 1 | 0.11 |
| 4.3 | Incident HPV16 infection | HPV16‐ | 1‐2 | 0.25 |
| 5.1 | CIN2+ associated with HPV16 | regardless of HPV infection | >= 1 | 0.36 |
| 5.3 | CIN2+ irrespective of HPV types | regardless of HPV infection | >= 1 | 0.64 |
| Bivalent vaccine (De Calvaho, 2012): 88 months of follow‐up | ||||
| 2.2 | 6M persistent HPV16/18 infection | hrHPV‐ | 3 | 0.00 |
| 2.4 | 12M persistent HPV16/18 infection | hrHPV‐ | 3 | 0.00 |
| 3.2 | CIN2+ associated with HPV16/18 | HPV16/18‐ | >= 1 | 0.00 |
| Quadrivalent vaccine (Villa, 2006): 60 months of follow‐up | ||||
| 4.8 | Persistent HPV6/11/16/18 infection | HPV16/18‐ | >= 1 | 0.07 |
2.2. Differences in efficacy between the bivalent and quadrivalent vaccine
Based on subgroup analysis by vaccine brands, licensed bivalent and quadrivalent vaccines confer similar protection against HPV16/18 infection and cervical lesions associated with HPV16/18 . However, we did find some evidence that bivalent vaccine was more efficacious than the quadrivalent vaccine against any CIN2+ and CIN3+ (irrespective of HPV type) among women who were hrHPV DNA negative (Analysis 1.7; Analysis 1.8) and against any CIN3+ regardless of HPV DNA status at baseline (Analysis 3.8). This difference may be due to differences in the populations enrolled in the trials, differences in serological or DNA methods used, or better cross‐protection of the bivalent vaccine against other hrHPV types. Cross‐protective vaccine efficacy was assessed in a recent meta‐analysis including data from ; FUTURE I trial (ph3,4v); FUTURE II trial (ph3,4v); Malagon 2012; PATRICIA trial (ph3,2v); Phase2 trial (ph2,2v); Phase2 trial (ph2,4v) . Better protection was found against six‐month persistent infection with HPV31 and HPV45 and against CIN2+ related to HPV33 and HPV45 using the bivalent versus the quadrivalent vaccine among women who were hrHPV negative at enrolment (Malagon 2012). Also, CVT (ph3,2v) and VIVIANE trial (ph3,2v) provided significant cross‐protective efficacy of the bivalent vaccine with respect to CIN2+ associated with non‐vaccine hrHPV types (Hildesheim 2014) and persistent HPV31 and HPV45 infection (Skinner 2014), respectively (Table 20). Although there may be some evidence of waning cross‐protection (Malagon 2012), efficacy of the bivalent vaccine lasting for more than nine years against incident HPV31, HPV33 and HPV45 (RR between 0.29 and 0.65) has been reported (Starkie Camejo 2016; Taylor 2016).
| Trials | Ref | Endpoint | Relative Risk (95% CI) | P value for difference in VE | |
| Bivalent | Quadrivalent | ||||
| 6‐month persistent HPV31 infection | 0.229 (0.156 to 0.228) | 0.538 (0.336 to 0.847) | 0.003 | ||
| 6‐month persistent HPV45 infection | 0.210 (0.106 to 0.387) | 0.922 (0.507 to 1.670) | 0.0003 | ||
| CIN2+ associated with HPV33 | 0.177 (0.053 to 0.466) | 0.760 (0.328 to 1.712) | 0.02 | ||
| CIN2+ associated with HPV45 | 0.000 (0.000 to 0.583) | 0.481 (0.174 to 1.177) | 0.04 | ||
| CIN2+ associated with other hrHPV | 0.401 (0.192 to 0.793) | ||||
| 6‐month persistent HPV31 infection | 0.209 (0.041 to 0.724) | ||||
| 6‐month persistent HPV45 infection | 0.221 (0.044 to 0.914) | ||||
Kuhs 2014 explored whether different serological testing methods and HPV DNA criteria, used to define the sub‐cohort of HPV‐naïve women in the trials, could have influenced efficacy estimates. Applying the less restrictive criteria used in the FUTURE I/II trials (FUTURE II trial (ph3,4v); FUTURE I trial (ph3,4v)) instead of those applied in the PATRICIA trial (PATRICIA trial (ph3,2v)) on the CVT decreased the estimated efficacy against any CIN2+ (irrespective of HPV type) from 81% to 69%, suggesting this is part of the explanation of the differences observed between vaccines.
Note‐worthy is the limited inter‐vaccine difference in efficacy against any CIN2+ (irrespective of HPV type) (Analysis 1.7; Analysis 3.7), where the contribution of non‐HPV16/18 hrHPV types is greater than for CIN3+ (Bzhalava 2013). Comparable significant reductions in the prevalence of HPV31, HPV33 and HPV45 have been observed in vaccinated versus unvaccinated young women attending screening in Australia (vaccinated mainly with the quadrivalent vaccine: Tabrizi 2014) and Scotland (vaccinated with the bivalent vaccine: Kavanagh 2014).
Differences in safety between the vaccine brands are discussed in section 2.4.
2.3. Adverse effects of HPV vaccines
Local adverse events at the injection site (pain, redness, swelling) were more common in vaccinated participants than in placebo recipients. However, systemic mild symptoms and serious adverse effects reported after an administered dose were equally distributed between the trial arms.
A pooled analysis of safety data was conducted by the manufacturer of the AS04‐adjuvanted bivalent HPV vaccine involving 31,173 adolescent girls and women who received the vaccine and 24,241 controls (Angelo 2014). Unsolicited adverse symptoms reported within 30 days after each dose were slightly more frequent in the vaccine group (30.8% versus 29.7%), whereas medically significant conditions (25.0% versus 28.3%), serious adverse effects (7.9% versus 9.3%) and potentially immune‐mediated diseases (0.52% versus 0.55%), reported over the whole study period, were not more frequent in vaccinated participants versus controls (Angelo 2014).
Occurrence of autoimmune events, possibly associated with the use of the adjuvants AS04 (3‐O‐desacyl‐4' monophosphoryl lipid A and aluminium) included in several vaccines, including the bivalent HPV vaccine, was assessed in a pooled analysis of trials conducted by the manufacturer (Verstraeten 2008). More than 68,000 records were included, among which 39,160 participants received the HPV16/18 L1 vaccine. The mean follow‐up time was 21 months. The overall rate of autoimmune‐related conditions was approximately 0.5% and the relative risk versus control groups was 0.98 (95% CI 0.80 to 1.21) for all AS04‐adjuvanted vaccines and 0.92 (95% CI 0.70 to 1.22) for HPV16/18 vaccine. For the individual autoimmune events, relative risks always included unity (Verstraeten 2008).
All estimates of adverse effects in our review were restricted to those reported from randomised trials and therefore could not detect rare events, for which post‐marketing surveillance, pharmacovigilance activities and linkage studies, joining vaccine and morbidity registries, are needed. The post‐licensure safety surveillance in the USA confirmed the general safety profile of the quadrivalent vaccine, which was consistent with observations from the studies included in our review, but identified a disproportional reporting of syncope and venous thromboembolic events. However, no causal relation could be established (Slade 2009). Subsequent studies did not find an association with thromboembolic events (Naleway 2016). Two healthcare organisations in California (USA) assessed new‐onset autoimmune conditions related to immunisation with the quadrivalent vaccine and did not identify significant associations, with the exception of Hashimoto thyroiditis (RR = 1.29, 95% CI 1.08 to 1.56). However, time‐relation and biological plausibility did not reveal evidence of causality (Chao 2012). The Medicines and Healthcare products Regulatory Agency of the UK set up a comprehensive pharmacovigilance study assessing the temporal association between chronic fatigue syndromes and the administration of the bivalent HPV vaccine (Donegan 2013). Despite the high coverage in girls and young women (age 12 to 20), no increased incidence of fatigue syndromes was observed after the introduction of HPV vaccination (incidence rate ratio: 0.94, 95% CI: 0.78 to 1.14). Detailed analysis of self‐controlled case series of 187 girls and young women did not reveal evidence that the HPV vaccine caused fatigue syndromes (ratio: 1.07, 95% CI: 0.57 to 2.00). A large linkage study, joining hospital records with HPV vaccine registries in Sweden and Denmark, did not reveal associations between administration of the quadrivalent vaccine and most autoimmune, neurological or venous thromboembolic adverse events. However, three autoimmune conditions were more common (Behcet’s disease, Raynaud’s disease and type 1 diabetes), and two neurological conditions were less common (epilepsy and paralysis) in vaccinated compared to non‐vaccinated cohorts. Authors considered that multiple comparisons may explain the significant findings (Arnheim‐Dahlstrom 2013). No increased incidence of thromboembolism or multiple sclerosis or other demyelating neurologic diseases after administration of the quadrivalent vaccine was detected from the Danish‐Swedish linkage studies (Scheller 2014; Scheller 2015).
In March 2014, the World Health Organization (WHO) Global Advisory Committee on Vaccine Safety (GACVS) reviewed the evidence base on safety of HPV vaccines and responded to questions related to reports on possible adverse effects (such as syncope, anaphylaxis, venous thromboembolism, adverse pregnancy outcomes, Guillain‐Barré Syndrome (GBS), stroke, toxic effects of the aluminium adjuvant, multiple sclerosis, cerebral vasculitis, complex regional pain syndrome (CRPS) and/or other chronic pain conditions). The committee concluded that the risk‐benefit profile of prophylactic HPV vaccines remains favourable and expressed its concerns about unjustified claims of harm, which lack biological and epidemiological evidence, and which may affect the confidence of the public (Larson 2011). At the same time, the Committee encouraged health authorities to continue surveillance and examination of potential adverse events (WHO 2014).
Seven large studies and one CDC review have investigated the association between HPV vaccination Guillain‐Barré syndrome (GBS) and found no evidence of increased risk (Arnheim‐Dahlstrom 2013; CDC 2015; Chao 2012; Gee 2017; Grimaldi‐Bensouda 2014; Ojha 2014; Vichnin 2015). In contrast, a French linkage study, linking HPV vaccination and morbidity registries, comprising more than 2 million girls found an increased risk of GBS: 0.4 versus 1.4 per 100,000 for non‐vaccinated and vaccinated girls and young women, respectively, adjusted hazard ratio (HR): 4.00, 95% CI 1.84 to 8.69) (ANSM/SANTE 2015). The association between GBS and HPV vaccination was strongest during the first three months after the last dose.
Upon request of the Danish health authorities, the Pharmacovigilance Risk Assessment Committee of the European Medicine Agency investigated complaints of complex regional pain syndrome (CRPS) and postural orthostatic tachycardia syndrome (POTS) among young women who received HPV vaccines (EMEA 2015). No causal relation could be established. Preliminary conclusions were confirmed by the EMA Committee for Medicinal Products for Human Use (CHMP) completed with representations from patient groups (EMA 2016). A Danish case‐control study compared pre‐vaccination health‐seeking behaviour in HPV vaccinated girls who had reported adverse effects (cases) with matched cohorts of HPV vaccinated girls who had not reported adverse affects. Increased rates of health problems were reported in the case group (Molbak 2016). Increasing trends in the incidence of chronic fatigue syndrome, systemic exertion intolerance disease and POTS (assessed from hospital discharge records) were reported in girls aged 12 to 15 years in the decade preceding the introduction of HPV vaccination in Finland (Skufca 2017). The authors warned for pre‐vaccination trends and variation in disease coding and healthcare‐seeking behaviour, which may influence the interpretation of associations with HPV vaccination (Molbak 2016, Skufca 2017).
In its last statement, the GACVS confirmed previous conclusions on HPV vaccine safety after revision of the recent signals on increased occurrence of GBS, POTS and CRPS (WHO 2016).
2.4. Comparison of adverse effects of the bivalent versus quadrivalent vaccines
Our review revealed a significantly higher rate of localised effects (Analysis 7.1), such as pain (Analysis 7.2) and swelling (Analysis 7.4) at the injection site for women who received the bivalent vaccine. However, in a meta‐regression adjusting for age and type of adjuvants or other vaccine given to the control group, these differences became non‐significant (Table 21). The meta‐regression analysis suggested a higher rate of local adverse effects associated with bivalent compared with the quadrivalent vaccine (relative risk ratio (RRR) = 1.69, 95% CI 0.96 to 2.96, P value = 0.61). The non‐significance might be due to the low power of meta‐regression. Higher rates of local adverse effects at the injection site with the bivalent vaccine were also observed in a head‐to‐head trial comparing immunogenicity and safety of the two licensed vaccines (Einstein 2011). A significantly higher rate of local injection site reactions was observed with the bivalent compared with the quadrivalent vaccine (RR for pain: 1.30 (95% CI 1.25 to 1.34); RR for swelling: 1.67 (95% CI 1.43 to 1.98); RR redness: 1.73 (95% CI 1.52 to 1.98). A marginally non‐significant higher frequency of medical significant conditions was noted among women who received the bivalent vaccine: RR = 1.15 (95% CI: 0.99 to 1.34). There were no statistically significant differences for the other adverse effects: new onset chronic diseases (RR = 0.95, 95% CI:0.52 to 1.74), new onset autoimmune disease (RR = 0.60, 95% CI:0.22 to 1.64), serious adverse effects (RR = 1.05, 95% CI:0.59 to 1.85) (Einstein 2011).
| Adverse effect | Relative risk | Relative risk ratio | p value | |
| Quadrivalent vs placebo | Bivalent/Quadrivalent | |||
| 1 | Overall adverse effects at injection site | 1.19 (0.89 to 1.59) | 1.69 (0.96 to 2.96) | 0.061 |
| 2 | Pain at injection site | 1.20 (0.78 to 1.85) | 1.19 (0.67 to 2.12) | 0.501 |
| 3 | Swelling at injection site | 2.72 (0.77to 9.61) | 0.62 (0.16 to 2.41) | 0.427 |
| 4 | Redness at injection site | 1.46 (1.23 to 1.74) | 1.08 (0.88 to 1.32) | 0.307 |
| 5 | Overall systemic events | 0.99 (0.91 to 1.07) | 1.06 (0.95 to 1.19) | 0.210 |
| 6 | Serious adverse events | 0.94 (0.70 to 1.26) | 1.08 (0.80 to 1.45) | 0.583 |
| 7 | Deaths | 1.18 (0.25 to 5.62) | 0.84 (0.14 to 4.91) | 0.775 |
Relative risks of the quadrivalent vaccine versus placebo and the relative risk ratios were computed by meta‐regression including vaccine, age group and type of product injected in the control group (aluminium adjuvants alone or other vaccine such as Hepatitis A vaccine) as covariate. The relative risk ratio reflects how much more an adverse effect is observed after vaccination with the bivalent versus the quadrivalent vaccine.
2.5. Pregnancy and infant outcomes
Pregnancy or sexual activity without contraception were exclusion criteria for enrolment in randomised HPV vaccination trials. However, if enrolled women became pregnant, pregnancy outcomes were surveyed carefully. In a pooled analysis of five phase III trials assessing the quadrivalent vaccine, miscarriage or congenital anomalies were not more common in the vaccine arm compared to the placebo arm (Garland 2009). No relation was found between the time from administration of the vaccine to conception and adverse pregnancy outcomes or occurrence of congenital anomalies. The rate of miscarriage was not higher for women who conceived within 30 days of any vaccination (18.2% in the vaccine arm versus 21.0% in the placebo group (P values or 95% CIs not computable by lack of denominator). Also in a pooled analysis of the PATRICIA and Costa Rica Vaccination trial (Wacholder 2010), miscarriage was not more frequent in women who received the bivalent HPV vaccine (197/1709 = 11.5%) compared with those who received the hepatitis A vaccine in the control group (176/1727 = 10.2%): RR = 1.13, 95% CI 0.93 to 1.37. However, for women who became pregnant within 90 days of administration of the bivalent vaccine, a significant increase in the rate of miscarriage was observed in women who received the HPV vaccine (58/394 = 14.7%) versus the control group (34/374 = 9.1%): RR = 1.62, 95% CI: 1.08 to 2.41) (Wacholder 2010). However, this finding was not confirmed in a larger study (Panagiotou 2015). After completion of the CVT trial (CVT (ph3,2v)), women in the placebo arm were offered the bivalent vaccine. Pregnancy outcomes were monitored for vaccinated women (from the vaccine arm + cross‐over vaccination from the control arm) and for control women (from the placebo arm having received Hepatitis A vaccine only completed with an unvaccinated cohort). The miscarriage rate was 13.3% (451 / 3394) among women who conceived at any time since bivalent HPV vaccination) versus 12.8% (414/3227) in pregnant women from the control group RR = 1.04 (95% 0.91 to 1.17, P value = 0.29) (Panagiotou 2015). There was no increased risk of miscarriage among women conceiving within 90 days of vaccination (P value = 0.436) overall or in subgroups. However, among women who conceived at any time from vaccination, an increased rate was observed for miscarriage occurring at 13 to 20 weeks of gestation (RR = 1.35, 95% CI 1.02‐1.77) (Panagiotou 2015).
In a post‐marketing surveillance study of 517 women who received the quadrivalent vaccine and became pregnant in the USA, Canada or France, the observed rates of miscarriage and birth defects were not higher than expected in the general population (Dana 2009). An updated analysis including 1752 pregnant women having received the quadrivalent vaccine confirmed previous conclusions (Goss 2015). No overall increased rate of adverse pregnancy outcomes was noted in British women who received the bivalent vaccine close to conception (‐30 to + 45 or ‐30 to +90 days) versus women who became pregnant six to 18 months after the last dose. However, in one subgroup, who received two doses of bivalent vaccine around conception, an increased hazard of miscarriage was found (HR 2.55, 95% CI 1.09 to 5.93) (Baril 2015). A retrospective cohort study assessed pregnancy outcomes in women with live births vaccinated with the quadrivalent HPV vaccine, according the co‐incident timing of vaccine administration and the pregnancy: a) 720 received the vaccine in the periconceptional period (two weeks before and after the last menstrual period); b) 638 during the pregnancy and c) 8196 four to 18 months before last menstrual period (Lipkind 2017). No increased risks neither in adverse obstetric events nor in birth outcomes were observed in the first two groups compared to the comparison group.
2.6. Safety of HPV vaccines co‐administered with other vaccines
A systematic review comparing HPV vaccines administered alone versus co‐administered with other vaccines (meningococcal conjugate, hepatitis A, hepatitis B, combined hepatitis A and B, tetanus, diphtheria, acellular pertussis, and inactivated poliovirus vaccines) showed non‐inferior seroconversion rates and similar rates of adverse effects (Noronha 2014).
2.7. Efficacy of the nona‐valent HPV vaccine
A recent paper reported the effects up to 48 months of the new nona‐valent vaccine which contains virus‐like particles (VLP) of the L1 protein of the HPV types 31, 33, 45, 52 and 58 as well as the four types included in the quadrivalent vaccine in women aged 16 to 26 years (Joura 2015). The seven included high‐risk types comprise the most prevalent types in cervical cancer and nearly 90% of all cervical cancer cases worldwide can be attributed to these types (Arbyn 2014; Bosch 2008). The randomised trial was not included in our review since it compared the nona‐valent with the quadrivalent vaccine.
In women who were hrHPV DNA negative at baseline the relative risk (9‐ versus quadrivalent vaccinated) of persistent infection with HPV types 31, 33, 45, 52 and 58 as well as CIN2+ associated with these five types was 0.04 (95% CI 0.03 to 0.06). In this group, the risk of any CIN2+ irrespective of HPV types was 0.60 (95% CI 0.36 to 0.98). In the modified intention‐to‐treat group, including women without cytological lesions regardless of baseline HPV DNA status, no protection was observed against any CIN2+ irrespective of HPV (RR = 1.00, 95% CI 0.96 to 1.16) (Joura 2015). Three per cent more local adverse reactions were observed in women who received the nona‐valent vaccine: RR = 1.03 (95% CI 1.02 to 1.04) but no significant differences in systemic of serious adverse events were noted. A more recent report confirmed efficacy findings over a follow‐up period of six years (Huh 2017).
A similar immune response of the nona‐valent vaccine compared to the quadrivalent vaccine against HPV6, HPV11, HPV16 and HPV18 was demonstrated for girls of age nine to 15 years (Vesikari 2015). Non‐inferior immunogenicity of the nona‐valent vaccine was shown in girls and boys aged nine to 15 years compared to young women aged 16 to 25 years (Van Damme 2015).
The efficacy and safety of the nona‐valent vaccine will be assessed in a future update of this Cochrane review, when results of more trials are available. This update will include also inter‐vaccine comparisons without a placebo arm.
2.8. Post marketing surveillance of HPV vaccine effectiveness
This review summarises efficacy estimated from randomised trials, which are not necessarily transposable to field conditions. However, trend analyses and linkage studies joining cervical cancer screening records and vaccination registries report a significant reduction in prevalence of HPV vaccine types, cervical cytological abnormalities and CIN in countries where HPV vaccination has been introduced and where a considerable HPV vaccination coverage has been achieved (Arbyn 2016; Baldur‐Felskov 2014; Brotherton 2011; Kavanagh 2014; Kavanagh 2017; Leval 2013; Markowitz 2013; Merckx 2015; Tabrizi 2012). A recent meta‐analysis assessed vaccination effects in the general population by comparing prevalence of HPV infection before and after introduction of HPV vaccination (Drolet 2015). Among girls and young women aged 13 to 19 years, a significant reduction was observed for infection with HPV16/18 infection (RR: 0.36, CI: 0.12 to 0.89) and of also of infection with HPV31, HPV33 and HPV45 (RR: 0.72, CI: 0.54 to 0.96), suggesting cross‐protection. No significant differences were observed in women of age 20 years and older (RR: 0.89, CI 0·79 to 1.02). The effects increased by vaccination coverage and years since vaccination. No differences by vaccine type (bi‐ or quadrivalent) were observed. These findings corroborate findings from the randomised trials. Women vaccinated at younger age reflect findings of young women who were free of HPV infection at enrolment in the RCTs. Herd immunity (protection of non‐vaccinated women living in populations with high HPV vaccination coverage) was shown from recent surveillance studies, linking HPV vaccination studies and HPV genotyping of cervical specimen of young women entering the screening programme, in Scotland (Kavanagh 2017) and Australia (Tabrizi 2014).
The effect on the incidence of genital warts is the first clinical effect of HPV vaccination (with the quadrivalent vaccine) and may be an indicator of protection against cervical (pre‐) cancer. Decreased incidence of genital warts in young (12 to 26 years) heterosexual, but not homosexual, males and decreased incidence of HPV vaccine types in non‐vaccinated young women in Australia, indicate a certain level of herd immunity (Donovan 2011; Tabrizi 2014). However, in Sweden, higher (although not statistically significant) rates of genital warts were reported in vaccinated women older than 20 years (Leval 2013). This phenomenon is most plausibly explained by an association between the tendency of opportunistic vaccination and high‐risk behaviour of adult sexually active women, who were vaccinated after exposure to HPV infection. The meta‐analysis of Drolet 2015 suggests herd immunity by observing reduced prevalence of genital warts in males younger than 20 years (RR: 0.66, CI 0.47 to 0.91) and in women in the age range 20 to 39 (0.68, 0.510.89) in countries where vaccination coverage among young women exceeded 50%.
To conclude, these real‐life effectiveness data are in line with conclusions of our review regarding efficacy derived from the randomised trials.
Overall completeness and applicability of evidence
1. Completeness of evidence
Figure 12 summarises the main efficacy estimates. We can distinguish seven endpoints (CIN2+, CIN3+, AIS+ associated with HPV types covered by the vaccines or any lesions irrespective of HPV types and persistent HPV16/18 infection), five exposure groups (defined by initial HPV DNA status and number of doses received), and two major age groups (15 to 26 and 25 to 45 years). Altogether, 70 data cells could potentially be completed from the trial databases. However, for 32 cells no data could be extracted and for the other 38 only a limited number of trials contributed data. Nonetheless, for the most relevant endpoint‐exposure group combinations, sufficient evidence could be derived allowing for evidence‐based decision making.
2. Endpoint of cervical cancer
The purpose of prophylactic vaccination against HPV is to reduce the incidence of cervical cancer. However, this outcome could not be assessed in our review, since trials conducted were not powered and included insufficient follow‐up time to demonstrate this endpoint. In agreement with World Health Organization (WHO) recommendation, reduction of histologically‐classified cervical intraepithelial neoplasias (CIN) grade 2 or worse, associated with the HPV types targeted by the vaccine, was the proposed main endpoint of vaccination efficacy trials (Pagliusi 2004). Defining invasive cancer as an outcome of the trials was considered as an unethical and unfeasible endpoint and would require extremely expensive and lengthy observation periods and postpone the availability of vaccines for decades (Pagliusi 2004). The observation of a reduced incidence of cervical cancer (and other HPV‐related cancer) in vaccinated cohorts will have to be obtained from population‐based studies linking cancer and vaccination registries (Lehtinen 2006).
3. Limited reported data for certain endpoints and exposure groups
This Cochrane review primarily used efficacy data extractable from peer‐reviewed published reports. Since, in principle all trials evaluated at baseline all enrolled women for presence of HPV genotypes and in addition cytology, and HPV serology, more efficacy data are available which would fit the defined analyses groups included in our Cochrane review. However, often only a restricted series of results were reported limiting the number of studies in each of the analyses (varying from one to eight), and gaps of non‐reported outcomes (Figure 6 and Figure 7). Indeed, only the endpoints CIN2+ related to HPV16/18 (Analysis 2.2) and persistent infection of HPV16/18 at six months (Analysis 5.4) in women being negative for HPV16/18 DNA at enrolment have as many as eight trials in one forest plot. Originally, we planned requesting data from data owners, to fill in gaps with available unpublished data. However, due to constraints in time and other resources this was not possible. We do not believe that this has undermined the importance of our review. For each major outcome included in summary of findings Table for the main comparison and summary of findings Table 3, we were able to obtain precise estimates of vaccine effects in the two main public health relevant groups: A) young women who were hrHPV negative at enrolment and received at least one dose of vaccine, who resemble the first target population of school‐based HPV vaccination programs (adolescent girls aged 12 to 14 years) and B) young women regardless of HPV status at enrolment, who received at least one vaccine dose, reflecting a catch‐up vaccination targeting older adolescents or young adult women. Among this latter category there is likely to be a considerable proportion who have already started sexual relations. In mid‐adult women (aged 24 to 45 years), almost no data were reported with respect to protection against any high‐grade CIN, irrespective of HPV type.
4. Non‐published trials
We consulted the trial registry https://clinicaltrials.gov/ to identify randomised trials which potentially could contain efficacy or safety data from women vaccinated with prophylactic HPV vaccines, but which were not published, or from which data could not be extracted (Appendix 6). A high level of reporting was noted for the safety outcome: results from 96% of women (97% and 95%, for the bi‐ and quadrivalent vaccine, respectively) enrolled in registered trials were comprised in studies included in our review. From four small trials with the bivalent vaccine, we could not retrieve data. Three trials (one bi‐bivalent (Denny 2013); two quadrivalent (Li 2012; Reisinger 2007)) were excluded. If the studies excluded from our Cochrane review were not taken into account, the inclusion coverage became 97.7% for the bivalent and 100% for the quadrivalent vaccine.
5. Immunogenicity of HPV vaccines
Intramuscular injection of L1‐based HPV vaccines induce production of virus‐specific antibodies in serum which exudate to epithelia and, by binding to HPV particles, impede new infection (Stanley 2006). The demonstration of serological responses in girls younger than 15 years of age, which were non‐inferior to those in women aged 15 to 26 (where virological and clinical efficacy was demonstrated), was pivotal in accepting HPV vaccines for use before onset of sexual activity (Schiller 2009).
The trials of the bi‐ and quadrivalent HPV vaccine have used different assays to measure virus‐specific antibody titres, making quantitative comparison of the serological data difficult. The chemiluminescence Immunoassay (cLIA ), generally used to measure the serological response in quadrivalent vaccine trials, is known to be more specific for certain fractions of virus‐neutralising antibodies, whereas enzyme‐linked immunosorbent assayS (ELISA) may also detect non‐neutralising antibodies. Loss of detectable anti‐HPV18 antibody by cLIA was not associated with waning of protection. Moreover, in trial reports, each company has used assay‐ and type‐specific concentration measures. Recently, standardised international units have been proposed to quantify type‐specific anti‐HPV serological responses (Unger 2010). However, these international units have not yet been applied in vaccine trial reports. As yet, no immunological correlate for clinical efficacy has been identified.
Therefore, immunogenicity of prophylactic HPV vaccines was not assessed in the current version of our Cochrane review, as was originally foreseen in the protocol (Arbyn 2013).
There was one head‐to‐head trial, where women were randomised to receive the bi‐ or quadrivalent vaccines (Einstein 2009). Immunogenicity of both vaccines could be directly compared by measuring the antibody responses in serum and cervico‐vaginal secretions with the same assays. Antibody titres and levels of memory B cells were significantly higher in all age groups for both HPV16 and HPV 18 with the bivalent, compared with the quadrivalent, vaccine. Differences were maintained 30 months after completion of vaccination. However, it was shown that adding VLP antigens from other HPV types to the AS04‐adjuvanted bivalent vaccine resulted in lower anti‐HPV16 and anti‐HPV18 responses (Van Damme 2014).
As soon as an immunologically comparative framework for immunogenicity is agreed, this review will be updated and extended with serologically‐defined endpoints.
Quality of the evidence
We rated the quality of evidence and present our findings in summary of findings Table for the main comparison; summary of findings Table 2; summary of findings Table 3 for efficacy outcomes across the three populations as defined by HPV status at baseline. We present analyses of pregnancy outcomes in summary of findings Table 4.
The studies providing data to this review are large and we have judged them to be at low risk of bias for efficacy endpoints for women who received three doses or at least one dose. For a few outcomes, we judged that the number of events to be low, even with large sample sizes, meaning that we cannot rule out different effect sizes to those we have found for adenocarcinoma in situ (AIS) associated with HPV16/18 and any AIS, irrespective of HPV type, in women who were hrHPV negative at baseline (summary of findings Table for the main comparison). Although few trials could be identified for a given exposure group/endpoint combination, the results were generally consistent across the efficacy endpoints in women who are hrHPV negative and HPV16/18 negative at baseline (summary of findings Table 2). For protection against precancer associated with HPV16/18, conferred by fewer than three doses of HPV vaccine, we downgraded the level of evidence to low or very low, since the risk in the placebo arms varied by number of doses received (Table 2: Analysis 2.3, Analysis 2.6, Analysis 2.9, Analysis 2.12; Analysis 2.15).
The quality of evidence was judged as high regarding absence of increased risk of severe systemic adverse effects associated with HPV vaccination. Regarding mortality associated with HPV vaccination, the quality of evidence is low. For the level of evidence regarding obstetrical safety, we judged the quality of evidence as moderate or high.
More than 70,000 women were included overall in the randomised trials and in the most important exposure group/efficacy endpoint combinations more than 10,000 women were enrolled, resulting in precise estimates. For certain post‐hoc analyses with respect to effects in women having received only one or two doses, fewer than 1000 women were included, yielding pooled estimates, with wider confidence intervals.
The natural history of CIN and cervical cancer is strongly linked to persistent infection with hrHPV infection (Forman 2012; IARC 2007), and the contribution of HPV types 16 and 18 in the overall burden of cervical cancer is around 71% (Arbyn 2014). Given this strong link, we can accept a high level of directness between the observed prevention of persistent infection, CIN and the anticipated expected prevention of cervical cancer incurred by HPV vaccination. Nevertheless, it must be acknowledged that reduced incidence of invasive cervical cancer in HPV vaccinated women cannot be observed within the available trials (See Discussion 2.2).
Publication bias could not be assessed formally, given the small number of trials reporting clinical efficacy data. However, the level of completeness of reporting and absence of a correlation between study size and effects allow us to conclude that the risk of reporting bias may be small.
2. Strict separation by type of endpoint and HPV DNA status at enrolment
We have separated exposure groups in terms of age and enrolment status, mainly based on the presence or absence of hrHPV DNA or HPV16/18 DNA and the distinction of trial outcomes, such as cervical precancer associated with HPV vaccine types or irrespective of HPV type. This allowed us to pool comparable data which did not appear possible a priori because of the use of different definitions of exposure groups in the original trial reports, such as according‐to‐protocol, naive‐vaccinated population, intention‐to‐treat, total‐vaccinated‐cohort, modified intention‐to‐treat. Other meta‐analyses ignored this principle and pooled results from very heterogeneous groups. For instance, Rambout 2007 considered efficacy data from the FUTURE‐1 and ‐2 trials (FUTURE I trial (ph3,4v), FUTURE II trial (ph3,4v), including women positive for HPV16/18 at enrolment for vaccination with the quadrivalent vaccine, and combined them with efficacy data from the Phase2 trial (ph2,2v) and PATRICIA trial (ph3,2v), excluding HPV16/18 positive women vaccinated with the bivalent vaccine. Protection was higher in the latter group, but this may be due to the enrolment of more hr HPV‐naïve women, rather than because of differences in the efficacy of the vaccine. By distinguishing exposure groups and outcomes in our review, homogenous data sets could be combined and significant protection could be demonstrated. We demonstrated protection against AIS associated with HPV16/18 in women vaccinated with the bi‐ or quadrivalent vaccines and who were initially hrHPV DNA negative or negative for the vaccine types (Analysis 1.5; Analysis 1.9; Analysis 2.10), or even regardless of initial HPV DNA status (Analysis 3.5). Without pooling trials with different vaccines, protection was not significant, since AIS is less common than high‐grade CIN. We considered meta‐analytical pooling as relevant only in the absence of heterogeneity. In contrast, we also found situations, where vaccine efficacy was significantly different between the two licensed vaccines. For instance, regarding protection against any CIN2+ or CIN3+, irrespective of HPV type, in women who were hrHPV DNA negative at baseline, greater protection was found for the bivalent compared to the quadrivalent vaccine (RR: 0.33 versus 0.57, P value = 0.0004 (Analysis 1.7) or RR: 0.08 versus 0.54, P value = 0.001 (Analysis 1.8), respectively). Also in total vaccinated cohorts, whatever the initial HPV DNA status, women who received at least one dose of the bivalent compared to the quadrivalent vaccine had better protection against any CIN3+ (RR: 0.55 versus 0.81, P value = 0.01 (Analysis 3.8]). See further discussion of potential methodologic reasons for this difference in Section 2.2 of the Discussion.
3. Unreported estimated outcomes: vaccination effect when fewer than three doses were administered
An original approach of this review was the estimation of the efficacy of fewer than three doses by subtracting the number of events in the populations that received all three doses from those who received at least one dose. By doing this subtraction, we found significant protection, in women initially negative for HPV16/18, against CIN2+ and CIN3+ associated with HPV16/18 in younger, but not in mid‐adult, women (Analysis 2.3). It is important to remember that these were post hoc analyses and that the trials were not designed to assess the effects of fewer than three doses. Furthermore, we were not able to assess differences between three‐dose vaccine recipients and those who did not complete the series.
Recent randomised trials have demonstrated non‐inferior anti‐HPV16 and anti‐HPV18 antibody levels induced after a two‐dose schedule at months zero and six in girls aged nine to 14 years compared to the usual three‐dose schedules of bivalent or quadrivalent vaccine in young women aged 15 to 26 years ( Dobson 2013; Lazcano‐Ponce 2014; Romanowski 2011). These observations have convinced some regulatory agencies to allow a two‐dose schedule for girls of nine to 14 years of age (EMEA 2014a; EMEA 2014b). Our findings suggest that two doses might provide protection in young women (aged 15 to 26 years), but not in mid‐adult women (24 to 45 years). Some experts have expressed concerns that the two‐dose schedule might affect the longevity of protection (Stanley 2014). Public health authorities should set up careful surveillance of the duration of protection by age and by the number and timing of received doses. A recent pooled post hoc analysis (PATRICIA & CVT (ph3,2v)) showed a similar efficacy of the bivalent vaccine against incident HPV16/18 infection among women who were HPV16/18 DNA negative at baseline and who received one dose (RR = 0.16, 95% CI 0.06 to 0.29), two doses (RR = 0.24, 95% CI 0.15 to 0.38), or three doses (RR = 0.23, 95% CI 0.21 to 0.25) (Kreimer 2015), Protection appeared to be higher for those who received two doses when the interval between administration was six months compared to one month. No data on protection of fewer than three doses against cervical lesions were reported. Recent data show durability of protection against HPV16/18 afforded by fewer than three doses of the bivalent vaccine over at least seven years (Safaeian 2018).
Post licensure studies of the effectiveness of the quadrivalent vaccine in the USA (Hofstetter 2016) and Australia (Brotherton 2015; Crowe 2014; Gertig 2013) have shown decreased rates of high‐grade and/or low‐grade cervical lesions in partially vaccinated young women versus non‐vaccinated young women who started cervical cancer screening. However. vaccine effectiveness was of lower magnitude than when three doses were given. A recent report from a suspended cluster‐randomised trial, conducted in India, compared immunogenicity of the quadrivalent vaccine according to the actual number of doses administered to girls aged 10 to 18 years. The immune response (in terms of geometric mean antibody levels) in the group who received two doses at month zero and month six or later was not inferior to the group who received three doses at months zero, two and six or later. However, the immune response was inferior in the groups who received two doses at month zero and two or who received only one dose (Sankaranarayanan 2016).
A recent Scottish surveillance study of the effectiveness of the bivalent vaccine demonstrated significant protection against prevalent HPV16/18 infection conferred by two doses (RR of 0.45, 95% CI 0.29 to 0.69) or one dose (RR of 0.52, 95% CI 0.31 to 0.83) among those reached by catch‐up vaccination targeting girls of age 14 to 18 years and who entered the screening programme (Cuschieri 2016). However, protection was lower than with three doses (RR of 0.27, 95% CI 0.20 to 0.36). No significant protection against cervical intra‐epithelial neoplastic lesions irrespective of HPV types associated with fewer than three doses was observed (Pollock 2014).
It must be remarked that partially vaccinated women in published post‐licensure studies were older than fully vaccinated women (so more likely to have been exposed to HPV prior to vaccination) and most women with two doses had a one to two month interval between vaccine administrations.
Potential biases in the review process
Post hoc analysis of vaccine effects associated with one or two doses
In this review, we computed efficacy estimates for women who received only one or two doses, by subtracting events and total number of women who received three doses from those who received at least one dose. We computed this for data presented within the same report for a given follow‐up time. This is a post hoc analysis, which has limitations, since counting of events often started for the women who received at least one dose at day one, whereas for those who received all three doses counting started from the day of the last administration. Most of the women in the group that received at least one dose received three doses. We assumed that the possible protection, not accounted for in the group receiving three doses, induced by the vaccine in the period between 1st and 2nd dose, would be small. Reported observed data from the Costa Rica Trial, separated by groups receiving only one, two or three does, are in agreement with our estimates (Kreimer 2011).
An important finding with public health relevance, was that one or two doses of bi‐ or quadrivalent vaccine did not protect against CIN2+ associated with HPV16/18, in women older than 24 years, even if they were negative for HPV16/18 at enrolment (RR = 0.98, 95% CI 0.20 to 4.83), whereas women younger than 26 years experienced protection against HPV16/18 related CIN2+, CIN3+ and AIS+ if HPV16/18 DNA negative at baseline.
Other potential biases
As mentioned in Overall completeness and applicability of evidence, for several outcomes no information was available for the group of mid‐adult women. We have focused efforts to obtain unpublished data from registered studies for adverse events. We tested the assumption that there is a difference between results obtained from published trial reports and trial registry and study results websites for serious adverse events and mortality by Sensitivity analysis. Journal‐published trial reports provide data at fixed time points, whereas trial registry and study results websites can be updated over time as data are collected from more recent follow‐up. Sensitivity analysis by source of data gives us some confidence that published and registry or website‐sourced data are similar for the same study. However, data from regulatory sources and data from unregistered and unpublished studies were not consulted for efficacy endpoints and less than severe adverse events.
The comparison of the risks of adverse events was compromised by the use of different products administered to participants in the control group, varying from adjuvant (often aluminium hydroxide or other aluminium compound) or an alternative vaccine (often Hepatitis A or Hepatitis B). Therefore, the pooled risks of adverse effects associated with HPV vaccines and the assumed risks for control groups must be interpreted cautiously (summary of findings Table 4).
Agreements and disagreements with other studies or reviews
A multitude of reviews and combined analyses have been conducted over recent years by regulatory agencies and institutions developing practice guidelines (Ault 2007; Haupt 2011; Harper 2009; Kjaer 2009; Lehtinen 2013; Romanowski 2011; Schiller 2012; Stanley 2014; WHO 2009) and systematic reviewers (Delere 2014; Lehtinen 2013; Lu 2011; Malagon 2012; McKeage 2011; Medeiros 2009; Rambout 2007). Our review is distinguished from previous reviews by its currency because of the inclusion of later reports of data from included trials. This includes the most recent results of the VIVIANE trial (Wheeler 2016) and the latest safety reports of the bivalent Chinese trial (July 2016). In general, the review corroborates findings from other major reviews. However, two findings were not previously reported: 1) the statistically significant protection against AIS both associated with HPV16/18 and irrespective of HPV type, and 2) the significant protection induced by fewer than three vaccine doses against CIN2+ associated with HPV16/18 in women who were HPV16/18 negative at baseline, although this was a post hoc analysis.
Future work
The current review focused primarily on protection against cervical precancer related to the HPV types included in the vaccine or any cervical precancer irrespective of HPV type. In the future, six‐month persistent infection with HPV types included in the vaccine probably will become the main assessed outcome, which is a more objectively measurable endpoint and highly correlated with clinical outcomes (IARC 2013). In future reviews, protection against persistent infection with the vaccine types may become the primary outcome.
We propose conducting additional Cochrane reviews on HPV vaccine efficacy against other HPV‐related diseases such as genital warts, vaginal, vulvar, anal and penile intra‐epithelial neoplasia and cancer, as well as HPV infection at these anatomical sites and in the oral cavity. These reviews may include study designs, in addition to randomised trials, such as cohort studies, registry linkage studies and trend analyses, The incidence of respiratory papillomatosis, which is a rare but very serious condition related to HPV6 and HPV11, could also be considered.
Reviews should assess effects in particular groups, such as men, immune‐depressed populations, men‐having‐sex‐with men (MSM) and women‐having‐sex‐with‐women (WSW), infants, and mid‐adult age groups.
A particular important area for further research is the question of how to integrate primary protection against HPV‐related disease with current and future cytology‐based or HPV‐based screening for cervical cancer. This research, and subsequent pooled analyses, should address how to screen vaccinated cohorts and whether non‐vaccinated HPV‐negative cohorts would benefit from vaccination at the time of screening (Bosch 2016).
Regulatory agencies (EMEA 2014a; EMEA 2014b) approved two‐dose schedules for L1 HPV vaccines in young girls, based on non‐inferior seroconversion rates and anti‐HPV antibody levels (Romanowski 2011; Stanley 2014). Our review provides some clinical efficacy evidence supporting this decision. Moreover, recent data suggest protection conferred by only one dose of HPV vaccine (Kreimer 2015; Safaeian 2018). However, it cannot be excluded that schemes with fewer than three doses would induce a protection of shorter duration. Comprehensive vaccine registries linked to screening, cytopathology, HPV virology, cancer registry data and linkable to cervical cytology and histology bio‐banks will be extremely useful tools for epidemiological surveillance to answer questions on duration of protection, occurrence of cross‐protection and type replacement (Arbyn 2010; Dillner 2011).
For reasons of statistical power and costs, trials often assess combined outcomes (persistent infection, cytological lesion, CIN1+, external ano‐genital lesions). Although this is acceptable for clinical decision making, authors should be invited to report separate outcomes to facilitate future meta‐analytical pooling. Editors of journals should also support publishing these detailed reports in appendices.
In later updates, we foresee inclusion of efficacy and safety data from trials which evaluate the nona‐valent vaccine and possible other vaccines that do not involve comparisons with a placebo group but include comparisons with other HPV vaccines.
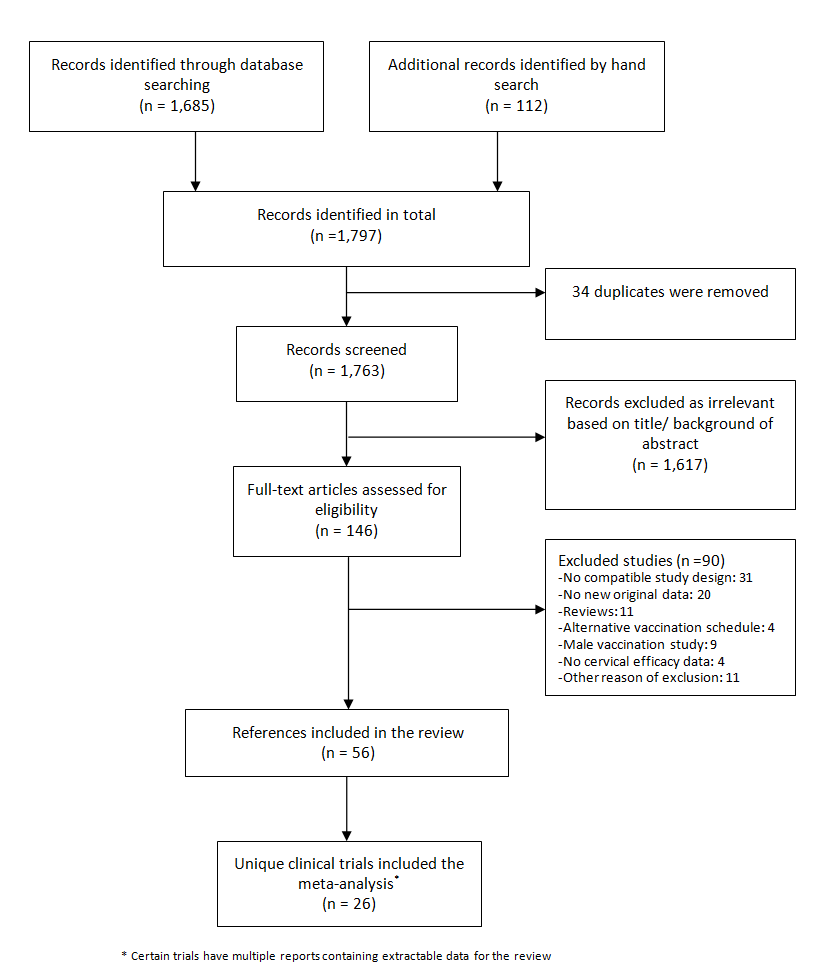
Flow diagram summarising the retrieval, inclusion and exclusion of relevant reports of randomised trials assessing the safety and effects of prophylactic HPV vaccines.

'Risk of bias' summary: review authors' judgements about each 'Risk of bias' item for each included study.
V1 = Random sequence generation; V2 = Allocation concealment; V3 = Blinding participants & personnel; V4 = Blinding of outcome assessment; V5 = Incomplete outcomes; V6 = Selective reporting.

'Risk of bias' graph: review authors' judgements about each 'Risk of bias' item presented as percentages across all included studies.
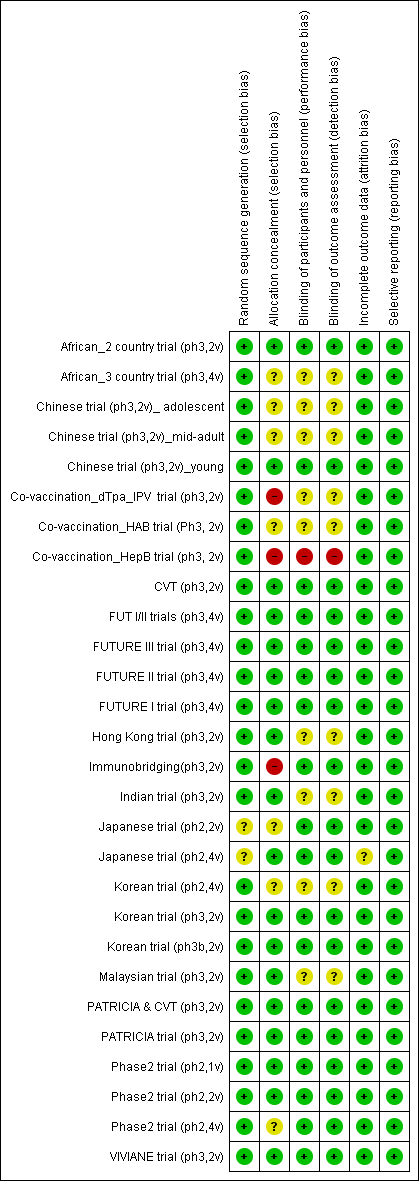
'Risk of bias' summary: review authors' judgements about each 'Risk of bias' item for each included study.
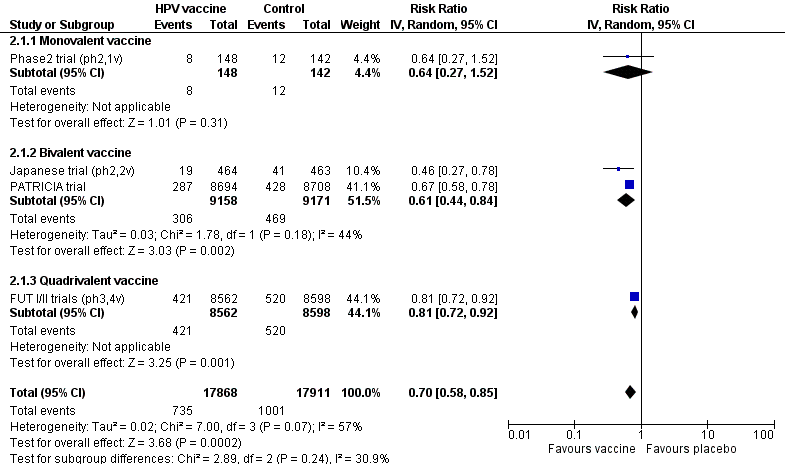
Protection against CIN2+ irrespective of presence of HPV types in women, aged 15‐26 years, regardless of their HPV DNA status at baseline, who received at least one dose.
![Summary of vaccine efficacy estimates, by age group, outcome and HPV DNA status at enrolment (for women who received at least one dose). [REFS BETWEEN SQUARE BRACKETS MUST BE ADAPTED][](/es/cdsr/doi/10.1002/14651858.CD009069.pub3/media/CDSR/CD009069/image_n/nCD009069-AFig-FIG06.png)
Summary of vaccine efficacy estimates, by age group, outcome and HPV DNA status at enrolment (for women who received at least one dose). [REFS BETWEEN SQUARE BRACKETS MUST BE ADAPTED][
![Summary of vaccine efficacy estimates by age group, outcome and number of received doses (for women who were HPV16/18 DNA negative at enrolment). [REFS BETWEEN SQUARE BRACKETS MUST BE ADAPTED][](/es/cdsr/doi/10.1002/14651858.CD009069.pub3/media/CDSR/CD009069/image_n/nCD009069-AFig-FIG07.png)
Summary of vaccine efficacy estimates by age group, outcome and number of received doses (for women who were HPV16/18 DNA negative at enrolment). [REFS BETWEEN SQUARE BRACKETS MUST BE ADAPTED][

Modified Cates plot: Number of cases of CIN2+ associated with HPV16/18 occurring in women who were all hrHPV DNA negative at baseline. 16 out of 1000 non‐vaccinated women developed the lesion (left) whereas fewer than one (0.2) out 1000 vaccinated women developed the lesion (right). Relative risk= 0.01 (95% CI: 0.01 to 0.05).

Modified Cates plot: Number of cases of CIN2+ irrespective of HPV types occurring in women who were all hrHPV DNA negative at baseline. 28 out of 1000 non‐vaccinated women developed the lesion (left) whereas 11 out 1000 vaccinated women developed the lesion (right). Relative risk= 0.37 (95% CI: 0.25 to 0.55).

Sensitivity analysis of Analysis 7.6 on severe adverse effects restricting to data extracted from publications in peer‐reviewed journals.

Sensitivity analysis of Analysis 7.7 on deaths restricting to data extracted from publications in peer‐reviewed journals.

Protection against CIN2+ associated with HPV16/18 in women, aged 15‐26 years, who were HPV DNA 16/18 negative at baseline, by number of doses.

Comparison 1 High‐grade cervical lesions in hrHPV DNA negative women at baseline, Outcome 1 CIN2+ associated with HPV16/18, at least 1 dose.

Comparison 1 High‐grade cervical lesions in hrHPV DNA negative women at baseline, Outcome 2 CIN2+ associated with HPV6/11/16/18, at least 1 dose.

Comparison 1 High‐grade cervical lesions in hrHPV DNA negative women at baseline, Outcome 3 CIN3+ associated with HPV16/18, at least 1 dose.
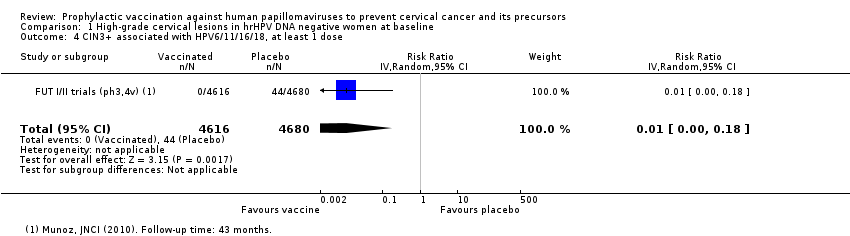
Comparison 1 High‐grade cervical lesions in hrHPV DNA negative women at baseline, Outcome 4 CIN3+ associated with HPV6/11/16/18, at least 1 dose.
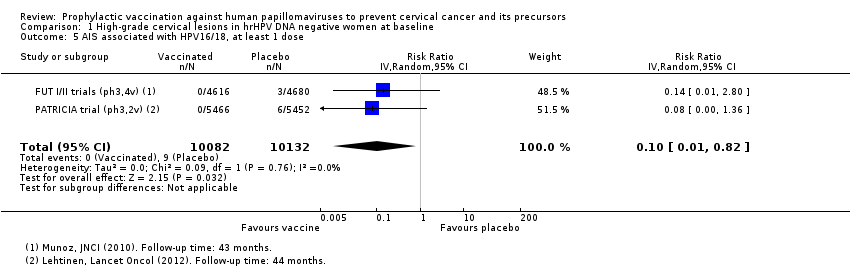
Comparison 1 High‐grade cervical lesions in hrHPV DNA negative women at baseline, Outcome 5 AIS associated with HPV16/18, at least 1 dose.
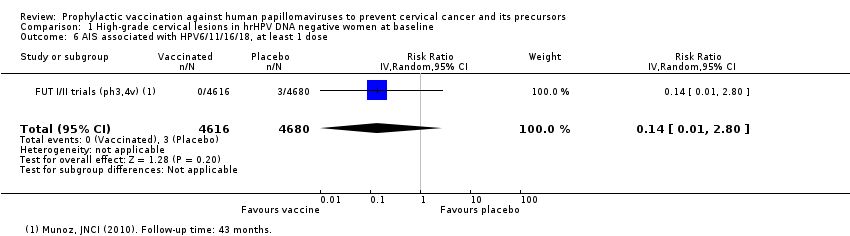
Comparison 1 High‐grade cervical lesions in hrHPV DNA negative women at baseline, Outcome 6 AIS associated with HPV6/11/16/18, at least 1 dose.
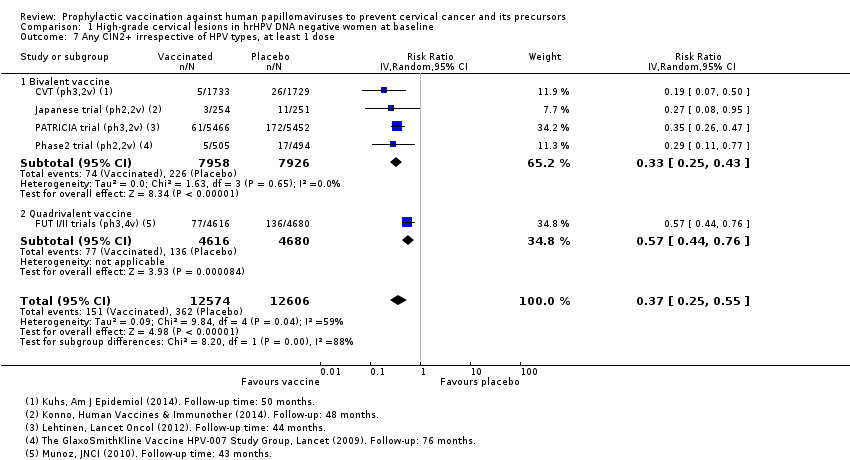
Comparison 1 High‐grade cervical lesions in hrHPV DNA negative women at baseline, Outcome 7 Any CIN2+ irrespective of HPV types, at least 1 dose.
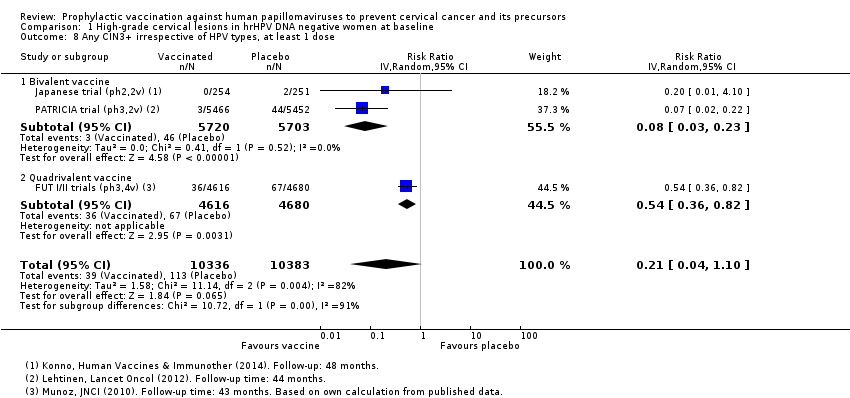
Comparison 1 High‐grade cervical lesions in hrHPV DNA negative women at baseline, Outcome 8 Any CIN3+ irrespective of HPV types, at least 1 dose.
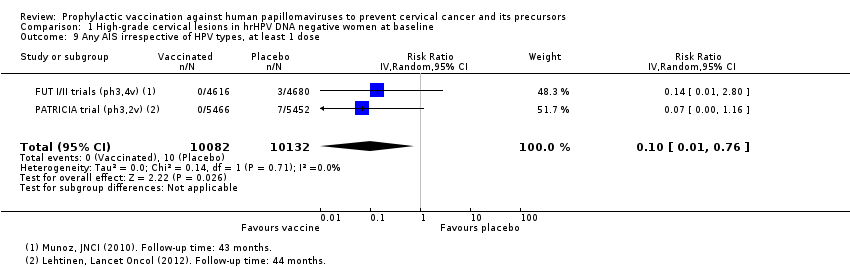
Comparison 1 High‐grade cervical lesions in hrHPV DNA negative women at baseline, Outcome 9 Any AIS irrespective of HPV types, at least 1 dose.

Comparison 2 High‐grade cervical lesions in HPV16/18 DNA negative women at baseline, Outcome 1 CIN2+ associated with HPV16/(18), 3 doses.

Comparison 2 High‐grade cervical lesions in HPV16/18 DNA negative women at baseline, Outcome 2 CIN2+ associated with HPV16/(18), at least 1 dose.

Comparison 2 High‐grade cervical lesions in HPV16/18 DNA negative women at baseline, Outcome 3 CIN2+ associated with HPV16/(18), 1 or 2 doses (post hoc analysis).
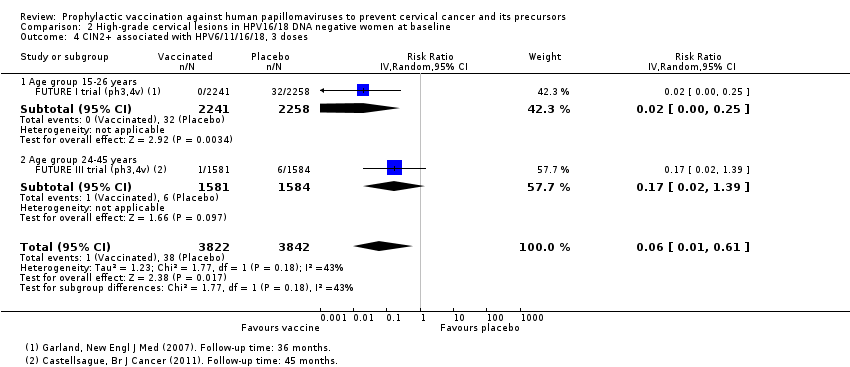
Comparison 2 High‐grade cervical lesions in HPV16/18 DNA negative women at baseline, Outcome 4 CIN2+ associated with HPV6/11/16/18, 3 doses.

Comparison 2 High‐grade cervical lesions in HPV16/18 DNA negative women at baseline, Outcome 5 CIN2+ associated with HPV6/11/16/18, at least 1 dose.

Comparison 2 High‐grade cervical lesions in HPV16/18 DNA negative women at baseline, Outcome 6 CIN2+ associated with HPV6/11/16/18, 1 or 2 doses (post hoc analysis).

Comparison 2 High‐grade cervical lesions in HPV16/18 DNA negative women at baseline, Outcome 7 CIN3+ associated with HPV16/18 or HPV6/11/16/18, 3 doses.
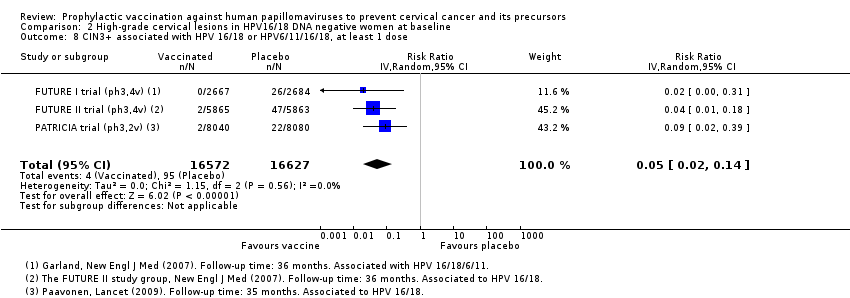
Comparison 2 High‐grade cervical lesions in HPV16/18 DNA negative women at baseline, Outcome 8 CIN3+ associated with HPV 16/18 or HPV6/11/16/18, at least 1 dose.
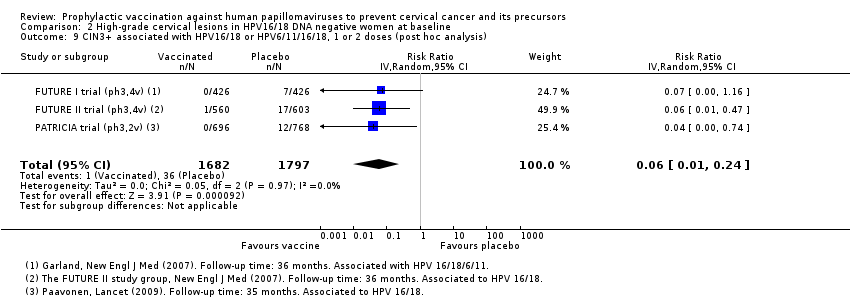
Comparison 2 High‐grade cervical lesions in HPV16/18 DNA negative women at baseline, Outcome 9 CIN3+ associated with HPV16/18 or HPV6/11/16/18, 1 or 2 doses (post hoc analysis).

Comparison 2 High‐grade cervical lesions in HPV16/18 DNA negative women at baseline, Outcome 10 AIS associated with HPV16/18 or HPV6/11/16/18, 3 doses.

Comparison 2 High‐grade cervical lesions in HPV16/18 DNA negative women at baseline, Outcome 11 AIS associated with HPV16/18 or 6/11/16/18, at least 1 dose.

Comparison 2 High‐grade cervical lesions in HPV16/18 DNA negative women at baseline, Outcome 12 AIS associated with HPV16/18 or HPV6/11/16/18, 1 or 2 doses (post hoc analysis).

Comparison 2 High‐grade cervical lesions in HPV16/18 DNA negative women at baseline, Outcome 13 Any CIN2+ irrespective of HPV types, 3 doses.
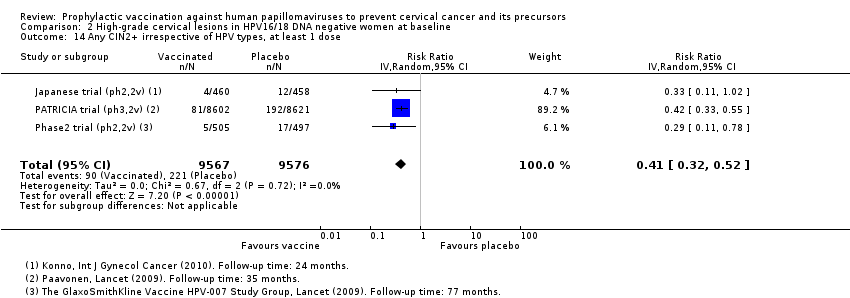
Comparison 2 High‐grade cervical lesions in HPV16/18 DNA negative women at baseline, Outcome 14 Any CIN2+ irrespective of HPV types, at least 1 dose.

Comparison 2 High‐grade cervical lesions in HPV16/18 DNA negative women at baseline, Outcome 15 Any CIN2+ irrespective of HPV types, 1 or 2 doses (post hoc analysis).
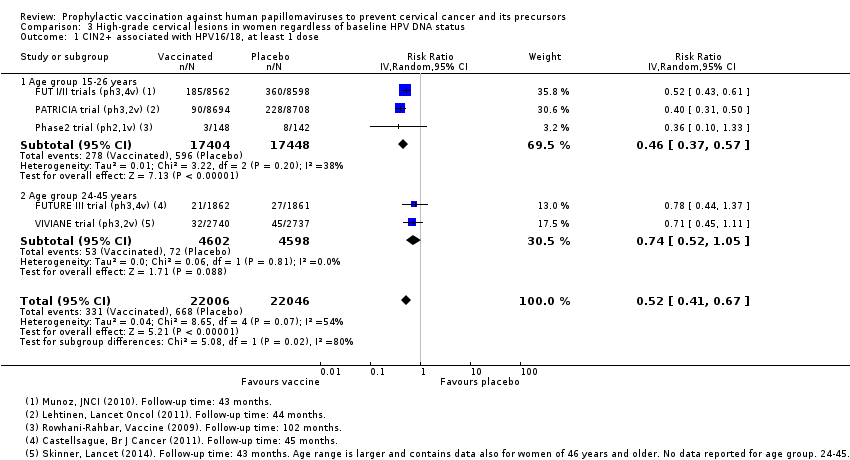
Comparison 3 High‐grade cervical lesions in women regardless of baseline HPV DNA status, Outcome 1 CIN2+ associated with HPV16/18, at least 1 dose.

Comparison 3 High‐grade cervical lesions in women regardless of baseline HPV DNA status, Outcome 2 CIN2+ associated with HPV6/11/16/18, at least 1 dose.

Comparison 3 High‐grade cervical lesions in women regardless of baseline HPV DNA status, Outcome 3 CIN3+ associated with HPV16/18, at least 1 dose.

Comparison 3 High‐grade cervical lesions in women regardless of baseline HPV DNA status, Outcome 4 CIN3+ associated with HPV6/11/16/18, at least 1 dose.

Comparison 3 High‐grade cervical lesions in women regardless of baseline HPV DNA status, Outcome 5 AIS associated with HPV16/18, at least 1 dose.

Comparison 3 High‐grade cervical lesions in women regardless of baseline HPV DNA status, Outcome 6 AIS associated with HPV6/11/16/18, at least 1 dose.
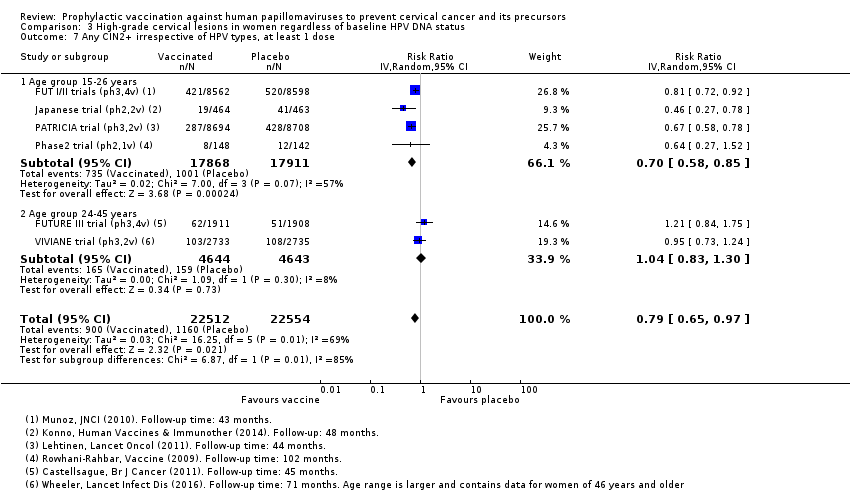
Comparison 3 High‐grade cervical lesions in women regardless of baseline HPV DNA status, Outcome 7 Any CIN2+ irrespective of HPV types, at least 1 dose.

Comparison 3 High‐grade cervical lesions in women regardless of baseline HPV DNA status, Outcome 8 Any CIN3+ HPV type, at least 1 dose.
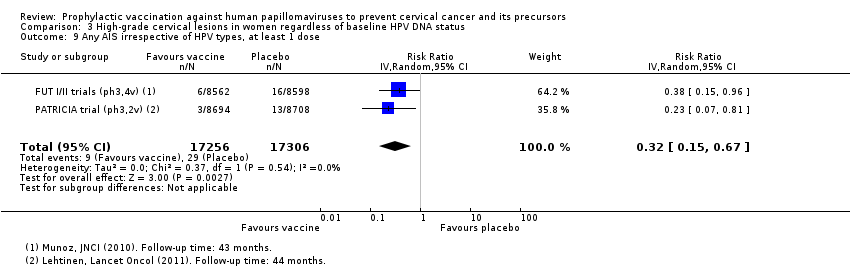
Comparison 3 High‐grade cervical lesions in women regardless of baseline HPV DNA status, Outcome 9 Any AIS irrespective of HPV types, at least 1 dose.

Comparison 4 Infection with HPV vaccine types in hrHPV DNA negative women at baseline, Outcome 1 Incident HPV16/18 infection, 3 doses.

Comparison 4 Infection with HPV vaccine types in hrHPV DNA negative women at baseline, Outcome 2 Persistent HPV16/18 infection (6M), 3 doses.
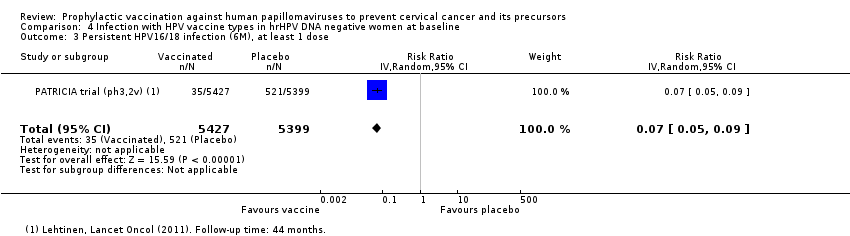
Comparison 4 Infection with HPV vaccine types in hrHPV DNA negative women at baseline, Outcome 3 Persistent HPV16/18 infection (6M), at least 1 dose.
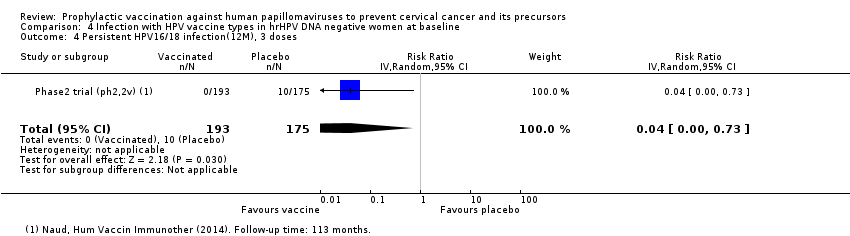
Comparison 4 Infection with HPV vaccine types in hrHPV DNA negative women at baseline, Outcome 4 Persistent HPV16/18 infection(12M), 3 doses.

Comparison 4 Infection with HPV vaccine types in hrHPV DNA negative women at baseline, Outcome 5 Persistent HPV16/18 infection (12M), at least 1 dose.

Comparison 5 HPV16/18 infection in HPV16/18 DNA negative women at baseline, Outcome 1 Incident HPV16/18 infection, 3 doses.
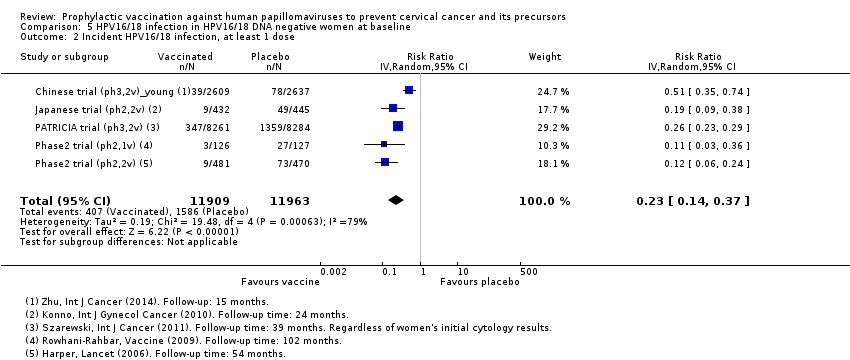
Comparison 5 HPV16/18 infection in HPV16/18 DNA negative women at baseline, Outcome 2 Incident HPV16/18 infection, at least 1 dose.

Comparison 5 HPV16/18 infection in HPV16/18 DNA negative women at baseline, Outcome 3 Incident HPV16/18 infection, 1 or 2 doses (post hoc analysis).

Comparison 5 HPV16/18 infection in HPV16/18 DNA negative women at baseline, Outcome 4 Persistent HPV16/18 infection (6M), 3 doses.

Comparison 5 HPV16/18 infection in HPV16/18 DNA negative women at baseline, Outcome 5 Persistent HPV16/18 infection (6M), at least 1 dose.
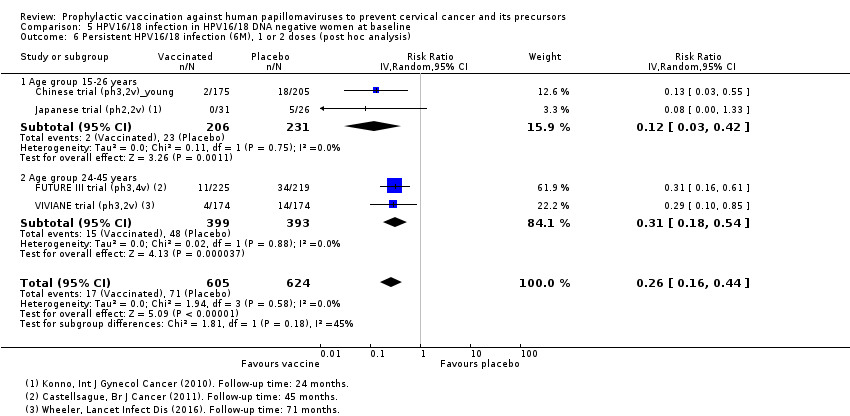
Comparison 5 HPV16/18 infection in HPV16/18 DNA negative women at baseline, Outcome 6 Persistent HPV16/18 infection (6M), 1 or 2 doses (post hoc analysis).

Comparison 5 HPV16/18 infection in HPV16/18 DNA negative women at baseline, Outcome 7 Persistent HPV6/11/16/18 infection (6M), 3 doses.

Comparison 5 HPV16/18 infection in HPV16/18 DNA negative women at baseline, Outcome 8 Persistent HPV6/11/16/18 infection (6M), at least 1 dose.

Comparison 5 HPV16/18 infection in HPV16/18 DNA negative women at baseline, Outcome 9 Persistent HPV16/18 infection (12M), 3 doses.

Comparison 5 HPV16/18 infection in HPV16/18 DNA negative women at baseline, Outcome 10 Persistent HPV16/18 infection (12M), at least 1 dose.

Comparison 5 HPV16/18 infection in HPV16/18 DNA negative women at baseline, Outcome 11 Persistent HPV16/18 infection (12M), 1 or 2 doses (post hoc analysis).

Comparison 6 Infection with HPV types included in the vaccine in women regardless of HPV DNA status at baseline, Outcome 1 Incident HPV16/18 infection, at least 1 dose.

Comparison 6 Infection with HPV types included in the vaccine in women regardless of HPV DNA status at baseline, Outcome 2 Persistent HPV16/18 infection (6M), at least 1 dose.

Comparison 6 Infection with HPV types included in the vaccine in women regardless of HPV DNA status at baseline, Outcome 3 Persistent HPV6/11/16/18 infection (6M), at least 1 dose.
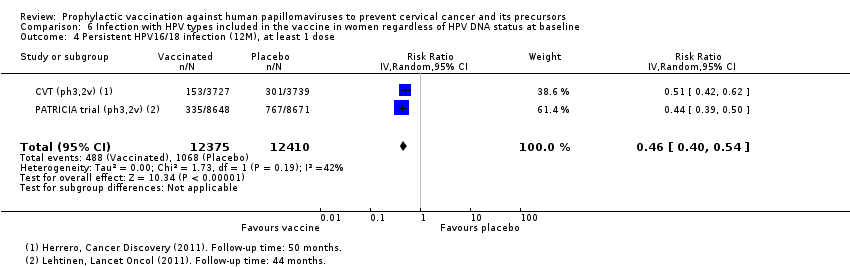
Comparison 6 Infection with HPV types included in the vaccine in women regardless of HPV DNA status at baseline, Outcome 4 Persistent HPV16/18 infection (12M), at least 1 dose.

Comparison 6 Infection with HPV types included in the vaccine in women regardless of HPV DNA status at baseline, Outcome 5 Persistent HPV16/18 infection (12M) by dose (post hoc analysis).
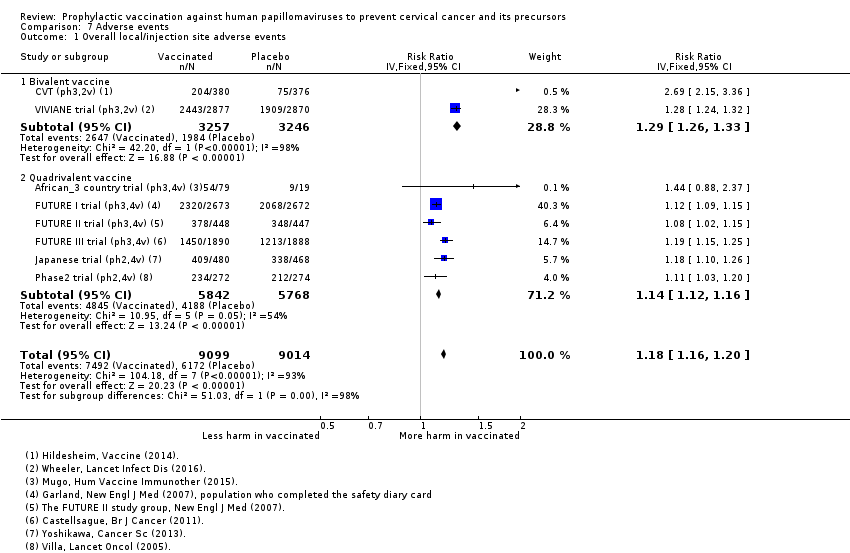
Comparison 7 Adverse events, Outcome 1 Overall local/injection site adverse events.
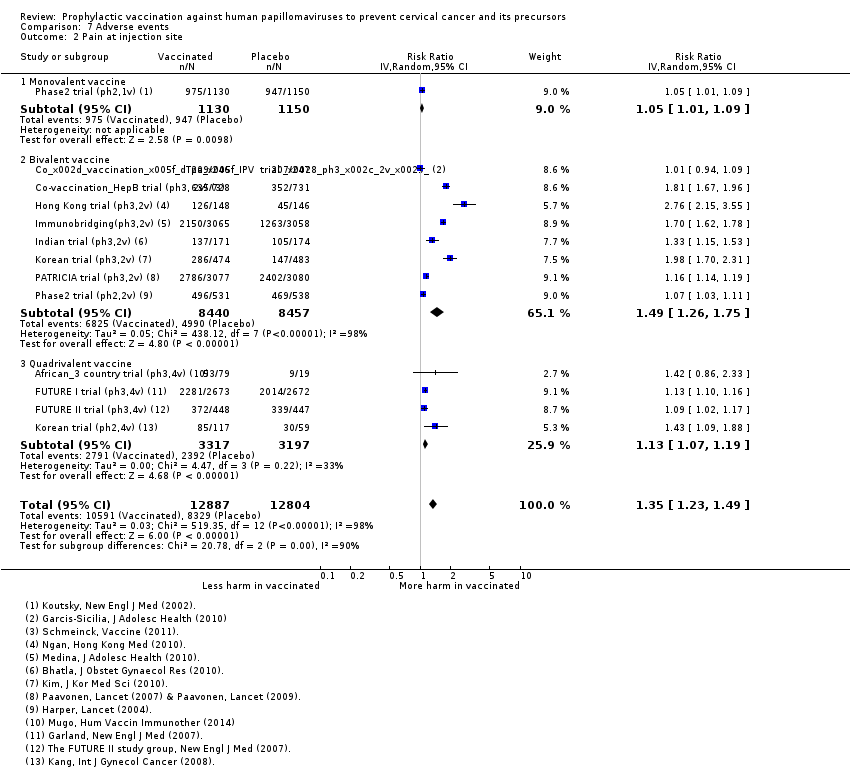
Comparison 7 Adverse events, Outcome 2 Pain at injection site.

Comparison 7 Adverse events, Outcome 3 Swelling at injection site.

Comparison 7 Adverse events, Outcome 4 Redness at injection site.
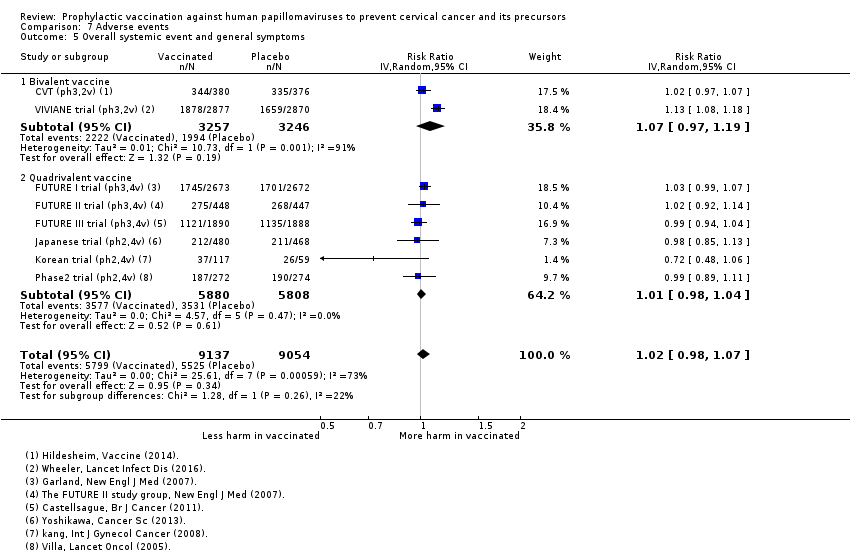
Comparison 7 Adverse events, Outcome 5 Overall systemic event and general symptoms.

Comparison 7 Adverse events, Outcome 6 Serious adverse events.

Comparison 7 Adverse events, Outcome 7 Deaths.
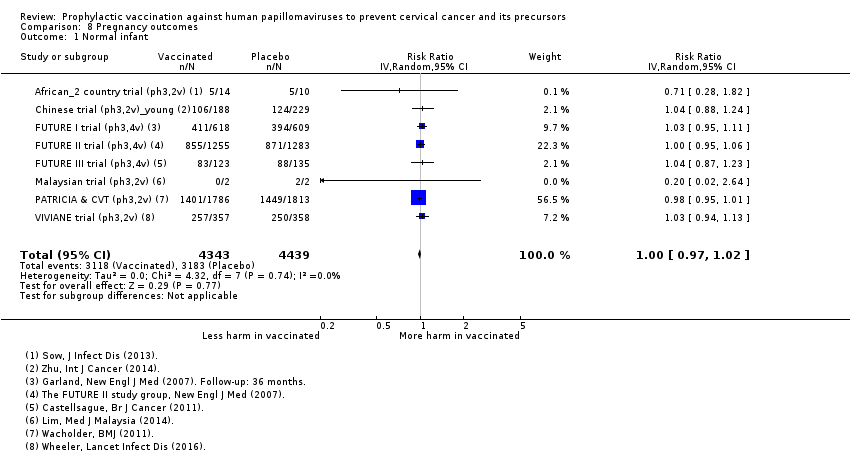
Comparison 8 Pregnancy outcomes, Outcome 1 Normal infant.
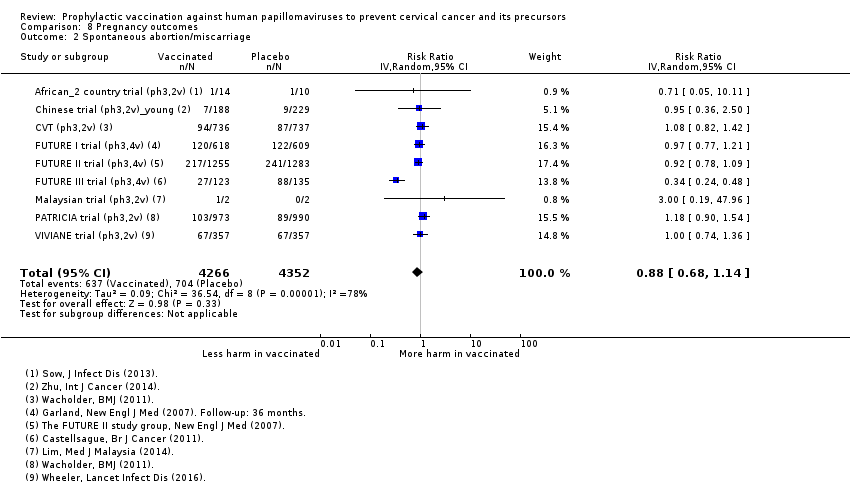
Comparison 8 Pregnancy outcomes, Outcome 2 Spontaneous abortion/miscarriage.

Comparison 8 Pregnancy outcomes, Outcome 3 Elective termination/induced abortion.

Comparison 8 Pregnancy outcomes, Outcome 4 Stillbirth.
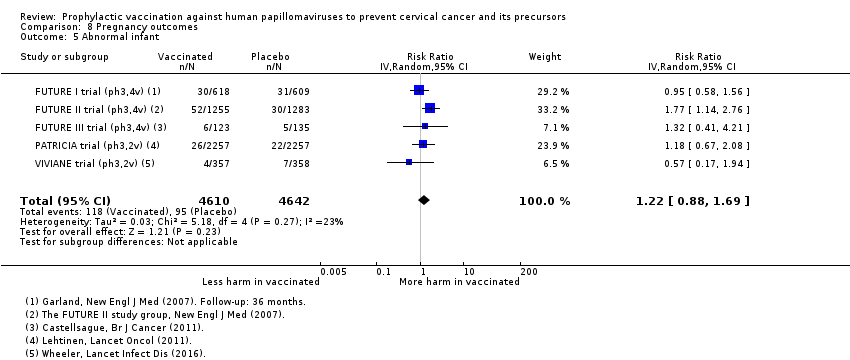
Comparison 8 Pregnancy outcomes, Outcome 5 Abnormal infant.
| HPV vaccine effects on cervical lesions in adolescent girls and women who are hrHPV DNA negative at baseline | ||||||
| Patient or population: adolescent girls and women aged 15 to 26 years who are hrHPV negative before vaccination Setting: Europe, Asia Pacific countries, South & North America Comparison: Placebo | ||||||
| Outcomes | Anticipated absolute effects* (95% CI) | Relative effect | № of participants | Certainty of the evidence | Comments | |
| Risk with placebo | Risk with HPV vaccination1 | |||||
| Cervical cancer ‐ not measured | ‐ | ‐ | ‐ | ‐ | ‐ | |
| CIN2+ associated with HPV16/18. Follow‐up: 3 to 5 years | 164 per 10,000 | 2 per 10,000 | RR 0.01 | 23,676 | ⊕⊕⊕⊕ | |
| CIN3+ associated with HPV16/18 Follow‐up: 3 to 5 years | 70 per 10,000 | 0 per 10,000 | RR 0.01 | 20,214 | ⊕⊕⊕⊕ | Continuity correction |
| AIS associated with HPV16/18 Follow‐up: 3 to 5 years | 9 per 10,000 | 0 per 10,000 | RR 0.10 | 20,214 | ⊕⊕⊕⊝ | Continuity correction |
| Any CIN2+ irrespective of HPV type, bivalent or quadrivalent vaccine Follow‐up: 2 to 6 years | 287 per 10,000 | 106 per 10,000 | RR 0.37 | 25,180 | ⊕⊕⊕⊕ | Substantial subgroup heterogeneity was observed (I2= 84.3%) for bi‐ and quadrivalent vaccines. So results are reported separately for the 2 vaccines (see next 2 rows). |
| Any CIN2+ irrespective of HPV type Follow‐up (bivalent): 3.5 to 6 years Follow‐up (quadrivalent): 3.5 years | Bivalent vaccine | RR 0.33 (0.25 to 0.43) | 15,884 (4 RCTs) | ⊕⊕⊕⊕ | ||
| 285 per 10,000 | 94 per 10,000 (71 to 122) | |||||
| Quadrivalent vaccine | RR 0.57 (0.44 to 0.76) | 9296 (1 RCT) | ⊕⊕⊕⊝ | |||
| 291 per 10,000 | 166 per 10,000 (128 to 221) | |||||
| Any CIN3+ irrespective of HPV type, bivalent or quadrivalent vaccine Follow‐up: 3.5 to 4 years | 109 per 10,000 | 23 per 10,000 | RR 0.21 | 20,719 | ⊕⊕⊕⊝ | Substantial subgroup heterogeneity was observed (I2 = 84.3%) for bi‐ and quadrivalent vaccines. So results are reported separately for the 2 vaccines (see next 2 rows). |
| Any CIN3+ irrespective of HPV type Follow‐up (bivalent): 4 years Follow‐up (quadrivalent): 3.5 years | Bivalent vaccine | RR 0.08 (0.03 to 0.23) | 11,423 (2 RCTs) | ⊕⊕⊕⊕ | ||
| 81 per 10,000 | 6 per 10,000 (3 to 19) | |||||
| Quadrivalent vaccine | RR 0.54 (0.36 to 0.82) | 9296 (1 RCT) | ⊕⊕⊕⊝ | |||
| 143 per 10,000 | 77 per 10,000 (51 to 117 ) | |||||
| Any AIS irrespective of HPV type | 10 per 10,000 | 0 per 10,000 | RR 0.10 | 20,214 | ⊕⊕⊕⊝ | Continuity correction |
| 1The risk in the intervention group (and its 95% confidence interval) is based on the assumed risk in the comparison group and the relative effect of the intervention (and its 95% CI). When risk in vaccine group is zero, the 95% CI is computed using an exact binomial method. | ||||||
| GRADE Working Group grades of evidence | ||||||
| 1 Assumed risk calculated from the sum of control group event rates. 2 Downgraded due to serious imprecision in effect estimate (width 95% CI around RR > 0.6). 3 Downgraded one level due to serious imprecision. Few events observed in the two studies (9 in placebo arms and 0 in vaccination arms for the outcome of AIS HPV16/18 and 7 in placebo arms and 0 in vaccination arms for outcome of AIS of any type). | ||||||
| HPV vaccine effects on cervical lesions in adolescent girls and women negative for HPV16/18 DNA at baseline | ||||||
| Patient or population: adolescent girls and women aged 15 to 45 years who were HPV16/18 negative before vaccination | ||||||
| Outcomes | Anticipated absolute effects* (95% CI) | Relative effect | № of participants | Certainty of the evidence | Comments | |
| Risk with placebo | Risk with HPV vaccination1 | |||||
| Cervical cancer ‐ not measured | ‐ | ‐ | ‐ | ‐ | ‐ | |
| CIN2+ associated with HPV16/18 Follow‐up (age 15 to 26 years): 1 to 8.5 years Follow‐up (age 24 to 45 years): 4 to 6 years | 15 to 26 years | RR 0.05 | 34,478 | ⊕⊕⊕⊕ | ||
| 113 per 10,000 | 6 per 10,000 | |||||
| 24 to 45 years | RR 0.30 (0.11 to 0.81) | 7552 (2 RCTs) | ⊕⊕⊕⊝ MODERATE 2 | |||
| 45 per 10,000 | 14 per 10,000 (5 to 37) | |||||
| CIN3+ associated with HPV16/18 (age 15 to 26 years) Follow‐up: 3 years | 57 per 10,000 | 3 per 10,000 (1 to 8) | RR 0.05 (0.02 to 0.14) | 33,199 (3 studies) | ⊕⊕⊕⊕ | |
| AIS associated with HPV16/18 or 6/11/16/18 (age 15 to 26 years) Follow‐up: 3 years | 12 per 10,000 | 0 per 10,000 | RR 0.09 | 17,079 | ⊕⊕⊕⊝ MODERATE 2 | Continuity correction |
| Any CIN2+ irrespective of HPV type (age 15 to 26 years) Follow‐up: 2 to 6.5 years | 231 per 10,000 | 95 per 10,000 | RR 0.41 | 19,143 | ⊕⊕⊕⊕ | |
| Any CIN3+ irrespective of HPV type ‐ not measured | ‐ | ‐ | ‐ | ‐ | ‐ | |
| Any AIS irrespective of HPV type ‐ not measured | ‐ | ‐ | ||||
| 1The risk in the intervention group (and its 95% confidence interval) is based on the assumed risk in the comparison group and the relative effect of the intervention (and its 95% CI). Exception: when risk in vaccine group is zero, the 95% CI is computed using an exact binomial method.. | ||||||
| GRADE Working Group grades of evidence | ||||||
| 1 Assumed risk calculated from the sum of control group event rates. 2 Downgraded due to serious imprecision in effect estimate (width 95% CI around RR > 0.6). | ||||||
| HPV vaccine effects on cervical lesions in adolescent girls and women unselected for HPV DNA status at baseline | ||||||
| Patient or population: adolescent girls and women aged 15 to 45 years regardless of HPV DNA status at baseline | ||||||
| Outcomes | Anticipated absolute effects* (95% CI) | Relative effect | № of participants | Certainty of the evidence | Comments | |
| Risk with placebo | Risk with HPV vaccination1 | |||||
| Cervical cancer ‐ not measured | ‐ | ‐ | ‐ | ‐ | ‐ | |
| CIN2+ associated with HPV16/18 Follow‐up (age 15 to 26 years): 3.5 to 8.5 years Follow‐up (age 24 to 45 years): 3.5 years | 15 to 26 years | RR 0.46 (0.37 to 0.57 | 34,852 | ⊕⊕⊕⊕ | ||
| 341 per 10,000 | 157 per 10,000 | |||||
| 24 to 45 years | RR 0.74 (0.52 to 1.05) | 9200 (2 studies) | ⊕⊕⊕⊝ | |||
| 145 per 10,000 | 107 per 10,000 (76 to 152) | |||||
| CIN3+ associated with HPV16/18 Follow‐up: 3.5 years | 165 per 10,000 | 91 per 10,000 (74 to 127) | RR 0.55 (0.45 to 0.67) | 34,562 (2 RCTs) | ⊕⊕⊕⊕ | |
| Adeno carcinoma in situ (AIS) associated with HPV16/18 Follow‐up: 3.5 years | 14 per 10,000 | 5 per 10,000 | RR 0.36 | 34,562 | ⊕⊕⊕⊕ | |
| Any CIN2+ irrespective of HPV type Follow‐up (age 15 to 26 years): 3.5 to 8.5 years Follow‐up (age 24 to 45 years): 3.5 to 6 years | 15 to 26 years | RR 0.70 | 35,779 | ⊕⊕⊕⊕ | ||
| 559 per 10,000 | 391 per 10,000 | |||||
| 24 to 45 years | RR 1.04 | 9287 | ⊕⊕⊕⊝ | |||
| 343 per 10,000 | 356 per 10,000 | |||||
| Any CIN3+ irrespective of HPV type (age 15 to 26 years) Follow‐up: 3.5 to 4 years | 266 per 10,000 | 178 per 10,000 (231 to 247) | RR 0.67 (0.49 to 0.93) | 35,489 (3 RCTs) | ⊕⊕⊕⊝ | Substantial subgroup heterogeneity was observed (I2 = 84.3%) for bivalent and quadrivalent vaccines. So results are reported separately for two vaccines. |
| Any CIN3+ irrespective of HPV type (age 15 to 26 years), Follow‐up (bivalent): 3.5 to 4 years Follow‐up (quadrivalent): 3.5 years | Bivalent vaccine | RR 0.55 (0.43 to 0.71) | 18,329 (2 RCTs) | ⊕⊕⊕⊕ | ||
| 188 per 10,000 | 104 per 10,000 (81 to 134) | |||||
| Quadrivalent vaccine | 0.81 (0.69 to 0.96) | 17,160 (1 RCT) | ⊕⊕⊕⊝ | |||
| 349 per 10,000 | 283 per 10,000 (241 to 335) | |||||
| Any AIS irrespective of HPV type (age 15 to 26 years) Follow‐up: 3.5 years | 17 per 10,000 | 5 per 10,000 | RR 0.32 | 34,562 | ⊕⊕⊕⊕ | |
| Serious adverse events Follow‐up: 6 months to 7 years | 669 per 10,000 | 656 per 10,000 | RR 0.98 | 71,597 | ⊕⊕⊕⊕ | |
| Deaths Follow‐up: 7 months to 10 years. Most of the information in the analysis comes from studies with follow‐up ranging from 5‐10 years. | 11 per 10,000 | 14 per 10,000 | RR 1.29 | 71,176 | ⊕⊕⊝⊝ | Older women had higher fatality rate (RR 2.36, 95% CI 1.10 to 5.03). Assessment of the deaths in the studies has not been able to identify a pattern in the cause or timing of death. |
| *The risk in the intervention group (and its 95% confidence interval) is based on the assumed risk in the comparison group and the relative effect of the intervention (and its 95% CI). | ||||||
| GRADE Working Group grades of evidence | ||||||
| 1 Assumed risk calculated from the sum of control group event rates for all outcomes unless otherwise stated. 2 Downgraded due to serious imprecision. Confidence interval is wide and includes large decrease and small increase in lesions with vaccination group in the older age group. 3 Downgraded one level due to serious inconsistency. Reduction in lesions was greater in younger women than in older women (RR 0.46 in 15 to 26 years versus RR 0.74 in 24 to 45 years; P = 0.02 for interaction). 4 Downgraded one level due to serious imprecision. Confidence interval includes potentially meaningful increase in risk of mortality. 5 Downgraded one level due to serious inconsistency. Despite limited evidence of statistical variation, sub grouping studies by age showed higher fatality rate with vaccines in older age group. There is no clear pattern in causes or timing of deaths. | ||||||
| HPV vaccine adverse pregnancy outcomes (regardless of DNA status and age) | ||||||
| Patient or population: adolescent girls and women aged 15 to 45 years who became pregnant during the study | ||||||
| Outcomes | Anticipated absolute effects* (95% CI) | Relative effect | № of participants | Certainty of the evidence | Comments | |
| Risk with placebo | Risk with HPV vaccines | |||||
| Spontaneous abortion/miscarriage Follow‐up: 1 to 7 years | Study population | RR 0.88 | 8618 | ⊕⊕⊕⊕ | ||
| 1618 per 10,000 | 1,424 per 10,000 | |||||
| Elective termination/induced abortion Follow‐up: 1 to 7 years | Study population | RR 0.90 | 10,909 | ⊕⊕⊕⊕ | ||
| 931 per 10,000 | 838 per 10,000 | |||||
| Stillbirth Follow‐up: 1 to 3.5 years | Study population | RR 1.12 | 8754 | ⊕⊕⊕⊝ | ||
| 70 per 10,000 | 78 per 10,000 | |||||
| Babies born with congenital malformations Follow‐up: 3 to 7 years | Study population | RR 1.22 | 9252 | ⊕⊕⊕⊝ | ||
| 205 per 10,000 | 250 per 10,000 | |||||
| *The risk in the intervention group (and its 95% confidence interval) is based on the assumed risk in the comparison group and the relative effect of the intervention (and its 95% CI). | ||||||
| GRADE Working Group grades of evidence | ||||||
| 1 Confidence interval rules out an increased risk of termination so there is no downgrade for imprecision. 2 Downgraded one level due to serious imprecision. Confidence intervals for both outcomes include meaningful increase and reduction in risk of stillbirth or abnormal infants following vaccination. | ||||||
| Valency | Phase | Number of trials | Appelation | N | Outcomes | Main References |
| Monovalent | II | 1 | 2392 | Efficacy, safety | ||
| Bivalent | II | 2 | 1040 | Efficacy, safety | ||
| 1113 | Efficacy, safety | |||||
| III | 16 | 676 | Safety | |||
| 6051 | Efficacy, safety | |||||
| 750 | Safety | |||||
| 1212 | Safety | |||||
| 494 | Safety | |||||
| 494 | Safety | |||||
| 541 | Safety | |||||
| 7466 | Efficacy, safety | |||||
| 294 | Safety | |||||
| 2067 | Safety | |||||
| 354 | Safety | |||||
| 208 | Safety | |||||
| 321 | Safety | |||||
| 271 | Safety | |||||
| 18,644 | Efficacy, safety | |||||
| 5752 | Efficay, safety, | |||||
| Quadrivalent | II | 3 | 1021 | Safety | ||
| 176 | Safety | |||||
| 552 | Efficacy, safety | |||||
| III | 4 | 98 | Safety | |||
| 5455 | Efficacy, safety | |||||
| 12,167 | Efficacy, safety | |||||
| 3819 | Efficacy, safety | |||||
| Total | 26 | 73,428 |
| Outcomes and exposure subgroups | Absolute risk / per 10,000 | Relative risk | Vaccine efficacy (95% CI) | Risk difference/ per 10,000 (95% CI) | No of Participants | Certainty of evidence | |
| Placebo | Vaccinated | ||||||
| 1. High‐grade cervical lesions in women who were hrHPV DNA negative at baseline | |||||||
| Analysis 1.1 CIN2+ associated with HPV16/18, at least 1 dose, age 15‐26 years | 164 | 2 | 0.01 (0.00 to 0.05) | 99% (95% to 100%) | 162 (157 to 164) | 23,676 | ⊕⊕⊕⊕ high |
| Analysis 1.2 CIN2+ associated with HPV6/11/16/18, at least 1 dose, age 15‐26 years | 197 | 2 | 0.01 (0.00 to 0.09) | 99% (91% to 100%) | 195 (179 to 197) | 9296 (1 study) | ⊕⊕⊕⊝ |
| Analysis 1.3 CIN3+ associated with HPV16/18, at least 1 dose, age 15‐26 years | 70 | 0* | 0.01 (0.00 to 0.10) | 99% (90% to 100%) | 70 (63 to 70) | 20,214 (2 studies) | ⊕⊕⊕⊕ high |
| Analysis 1.4 CIN3+ associated with HPV6/11/16/18, at least 1 dose, age 15‐26 years | 94 | 0* | 0.01 (0.00 to 0.18) | 99% (82% to 100%) | 94 (77 to 94) | 9296 (1 study) | ⊕⊕⊕⊝ |
| Analysis 1.5 AIS associated with HPV16/18, at least 1 dose, age 15‐26 years | 9 | 0* | 0.10 (0.01 to 0.82) | 90% (18% to 99%) | 9 (2 to 9) | 20,214 | ⊕⊕⊕⊝ |
| Analysis 1.6 AIS associated with HPV6/11/16/18m at least 1 dose, age 15‐26 years | 6 | 0* | 0.14 (0.01 to 2.8) | 86% (‐180% to 99%) | 6 (‐12 to 6) | 9296 (1 study) | ⊕⊕⊕⊝ |
| Analysis 1.7.1 Any CIN2+ irrespective of HPV types, at least 1 dose of the bivalent vaccine, age 15‐26 years | 285 | 94 | 0.33 (0.25 to 0.43) | 67% (57% to 75%) | 191 (163 to 214) | 15,884 (4 studies) | ⊕⊕⊕⊕ high |
| Analysis 1.7.2 Any CIN2+ irrespective of HPV types, at least 1 dose of the quadrivalent vaccine, age 15‐26 years | 291 | 166 | 0.57 (0.44 to 0.76) | 43% (24 to 56%) | 125 (70 to 163) | 9296 (1 study) | ⊕⊕⊕⊝ |
| Analysis 1.8.1 Any CIN3+ irrespective of HPV types, at least 1 dose of the bivalent vaccine, age 15‐26 years | 81 | 6 | 0.08 (0.03 to 0.23) | 92% (77% to 97%) | 74 (62 to 78) | 11,423 (2 studies) | ⊕⊕⊕⊕ |
| Analysis 1.8.2 Any CIN3+ irrespective of HPV types, at least 1 dose of the quadrivalent vaccine, age 15‐26 years | 143 | 77 | 0.54 (0.36 to 0.82) | 46% (17% to 64%) | 66 (26 to 92) | 9296 (1 study) | ⊕⊕⊕⊝ |
| Analysis 1.9 Any AIS irrespective of HPV types, at least 1 dose | 10 | 0* | 0.10 (0.01 to 0.76) | 90% (24% to 99%) | 10 (2 to 10) | 20,214 | ⊕⊕⊕⊝ |
| 2. High‐grade cervical lesions in women who were HPV16/18 negative at baseline | |||||||
| Analysis 2.1.1 CIN2+ associated with HPV16/18, 3 doses, age 15‐26 years | 74 | 5 | 0.07 (0.03 to 0.15) | 93% (85% to 97%) | 69 (63 to 72) | 36,579 (6 studies) | ⊕⊕⊕⊕ high |
| Analysis 2.1.2 CIN2+ associated with HPV16/18, 3 doses, 24‐45 years | 36 | 6 | 0.16 (0.04 to 0.74) | 84% (26% to 96%) | 30 (9 to 34) | 6797 (2 studies) | ⊕⊕⊕⊝ |
| Analysis 2.2.1 CIN2+ associated with HPV16/18, at least 1 dose, 15‐26 years | 113 | 6 | 0.05 (0.03 to 0.10) | 95% (90% to 97%) | 107 (102 to 110) | 34,478 (6 studies) | ⊕⊕⊕⊕ high |
| Analysis 2.2.2 CIN2+ associated with HPV16/18, at least 1 dose, age 24‐45 years | 45 | 14 | 0.30 (0.11 to 0.81) | 70% (19% to 89%) | 32 (9 to 40) | 7552 (2 studies) | ⊕⊕⊕⊝ |
| Analysis 2.3.1 CIN2+ associated with HPV16/18, 1 or 2 doses, 15‐26 years*** | 436 | 44 | 0.10 (0.04 to 0.26) | 90% (74% to 96%) | 392 (323 to 418) | 2958 (5 studies) | ⊕⊕⊝⊝ low1$ |
| Analysis 2.3.2 CIN2+ associated with HPV16/18, 1 or 2 doses, age 24‐45 years*** | 134 | 82 | 0.61 (0.14 to 2.67) | 39% (‐167% to 86%) | 52 (‐2245 to 115) | 755 (2 studies) | ⊕⊝⊝⊝ |
| Analysis 2.4 CIN2+ associated with HPV6/11/16/18, 3 doses, age 15‐45 years | 99 | 6 | 0.06 (0.01 to 0.61) | 94% (39% to 99%) | 93 (39 to 98) | 7664 (2 studies) | ⊕⊕⊕⊝ |
| Analysis 2.4.1 CIN2+ associated with HPV6/11/16/18, 3 doses, age 15‐26 years | 142 | 0* | 0.02 (0.00 to 0.25) | 98% (75% to 100%) | 142 (93 to 190) | 4499 (1 study) | ⊕⊕⊕⊝ |
| Analysis 2.4.2 CIN2+ associated with HPV6/11/16/18, 3 doses, age 24‐45 years | 38 | 6 | 0.17 (0.02 to 1.39) | 83% (‐39% to 98%) | 32 (‐1 to 32) | 3165 (1 study) | ⊕⊕⊝⊝ |
| Analysis 2.5.1 CIN2+ associated with HPV6/11/16/18, at least 1 dose, age 15‐26 years | 160 | 0* | 0.01 (0.00 to 0.19) | 99% (81% to 100%) | 160 (130 to 159) | 5351 (1 study) | ⊕⊕⊕⊝ |
| Analysis 2.5.2 CIN2+ associated with HPV6/11/16/18, at least 1 dose, age 24‐45 years | 44 | 16 | 0.37 (0.10 to 1.41) | 63% (‐41% to 90%) | 28 (‐18 to 40) | 3629 (1 study) | ⊕⊕⊕⊝ |
| Analysis 2.6 CIN2+ associated with HPV6/11/16/18, 1 or 2 doses, age 15‐45 years*** | 199 | 48 | 0.24 (0.01 to 5) | 76% (‐400% to 99%) | 151 (‐795 to 197) | 1316 (2 studies) | ⊕⊝⊝⊝ |
| Analysis 2.6.1 CIN2+ associated with HPV6/11/16/18, 1 or 2 doses, age 15‐26 years*** | 258 | 0* | 0.04 (0.00 to 0.74) | 96% (26% to 100%)) | 258 (108 to 409) | 852 (1 study) | ⊕⊝⊝⊝ |
| Analysis 2.6.2 CIN2+ associated with HPV6/11/16/18, 1 or 2 doses, age 24‐45 years*** | 88 | 85 | 0.97 (0.14 to 6.80) | 3% (‐580% to 86%) | 3 (‐165 to 171) | 464 (1 study) | ⊕⊝⊝⊝ |
| Analysis 2.7 CIN3+ associated with HPV16/18, 3 doses, age 15‐26 years | 40 | 3 | 0.07 (0.02 to 0.29) | 93% (71% to 98%) | 37 (28 to 39) | 29,720 (3 studies) | ⊕⊕⊕⊕ |
| Analysis 2.8 CIN3+ associated with HPV16/18, at least 1 dose, age 15‐26 years | 57 | 3 | 0.05 (0.02 to 0.14) | 95% (86% to 98%) | 54 (49 to 56) | 33,199 (3 studies) | ⊕⊕⊕⊕ high |
| Analysis 2.9 CIN3+ associated with HPV16/18, 1 or 2 doses, age 15‐26 years*** | 200 | 12 | 0.06 (0.01 to 0.24) | 94% (26% to 100%) | 188 (152 to 198) | 3479 (3 studies) | ⊕⊕⊝⊝ low1$ |
| Analysis 2.10 AIS+ associated with HPV16/18, 3 doses, age 15‐26 years | 8 | 0* | 0.12 (0.02 to 0.70) | 88% (36% to 99%) | 8 (2 to 8) | 29,707 (3 studies) | ⊕⊕⊕⊝ |
| Analysis 2.11 AIS+ associated with HPV16/18, at least 1 dose, age 15‐26 years | 12 | 0* | 0.09 (0.01 to 0.72) | 81% (28% to 99%) | 12 (3 to 12) | 17,079 (2 studies) | ⊕⊕⊕⊝ |
| Analysis 2.12 AIS+ associated with HPV16/18 or HPV6/11/16/18, 1 or 2 doses, age 15‐26 years*** | 29 | 0* | 0.15 (0.01 to 2.97) | 85% (‐197% to 99%) | 29 (‐57 to 29) | 2015 (2 studies) | ⊕⊝⊝⊝ |
| Analysis 2.13 CIN2+ irrespective of HPV types, 3 doses, age 15‐26 years | 166 | 66 | 0.40 (0.25 to 0.64) | 60% (36% to 75%) | 99 (60 to 124) | 7320 (3 studies) | ⊕⊕⊕⊕ high |
| Analysis 2.14 CIN2+ irrespective of HPV types, at least 1 dose, age 15‐26 years | 231 | 95 | 0.41 (0.32 to 0.52) | 58% (46% to 67%) | 136 (111 to 157) | 19,143 (3 studies) | ⊕⊕⊕⊕ high |
| Analysis 2.15 CIN2+ irrespective of HPV types, 1 or 2 doses, age 20‐25 years*** | 1000 | 710 | 0.71 (0.15 to 3.38) | 29% (‐238% to 85%) | 290 (‐2,380 to 850) | 34 (1 study) | ⊕⊝⊝⊝ |
| 3. High‐grade cervical lesions in all women regardless of HPV DNA status at baseline** | |||||||
| Analysis 3.1.1 CIN2+ associated with HPV16/18, at least 1 dose, age 15‐26 years | 341 | 157 | 0.46 (0.37 to 0.57) | 54% (43% to 63%) | 184 (147 to 215) | 34,852 | ⊕⊕⊕⊕ high |
| Analysis 3.1.2 CIN2+ associated with HPV16/18, at least 1 dose, age 24‐45 years | 157 | 116 | 0.74 (0.52 to 1.05) | 26% (‐5% to 48%) | 41 (‐8 to 75) | 9200 (2 studies) | ⊕⊕⊕⊝ moderate4 |
| Analysis 3.2.1 CIN2+ associated with HPV6/11/16/18, at least 1 dose, age 15‐26 years | 436 | 217 | 0.50 (0.42 to 0.59) | 50% (41% to 58%) | 219 (166 to 272) | 17,160 (1 study) | ⊕⊕⊕⊝ |
| Analysis 3.2.2 CIN2+ associated with HPV6/11/16/18, at least 1 dose, age 24‐45 years | 145 | 113 | 0.78 (0.44 to 1.37) | 22% (‐37% to 56%) | 143 (72 to 204 | 3723 (1 study) | ⊕⊕⊕⊝ |
| Analysis 3.3 CIN3+ associated with HPV16/18, at least 1 dose, age 15‐26 years | 165 | 91 | 0.55 (0.43 to 0.68) | 74% (55% to 91%) | 74 (55 to 91) | 34,562 | ⊕⊕⊕⊕ high |
| Analysis 3.4 CIN3+ associated with HPV16/18, 1 or 2 doses, age 15‐26 years*** | 230 | 124 | 0.54 (0.43 to 0.68) | 46% (32% to 57%) | 106 (74 to 131) | 17,160 (1 study) | ⊕⊕⊝⊝ |
| Analysis 3.5 AIS associated with HPV16/18, at least 1 dose, age 15‐26 years | 14 | 5 | 0.36 (0.17 to 0.78) | 64% (22% to 83%) | 9 (3 to 12) | 34,562 | ⊕⊕⊕⊕ high |
| Analysis 3.6 AIS associated with HPV6/11/16/18, at least 1 dose, age 15‐45 years | 15 | 6 | 0.40 (0.16 to 0.98) | 60% (2% to 84%) | 9 (0 to 13) | 20,830 (1 study) | ⊕⊕⊕⊝ |
| Analysis 3.7.1 Any CIN2+ irrespective of HPV types, at least 1 dose, age 15‐26 years | 559 | 391 | 0.70 (0.58 to 0.85) | 30% (15% to 42%) | 168 (84 to 235) | 35,779 | ⊕⊕⊕⊕ high |
| Analysis 3.7 2 Any CIN2+ irrespective of HPV types, at least 1 dose, age 24‐45 years | 342 | 356 | 1.04 (0.83 to 1.30) | ‐4% (‐30% to 17%) | ‐14 (‐103 to 58) | 9287 (2 studies) | ⊕⊕⊝⊝ |
| Analysis 3.8 Any CIN3+ irrespective of HPV types, at least 1 dose, age 18‐26 years, bivalent vaccine | 188 | 103 | 0.55 (0.43 to 0.71) | 45% (29% to 57%) | 84 (54 to 1107) | 18,329 (2 studies) | ⊕⊕⊕⊕ high |
| Analysis 3.8 Any CIN3+ irrespective of HPV types, at least 1 dose, age 15‐26 years, quadrivalent vaccine | 349 | 283 | 0.81 (0.69 to 0.96) | 19% (4% to 31%) | 66 (14 to 108) | 17,160 (1 study) | ⊕⊕⊕⊝ |
| Analysis 3.9 Any AIS irrespective of HPV types, at least 1 dose, age 15‐26 years | 17 | 5 | 0.32 (0.15 to 0.67) | 68% (33% to 0.85%) | 11 (6 to 14) | 34,562 | ⊕⊕⊕⊕ high |
| 4. HPV16/18 infection in women who were hrHPV DNA negative at baseline | |||||||
| Analysis 4.1 Incident HPV16/18 infection, 3 doses, age 18‐26 years | 2,457 | 147 | 0.06 (0.02 to 0.20) | 94% (80% to 98%) | 2,310 (1,966 to 2,408) | 368 (1 study) | ⊕⊕⊕⊝ |
| Analysis 4.2 Persistent HPV16/18 infection(6M), 3 doses, age 15‐26 years | 971 | 29 | 0.02 (0.00 to 0.35) | 97% (57% to 100%) | 942 (554 to 971) | 368 (1 study) | ⊕⊕⊕⊝ |
| Analysis 4.3 Persistent HPV16/18 infection(6M), at least 1 dose, age 18‐25 years | 96 | 7 | 0.07 (0.05 to 0.09) | 93% (81% to 95%) | 90 (88 to 91) | 10,826 (1 study) | ⊕⊕⊕⊝ |
| Analysis 4.4 Persistent HPV16/18 infection(12M), 3 doses, age 15‐26 years | 571 | 23 | 0.04 (0.00 to 0.73) | 96% (27% to 100%) | 549 (154 to 571) | 368 (1 study) | ⊕⊕⊕⊝ |
| Analysis 4.5 Persistent HPV16/18 infection(12M), at least 1 dose, age 15‐26 years | 462 | 37 | 0.08 (0.05 to 0.12) | 92% (88% to 95%) | 425 (406 to 439) | 14,153 ( 2 studies) | ⊕⊕⊕⊕ high |
| 5. HPV16/18 infection in women who were HPV16/18 negative at baseline | |||||||
| Analysis 5.1 Incident HPV16/18 infection, 3 doses, age 15‐26 years | 474 | 81 | 0.17 (0.10 to 0.31) | 87% (78% to 92%) | 412 (369 to 436) | 8,034 (4 studies) | ⊕⊕⊕⊕ high |
| Analysis 5.2 Incident HPV16/18 infection, at least 1 dose, age 15‐26 years | 1,326 | 305 | 0.23 (0.14 to 0.37) | 81% (71% to 88%) | 1,074 (941 to 1,167) | 23,872 (5 studies) | ⊕⊕⊕⊕ high |
| Analysis 5.3 Incident HPV16/18 infection, 1 or 2 dose, age 15‐26 years*** | 2,568 | 1207 | 0.47 (0.26 to 0.84) | 74% (31% to 90%) | 1,901 (796 to 2,311) | 331 (3 studies) | ⊕⊕⊕⊝ moderate1 |
| Analysis 5.4.1 Persistent HPV16/18 infection (6M), 3 doses, age 15‐26 years | 581 | 35 | 0.06 (0.05 to 0.08) | 94% (91% to 95%) | 546 (534 to 552) | 27,385 (6 studies) | ⊕⊕⊕⊕ high |
| Analysis 5.4.2 Persistent HPV16/18 infection (6M), 3 doses, age 24‐45 years | 350 | 38 | 0.11 (0.06 to 0.20) | 89% (80% to 94%) | 311 (280 to 329) | 6728 (2 studies) | ⊕⊕⊕⊝ |
| Analysis 5.5.1 Persistent HPV16/18 infection (6M), at least 1 dose, age 15‐26 years | 657 | 66 | 0.10 (0.08 to 0.13) | 90% (87% to 92%) | 591 (572 to 605) | 22,803 (4 studies) | ⊕⊕⊕⊕ high |
| Analysis 5.5.2 Persistent HPV16/18 infection (6M), at least 1 dose, age 24‐45 years | 441 | 75 | 0.17 (0.10 to 0.29) | 83% (71% to 90%) | 366 (313 to 397) | 7520 (2 studies) | ⊕⊕⊕⊕ high |
| Analysis 5.6.1 Persistent HPV16/18 infection (6M), 1 or 2 doses, age 15‐26 years*** | 996 | 119 | 0.12 (0.03 to 0.42) | 88% (58% to 97%) | 876 (577 to 966) | 437 (2 studies) | ⊕⊕⊝⊝ |
| Analysis 5.6.2 Persistent HPV16/18 infection (6M), 1 or 2 doses, age 24‐45 years*** | 1,221 | 379 | 0.31 (0.18 to 0.54) | 69% (46% to 82%) | 843 (562 to 1002) | 792 (2 studies) | ⊕⊕⊕⊝ moderate1 |
| Analysis 5.7 Persistent HPV6/11/16/18 infection (6M), 3 doses | 518 | 62 | 0.12 (0.06 to 0.21) | 88% (79% to 94%) | 456 (409 to 487) | 4008 (2 studies) | ⊕⊕⊕⊕ high |
| Analysis 5.8 Persistent HPV6/11/16/18 infection (6M), at least 1 dose | 907 | 118 | 0.13 (0.05 to 0.37) | 87% (63% to 95%) | 789 (571 to 862) | 4129 (2 studies) | ⊕⊕⊕⊕ high |
| Analysis 5.9 Persistent HPV16/18 infection (12M), 3 doses | 297 | 27 | 0.09 (0.06 to 0.13) | 91% (87% to 94%) | 270 (258 to 279) | 22,267 (4 studies) | ⊕⊕⊕⊕ high |
| Analysis 5.10 Persistent HPV16/18 infection (12M), at least 1 dose | 365 | 58 | 0.16 (0.01 to 0.13) | 84% (87% to 99%) | 306 (292 to 361) | 29,464 (5 studies) | ⊕⊕⊕⊕ high |
| Analysis 5.11 Persistent HPV16/18 infection (12M), 1 or 2 doses*** | 205 | 27 | 0.13 (0.06 to 0.33) | 87% (67% to 94%) | 178 (137 to 193) | 3912 (3 studies) | ⊕⊕⊕⊝ moderate1 |
| 6. HPV16/18 infection regardless of HPV DNA status at baseline** | |||||||
| Analysis 6.1 Incident HPV16/18 infection, at least 1 dose, age 15‐26 years | 807 | 194 | 0.24 (0.17 to 0.33) | 76% (67% to 83%) | 613 (541 to 670) | 4210 (1 study) | ⊕⊕⊕⊝ |
| Analysis 6.2.1 Persistent HPV16/18 infection (6M), at least 1 dose, age 15‐26 years | 1,359 | 598 | 0.44 (0.38 to 0.51) | 56% (49% to 62%) | 761 (666 to 842) | 25,199 (2 studies) | ⊕⊕⊕⊕ high |
| Analysis 6.2.2 Persistent HPV16/18 infection (6M), at least 1 dose, age 24‐45 years | 642 | 366 | 0.57 (0.47 to 0.69) | 43% (31% to 53%) | 276 (199 to 341) | 8648 (2 studies) | ⊕⊕⊕⊕ high |
| Analysis 6.3 Persistent HPV6/11/16/18 infection (6M), at least 1 dose, age 24‐45 years | 1,136 | 591 | 0.52 (0.42 to 0.65) | 48% (35% to 58%) | 545 (398 to 659) | 3713 (1 study) | ⊕⊕⊕⊝ |
| Analysis 6.4 Persistent HPV16/18 infection (12M), at least 1 dose, age 15‐26 years | 861 | 396 | 0.46 (0.40 to 0.54) | 54% (46% to 60%) | 465 (396 to 516) | 24,785 (2 studies) | ⊕⊕⊕⊕ high |
| CI: Confidence interval; RR: Risk Ratio; | |||||||
| GRADE Working Group grades of evidence Moderate quality: Further research is likely to have an important impact on our confidence in the estimate of effect and may change the estimate. | |||||||
| 1In case of study flaws as assessed by the Cochrane Collaboration's tool for assessing risk of bias in randomised trials (Higgins 2011b), not observed but calculated outcome; 2 Substantial heterogeneity defined as I2 >30%, when multiple studies were available for the considered outcome; 3When only one study was retrieved for the outcome; 4Imprecision, when the width of the 95% confidence interval around RR >0.60. 0* When zero events occurred in the vaccine group a continuity correction was applied to compute the RR and its confidence interval. Nevertheless, in this case the absolute risks in the vaccine arms in Table 2 were computed considering an exact binomal distribution. ** Relative and absolute effects in women regardless of HPV DNA status at baseline (headings 3 and 6) must be interpreted with care since influenced by the prevalence of HPV infection at enrolment in the respective trials. *** Post hoc analysis for women who received <3 doses. $ For the precancer endpoints (CIN2/3 and AIS),a higher risk in the placebo arms was observed if <3 doses were received compared to those who received 3 doses Therefore the quality of evidence was downgraded to low or very low. | |||||||
| Outcome | Initial HPV status at enrolment | |
| hrHPV negative | Regardless of HPV status | |
| Lesions associated with HPV16/18 | NNV (95% CI) | NNV (95% CI) |
| CIN2+ | 62 (61 to 64) | 54 (46 to 68) |
| CIN3+ | 204 (149 to 333) | 135 (110 to 263) |
| AIS+ | 1111 (714 to 5000) | 1111 (625 to 3333) |
| Lesions irrespective of HPV types | NNV (95% CI) | NNV (95% CI) |
| CIN2+ | 60 (50 to 76) | 68 (52 to 97) |
| CIN3+ | 141 (106 to 208) | 133 (94 to 227) |
| AIS+ | 1000 (556 to 10,000) | 833 (526 to 2000) |
| AIS: adenocarcinoma in situ, CIN: cervical intraepithelial neoplasia, CIN2+: CIN of degree II or worse, CIN3+: CIN of degree 3 or worse, hrHPV: high‐risk human papillomavirus types, NNV: number needed to vaccinate. | ||
| Outcomes | Absolute risk/ per 10,000 | Relative effect | No of Participants | Quality of the evidence | |
| placebo | vaccinated | ||||
| Analysis 7.1Overall local/injection site adverse events | 6847 | 8080 | 1.18 (1.16 to 1.20) | 18,113 | ⊕⊕⊕⊝ |
| Analysis 7.2Pain at injection site | 6505 | 8782 | 1.35 (1.23 to 1.49) | 25,691 | ⊕⊕⊕⊝ |
| Analysis 7.3Swelling at injection site | 1582 | 2737 | 1.73 (1.32 to 2.27) | 22,106 | ⊕⊕⊕⊝ |
| Analysis 7.4Redness at injection site | 1938 | 3333 | 1.72 (1.50 to 1.97) | 19,996 | ⊕⊕⊕⊝ |
| Analysis 7.5Overall systematic event and general symptoms | 6102 | 6224 | 1.02 (0.98 to 1.07) | 18,191 | ⊕⊕⊕⊝ |
| Analysis 7.6Serious adverse events | 605 | 611 | 1.01 (0.95 to 1.07) | 6978 | ⊕⊕⊕⊕ |
| Analysis 7.7Deaths | 11 | 13 | 1.25 (0.81 to 1.93) | 71,452 (23 studies) | ⊕⊕⊝⊝ |
| Analysis 8.1Normal infant | 7171 | 7171 | 1.00 (0.97 to 1.02) | 8782 | ⊕⊕⊕⊕ |
| Analysis 8.2Spontaneous abortion/miscarriage | 1618 | 1424 | 0.88 (0.68 to 1.14) | 8618 | ⊕⊕⊕⊕ |
| Analysis 8.3Elective termination/induced abortion | 931 | 838 | 0.90 (0.80 to 1.02) | 10.909 | ⊕⊕⊕⊕ |
| Analysis 8.4Stillbirth | 70 | 78 | 1.12 (0.68 to 1.83) | 8754 | ⊕⊕⊕⊝4 |
| Analysis 8.5Abnormal infant | 205 | 250 | 1.22 (0.88 to 1.69) | 9252 | ⊕⊕⊕⊝4 |
| CI: Confidence interval; RR: Risk Ratio | |||||
| GRADE Working Group grades of evidence Moderate quality: Further research is likely to have an important impact on our confidence in the estimate of effect and may change the estimate. | |||||
| 1In case of study flaws as assessed by Cochrane's tool for assessing risk of bias in randomised trials (Higgins 2011b), not observed but calculated outcome 2 Substantial heterogeneity defined as I2 > 30%, when multiple studies were available for the considered outcome 3When only one study was retrieved for the outcome 4Imprecision, when the width of the 95% confidence interval around RR > 0.60 † inter‐age group heterogeneity, absence of pattern in causes of deaths | |||||
| ID | Group | Death causes |
| 1 | C | Pulmonary thromboembolism with background of acute lymphoblastic leukaemia |
| 2 | V | Breast cancer |
| 3 | V | Pulmonary tuberculosis |
| 4 | V | Thyrotoxicosis |
| 5 | V | Cerebral haemorrhage subsequent to hypertension |
| 6 | V | Pericarditis on a background of lupus erythematosus |
| 7 | V | Nasopharyngeal cancer with metastases to brain |
| 8 | V | Pulmonary embolism after intervention for uterine myoma |
| RR of deaths in vaccine vs placebo arm (7 over 1,890 vs 1 over 1888): RR = 6.99 (95% CI 0.86 to 56.78), 2‐sided pexact=0.070. The age at death varied between 29 and 45 years, seven of the deaths occurred in the Philippines and one in Columbia. All participants received three doses of HPV vaccine or placebo except one who received only two doses of vaccine. The time interval between last dose and date at death ranged between 6 and 37 months. | ||
| Group:V = vaccinated against HPV, C = control group. Source: end‐of‐study analysis after a median follow‐up of four years (Castellsagué 2011) and personal communication with Alfred Saah (MSD, 6/05/2016). | ||
| Patient | Cause of death | Group | Age | Country | Source |
| 1 | Breast cancer metastatic | V | 47 | Canada | 1 |
| 2 | Suicide | V | 47 | Mexico | 1 |
| 3 | Lower respiratory tract infection and sepsis* | C | 55 | Mexico | 1 |
| 4 | Cervix cancer metastatic** | V | 45 | Mexico | 1 |
| 5 | Interstitial lung disease | V | 41 | Mexico | 1 |
| 6 | Breast cancer | *** | 32 | Mexico | 1*** |
| 7 | Suicide | V | 41 | Mexico | 1 |
| 8 | Cardiac valve disease and liver disorder* | C | 38 | Mexico | 1 |
| 9 | Drug hypersensitivity and acute renal failure* | V | 46 | Peru | 1 |
| 10 | Cardiorespiratory arrest | C | 44 | Phillipines | 1 |
| 11 | Acute myocardial infarction | V | 31 | Phillipines | 1 |
| 12 | Multiple myeloma and pulmonary embolism* | V | 50 | Phillipines | 1 |
| 13 | Homicide | V | 32 | Phillipines | 1 |
| 14 | Bronchopneumonia | V | 40 | Singapore | 1 |
| 15 | Lung neoplasm malignant | V | 41 | Thailand | 1 |
| 16 | Suicide | V | 28 | USA | 1 |
| 17 | Glioblastoma multiforme | V | 45 | USA | 1 |
| 18 | Anaplastic astrocytoma | C | 43 | **** | 2 |
| 19 | Nasopharyngeal cancer | C | 41 | **** | 2 |
| Remarks | |||||
| * | Multiple death causes | ||||
| ** | This woman had normal cytology but was HPV‐18 DNA‐positive at study entry (May 2006). At the next scheduled cytology testing at Month 12 (April 2007), the cytology finding was atypical squamous cells cannot exclude high‐grade squamous intraepithelial lesion. She was diagnosed with metastatic cervical cancer in May 2007 (approximately 7 months after receiving the third dose of vaccine or control) and died in July 2008 | ||||
| *** | One case of death due to breast cancer reported in the 48 month report (Skinner 2014) had to be excluded from the analysis (Wheeler 2016). | ||||
| **** | Two additional cases of death occurring in the control arm were reported in the 84‐month report (Wheeler 2016). The country for these two cases was not reported. | ||||
| Source: 1) interim analysis after 48 months of follow‐up (Skinner 2014); 2) report at 84 months of follow‐up (Wheeler 2016) The 84‐month follow‐up report revealed 13 deaths in the HPV arm (N = 2877) versus 5 (N = 2870), with death causes allocated to the trial arms (vaccine versus placebo arm) the RR was 2.59 (95% CI 0.93 to 7.27), 2‐sided pexact=0.0957. No pattern was noticed which could indicate a causal role attributed to HPV vaccination. | |||||
| Trial | Target age group | Age category | Reported age sub‐groups |
| 16‐23 | younger | none | |
| 15‐25 | younger | none | |
| 16‐23 | younger | none | |
| 20‐25 | younger | none | |
| 15‐25 | younger | 15‐17, 18‐20, 21‐25 | |
| 18‐25 | younger | 18‐19, 20‐21, 22‐23, 24‐25 | |
| 26+ | older | 26‐35, 36‐45, 46+ | |
| 16‐24 | younger | none | |
| 15‐26 | younger | none | |
| 25‐45 | older | none |
| Outcome | Age | Event/N Vaccine | Event/N Placebo | Relative risk (95% CI) | Vaccine efficacy % (95% CI) | P value for linear effect of age |
| In women with hrHPV DNA negative status at baseline | ||||||
| CIN2+ associated with HPV16/18 | 15‐17 | 1/1997 | 53/2022 | 0.02 (0.00 to 0.14) | 98% (86 to 100%) | 0.995 |
| 18‐20 | 0/1096 | 27/1144 | 0.02 (0.00 to 0.32) | 98% (68 to 100%) | ||
| 21‐25 | 0/2363 | 17/2281 | 0.03 (0.00 to 0.47) | 97% (53 to 100%) | ||
| CIN2+ irrespective of HPV types | 15‐17 | 34/1997 | 101/2022 | 0.34 (0.23 to 0.50) | 66% (50 to 77%) | 0.355 |
| 18‐20 | 10/1096 | 38/1144 | 0.27 (0.14 to 0.55) | 73% (45 to 86%) | ||
| 21‐25 | 17/2363 | 33/2281 | 0.50 (0.28 to 0.89) | 50% (11 to 72%) | ||
| CIN3+ associated with HPV16/18 | 15‐17 | 0/1997 | 14/2022 | 0.04 (0.00 to 0.61) | 96% (39 to100%) | 1.000 |
| 18‐20 | 0/1096 | 8/1144 | 0.07 (0.00 to 1.13) | 93% (‐13 to 100%) | ||
| 21‐25 | 0/2363 | 5/2281 | 0.10 (0.00 to 1.74) | 90%(‐74 to 100%) | ||
| CIN3+ irrespective of HPV types | 15‐17 | 2/1997 | 24/2022 | 0.08 (0.02 to 0.36) | 92% (64 to 98%) | 0.488 |
| 18‐20 | 1/1096 | 11/1144 | 0.09 (0.01 to 0.73) | 91% (27 to 99%) | ||
| 21‐25 | 0/2363 | 9/2281 | 0.05 (0.00 to 0.92) | 95% (8 to 100%) | ||
| Persistent HPV16/18 infection (6M) | 15‐17 | 14/1989 | 303/2020 | 0.05 (0.03 to 0.08) | 95% (92 to 97%) | 0..042 |
| 18‐20 | 9/1090 | 110/1125 | 0.08 (0.04 to 0.17) | 92%(83 to 96%) | ||
| 21‐25 | 12/2338 | 108/2249 | 0.11 (0.06 to 0.19) | 89% (81 to 94%) | ||
| Regardless of women’s baseline HPV DNA status | ||||||
| CIN2+ associated with HPV16/18 | 15‐17 | 21/2882 | 100/2892 | 0.21 (0.13 to 0.24) | 79% (66 to 87%) | 0.000 |
| 18‐20 | 23/1871 | 66/1908 | 0.36 (0.22 to 0.57) | 64% (43 to 78%) | ||
| 21‐25 | 46/3929 | 62/3898 | 0.74 (0.50 to 1.08) | 26% (‐8 to 50%) | ||
| CIN2+ irrespective of HPV types | 15‐17 | 112/2882 | 200/2892 | 0.56 (0.45 to 0.70) | 44% (30 to 55%) | 0.006 |
| 18‐20 | 62/1871 | 105/1908 | 0.60 (0.44 to 0.82) | 40% (18 to 56%) | ||
| 21‐25 | 113/3929 | 123/3898 | 0.91 (0.09 to 1.17) | 9% (‐17 to 29%) | ||
| CIN3+ associated with HPV16/18 | 15‐17 | 7/2882 | 36/2892 | 0.20 (0.09 to 0.44) | 80% (56 to 91%) | 0.000 |
| 18‐20 | 13/1871 | 30/1908 | 0.44 (0.23 to 0.84) | 56% (16 to 77%) | ||
| 21‐25 | 31/3929 | 28/3898 | 1.10 (0.66 to 1.83) | ‐10% (‐83 to 34%) | ||
| CIN3+ irrespective of HPV types | 15‐17 | 21/2882 | 61/2892 | 0.35 (0.21 to 0.57) | 65% (43 to 79%) | 0.008 |
| 18‐20 | 22/1871 | 44/1908 | 0.51 (0.31 to 0.85) | 49% (15 to 69%) | ||
| 21‐25 | 43/3929 | 53/3898 | 0.80 (0.54 to 1.20) | 20% (‐20 to 46%) | ||
| Persistent HPV16/18 infection (6M) | 15‐17 | 167/2916 | 588/2920 | 0.28 (0.24 to 0.34) | 72% (66 to 76%) | 0.000 |
| 18‐20 | 143/1925 | 283/1961 | 0.51 (0.43 to 0.62) | 49% (38 to 57%) | ||
| 21‐25 | 194/4009 | 356/3979 | 0.54 (0.46 to 0.64) | 46% (36 to 54% ) | ||
| Source: Lehtinen 2012. CIN: cervical intraepithelial neoplasia, CIN2+: CIN of degree II or worse, CIN3+: CIN of degree 3 or worse, HPV: human papillomavirus types.. | ||||||
| Outcome | Age | Vaccine | Placebo | Relative risk (95% CI) | Vaccine efficacy (95% CI) | P value for linear effect of age |
| In women with HPV16/18 DNA negative status at baseline cohort | ||||||
| Persistent HPV16/18 infection (6M) | 18‐19 | 1/825 | 51/870 | 0.02 (0.00 to 0.10) | 98% (90% to 100%) | 0.145 |
| 20‐21 | 3/659 | 36/649 | 0.08 (0.02 to 0.24) | 92% (76% to 98%) | ||
| 22‐23 | 2/588 | 36/625 | 0.06 (0.00 to 0.20) | 94% (80% to 100%) | ||
| 24‐25 | 3/563 | 20/533 | 0.14 (0.03 to 0.44) | 86% (56% to 97%) | ||
| Regardless if women’s baseline HPV DNA status | ||||||
| Persistent HPV16/18 infection (6M) | 18‐19 | 47/1193 | 165/1,244 | 0.30 (0.21 to 0.41) | 70% (59% to 79%) | 0.000 |
| 20‐21 | 64/946 | 134/905 | 0.46 (0.34 to 0.61) | 54% (39% to 66%) | ||
| 22‐23 | 59/818 | 112/848 | 0.55 (0.40 to 0.75) | 45% (25% to 60%) | ||
| 24‐25 | 61/770 | 75/742 | 0.78 (0.56 to 1.99) | 22 %(‐9.9 to 44%) | ||
| Source: Herrero 2011. | ||||||
| Outcome | Age | Event/NVaccine | Event/NPlacebo | Relative risk (95% CI) | Vaccine efficacy (95% CI) | P value for linear effect of age |
| In women with HPV16/18 DNA negative status at baseline cohort | ||||||
| Persistent HPV16/18 infection (6M) | 26‐35 | 3/834 | 22/800 | 0.13 (0.04 to 0.44) | 87% (56% to 96%) | 0.532 |
| 36‐45 | 3/816 | 12/809 | 0.25 (0.07 to 0.88) | 75%(12% to 93%) | ||
| 46+ | 0/219 | 0/213 | N.A. | N.A. | ||
| Regardless if women’s baseline HPV DNA status | ||||||
| Persistent HPV16/18 infection (6M) | 26‐35 | 48/1221 | 78/1242 | 0.63 (0.44 to 0.89) | 37% (11% to 56%) | 0.177 |
| 36‐45 | 19/1244 | 43/1228 | 0.44 (0.26 to 0.74) | 56% (26% to 74%) | ||
| 46+ | 4/300 | 11/306 | 0.37 (0.12 to 1.15) | 63% (‐15% to 88%) | ||
| Source: Skinner 2014. | ||||||
| Initial HPV DNA/ status | Serology status | Vaccine | Placebo | Relative Risk (95% CI) | Relative Risk ratio |
| DNA(‐) | Sero‐ | 0/2,241 | 32/2258 | 0.00 (0.02 to 0.26) | 15.93 |
| Sero+ | 0/377 | 2/379 | 0.25 (0.01 to 5.20) | ||
| DNA(+) | Sero‐ | 27/232 | 31/213 | 0.80 (0.49 to 1.29) | 1.50 |
| Sero+ | 41/156 | 30/137 | 1.20 (0.80 to 1.81) | ||
| DNA(‐) | Sero‐ | 0/5,305 | 28/5260 | 0.02(0.00 to 0.14) | 7.41 |
| Sero+ | 0/498 | 4/524 | 0.13 (0.01 to 2.43) | ||
| DNA(+) | Sero‐ | 33/423 | 35/402 | 0.90 (0.57 to 1.41) | 1.12 |
| Sero+ | 47/298 | 52/332 | 1.01 (0.70 to 1.45 | ||
| DNA(‐) | Sero‐ | 5/8709 | 92/8112 | 0.05 (0.02 to 0.12) | 6.16 |
| Sero+ | 3/1710 | 10/1777 | 0.31 (0.09 to 1.13) | ||
| DNA(+) | Sero‐ | 20/309 | 29/293 | 0.65 (0.38 to 1.13) | 1.70 |
| Sero+ | 53/333 | 44/307 | 1.11 (0.77 to 1.61) | ||
| Pooled results for CIN2+ associated with HPV16/18 | |||||
| DNA(‐) | Sero‐ | 5/14,014 | 120/13,372 | 0.03 (0.02 to 0.09) | 5.85 (0.53 to 65.10) |
| Sero+ | 3/2205 | 14/2301 | 0.19 (0.09 t0 o.77) | ||
| DNA(+) | Sero‐ | 53/679 | 64/695 | 0.79 (0.60 to 1.05 | 1.37 (0.97 to 1.93) |
| Sero+ | 100/531 | 96/639 | 1.10 (0.88 to 1.36) | ||
| *RR against HPV 6/11/16/18 related cervical lesions ** RR against HPV16/18 related CIN2+ *** Pooled only for FUTURE II and PATRIACIA, since, in the FUTURE I trial, the endpoints were cervical lesions and not CIN2+ associated with HPV16/18 | |||||
| Outcome | P value | ||||||
| V1 | V2 | V3 | V4 | V5 | V6 | V7 | |
| Persistent HPV16/18 infection (6M), in women being baseline HPV16/18 negative 3 doses | 0.70 | 0.60 | np | np | 0.90 | np | 0.42 |
| Persistent HPV16/18 infection (6M), in women being baseline HPV16/18 negative at least 1 dose | 0.56 | 0.56 | np | np | np | np | np |
| Persistent HPV16/18 infection (12M), in women being baseline HPV16/18 negative 3 doses | 0.94 | 0.94 | np | np | np | np | 0.73 |
| Persistent HPV16/18 infection (12M), in women being baseline HPV16/18 negative at least 1 dose | 0.67 | 0.67 | np | np | np | np | np |
| Influence of study quality (items V1‐V6) and independence of the research team towards the vaccine manufacturer (V7) on protection against persistent HPV16/18 infection assessed by meta‐regression. The P values correspond with the statistical significance of the incorporation of each item in the meta‐regression. V1: Random sequence generation; V2: Allocation concealment; V3: Blinding participants and personnel; V4: Blinding of outcome; V5: Incomplete outcomes; V6: Selective reporting; V7: Involvement of manufacturer, np: meta‐regression not possible because of collinearity. | |||||||
| Outcome | No. of doses | Vaccine arm | Placebo arm | Relative Risk (95%CI) | P value for linear dose‐effect relation |
| 12‐month persistent HPV16/18 infection in women being HPV16/18 negative at baseline | 3 | 84/11,104 | 627/11,203 | 0.135 (0.108 to 0.169) | 0.303 |
| 2 | 3/611 | 26/574 | 0.108 (0.033 to 0.356) | ||
| 1 | 1/292 | 17/249 | 0.050 (0.007 to 0.374) | ||
| 6‐month persistent HPV16/18 infection in women being HPV16/18 negative at baseline | 3 | 114/11,104 | 1000/11,209 | 0.115 (0.095 to 0.139) | 0.269 |
| 2 | 4/611 | 35/574 | 0.107 (0.038 to 0.300) | ||
| 1 | 1/292 | 24/250 | 0.036 (0.005 to 0.261) | ||
| Incident HPV16/18 infection in women being HPV16/18 negative at baseline | 3 | 529/11,110 | 2172/11,217 | 0.246 (0.224 to 0.269) | 0.337 |
| 2 | 22/611 | 82/574 | 0.252 (0.160 to 0.398) | ||
| 1 | 8/292 | 45/251 | 0.153 (0.073 to 0.318) | ||
| 12‐month persistent HPV16/18 infection in women being hrHPV negative at baseline | 3 | 27/6634 | 351/6656 | 0.077 (0.052 to 0.114) | 0.996 |
| 2 | 2/273 | 12/276 | 0.168 (0.038 to 0.746) | ||
| 1 | 0/138 | 5/99 | 0.071 (0.004 to 1.289) | ||
| 6‐month persistent HPV16/18 infection in women being hrHPV negative at baseline | 3 | 38/6634 | 567/6660 | 0.067 (0.049 to 0.093) | 0.809 |
| 2 | 2/273 | 16/276 | 0.126 (0.029 to 0.544) | ||
| 1 | 0/138 | 8/100 | 0.045 (0.003 to 0.774) | ||
| Incident HPV16/18 infection in women being hrHPV negative at baseline | 3 | 38/6634 | 567/6660 | 0.067 (0.049 to 0.093) | 0.809 |
| 2 | 2/273 | 16/276 | 0.126 (0.029 to 0.544) | ||
| 1 | 0/138 | 8/100 | 0.045 (0.003 to 0.774) | ||
| Source: PATRICIA & CVT (ph3,2v) (Kreimer 2015). | |||||
| Outcome | No. of doses | n events | N vaccinated | % (95%CI) | P* for difference with 3 doses |
| Cumulative incidence HPV16/18 infections | 3 | 88 | 2023 | 4.3 (3.5 to 5.3) | ‐ |
| 2 (at months 0 & 6) | 3 | 78 | 3.8 (1.0 to 10.1) | 1.00 | |
| 2 (at months 0 & 1) | 7 | 192 | 3.6 (1.6 to 7.1) | 0.85 | |
| 1 | 2 | 133 | 1.5 (0.3 to 4.9) | 0.17 | |
| Source: Safaeian 2018. * two‐sided exact test for difference between proportions. | |||||
| Outcomes | Age Group (years) | Studies | RR if 3 doses (95% CI) | RR if 1‐2 doses (95% CI) |
| CIN2+ due to HPV16/18 | 15‐26 | 5 (FUTURE II trial (ph3,4v); Japanese trial (ph2,2v); PATRICIA trial (ph3,2v); Phase2 trial (ph2,1v); Chinese trial (ph3,2v)_young) | 0.07 (0.03 to 0.14)* | 0.10 (0.04 to 0.26)* |
| 24‐45 | 0.14 (0.03 to 0.79)* | 0.98 (0.20 to 4.83) | ||
| CIN3+ due to HPV16/18 | 15‐26 | 0.20 (0.04 to 0.91)* | 0.04 (0.01 to 0.74)* | |
| Incident HPV16/18 infection | 15‐26 | 3 (Japanese trial (ph2,2v); Phase2 trial (ph2,1v);Chinese trial (ph3,2v)_young) | 0.20 (0.10 to 0.41)* | 0.47 (0.26 to 0.84)* |
| 6‐month persistent HPV16/18 infection | 15‐26 | 0.05 (0.01 to 0.27)* | 0.12 (0.03 to 0.42)* | |
| 24‐45 | 0.15 (0.09 to 0.27)* | 0.34 (0.19 to 0.61)* | ||
| 12‐month persistent HPV16/18 infection | 15‐26 | 3 (Japanese trial (ph2,2v);CVT (ph3,2v); Chinese trial (ph3,2v)_young) | 0.09 (0.05 to 0.19)* | 0.13 (0.06 to 0.33)* |
| *Vaccine efficacy in women being HPV16/18 DNA negative at enrolment and having received all three or less than three doses (computed from trials where per‐protocol [all doses administered] and intention‐to‐treat analyses [at least one dose administered] are reported). | ||||
| Outcomes | Study | Report (duration of follow‐up) | Vaccine | Placebo | Relative Risk (95%CI) | P value for linear difference of follow‐up time effect |
| CIN2+ associated with HPV16/18 in women being HPV negative at baseline | PATRICIA | Paavonen 2007 14.8 moths | 2/7788 | 21/7838 | 0.096 (0.007 to 0.466) | 0.512 |
| Paavonen 2009 34.9 months | 5/8040 | 91/8080 | 0.054 (0.016 to 0.137) | |||
| Szarewski 2011 39.4 months | 5/8079 | 92/8112 | 0.054 (0.016 to 0.137) | |||
| Lehtinen 2011 43.7 months | 5/7338 | 97/7305 | 0.051 (0.016 to 0.123) | |||
| FUTURE | The FUTURE II study group 2007 36 months | 3/5865 | 87/5836 | 0.039 (0.011 to 0.109) | 0.994 | |
| Munoz 2010* 43 months | 0/4616 | 89/4680 | 0.006 (0.000 to 0.092) | |||
| CIN2+ irrespective of HPV types regardless of women’s initial HPV DNA status | PATRICIA | Paavonen 2009 34.9 months | 224/8667 | 322/8682 | 0.696 (0.579 to 0.8369) | 0.750 |
| Lehtinen 2011 43.7 months | 287/8694 | 428/8708 | 0.669 (0.574 to 0.778) | |||
| FUTURE | The FUTURE II study group 2007 36 months | 281/6087 | 361/6080 | 0.780 (0.668 to 0.905) | 0.665 | |
| Munoz 2010 43 months | 421/8562 | 520/8598 | 0.807 (0.690 to 0.943) | |||
| Assessment of the influence of duration of follow‐up on study outcomes using meta‐regression. p‐values correspond with the statistical significance of incorporating average follow‐up time as a continuous variable. | ||||||
| Number of sex partners | Vaccine | Placebo | Relative Risk (95% CI) | P value of number of sexual partners effect |
| In women being HPV16/18 DNA negative at baseline cohort | ||||
| Virgin | 1/566 | 17/615 | 0.064 (0.003 to 0.352) | 0.7448 |
| 1 partner | 3/904 | 27/915 | 0.112 (0.007 to 0.335) | |
| 2 partners | 1/544 | 17/519 | 0.056 (0.003 to 0.309) | |
| 3+ partners | 3/621 | 28/628 | 0.108 (0.026 to 0.321) | |
| Regardless of women’s baseline HPV DNA status | ||||
| Virgin | 4/733 | 21/819 | 0.202 (0.059 to 0.551) | < 0.0001 |
| 1 partner | 40/1237 | 83/1256 | 0.489 (0.333 to 0.711) | |
| 2 partners | 38/777 | 81/753 | 0.455 (0.307 to 0.665) | |
| 3+ partners | 71/940 | 116/911 | 0.593 (0.440 to 0.796) | |
| The influence of the number of lifetime sexual partners on vaccine efficacy was assessed by Poisson regression. The P value corresponds with the likelihood ratio test comparing a Poisson model with and without inclusion of the sexual history with 3 possible categories. Source: CVT (ph3,2v) (Herrero 2011). | ||||
| Outcomes | Study | Number of participants | Study size | Vaccine | Placebo | Relative Risk (95%CI) | P value |
| CIN2+ associated with HPV16/18 in women being HPV16/18 negative at baseline | Phase2 trial (V1) | 2392 | S | 0/126 | 8/127 | 0.062* (0.004 to 1.071) | 0.598 |
| Phase2 trial (V2) | 1113 | S | 0/219 | 3/212 | 0.161* (0.008 to 3.091) | ||
| Japanese trial (ph2,2v) | 1040 | S | 0/422 | 2/427 | 0.252* (0.012 to 5.241) | ||
| PATRICIA trial (ph3,2v) | 18,644 | L | 5/8040 | 91/8080 | 0.055 (0.022 to 0.136) | ||
| FUTURE II trial (ph3, 4v) | 12,167 | L | 3/5865 | 87/5863 | 0.034 (0.011 to 0.109) | ||
| Chinese trial (ph3,2V) | 6051 | L | 0/2543 | 4/2554 | 0.125 (0.001 to 8.681) | ||
| CIN2+ irrespective of HPV types and regardless of women’s initial HPV DNA status | FUTURE I/II trial (ph3,4v) | 17,622 | L | 421/8562 | 520/8598 | 0.813 (0.718 to 0.921) | 0.703 |
| PATRICIA trial (ph3,2v) | 18,644 | L | 287/8694 | 428/8708 | 0.672 (0.582 to 0.778) | ||
| Phase2 trial (v1) | 2392 | S | 8/148 | 12/142 | 0.640 (0.269 to 1.568) | ||
| Assesment of the influence of the study size on the protection against CIN2+ associated with HPV16/18 according to study size (S = small, < 3000 participants, L = large >= 3000 participants) in women aged 15‐26 years and received at least 1 dose. * P values correspond with the statistical significance of a meta‐regression with vs without study size category. | |||||||
| Analysis | Endpoint | Initial HPV status | Doses | Relative Risk |
| Monovalent vaccine (Rowhani‐Rahbar, 2009): 102 months of follow‐up | ||||
| 3.1 | CIN2+ associated with HPV16 | HPV16‐ | 3 | 0.00 |
| 3.2 | CIN2+ associated with HPV16 | HPV16‐ | >= 1 | 0.00 |
| 3.3 | CIN2+ associated with HPV16 | HPV16‐ | 1‐2 | 0.00 |
| 4.1 | Incident HPV16 infection | HPV16‐ | 3 | 0.05 |
| 4.3 | Incident HPV16 infection | HPV16‐ | >= 1 | 0.11 |
| 4.3 | Incident HPV16 infection | HPV16‐ | 1‐2 | 0.25 |
| 5.1 | CIN2+ associated with HPV16 | regardless of HPV infection | >= 1 | 0.36 |
| 5.3 | CIN2+ irrespective of HPV types | regardless of HPV infection | >= 1 | 0.64 |
| Bivalent vaccine (De Calvaho, 2012): 88 months of follow‐up | ||||
| 2.2 | 6M persistent HPV16/18 infection | hrHPV‐ | 3 | 0.00 |
| 2.4 | 12M persistent HPV16/18 infection | hrHPV‐ | 3 | 0.00 |
| 3.2 | CIN2+ associated with HPV16/18 | HPV16/18‐ | >= 1 | 0.00 |
| Quadrivalent vaccine (Villa, 2006): 60 months of follow‐up | ||||
| 4.8 | Persistent HPV6/11/16/18 infection | HPV16/18‐ | >= 1 | 0.07 |
| Trials | Ref | Endpoint | Relative Risk (95% CI) | P value for difference in VE | |
| Bivalent | Quadrivalent | ||||
| 6‐month persistent HPV31 infection | 0.229 (0.156 to 0.228) | 0.538 (0.336 to 0.847) | 0.003 | ||
| 6‐month persistent HPV45 infection | 0.210 (0.106 to 0.387) | 0.922 (0.507 to 1.670) | 0.0003 | ||
| CIN2+ associated with HPV33 | 0.177 (0.053 to 0.466) | 0.760 (0.328 to 1.712) | 0.02 | ||
| CIN2+ associated with HPV45 | 0.000 (0.000 to 0.583) | 0.481 (0.174 to 1.177) | 0.04 | ||
| CIN2+ associated with other hrHPV | 0.401 (0.192 to 0.793) | ||||
| 6‐month persistent HPV31 infection | 0.209 (0.041 to 0.724) | ||||
| 6‐month persistent HPV45 infection | 0.221 (0.044 to 0.914) | ||||
| Adverse effect | Relative risk | Relative risk ratio | p value | |
| Quadrivalent vs placebo | Bivalent/Quadrivalent | |||
| 1 | Overall adverse effects at injection site | 1.19 (0.89 to 1.59) | 1.69 (0.96 to 2.96) | 0.061 |
| 2 | Pain at injection site | 1.20 (0.78 to 1.85) | 1.19 (0.67 to 2.12) | 0.501 |
| 3 | Swelling at injection site | 2.72 (0.77to 9.61) | 0.62 (0.16 to 2.41) | 0.427 |
| 4 | Redness at injection site | 1.46 (1.23 to 1.74) | 1.08 (0.88 to 1.32) | 0.307 |
| 5 | Overall systemic events | 0.99 (0.91 to 1.07) | 1.06 (0.95 to 1.19) | 0.210 |
| 6 | Serious adverse events | 0.94 (0.70 to 1.26) | 1.08 (0.80 to 1.45) | 0.583 |
| 7 | Deaths | 1.18 (0.25 to 5.62) | 0.84 (0.14 to 4.91) | 0.775 |
| Relative risks of the quadrivalent vaccine versus placebo and the relative risk ratios were computed by meta‐regression including vaccine, age group and type of product injected in the control group (aluminium adjuvants alone or other vaccine such as Hepatitis A vaccine) as covariate. The relative risk ratio reflects how much more an adverse effect is observed after vaccination with the bivalent versus the quadrivalent vaccine. | ||||
| Outcome or subgroup title | No. of studies | No. of participants | Statistical method | Effect size |
| 1 CIN2+ associated with HPV16/18, at least 1 dose Show forest plot | 3 | 23676 | Risk Ratio (IV, Random, 95% CI) | 0.01 [0.00, 0.05] |
| 2 CIN2+ associated with HPV6/11/16/18, at least 1 dose Show forest plot | 1 | 9296 | Risk Ratio (IV, Random, 95% CI) | 0.01 [0.00, 0.09] |
| 3 CIN3+ associated with HPV16/18, at least 1 dose Show forest plot | 2 | 20214 | Risk Ratio (IV, Random, 95% CI) | 0.01 [0.00, 0.10] |
| 4 CIN3+ associated with HPV6/11/16/18, at least 1 dose Show forest plot | 1 | 9296 | Risk Ratio (IV, Random, 95% CI) | 0.01 [0.00, 0.18] |
| 5 AIS associated with HPV16/18, at least 1 dose Show forest plot | 2 | 20214 | Risk Ratio (IV, Random, 95% CI) | 0.10 [0.01, 0.82] |
| 6 AIS associated with HPV6/11/16/18, at least 1 dose Show forest plot | 1 | 9296 | Risk Ratio (IV, Random, 95% CI) | 0.14 [0.01, 2.80] |
| 7 Any CIN2+ irrespective of HPV types, at least 1 dose Show forest plot | 5 | 25180 | Risk Ratio (IV, Random, 95% CI) | 0.37 [0.25, 0.55] |
| 7.1 Bivalent vaccine | 4 | 15884 | Risk Ratio (IV, Random, 95% CI) | 0.33 [0.25, 0.43] |
| 7.2 Quadrivalent vaccine | 1 | 9296 | Risk Ratio (IV, Random, 95% CI) | 0.57 [0.44, 0.76] |
| 8 Any CIN3+ irrespective of HPV types, at least 1 dose Show forest plot | 3 | 20719 | Risk Ratio (IV, Random, 95% CI) | 0.21 [0.04, 1.10] |
| 8.1 Bivalent vaccine | 2 | 11423 | Risk Ratio (IV, Random, 95% CI) | 0.08 [0.03, 0.23] |
| 8.2 Quadrivalent vaccine | 1 | 9296 | Risk Ratio (IV, Random, 95% CI) | 0.54 [0.36, 0.82] |
| 9 Any AIS irrespective of HPV types, at least 1 dose Show forest plot | 2 | 20214 | Risk Ratio (IV, Random, 95% CI) | 0.10 [0.01, 0.76] |
| Outcome or subgroup title | No. of studies | No. of participants | Statistical method | Effect size |
| 1 CIN2+ associated with HPV16/(18), 3 doses Show forest plot | 8 | 43376 | Risk Ratio (IV, Random, 95% CI) | 0.08 [0.04, 0.16] |
| 1.1 Age group 15‐26 years | 6 | 36579 | Risk Ratio (IV, Random, 95% CI) | 0.07 [0.03, 0.15] |
| 1.2 Age group 24‐45 years | 2 | 6797 | Risk Ratio (IV, Random, 95% CI) | 0.16 [0.04, 0.74] |
| 2 CIN2+ associated with HPV16/(18), at least 1 dose Show forest plot | 8 | 42030 | Risk Ratio (IV, Random, 95% CI) | 0.10 [0.05, 0.20] |
| 2.1 Age group 15‐26 years | 6 | 34478 | Risk Ratio (IV, Random, 95% CI) | 0.05 [0.03, 0.10] |
| 2.2 Age group 24‐45 years | 2 | 7552 | Risk Ratio (IV, Random, 95% CI) | 0.30 [0.11, 0.81] |
| 3 CIN2+ associated with HPV16/(18), 1 or 2 doses (post hoc analysis) Show forest plot | 7 | 3713 | Risk Ratio (IV, Random, 95% CI) | 0.19 [0.07, 0.51] |
| 3.1 women age 15‐26 years | 5 | 2958 | Risk Ratio (IV, Random, 95% CI) | 0.10 [0.04, 0.26] |
| 3.2 women age 24‐45 years | 2 | 755 | Risk Ratio (IV, Random, 95% CI) | 0.61 [0.14, 2.67] |
| 4 CIN2+ associated with HPV6/11/16/18, 3 doses Show forest plot | 2 | 7664 | Risk Ratio (IV, Random, 95% CI) | 0.06 [0.01, 0.61] |
| 4.1 Age group 15‐26 years | 1 | 4499 | Risk Ratio (IV, Random, 95% CI) | 0.02 [0.00, 0.25] |
| 4.2 Age group 24‐45 years | 1 | 3165 | Risk Ratio (IV, Random, 95% CI) | 0.17 [0.02, 1.39] |
| 5 CIN2+ associated with HPV6/11/16/18, at least 1 dose Show forest plot | 2 | 8980 | Risk Ratio (IV, Random, 95% CI) | 0.08 [0.00, 2.41] |
| 5.1 Age group 15‐26 years | 1 | 5351 | Risk Ratio (IV, Random, 95% CI) | 0.01 [0.00, 0.19] |
| 5.2 Age group 24‐45 years | 1 | 3629 | Risk Ratio (IV, Random, 95% CI) | 0.37 [0.10, 1.41] |
| 6 CIN2+ associated with HPV6/11/16/18, 1 or 2 doses (post hoc analysis) Show forest plot | 2 | 1316 | Risk Ratio (IV, Random, 95% CI) | 0.24 [0.01, 5.00] |
| 6.1 Age group 15‐26 years | 1 | 852 | Risk Ratio (IV, Random, 95% CI) | 0.04 [0.00, 0.74] |
| 6.2 Age group 24‐45 years | 1 | 464 | Risk Ratio (IV, Random, 95% CI) | 0.97 [0.14, 6.80] |
| 7 CIN3+ associated with HPV16/18 or HPV6/11/16/18, 3 doses Show forest plot | 3 | 29720 | Risk Ratio (IV, Random, 95% CI) | 0.07 [0.02, 0.29] |
| 8 CIN3+ associated with HPV 16/18 or HPV6/11/16/18, at least 1 dose Show forest plot | 3 | 33199 | Risk Ratio (IV, Random, 95% CI) | 0.05 [0.02, 0.14] |
| 9 CIN3+ associated with HPV16/18 or HPV6/11/16/18, 1 or 2 doses (post hoc analysis) Show forest plot | 3 | 3479 | Risk Ratio (IV, Random, 95% CI) | 0.06 [0.01, 0.24] |
| 10 AIS associated with HPV16/18 or HPV6/11/16/18, 3 doses Show forest plot | 3 | 29707 | Risk Ratio (IV, Random, 95% CI) | 0.12 [0.02, 0.70] |
| 11 AIS associated with HPV16/18 or 6/11/16/18, at least 1 dose Show forest plot | 2 | 17079 | Risk Ratio (IV, Random, 95% CI) | 0.09 [0.01, 0.72] |
| 12 AIS associated with HPV16/18 or HPV6/11/16/18, 1 or 2 doses (post hoc analysis) Show forest plot | 2 | 2015 | Risk Ratio (IV, Random, 95% CI) | 0.15 [0.01, 2.97] |
| 13 Any CIN2+ irrespective of HPV types, 3 doses Show forest plot | 3 | 7320 | Risk Ratio (IV, Random, 95% CI) | 0.40 [0.25, 0.64] |
| 14 Any CIN2+ irrespective of HPV types, at least 1 dose Show forest plot | 3 | 19143 | Risk Ratio (IV, Random, 95% CI) | 0.41 [0.32, 0.52] |
| 15 Any CIN2+ irrespective of HPV types, 1 or 2 doses (post hoc analysis) Show forest plot | 1 | 34 | Risk Ratio (IV, Random, 95% CI) | 0.71 [0.15, 3.38] |
| Outcome or subgroup title | No. of studies | No. of participants | Statistical method | Effect size |
| 1 CIN2+ associated with HPV16/18, at least 1 dose Show forest plot | 5 | 44052 | Risk Ratio (IV, Random, 95% CI) | 0.52 [0.41, 0.67] |
| 1.1 Age group 15‐26 years | 3 | 34852 | Risk Ratio (IV, Random, 95% CI) | 0.46 [0.37, 0.57] |
| 1.2 Age group 24‐45 years | 2 | 9200 | Risk Ratio (IV, Random, 95% CI) | 0.74 [0.52, 1.05] |
| 2 CIN2+ associated with HPV6/11/16/18, at least 1 dose Show forest plot | 2 | 20883 | Risk Ratio (IV, Random, 95% CI) | 0.57 [0.38, 0.86] |
| 2.1 Age group 15‐26 years | 1 | 17160 | Risk Ratio (IV, Random, 95% CI) | 0.50 [0.42, 0.59] |
| 2.2 Age group 24‐45 years | 1 | 3723 | Risk Ratio (IV, Random, 95% CI) | 0.78 [0.44, 1.37] |
| 3 CIN3+ associated with HPV16/18, at least 1 dose Show forest plot | 2 | 34562 | Risk Ratio (IV, Random, 95% CI) | 0.55 [0.45, 0.67] |
| 4 CIN3+ associated with HPV6/11/16/18, at least 1 dose Show forest plot | 1 | 17160 | Risk Ratio (IV, Random, 95% CI) | 0.54 [0.43, 0.68] |
| 5 AIS associated with HPV16/18, at least 1 dose Show forest plot | 2 | 34562 | Risk Ratio (IV, Random, 95% CI) | 0.36 [0.17, 0.78] |
| 6 AIS associated with HPV6/11/16/18, at least 1 dose Show forest plot | 2 | 20830 | Risk Ratio (IV, Random, 95% CI) | 0.40 [0.16, 0.98] |
| 7 Any CIN2+ irrespective of HPV types, at least 1 dose Show forest plot | 6 | 45066 | Risk Ratio (IV, Random, 95% CI) | 0.79 [0.65, 0.97] |
| 7.1 Age group 15‐26 years | 4 | 35779 | Risk Ratio (IV, Random, 95% CI) | 0.70 [0.58, 0.85] |
| 7.2 Age group 24‐45 years | 2 | 9287 | Risk Ratio (IV, Random, 95% CI) | 1.04 [0.83, 1.30] |
| 8 Any CIN3+ HPV type, at least 1 dose Show forest plot | 3 | 35489 | Risk Ratio (IV, Random, 95% CI) | 0.67 [0.49, 0.93] |
| 8.1 Bivalent vaccine | 2 | 18329 | Risk Ratio (IV, Random, 95% CI) | 0.55 [0.43, 0.71] |
| 8.2 Quadrivalent vaccine | 1 | 17160 | Risk Ratio (IV, Random, 95% CI) | 0.81 [0.69, 0.96] |
| 9 Any AIS irrespective of HPV types, at least 1 dose Show forest plot | 2 | 34562 | Risk Ratio (IV, Random, 95% CI) | 0.32 [0.15, 0.67] |
| Outcome or subgroup title | No. of studies | No. of participants | Statistical method | Effect size |
| 1 Incident HPV16/18 infection, 3 doses Show forest plot | 1 | 368 | Risk Ratio (IV, Random, 95% CI) | 0.06 [0.02, 0.20] |
| 2 Persistent HPV16/18 infection (6M), 3 doses Show forest plot | 1 | 368 | Risk Ratio (IV, Random, 95% CI) | 0.02 [0.00, 0.35] |
| 3 Persistent HPV16/18 infection (6M), at least 1 dose Show forest plot | 1 | 10826 | Risk Ratio (IV, Random, 95% CI) | 0.07 [0.05, 0.09] |
| 4 Persistent HPV16/18 infection(12M), 3 doses Show forest plot | 1 | 368 | Risk Ratio (IV, Random, 95% CI) | 0.04 [0.00, 0.73] |
| 5 Persistent HPV16/18 infection (12M), at least 1 dose Show forest plot | 2 | 14153 | Risk Ratio (IV, Random, 95% CI) | 0.08 [0.05, 0.12] |
| Outcome or subgroup title | No. of studies | No. of participants | Statistical method | Effect size |
| 1 Incident HPV16/18 infection, 3 doses Show forest plot | 4 | 8034 | Risk Ratio (IV, Random, 95% CI) | 0.17 [0.10, 0.31] |
| 2 Incident HPV16/18 infection, at least 1 dose Show forest plot | 5 | 23872 | Risk Ratio (IV, Random, 95% CI) | 0.23 [0.14, 0.37] |
| 3 Incident HPV16/18 infection, 1 or 2 doses (post hoc analysis) Show forest plot | 3 | 331 | Risk Ratio (IV, Random, 95% CI) | 0.47 [0.26, 0.84] |
| 4 Persistent HPV16/18 infection (6M), 3 doses Show forest plot | 8 | 34113 | Risk Ratio (IV, Random, 95% CI) | 0.07 [0.06, 0.09] |
| 4.1 Age group 15‐26 years | 6 | 27385 | Risk Ratio (IV, Random, 95% CI) | 0.06 [0.05, 0.08] |
| 4.2 Age group 24‐45 years | 2 | 6728 | Risk Ratio (IV, Random, 95% CI) | 0.11 [0.06, 0.20] |
| 5 Persistent HPV16/18 infection (6M), at least 1 dose Show forest plot | 6 | 30323 | Risk Ratio (IV, Random, 95% CI) | 0.12 [0.08, 0.17] |
| 5.1 Age group 15‐26 years | 4 | 22803 | Risk Ratio (IV, Random, 95% CI) | 0.10 [0.08, 0.12] |
| 5.2 Age group 24‐45 years | 2 | 7520 | Risk Ratio (IV, Random, 95% CI) | 0.17 [0.10, 0.29] |
| 6 Persistent HPV16/18 infection (6M), 1 or 2 doses (post hoc analysis) Show forest plot | 4 | 1229 | Risk Ratio (IV, Random, 95% CI) | 0.26 [0.16, 0.44] |
| 6.1 Age group 15‐26 years | 2 | 437 | Risk Ratio (IV, Random, 95% CI) | 0.12 [0.03, 0.42] |
| 6.2 Age group 24‐45 years | 2 | 792 | Risk Ratio (IV, Random, 95% CI) | 0.31 [0.18, 0.54] |
| 7 Persistent HPV6/11/16/18 infection (6M), 3 doses Show forest plot | 2 | 4008 | Risk Ratio (IV, Random, 95% CI) | 0.12 [0.06, 0.21] |
| 8 Persistent HPV6/11/16/18 infection (6M), at least 1 dose Show forest plot | 2 | 4129 | Risk Ratio (IV, Random, 95% CI) | 0.13 [0.05, 0.37] |
| 9 Persistent HPV16/18 infection (12M), 3 doses Show forest plot | 4 | 22267 | Risk Ratio (IV, Random, 95% CI) | 0.09 [0.06, 0.13] |
| 10 Persistent HPV16/18 infection (12M), at least 1 dose Show forest plot | 5 | 29464 | Risk Ratio (IV, Random, 95% CI) | 0.16 [0.12, 0.20] |
| 11 Persistent HPV16/18 infection (12M), 1 or 2 doses (post hoc analysis) Show forest plot | 3 | 3912 | Risk Ratio (IV, Random, 95% CI) | 0.13 [0.06, 0.33] |
| Outcome or subgroup title | No. of studies | No. of participants | Statistical method | Effect size |
| 1 Incident HPV16/18 infection, at least 1 dose Show forest plot | 1 | 4210 | Risk Ratio (IV, Random, 95% CI) | 0.24 [0.17, 0.33] |
| 2 Persistent HPV16/18 infection (6M), at least 1 dose Show forest plot | 4 | 33847 | Risk Ratio (IV, Random, 95% CI) | 0.48 [0.41, 0.57] |
| 2.1 Age group 15‐26 years | 2 | 25199 | Risk Ratio (IV, Random, 95% CI) | 0.44 [0.38, 0.51] |
| 2.2 Age group 24‐45 years | 2 | 8648 | Risk Ratio (IV, Random, 95% CI) | 0.57 [0.47, 0.69] |
| 3 Persistent HPV6/11/16/18 infection (6M), at least 1 dose Show forest plot | 1 | 3713 | Risk Ratio (IV, Random, 95% CI) | 0.52 [0.42, 0.65] |
| 4 Persistent HPV16/18 infection (12M), at least 1 dose Show forest plot | 2 | 24785 | Risk Ratio (IV, Random, 95% CI) | 0.46 [0.40, 0.54] |
| 5 Persistent HPV16/18 infection (12M) by dose (post hoc analysis) Show forest plot | 1 | 7153 | Risk Ratio (IV, Random, 95% CI) | 0.18 [0.12, 0.27] |
| Outcome or subgroup title | No. of studies | No. of participants | Statistical method | Effect size |
| 1 Overall local/injection site adverse events Show forest plot | 8 | 18113 | Risk Ratio (IV, Fixed, 95% CI) | 1.18 [1.16, 1.20] |
| 1.1 Bivalent vaccine | 2 | 6503 | Risk Ratio (IV, Fixed, 95% CI) | 1.29 [1.26, 1.33] |
| 1.2 Quadrivalent vaccine | 6 | 11610 | Risk Ratio (IV, Fixed, 95% CI) | 1.14 [1.12, 1.16] |
| 2 Pain at injection site Show forest plot | 13 | 25691 | Risk Ratio (IV, Random, 95% CI) | 1.35 [1.23, 1.49] |
| 2.1 Monovalent vaccine | 1 | 2280 | Risk Ratio (IV, Random, 95% CI) | 1.05 [1.01, 1.09] |
| 2.2 Bivalent vaccine | 8 | 16897 | Risk Ratio (IV, Random, 95% CI) | 1.49 [1.26, 1.75] |
| 2.3 Quadrivalent vaccine | 4 | 6514 | Risk Ratio (IV, Random, 95% CI) | 1.13 [1.07, 1.19] |
| 3 Swelling at injection site Show forest plot | 9 | 22106 | Risk Ratio (IV, Random, 95% CI) | 1.73 [1.32, 2.27] |
| 3.1 Bivalent vaccine | 7 | 16603 | Risk Ratio (IV, Random, 95% CI) | 1.62 [1.15, 2.29] |
| 3.2 Quadrivalent vaccine | 2 | 5503 | Risk Ratio (IV, Random, 95% CI) | 2.79 [0.85, 9.15] |
| 4 Redness at injection site Show forest plot | 6 | 19996 | Risk Ratio (IV, Random, 95% CI) | 1.72 [1.50, 1.97] |
| 4.1 Quadrivalent vaccine | 1 | 5345 | Risk Ratio (IV, Random, 95% CI) | 1.46 [1.32, 1.63] |
| 4.2 Bivalent vaccine | 5 | 14651 | Risk Ratio (IV, Random, 95% CI) | 1.80 [1.53, 2.11] |
| 5 Overall systemic event and general symptoms Show forest plot | 8 | 18191 | Risk Ratio (IV, Random, 95% CI) | 1.02 [0.98, 1.07] |
| 5.1 Bivalent vaccine | 2 | 6503 | Risk Ratio (IV, Random, 95% CI) | 1.07 [0.97, 1.19] |
| 5.2 Quadrivalent vaccine | 6 | 11688 | Risk Ratio (IV, Random, 95% CI) | 1.01 [0.98, 1.04] |
| 6 Serious adverse events Show forest plot | 23 | 71597 | Risk Ratio (IV, Random, 95% CI) | 0.98 [0.92, 1.05] |
| 6.1 Monovalent vaccine | 1 | 2387 | Risk Ratio (IV, Random, 95% CI) | 0.95 [0.51, 1.78] |
| 6.2 Bivalent vaccine | 15 | 46231 | Risk Ratio (IV, Random, 95% CI) | 1.01 [0.96, 1.07] |
| 6.3 Quadrivalent vaccine | 7 | 22979 | Risk Ratio (IV, Random, 95% CI) | 0.81 [0.65, 1.02] |
| 7 Deaths Show forest plot | 23 | 71176 | Risk Ratio (IV, Random, 95% CI) | 1.29 [0.85, 1.98] |
| 7.1 Monovalent vaccine | 1 | 2280 | Risk Ratio (IV, Random, 95% CI) | 0.0 [0.0, 0.0] |
| 7.2 Bivalent vaccine | 15 | 46231 | Risk Ratio (IV, Random, 95% CI) | 1.21 [0.66, 2.22] |
| 7.3 Quadrivalent vaccine | 7 | 22665 | Risk Ratio (IV, Random, 95% CI) | 1.54 [0.73, 3.23] |
| Outcome or subgroup title | No. of studies | No. of participants | Statistical method | Effect size |
| 1 Normal infant Show forest plot | 8 | 8782 | Risk Ratio (IV, Random, 95% CI) | 1.00 [0.97, 1.02] |
| 2 Spontaneous abortion/miscarriage Show forest plot | 9 | 8618 | Risk Ratio (IV, Random, 95% CI) | 0.88 [0.68, 1.14] |
| 3 Elective termination/induced abortion Show forest plot | 9 | 10909 | Risk Ratio (IV, Random, 95% CI) | 0.90 [0.80, 1.02] |
| 4 Stillbirth Show forest plot | 6 | 8754 | Risk Ratio (IV, Random, 95% CI) | 1.12 [0.68, 1.83] |
| 5 Abnormal infant Show forest plot | 5 | 9252 | Risk Ratio (IV, Random, 95% CI) | 1.22 [0.88, 1.69] |