Controles generales de salud en adultos para la reducción de la morbilidad y mortalidad por enfermedades
Resumen
Antecedentes
Los controles generales de salud son elementos habituales de la atención sanitaria en algunos países. Dichos controles intentan detectar enfermedades y factores de riesgo de enfermedades con el objetivo de reducir la morbilidad y la mortalidad. En su mayoría, las pruebas de detección utilizadas habitualmente y ofrecidas en los controles generales de salud no se han estudiado de forma completa. Además, las pruebas de detección dan lugar a un mayor uso de las intervenciones de diagnóstico y tratamiento, lo que puede tener efectos perjudiciales, así como beneficiosos. Por lo tanto, es importante evaluar si los controles generales de salud tienen más efectos beneficiosos que perjudiciales. Ésta es la primera actualización de la revisión publicada en 2012.
Objetivos
Cuantificar los efectos beneficiosos y perjudiciales de los controles generales de salud.
Métodos de búsqueda
Se hicieron búsquedas en CENTRAL, MEDLINE, Embase, en otras dos bases de datos y en dos registros de ensayos el 31 enero 2018. Dos autores de la revisión examinaron los títulos y los resúmenes, evaluaron los artículos en cuanto a la elegibilidad y leyeron las listas de referencias. Un autor de revisión utilizó el seguimiento de citas (Web of Knowledge) y les pidió a los autores de ensayos información acerca de estudios adicionales.
Criterios de selección
Se incluyeron los ensayos aleatorios que compararon los controles de salud con ningún control de salud en adultos no seleccionados en cuanto a enfermedad o factores de riesgo. No se incluyeron ensayos relacionados con geriatría. Los controles de salud se definieron como pruebas de detección en poblaciones generales para más de una enfermedad o factor de riesgo en más de un sistema orgánico.
Obtención y análisis de los datos
Dos autores de la revisión, de forma independiente, extrajeron los datos y evaluaron el riesgo de sesgo de los ensayos incluidos. Cuando fue necesario, se estableció contacto con los autores de los ensayos para obtener resultados adicionales o detalles de los ensayos. Cuando fue posible, se analizaron los resultados mediante un metanálisis con un modelo de efectos aleatorios; de lo contrario, se realizó una síntesis narrativa.
Resultados principales
Se incluyeron 17 ensayos, 15 de los cuales informaron sobre datos de resultados (251 891 participantes). El riesgo de sesgo fue generalmente bajo para los resultados primarios. Los controles de salud tienen poco o ningún efecto sobre la mortalidad total (cociente de riesgos [CR] 1,00; intervalo de confianza [IC] del 95%: 0,97 a 1,03; 11 ensayos; 233 298 participantes y 21 535 muertes; evidencia de certeza alta, I2 = 0%), o la mortalidad por cáncer (CR 1,01; IC del 95%: 0,92 a 1,12; ocho ensayos; 139 290 participantes y 3663 muertes; evidencia de certeza alta, I2 = 33%) y probablemente tienen poco o ningún efecto sobre la mortalidad cardiovascular (CR 1,05; IC del 95%: 0,94 a 1,16; nueve ensayos; 170 227 participantes y 6237 muertes; evidencia de certeza moderada; I2 = 65%). Los controles de salud tienen poco o ningún efecto sobre la cardiopatía isquémica mortal y no mortal (CR 0,98; IC del 95%: 0,94 a 1,03; cuatro ensayos; 164 881 pacientes, 10 325 eventos; evidencia de certeza alta; I2 = 11%) y probablemente tienen poco o ningún efecto sobre el accidente cerebrovascular mortal y no mortal (CR 1,05; IC del 95%: 0,95 a 1,17; tres ensayos; 107 421 pacientes, 4543 eventos; evidencia de certeza moderada, I2 = 53%).
Conclusiones de los autores
Es poco probable que los controles generales de salud sean beneficiosos.
PICO
Resumen en términos sencillos
Controles generales de salud para la reducción de enfermedades y de la mortalidad
¿Cuál es el objetivo de esta revisión?
El objetivo de esta revisión Cochrane fue determinar si los controles generales de salud reducen los casos de enfermedad y las muertes. Ésta es una actualización de una revisión Cochrane anterior.
Mensajes clave
Es poco probable que las ofertas sistemáticas de los controles de salud sean beneficiosas y las mismas pueden dar lugar a pruebas y tratamientos innecesarios.
¿Qué se estudió en la revisión?
Los controles generales de salud incluyen pruebas múltiples en un paciente que no se siente enfermo. La finalidad es detectar enfermedades de manera precoz, prevenir el desarrollo de enfermedades o brindar tranquilidad. Los controles de salud son un elemento habitual de la asistencia sanitaria en algunos países. La experiencia de los programas de detección para las enfermedades individuales ha mostrado que los beneficios pueden ser menores de lo esperado y los efectos perjudiciales mayores. Se identificaron y analizaron todos los ensayos aleatorios que comparaban las invitaciones para uno o más controles de salud para el público en general con ninguna invitación. Se analizó el efecto sobre la enfermedad y el riesgo de muerte, así como otros resultados que representan la enfermedad, p.ej. la hospitalización y el ausentismo laboral.
¿Cuáles son los principales resultados de la revisión?
Se identificaron 17 ensayos aleatorios que compararon un grupo de adultos a los que se les ofrecieron controles generales de salud con un grupo al que no se le ofrecieron controles de salud.
Quince ensayos informaron de resultados e incluyeron 251 891 participantes. Once de estos ensayos habían estudiado el riesgo de muerte, incorporaron a 233 298 participantes y evaluaron 21 535 muertes. Esta cantidad de datos es excepcionalmente grande en la investigación en asistencia sanitaria, lo cual permitió establecer conclusiones importantes con un grado alto de certeza. Los controles de salud tienen poco o ningún efecto sobre el riesgo de muerte por cualquier causa (evidencia de certeza alta) o en el riesgo de muerte por cáncer (evidencia de certeza alta) y probablemente tienen poco o ningún efecto sobre el riesgo de muerte por causas cardiovasculares (evidencia de certeza moderada). Asimismo, los controles de salud tienen poco o ningún efecto sobre las cardiopatías (evidencia de certeza alta) y probablemente tienen poco o ningún efecto sobre el accidente cerebrovascular (evidencia de certeza moderada).
Un motivo para la falta evidente de efecto puede ser que los médicos de atención primaria ya identifican e intervienen cuando sospechan que un paciente presenta un riesgo alto de desarrollar enfermedades al consultar por otros motivos. Además, los pacientes en alto riesgo de desarrollar enfermedades pueden no asistir a los controles generales de salud cuando se los invita o pueden no cumplir con las pruebas y los tratamientos sugeridos.
¿Cuál es el grado de actualización de la revisión?
Los autores de la revisión buscaron estudios publicados hasta el 31 de enero 2018.
Conclusiones de los autores
Summary of findings
| General health checks for reducing morbidity and mortality from disease | |||||
| Patient or population: general adult populations (geriatric trials not included) Setting: general practice or medical/research centre (Europe and USA) Intervention: one or more general health checks (screening by any healthcare provider for more than one disease or risk factor in more than one organ system using more than one test) Comparison: no health checks | |||||
| Outcomes | Illustrative comparative risks* (95% CI) | Relative effect | No of participants | Certainty of the evidence | |
| Assumed riska | Corresponding risk | ||||
| Without health checks | With health checks | ||||
| Total mortality Follow‐up: 4‐30 years | 68 per 1000 | 68 per 1000 | RR 1.00 (0.97 to 1.03) | 233,298 | ⊕⊕⊕⊕ |
| Cancer mortality Follow‐up: 4‐22 years | 26 per 1000 | 26 per 1000 | RR 1.01 (0.92 to 1.12) | 139,290 | ⊕⊕⊕⊕ |
| Cardiovascular mortality Follow‐up: 4‐30 years | 32 per 1000 | 34 per 1000 | RR 1.05 (0.94 to 1.16) | 170,227 | ⊕⊕⊕⊝b |
| Fatal and non‐fatal ischaemic heart disease Follow‐up: 4‐30 years | 66 per 1000 | 65 per 1000 | RR 0.98 (0.94 to 1.03) | 164,881 | ⊕⊕⊕⊕ |
| Fatal and non‐fatal stroke Follow‐up: 4‐30 years | 29 per 1000 | 30 per 1000 | RR 1.05 (0.95 to 1.17) | 107,421 | ⊕⊕⊕⊝c |
| *The basis for the assumed risk is provided in footnotes. The corresponding risk (and its 95% confidence interval) is based on the assumed risk in the comparison group and the relative effect of the intervention (and its 95% CI). | |||||
| GRADE Working Group grades of evidence | |||||
| aSome trials used skewed randomisation in age and sex strata, giving unbalanced baselines (accounted for in the analysis estimates used). For this reason, control‐group event rates are somewhat misleading. The risk without the intervention is based on the median event rate in intervention and control groups combined. The corresponding risk with the intervention (and the 95% confidence interval for the difference), is based on the overall relative effect (and its 95% confidence interval). bDowngraded due to serious inconsistency. Substantial unexplained heterogeneity in results (I2 = 65%) cDowngraded due to serious inconsistency. Substantial heterogeneity in results (I2 = 53%) | |||||
Antecedentes
Descripción de la afección
Los controles generales de salud son elementos habituales de la asistencia sanitaria en algunos países (Han 1997; Holland 2009), a veces como programas sistemáticos nacionales (Nakao 2018; Robson 2016). La evolución de la medicina en la segunda mitad del siglo XX ha llevado a un gran aumento de los métodos de diagnóstico y a mayores expectativas en cuanto a la prevención o la detección de muchas enfermedades antes de que haya un efecto perjudicial irreversible.
Descripción de la intervención
Los controles generales de salud incluyen un contacto entre un profesional de la salud y un paciente que no está motivado por los síntomas, y en el que se realizan varias pruebas de detección para evaluar la salud general. La finalidad es prevenir la enfermedad futura mediante la detección temprana de las enfermedades o los factores de riesgo, o proporcionar tranquilidad. La terminología es confusa. Pruebas de detección multifásicas, examen de salud periódico, controles de salud físicos y preventivos anuales son ejemplos de los términos usados para describir la intervención. Algunos estudios investigaron el efecto de un único control de salud y algunos examinaron el efecto de los controles consecutivos. Las pruebas diagnósticas incluidas varían de forma considerable. Se utilizó el término amplio “control general de salud”, el cual es usado con frecuencia por los legos y en la publicidad.
Pocas de las pruebas de detección comúnmente incluidas en los controles de salud generales se evaluaron de acuerdo a los criterios aceptados, o sea, en ensayos aleatorios de alta calidad (UK National Screening Committee 2010). Aunque los efectos beneficiosos y perjudiciales de los tratamientos para trastornos como la hipertensión y la diabetes se han estudiado ampliamente en ensayos aleatorios, las pruebas de detección de los pacientes asintomáticos en cuanto a estos trastornos se han estudiado muy poco (Piper 2015; Selph 2015). La evaluación del riesgo cardiovascular con una puntuación del riesgo es frecuente en los controles de salud, aunque no está claro si ayuda (Karmali 2017). Cuando las pruebas de detección para los trastornos individuales se han estudiado en ensayos aleatorios, las conclusiones fueron variadas. Por ejemplo, las pruebas de detección para el cáncer de próstata probablemente no reducen la mortalidad específica de la enfermedad pero tienen efectos perjudiciales importantes (Ilic 2013; Martin 2018), mientras que las pruebas de sangre oculta en heces reducen la mortalidad por cáncer colorrectal, aunque a costa de una gran cantidad de exámenes invasivos en personas sanas (Holme 2013).
Los controles de salud pueden ofrecerse sistemáticamente a la población en general como parte de una póliza nacional o un seguro de salud privado, o los empleadores pueden ofrecérselos a sus empleados. También pueden ser adquiridos por el individuo a partir de los proveedores comerciales o pueden ser proporcionados por los médicos generales. Los controles de salud pueden ser muy integrales y usar tecnologías avanzadas, como la tomografía computadorizada o la resonancia magnética, aunque estas intervenciones no se recomiendan para los controles de salud debido a los beneficios no comprobados y al riesgo de efectos perjudiciales (FDA 2018).
Algunos controles generales de salud incluyen una conversación con un profesional de la salud, posiblemente un cuestionario y a veces también una exploración física realizada por un médico. Esencialmente las anteriores son pruebas de detección, aunque una conversación puede no percibirse como tal. Las intervenciones del estilo de vida también se implementan con frecuencia durante un control de salud, p.ej. el asesoramiento sobre el régimen dietético y el hábito de fumar. Dichas intervenciones no son de detección sino conductuales, y parecen ser de valor variable. Por ejemplo, las revisiones sistemáticas no han mostrado el valor de las intervenciones de factores de riesgo múltiple en las poblaciones en general (Ebrahim 2011). Puede haber un efecto pequeño de la modificación de la ingesta de grasas en la alimentación, aunque los resultados son inciertos (Hooper 2011; Hooper 2015). Sin embargo, se ha demostrado que el simple asesoramiento sobre el abandono del hábito de fumar tiene un efecto (Stead 2013).
Es importante destacar que los médicos de atención primaria a veces recomiendan controles de salud o pruebas de detección seleccionadas para los pacientes que consideran que pueden beneficiarse a partir de las mismas cuando los atienden por otras razones. Dichas pruebas clínicamente motivadas a menudo se consideran una parte integrante de la práctica de atención primaria y los efectos de los controles sistemáticos de salud se miden como un agregado a esta práctica.
De qué manera podría funcionar la intervención
Se espera que los controles generales de salud reduzcan la morbilidad y la mortalidad mediante la detección y el tratamiento tempranos de las enfermedades y los factores de riesgo. Por ejemplo, la detección temprana de la hipertensión puede dar lugar a una reducción en la morbilidad y la mortalidad mediante el tratamiento. Las pruebas de detección pueden encontrar precursores de enfermedades, p.ej. adenomas colorrectales o displasia cervical, cuyo tratamiento puede prevenir el desarrollo de cáncer. Además, la identificación de los signos o los síntomas de las enfermedades manifiestas que la persona no ha considerado importantes puede ser beneficiosa. También pueden ser de utilidad la orientación en cuanto al régimen dietético, el peso y el hábito de fumar. Las personas sanas pueden sentir tranquilidad, lo cual podría disminuir la preocupación. La naturaleza preventiva de los controles generales de salud implica que se esperaría que la mayoría de los efectos tuviera una latencia de varios años.
Las pruebas de detección en los pacientes sanos también pueden ser perjudiciales. Aunque no se sabe si las pruebas de detección dan lugar a un beneficio, todas las intervenciones médicas pueden causar efectos perjudiciales. Un ejemplo conocido es el sobrediagnóstico del cáncer latente o del carcinoma in situ, que podría no haber progresado hasta presentar síntomas o podría haber remitido espontáneamente (Welch 2004). Además, los resultados de falsos positivos pueden llevar a pruebas de diagnóstico invasivas innecesarias y causar efectos perjudiciales, y el tratamiento farmacológico de los pacientes con factores de riesgo como colesterol alto y glucemia elevada puede tener efectos adversos. Los resultados de falsos positivos pueden causar una preocupación innecesaria (Brewer 2007), y los resultados de negativos falsos pueden dar lugar a un sentido falso de seguridad y retrasar la atención médica cuando es necesaria. Además, el hecho de ser etiquetado como con una enfermedad, o incluso simplemente como en mayor riesgo de contraer una enfermedad, puede afectar de manera negativa las opiniones que las personas saludables tienen de sí mismas (Barger 2006; Hamer 2010; Haynes 1978). También puede hacer más difícil la obtención de un seguro de vida y de salud en algunos países. En último término, pero no menos importante, hay un coste económico para los pacientes y la sociedad en cuanto a la identificación y el tratamiento de los factores de riesgo y las enfermedades que podrían no haberse manifestado nunca en el paciente como enfermedad o acortamiento de la vida.
Por qué es importante realizar esta revisión
Los controles generales de salud son combinaciones de pruebas de detección, de las cuales pocas se han estudiado de forma adecuada, y no está claro si dan lugar a más efectos beneficiosos que perjudiciales. Las revisiones sistemáticas de los controles de salud no han encontrado efectos sobre la morbilidad y la mortalidad, pero algunas han encontrado efectos sobre los resultados indirectos como la presión arterial y el colesterol (Dyakova 2016; Krogsbøll 2012; Si 2014). Se observó la necesidad de una revisión amplia e integral de los ensayos aleatorios, con un énfasis en los resultados clínicamente importantes en lugar de los resultados indirectos. Se eligió no examinar los estudios observacionales debido a que el riesgo de sesgo es demasiado grande con relación a los tamaños del efecto esperados. Ésta es la primera actualización de la revisión publicada en 2012 (Krogsbøll 2012).
Objetivos
Cuantificar los efectos beneficiosos y perjudiciales de los controles generales de salud.
Métodos
Criterios de inclusión de estudios para esta revisión
Tipos de estudios
Ensayos aleatorios de los controles generales de salud en comparación con ningún control de salud. No hubo restricciones de idioma. Se incluyeron ensayos de forma independiente de la fuente de financiamiento.
Tipos de participantes
Criterios de inclusión
Adultos, independientemente del género y el grupo étnico. El contexto tenía que ser la atención primaria o la comunidad. Se incluyeron ensayos de forma independiente de si estaban dirigidos a la población general o a un grupo más reducido, por ejemplo los empleados de una empresa.
Criterios de exclusión
No se incluyeron ensayos descritos como dirigidos específicamente a personas mayores, o que solo incluían a personas a partir de los 65 años de edad (ver Diferencias entre el protocolo y la revisión). También se excluyeron los ensayos en poblaciones de pacientes con enfermedades o factores de riesgo específicos conocidos, p.ej. los ensayos en pacientes con hipertensión o cardiopatía isquémica.
Tipos de intervenciones
Pruebas de detección para más de una enfermedad o factor de riesgo y en más de un sistema orgánico, realizadas solo una vez o de forma reiterada. Esta definición excluye los ensayos de las pruebas de detección para enfermedades únicas, por ejemplo el cáncer de próstata, y los ensayos de pruebas de detección únicas que pueden detectar más de una enfermedad, por ejemplo la espirometría.
Se aceptaron los ensayos que incluían una intervención del estilo de vida (por ejemplo, asesoramiento sobre el régimen dietético, el hábito de fumar y el ejercicio), además de las pruebas de detección, debido a que la misma es una intervención bastante bien definida que a menudo se incorpora en los controles de salud.
Se incluyeron ensayos de forma independiente del tipo de profesional sanitario, por ejemplo un médico, profesional de enfermería u otros.
Tipos de medida de resultado
Algunos ensayos y estudios observacionales han investigado los efectos de los controles de salud sobre los resultados indirectos, por ejemplo los factores de riesgo cardiovasculares, los comportamientos de salud o las tasas de detección del cáncer, y algunos han encontrado efectos positivos, aunque generalmente pequeños. Sin embargo, puede haber problemas graves con el uso de los resultados indirectos (Fleming 1996).
Primero, la evaluación del efecto de los cambios en un resultado indirecto sobre la morbilidad y la mortalidad es difícil y poco confiable y requiere el modelado con supuestos que son difíciles de examinar. Puede haber latencia de los efectos (Ebrahim 2011), y falta de certeza con respecto al grado de reversibilidad del riesgo. Por ejemplo, el abandono del hábito de fumar reduce el riesgo de cardiopatía coronaria y mortalidad, aunque de modo lento y probablemente no de forma completa (Ben‐Shlomo 1994; Cook 1986). Además, es difícil saber hasta qué grado los cambios en los factores de riesgo y los comportamientos se mantienen a largo plazo. Segundo, el uso de los resultados indirectos ignora los efectos perjudiciales de los tratamientos y los procedimientos de diagnóstico durante el seguimiento. Un ejemplo es el fármaco rosiglitazona para la diabetes, que redujo el resultado indirecto de glucemia pero causó cardiopatía grave (Lehman 2010; Nissen 2010). Lo anterior no se reconoció en los ensayos que utilizaron resultados indirectos únicamente. Tercero, para medir los cambios en los factores de riesgo y los comportamientos de salud, los participantes necesitan asistir a una sesión de seguimiento o responder cuestionarios. Debido a que es imposible cegar al grupo de intervención y a que la intervención a menudo es en parte conductual, puede esperarse un sesgo relacionado con las pérdidas durante el seguimiento. Por ejemplo, los pacientes con comportamientos de salud adversos podrían no estar dispuestos a confrontar a los investigadores nuevamente, lo cual podría dar lugar a una mejoría falsa en los resultados indirectos en un análisis de casos disponibles o un análisis de la última observación considerada. Además, la ausencia de cegamiento puede causar sesgo de informe de los comportamientos de salud.
Por estas razones, el interés se centró en los resultados que representan directamente los efectos beneficiosos y perjudiciales de los controles de salud sobre la salud de los participantes y que pueden evaluarse de forma confiable con un seguimiento largo. Se eligió la mortalidad total y específica de la enfermedad como los resultados primarios debido a que es menos probable que estén sesgados con respecto a otros resultados, son de relevancia directa para los participantes y captan los efectos beneficiosos y perjudiciales. Sin embargo, se incluyeron algunos resultados que son sensibles al sesgo de abandono y de informe porque son importantes y no pueden evaluarse de otras maneras, por ejemplo, salud y preocupación autoinformadas.
Resultados primarios
-
Mortalidad total
-
Mortalidad específica de la enfermedad
Resultados secundarios
-
Morbilidad (p.ej. infarto de miocardio)
-
Nuevos diagnósticos (totales y específicos de enfermedades)
-
Ingreso en el hospital
-
Discapacidad (preferentemente informada por el paciente)
-
Preocupación
-
Salud autoinformada
-
Número de derivaciones a especialistas
-
Número de visitas no programadas a los médicos generales
-
Número de procedimientos de diagnóstico adicionales debido a las pruebas de detección positivas
-
Fármacos nuevos prescritos y frecuencia y tipo de cirugía
-
Ausencia de trabajo
Efectos perjudiciales
Los principales efectos perjudiciales de los controles de salud se representan en los resultados anteriores. Los efectos perjudiciales principales son el sobrediagnóstico, los efectos adversos psicológicos y conductuales, las complicaciones relacionadas con las investigaciones de seguimiento y los tratamientos innecesarios como resultado del sobrediagnóstico. Aunque las actividades de diagnóstico, preventivas y terapéuticas pueden mejorar la salud, a menudo también son nocivas y deben ser equilibradas con respecto a las reducciones en la morbilidad y la mortalidad para estar justificadas. El cálculo del sobrediagnóstico no será posible para todas las enfermedades debido al alcance amplio de la revisión y porque el aumento de la incidencia es un objetivo para algunos trastornos, por ejemplo la diabetes, pero un problema para otros, por ejemplo el cáncer de próstata. Estas preguntas son consideradas de forma más apropiada en las revisiones de las pruebas de detección para las enfermedades individuales. Sin embargo, aún es útil una cuantificación del cambio en la incidencia de los trastornos individuales aunque pueda representar efectos beneficiosos y perjudiciales. Otro efecto perjudicial posible es un efecto negativo sobre los comportamientos de salud, por ejemplo el fracaso en el abandono del hábito de fumar debido a la tranquilidad relacionada con la buena salud. Dichos efectos también serían captados por los resultados elegidos.
Métodos de búsqueda para la identificación de los estudios
Búsquedas electrónicas
The searches were revised relative to the previous version of this review to improve identification of relevant studies. Searches were limited to 2012 onwards to find material published since the date of searches carried out for the previous version of this review.
We searched the following databases on 31 January 2018:
-
Cochrane Central Register of Controlled Trials (CENTRAL; 2017, Issue 12) in the Cochrane Library;
-
Database of Abstracts of Reviews of Effects (DARE; 2015, Issue 2) in the Cochrane Library;
-
MEDLINE Ovid (including Epub Ahead of Print, In‐Process & Other Non‐Indexed Citations and Versions; 2012 to 24 January 2018);
-
Embase Ovid (2012 to 30 January 2018);
-
CINAHL EBSCO (Cumulative Index to Nursing and Allied Health Literature).
The EPOC Cochrane Information Specialist (CIS) developed the search strategies based on the protocol and the original search. The search strategies are presented in full in Appendix 1.
Búsqueda de otros recursos
Trial Registries
We searched the following resources on 31 January 2018:
-
International Clinical Trials Registry Platform (ICTRP), Word Health Organization (WHO) www.who.int/ictrp/en/;
-
ClinicalTrials.gov, US National Institutes of Health (NIH) clinicaltrials.gov.
We searched the reference lists of included studies and used citation tracking (Web of Knowledge) for all articles describing eligible trials. We asked authors of the included studies if they were aware of any other published, unpublished, or ongoing studies that could meet our inclusion criteria.
Obtención y análisis de los datos
Selección de los estudios
Two review authors (LTK and KJJ), independently assessed the potential relevance of all titles and abstracts identified through the searches and assessed full‐text copies of potentially eligible articles. We resolved disagreements discussion, involving the third author (PCG) when necessary. Two review authors (LTK and KJJ) independently searched reference lists, and one review author (LTK), used citation tracking (Web of Knowledge) on included articles.
Extracción y manejo de los datos
Two authors (LTK and KJJ), independently extracted data from the included trials and entered them into a piloted data extraction form. When relevant information was missing from the reports we contacted the trial authors.
We extracted the following data from all included trials: study design, diagnostic tests used, total study duration, the number of participants allocated to each arm, number lost to follow‐up for each outcome, baseline comparability, setting, age, country, and date of study. We extracted the number of events or rates for mortality, hospitalisation (one or more), surgery, new medications, referrals to specialists and diagnostic procedures required because of positive screening tests, and for the number of physician visits. For ordinal scale outcomes we extracted the mean value; standard deviation; and name, range, and direction of the scale. When these data formats were not available we extracted what was possible to extract, including narrative accounts if the actual numbers were missing.
Evaluación del riesgo de sesgo de los estudios incluidos
We used the Cochrane 'Risk of bias' tool (Higgins 2017). The domains formally assessed were: sequence generation, allocation concealment, blinding of participants and personnel, blinding of outcome assessment, incomplete outcome data, selective reporting, and other biases. We assessed the risk of contamination of the control group under 'Other bias'. We also assessed the randomised groups for baseline comparability.
Medidas del efecto del tratamiento
For mortality, we used the risk ratio, except in cases where only hazard ratios were available. We treated ranking scales as continuous data when possible. For all measures we used 95% confidence intervals.
Three trials used skewed randomisation in several strata, for example, age and gender, providing intentionally unbalanced baseline characteristics (DanMONICA 1982; Inter99 1999; Stockholm 1969). In one case this was motivated by increased sampling efficiency, as the intervention group was also part of a cohort study (DanMONICA 1982), and in another case the researchers wanted to include more participants in groups judged likely to respond well to a lifestyle intervention (Inter99 1999). In all three cases, the trial authors adjusted for the imbalance using Cox regression. For some of the analyses, we obtained data on participants and events in each stratum and treated these as separate trials, summarising the effect with fixed‐effect meta‐analysis. This provided almost identical results to the published ones.
Cuestiones relativas a la unidad de análisis
For cluster‐randomised trials we preferably used effect estimates and standard errors from analyses that took the clustering into account. When such estimates were not available we disregarded the effect of clustering and investigated the impact of this in a sensitivity analysis.
Manejo de los datos faltantes
We preferred data from intention‐to‐treat analyses (ITT). When these were not available, we assessed the possible bias resulting from missing data.
Evaluación de la heterogeneidad
We assessed clinical and methodological differences between trials before doing any meta‐analyses, and we judged whether trials could be pooled. We assessed heterogeneity with the I2 statistic, which describes the variation between trials in relation to the total variation (Higgins 2003).
Evaluación de los sesgos de notificación
Outcome reporting bias is difficult to assess in these trials but we noted whether the outcomes that we considered important had been reported. When the study design implied that data on other outcomes than the ones reported might have been investigated, we asked the trial authors for further data. In meta‐analyses with more than 10 trials, we made funnel plots.
Síntesis de los datos
As specified in our protocol, we used random‐effects model meta‐analyses. In order to combine as many results as possible, we used the generic inverse variance method available in Review Manager 5 (Review Manager 2014). In some cases effect estimates were reported as hazard ratios, and we combined these with risk ratios in the meta‐analyses. When meta‐analysis was not possible, we did a narrative synthesis.
GRADE and 'Summary of findings' table
For our primary outcomes (total mortality, disease‐specific mortality), and morbidity (fatal and non‐fatal ischaemic heart disease, fatal and non‐fatal stroke), we used GRADE to assess and describe the certainty of evidence, using GRADEpro GDT software (GRADEpro GDT 2015). One review author (LK), assessed the quality of the evidence across all studies contributing to the meta‐analysis for each outcome using the five GRADE considerations (study limitations, consistency of effect, imprecision, indirectness and publication bias) as outlined in the Cochrane Handbook for Systematic Reviews of Interventions (Schünemann 2017), using GRADEpro GDT software. Another review author (KJ), checked the assessments; we resolved any disagreements through discussion. We justified decisions to downgrade the quality of studies in the footnotes of the 'Summary of findings' table.
Análisis de subgrupos e investigación de la heterogeneidad
We pre‐planned the following subgroup analyses:
-
only one health check versus several;
-
physical examination by physician;
-
interventions that included advice on lifestyle;
-
age of trial;
-
geographical location of trial;
-
high versus low risk of bias;
-
long versus short follow‐up.
Análisis de sensibilidad
We decided to include cluster‐randomised trials despite anticipating that we had to ignore the clustering in some cases, and despite the greater risk of unsuccessful randomisation. To investigate the robustness of our results, we pre‐planned a sensitivity analysis excluding cluster‐randomised trials.
Results
Description of studies
Results of the search
The search for this update yielded 4021 records after removal of duplicates. From these, we selected 63 articles for full‐text assessment, plus four identified through other sources. Of these 67 articles, we excluded 56. The remaining 11 articles described four trials; one was new (DanMONICA 1982), one was already included but had new results (Inter99 1999), and two were ongoing trials. We did not identify any additional trials by searching reference lists and through citation tracking. In the previous version of this review, we included 16 trials (Ebeltoft 1992; Family Heart 1990; Göteborg 1963; Göteborg 1970; Inter99 1999; Kaiser Permanente 1965; Malmö 1969; Mankato 1982; New York 1971; Northumberland 1969; OXCHECK 1989; Salt Lake City 1972; South‐East London 1967; Stockholm 1969; Titograd 1971; WHO 1971), but two trials did not report results (New York 1971; Titograd 1971). With one new trial identified (DanMONICA 1982), we therefore had 17 trials in all, and 15 trials with data for our updated analysis (Figure 1).

Study flow diagram
Included studies
We included 17 trials, 15 of which reported outcome data.
The 15 trials with data varied in size from 533 randomised participants in Northumberland 1969, to 61,301 in Inter99 1999. The total number of participants was 251,891 with 87,412 allocated to health checks and 164,479 to a control group. Eleven trials with 233,298 participants reported a total of 21,535 deaths (DanMONICA 1982; Ebeltoft 1992; Göteborg 1963; Göteborg 1970; Inter99 1999; Kaiser Permanente 1965; Malmö 1969; OXCHECK 1989; South‐East London 1967; Stockholm 1969; WHO 1971). The length of follow‐up for total mortality varied from 4 to 30 years, and it also varied for other outcomes. The trials that did not report mortality were often small (Mankato 1982; Northumberland 1969; Salt Lake City 1972), with the exception of the British Family Heart study (Family Heart 1990), which included 12,924 participants.
The setting was general practice in five trials (Family Heart 1990; Ebeltoft 1992; Northumberland 1969; OXCHECK 1989; South‐East London 1967), medical centre/research centre in nine trials (DanMONICA 1982; Göteborg 1963; Göteborg 1970; Inter99 1999; Kaiser Permanente 1965; Malmö 1969; Mankato 1982; Salt Lake City 1972; Stockholm 1969), and the workplace in one trial (WHO 1971). As per our inclusion criteria, they included people that were not selected for diseases or risk factors. Four trials randomised households or couples (Family Heart 1990; OXCHECK 1989; Salt Lake City 1972; South‐East London 1967), one randomised factories (WHO 1971), and ten randomised participants. Three trials were conducted in the USA (Kaiser Permanente 1965; Mankato 1982; Salt Lake City 1972), and twelve were conducted in Europe (DanMONICA 1982; Ebeltoft 1992; Family Heart 1990; Göteborg 1963; Göteborg 1970; Inter99 1999; Malmö 1969; Northumberland 1969; OXCHECK 1989; South‐East London 1967; Stockholm 1969; WHO 1971).
The interventions offered can be broadly classified into two categories: screening focused on cardiovascular risk factors with a strong lifestyle intervention component, and broad screenings using many tests (often called multiphasic screening in older publications) but often without an important lifestyle intervention component. The very broad type of screening was mainly seen in trials that started in the 1960s and 1970s. Five trials included screening for cancer. The tests used were chest radiographs (Göteborg 1963; Malmö 1969); chest radiographs and faecal occult blood testing (South‐East London 1967); chest radiographs, mammography and cervical smears (Salt Lake City 1972); and chest radiographs, sigmoidoscopy, mammography and pelvic examinations (Kaiser Permanente 1965). One trial used abdominal ultrasound (DanMONICA 1982). See Table 1 for an overview of the interventions used. Six trials included a physical examination by a physician (Göteborg 1963; Kaiser Permanente 1965; Malmö 1969; Northumberland 1969; South‐East London 1967; Stockholm 1969), while nine trials did not (DanMONICA 1982; Ebeltoft 1992; Family Heart 1990; Göteborg 1970; Inter99 1999; Mankato 1982; OXCHECK 1989; Salt Lake City 1972; WHO 1971).
| Blood pressure | Cholesterol | Height and weight | Risk score | Electrocardiogram | Biochemistry panel | History | Spirometry | Urine analyses | Diabetes | Clinical examination | Vision and/or hearing | Cancer screening | |
| x | x | x | x | x | Current symptoms, personal and family history |
| x | Fasting blood sugar | x | x | Chest X‐ray | ||
| x | Probably | x | x | x | Current symptoms, personal and family history | x | x | x | x | Chest X‐ray, mammography, pelvic exam, sigmoidoscopy | |||
| x | Probably | x | x | x | Current symptoms, personal history | x | x | x | Chest X‐ray, faecal occult blood | ||||
| x | x | x | x | Haematocrit, triglycerides, cholesterol | Interview and questionnaire, not specified | x | x | x | Chest X‐ray | ||||
| ? | ? | ? | ? | ? | ? | Current symptoms | ? | ? | ? | ? | ? | ? | |
| x | Probably | x | x | Current symptoms, personal history | x | x | |||||||
| x | x | x | x | Family history | |||||||||
| x | x | x |
| Current symptoms |
| ||||||||
| x | x | x | x | x | x | x | Chest X‐ray, mammography, cervical smear | ||||||
| x | x | x | x | Current symptoms, personal and family history | Peak flow | x | Not explicit, but abdominal ultrasound done | ||||||
| x | x | x | |||||||||||
| x | x | x | Personal and family history | ||||||||||
| x | x | x | Dundee | Personal and family history |
| Random capillary glucose | |||||||
| x | x | x | Anggaard | x | x | x | x | Non‐fasting blood glucose | x | ||||
| x | x | x | PRECARD | x | x | Oral glucose tolerance test |
Not all screening tests used are shown; see Characteristics of included studies for full details. The Kaiser Permanente 1965, South‐East London 1967, and Stockholm 1969 trials did not specify the contents of their biochemical screening. It seems unlikely that cholesterol was not included.
The uptake in the first screening round ranged between 50% (Mankato 1982) and 90% (Ebeltoft 1992) with a median of 80%. Kaiser Permanente 1965 did not use screening rounds at specific intervals but urged the intervention group repeatedly by written invitations and phone calls to utilise a pre‐paid health check.
We chose to label the studies with the year of trial start, instead of year of publication, for the following reasons: 1) year of publication would make the data look much younger than it is, especially in trials with very long follow‐up, 2) results were often scattered in several papers in different years, whereas year of trial start is more well‐defined. Other citations are labelled in the standard fashion with year of publication.
Excluded studies
We excluded 56 studies found in the updated search (Characteristics of excluded studies). The list of excluded studies (Characteristics of excluded studies) also includes one important but not eligible trial not found in the search (Lindholt 2017). In the previous version of the review, two articles were awaiting assessment (Brett 2012; Stickler 2000). These have been excluded.
Risk of bias in included studies
Risk of bias varied considerably between trials, but there were problems in most trials, mainly in relation to outcomes that required participation for follow‐up. The two major issues were lack of blinding and missing outcome data, whereas selection bias was unlikely in most trials.
For our primary outcomes, nine out of eleven trials reporting on these had low risk of selection bias, and ten out of eleven were at low risk of attrition bias. Kaiser Permanente 1965, South‐East London 1967 and Ebeltoft 1992 were biased towards no effect because of contamination and low contrast between groups. For OXCHECK 1989, we chose to combine all three intervention groups to achieve more power, accepting a loss of contrast. However, the results were similar when analysing the results for maximum contrast, that is only comparing those screened in year one with those in year four. Four trials were biased by design in favour of the screening group, due to follow‐up of detected problems at special centres (Göteborg 1963; Göteborg 1970; Malmö 1969; WHO 1971).
For other outcomes, detection bias, biased reporting of subjective outcomes, and biased dropout were major concerns in many of the trials. In particular, the patient‐reported outcomes should be viewed with caution due to the lack of blinding. Readers are referred to the 'Risk of bias' figures for an overview (Figure 2; Figure 3).

'Risk of bias' summary: review authors' judgements about each risk of bias item for each included study

'Risk of bias; graph: review authors' judgements about each risk of bias item presented as percentages across all included trials
Allocation
Seven trials used a genuinely random method for generating the randomisation sequence (DanMONICA 1982; Ebeltoft 1992; Göteborg 1970; Inter99 1999; Mankato 1982; OXCHECK 1989; Stockholm 1969). We could not determine how six trials generated the sequence (Family Heart 1990; New York 1971; Salt Lake City 1972; South‐East London 1967; Titograd 1971; WHO 1971). Four trials used allocation methods such as date of birth (Göteborg 1963; Kaiser Permanente 1965; Malmö 1969; Northumberland 1969), but these trials included participants through lists or registers and allocated them all at once before making any contact with them, and we therefore judged the risk of selection bias to be low.
We judged allocation to be adequately concealed in 14 trials (DanMONICA 1982; Ebeltoft 1992; Family Heart 1990; Göteborg 1963; Göteborg 1970; Inter99 1999; Kaiser Permanente 1965; Malmö 1969; Mankato 1982; Northumberland 1969; OXCHECK 1989; South‐East London 1967; Stockholm 1969; WHO 1971). It was unclear in three trials (New York 1971; Salt Lake City 1972; Titograd 1971).
We thus judged 11 trials as likely to be free from selection bias (DanMONICA 1982; Ebeltoft 1992; Göteborg 1963; Göteborg 1970; Inter99 1999; Kaiser Permanente 1965; Malmö 1969; Mankato 1982; Northumberland 1969; OXCHECK 1989; Stockholm 1969). We could not rule out selection bias in six trials. Five trials did not describe sequence generation (Family Heart 1990; New York 1971; Salt Lake City 1972; Titograd 1971; WHO 1971), and South‐East London 1967 used a matching procedure, which was unclearly described, for randomisation, and the sizes of the groups varied between publications.
Blinding
Performance bias
Performance bias in this context meant differences in medical attention and preventive and screening activities resulting from knowledge of allocation.
In eight trials, the risk of performance bias was low (DanMONICA 1982; Göteborg 1963; Göteborg 1970; Inter99 1999; Kaiser Permanente 1965; Malmö 1969; Mankato 1982; WHO 1971), in four trials it was unclear (Family Heart 1990; New York 1971; Stockholm 1969; Titograd 1971), and in five trials the risk was high (Ebeltoft 1992; Northumberland 1969; OXCHECK 1989; Salt Lake City 1972; South‐East London 1967), because the primary care physicians clearly had knowledge of the status of their patients. For example, in one trial primary care physicians had lifestyle conversations with a subset of their own patients (Ebeltoft 1992), and in another trial there was a sticker on the medical records indicating the allocation (OXCHECK 1989).
Detection bias
We present a single assessment of the risk of detection bias for each trial, although there were exceptions for some outcomes in some trials (see Characteristics of included studies).
Eight trials had a low risk for most outcomes (DanMONICA 1982; Ebeltoft 1992; Göteborg 1970; Inter99 1999; Kaiser Permanente 1965; Malmö 1969; OXCHECK 1989; Stockholm 1969), four trials had unclear risk (New York 1971; South‐East London 1967; Titograd 1971; WHO 1971), and five trials had a high risk (Family Heart 1990; Göteborg 1963; Mankato 1982; Northumberland 1969; Salt Lake City 1972).
Of the three trials that adjudicated the cause of death given on death certificates, one did this blinded (Malmö 1969), one unblinded (Göteborg 1963), and in one it was unclear (WHO 1971). The other eight trials reporting on mortality used public registers or death certificates without re‐classification (DanMONICA 1982; Ebeltoft 1992; Göteborg 1970; Inter99 1999; Kaiser Permanente 1965; OXCHECK 1989; South‐East London 1967; Stockholm 1969).
We considered answers to questionnaires to be at high risk of bias due to the lack of blinding of the intervention group.
Incomplete outcome data
Objective outcomes
For objective outcomes (for example mortality, physician visits), we judged the risk of attrition bias to be low in ten trials (DanMONICA 1982; Ebeltoft 1992; Göteborg 1963; Göteborg 1970; Inter99 1999; Malmö 1969; OXCHECK 1989; South‐East London 1967; Stockholm 1969; WHO 1971), unclear in six trials (Family Heart 1990; Kaiser Permanente 1965; Mankato 1982; New York 1971; Northumberland 1969; Titograd 1971), and high in one trial (Salt Lake City 1972), which excluded participants who changed economic status, did not attend for screening, did not consult their physician about screening results, or did not participate in the one‐year follow‐up. This resulted in only 49% of the intervention group and 82% of the control group participants being included in the analyses. In Kaiser Permanente 1965, the trial authors considered participants as lost to follow‐up when they left the Kaiser health plan. This resulted in the loss of more than one third of participants for most outcomes. For mortality, only people leaving California were lost. The trial authors used registers, and estimated the loss to be 8% to 18% over the 16‐year study period (Friedman 1986). Other trial authors had access to mortality registers with much fewer losses (Ebeltoft 1992; Göteborg 1963; Göteborg 1970; Malmö 1969; OXCHECK 1989; South‐East London 1967; Stockholm 1969; WHO 1971). WHO 1971 did not report cancer mortality from the Belgian part of the trial. The reason given for this was that all non‐coronary deaths were only categorised as such, without detailing the cause of death, as per the trial's protocol. The risk of bias due to this was unclear.
Subjective outcomes
In unblinded trials, attrition bias (bias due to incomplete outcome data in those lost to follow‐up) is a threat to any outcome that is dependent on the active participation of participants for follow‐up, for example answering a questionnaire, even when numbers lost to follow‐up are similar in the groups. None of the trials were at low risk of attrition bias, nine trials did not report subjective outcomes (DanMONICA 1982; Göteborg 1963; Malmö 1969; Northumberland 1969; New York 1971; OXCHECK 1989; Stockholm 1969; Titograd 1971; WHO 1971), and the risk was high in all other trials (Ebeltoft 1992; Family Heart 1990; Göteborg 1970; Inter99 1999; Kaiser Permanente 1965; Mankato 1982; Salt Lake City 1972; South‐East London 1967).
Five trials investigated the possible effects of the missing data. In Inter99 1999, the authors investigated the effects of non‐response with logistic regression on serial measurements of self‐reported health. They found that extreme values of self‐reported health were associated with non‐response but judged it unlikely to have seriously biased the results (Pisinger 2009). The British Family Heart Study (Family Heart 1990) used imputation with the last observation carried forward in the analysis of self‐reported health and found no important differences. In another analysis they found twice as many smokers among non‐attenders as among attenders. The Minnesota Heart Health Program trial (Mankato 1982) and OXCHECK 1989 found similar evidence of bias in relation to smoking but no large differences for other variables.The Ebeltoft 1992 authors reported in a letter that there were no differences in sex, age, baseline smoking, and baseline body mass index (BMI) between non‐attenders in the intervention and control groups, but did not present the data (Engberg 2002). Important differences might not be statistically significant when the numbers are small.
None of the trials used optimal imputation techniques (for example multiple imputation). Last observation carried forward may give biased results, and the direction of the bias is unpredictable (Jørgensen 2014). Also, there might be differences in unmeasured factors, such as motivation and ability to change lifestyle, and we advise caution in interpreting these outcomes.
Selective reporting
We found nine trials to be at low risk of reporting bias (DanMONICA 1982; Family Heart 1990; Göteborg 1963; Göteborg 1970; Inter99 1999; Malmö 1969; Mankato 1982; OXCHECK 1989; WHO 1971), in four trials the risk was unclear (Ebeltoft 1992;; Northumberland 1969; Salt Lake City 1972; Stockholm 1969) and in four trials the risk of reporting bias was high: Kaiser Permanente 1965 collected data on surgery, prescriptions, and reasons for hospitalisation but did not publish them. They also collected and reported results on new diagnoses in early publications but not for the planned study period; South‐East London 1967 collected but did not report data on referrals, prescriptions, and investigations carried out; and New York 1971 and Titograd 1971 have never published any results. A funnel plot for mortality did not suggest publication bias (Figure 4).
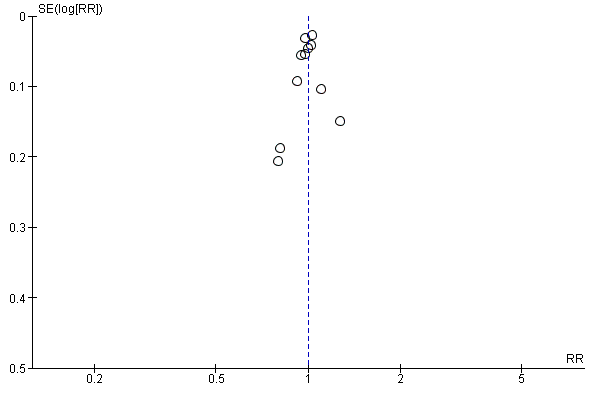
Funnel plot of comparison 1. Health checks versus control, outcome: 1.1 Total mortality.
Other potential sources of bias
Four trials had a design that could favour the screening group (Göteborg 1963; Göteborg 1970; Malmö 1969; WHO 1971). In these trials, conditions identified at screening were treated and followed at a special clinic or by the researchers whereas participants in the control group used their normal physicians. However, this could also increase possible iatrogenic harm.
Screening of the control group (contamination) would dilute both the beneficial and the harmful effects of the intervention. Only two trials assessed the number of participants in the control group having health checks. In Kaiser Permanente 1965, after 16 years, the mean number of health checks in the control group was 2.8 compared with 6.8 in the screening group, and 36% of the control group had not had a health check compared to 16% of the screening group. However this result cannot be generalised to the other trials or other populations, mainly because the participants were all members of the same health plan with access to the same high‐profiled multiphasic health screening. Also, screening has long been more popular in the USA than in Europe. In the South‐East London Screening Study (South‐East London 1967), there was very little interest in screening among the participants in the control group, and none were screened for the first five years (Trevelyan 1973). However, the control group was offered screening after five years, which biased the nine‐year results towards no effect.
The British Family Heart Study (Family Heart 1990), used both an internal and an external control group in order to investigate contamination. They found similar results when comparing with either control group indicating that contamination was not a big problem. In Ebeltoft 1992, which was set in a small town, the trial authors noted that the trial appeared to have a large positive influence on the health behaviours of the control group (Lauritzen 2012). Also, the control group was offered screening after five years while some data were collected for eight years. Mankato 1982 was conducted during a health promotion campaign, which may have diminished the effect of the intervention.
In summary, we found seven trials with a low risk of contamination (DanMONICA 1982; Göteborg 1963; Göteborg 1970; Inter99 1999; Malmö 1969; Stockholm 1969; WHO 1971), six trials in which it was unclear (Family Heart 1990; New York 1971; Northumberland 1969; OXCHECK 1989; Salt Lake City 1972; Titograd 1971), and four trials with a high risk of contamination (Ebeltoft 1992; Kaiser Permanente 1965; Mankato 1982; South‐East London 1967).
Two trials randomised people who had returned an initial questionnaire on health and lifestyle (Ebeltoft 1992; OXCHECK 1989). This limited the external validity because of self‐selection of people with an interest in health and lifestyle (Pill 1988; Waller 1990).
Effects of interventions
See: Summary of findings for the main comparison General health checks versus usual care
Please note that included trials are labelled with year of trial start, rather than publication year, as described above.
Total mortality
Eleven trials reported total mortality (DanMONICA 1982; Ebeltoft 1992; Göteborg 1963; Göteborg 1970; Inter99 1999; Kaiser Permanente 1965; Malmö 1969; OXCHECK 1989; South‐East London 1967; Stockholm 1969; WHO 1971).The median length of follow‐up was 10 years and the range was 4 to 30 years.The median event rate in the intervention and control groups combined was 7% and the range was 2% (OXCHECK 1989), to 36% (DanMONICA 1982), reflecting the different lengths of follow‐up (Table 2).
| Deaths in intervention group | Participants in intervention group | Deaths in control group | Participants in control group | |
| Total mortality | ||||
| 146 | 1010 | 306 | 1956 | |
| 585 | 5138 | 643 | 5536 | |
| 196 | 3292 | 169 | 3132 | |
| 492 | 3064 | 2503 | 29122 | |
| 49 | 809 | 60 | 804 | |
| 1293 | 10004 | 2636 | 20018 | |
| 1325 | 30489 | 1186 | 26971 | |
| 205 | 8307 | 54 | 2783 | |
| 49 | 2030 | 43 | 1434 | |
| 595 | 11629 | 2568 | 47987 | |
| 2033 | 4789 | 4399 | 12994 | |
| Cancer mortality | ||||
| 35 | 1010 | 73 | 1956 | |
| 173 | 5138 | 190 | 5536 | |
| 50 | 3292 | 47 | 3132 | |
| 144 | 3064 | 757 | 29122 | |
| 17 | 809 | 9 | 804 | |
| 315 | 10004 | 728 | 20018 | |
| 564 | 23358 | 456 | 20957 | |
| 82 | 8307 | 23 | 2783 | |
| Cardiovascular mortality | ||||
| 74 | 1010 | 132 | 1956 | |
| 240 | 5138 | 256 | 5536 | |
| 84 | 3292 | 52 | 3132 | |
| 206 | 3064 | 947 | 29122 | |
| 14 | 809 | 33 | 804 | |
| 526 | 10004 | 1077 | 20018 | |
| 428 | 30489 | 398 | 26971 | |
| 83 | 8307 | 17 | 2783 | |
| 583 | 4798 | 1087 | 12994 |
aSkewed randomisation in age and needs strata, giving unbalanced baselines.
bWe used a published effect estimate that took the matched pair cluster randomisation into account
cSkewed randomisation in age and gender strata, giving unbalanced baselines.
dSkewed randomisation in age and gender strata, giving unbalanced baselines.
Health checks have little or no effect on total mortality (RR 1.00, 95% CI 0.97 to 1.03; 11 trials; 233,298 participants and 21,535 deaths; high‐certainty evidence, I2 = 0%; Analysis 1.1). Subgroup and sensitivity analyses did not alter the results.
Disease‐specific mortality
Cancer mortality
Eight trials reported cancer mortality (Göteborg 1963; Göteborg 1970; Kaiser Permanente 1965; Malmö 1969; OXCHECK 1989; South‐East London 1967; Stockholm 1969; WHO 1971). Health checks have little or no effect and did not reduce cancer mortality (RR 1.01, 95% CI 0.92 to 1.12; 8 trials; 139,290 participants and 3663 deaths; high‐certainty evidence, I2 = 33%; Analysis 1.14). Subgroup and sensitivity analyses did not alter the results. Göteborg 1970 found a reduction in cancer mortality (RR 0.87, 95% CI 0.76 to 0.99), which is surprising since that trial only screened for cardiovascular risk factors. Furthermore, Göteborg 1970 was not successful in reducing smoking. We believe that the result is due to chance.
Cardiovascular mortality
Nine trials reported cardiovascular mortality, although with differing definitions (DanMONICA 1982; Göteborg 1963; Göteborg 1970; Kaiser Permanente 1965; Malmö 1969; OXCHECK 1989; South‐East London 1967; Stockholm 1969; WHO 1971). Health checks probably have little or no effect and did not reduce cardiovascular mortality (RR 1.05, 95% CI 0.94 to 1.16; 9 trials; 170,227 participants and 6237 deaths; moderate‐certainty evidence; I2 = 65%; Analysis 1.27). One possible explanation for the large heterogeneity was the different definitions of the outcome among trials. For example, WHO 1971 only reported mortality from coronary heart disease whereas other trials combined deaths from ischaemic heart disease and stroke (DanMONICA 1982). One trial found a large reduction in cardiovascular mortality with health checks (Malmö 1969), while two trials found substantial increases (DanMONICA 1982; South‐East London 1967). Subgroup and sensitivity analyses did not alter the results, nor explain heterogeneity.
Morbidity
Combined fatal and non‐fatal ischaemic heart disease
Four trials reported combined fatal and non‐fatal ischaemic heart disease or coronary heart disease (DanMONICA 1982; Göteborg 1970; Inter99 1999; WHO 1971). Health checks have little or no effect on this (RR 0.98, 95% CI 0.94 to 1.03; 4 trials; 164,881 participants, 10,325 events; high‐certainty evidence; I2 = 11%; Analysis 1.40).
Combined fatal and non‐fatal stroke
Three trials reported combined fatal and non‐fatal stroke (DanMONICA 1982; Göteborg 1970; Inter99 1999). Health checks probably have little or no effect on this (RR 1.05 95% CI 0.95 to 1.17; 3 trials; 107,421 participants, 4543 events; moderate‐certainty evidence, I2 = 53%; Analysis 1.41). One trial found a large harmful effect of health checks (DanMONICA 1982), which caused the heterogeneity. This trial had the longest follow‐up of all trials (30 years), employed broad screening and used little lifestyle intervention.
Other measures of morbidity
Six other trials reported some measure of morbidity.
The OXCHECK 1989 authors supplied us with data on incident cancers. When pooling the three intervention groups and comparing with the control group the RR was 1.12 (95% CI 0.85 to 1.48). When using only the group screened at year one, for maximum contrast, the RR was 1.17 (95% CI 0.85 to 1.63).
Kaiser Permanente 1965 found that, after seven years, 61% of the intervention group reported having a chronic condition compared to 54% in the control group. The conditions were not defined and were likely to have included risk factors like elevated blood pressure or blood glucose.
The South‐East London Screening Study (South‐East London 1967) did not find effects on the prevalence of angina, changes on electrocardiogram indicating ischaemia, or bronchitic symptoms after five years. For angina the prevalence was 21.9% (screening) and 22.4% (control group), for ischaemic changes 17.9% (screening) and 16.6% (control), and for bronchitic symptoms 29.0% (screening) and 30.6% (control). They also specified the reasons for hospitalisation, using broad categories, such as cardiovascular causes, central nervous system causes, and neoplasms, but did not find differences.
Malmö 1969 reported reasons for hospitalisation in disease categories, for example ischaemic heart disease, cerebrovascular disease, and neoplasms, and did not find differences between groups. There was low power due to the stratification in disease categories. See the results on total hospitalisation below.
The British Family Heart Study (Family Heart 1990), investigated the effect on the prevalence of four conditions. They found substantially more participants with self‐reported high blood pressure and high cholesterol in the screening group, slightly more men with self‐reported diabetes in the screening group, and no effect on self‐reported coronary heart disease. After one year, 6.9% of the control group men had high blood cholesterol compared to 14% of the screening group. For women the results were 3.8% (control) and 9.7% (screening). For high blood pressure, the results for men were 14.8% (control) and 17.1% (screening); and for women, 13.0% (control) and 16.2% (screening). For diabetes, the results for men were 1.7% (control) and 3.3% (screening); and for women, 1.1% (control) and 1.2% (screening). For coronary heart disease, the results for men were 5.5% (control) and 5.9% (screening); and for the women, 1.1% (control) and 1.9% (screening). The results were similar when the trial authors calculated the results within each practice and pooled results. The results were at risk of detection bias and attrition bias.
Inter99 1999 found that health checks increased the incidence of diabetes in the first year, HR 1.68 (P = 0.0001), but that this evened out during further follow‐up.
In summary, health checks did not reduce morbidity in terms of actual illness, but they may increase the number of people diagnosed with elevated risk factors.
New diagnoses
In addition to conditions identified through the screening itself, screening might increase diagnostic activity between scheduled screenings due to increased physician contact in relation to follow‐up visits or due to a lowered threshold for consulting a physician. Cumulative rates of new diagnoses over time in the screened and unscreened groups would allow an assessment of the full effect of screening on diagnostic activity. However, only one trial reported such results (Kaiser Permanente 1965), and only for the first six years. In a 40% sample, Kaiser Permanente 1965 found a sharp divergence in the mean annual number of new diagnoses per participant immediately after the intervention started, with the differences being statistically significant each year. By adding the results for each year we found a mean number of new diagnoses per participant of 4.3 in the screening group and 3.6 in the control group. This corresponded to a 20% increase. The trial lasted for 16 years but follow‐up for new diagnoses was not continued.
Four trials reported their findings at the first screening of the intervention group but without comparisons with the control group over time. South‐East London 1967 found an average of 2.3 diseases per participant at the first screening. Of these, 53% were not previously known. Ebeltoft 1992 reported the percentage of participants with abnormal findings prompting health advice at the initial screening to be 76%. The most common reasons were raised CO concentration in expiratory air in smokers (37%), low physical endurance (30%), poor hearing (19%), poor sight (12%), and being overweight (16%). Increased cardiovascular risk was found in 11%, hypercholesterolaemia in 10%, hypertension in 10%, and elevated liver enzymes in 13%. Salt Lake City 1972 found a total of 2031 abnormalities in 384 people screened. This trial used very broad biochemical screening.
In summary, health checks may increase the number of new diagnoses (low‐certainty evidence).
Admission to hospital
Five trials reported hospitalisation using different measures, for example, admission rates, number of people admitted once or more, or number of days in hospital.
Kaiser Permanente 1965 reported the mean number of days in hospital over 18 years of follow‐up. The results were 10.0 days in the intervention group and 10.4 days in the control group. Roughly one third of participants had missing data. South‐East London 1967 reported the number of participants admitted to hospital once or more during nine years of follow‐up, RR 1.04 (95% CI 0.96 to 1.13). The amount of missing data was unclear but was probably low. Malmö 1969 also studied the number admitted once or more and found similar results, RR 1.05 (95% CI 0.92 to 1.20). There were 3% to 5% missing data. Salt Lake City 1972 compared hospitalisation rates before and after the intervention and did not find an effect, but they did find an effect on the number of nights in hospital in one of three subgroups, which was an unreliable result due to biased exclusions after randomisation. Ebeltoft 1992 compared admission rates in the two intervention groups with the control group and did not find an effect after eight years, rate ratio of 0.91 (95% CI 0.63 to 1.32). They also compared the random sample invited to participate in the trial with all not invited and found similar results, rate ratio of 0.97 (95% CI 0.80 to 1.18). There were 5% missing data.
In summary, health checks may make little or no difference to admission rates, number of people admitted once or more, or number of days in hospital (low‐certainty evidence).
Disability
Three trials investigated the effect on disability. Kaiser Permanente 1965 found that after 16 years 31% of the screening group and 30% of the control group reported total or partial disability on a questionnaire. Attrition was roughly one third and response rates around 75%, which left only half of the people randomised in this analysis. South‐East London 1967 found that 2.5% in the screening group and 1.8% in the control group reported major disability after five years. There were between 40% and 50% missing data in this analysis. Salt Lake City 1972 compared the number of disability days before and after the intervention and did not find an effect.
In summary, health checks may make little or no difference to disability (low‐certainty evidence).
Worry
Only two trials reported relevant results, using scales measuring psychological distress.
Ebeltoft 1992 used the General Health Questionnaire (GHQ‐12) at baseline and after one and five years. A decrease in score indicates a beneficial effect of the intervention. After one year, the change from baseline in the screening groups was an increase of 0.05 and in the control group a decrease of 0.16, P = 0.6. After five years, the screening group had a decrease of 0.23 and the control group had a decrease of 0.39, P = 0.73. They also investigated subgroups of smokers, overweight participants, people who were informed of an elevated risk and people informed of no elevated risk, and did not find effects. Participation was 79% after five years.
South‐East London 1967 used the Middlesex Hospital Questionnaire on a subset of participants after five years. In the anxiety domain of the scale, the trial authors found lower scores in the intervention group among men (lower scores are better). When pooling men and women, we found a mean score of 4.14 (standard deviation (SD) = 3.38, 602 participants) in the intervention group and 4.48 (SD = 3.63, 572 participants) in the control group, P = 0.10 (t‐test, equal variances). In the other domains assessed with this scale ('phobic', 'obsessional', 'somatic', 'depression', 'hysteria'), there were no effects. Follow‐up was roughly 90%.
In summary, health checks may make little or no difference to worry (low‐certainty evidence).
Self‐reported health
Four trials reported self‐reported health.
South‐East London 1967 found that after five years 53.6% of the screening group and 56.5% of the control group reported good or excellent health in the preceding two weeks (Chi2 = 3.274, P = 0.07).
Ebeltoft 1992 used a five‐point scale at baseline and after five years. After five years, 70% and 72% of the two intervention groups reported good or excellent health compared to 71% of the control group. Data on change from baseline were only available in a graph. This showed that approximately 12% in the intervention groups had an improvement in self‐reported health compared to approximately 20% in the control group.
In Family Heart 1990, 79.5% of the screening group and 75.7% of the internal control group reported good or excellent health after one year. This analysis used last observation carried forward for missing data. The pooled difference, taking into account the 13 different practices, was 3.8% in favour of screening, P = 0.004.
Inter99 1999 used SF‐12 and found slower deterioration of both physical and mental health components in the intervention group. For mental health, the difference after five years was approximately 2 on a 100‐point scale, where 50 is the mean of a reference population with a SD of 10. The effect was even smaller for physical health but was difficult to assess because of baseline imbalances in scores. The trial authors found indications of biased non‐response.
In summary, health checks may slightly improve self‐reported health (low‐certainty evidence).
Referrals to specialists
Only one trial (Ebeltoft 1992), reported on this outcome, but we could not use the results in our analysis. The trial authors only had data from 1995 to 1999 but the screening took place in 1992 to 1993 (intervention groups screened), and 1997 (intervention groups and control group screened). Thus the expected increase in referrals following the intervention was not included in the analysis and any contrast between groups would be diluted by the 1997 screening. The trial authors made two comparisons and did not find effects in either analysis. When comparing the screening and control groups, the rate ratio was 1.04 (95% CI 0.85 to 1.26). When comparing the random sample invited to participate in the trial versus all eligible people not invited, the rate ratio was 0.94 (95% CI 0.84 to 1.06).
In summary, it is uncertain whether health checks increase or reduce referrals to specialists, as the certainty of this evidence is very low.
Non‐scheduled visits to general practitioners
Five trials reported physician visits. The length of follow‐up was between one and nine years, with missing outcome data ranging between 5% (Ebeltoft 1992) and 51% (Salt Lake City 1972).
Kaiser Permanente 1965 found a mean number of physician visits of 16.0 in both groups after five years, not including the screenings themselves. The results were reported without measures of uncertainty and data on this outcome were collected from a 20% subsample.
South‐East London 1967 did not find an effect on the mean annual number of physician visits. It was not clear whether the screening visits were included in this, and we cannot tell whether the results were from the five‐year or nine‐year follow‐up. We excluded participants who left the study before one year from the analyses (14% from the screening group and 13% from the control group).
Northumberland 1969 found an average number of consultations per participant of 5.4 in the screening group and 5.0 in the control group over 1½ years. This did not include the screenings themselves. When adding the screenings the results were 6.3 in the screening group and 5.0 in the control group. The trial authors did not specify the type of health check, and there was a high risk of detection bias, as the allocation was noted on the front cover of the participant's record.
Salt Lake City 1972 did not find effects after one year, but this result was unreliable due to biased exclusions. The screening visits were not included in the analysis.
Ebeltoft 1992 found an increased rate of physician visits after five years in the screening plus health discussion group compared to the control group, rate ratio of 1.15 (95% CI 1.02 to 1.31), but not in the screening only group compared to controls, rate ratio of 1.01 (95% CI 0.89 to 1.15). When comparing all those invited to participate in the trial with all not invited, the rate ratio was 1.01 (95% CI 0.93 to 1.10). However, this comparison included screening of the control group in 1997, diluting any differences between groups. The trial authors found a downward trend in the rate ratio over time favouring the intervention, but in the absence of an overall effect this is not a relevant observation. It likely reflects the initial increase in visits generated by the screenings themselves, which gave a high starting point for the trend analysis.
In summary, health checks may make little or no difference to the number of physician visits (low‐certainty evidence).
Additional diagnostic procedures required due to positive screening tests
We did not find any trials that reported this outcome.
Kaiser Permanente 1965 reported the mean number of laboratory tests per participant after five and 10 years, based on a 20% sample. After five years it was 23.8 in the screening group and 23.3 in the control group. The data after 10 years were not reported but the trial authors stated that there was no difference. The number of laboratory tests did not include the tests used at screening.
Prescriptions and surgery
None of the trials reported the total number of prescriptions, new drugs prescribed, or the number of operations performed. This is unfortunate since these are important factors for balancing the benefits and harms of health checks and for estimating the costs.
Five trials provided some results of relevance.
Göteborg 1970 examined random samples of the intervention group and control group and found that after 10 years of follow‐up 26.0% of the intervention group used antihypertensive medications compared to 19.6% in the control group (Chi2 = 16.41, P < 0.0001, our calculation). Kaiser Permanente 1965 reported narratively that prescription rates gathered from pharmacies showed a non‐significant trend towards increased prescription in the screening group, but only analysed data from years six and seven. Ebeltoft 1992 presented data on self‐reported use of selected types of drugs after five years. In the screening groups, 4.8% reported using blood pressure medication compared to 6.8% in the control group (Chi2 = 1.42, P = 0.23, our calculation). For diuretics, the figures were 3.7% (screening), and 3.9% (control group), and for heart medication they were 0.9% (screening), and 1.0% (control). Family Heart 1990 reported narratively that there was no difference between the intervention and control groups regarding use of drugs to lower blood pressure or cholesterol, or for diabetes. Mankato 1982 reported that the proportion of participants on blood pressure medication after one year was 13.8% in the intervention group and 9.8% in the control group (P < 0.05).
In summary, it is uncertain whether health checks increase or reduce prescriptions and surgery, as the certainty of this evidence is very low.
Absence from work
Two trials reported absence from work (Kaiser Permanente 1965; South‐East London 1967). Neither trial found an effect, and neither trial reported the exact results but only mentioned their findings in a narrative.
It is uncertain whether health checks increase or reduce absence from work as the certainty of this evidence is very low.
Subgroup and sensitivity analyses
We planned and performed several subgroup and sensitivity analyses. Some of the resulting subgroups were based on very few trials but are presented for completeness (see graphs). They should be interpreted with caution and we found no convincing patterns.
For outcomes not included in the meta‐analyses we were not able to discern any patterns except that the more recent trials often had a strong focus on lifestyle interventions, often had changes in risk factors as their primary outcomes, and were designed accordingly, with shorter follow‐up (Ebeltoft 1992; Family Heart 1990; Mankato 1982; OXCHECK 1989).
Discusión
Resumen de los resultados principales
Se encontraron 17 ensayos aleatorios que compararon el efecto de las ofertas sistemáticas de uno o más controles de salud versus la atención habitual, 15 de los cuales habían presentado los resultados. Los controles de salud tienen poco o ningún efecto sobre la mortalidad total o por cáncer (evidencia de certeza alta) y probablemente tienen poco o ningún efecto sobre la mortalidad cardiovascular (evidencia de certeza moderada). De manera similar, los controles de salud tienen poco o ningún efecto sobre la cardiopatía isquémica mortal y no mortal (evidencia de certeza alta) y probablemente tienen poco o ningún efecto sobre el accidente cerebrovascular mortal y no mortal (evidencia de certeza moderada). Esta actualización incluyó un nuevo ensayo, cuyos resultados confirman los de los ensayos anteriores.
Para la mortalidad total, el intervalo de confianza incluye una reducción del 3% y un aumento del 3%, y ambos serían clínicamente relevantes. Sin embargo, tampoco hubo reducciones para las causas de muerte que se ven más probablemente influenciadas por los controles de salud, la mortalidad cardiovascular y específica del cáncer. Se esperaría una latencia significativa de los efectos sobre la mortalidad aunque se incluyeron varios ensayos con un seguimiento muy largo. Los resultados indican que la ausencia de un efecto sobre la mortalidad total no es un resultado del azar, ni se debe al poder estadístico reducido.
Compleción y aplicabilidad general de las pruebas
La ausencia de un efecto sobre los resultados primarios se vio representada por una falta de efecto sobre la mayoría de los resultados secundarios. Los resultados que se esperaba que representaran efectos beneficiosos de la intervención fueron estudiados e informados de modo más adecuado que los resultados perjudiciales. Se esperó que se informara la cantidad de nuevos diagnósticos y tratamientos iniciados porque los mismos son elementos importantes de las pruebas de detección, aunque esto sucedió con poca frecuencia. Sólo un ensayo informó de la cantidad de nuevos diagnósticos en los dos grupos, y solo para los seis primeros años aunque la intervención continuó por 16 años (Kaiser Permanente 1965). La administración de fármacos solo se evaluó para fármacos seleccionados y fue sobre todo autoinformada. También se esperó que se informara la cantidad de pruebas de seguimiento y de derivaciones a los especialistas debido a que representan la carga de pruebas de detección para los participantes y el sistema de asistencia sanitaria. Sin embargo, estos resultados se informaron con poca frecuencia. Sin conocer la cantidad de investigaciones “posteriores” después de las pruebas de detección, no es posible evaluar los efectos perjudiciales ni los costes (Walter 2013). Por mucho tiempo se ha reconocido lo anterior como un problema para las pruebas de detección en general (Raffle 2007).
Se esperaría una mayor actividad diagnóstica y terapéutica si los controles de salud general dieran lugar a una mejoría en la salud, al menos a corto plazo, debido a que el anterior es el mecanismo principal de la intervención. Sin embargo, más diagnósticos y más tratamiento a falta de mejorías en la salud indicarían un sobrediagnóstico y sobretratamiento. El sobrediagnóstico es el diagnóstico de trastornos que no habrían causado síntomas ni habrían causado otros problemas para los pacientes y es un problema inherente a cualquier programa de detección. El sobrediagnóstico da lugar al sobretratamiento, que ha estado documentado en particular en las pruebas de detección del cáncer aunque también es un efecto perjudicial evidente en las pruebas de detección de los factores de riesgo cardiovasculares, como lo representan los grandes números necesarios a tratar para lograr un resultado beneficioso adicional en la prevención primaria de las enfermedades cardiovasculares (Welch 2011).
Los estudios incluidos investigaron las consecuencias psicológicas de los controles generales de salud a un grado algo mayor, aunque solo en una minoría de los ensayos. Un resultado interesante es que no se encontró ningún efecto fiable sobre las medidas de la dificultad psicológica, la salud autoinformada o el ausentismo laboral. Una revisión sistemática (Boulware 2007), encontró efectos beneficiosos de las evaluaciones de salud periódicas sobre la preocupación en un ensayo en personas de edad muy avanzada (Patrick 1999), y una revisión sistemática de las puntuaciones del riesgo de cardiopatías coronarias no encontró efectos perjudiciales en dos estudios de "calidad regular" (Sheridan 2008). Con respecto a la hipertensión, en los estudios transversales se ha hallado que los pacientes con diagnóstico de hipertensión tuvieron una peor salud autoinformada, de forma independiente de si fueron diagnosticados correctamente o no (Barger 2006; Bloom 1981). Sin embargo, una revisión de los estudios de cohortes encontró efectos contradictorios sobre el ausentismo y evidencia de "calidad regular" de que las pruebas de detección para la hipertensión no causan efectos psicológicos adversos (Sheridan 2003). Una revisión encontró efectos psicológicos adversos a corto plazo a partir de la predicción del riesgo de enfermedad en una persona, pero no efectos a largo plazo (Shaw 1999). De manera similar, una revisión de los ensayos de cualquier clase de pruebas de detección no encontró ningún efecto a largo plazo sobre la ansiedad, la depresión ni la calidad de vida, aunque los autores no pudieron establecer conclusiones acerca de los efectos a corto plazo (Collins 2011). Ninguno de los ensayos examinados informó de los efectos psicológicos adversos a corto plazo.
La ausencia de efectos beneficiosos indica que los controles generales de salud no funcionaron en la forma prevista en los ensayos incluidos. A continuación, se exploran los posibles motivos de la falta evidente de un efecto así como los retos al generalizar los resultados a la actualidad.
Sesgo
Tres ensayos en los metanálisis de la mortalidad estaban sesgados hacia ningún efecto (Ebeltoft 1992; Kaiser Permanente 1965; South‐East London 1967), y en un ensayo se otorgó prioridad al poder sobre el contraste en la fusión de los grupos de intervención (OXCHECK 1989). Sin embargo, en un análisis de sensibilidad post hoc, la eliminación de estos ensayos de los análisis no cambió los resultados y amplió solo levemente los intervalos de confianza.
Tipo de control de salud
Muchos de los ensayos más antiguos investigaron regímenes de detección muy amplios, con un gran potencial para detectar anomalías. Las personas sanas con frecuencia presentan una patología que puede ser detectada mediante un examen, imagenología (Furtado 2005; Xiong 2005), o biopsia (Welch 2004), aunque este hecho no necesariamente es beneficioso y puede ser perjudicial (Welch 2011). Los resultados de Kaiser Permanente 1965 sugirieron que lo fue, ya que encontraron aumentos en la mortalidad debido al cáncer linfohematopoyético y al suicidio. El anterior puede ser un resultado aleatorio aunque el modelo apareció después de siete años y continuó desde el principio hasta el final de los 16 años del ensayo. El aumento en las pruebas diagnósticas disponibles podría dar lugar a procedimientos de seguimiento más invasivos en la actualidad y a más tratamientos farmacológicos y cirugías, por ejemplo para el cáncer de próstata y de tiroides, con los consiguientes efectos perjudiciales. Hoy día, ninguna autoridad recomienda controles de salud tan amplios como los estudiados en algunos de los ensayos más antiguos aunque todavía son comunes, en particular entre los proveedores comerciales (Grønhøj Larsen 2012).
La mayoría de los ensayos que informaron sobre la mortalidad no tuvieron un componente explícito de intervención del estilo de vida, aunque no se espera que este elemento sea particularmente importante. Se han estudiado ampliamente las intervenciones de factores de riesgo múltiples dirigidas a las poblaciones en general para la prevención primaria de la cardiopatía coronaria, y no se encontró un efecto sobre la mortalidad total ni específica de la cardiopatía coronaria, ni en el número de eventos cardiovasculares (Ebrahim 2011). Uno de los ensayos de la revisión incluyó una comparación aleatoria entre las pruebas de detección con y sin conversaciones programadas presenciales del estilo de vida, aunque no encontró efectos (Ebeltoft 1992).
Desarrollos en el tratamiento
Los desarrollos en la farmacoterapia preventiva podrían generar un efecto diferente sobre los resultados cardiovasculares en la actualidad en comparación con el momento en que se realizaron algunos de los ensayos. Por ejemplo, es probable que la administración de estatinas e inhibidores de la enzima convertidora de angiotensina en lugar de fármacos nocivos como el clofibrato (WHO 1984), y la reserpina (Healy 2004), proporcione una mejoría significativa. Sin embargo, no se puede saber si los desarrollos en las farmacoterapias siempre son beneficiosos para los pacientes debido a que algunos fármacos modernos pueden tener efectos perjudiciales graves que no se conocen actualmente. Por ejemplo, el fármaco para la diabetes rosiglitazona estuvo en el mercado por diez años antes de retirarse debido a que causa cardiopatía grave (Lehman 2010; Nissen 2010). Además, el informe deficiente en los ensayos de los efectos perjudiciales de los fármacos preventivos administrados comúnmente, como las estatinas (Taylor 2013), puede significar que los efectos adversos son más frecuentes de lo que se cree (Golomb 2012).
Los umbrales para el tratamiento de los factores de riesgo cardiovascular y la diabetes actualmente son más bajos que en el momento en que se realizó la mayoría de los ensayos. Este hecho ha dado lugar a una mayor prescripción de fármacos preventivos con eficacia demostrada, por ejemplo las estatinas (Taylor 2013), y los antihipertensivos (Wright 2009). Sin embargo, el equilibrio entre los efectos beneficiosos y perjudiciales puede no ser favorable cuando los riesgos absolutos son bajos, como en una población sometida a pruebas de detección, o cuando se usan en poblaciones más heterogéneas con comorbilidades. Por ejemplo, las poblaciones usadas para examinar los fármacos antihipertensivos generalmente fueron más jóvenes y tenían menos comorbilidades que el paciente típico de la práctica general (Uijen 2007). La inclusión de los resultados de un gran ensayo realizado entre 1999 y 2009 (Inter99 1999), indica que el efecto de los controles de salud no ha cambiado con el tiempo.
El tratamiento para las enfermedades identificadas ha mejorado en muchas áreas, lo cual podría dar lugar a mejores efectos de los controles de salud con el transcurso del tiempo. Sin embargo, en los metanálisis organizados por año de comienzo del ensayo, no hay ninguna tendencia temporal visible (Análisis 1.1; Análisis 1.27; Análisis 1.14).
Autoselección
Los pacientes que aceptan una invitación a un control de salud suelen ser diferentes de los que no. Por lo general, tienen un nivel socioeconómico mayor (Pill 1988), un riesgo cardiovascular inferior (Waller 1990), menos morbilidad cardiovascular (Jørgensen 2003), y menor mortalidad (Bender 2015a; Göteborg 1970). Este fenómeno se representa en los estudios de la adherencia a la farmacoterapia, en que la alta adherencia al placebo se asocia con una mortalidad reducida (Simpson 2006). Por lo tanto, los controles de salud sistemáticos pueden no llegar a los que más necesitan la prevención, lo cual ha sido denominado “otro ejemplo de la atención inversa” (Waller 1990).
Pruebas clínicamente motivadas
Otra razón posible de la ausencia de efectos beneficiosos es que muchos médicos ya llevan a cabo las pruebas de detección para los factores de riesgo o enfermedades cardiovasculares en los pacientes que consideran en alto riesgo cuando los atienden por otras razones. Lo anterior a menudo se considera una parte integrante de la práctica de atención primaria. Las pruebas clínicamente motivadas ya pueden haber dado lugar a la identificación de muchas personas en alto riesgo, lo que reduce la posibilidad de un beneficio de las pruebas de detección sistemáticas.
Certeza de la evidencia
Para los resultados primarios y para los eventos mortales y no mortales combinados, la certeza de la evidencia fue alta o moderada según los criterios GRADE. Este hecho significa que es poco probable que la investigación adicional altere estos cálculos. Para la mayoría de los otros resultados, la certeza fue baja, lo cual representa la escasez de datos informados.
Sesgos potenciales en el proceso de revisión
Se intentó evitar el sesgo mediante el uso de los métodos Cochrane, incluido un protocolo revisado por pares, la evaluación doble e independiente de los resultados de la búsqueda y los artículos de texto completo, así como la extracción de datos doble e independiente y la evaluación del riesgo de sesgo”. Debido a que la terminología que impone desafíos en este campo podría dar lugar a la omisión de ensayos, se realizó un esfuerzo especial para buscar de forma exhaustiva, incluida la búsqueda manual de las listas de referencias y el seguimiento de las citas.
En los metanálisis, se pasó por alto el agrupamiento por familia en dos ensayos (OXCHECK 1989; South‐East London 1967), y por fábrica en el análisis de la mortalidad por cáncer de la OMS 1971. En un análisis de sensibilidad predeterminado, la exclusión de los ensayos con asignación al azar por grupos resultó en un cambio muy pequeño en los resultados.
Se intentó contactar con los autores de los ensayos y se tuvo éxito en 11 casos (DanMONICA 1982; Ebeltoft 1992; Göteborg 1963; Göteborg 1970; Inter99 1999; Malmö 1969; Mankato 1982; OXCHECK 1989; South‐East London 1967; Stockholm 1969; WHO 1971). A menudo hubo preguntas acerca de los métodos del ensayo aunque debido a que la mayoría de los ensayos eran muy antiguos, hay un riesgo de que algunas respuestas puedan haber sido inexactas.
Acuerdos y desacuerdos con otros estudios o revisiones
Una revisión sistemática de los controles de salud en la práctica general (Si 2014), y una revisión Cochrane de las pruebas de detección sistemáticas versus oportunistas para el riesgo cardiovascular (Dyakova 2016), encontraron resultados similares a los de esta revisión. Estas revisiones también incluyeron cambios en los factores de riesgo, y ambas encontraron una reducción pequeña en el colesterol y la presión arterial. Una revisión sistemática de los controles de salud incluyó estudios observacionales y estudios geriátricos aunque usó una definición diferente de la intervención e incluyó menos ensayos (Boulware 2007). En gran parte, los ensayos examinados son diferentes aunque los resultados están ampliamente de acuerdo con los resultados superpuestos de la mortalidad total, la hospitalización, la discapacidad y la cantidad de nuevos diagnósticos (detección de enfermedades). Existe preocupación en cuanto a que Boulware 2007 encontró un ensayo que mostró un efecto beneficioso mientras que se hallaron dos ensayos sin un efecto sobre este resultado.
No se incluyeron los ensayos geriátricos debido a que comprendían muchas intervenciones diferentes de las pruebas de detección para las enfermedades y los factores de riesgo, y las intervenciones del estilo de vida. Una revisión sistemática de 89 ensayos de intervenciones complejas para mejorar la funcionalidad física y mantener un estilo de vida independiente en pacientes de edad muy avanzada encontró efectos beneficiosos sobre el riesgo de no vivir en el domicilio, el ingreso a residencias geriátricas, las caídas, los ingresos al hospital y la función física, pero no en la mortalidad (Beswick 2008). En el subgrupo de 28 ensayos de las evaluaciones geriátricas para los pacientes de edad muy avanzada que representaban a la población en general, los resultados fueron similares excepto que no se encontró ningún efecto sobre la hospitalización. Por lo tanto, los resultados fueron similares a los de esta revisión excepto en los resultados de especial relevancia para los pacientes mayores en los que se encontraron beneficios importantes.
Un ensayo de 2017 de las pruebas de detección en hombres de 65 a 74 años de edad para los aneurismas aórticos abdominales y la hipertensión central y periférica encontró una reducción en la mortalidad total después de una mediana de 4,4 años aunque a costa del sobretratamiento con cirugía y medicación (Lindholt 2017). Este resultado podría haberse debido al azar, debido a que también se redujo la mortalidad por causas diferentes a las EC, aunque no había sido el objetivo de la intervención. De manera similar, un ensayo con asignación al azar grupal de las pruebas de detección en participantes a partir de 65 años de edad para la hipertensión y los factores de riesgo cardiovascular encontró un efecto sobre los eventos cardiovasculares después de solo un año y con una captación de las pruebas de detección de solo un 20%; también es probable que este resultado se deba al azar (Kaczorowski 2011). No obstante, los pacientes en dicho grupo etario parecerían un objetivo razonable para los estudios adicionales de las pruebas de detección cardiovasculares debido a que el riesgo es alto.

Study flow diagram

'Risk of bias' summary: review authors' judgements about each risk of bias item for each included study

'Risk of bias; graph: review authors' judgements about each risk of bias item presented as percentages across all included trials

Funnel plot of comparison 1. Health checks versus control, outcome: 1.1 Total mortality.

Comparison 1 Health checks versus control, Outcome 1 Total mortality.

Comparison 1 Health checks versus control, Outcome 2 Total mortality ‐ sensitivity analyses.

Comparison 1 Health checks versus control, Outcome 3 Total mortality ‐ no. of health checks.
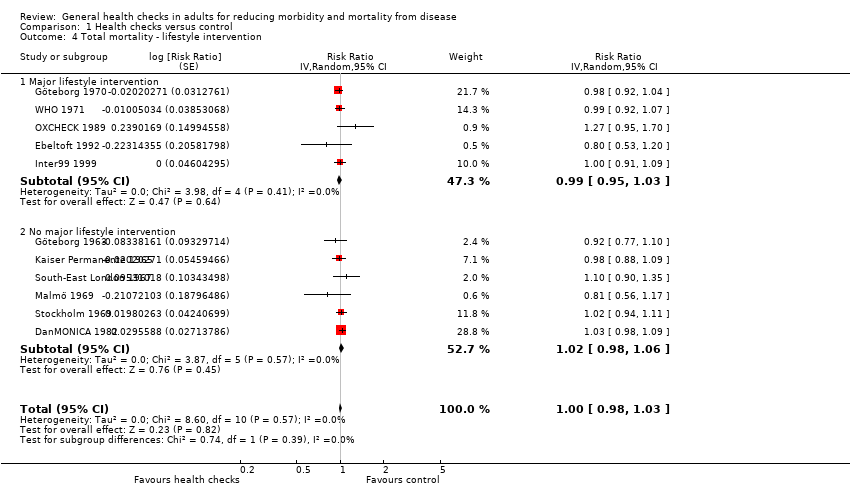
Comparison 1 Health checks versus control, Outcome 4 Total mortality ‐ lifestyle intervention.

Comparison 1 Health checks versus control, Outcome 5 Total mortality ‐ length of follow‐up.

Comparison 1 Health checks versus control, Outcome 6 Total mortality ‐ age of trial.

Comparison 1 Health checks versus control, Outcome 7 Total mortality ‐ geographical location.

Comparison 1 Health checks versus control, Outcome 8 Total mortality ‐ examination by physician.

Comparison 1 Health checks versus control, Outcome 9 Total mortality ‐ selection bias.

Comparison 1 Health checks versus control, Outcome 10 Total mortality ‐ performance bias.

Comparison 1 Health checks versus control, Outcome 11 Total mortality ‐ detection bias.

Comparison 1 Health checks versus control, Outcome 12 Total mortality ‐ incomplete outcome data.

Comparison 1 Health checks versus control, Outcome 13 Total mortality ‐ contamination.

Comparison 1 Health checks versus control, Outcome 14 Cancer mortality.

Comparison 1 Health checks versus control, Outcome 15 Cancer mortality ‐ sensitivity analyses.

Comparison 1 Health checks versus control, Outcome 16 Cancer mortality ‐ no. of health checks.

Comparison 1 Health checks versus control, Outcome 17 Cancer mortality lifestyle intervention.

Comparison 1 Health checks versus control, Outcome 18 Cancer mortality ‐ length of follow‐up.

Comparison 1 Health checks versus control, Outcome 19 Cancer mortality ‐ age of trial.

Comparison 1 Health checks versus control, Outcome 20 Cancer mortality ‐ geographical location.

Comparison 1 Health checks versus control, Outcome 21 Cancer mortality ‐ examination by physician.

Comparison 1 Health checks versus control, Outcome 22 Cancer mortality ‐ selection bias.

Comparison 1 Health checks versus control, Outcome 23 Cancer mortality ‐ performance bias.

Comparison 1 Health checks versus control, Outcome 24 Cancer mortality ‐ detection bias.

Comparison 1 Health checks versus control, Outcome 25 Cancer mortality ‐ incomplete outcome data.

Comparison 1 Health checks versus control, Outcome 26 Cancer mortality ‐ contamination.

Comparison 1 Health checks versus control, Outcome 27 Cardiovascular mortality.

Comparison 1 Health checks versus control, Outcome 28 Cardiovascular mortality ‐ sensitivity analyses.

Comparison 1 Health checks versus control, Outcome 29 Cardiovascular mortality ‐ no. of health checks.

Comparison 1 Health checks versus control, Outcome 30 Cardiovascular mortality lifestyle intervention.

Comparison 1 Health checks versus control, Outcome 31 Cardiovascular mortality ‐ length of follow‐up.

Comparison 1 Health checks versus control, Outcome 32 Cardiovascular mortality ‐ age of trial.

Comparison 1 Health checks versus control, Outcome 33 Cardiovascular mortality ‐ geographical location.

Comparison 1 Health checks versus control, Outcome 34 Cardiovascular mortality ‐ examination by physician.

Comparison 1 Health checks versus control, Outcome 35 Cardiovascular mortality ‐ selection bias.

Comparison 1 Health checks versus control, Outcome 36 Cardiovascular mortality ‐ performance bias.

Comparison 1 Health checks versus control, Outcome 37 Cardiovascular mortality ‐ detection bias.

Comparison 1 Health checks versus control, Outcome 38 Cardiovascular mortality ‐ incomplete outcome data.

Comparison 1 Health checks versus control, Outcome 39 Cardiovascular mortality ‐ contamination.

Comparison 1 Health checks versus control, Outcome 40 Fatal and non‐fatal ischaemic heart disease.

Comparison 1 Health checks versus control, Outcome 41 Fatal and non‐fatal stroke.
| General health checks for reducing morbidity and mortality from disease | |||||
| Patient or population: general adult populations (geriatric trials not included) Setting: general practice or medical/research centre (Europe and USA) Intervention: one or more general health checks (screening by any healthcare provider for more than one disease or risk factor in more than one organ system using more than one test) Comparison: no health checks | |||||
| Outcomes | Illustrative comparative risks* (95% CI) | Relative effect | No of participants | Certainty of the evidence | |
| Assumed riska | Corresponding risk | ||||
| Without health checks | With health checks | ||||
| Total mortality Follow‐up: 4‐30 years | 68 per 1000 | 68 per 1000 | RR 1.00 (0.97 to 1.03) | 233,298 | ⊕⊕⊕⊕ |
| Cancer mortality Follow‐up: 4‐22 years | 26 per 1000 | 26 per 1000 | RR 1.01 (0.92 to 1.12) | 139,290 | ⊕⊕⊕⊕ |
| Cardiovascular mortality Follow‐up: 4‐30 years | 32 per 1000 | 34 per 1000 | RR 1.05 (0.94 to 1.16) | 170,227 | ⊕⊕⊕⊝b |
| Fatal and non‐fatal ischaemic heart disease Follow‐up: 4‐30 years | 66 per 1000 | 65 per 1000 | RR 0.98 (0.94 to 1.03) | 164,881 | ⊕⊕⊕⊕ |
| Fatal and non‐fatal stroke Follow‐up: 4‐30 years | 29 per 1000 | 30 per 1000 | RR 1.05 (0.95 to 1.17) | 107,421 | ⊕⊕⊕⊝c |
| *The basis for the assumed risk is provided in footnotes. The corresponding risk (and its 95% confidence interval) is based on the assumed risk in the comparison group and the relative effect of the intervention (and its 95% CI). | |||||
| GRADE Working Group grades of evidence | |||||
| aSome trials used skewed randomisation in age and sex strata, giving unbalanced baselines (accounted for in the analysis estimates used). For this reason, control‐group event rates are somewhat misleading. The risk without the intervention is based on the median event rate in intervention and control groups combined. The corresponding risk with the intervention (and the 95% confidence interval for the difference), is based on the overall relative effect (and its 95% confidence interval). bDowngraded due to serious inconsistency. Substantial unexplained heterogeneity in results (I2 = 65%) cDowngraded due to serious inconsistency. Substantial heterogeneity in results (I2 = 53%) | |||||
| Blood pressure | Cholesterol | Height and weight | Risk score | Electrocardiogram | Biochemistry panel | History | Spirometry | Urine analyses | Diabetes | Clinical examination | Vision and/or hearing | Cancer screening | |
| x | x | x | x | x | Current symptoms, personal and family history |
| x | Fasting blood sugar | x | x | Chest X‐ray | ||
| x | Probably | x | x | x | Current symptoms, personal and family history | x | x | x | x | Chest X‐ray, mammography, pelvic exam, sigmoidoscopy | |||
| x | Probably | x | x | x | Current symptoms, personal history | x | x | x | Chest X‐ray, faecal occult blood | ||||
| x | x | x | x | Haematocrit, triglycerides, cholesterol | Interview and questionnaire, not specified | x | x | x | Chest X‐ray | ||||
| ? | ? | ? | ? | ? | ? | Current symptoms | ? | ? | ? | ? | ? | ? | |
| x | Probably | x | x | Current symptoms, personal history | x | x | |||||||
| x | x | x | x | Family history | |||||||||
| x | x | x |
| Current symptoms |
| ||||||||
| x | x | x | x | x | x | x | Chest X‐ray, mammography, cervical smear | ||||||
| x | x | x | x | Current symptoms, personal and family history | Peak flow | x | Not explicit, but abdominal ultrasound done | ||||||
| x | x | x | |||||||||||
| x | x | x | Personal and family history | ||||||||||
| x | x | x | Dundee | Personal and family history |
| Random capillary glucose | |||||||
| x | x | x | Anggaard | x | x | x | x | Non‐fasting blood glucose | x | ||||
| x | x | x | PRECARD | x | x | Oral glucose tolerance test | |||||||
| Not all screening tests used are shown; see Characteristics of included studies for full details. The Kaiser Permanente 1965, South‐East London 1967, and Stockholm 1969 trials did not specify the contents of their biochemical screening. It seems unlikely that cholesterol was not included. | |||||||||||||
| Deaths in intervention group | Participants in intervention group | Deaths in control group | Participants in control group | |
| Total mortality | ||||
| 146 | 1010 | 306 | 1956 | |
| 585 | 5138 | 643 | 5536 | |
| 196 | 3292 | 169 | 3132 | |
| 492 | 3064 | 2503 | 29122 | |
| 49 | 809 | 60 | 804 | |
| 1293 | 10004 | 2636 | 20018 | |
| 1325 | 30489 | 1186 | 26971 | |
| 205 | 8307 | 54 | 2783 | |
| 49 | 2030 | 43 | 1434 | |
| 595 | 11629 | 2568 | 47987 | |
| 2033 | 4789 | 4399 | 12994 | |
| Cancer mortality | ||||
| 35 | 1010 | 73 | 1956 | |
| 173 | 5138 | 190 | 5536 | |
| 50 | 3292 | 47 | 3132 | |
| 144 | 3064 | 757 | 29122 | |
| 17 | 809 | 9 | 804 | |
| 315 | 10004 | 728 | 20018 | |
| 564 | 23358 | 456 | 20957 | |
| 82 | 8307 | 23 | 2783 | |
| Cardiovascular mortality | ||||
| 74 | 1010 | 132 | 1956 | |
| 240 | 5138 | 256 | 5536 | |
| 84 | 3292 | 52 | 3132 | |
| 206 | 3064 | 947 | 29122 | |
| 14 | 809 | 33 | 804 | |
| 526 | 10004 | 1077 | 20018 | |
| 428 | 30489 | 398 | 26971 | |
| 83 | 8307 | 17 | 2783 | |
| 583 | 4798 | 1087 | 12994 | |
| aSkewed randomisation in age and needs strata, giving unbalanced baselines. | ||||
| Outcome or subgroup title | No. of studies | No. of participants | Statistical method | Effect size |
| 1 Total mortality Show forest plot | 11 | Risk Ratio (Random, 95% CI) | 1.00 [0.97, 1.03] | |
| 2 Total mortality ‐ sensitivity analyses Show forest plot | 8 | Risk Ratio (Random, 95% CI) | 1.00 [0.97, 1.03] | |
| 2.1 Excluding cluster trials | 8 | Risk Ratio (Random, 95% CI) | 1.00 [0.97, 1.03] | |
| 3 Total mortality ‐ no. of health checks Show forest plot | 11 | Risk Ratio (Random, 95% CI) | 1.00 [0.98, 1.03] | |
| 3.1 One health check | 3 | Risk Ratio (Random, 95% CI) | 1.00 [0.94, 1.06] | |
| 3.2 More than one health check | 8 | Risk Ratio (Random, 95% CI) | 1.01 [0.97, 1.04] | |
| 4 Total mortality ‐ lifestyle intervention Show forest plot | 11 | Risk Ratio (Random, 95% CI) | 1.00 [0.98, 1.03] | |
| 4.1 Major lifestyle intervention | 5 | Risk Ratio (Random, 95% CI) | 0.99 [0.95, 1.03] | |
| 4.2 No major lifestyle intervention | 6 | Risk Ratio (Random, 95% CI) | 1.02 [0.98, 1.06] | |
| 5 Total mortality ‐ length of follow‐up Show forest plot | 11 | Risk Ratio (Random, 95% CI) | 1.00 [0.98, 1.03] | |
| 5.1 Up to five years | 2 | Risk Ratio (Random, 95% CI) | 1.03 [0.66, 1.60] | |
| 5.2 More than 5 years | 9 | Risk Ratio (Random, 95% CI) | 1.00 [0.97, 1.03] | |
| 6 Total mortality ‐ age of trial Show forest plot | 11 | Risk Ratio (Random, 95% CI) | 1.00 [0.98, 1.03] | |
| 6.1 Trial started before 1980 | 7 | Risk Ratio (Random, 95% CI) | 0.99 [0.95, 1.03] | |
| 6.2 Trial started after 1980 | 4 | Risk Ratio (Random, 95% CI) | 1.02 [0.96, 1.09] | |
| 7 Total mortality ‐ geographical location Show forest plot | 11 | Risk Ratio (Random, 95% CI) | 1.00 [0.98, 1.03] | |
| 7.1 USA | 1 | Risk Ratio (Random, 95% CI) | 0.98 [0.88, 1.09] | |
| 7.2 Europe | 10 | Risk Ratio (Random, 95% CI) | 1.01 [0.98, 1.04] | |
| 8 Total mortality ‐ examination by physician Show forest plot | 11 | Risk Ratio (Random, 95% CI) | 1.00 [0.98, 1.03] | |
| 8.1 Examination by physician | 5 | Risk Ratio (Random, 95% CI) | 1.00 [0.94, 1.06] | |
| 8.2 No examination by physician | 6 | Risk Ratio (Random, 95% CI) | 1.00 [0.97, 1.04] | |
| 9 Total mortality ‐ selection bias Show forest plot | 11 | Risk Ratio (Random, 95% CI) | 1.00 [0.98, 1.03] | |
| 9.1 Low risk of selection bias | 9 | Risk Ratio (Random, 95% CI) | 1.00 [0.97, 1.04] | |
| 9.2 Unclear risk of selection bias | 2 | Risk Ratio (Random, 95% CI) | 1.00 [0.93, 1.08] | |
| 9.3 High risk of selection bias | 0 | Risk Ratio (Random, 95% CI) | 0.0 [0.0, 0.0] | |
| 10 Total mortality ‐ performance bias Show forest plot | 11 | Risk Ratio (Random, 95% CI) | 1.00 [0.98, 1.03] | |
| 10.1 Low risk | 7 | Risk Ratio (Random, 95% CI) | 1.00 [0.97, 1.03] | |
| 10.2 Unclear risk | 1 | Risk Ratio (Random, 95% CI) | 1.02 [0.94, 1.11] | |
| 10.3 High risk | 3 | Risk Ratio (Random, 95% CI) | 1.08 [0.87, 1.33] | |
| 11 Total mortality ‐ detection bias Show forest plot | 11 | Risk Ratio (Random, 95% CI) | 1.00 [0.98, 1.03] | |
| 11.1 Low risk | 8 | Risk Ratio (Random, 95% CI) | 1.01 [0.97, 1.04] | |
| 11.2 Unclear risk | 2 | Risk Ratio (Random, 95% CI) | 1.00 [0.93, 1.08] | |
| 11.3 High risk | 1 | Risk Ratio (Random, 95% CI) | 0.92 [0.77, 1.10] | |
| 12 Total mortality ‐ incomplete outcome data Show forest plot | 11 | Risk Ratio (Random, 95% CI) | 1.00 [0.98, 1.03] | |
| 12.1 Low risk | 10 | Risk Ratio (Random, 95% CI) | 1.01 [0.98, 1.04] | |
| 12.2 Unclear risk | 1 | Risk Ratio (Random, 95% CI) | 0.98 [0.88, 1.09] | |
| 12.3 High risk | 0 | Risk Ratio (Random, 95% CI) | 0.0 [0.0, 0.0] | |
| 13 Total mortality ‐ contamination Show forest plot | 11 | Risk Ratio (Random, 95% CI) | 1.00 [0.98, 1.03] | |
| 13.1 Low risk | 7 | Risk Ratio (Random, 95% CI) | 1.00 [0.97, 1.03] | |
| 13.2 Unclear risk | 1 | Risk Ratio (Random, 95% CI) | 1.27 [0.95, 1.70] | |
| 13.3 High risk | 3 | Risk Ratio (Random, 95% CI) | 0.99 [0.90, 1.10] | |
| 14 Cancer mortality Show forest plot | 8 | Risk Ratio (Random, 95% CI) | 1.01 [0.92, 1.12] | |
| 15 Cancer mortality ‐ sensitivity analyses Show forest plot | 5 | Risk Ratio (Random, 95% CI) | 0.97 [0.85, 1.09] | |
| 15.1 Excluding cluster trials | 5 | Risk Ratio (Random, 95% CI) | 0.97 [0.85, 1.09] | |
| 16 Cancer mortality ‐ no. of health checks Show forest plot | 8 | Risk Ratio (Random, 95% CI) | 1.01 [0.92, 1.12] | |
| 16.1 Only one health check | 3 | Risk Ratio (Random, 95% CI) | 1.10 [1.00, 1.21] | |
| 16.2 More than one health check | 5 | Risk Ratio (Random, 95% CI) | 0.92 [0.83, 1.02] | |
| 17 Cancer mortality lifestyle intervention Show forest plot | 8 | Risk Ratio (Random, 95% CI) | 1.01 [0.92, 1.12] | |
| 17.1 Major lifestyle intervention | 3 | Risk Ratio (Random, 95% CI) | 1.01 [0.82, 1.24] | |
| 17.2 No major lifestyle intervention | 5 | Risk Ratio (Random, 95% CI) | 1.02 [0.91, 1.15] | |
| 18 Cancer mortality ‐ length of follow‐up Show forest plot | 8 | Risk Ratio (Random, 95% CI) | 1.01 [0.92, 1.12] | |
| 18.1 Up to five years | 2 | Risk Ratio (Random, 95% CI) | 1.33 [0.89, 1.99] | |
| 18.2 More than five years | 6 | Risk Ratio (Random, 95% CI) | 1.00 [0.90, 1.10] | |
| 19 Cancer mortality ‐ age of trial Show forest plot | 8 | Risk Ratio (Random, 95% CI) | 1.01 [0.92, 1.12] | |
| 19.1 Trial started before 1980 | 7 | Risk Ratio (Random, 95% CI) | 1.01 [0.91, 1.12] | |
| 19.2 Trial started after 1980 | 1 | Risk Ratio (Random, 95% CI) | 1.19 [0.75, 1.89] | |
| 20 Cancer mortality ‐ geographical location Show forest plot | 8 | Risk Ratio (Random, 95% CI) | 1.01 [0.92, 1.12] | |
| 20.1 Europe | 7 | Risk Ratio (Random, 95% CI) | 1.02 [0.91, 1.15] | |
| 20.2 USA | 1 | Risk Ratio (Random, 95% CI) | 0.98 [0.80, 1.20] | |
| 21 Cancer mortality ‐ examination by physician Show forest plot | 8 | Risk Ratio (Random, 95% CI) | 1.01 [0.92, 1.12] | |
| 21.1 Examination by physician | 5 | Risk Ratio (Random, 95% CI) | 1.02 [0.91, 1.15] | |
| 21.2 No examination by physician | 3 | Risk Ratio (Random, 95% CI) | 1.01 [0.82, 1.24] | |
| 22 Cancer mortality ‐ selection bias Show forest plot | 8 | Risk Ratio (Random, 95% CI) | 1.01 [0.92, 1.12] | |
| 22.1 Low risk | 6 | Risk Ratio (Random, 95% CI) | 0.98 [0.87, 1.10] | |
| 22.2 Unclear risk | 2 | Risk Ratio (Random, 95% CI) | 1.10 [0.98, 1.24] | |
| 22.3 High risk | 0 | Risk Ratio (Random, 95% CI) | 0.0 [0.0, 0.0] | |
| 23 Cancer mortality ‐ performance bias Show forest plot | 8 | Risk Ratio (Random, 95% CI) | 1.01 [0.92, 1.12] | |
| 23.1 Low risk | 5 | Risk Ratio (Random, 95% CI) | 1.00 [0.86, 1.16] | |
| 23.2 Unclear risk | 1 | Risk Ratio (Random, 95% CI) | 1.05 [0.88, 1.25] | |
| 23.3 High risk | 2 | Risk Ratio (Random, 95% CI) | 1.08 [0.80, 1.46] | |
| 24 Cancer mortality ‐ detection bias Show forest plot | 8 | Risk Ratio (Random, 95% CI) | 1.01 [0.92, 1.12] | |
| 24.1 Low risk | 5 | Risk Ratio (Random, 95% CI) | 0.99 [0.86, 1.13] | |
| 24.2 Unclear risk | 2 | Risk Ratio (Random, 95% CI) | 1.10 [0.98, 1.24] | |
| 24.3 High risk | 1 | Risk Ratio (Random, 95% CI) | 0.93 [0.63, 1.38] | |
| 25 Cancer mortality ‐ incomplete outcome data Show forest plot | 8 | Risk Ratio (Random, 95% CI) | 1.01 [0.92, 1.12] | |
| 25.1 Low risk | 6 | Risk Ratio (Random, 95% CI) | 0.98 [0.86, 1.12] | |
| 25.2 Unclear risk | 2 | Risk Ratio (Random, 95% CI) | 1.07 [0.96, 1.20] | |
| 25.3 High risk | 0 | Risk Ratio (Random, 95% CI) | 0.0 [0.0, 0.0] | |
| 26 Cancer mortality ‐ contamination Show forest plot | 8 | Risk Ratio (Random, 95% CI) | 1.01 [0.92, 1.12] | |
| 26.1 Low risk | 5 | Risk Ratio (Random, 95% CI) | 1.01 [0.88, 1.17] | |
| 26.2 Unclear risk | 1 | Risk Ratio (Random, 95% CI) | 1.19 [0.75, 1.89] | |
| 26.3 High risk | 2 | Risk Ratio (Random, 95% CI) | 0.99 [0.82, 1.18] | |
| 27 Cardiovascular mortality Show forest plot | 9 | Risk Ratio (Random, 95% CI) | 1.05 [0.94, 1.16] | |
| 28 Cardiovascular mortality ‐ sensitivity analyses Show forest plot | 6 | Risk Ratio (Random, 95% CI) | 1.02 [0.92, 1.13] | |
| 28.1 Excluding cluster trials | 6 | Risk Ratio (Random, 95% CI) | 1.02 [0.92, 1.13] | |
| 29 Cardiovascular mortality ‐ no. of health checks Show forest plot | 9 | Risk Ratio (Random, 95% CI) | 1.05 [0.94, 1.16] | |
| 29.1 Only one health check | 3 | Risk Ratio (Random, 95% CI) | 0.89 [0.69, 1.14] | |
| 29.2 More than one health check | 6 | Risk Ratio (Random, 95% CI) | 1.10 [0.98, 1.23] | |
| 30 Cardiovascular mortality lifestyle intervention Show forest plot | 9 | Risk Ratio (Random, 95% CI) | 1.05 [0.94, 1.16] | |
| 30.1 Major lifestyle intervention | 3 | Risk Ratio (Random, 95% CI) | 0.99 [0.86, 1.15] | |
| 30.2 No major lifestyle intervention | 6 | Risk Ratio (Random, 95% CI) | 1.07 [0.93, 1.23] | |
| 31 Cardiovascular mortality ‐ length of follow‐up Show forest plot | 9 | Risk Ratio (Random, 95% CI) | 1.05 [0.94, 1.16] | |
| 31.1 Up to five years | 2 | Risk Ratio (Random, 95% CI) | 0.84 [0.22, 3.18] | |
| 31.2 More than five years | 7 | Risk Ratio (Random, 95% CI) | 1.05 [0.97, 1.13] | |
| 32 Cardiovascular mortality ‐ age of trial Show forest plot | 9 | Risk Ratio (Random, 95% CI) | 1.05 [0.94, 1.16] | |
| 32.1 Trial started before 1980 | 7 | Risk Ratio (Random, 95% CI) | 1.01 [0.90, 1.13] | |
| 32.2 Trial started after 1980 | 2 | Risk Ratio (Random, 95% CI) | 1.24 [0.89, 1.72] | |
| 33 Cardiovascular mortality ‐ geographical location Show forest plot | 9 | Risk Ratio (Random, 95% CI) | 1.05 [0.94, 1.16] | |
| 33.1 Europe | 8 | Risk Ratio (Random, 95% CI) | 1.05 [0.93, 1.18] | |
| 33.2 USA | 1 | Risk Ratio (Random, 95% CI) | 1.01 [0.85, 1.20] | |
| 34 Cardiovascular mortality ‐ examination by physician Show forest plot | 9 | Risk Ratio (Random, 95% CI) | 1.05 [0.94, 1.16] | |
| 34.1 Examination by physician | 5 | Risk Ratio (Random, 95% CI) | 1.03 [0.84, 1.27] | |
| 34.2 No examination by physician | 4 | Risk Ratio (Random, 95% CI) | 1.04 [0.92, 1.17] | |
| 35 Cardiovascular mortality ‐ selection bias Show forest plot | 9 | Risk Ratio (Random, 95% CI) | 1.05 [0.94, 1.16] | |
| 35.1 Low risk | 7 | Risk Ratio (Random, 95% CI) | 1.04 [0.93, 1.16] | |
| 35.2 Unclear risk | 2 | Risk Ratio (Random, 95% CI) | 1.17 [0.71, 1.91] | |
| 35.3 High risk | 0 | Risk Ratio (Random, 95% CI) | 0.0 [0.0, 0.0] | |
| 36 Cardiovascular mortality ‐ performance bias Show forest plot | 9 | Risk Ratio (Random, 95% CI) | 1.05 [0.94, 1.16] | |
| 36.1 Low risk | 6 | Risk Ratio (Random, 95% CI) | 0.99 [0.89, 1.11] | |
| 36.2 Unclear risk | 1 | Risk Ratio (Random, 95% CI) | 1.05 [0.91, 1.21] | |
| 36.3 High risk | 2 | Risk Ratio (Random, 95% CI) | 1.57 [1.18, 2.09] | |
| 37 Cardiovascular mortality ‐ detection bias Show forest plot | 9 | Risk Ratio (Random, 95% CI) | 1.05 [0.94, 1.16] | |
| 37.1 Low risk | 6 | Risk Ratio (Random, 95% CI) | 1.03 [0.91, 1.16] | |
| 37.2 Unclear risk | 2 | Risk Ratio (Random, 95% CI) | 1.17 [0.71, 1.91] | |
| 37.3 High risk | 1 | Risk Ratio (Random, 95% CI) | 1.09 [0.83, 1.43] | |
| 38 Cardiovascular mortality ‐ incomplete outcome data Show forest plot | 9 | Risk Ratio (Random, 95% CI) | 1.05 [0.94, 1.16] | |
| 38.1 Low risk | 8 | Risk Ratio (Random, 95% CI) | 1.05 [0.93, 1.18] | |
| 38.2 Unclear risk | 1 | Risk Ratio (Random, 95% CI) | 1.01 [0.85, 1.20] | |
| 38.3 High risk | 0 | Risk Ratio (Random, 95% CI) | 0.0 [0.0, 0.0] | |
| 39 Cardiovascular mortality ‐ contamination Show forest plot | 9 | Risk Ratio (Random, 95% CI) | 1.05 [0.94, 1.16] | |
| 39.1 Low risk | 6 | Risk Ratio (Random, 95% CI) | 1.00 [0.90, 1.12] | |
| 39.2 Unclear risk | 1 | Risk Ratio (Random, 95% CI) | 1.64 [0.97, 2.76] | |
| 39.3 High risk | 2 | Risk Ratio (Random, 95% CI) | 1.21 [0.81, 1.83] | |
| 40 Fatal and non‐fatal ischaemic heart disease Show forest plot | 4 | Risk Ratio (Random, 95% CI) | 0.98 [0.94, 1.03] | |
| 41 Fatal and non‐fatal stroke Show forest plot | 3 | Risk Ratio (Random, 95% CI) | 1.05 [0.95, 1.17] | |