Controles generales de salud en adultos para la reducción de la morbilidad y mortalidad por enfermedades
Resumen
Antecedentes
Los controles generales de salud son elementos habituales de la asistencia sanitaria en algunos países. Dichos controles intentan detectar enfermedades y factores de riesgo de enfermedades con el objetivo de reducir la morbilidad y la mortalidad. En su mayoría las pruebas de detección utilizadas habitualmente y ofrecidas en los controles generales de salud no se han estudiado de forma completa. Además, las pruebas de detección dan lugar a un mayor uso de las intervenciones de diagnóstico y tratamiento, lo que puede tener efectos perjudiciales, así como beneficiosos. Por lo tanto, es importante evaluar si los controles generales de salud tienen más efectos beneficiosos que perjudiciales.
Objetivos
Se intentó cuantificar los efectos beneficiosos y perjudiciales de los controles generales de salud con un énfasis en resultados relevantes para los pacientes como la morbilidad y la mortalidad, en lugar de en resultados alternativos como la presión arterial y los niveles de colesterol sérico.
Métodos de búsqueda
Se hicieron búsquedas en The Cochrane Library, Registro Cochrane Central de Ensayos Controlados (Cochrane Central Register of Controlled Trials) (CENTRAL), registro de ensayos del Grupo Cochrane para una Práctica y Organización Sanitaria Efectivas (Cochrane Effective Practice and Organisation of Care, EPOC), MEDLINE, EMBASE, Healthstar, CINAHL, ClinicalTrials.gov y WHO International Clinical Trials Registry Platform (ICTRP) hasta julio de 2012. Dos revisores seleccionaron los títulos y los resúmenes, evaluaron los artículos en cuanto a la elegibilidad y leyeron las listas de referencias. Un revisor utilizó el seguimiento de citas (Web of Knowledge) y preguntó a los autores de ensayos acerca de estudios adicionales.
Criterios de selección
Se incluyeron los ensayos aleatorios que compararon los controles de salud con ningún control de salud en adultos no seleccionados en cuanto a enfermedad o factores de riesgo. No se incluyeron ensayos relacionados con geriatría. Los controles de salud se definieron como pruebas de detección en poblaciones generales para más de una enfermedad o factor de riesgo en más de un sistema de órganos.
Obtención y análisis de los datos
Dos revisores de forma independiente extrajeron los datos y evaluaron el riesgo de sesgo de los ensayos. Cuando fue necesario se estableció contacto con los autores para obtener resultados adicionales o detalles de los ensayos. Los resultados de mortalidad se analizaron en un metanálisis con un modelo de efectos aleatorios y para los otros resultados se realizó una síntesis cualitativa debido a que no fue posible realizar el metanálisis.
Resultados principales
Se incluyeron 16 ensayos, 14 de los cuales tuvieron datos de resultado disponibles (182 880 participantes). Nueve ensayos proporcionaron datos sobre la mortalidad total (155 899 participantes, 11 940 muertes), período de seguimiento mediano de nueve años, lo que proporcionó un cociente de riesgos de 0,99 (intervalo de confianza [IC] del 95%: 0,95 a 1,03). Ocho ensayos proporcionaron datos sobre la mortalidad cardiovascular (152 435 participantes, 4567 muertes), cociente de riesgos 1,03 (IC del 95%: 0,91 a 1,17) y ocho ensayos sobre la mortalidad por cáncer (139 290 participantes, 3663 muertes), cociente de riesgos 1,01 (IC del 95%: 0,92 a 1,12). Los análisis de sensibilidad y de subgrupos no alteraron estos resultados.
No se encontró un efecto sobre los eventos clínicos u otras medidas de morbilidad, aunque un ensayo encontró una mayor incidencia de hipertensión e hipercolesterolemia con las pruebas de detección, y un ensayo encontró una mayor incidencia de enfermedades crónicas autoinformadas. Un ensayo encontró un aumento del 20% en el número total de nuevos diagnósticos por participante después de seis años en comparación con el grupo control. Ningún ensayo comparó el número total de prescripciones, pero dos de cuatro ensayos encontraron un aumento en el número de pacientes que utilizó fármacos antihipertensivos. Dos de cuatro ensayos encontraron efectos beneficiosos pequeños sobre la salud autoinformada, aunque los mismos podrían haber sido causados por sesgo de informe debido a que los ensayos no fueron cegados. No se encontró un efecto sobre el ingreso hospitalario, la discapacidad, la preocupación, las visitas adicionales al médico o el ausentismo laboral, aunque la mayoría de estos resultados se estudió de forma deficiente. No se encontraron resultados útiles en el número de derivaciones a especialistas, el número de pruebas de seguimiento después de resultados positivos en las pruebas de detección, ni en la cantidad de cirugías.
Conclusiones de los autores
Los controles generales de salud no redujeron la morbilidad ni la mortalidad, ni en general, ni por causas cardiovasculares o cáncer, aunque se observó un aumento en el número de nuevos diagnósticos. Con frecuencia no se estudiaron ni informaron resultados perjudiciales importantes como el número de procedimientos de diagnóstico de seguimiento o los efectos psicológicos a corto plazo, y muchos ensayos tuvieron problemas metodológicos. Debido al gran número de participantes y muertes incluidas, los largos períodos de seguimiento utilizados y al hecho de considerar que no se redujo la mortalidad cardiovascular y por cáncer, es poco probable que los controles generales de salud tengan efectos beneficiosos.
PICOs
Resumen en términos sencillos
Controles generales de salud para la reducción de enfermedades y de la mortalidad
Los controles generales de salud incluyen realizar pruebas múltiples a una persona que no se siente enferma con el objetivo de encontrar enfermedades de forma temprana, prevenir el desarrollo de enfermedades o proporcionar tranquilidad. Los controles de salud son un elemento habitual de la asistencia sanitaria en algunos países. Muchas personas creen intuitivamente que los controles de salud tienen sentido, pero la experiencia de los programas de detección de enfermedades individuales han mostrado que los efectos beneficiosos pueden ser menores de lo esperado y que los efectos perjudiciales pueden ser mayores. Un posible efecto perjudicial de los controles de salud es el diagnóstico y tratamiento de afecciones que no están destinadas a causar síntomas o la muerte. Por lo tanto, su diagnóstico será superfluo y conllevará el riesgo de un tratamiento innecesario.
Se identificaron 16 ensayos aleatorios que compararon un grupo de adultos a los que se les realizaron controles generales de salud con un grupo al que no se le ofrecieron controles de salud. Hubo resultados disponibles de 14 ensayos que incluyeron a 182 880 participantes. Nueve ensayos estudiaron el riesgo de muerte e incluyeron a 155 899 participantes y 11 940 muertes. No hubo efectos sobre el riesgo de muerte, ni sobre el riesgo de muerte a causa de enfermedades cardiovasculares o cáncer. No se encontró un efecto sobre el riesgo de enfermedad, pero un ensayo encontró un aumento en el número de pacientes identificados con hipertensión y niveles altos de colesterol, y un ensayo encontró un aumento en el número con enfermedades crónicas. Un ensayo informó el número total de nuevos diagnósticos por participante y encontró un aumento del 20% después de seis años en comparación con el grupo control. Ningún ensayo comparó el número total de nuevas prescripciones, pero dos de cuatro ensayos encontraron un aumento en el número de pacientes que utilizó fármacos para la hipertensión. Dos de cuatro ensayos encontraron que los controles de salud dieron lugar a que los pacientes se sintieran algo más sanos, aunque este resultado no es confiable. No se encontró que los controles de salud tuvieran un efecto sobre el número de ingresos hospitalarios, la discapacidad, la preocupación, el número de derivaciones a especialistas, las visitas adicionales al médico o el ausentismo laboral, aunque la mayoría de estos resultados se estudiaron de forma deficiente. Ninguno de los ensayos informó sobre el número de pruebas de seguimiento después de resultados positivos en las pruebas de detección, ni sobre la cantidad de cirugías realizadas.
Un motivo para la falta evidente de efecto puede ser que los médicos de atención primaria ya identifican e intervienen cuando sospechan que un paciente presenta un riesgo alto de desarrollar enfermedades cuando consultan por otros motivos. Además, los que presentan un riesgo alto de desarrollar enfermedades pueden no asistir a los controles generales de salud cuando se les ofrecen. En su mayoría los ensayos fueron antiguos, lo que hace que los resultados sean menos aplicables a los contextos actuales debido a que los tratamientos utilizados para las enfermedades y los factores de riesgo han cambiado.
Debido al gran número de participantes y muertes incluidas, los largos períodos de seguimiento utilizados en los ensayos y al considerar que no se redujo la mortalidad por enfermedades cardiovasculares y por cáncer, es poco probable que los controles generales de salud tengan efectos beneficiosos.
Authors' conclusions
Summary of findings
| Outcomes | Illustrative comparative risks* (95% CI) | Relative effect | No of participants | Quality of the evidence | Comments | |
| Assumed risk | Corresponding risk with intervention | |||||
| Total mortality | RR 0.99 | 155,899 | ⊕⊕⊕⊕ | |||
| 75 per 1000 | 74 per 1000 | |||||
| Cardiovascular mortality | RR 1.03 | 152,435 | ⊕⊕⊕⊝ | There was substantial heterogeneity which may reflect the different outcome definitions used in the trials. | ||
| 37 per 1000 | 38 per 1000 | |||||
| Cancer mortality | RR 1.01 | 139,290 | ⊕⊕⊕⊕ | |||
| 21 per 1000 | 21 per 1000 | |||||
| *The assumed risk is the median control group risk across studies. The corresponding risk (and its 95% confidence interval) is based on the assumed risk in the comparison group and the relative effect of the intervention (and its 95% CI). | ||||||
| GRADE Working Group grades of evidence | ||||||
Background
Description of the condition
General health checks are common elements of health care in some countries (Han 1997; Holland 2009). Historically, general health checks of the healthy public is a recent phenomenon. The evolution of medicine in the latter half of the 20th century has yielded a great increase in diagnostic methods and increased expectations that many diseases can be prevented or discovered before there is irreversible damage.
Description of the intervention
General health checks involve a contact between a health professional and a person that is not motivated by symptoms and where several screening tests are performed to assess general health. The purpose is to prevent future illness through earlier detection of disease or risk factors, or to provide reassurance. The terminology is confusing. Multiphasic screening, periodic health examination and preventive health checks are examples of terms used to describe the intervention. Some studies have investigated the effect of a single health check and some have examined the effect of consecutive checks, and the diagnostic tests included vary considerably. We use the broad term 'general health check', which is frequently used by lay people and in advertising.
Few of the screening tests commonly included in general health checks have been evaluated according to accepted criteria, that is in high‐quality randomised trials (UK National Screening Committee 2010). Whilst the benefits and harms of treatments for conditions such as hypertension and diabetes have been extensively studied in randomised trials, screening asymptomatic people for these conditions has not (Norris 2008; Sheridan 2003). When screening for individual conditions has been studied in randomised trials, the outcome has varied. For example, screening for prostate cancer does not appear to substantially reduce disease‐specific mortality but has important harms (Djulbegovic 2010), whereas testing for faecal occult blood prevents one in six colorectal cancer deaths though at the cost of a large number of invasive examinations in healthy people (Hewitson 2007).
Health checks may be offered to the general population as part of a national policy or private health insurance, or employers may offer them to their employees. They may also be purchased by the individual from commercial providers or provided by general practitioners. Health checks may be quite comprehensive and use advanced technologies, such as computed tomography or magnetic resonance imaging, although these interventions are not recommended for health checks because of unproven benefit and risk of harms (FDA 2011).
Some general health checks include a conversation with a health professional, possibly a questionnaire, and sometimes also a physical examination by a doctor. In essence these manoeuvres are screening tests, although a conversation may not be perceived as such. Lifestyle interventions are also frequently administered during a health check, for example advice on diet and smoking. This is not screening but behavioural intervention, and appears to be of varying value. For example, systematic reviews have not shown a value for multiple risk factor interventions in general populations (Ebrahim 2011). There may be a small effect of modification of dietary fat, but the ideal type of modification is not clear (Hooper 2011). However, simple advice on quitting smoking has been shown to have an effect (Stead 2008).
Importantly, primary care physicians sometimes advise health checks or selected screening tests for patients that they think might benefit from them when they see the patients for other reasons. Such clinically motivated testing is often considered an integral part of primary care practice and it is against this background that the effect of systematic health checks are measured.
How the intervention might work
General health checks are expected to reduce morbidity and mortality through earlier detection and treatment of diseases and risk factors for diseases. For example, early detection of hypertension or hypercholesterolaemia may lead to reductions in morbidity and mortality through treatment. Screening may detect precursors to disease, for example colorectal adenomas or cervical dysplasia the treatment of which may prevent cancer from developing. Also, identification of signs or symptoms of manifest disease that the person had not deemed important may be beneficial. Counselling on diet, weight and smoking may also be of value. Healthy people may feel reassured, which could decrease worry. The preventive nature of general health checks implies that most effects would be expected to have a latency of several years.
Screening healthy people can also be harmful. While we cannot be certain that screening leads to benefit, all medical interventions can lead to harm. A well‐known example is overdiagnosis of latent cancers or carcinoma in situ, which might not have progressed to become symptomatic or might have regressed spontaneously (Welch 2004). Furthermore, false positive test results can lead to unnecessary invasive diagnostic tests that may cause harm; and drug treatment of people with risk factors such as high cholesterol and elevated blood glucose can have adverse effects, also in people who would not have developed manifest disease. False positive test results may cause unnecessary worry (Brewer 2007), and false negative results may lead to a false sense of security and delay medical attention when needed. Further, being labelled as having a disease, or even just as being at increased risk of getting a disease, may negatively impact healthy peoples' views of themselves (Barger 2006; Haynes 1978). It may also make it more difficult to obtain life and health insurance in some countries. Last but not least, there is a financial cost for patients and society in identifying and treating risk factors and diseases that might never have manifested themselves as illness or shortened life.
Why it is important to do this review
General health checks are mixtures of screening tests few of which have been adequately studied, and it is not clear whether they do more good than harm. A systematic review of the periodic health evaluation, which included both trials and observational studies, found mixed results on clinical outcomes, except for patient worry where a beneficial effect was seen in one trial (Boulware 2006; Boulware 2007). The definition of the intervention was narrow and relatively few trials were included. Two other reviews focused on using global coronary risk scores, which is a common component of health checks (Sheridan 2008; Sheridan 2010). One included studies in which the effect of calculating the risk score could be isolated and it did not find any studies reporting on long‐term clinical events. Two out of four studies found that the intervention increased prescription of cardiovascular drugs (Sheridan 2008). Another review focused on the effect of giving global coronary risk information to adults (Sheridan 2010). The authors found that the intervention improved the participants' perception of risk and that it may increase the intent to initiate prevention, but they found no studies reporting on actual event rates. We saw a need for a broad and comprehensive review of the randomised trials, with a focus on clinically important outcomes rather than surrogate outcomes. We chose not to review observational studies because the risk of bias is too great in relation to the expected effect sizes.
Objectives
To quantify the benefits and harms of general health checks.
Methods
Criteria for considering studies for this review
Types of studies
Randomised trials of general health checks compared with no health checks. We had no language restrictions. We included trials regardless of funding source.
Types of participants
Inclusion criteria
Adults, regardless of gender and ethnicity. The setting had to be primary care or the community. We included trials regardless of whether they were directed at the general population or a more narrow group, for example employees of a company.
Exclusion criteria
We did not include studies described as specifically targeting older people, or which only included people aged 65 years or more (see Differences between protocol and review). Studies in populations of patients or people with specific known risk factors or diseases were excluded, for example studies in people with hypertension or ischaemic heart disease.
Types of interventions
Screening for more than one disease or risk factor and in more than one organ system, whether performed only once or repeatedly. This definition excludes trials of screening for single diseases, for example prostate cancer, and trials of single screening tests which may detect more than one disease, for example spirometry.
We accepted trials which included a lifestyle intervention (for example advice on diet, smoking and exercise) in addition to screening since this is a fairly well‐defined intervention that is often incorporated into health checks.
We included trials regardless of the type of healthcare provider, for example a doctor, nurse, or other health professional.
Types of outcome measures
Some trials and observational studies have investigated the effects of health checks on surrogate outcomes, for example cardiovascular risk factors, health behaviours, or cancer screening rates, and some have found positive effects, albeit generally small. However, there can be serious problems with using surrogate outcomes (Fleming 1996).
First, assessing the effect of changes in a surrogate outcome on morbidity and mortality is difficult and unreliable and requires modelling with assumptions that are difficult to test. There may be latency of effects (Ebrahim 2011; Hooper 2011) and uncertainty regarding the degree of reversibility of the risk. For example, quitting smoking reduces the risk of coronary heart disease and mortality, but slowly and probably not completely (Ben‐Schlomo 1994; Cook 1986). Also, it is difficult to know to what degree changes in risk factors and behaviours are maintained in the long term. Second, the use of surrogate outcomes disregards the harmful effects of follow‐up diagnostic procedures and treatments. A recent example is the drug rosiglitazone for diabetes, which reduced the surrogate outcome blood glucose but caused serious heart disease (Lehman 2010; Nissen 2010). This was not recognised in trials using surrogate outcomes only. Third, in order to measure changes in risk factors and health behaviours the participants need to attend a follow‐up session or answer questionnaires. Since it is impossible to blind the intervention group, and since the intervention is often partly behavioural, biased loss to follow‐up is to be expected. For example, people with adverse health behaviours might not feel inclined to confront the researchers again, which could lead to spurious improvements in surrogate outcomes in an available case analysis or a last observation carried forward analysis. Also, the lack of blinding may cause biased reporting of health behaviours.
For these reasons, we focused on outcomes that directly reflect the beneficial and harmful effects of health checks on the health of the participants and which can be reliably ascertained with long follow‐up. We chose total and disease‐specific mortality as our primary outcomes because these are less likely to be biased than other outcomes, are of direct relevance to participants, and capture both beneficial and harmful effects. However, we included some outcomes that are susceptible to attrition bias and reporting bias because they are important and cannot be assessed in other ways, for example self‐reported health and worry.
Primary outcomes
-
All‐cause mortality
-
Disease‐specific mortality
Secondary outcomes
-
Morbidity (e.g. myocardial infarction)
-
New diagnoses (total and condition‐specific)
-
Admission to hospital
-
Disability (preferably patient‐reported)
-
Patient worry
-
Self‐reported health
-
Number of referrals to specialists
-
Number of non‐scheduled visits to general practitioners
-
Number of additional diagnostic procedures due to positive screening tests
-
New medications prescribed and frequency and type of surgery
-
Absence from work
Harms
The harmful effects of health checks are reflected in the above outcomes. The major harms are overdiagnosis, adverse psychological and behavioural effects, complications related to follow‐up investigations, and unnecessary treatments instigated as a result of overdiagnosis. While diagnostic, preventive and therapeutic activity can lead to improved health, they are also often harmful and should be balanced by reductions in morbidity and mortality to be justified. Estimating overdiagnosis will not be possible for all diseases due to the broad scope of the review and because increased incidence is a goal for some conditions, for example diabetes, but a problem for others, for example prostate cancer. These questions are more appropriately addressed in reviews of screening for individual diseases. However, a quantification of the change in the incidence of individual conditions is still valuable even though it may represent both beneficial and harmful effects. Another possible harm is a negative effect on health behaviours, for example failure to quit smoking due to reassurance of good health. Such effects would also be captured by the chosen outcomes.
Search methods for identification of studies
Related systematic reviews were identified by searching the Database of Abstracts of Reviews of Effectiveness (DARE) and the databases listed below. Studies were identified using the following bibliographic databases, sources, and approaches.
The Cochrane Central Register of Controlled Trials (CENTRAL) (2010, Issue 11), part of the The Cochrane Library at www.thecochranelibrary.com.
MEDLINE on Ovid (1948 to current), MEDLINE In‐Process.
EMBASE on Ovid (1947 to current).
Cumulative Index to Nursing and Allied Health Literature CINAHL on EBSCOhost (1980 to current).
Healthstar on Ovid (1966 to 2010).
Cochrane Effective Practice and Organisation of Care Review Group (EPOC) Specialised Register, Reference Manager.
ClinicalTrials.gov.
World Health Organization (WHO) International Clinical Trials Registry Platform (ICTRP).
Search strategies were developed by the EPOC Trials Search Co‐ordinator (TSC), Michelle Fiander, in consultation with the authors. Strategies reflect an iterative development process whereby the TSC developed a series of test strategies the results of which were screened by the authors for relevance. Based on this feedback, the TSC added or deleted terms and search strategies were finalized. Two MEDLINE strategies were run: MEDLINE Strategy A (Appendix 1), run in August 2010; MEDLINE Strategy B (Appendix 2), run in November 2010. Strategy B served as the basis for translations to other databases. Neither date nor language restrictions were applied. Duplicates were removed both in the Ovid interface and in Reference Manager software. Searches were conducted in November to December 2010; all databases were searched from the database start date forward. Two methodological search filters were used to limit retrieval to the appropriate study design and interventions of interest: the Cochrane randomised controlled trial (RCT) sensitivity and precision maximizing filter (Higgins 2011); and the EPOC filter to identify non‐RCT study designs. Strategies for searches in The Cochrane Library, EMBASE, CINAHL, and the EPOC Register are in Appendix 3. An updated search was run in July 2012 (Appendix 4).
Searching other resources
We searched the reference lists of included studies and used citation tracking (Web of Knowledge) for all articles describing eligible trials. We asked authors of the included studies if they were aware of any other published, unpublished, or ongoing studies that could meet our inclusion criteria.
Data collection and analysis
Selection of studies
Two authors (LTK and CGL or KJJ) independently assessed the potential relevance of all titles and abstracts identified through the searches and full‐text copies of potentially eligible articles were assessed. Disagreements were resolved through discussion, involving the other authors (KJJ and PCG) when necessary. Two authors independently searched reference lists (LTK and KJJ) and one author used citation tracking (Web of Knowledge) on included articles.
Data extraction and management
Two authors (LTK and KJJ) independently extracted data from the included trials and entered them into a piloted data extraction form. When relevant information was missing from the reports we contacted the authors.
The following data were extracted from all included trials: study design, diagnostic tests used, total study duration, the number of participants allocated to each arm, number lost to follow‐up for each outcome, baseline comparability, setting, age, country, and date of study. We extracted the number of events or rates for mortality, hospitalisation (one or more), surgery, new medications, referrals to specialists and diagnostic procedures required because of positive screening tests, and for the number of physician visits. For ordinal scale outcomes we extracted the mean value; standard deviation; and name, range, and direction of the scale. When these data formats were not available we extracted what was possible to extract, including narrative accounts if the actual numbers were missing.
Assessment of risk of bias in included studies
We used the Cochrane risk of bias tool. The domains formally assessed were: sequence generation, allocation concealment, blinding of participants and personnel, blinding of outcome assessment, incomplete outcome data, selective reporting, and other biases. We assessed the risk of contamination of the control group under 'Other bias'. We also assessed the randomised groups for baseline comparability.
Measures of treatment effect
We preferred data from intention‐to‐treat analyses (ITT). When these were not available, we assessed the possible bias resulting from missing data. For mortality, we used the risk ratio. Ranking scales were treated as continuous data when possible. For all measures we used 95% confidence intervals.
Unit of analysis issues
For cluster randomised trials we preferably used effect estimates and standard errors from analyses which took the clustering into account. When such estimates were not available we disregarded the effect of clustering and investigated the impact of this in a sensitivity analysis.
Assessment of heterogeneity
Clinical and methodological differences between trials were assessed before any meta‐analyses were done, and we judged whether trials could be pooled. Heterogeneity was investigated with the I2 statistic, which describes the variation between trials in relation to the total variation.
Assessment of reporting biases
Outcome reporting bias is difficult to assess but we noted whether the outcomes that we considered important were reported. When the study design implied that data on other outcomes than the ones reported might have been investigated, we asked the authors for further data.
Data synthesis
As specified in our protocol, we used random‐effects model meta‐analyses. Due to the need to use published effect estimates in two trials, we used the generic inverse variance method available in RevMan. For outcomes other than mortality we summarised the results in tables and did a qualitative synthesis.
Subgroup analysis and investigation of heterogeneity
We planned the following subgroup analyses:
-
only one health check versus several;
-
physical examination by physician;
-
interventions that included advice on lifestyle;
-
age of trial;
-
geographical location of trial;
-
high versus low risk of bias;
-
long versus short follow‐up.
Sensitivity analysis
We decided to include cluster randomised trials despite anticipating that we had to ignore the clustering in some cases, and despite the greater risk of unsuccessful randomisation. To investigate the robustness of our results, we planned a sensitivity analysis excluding cluster randomised trials.
Results
Description of studies
Results of the search
The search yielded 4526 records after removal of duplicates. From these we selected 178 articles for full‐text assessment, of which we excluded 141. Forty‐one of the excluded articles did not report on a randomised trial, 68 articles (57 trials) studied a non‐relevant intervention (for example reminder systems for physicians or lifestyle interventions), 15 articles (11 trials) were geriatric, 15 articles (15 trials) studied people who were selected for diseases or risk factors thus not representing a general population, one did not have an unscreened control group, and one could not be retrieved. This left 37 articles reporting on 10 trials that were eligible for inclusion. An additional six trials reported in 26 articles were identified through searching reference lists and citation tracking. We identified a further 14 articles on the included trials through searching reference lists and citation tracking. Thus 16 trials reported in 77 articles were included; but since two trials never published their results (New York 1971; Titograd 1971), 14 trials reported in 73 articles were analysed (see Figure 1).

Study flow diagram.
Included studies
The 14 trials included in the analyses varied in size from 533 randomised persons in the Northumberland trial (Northumberland 1969) to 57,460 in the WHO trial (WHO 1971). The total number of participants was 182,880 with 76,403 allocated to health checks and 106,477 to control. Nine trials with 155,899 participants reported a total of 11,940 deaths (Ebeltoft 1992; Göteborg 1963; Göteborg 1970; Kaiser Permanente 1965; Malmö 1969; OXCHECK 1989; South‐East London 1967; Stockholm 1969; WHO 1971). The length of follow‐up for mortality varied from 4 to 22 years, and it also varied within trials for different outcomes. The trials that did not report on mortality were often small (Mankato 1982; Northumberland 1969; Salt Lake City 1972), with the exception of the British Family Heart study (Family Heart 1990) which included 12,924 persons. The Inter99 trial (Inter99 1999) has not yet published results for mortality.
The setting was general practice in five trials (Family Heart 1990; Ebeltoft 1992; Northumberland 1969; OXCHECK 1989; South‐East London 1967), the community in eight trials (Göteborg 1963; Göteborg 1970; Inter99 1999; Kaiser Permanente 1965; Malmö 1969; Mankato 1982; Salt Lake City 1972; Stockholm 1969), and the workplace in one trial (WHO 1971). As per our inclusion criteria, they included people that were not selected for diseases or risk factors. Four trials randomised households or couples (Family Heart 1990; OXCHECK 1989; Salt Lake City 1972; South‐East London 1967), one randomised factories (WHO 1971), and nine randomised persons.
The interventions can be broadly classified into two categories: screening focused on cardiovascular risk factors with a strong lifestyle intervention component, and broad screenings using many tests (often called multiphasic screening in older publications) but often without an important lifestyle intervention component. The broad type of screening was mainly seen in trials that started in the 1960s and 1970s (Göteborg 1963; Kaiser Permanente 1965; Malmö 1969; Northumberland 1969; Salt Lake City 1972; South‐East London 1967) and in the Ebeltoft trial (Ebeltoft 1992) in the 1990s. Five trials included screening for cancer. The tests used were chest radiographs (Göteborg 1963; Malmö 1969); chest radiographs and faecal occult blood testing (South‐East London 1967); chest radiographs, mammography and cervical smears (Salt Lake City 1972); and chest radiographs, sigmoidoscopy, mammography and pelvic examinations (Kaiser Permanente 1965). See Table 1 for an overview of the interventions used.
| Blood pressure | Cholesterol | Height and weight | Risk score | Electrocardiogram | Biochemistry panel | History | Spirometry | Urine analyses | Diabetes | Clinical examination | Vision and/or hearing | Cancer screening | |
| Göteborg 1963 | x | x | x | x | x | current symptoms, personal and family history |
| x | fasting blood sugar | x | x | chest X‐ray | |
| Kaiser Permanente 1965 | x | probably | x | x | x | current symptoms, personal and family history | x | x | x | x | chest X‐ray, mammography, pelvic exam, sigmoidoscopy | ||
| South‐East London 1967 | x | probably | x | x | x | current symptoms, personal history | x | x | x | chest X‐ray, faecal occult blood | |||
| Malmö 1969 | x | x | x | x | haematocrit, triglycerides, cholesterol | interview and questionnaire, not specified | x | x | x | chest X‐ray | |||
| Northumberland 1969 | ? | ? | ? | ? | ? | ? | current symptoms | ? | ? | ? | ? | ? | ? |
| Stockholm 1969 | x | probably | x | x | current symptoms, personal history | x | x | ||||||
| Göteborg 1970 | x | x | x | x | family history | ||||||||
| WHO 1971 | x | x | x |
| current symptoms |
| |||||||
| Salt Lake City 1972 | x | x | x | x | x | x | x | chest X‐ray, mammography, cervical smear | |||||
| Mankato 1982 | x | x | x | ||||||||||
| OXCHECK 1989 | x | x | x | personal and family history | |||||||||
| Family Heart 1990 | x | x | x | Dundee | personal and family history |
| random capillary glucose | ||||||
| Ebeltoft 1992 | x | x | x | Anggaard | x | x | x | x | non‐fasting blood glucose | x | |||
| Inter99 1999 | x | x | x | PRECARD | x | x | oral glucose tolerance test |
Not all screening tests used are shown; see Characteristics of included studies for full details. The Kaiser Permanente 1965, South‐East London 1967, and Stockholm 1969 trials did not specify the contents of their biochemical screening. It seems unlikely that cholesterol was not included.
The uptake in the first screening round ranged between 50% (Mankato 1982) and 90% (Ebeltoft 1992) with a median of 82%. The Kaiser Permanente trial did not have screening rounds but used continuous urging of the intervention group by written invitations and phone calls to utilise a pre‐paid health check.
Here we present a description of the included trials. The references to trials are labelled with the year of the start of the trial. For additional details the reader is referred to the Characteristics of included studies section.
The Göteborg 1963 trial
This included all men born in 1913 and living in Göteborg, Sweden in 1962. Randomisation was done using date of birth, in a 1:2 ratio, resulting in groups sizes of 1010 (intervention) and 1956 (control). The allocation sequence was predictable but since all eligible persons were included and allocated before any contact was made the risk of selection bias was low. The intervention group was invited for three rounds of screening (1963, 1967, and 1973) and the control group was not contacted. All participants were followed for mortality over 15 years.
The first screening was performed by staff at a local hospital and included an interview about cardiovascular symptoms and chronic bronchitis, a questionnaire on social data, smoking, personal and family history, a questionnaire on cardiovascular symptoms, weight, height, skinfold thickness, blood pressure, electrocardiography, urinalysis (protein, glucose, osmolality), blood samples (cholesterol, triglycerides, fasting blood sugar, haematocrit, sedimentation rate, creatinine, serum protein electrophoresis, sodium, potassium, chlorides, blood group), chest x‐ray, measurement of heart volume, general physical examination, and an examination by an ophthalmologist. Half of the intervention group had a psychiatric interview and the other half were given a psychiatric questionnaire. At the second screening, in 1967, the examination also included a work test at maximum load. The 1973 examination was unclearly described but at least included height, weight, skinfold thickness, and questions about morbidity, well‐being, and utilisation of medical care.
The Kaiser‐Permanente trial
This trial investigated the effects of broad (multiphasic) screening with 16 years of follow‐up. In 1964, a sample of members of the Kaiser‐Permanente Health Plan in San Francisco and Oakland aged 35 to 54 years were divided into an intervention group (n = 5156) and a control group (n = 5557) using an allocation algorithm based on membership numbers, which was likely to yield comparable groups. This was done before any contact was made with the trial participants and the risk of selection bias was low. The intervention began on 1 January 1965 and participants alive at that date were included in the analyses, giving analysed group sizes of 5138 (intervention) and 5536 (control). The control group was larger than the intervention group due to identity mix‐ups and exclusion from the intervention group of people who had moved too far away from the study centre. The excluded participants were included in an analysis of mortality after 11 years, without changes to the results (Dales 1979).
Participants in the intervention group were urged annually, by telephone and letter, to have a multiphasic screening examination that was available to members of the Kaiser health plan. The intervention continued for 16 years. The control group participants received questionnaires about their health but were not urged to be screened and were not informed about the experiment. However, as part of their health plan they were able to request the same multiphasic screening examination as the intervention group and did so to a large extent. After 16 years of intervention the mean number of health checks was 6.8 in the intervention group and 2.8 in the control group. In the intervention group 15.7% of the participants had never had a health check, compared to 36.2% in the control group. Thus, the contrast between the groups was not substantial.
The screening intervention was broad and included a medical history, clinical examination, chest x‐ray, laboratory tests, mammography, and recommendations for gynaecologic examinations and sigmoidoscopy for people over 40 years, but no explicit lifestyle component (see full list at Characteristics of included studies). Additional testing was done according to computerised advice rules and the judgement of the clinicians in charge of the screening. There was a follow‐up visit with a physician or nurse for interpretation of the results.
The outcomes relevant to this review were total mortality, cause‐specific mortality, morbidity, hospitalisation, physician visits, prescriptions, disability, and number of new diagnoses. A weakness of this trial is that participants leaving the health plan were considered lost to follow‐up for all outcomes except mortality, resulting in more than 35% having been lost after 16 years. Only people leaving California were lost to follow‐up for mortality and the authors assessed this to be 8% to 18% of deaths (Friedman 1986).
The South‐East London Screening Study
This trial began in 1967 and was set in two general practices in London, England. All registered people aged 40 to 64 years were included and they were randomised all at once before any contact was made with them. The randomisation was unclearly described but involved alternate allocation of couples from an alphabetically arranged list. There was also some form of matching, but this was not described in detail.
The trial is reported in several papers by different sets of authors and the sizes of the compared groups after randomisation differ between publications. An early paper stated that the group sizes were 3460 (intervention) and 3337 (control) (Trevelyan 1973), but in the main paper they were reported as 3876 (intervention) and 3353 (control) (South‐East London Study Group 1977). Furthermore, only 3292 (intervention) and 3132 (control) were included in the mortality analyses. Another paper explained that 579 spouses of eligible participants who were outside the defined age range were originally included in the study and invited for screening (D'Souza 1976) but they appear to have been excluded at the time of analysis, possibly to avoid bias from expanding the intervention group with people at ages less likely to benefit from screening. However, this does not fully explain the discrepancies.
The intervention group was invited for two rounds of multiphasic screening, done independently from the participants' own general practitioners. The screening included a physical examination, medical history, a questionnaire on symptoms, height and weight measurements, vision and hearing tests, chest x‐ray, spirometry, electrocardiogram (ECG), blood pressure, blood chemistry and faecal occult blood testing. The control group was not invited, and the authors wrote that the control group did not show any interest in screening and that none were screened (Trevelyan 1973).
After five years, both the intervention group and the control group were screened using the same tests, except for the questionnaire and faecal occult blood testing. Follow‐up for mortality and usage of health services continued for a further four years. One later report described the five‐year survey as being "non‐prescriptive (in the sense that no therapeutic activity was expected to result from it)" but did not describe how this was ensured (Stone 1981). Screening the control group after five years biased the nine‐year results towards no effect.
The Northumberland trial
In 1969, all men aged 50 to 59 in seven general practices in the UK were included and randomised by date of birth into three groups. People with serious illnesses were excluded. One group was screened with a full physical examination (n = 242), although the contents of this were not described. A control group was not invited for screening (n = 291). A third group was sent a questionnaire about health issues and were invited for examination if certain symptoms were present, for example persistent cough or haematuria (n = 275). Follow‐up was done after 18 months and was based on patient records. The outcome included in this review is physician visits. Other relevant outcomes were reported but in a way we could not use.
The Malmö trial
The study population was defined as all men born in 1914 and living in Malmö, Sweden in early 1969. All men born in even‐numbered months were invited to screening (n = 809) and all men born in uneven‐numbered months were not (n = 804). This method of allocation sequence generation is obsolete, but since all eligible participants were included and randomised before any contact was made the risk of selection bias was low. The screening intervention was broad and included blood pressure, blood tests (cholesterol, triglycerides, haematocrit), urinalysis (glucose, albumin), height, weight, electrocardiography, spirometry, nitrogen washout for measuring pulmonary dead space, sputum cytology, chest x‐ray, venous occlusion plethysmography (arterial blood flow), an interview, a questionnaire, and a physical examination. Of the 178 participants classified as heavy smokers in the intervention group, a random sample of 51 were offered a group counselling intervention to quit. Participants with hypertension or impaired lung function were followed up and treated at a hospital rather than by their general practitioner. This may have biased the results in favour of the intervention group.
The participants' primary care physicians were not involved with the study and the control group was not contacted. Information on mortality and hospitalisations was gathered from public registers after five years, with 1% loss to follow‐up. Cause of death was ascertained blinded to randomised group by one person using autopsy reports and hospital records.
The Stockholm trial
This trial aimed to assess the effect of one general health examination on long‐term mortality. The participants were men and women aged 18 to 65 years living around Stockholm. A complex stratified randomisation scheme was used which purposely introduced baseline imbalances (see Characteristics of included studies for description). The authors used Cox regression, in which they controlled for the baseline imbalances introduced by the randomisation scheme as well as sex and age. We obtained mortality data from the authors and supplemented this analysis with a fixed‐effect model meta‐analysis combining the effects in each of the 12 strata, and got results nearly identical to those originally reported.
The numbers randomised were 3064 (screening) and 29,122 (control). Participants in the intervention group were invited to one screening while the control group was not. Both groups were sent a questionnaire before randomisation. The screening consisted of blood pressure; blood tests (not specified); ECG; exercise tests; a physical examination; social, psychiatric and medical interviews; eye and dental examinations. Participants with an identified need for specialist services were directly referred, whereas participants were instructed to contact their primary care physician for other identified issues. Simple services like reassurance and prescription of simple medications (not specified) were provided by the researchers.
Participants were followed up for mortality in registers over a period of 22 years. The outcomes studied were total mortality, cardiovascular mortality, cancer mortality, and mortality from accidents and intoxications. Data on hospitalisation were collected but not published.
The Göteborg 1970 trial
The aims of this trial were to reduce cardiovascular risk factors and to measure the effect on morbidity and mortality. The trial started in 1970 and included all men in Göteborg, Sweden, who were born in 1915 to 1922 and 1924 t0 1925. These were randomised to an intervention group (n = 10,004) and two control groups (n = 10,011 and 10,007). The intervention group was invited to screening at baseline and after four years. The screening was focused on cardiovascular risk factors and included blood pressure, total serum cholesterol, height, weight, ECG, a questionnaire on family history of cardiovascular disease and risk factors, and an interview. Elevated risk factors were treated with lifestyle advice and drugs according to simple decision rules based on cut‐off values for individual risk factors (see Characteristics of included studies). Thus, the standard of follow‐up and care was likely to be different compared to the control groups.
In one of the control groups, a random 2% were invited to screening at baseline and an 11% sample after four years. The purpose of this was to compare changes in risk factors. The other control group was never contacted. We chose to pool both control groups for our meta‐analysis.
The participants were followed in registers for mortality and morbidity until the end of 1983, with a mean follow‐up time of 11.8 years. For our analysis of cardiovascular mortality we combined fatal coronary heart disease and fatal stroke.
The WHO trial
(WHO 1971)
Conducted in five countries (UK, Belgium, Poland, Spain, Italy) this trial had aims similar to the multifactor primary prevention trial in Göteborg (Göteborg 1970), but used a different design and was set in the workplace. It started as one trial in the UK but was soon expanded to include other countries using similar methods. Results from Spain were never included in the analysis of events. This decision was made before results were available to the investigators and was due to the fact the Spanish part of the trial was started later than the others. Factories were recruited for participation, matched in pairs, and these pairs were then randomised to either intervention or control. The method of randomisation was not described but allocation was concealed and demographic and prognostic variables were balanced at baseline. The number of factories were 80, providing 40 pairs. Only the male employees were included. The sizes of the groups as randomised were 30,489 (intervention) and 30,392 (control). To assess baseline balance and study the effect on risk factors, a 10% random sample of the control group was invited to screening. These participants were not included in the analysis of events and the numbers analysed were thus 30,489 (intervention) and 26,971 (control).
The screening included blood pressure, total serum cholesterol, weight and a questionnaire on smoking, physical activity and symptoms of coronary heart disease. The men at highest risk (10% to 20%, which varied between centres) were called for an interview with a physician and given lifestyle advice and medical treatment of risk factors. In addition, the intervention factories had a campaign of health education aimed at reducing risk factors.
Annually, a random 5% of the intervention group were invited to screening in order to assess changes in risk factors. At the end of trial, all in both the intervention and control factories were invited to screening. Follow‐up was at between five and six years (differed between centres). Mortality was assessed for all, but morbidity was only assessed for people still employed to avoid detection bias.
No results for cardiovascular mortality were reported (including stroke and other causes) so instead we used the reported results for coronary heart disease mortality in our meta‐analysis. For total and coronary heart disease mortality, we used reported effect estimates from an analysis which took clustering into account. For cancer mortality no such estimate was reported so we disregarded the clustering.
The automated multiphasic health testing (AMHT) study
This trial was set up in the Health Insurance Plan of Greater New York (HIP) with the aim of investigating whether health checks could reduce the gap in health status and health behaviour between poor and non‐poor persons. The study included families with at least one person aged 12 to 74 years. The exact size of the sample was unclear, but about 7,000 non‐poor persons and somewhat fewer poor persons were mentioned as being the intervention group. The control group was said to be 20% of this size. The intervention included blood pressure, height, weight, skinfold thickness, ECG, pulse rate, chest x‐ray, audiometry, dental survey, visual acuity, tonometry, spirometry, glucose challenge, blood tests (cholesterol, total protein, albumin, calcium, total bilirubin, urea nitrogen, uric acid, haemoglobin, white blood cell count, syphilis test), urine tests (pH, protein, glucose, blood, acetone), sickle cell trait, urine culture (women only), instruction in breast self‐examination, mammography (women aged 40+ years), and Pap smear. The trial was designed to investigate disability and absence from work. Mortality data were also to be gathered. The AMHT programme was discontinued after the first screening round but follow‐up was planned to continue. We have not found reports of the results.
Titograd 1971
This study was set up in Titograd, former Yugoslavia, in collaboration between Yugoslavian and American researchers. A random sample was drawn from the population aged 30 to 49 years, and randomly divided into an intervention (n = 6577) and a control group (n = 6573). A 20% random subsample of both groups were interviewed at baseline. The intervention group was invited for screening at baseline and at two‐year intervals. Follow‐up of positive test results and treatment of identified conditions was done according to specified regimens. The intervention included blood pressure, cholesterol, height and weight, ECG, spirometry, glucose tolerance, chest x‐ray, red and white blood cell counts, blood sedimentation rate, blood urea nitrogen, cervical smear, visual acuity and fundus examination, Wassermann reaction (syphilis), urinalysis (not specified), and a latex fixation test (unclear which antibodies were tested for). The control group was not invited for screening. Analysis of morbidity, disability, mortality, and medical care utilisation was planned after six years, and if no effect was observed the trial would be continued for a further four years. We have not found reports of the results of this trial.
Salt Lake City 1972
This trial was conducted in 1972 to 1973 and studied the effects of one multiphasic screening examination on disability and utilisation of health care. The study sample consisted of random samples from three groups in Salt Lake City, USA: 200 low‐income families with a pre‐paid healthcare programme, 200 low‐income families with no pre‐paid healthcare programme, and 166 middle‐income families who had volunteered for a study of health care. The participants were randomised by family to the intervention or control in a 3:2 ratio. The number of families in each group were not reported but the number of participants in the intervention group was 642 and in the control group it was 454. All were interviewed at baseline for information about health status, number of disability days caused by illness, patterns of healthcare utilisation, health knowledge, attitudes toward the healthcare system, and hypochondriasis. The intervention group was offered one multiphasic screening consisting of a very broad array of tests including five different x‐ray studies, mammography, cervical cytology, spirometry, ECG, blood pressure, tonometry, audiometry, visual acuity, venereal disease survey, 12 blood tests and six urine tests. The control group was not offered screening. All outcomes were ascertained through a second interview one year later. Those who changed economic status, did not attend for screening, did not consult their physician about screening results, or who did not participate in the one‐year follow‐up were excluded. This resulted in 49% of the intervention group and 82% of the control group participants being included in analyses. The relevant outcomes studied were hospitalisation, physician visits, and disability.
The Minnesota Heart Health Program
This trial randomised addresses representing the entire community to intervention (n = 1156) or control (n = 1167). In the intervention group, the whole household was invited for screening but only one person from each household aged 25 to 74 years, selected randomly, was followed up and included in the analyses. After one year, the participants in the intervention group who attended the initial screening were re‐invited for a follow‐up screening and the control group was invited for their first time. The screening included blood pressure, cholesterol, height, weight, expired air carbon monoxide, and leisure time physical activity. Participants received health education at each measurement station. Each family spent 20 minutes with a health educator to review the results and receive further advice. Participants were referred to their regular physician for treatment when necessary. Only persons who participated in the screening were included in analyses, which resulted in missing outcome data for more than 50%. The trial was conducted during a population‐based programme to educate about risk factors for coronary heart disease. The relevant outcome reported was use of antihypertensive medication.
OXCHECK
Starting in 1989, this trial included 11,090 persons aged 35 to 64 years who were registered with one of five general practices in the UK and who returned an initial questionnaire. Participants were randomised by household into four groups before contact was made. The first group had health checks at year one and year four, the second group at years two and four, the third group at years three and four, and the last group only at year four. Participants in the first two groups were further randomised to annual re‐checks or no re‐checks. The first three groups constituted the intervention groups with differing lengths of follow‐up and 'dose' of the intervention, and the last group was a control group.
The health checks were performed by specially trained nurses and included measurement of blood pressure, total cholesterol, height and weight; and questionnaires on personal and family medical history, lifestyle, diet, exercise rates, and alcohol consumption. Participants were given individualised counselling on reduction of risk factors and offered follow‐up visits with the nurse, as needed. The groups were compared for changes in risk factors and health behaviours. The trial was designed for studying changes in risk factors and not mortality, but we obtained mortality data from the authors.
The British Family Heart Study
Thirteen matched pairs of general practices were randomised to either intervention or control (external control group). In the intervention practices, men aged 40 to 59 years were randomised to either intervention or control (internal control group) and their partners were included. The number of people randomised was not clear but the numbers analysed were 3436 (intervention), 3576 (internal control), and 5912 (external control). The intervention group was invited for screening and lifestyle intervention at baseline. The screening included blood pressure, cholesterol, blood glucose, body mass index (BMI), waist/hip ratio, smoking status, and medical history. A coronary risk score (Dundee) was communicated to each participant and the frequency of follow‐up examinations was determined by this score together with other individual risk factors. Lifestyle advice was given and personally negotiated lifestyle changes were recorded. After one year both the intervention and control groups were invited for follow‐up screening. Only those participants who attended their first health check were included in the analyses, that is at baseline for the intervention group and after one year for the control group. Relevant outcomes were self‐reported prevalence of hypertension, hypercholesterolaemia, diabetes, and coronary heart disease; self‐reported health; and use of selected medications.
The Ebeltoft trial
This trial began in 1992 and studied the effects of broad health checks and lifestyle interventions in general practice. The initial population was all 3464 residents aged 30 to 49 years living in the Ebeltoft municipality, Denmark, in 1991. A random sample of 2000 participants (invitation failed for administrative reasons in an additional 30 persons) were mailed an invitation and a questionnaire. Persons who returned the questionnaire (n = 1507) were individually randomised into two intervention groups and a control group. The first intervention group (n = 502) was offered a health check at baseline and after two years, with a written response about the results and recommendations for follow‐up. The second intervention group (n = 504) was offered the same plus annual 45‐minute lifestyle discussions with the general practitioner. The third group (n = 501) had usual care.
The health checks included an assessment of cardiovascular risk (blood pressure, cholesterol, smoking, family history, sex, age, body mass index), ECG, liver enzymes, creatinine, blood glucose, HIV status (optional), spirometry, urinary dipstick for albumin and blood, BMI, CO concentration in expired air, physical endurance, and vision and hearing tests.
All three groups were invited for screening after five years with 25% to 31% loss to follow‐up. The main outcomes were cardiovascular risk factors but self‐reported health and worry were also measured. Data on mortality, physician visits, referrals, and hospitalisation were collected through registers, and two comparisons were made: 1) between the three intervention groups, and 2) between the 2000 randomly invited to participate in the trial and the 1434 not invited. The first comparison may have had diminished external validity due to self‐selection in returning the questionnaire, and the questionnaire itself may have contaminated the control group. Furthermore, hospitalisations and referrals were compared after eight years of follow‐up even though the control group was screened after five years. The second comparison did not have these problems but had low contrast since only about half of the participants invited to participate in the trial were eventually invited to health checks. We chose the eight‐year mortality results from the second comparison for our meta‐analysis, and for the qualitative analyses we present results from both comparisons.
Inter99
This recently concluded trial investigated the effects of health checks and two kinds of lifestyle interventions. All 61,301 persons aged 30, 35, 40, 45, 50, 55 and 60 years and living in 11 municipalities in the south‐western part of Copenhagen County on 2 December 1998 were included. A random sample of 13,016 persons were invited to screening and the remaining 48,285 constituted the control group. The intervention groups and a random sample of 5264 persons in the control group had questionnaires at baseline and after one, three, and five years of follow‐up. All participants were followed up through central registers.
The screening included blood pressure, height and weight, waist and hip circumference and ratio, fasting blood samples (high density lipoprotein (HDL), triglyceride, total cholesterol, very low density lipoprotein (VLDL), low density lipoprotein (LDL)), glucose tolerance test, spirometry, and ECG. Absolute 10‐year risk of ischaemic heart disease was assessed using the PRECARD computer program and individual counselling on risk factors and adverse health behaviours was given.
High‐risk participants were offered four health checks (at baseline and years one, three, and five), low‐risk participants were offered two (at baseline and year five). The intervention group was further randomised into high or low intensity treatment of risk factors. The high intensity group participants, who had a high risk of ischaemic heart disease, were offered six sessions of group counselling during a four to six month period and were re‐invited for a similar intervention after one and three years. Participants in the low intensity group were not offered group counselling but were referred to their general practitioner. The control group was not contacted.
Mortality data are not published yet. The results on self‐reported health were based on a comparison between the intervention group and the 11% subsample of the control group that had questionnaires. Those who returned the baseline questionnaire were included in an analysis of repeated measurements of self‐reported health, giving sample sizes of 6784 (intervention) and 3321 (control group).
Risk of bias in included studies
Risk of bias varied considerably between trials, but in general there were problems in most trials. The two major issues were lack of blinding and missing outcome data, whereas selection bias was unlikely in most trials.
For mortality, seven out of nine trials reporting on this outcome had low risk of selection bias, and eight of nine were at low risk of attrition bias for that particular outcome. Kaiser Permanente (Kaiser Permanente 1965), the South‐East London Screening Study (South‐East London 1967), and the Ebeltoft Health Promotion Study (Ebeltoft 1992) were biased towards no effect because of contamination and low contrast between groups, and in the OXCHECK (OXCHECK 1989) we prioritised power over contrast in the merging of groups. Four trials were biased by design in favour of the screening group (Göteborg 1963; Göteborg 1970; Malmö 1969; WHO 1971). One of the most reliable trials (Inter99 1999) has not yet published mortality results.
For other outcomes, detection bias, biased reporting of subjective outcomes, and biased drop‐out were major concerns in many of the trials. In particular, the patient‐reported outcomes should be viewed with caution due to the lack of blinding. Readers are referred to the risk of bias figures for an overview (Figure 2; Figure 3).

Risk of bias summary: review authors' judgements about each risk of bias item for each included study.

Allocation
Six trials used a genuinely random method for generating the randomisation sequence (Ebeltoft 1992; Göteborg 1970; Inter99 1999; Mankato 1982; OXCHECK 1989; Stockholm 1969). In four trials, we could not determine how the sequence was generated (Family Heart 1990; Salt Lake City 1972; South‐East London 1967; WHO 1971). In four trials, the sequence was predictable (for example date of birth) (Göteborg 1963; Kaiser Permanente 1965; Malmö 1969; Northumberland 1969) but these trials used designs where participants were included through lists or registers and allocated before any contact was made and we judged the risk of selection bias to be low.
We judged allocation to be adequately concealed in 13 trials (Ebeltoft 1992; Family Heart 1990; Göteborg 1963; Göteborg 1970; Inter99 1999; Kaiser Permanente 1965; Malmö 1969; Mankato 1982; Northumberland 1969; OXCHECK 1989; South‐East London 1967; Stockholm 1969; WHO 1971), reflecting the use of a pre‐randomised design. It was unclear in one trial (Salt Lake City 1972).
We thus judged 10 trials as likely to be free from selection bias (Ebeltoft 1992; Göteborg 1963; Göteborg 1970; Inter99 1999; Kaiser Permanente 1965; Malmö 1969; Mankato 1982; Northumberland 1969; OXCHECK 1989; Stockholm 1969). In four trials, we could not rule out selection bias. In the WHO trial (WHO 1971), the Salt Lake City trial (Salt Lake City 1972), and the British Family Heart Study (Family Heart 1990) there was no description of the sequence generation. In the South‐East London Screening Study (South‐East London 1967) the randomisation included use of a matching procedure which was unclearly described, and the sizes of the groups varied between publications.
Blinding
True blinding was not possible for the intervention group but could be achieved for the control group and the participants' primary care physicians by not informing them about the trial, and by gathering outcome data through registers. This may not be unethical because the participants were not patients in need of treatment, and the control group suffered no harm by being studied in this way. One trial attempted to create some degree of blinding by simply urging people to have a health check, which they were already entitled to by their health plan membership (Kaiser Permanente 1965).
Performance bias
Performance bias in this context meant differences in medical attention and preventive and screening activities resulting from knowledge of allocation.
In seven trials, the risk of performance bias was low (Göteborg 1963; Göteborg 1970; Inter99 1999; Kaiser Permanente 1965; Malmö 1969; Mankato 1982; WHO 1971), in two trials it was unclear (Family Heart 1990; Stockholm 1969), and in five trials the risk was high (Ebeltoft 1992; Northumberland 1969; OXCHECK 1989; Salt Lake City 1972; South‐East London 1967) because the primary care physicians clearly had knowledge of the status of their patients. For example, in one trial primary care physicians had lifestyle conversations with a subset of their own patients (Ebeltoft 1992), and in one trial there was a sticker on the medical records indicating the allocation (OXCHECK 1989). We expect the effects of these biases to be small due to the fact that these were predominantly healthy people with relatively few health issues requiring care.
Detection bias
We present a single assessment of the risk of detection bias for each trial, although there were exceptions for some outcomes in some trials. The reader is referred to the Characteristics of included studies section for detailed assessments.
Six trials had a low risk for most outcomes (Ebeltoft 1992; Göteborg 1970; Kaiser Permanente 1965; Malmö 1969; OXCHECK 1989; Stockholm 1969), two trials had unclear risk (South‐East London 1967; WHO 1971), and six trials had a high risk (Family Heart 1990; Göteborg 1963; Inter99 1999; Mankato 1982; Northumberland 1969; Salt Lake City 1972).
Of the three trials that adjudicated the cause of death given on death certificates, one did this blinded (Malmö 1969), one unblinded (Göteborg 1963), and in one it was unclear (WHO 1971). The other six trials reporting on mortality used public registers or death certificates without re‐classification (Ebeltoft 1992; Göteborg 1970; Kaiser Permanente 1965; OXCHECK 1989; South‐East London 1967; Stockholm 1969). The Inter99 trial (Inter99 1999) has not yet published mortality results or details about cause of death ascertainment.
We considered answers to questionnaires to be at high risk of bias due to the lack of blinding.
Incomplete outcome data
Objective outcomes
For objective outcomes (for example mortality, physician visits) we judged the risk of attrition bias to be low in eight trials (Ebeltoft 1992; Göteborg 1963; Göteborg 1970; Malmö 1969; OXCHECK 1989; South‐East London 1967; Stockholm 1969; WHO 1971), unclear in five trials (Family Heart 1990; Inter99 1999; Kaiser Permanente 1965; Mankato 1982; Northumberland 1969), and high in one trial. The Salt Lake City trial (Salt Lake City 1972) excluded participants who changed economic status, did not attend for screening, did not consult their physician about screening results, or did not participate in the one‐year follow‐up. This resulted in only 49% of the intervention group and 82% of the control group participants being included in the analyses. In the Kaiser Permanente trial, the authors considered participants as lost to follow‐up when they left the Kaiser health plan. This resulted in the loss of more than one third of participants for most outcomes. For mortality, only people leaving California were lost. Registers were used and the authors estimated the loss to be 8% to 18% over the 16‐year study period (Friedman 1986). Other trialists had access to mortality registers with much fewer losses (Ebeltoft 1992; Göteborg 1963; Göteborg 1970; Malmö 1969; OXCHECK 1989; South‐East London 1967; Stockholm 1969; WHO 1971). In the WHO trial (WHO 1971), cancer mortality was not reported from the Belgian part of the trial. The reason given for this was that all non‐coronary deaths were only categorised as such, without detailing the cause of death, as per the trial's protocol. The risk of bias due to this was unclear.
Subjective outcomes
In unblinded trials, attrition bias (bias due to incomplete outcome data in those lost to follow‐up) is a threat to any outcome which is dependent on the active participation of participants for follow‐up, for example answering a questionnaire, even when numbers lost to follow‐up are similar in the groups. None of the trials were at low risk of attrition bias, six trials did not report subjective outcomes (Göteborg 1963; Malmö 1969; Northumberland 1969; OXCHECK 1989; Stockholm 1969; WHO 1971) and the risk was high in all other trials (Ebeltoft 1992; Family Heart 1990; Göteborg 1970; Inter99 1999; Kaiser Permanente 1965; Mankato 1982; Salt Lake City 1972; South‐East London 1967).
Five trials investigated the possible effects of the missing data. In the Inter99 trial, the authors investigated the effects of non‐response with logistic regression on serial measurements of self‐reported health. They found that extreme values of self‐reported health were associated with non‐response but judged it unlikely to have seriously biased the results (Pisinger 2009). The British Family Heart Study (Family Heart 1990) used imputation with the last observation carried forward in the analysis of self‐reported health and found no important differences. In another analysis they found twice as many smokers among non‐attenders as among attenders. The Minnesota Heart Health Program trial (Mankato 1982) and the OXCHECK (OXCHECK 1989) trial found similar evidence of bias in relation to smoking but no large differences for other variables. In the Ebeltoft trial (Ebeltoft 1992), the authors reported in a letter that there were no differences in sex, age, baseline smoking, and baseline BMI between non‐attenders in the intervention and control groups, but did not present the data (Engberg 2002c). Important differences might not be statistically significant when the numbers are small.
None of the trials used optimal imputation techniques (for example multiple imputation). Last observation carried forward may give biased results, and the direction of the bias is unpredictable. Also, there might be differences in unmeasured factors, such as motivation and ability to change lifestyle, and we advice caution in interpreting these outcomes.
Selective reporting
We found seven trials to be at low risk of reporting bias (Family Heart 1990; Göteborg 1963; Göteborg 1970; Malmö 1969; Mankato 1982; OXCHECK 1989; WHO 1971), in five trials the risk was unclear (Ebeltoft 1992; Inter99 1999; Northumberland 1969; Salt Lake City 1972; Stockholm 1969) and in two trials the risk of reporting bias was high. In the Kaiser Permanente trial (Kaiser Permanente 1965), data on surgery, prescriptions, and reasons for hospitalisation were collected but not published. Also, results on new diagnoses were collected and reported in early publications but not for the planned study period. In the South‐East London Screening Study (South‐East London 1967), data on referrals, prescriptions, and investigations carried out were collected but not reported.
Other potential sources of bias
Four trials had a design that could favour the screening group (Göteborg 1963; Göteborg 1970; Malmö 1969; WHO 1971). In these trials, conditions identified at screening were treated and followed at a special clinic or by the researchers whereas the control group used their regular physicians.
Screening of the control group (contamination) would dilute both the beneficial and the harmful effects of the intervention. The number of participants in the control group having health checks was only assessed in two trials. In the Kaiser Permanente trial (Kaiser Permanente 1965), after 16 years, the mean number of health checks in the control group was 2.8 compared with 6.8 in the screening group. Only 36.2% of the control group had not had a health check compared to 15.7% of the screening group. However this result cannot be generalised to the other trials, or other populations, mainly because the participants were all members of the same health plan with access to the same high‐profiled multiphasic health screening. Also, screening has long been more popular in the US than in, for example, Europe. In the South‐East London Screening Study (South‐East London 1967) there was very little interest in screening among the participants in the control group, and none were screened for the first five years (Trevelyan 1973). However, the control group was offered screening after five years, which biased the nine‐year results towards no effect.
The British Family Heart Study (Family Heart 1990) used both an internal and an external control group in order to investigate contamination. They found similar results when comparing with either control group indicating that contamination was not a big problem. In the Ebeltoft Health Promotion Study (Ebeltoft 1992), which was set in a small town, the authors noted that the trial appeared to have a large positive influence on the health behaviours of the control group (Lauritzen 2012). Also, the control group was offered screening after five years while some data were collected for eight years. The Mankato trial (Mankato 1982) was conducted during a health promotion campaign, which may have diminished the effect of the intervention.
In summary, we found six trials with a low risk of contamination (Göteborg 1963; Göteborg 1970; Inter99 1999; Malmö 1969; Stockholm 1969; WHO 1971), four trials in which it was unclear (Family Heart 1990; Northumberland 1969; OXCHECK 1989; Salt Lake City 1972), and four trials with a high risk of contamination (Ebeltoft 1992; Kaiser Permanente 1965; Mankato 1982; South‐East London 1967). For the OXCHECK trial, we chose to combine all three intervention groups to achieve more power, accepting a loss of contrast. However, the results were similar when analysing the results for maximum contrast, that is only comparing those screened in year one with those in year four.
Two trials randomised only people who had returned an initial questionnaire on health and lifestyle (Ebeltoft 1992; OXCHECK 1989). This limited the external validity because of self‐selection of people with an interest in health and lifestyle (Pill 1988; Waller 1990).
Effects of interventions
Total mortality
Nine trials reported on total mortality. Seven had a low risk of selection bias (Ebeltoft 1992; Göteborg 1963; Göteborg 1970; Kaiser Permanente 1965; Malmö 1969; OXCHECK 1989; Stockholm 1969) and two had an unclear risk (South‐East London 1967; WHO 1971). The length of follow‐up was four (OXCHECK 1989), five (Malmö 1969), between five and six (WHO 1971), eight (Ebeltoft 1992), nine (South‐East London 1967), 11.8 (Göteborg 1970), 15 (Göteborg 1963), 16 (Kaiser Permanente 1965), and 22 years (Stockholm 1969). In total, the meta‐analysis included 155,899 persons and 11,940 deaths. The median event rate in the control group was 7% and the range was 2% to 16%. We did not find an effect of general health checks on total mortality in the pooled analysis, risk ratio (RR) of 0.99 (95% CI 0.95 to 1.03). There was no heterogeneity (I2 = 0%). Subgroup and sensitivity analyses did not alter the results.
Disease‐specific mortality
For cardiovascular mortality (152,435 persons, 4567 deaths), the pooled point estimate was 1.03 (95% CI 0.91 to 1.17) but with large heterogeneity (I2 = 64%). One possible explanation for the heterogeneity was the different definitions of the outcome among trials. For example, the WHO trial only reported mortality from coronary heart disease (WHO 1971) and the South‐East London Screening Study grouped mortality from stroke with mortality from diseases in the central nerveous system, which meant that we could not include it (South‐East London 1967). Another possible reason was unrecognised bias in the outcome assessment. One trial found a large reduction in cardiovascular mortality (Malmö 1969), RR of 0.42 (95% CI 0.23 to 0.77), while another found a large increase (South‐East London 1967), RR of 1.54 (95% CI 1.09 to 2.17). The Kaiser Permanente trial (Kaiser Permanente 1965) found a reduction in a pre‐specified composite of potentially postponable causes of death, which included colorectal cancer and hypertension related disorders. Ischaemic heart disease was not a part of the composite. Subgroup and sensitivity analyses did not alter the results, nor explain heterogeneity. The two trials at high risk of performance bias showed a harmful effect of the intervention, but we consider this a chance finding.
For cancer mortality (139,290 persons, 3663 deaths) the pooled point estimate was 1.01 (95% CI 0.92 to 1.12) with moderate heterogeneity (I2 = 33%). Subgroup and sensitivity analyses did not alter the results. The Göteborg 1970 trial (Göteborg 1970) found a reduction in cancer mortality, RR of 0.87 (95% CI 0.76 to 0.99). This was surprising since that trial only screened for cardiovascular risk. Furthermore, the intervention was not successful in reducing smoking. We believe that the result may be due to chance.
Morbidity
Few trials reported on well‐defined clinical events. The Göteborg 1970 trial (Göteborg 1970) did not find effects on non‐fatal coronary heart disease (CHD), RR of 1.03 (95% CI 0.92 to 1.14), non‐fatal stroke (RR 1.12, 95% CI 0.93 to 1.35), combined fatal and non‐fatal CHD (RR 0.99, 95% CI 0.91 to 1.07), or combined fatal and non‐fatal stroke (RR 1.01, 95% CI 0.86 to 1.20). The results from the WHO trial (WHO 1971) were suggestive of an effect on non‐fatal myocardial infarction (RR 0.85, 95% CI 0.72 to 1.01) and combined fatal and non‐fatal coronary heart disease (RR 0.90, 95% CI 0.80 to 1.01). The OXCHECK (OXCHECK 1989) authors supplied us with data on incident cancers. When pooling the three intervention groups and comparing with the control group the risk ratio was 1.12 (95% CI 0.85 to 1.48). When using only the group screened at year one, for maximum contrast, the risk ratio was 1.17 (95% CI 0.85 to 1.63).
Four other trials reported some measure of morbidity.
The Kaiser Permanente trial (Kaiser Permanente 1965) found that after seven years 61% of the intervention group reported having a chronic condition compared to 54% in the control group, and that this difference was statistically significant. The conditions were not defined and were likely to have included elevated risk factors like blood pressure or blood glucose.
The South‐East London Screening Study (South‐East London 1967) did not find effects on the prevalence of angina, ischaemic changes on electrocardiogram, or bronchitic symptoms after five years. For angina the prevalence was 21.9% (screening) and 22.4% (control group), for ischaemic changes 17.9% (screening) and 16.6% (control), and for bronchitic symptoms 29.0% (screening) and 30.6% (control). They also specified the reasons for hospitalisation, using broad categories such as cardiovascular causes, central nervous system causes, and neoplasms, but did not find differences.
The Malmö trial (Malmö 1969) reported reasons for hospitalisations in categories, for example ischaemic heart disease, cerebrovascular disease, and neoplasms, and did not find differences between groups. There was low power due to the stratification in to disease categories. See the results on total hospitalisation below.
The British Family Heart Study (Family Heart 1990) investigated the effect on the prevalence of four conditions. They found substantially more persons with self‐reported high blood pressure and high cholesterol in the screening group, slightly more men with self‐reported diabetes in the screening group, and no effect on self‐reported coronary heart disease. After one year, 6.9% of the control group men had high blood cholesterol compared to 14% of the screening group. For women the results were 3.8% (control) and 9.7% (screening). For high blood pressure, the results for the men were: 14.8% (control) and 17.1% (screening); and for the women: 13.0% (control) and 16.2% (screening). For diabetes, the results for the men were: 1.7% (control) and 3.3% (screening); and for the women: 1.1% (control) and 1.2% (screening). For coronary heart disease, the results for the men were: 5.5% (control) and 5.9% (screening); and for the women: 1.1% (control) and 1.9% (screening). The results were similar when the authors calculated the results within each practice and pooled results. The results were at risk of detection bias and attrition bias.
In summary, we did not find an effect of health checks on morbidity in terms of actual illness, but they may increase the number of people diagnosed with elevated risk factors, as expected.
New diagnoses
In addition to conditions identified through the screening itself, screening might increase diagnostic activity between scheduled screenings due to increased physician contact in relation to follow‐up visits or due to a lowered threshold for consulting a physician. Cumulative rates of new diagnoses over time in the screened and unscreened groups would allow an assessment of the full effect of screening on diagnostic activity. However, only one trial reported such results (Kaiser Permanente 1965), but only for the first six years. In a 40% sample, that trial found a sharp divergence in the mean annual number of new diagnoses per participant immediately after the intervention started, with the differences being statistically significant each year. By adding the results for each year we found a mean number of new diagnoses per participant of 4.3 in the screening group and 3.6 in the control group. This corresponded to a 20% increase. The trial lasted for 16 years but follow‐up for new diagnoses was not continued.
Four trials reported on the findings at the first screening of the intervention group but without comparisons with the control group over time. The South‐East London Screening Study (South‐East London 1967) found an average of 2,3 diseases per person at the first screening. Of these 53% were not previously known. The Ebeltoft trial (Ebeltoft 1992) reported the percentage of participants with abnormal findings prompting health advice at the inititial screening to be 76%. The most common reasons were raised CO concentration in expiratory air in smokers (37%), low physical endurance (30%), poor hearing (19%), poor sight (12%), and being overweight (16%). Increased cardiovascular risk was found in 11%, hypercholesterolaemia in 10%, hypertension in 10%, and elevated liver enzymes in 13%. The Salt Lake City Trial (Salt Lake City 1972) found a total of 2031 abnormalities in 384 people screened. This trial used very broad biochemical screening.
In summary, health checks were likely to increase the number of new diagnoses, but the outcome was poorly reported in most trials.
Admission to hospital
Five trials reported on hospitalisation using different measures, for example admission rates, number of people admitted once or more, or number of days in hospital.
The Kaiser Permanente trial (Kaiser Permanente 1965) reported the mean number of days in hospital over 18 years of follow‐up. The results were 10.00 days in the intervention group and 10.38 days in the control group (P = 0.13, Wilcoxon rank sum test reported in article). Roughly one third of participants had missing data for this outcome. The South‐East London Screening Study (South‐East London 1967) reported the number of participants admitted to hospital once or more during nine years of follow‐up, risk ratio of 1.04 (95% CI 0.96 to 1.13). The amount of missing data was unclear but was probably low for this outcome. The Malmö trial (Malmö 1969) also studied the number admitted once or more and found similar results, risk ratio of 1.05 (95% CI 0.92 to 1.20). There were 3% to 5% missing data. The Salt Lake City trial (Salt Lake City 1972) compared hospitalisation rates before and after the intervention and did not find an effect, but they did find an effect on the number of nights in hospital in one of three subgroups. The result was unreliable due to biased exclusions after randomisation. The Ebeltoft trial (Ebeltoft 1992) compared admission rates in the two intervention groups with the control group and did not find an effect after eight years, rate ratio of 0.91 (95% CI 0.63 to 1.32). They also compared the random sample invited to participate in the trial with all not invited and found similar results, rate ratio of 0.97 (95% CI 0.80 to 1.18). There were 5% missing data.
In summary, we did not find an effect on admission rates, number of people admitted once or more, or number of days in hospital.
Disability
Three trials investigated the effect on disability. The Kaiser Permanente trial (Kaiser Permanente 1965) found that after 16 years 31% of the screening group and 30% of the control group reported total or partial disability on a questionnaire. Attrition was roughly one third and response rates around 75%, which left only half of the people randomised in this analysis. The South‐East London Screening Study (South‐East London 1967) found that 2.5% in the screening group and 1.8% in the control group reported major disability after five years. There were between 40% and 50% missing data in this analysis. The Salt Lake City trial (Salt Lake City 1972) compared the number of disability days before and after the intervention and did not find an effect.
In summary, we did not find an effect on disability but the results were unreliable due to a high risk of attrition bias and reporting bias.
Worry
Only two trials reported relevant results, using scales measuring psychological distress.
The Ebeltoft trial (Ebeltoft 1992) used the General Health Questionnaire (GHQ‐12) at baseline and after one and five years. A decrease in score indicates a beneficial effect of the intervention. After one year, the change from baseline in the screening groups was an increase of 0.05 and in the control group a decrease of 0.16, P = 0.6. After five years, the screening group had a decrease of 0.23 and the control group had a decrease of 0.39, P = 0.73. They also investigated subgroups of smokers, overweight participants, people who were informed of an elevated risk and people informed of no elevated risk, and did not find effects. Participation was 79.2% after five years.
The South‐East London Screening Study (South‐East London 1967) used the Middlesex Hospital Questionnaire on a subset of participants after five years. In the anxiety domain of the scale, the authors found significantly lower scores in the intervention group among men (lower scores are better). When pooling men and women, we found a mean score of 4.14 (SD = 3.38, n = 602) in the intervention group and 4.48 (SD = 3.63, n = 572) in the control group, P = 0.097 (t‐test, equal variances). In the other domains assessed with this scale ('phobic', 'obsessional', 'somatic', 'depression', 'hysteria') there were no effects. Follow‐up was roughly 90%.
In summary, we did not find that screening caused or reduced worry, but only long‐term effects were investigated in the trials.
Self‐reported health
Four trials reported on self‐reported health.
The South‐East London Screening Study (South‐East London 1967) found that after five years 53.6% of the screening group and 56.5% of the control group reported good or excellent health in the preceeding two weeks (X2 = 3.274, P = 0.07).
The Ebeltoft trial (Ebeltoft 1992) used a five‐point scale at baseline and after five years. After five years, 69.9% and 71.6% of the two intervention groups reported good or excellent health compared to 71% of the control group. Data on change from baseline were only available in a graph. This showed that approximately 12% in the intervention groups had an improvement in self‐reported health compared to approximately 20% in the control group. Approximately 60% in the intervention groups had no change compared to approximately 52% in the control group. In all groups approximately 28% had worsened self‐reported health.
In the British Family Heart Study (Family Heart 1990) 79.5% of the screening group and 75.7% of the internal control group reported good or excellent health after one year. This analysis used last observation carried forward for missing data. The pooled difference, taking into account the 13 different practices, was 3.8% in favour of screening, P = 0.004.
The Inter99 trial (Inter99 1999) used SF‐12 and found significantly slower deterioration of both physical and mental health components in the intervention group. For mental health, the difference after five years was approximately 2 on a 100‐point scale, where 50 is the mean of a reference population and the standard deviation is set to 10. The effect was smaller for physical health but was difficult to assess because of baseline imbalances in scores. The authors found indications of biased non‐response.
In summary, two out of four trials found small beneficial effects on self‐reported health but they may be due to bias.
Referrals to specialists
Only one trial (Ebeltoft 1992) reported on this outcome, but the results could not be used in our analysis. This was because the authors only had data from 1995 to 1999 but the screening took place in 1992 to 1993 (intervention groups screened) and 1997 (intervention groups and control group screened). This means that the expected increase in referrals following the intervention was not included in the analysis, and that any contrast between groups would be diminished by the 1997 screening. The authors made two comparisons and did not find effects in either analysis. When comparing the screening and control groups, the rate ratio was 1.04 (95% CI 0.85 to 1.26). When comparing the random sample invited to participate in the trial versus all eligible people not invited, the rate ratio was 0.94 (95% CI 0.84 to 1.06).
Number of non‐scheduled visits to general practitioners
Five trials reported on physician visits. The length of follow‐up was between one and nine years, with missing outcome data ranging between 5% (Ebeltoft 1992) and 51% (Salt Lake City 1972).
The Kaiser Permanente trial (Kaiser Permanente 1965) found a mean number of physician visits of 16.0 in both groups after five years, not including the screenings themselves. The results were reported without measures of uncertainty and data on this outcome were collected from a 20% subsample, which reduces power.
The South‐East London Screening Study (South‐East London 1967) did not find an effect on the mean annual number of physician visits. It was not clear whether the screening visits were included in this, and we cannot tell whether the results were from the five‐year or nine‐year follow‐up. Participants who left the study before one year were excluded from the analyses (14% from the screening group and 13% from the control group).
The Northumberland trial (Northumberland 1969) found an average number of consultations per participant of 5.4 in the screening group and 5.0 in the control group over 1½ years. This did not include the screenings themselves. When adding the screenings the results were 6.3 in the screening group and 5.0 in the control group. The type of health check was not specified, and there was a high risk of detection bias.
The Salt Lake City trial (Salt Lake City 1972) did not find effects after one year, but this result was unreliable. The screening visits were not included in the analysis.
The Ebeltoft trial (Ebeltoft 1992) found an increased rate of physician visits after five years in the screening plus health discussion group compared to the control group, rate ratio of 1.15 (95% CI 1.02 to 1.31) but not in the screening only group compared to controls, rate ratio of 1.01 (95% CI 0.89 to 1.15). When comparing all those invited to participate in the trial with all not invited, the rate ratio was 1.01 (95% CI 0.93 to 1.10). However, this comparison included data from 1992 to 1999 and thus included the screening of the control group in 1997, diluting any differences between groups. The authors found a significant downwards trend in the rate ratio over time favouring the intervention, but in the absence of an overall effect this is not a relevant observation. It likely reflects the initial increase in visits generated by the screenings themselves, which gave a high starting point for the trend analysis. Similarly, the 1997 screening of the control group would be expected to cause an increase in physician visits in the control group, further contributing to the downward trend.
In summary, we did not find an effect on physician visits. Most trials did not include the screening visits in the analysis.
Number of additional diagnostic procedures required because of positive screening tests
None of the trials reported on this outcome.
The Kaiser Permanente trial (Kaiser Permanente 1965) reported the mean number of laboratory tests per participant after five and 10 years, based on a 20% sample. After five years it was 23.8 in the screening group and 23.3 in the control group. The data after 10 years were not reported but it was stated in a narrative that there was no difference. The number of laboratory tests did not include the tests used at screening.
Prescriptions and surgery
None of the trials reported the total number of prescriptions, new drugs prescribed, or the number of operations performed. This is unfortunate since these are important factors for balancing the benefits and harms of health checks, and for estimating the costs.
Five trials provided some results of relevance.
The Göteborg 1970 trial (Göteborg 1970) examined random samples of the intervention group and control group 1 and found that after 10 years of follow‐up 26.0% of the intervention group used antihypertensive medications compared to 19.6% in the control group (Chi2 = 16.41, P < 0.0001, our calculation). The Kaiser Permanente trial (Kaiser Permanente 1965) reported in a narrative that prescription rates gathered from pharmacies showed a non‐significant trend towards increased prescription in the screening group, but only data from years six and seven were analysed. The Ebeltoft trial (Ebeltoft 1992) presented data on self‐reported use of selected types of drugs after five years. In the screening groups, 4.8% reported using blood pressure medication compared to 6.8% in the control group (X2 = 1.42, P = 0.23, our calculation). For diuretics, the figures were 3.7% (screening) and 3.9% (control group), and for heart medication they were 0.9% (screening) and 1.0% (control). The British Family Heart Study (Family Heart 1990) reported in a narrative that there was no difference between the intervention and control groups regarding use of drugs to lower blood pressure or cholesterol, or for diabetes. The Mankato trial (Mankato 1982) reported that the proportion of participants on blood pressure medication after one year was 13.8% in the intervention group and 9.8% in the control group (P < 0.05).
In summary, we cannot make firm conclusions on total drug use. Two out of four trials found increased use of antihypertensive medication, but there was a high risk of bias in all the results. None of the trials studied the amount of surgery used.
Absence from work
Two trials reported on absence from work (Kaiser Permanente 1965; South‐East London 1967). Neither trial found an effect, and neither trial reported the exact results but only mentioned their findings in a narrative.
Subgroup and sensitivity analyses
We planned and performed several subgroup and sensitivity analyses. Some of the resulting subgroups were based on very few trials but are presented for completeness. They should be interpreted with caution. We found no convincing patterns in any subgroup or sensitivity analysis.
For outcomes not included in the meta‐analyses we considered the same factors. We were not able to discern any patterns except that the more recent trials often had a strong focus on lifestyle interventions, often had changes in risk factors as their primary outcomes, and were designed accordingly (shorter follow‐up) (Ebeltoft 1992; Family Heart 1990; Mankato 1982; OXCHECK 1989).
Discussion
Summary of main results
We did not find an effect of general health checks on total or cause‐specific mortality. For total mortality our confidence interval includes a 5% reduction and a 3% increase, both of which would be clinically relevant. However, for the causes of death most likely to be influenced by health checks, cardiovascular and cancer‐specific mortality, there were no reductions either. A substantial latency of effects on mortality would be expected but we included several trials with very long follow‐up. Our results suggest that the lack of an effect on total mortality is not a chance finding, nor due to low power, but that there may in fact be no or only a minimal effect of the intervention on mortality in general non‐geriatric populations.
We did not find an effect on morbidity, hospitalisations, disability, visits to the physician, number of referrals, or absence from work. We found indications of an increase in the number of new diagnoses as well as descriptions of large numbers of abnormal findings at the initial screenings. We also found indications of increased use of antihypertensive drugs, but this outcome was poorly studied. We did not find an effect on measures of psychological distress but this was also sporadically reported and only for long‐term effects. Two out of four trials found a possible small improvement in self‐reported health but this may have been due to bias. None of the trials studied the number of follow‐up tests after positive screening results, nor the amount of surgery resulting from the intervention.
In general, the outcomes expected to reflect beneficial effects of the intervention were better studied and reported than the harmful effects. We expected the number of new diagnoses and initiated treatments to be reported since these are important elements of screening, but this was rarely the case. Only one trial reported the number of new diagnoses in the two groups, and only for the first six years although the intervention was continued for 16 years (Kaiser Permanente 1965). Drug use was only assessed for selected drugs and was mainly self‐reported, with a risk of attrition bias and detection bias because the screening groups could not be blinded. We also expected the number of follow‐up tests and referrals to specialists to be reported since they also reflect the burden placed by screening upon the participants and the healthcare system. However, these outcomes were rarely reported. Without knowing the amount of 'downstream' investigations following screening, it is not possible to evaluate the harms or costs. This has been long recognised for screening interventions in general (Raffle & Gray 2007).
Increased diagnostic and therapeutic activity would be expected if general health checks led to improved health, at least in the short term, as this is the main mechanism of the intervention. However, more diagnoses and more treatment in the absence of health improvements would indicate overdiagnosis and overtreatment. Overdiagnosis is the diagnosis of conditions which were not destined to cause symptoms or affect the longevity of the patient if they had not been detected at screening, and is an inherent risk in any screening programme. Overdiagnosis leads to overtreatment and perhaps increased anxiety and undesirable effects on peoples' image of their own health. These harms have been documented in cancer screening and are also obvious harms in screening for cardiovascular risk factors, as reflected in the large numbers needed to treat in primary prevention of cardiovascular disease (Welch, Schwartz and Woloshin 2011).
The psychological consequences of general health checks were investigated to a somewhat greater extent, although only in a minority of trials. An interesting result is that we did not find harmful effects on measures of psychological distress, self‐reported health, or absence from work. Two trials found beneficial effects on self‐reported health, but the effects were small and could be due to bias. One systematic review (Boulware 2007) found beneficial effects of periodic health evaluations on worry in one trial of elderly people (Patrick 1999), and a systematic review of coronary heart disease risk scores found no harmful effects in two fair quality studies (Sheridan 2008). Regarding hypertension, cross‐sectional studies have found that people diagnosed with hypertension had poorer self‐reported health regardless of whether they were correctly diagnosed or not (Barger 2006; Bloom 1981). However, a review of cohort studies found mixed effects on absenteeism and fair quality evidence that screening for hypertension does not cause adverse psychological effects (Sheridan 2003). One review found short‐term adverse psychological effects from predicting a person's risk of illness, but no long‐term effects (Shaw 1999). Similarly, a review of trials of any kind of screening found no long‐term effect on anxiety, depression, or quality of life, but the reviewers were not able to make conclusions about short‐term effects (Collins 2011). None of the trials we reviewed reported on short‐term adverse psychological effects.
The lack of measurable effects indicates that general health checks did not work as intended in the included trials. Below, we explore possible reasons for the apparent lack of effect as well as challenges in generalising the results to the present day.
Bias
Three trials in our mortality meta‐analyses were biased towards no effect (Ebeltoft 1992; Kaiser Permanente 1965; South‐East London 1967), and in one trial we prioritised power over contrast in the merging of intervention groups (OXCHECK 1989). In a post hoc sensitivity analysis, removing these trials from the analyses did not change the results and only marginally expanded the confidence intervals.
Type of health check
Many of the older trials investigated very broad screening regimens, with a large potential for detecting abnormalitites. Healthy people frequently harbour pathology that can be discovered by examination, imaging (Furtado 2005; Xiong 2005), or biopsy (Welch 2004), but this is not necessarily beneficial and it may be harmful (Welch, Schwartz and Woloshin 2011). The results from the Kaiser Permanente trial (Kaiser Permanente 1965) suggested that it was as they found increases in mortality due to lymphohaematopoietic cancers and suicide. This may be a random finding but the pattern appeared after seven years and continued thoughout the full 16 years of the trial. The increase in available diagnostic tests might lead to more invasive follow‐up procedures today and more drug treatment and surgery, for example for prostate and thyroid cancer, with resulting harms. Today, no authorities recommend health checks as broad as studied in some of the older trials but they are still common, particularly among commercial providers (Grønhøj Larsen 2012). In contrast, the recently introduced National Health Service (NHS) Health Check in the UK is focused on cardiovascular risk and diabetes, with fewer tests.
Most of the trials that reported on mortality did not have an explicit lifestyle intervention component, but we do not expect this element to be particularly important. Multiple risk factor interventions directed at general populations for the primary prevention of coronary heart disease have been extensively studied and found to be without effect on total and coronary heart disease‐specific mortality, or the number of cardiovascular events (Ebrahim 2011). One of the trials in our review included a randomised comparison between screening with and without scheduled face‐to‐face lifestyle conversations, but found no effect (Ebeltoft 1992).
Developments in therapy
Developments in preventive drug therapy might produce a different effect on cardiovascular outcomes today compared to when the identified trials were performed. For example, use of statins and angiotensin converting enzyme inhibitors instead of harmful drugs such as clofibrate (WHO 1984) and reserpine (Healy 2004) is likely to provide a considerable improvement. However, we cannot be certain that developments in drug treatments are always beneficial to patients because some modern drugs may have serious side effects that are not known at present. For example, the diabetes drug rosiglitazone was on the market for 10 years before being withdrawn because it causes serious heart disease (Lehman 2010; Nissen 2010), and tiotropium mist inhalers for chronic obstructive pulmonary disease have recently been shown to increase mortality (Singh 2011). Also, poor trial reporting of harms from commonly used preventive drugs, such as statins (Taylor 2011), may mean that adverse effects are more common and more serious than we think (Golomb 2012).
Thresholds for treating cardiovascular risk factors and diabetes are lower today than at the time most of the included trials were conducted. This has lead to increased prescription of preventive drugs with demonstrated efficacy, for example statins (Taylor 2011) and antihypertensives (Wright 2009). However, the balance between benefits and harms may be unfavourable when the absolute risks are low, such as in a screened population, or when used in more heterogeneous populations with more co‐morbidities. For example, the populations used for testing antihypertensive drugs were usually younger and had less co‐morbidity than the typical patient in general practice (Uijen 2007). Thus, we cannot know whether results would be better today. Morbidity and mortality results from the Inter99 trial (Inter99 1999) will inform about the effect of health checks in a modern setting.
Therapy for identified disease has improved in many areas and this might lead to better effects of health checks over time. However, in the meta‐analyses arranged by year of trial start there are no visible time trends (Analysis 1.1; Analysis 1.14; Analysis 1.27), and the idea of increasing benefits over time therefore remains hypothetical.
Self‐selection
People who accept an invitation to a health check are often different from those who do not. They tend to have higher socioeconomic status (Pill 1988), lower cardiovascular risk (Waller 1990), less cardiovascular morbidity (Jørgensen 2003), and lower mortality (Göteborg 1970). Thus, systematic health checks may not reach those who need prevention the most, and they have been called 'another example of inverse care' (Waller 1990).
Clinically motivated testing
Another possible reason for the lack of beneficial effects is that many physicians already carry out screening for cardiovascular risk factors or diseases in patients that they judge to be at high risk when they see them for other reasons. This is often considered an integral part of primary care practice. Clinically motivated testing may already have resulted in the identification of many people at high risk thus eroding the potential for a benefit from systematic screening.
Potential biases in the review process
In the meta‐analyses, we ignored clustering by family in two trials (OXCHECK 1989; South‐East London 1967) and by factory in the analysis of cancer mortality from the WHO trial (WHO 1971). In a pre‐specified sensitivity analysis, excluding cluster randomised trials resulted in very little change to the results.
We attempted to contact authors and succeeded in 10 cases (Ebeltoft 1992; Göteborg 1963; Göteborg 1970; Inter99 1999; Malmö 1969; Mankato 1982; OXCHECK 1989; South‐East London 1967; Stockholm 1969; WHO 1971). We often had questions about trial methods but, since most trials were quite old, there is a risk that some answers may have been inaccurate.
Agreements and disagreements with other studies or reviews
The existing systematic review of health checks included observational studies and geriatric studies but used a different definition of the intervention and included fewer trials (Boulware 2006; Boulware 2007). The trials reviewed by us are largely different but the results are broadly in line for the overlapping outcomes of total mortality, hospitalisation, disability, and the number of new diagnoses (disease detection). For worry, the previous review found one trial which showed a beneficial effect whereas we found two trials without an effect on this outcome.
We did not include geriatric trials because they included interventions other than screening for disease and risk factors, and lifestyle interventions. A systematic review of 89 trials of complex interventions to improve physical function and maintain independent living in elderly people found beneficial effects on the risk of not living at home, nursing home admission, falls, hospital admissions, and physical function, but not mortality (Beswick 2008). In the subgroup of 28 trials of geriatric assessments for elderly people representing the general population, the results were similar except no effect on hospitalisation was found. Thus, the results were similar to ours except on outcomes of special relevance to older people, where important benefits were found.
Risk of bias summary: review authors' judgements about each risk of bias item for each included study.

Comparison 1 Health checks versus control, Outcome 1 Total mortality.
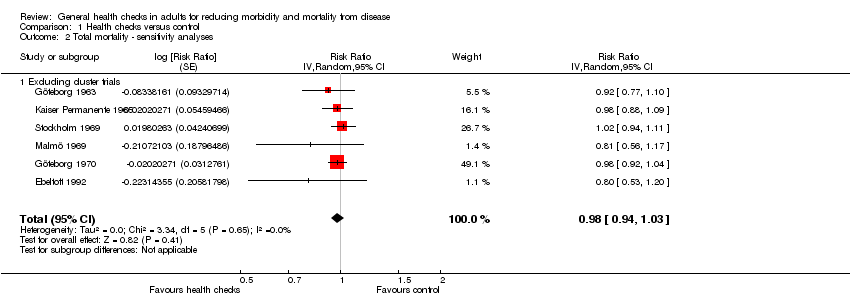
Comparison 1 Health checks versus control, Outcome 2 Total mortality ‐ sensitivity analyses.

Comparison 1 Health checks versus control, Outcome 3 Total mortality ‐ no. of health checks.

Comparison 1 Health checks versus control, Outcome 4 Total mortality ‐ lifestyle intervention.

Comparison 1 Health checks versus control, Outcome 5 Total mortality ‐ length of follow‐up.

Comparison 1 Health checks versus control, Outcome 6 Total mortality ‐ age of trial.

Comparison 1 Health checks versus control, Outcome 7 Total mortality ‐ geographical location.

Comparison 1 Health checks versus control, Outcome 8 Total mortality ‐ examination by physician.

Comparison 1 Health checks versus control, Outcome 9 Total mortality ‐ selection bias.

Comparison 1 Health checks versus control, Outcome 10 Total mortality ‐ performance bias.

Comparison 1 Health checks versus control, Outcome 11 Total mortality ‐ detection bias.

Comparison 1 Health checks versus control, Outcome 12 Total mortality ‐ incomplete outcome data.

Comparison 1 Health checks versus control, Outcome 13 Total mortality ‐ contamination.

Comparison 1 Health checks versus control, Outcome 14 Cardiovascular mortality.

Comparison 1 Health checks versus control, Outcome 15 Cardiovascular mortality ‐ sensitivity analyses.

Comparison 1 Health checks versus control, Outcome 16 Cardiovascular mortality ‐ no. of health checks.

Comparison 1 Health checks versus control, Outcome 17 Cardiovascular mortality lifestyle intervention.

Comparison 1 Health checks versus control, Outcome 18 Cardiovascular mortality ‐ length of follow‐up.

Comparison 1 Health checks versus control, Outcome 19 Cardiovascular mortality ‐ age of trial.

Comparison 1 Health checks versus control, Outcome 20 Cardiovascular mortality ‐ geographical location.

Comparison 1 Health checks versus control, Outcome 21 Cardiovascular mortality ‐ examination by physician.
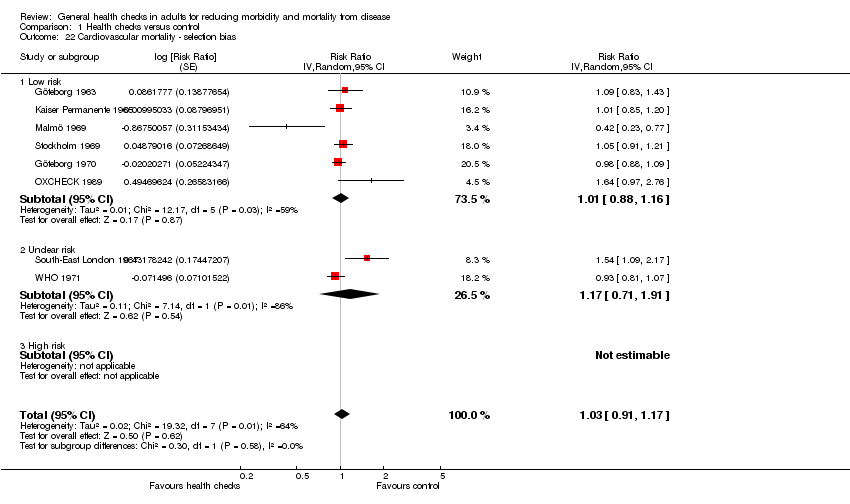
Comparison 1 Health checks versus control, Outcome 22 Cardiovascular mortality ‐ selection bias.

Comparison 1 Health checks versus control, Outcome 23 Cardiovascular mortality ‐ performance bias.

Comparison 1 Health checks versus control, Outcome 24 Cardiovascular mortality ‐ detection bias.

Comparison 1 Health checks versus control, Outcome 25 Cardiovascular mortality ‐ incomplete outcome data.

Comparison 1 Health checks versus control, Outcome 26 Cardiovascular mortality ‐ contamination.

Comparison 1 Health checks versus control, Outcome 27 Cancer mortality.

Comparison 1 Health checks versus control, Outcome 28 Cancer mortality ‐ sensitivity analyses.

Comparison 1 Health checks versus control, Outcome 29 Cancer mortality ‐ no. of health checks.

Comparison 1 Health checks versus control, Outcome 30 Cancer mortality lifestyle intervention.
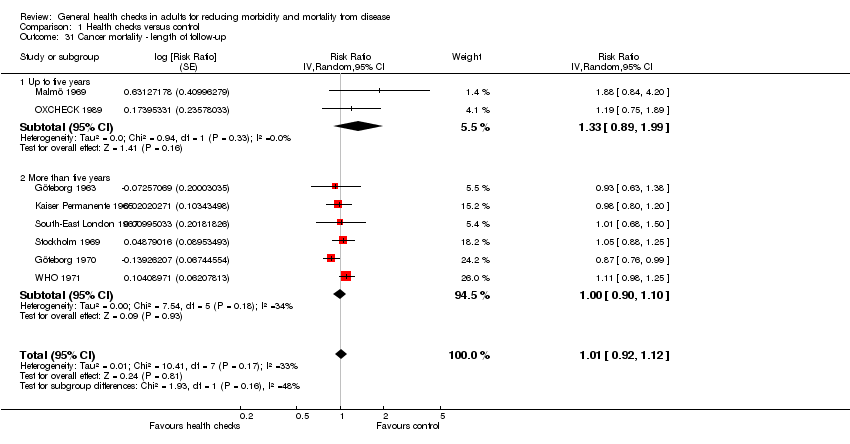
Comparison 1 Health checks versus control, Outcome 31 Cancer mortality ‐ length of follow‐up.

Comparison 1 Health checks versus control, Outcome 32 Cancer mortality ‐ age of trial.

Comparison 1 Health checks versus control, Outcome 33 Cancer mortality ‐ geographical location.

Comparison 1 Health checks versus control, Outcome 34 Cancer mortality ‐ examination by physician.

Comparison 1 Health checks versus control, Outcome 35 Cancer mortality ‐ selection bias.

Comparison 1 Health checks versus control, Outcome 36 Cancer mortality ‐ performance bias.

Comparison 1 Health checks versus control, Outcome 37 Cancer mortality ‐ detection bias.

Comparison 1 Health checks versus control, Outcome 38 Cancer mortality ‐ incomplete outcome data.

Comparison 1 Health checks versus control, Outcome 39 Cancer mortality ‐ contamination.
| Outcomes | Illustrative comparative risks* (95% CI) | Relative effect | No of participants | Quality of the evidence | Comments | |
| Assumed risk | Corresponding risk with intervention | |||||
| Total mortality | RR 0.99 | 155,899 | ⊕⊕⊕⊕ | |||
| 75 per 1000 | 74 per 1000 | |||||
| Cardiovascular mortality | RR 1.03 | 152,435 | ⊕⊕⊕⊝ | There was substantial heterogeneity which may reflect the different outcome definitions used in the trials. | ||
| 37 per 1000 | 38 per 1000 | |||||
| Cancer mortality | RR 1.01 | 139,290 | ⊕⊕⊕⊕ | |||
| 21 per 1000 | 21 per 1000 | |||||
| *The assumed risk is the median control group risk across studies. The corresponding risk (and its 95% confidence interval) is based on the assumed risk in the comparison group and the relative effect of the intervention (and its 95% CI). | ||||||
| GRADE Working Group grades of evidence | ||||||
| Blood pressure | Cholesterol | Height and weight | Risk score | Electrocardiogram | Biochemistry panel | History | Spirometry | Urine analyses | Diabetes | Clinical examination | Vision and/or hearing | Cancer screening | |
| Göteborg 1963 | x | x | x | x | x | current symptoms, personal and family history |
| x | fasting blood sugar | x | x | chest X‐ray | |
| Kaiser Permanente 1965 | x | probably | x | x | x | current symptoms, personal and family history | x | x | x | x | chest X‐ray, mammography, pelvic exam, sigmoidoscopy | ||
| South‐East London 1967 | x | probably | x | x | x | current symptoms, personal history | x | x | x | chest X‐ray, faecal occult blood | |||
| Malmö 1969 | x | x | x | x | haematocrit, triglycerides, cholesterol | interview and questionnaire, not specified | x | x | x | chest X‐ray | |||
| Northumberland 1969 | ? | ? | ? | ? | ? | ? | current symptoms | ? | ? | ? | ? | ? | ? |
| Stockholm 1969 | x | probably | x | x | current symptoms, personal history | x | x | ||||||
| Göteborg 1970 | x | x | x | x | family history | ||||||||
| WHO 1971 | x | x | x |
| current symptoms |
| |||||||
| Salt Lake City 1972 | x | x | x | x | x | x | x | chest X‐ray, mammography, cervical smear | |||||
| Mankato 1982 | x | x | x | ||||||||||
| OXCHECK 1989 | x | x | x | personal and family history | |||||||||
| Family Heart 1990 | x | x | x | Dundee | personal and family history |
| random capillary glucose | ||||||
| Ebeltoft 1992 | x | x | x | Anggaard | x | x | x | x | non‐fasting blood glucose | x | |||
| Inter99 1999 | x | x | x | PRECARD | x | x | oral glucose tolerance test | ||||||
| Not all screening tests used are shown; see Characteristics of included studies for full details. The Kaiser Permanente 1965, South‐East London 1967, and Stockholm 1969 trials did not specify the contents of their biochemical screening. It seems unlikely that cholesterol was not included. | |||||||||||||
| Outcome or subgroup title | No. of studies | No. of participants | Statistical method | Effect size |
| 1 Total mortality Show forest plot | 9 | Risk Ratio (Random, 95% CI) | 0.99 [0.95, 1.03] | |
| 2 Total mortality ‐ sensitivity analyses Show forest plot | 6 | Risk Ratio (Random, 95% CI) | 0.98 [0.94, 1.03] | |
| 2.1 Excluding cluster trials | 6 | Risk Ratio (Random, 95% CI) | 0.98 [0.94, 1.03] | |
| 3 Total mortality ‐ no. of health checks Show forest plot | 9 | Risk Ratio (Random, 95% CI) | 0.99 [0.96, 1.03] | |
| 3.1 One health check | 3 | Risk Ratio (Random, 95% CI) | 1.00 [0.94, 1.06] | |
| 3.2 More than one health check | 6 | Risk Ratio (Random, 95% CI) | 0.99 [0.93, 1.05] | |
| 4 Total mortality ‐ lifestyle intervention Show forest plot | 9 | Risk Ratio (Random, 95% CI) | 0.99 [0.96, 1.03] | |
| 4.1 Major lifestyle intervention | 4 | Risk Ratio (Random, 95% CI) | 0.99 [0.93, 1.06] | |
| 4.2 No major lifestyle intervention | 5 | Risk Ratio (Random, 95% CI) | 1.00 [0.94, 1.06] | |
| 5 Total mortality ‐ length of follow‐up Show forest plot | 9 | Risk Ratio (Random, 95% CI) | 0.99 [0.96, 1.03] | |
| 5.1 Up to five years | 2 | Risk Ratio (Random, 95% CI) | 1.03 [0.66, 1.60] | |
| 5.2 More than 5 years | 7 | Risk Ratio (Random, 95% CI) | 0.99 [0.95, 1.03] | |
| 6 Total mortality ‐ age of trial Show forest plot | 9 | Risk Ratio (Random, 95% CI) | 0.99 [0.96, 1.03] | |
| 6.1 Trial started before 1980 | 7 | Risk Ratio (Random, 95% CI) | 0.99 [0.95, 1.03] | |
| 6.2 Trial started after 1980 | 2 | Risk Ratio (Random, 95% CI) | 1.03 [0.66, 1.62] | |
| 7 Total mortality ‐ geographical location Show forest plot | 9 | Risk Ratio (Random, 95% CI) | 0.99 [0.96, 1.03] | |
| 7.1 USA | 1 | Risk Ratio (Random, 95% CI) | 0.98 [0.88, 1.09] | |
| 7.2 Europe | 8 | Risk Ratio (Random, 95% CI) | 0.99 [0.95, 1.03] | |
| 8 Total mortality ‐ examination by physician Show forest plot | 9 | Risk Ratio (Random, 95% CI) | 0.99 [0.96, 1.03] | |
| 8.1 Examination by physician | 5 | Risk Ratio (Random, 95% CI) | 1.00 [0.94, 1.06] | |
| 8.2 No examination by physician | 4 | Risk Ratio (Random, 95% CI) | 0.99 [0.93, 1.06] | |
| 9 Total mortality ‐ selection bias Show forest plot | 9 | Risk Ratio (Random, 95% CI) | 0.99 [0.96, 1.03] | |
| 9.1 low risk of selection bias | 7 | Risk Ratio (Random, 95% CI) | 0.99 [0.94, 1.03] | |
| 9.2 Unclear risk of selection bias | 2 | Risk Ratio (Random, 95% CI) | 1.00 [0.93, 1.08] | |
| 9.3 High risk of selection bias | 0 | Risk Ratio (Random, 95% CI) | 0.0 [0.0, 0.0] | |
| 10 Total mortality ‐ performance bias Show forest plot | 9 | Risk Ratio (Random, 95% CI) | 0.99 [0.96, 1.03] | |
| 10.1 low risk | 5 | Risk Ratio (Random, 95% CI) | 0.98 [0.94, 1.02] | |
| 10.2 Unclear risk | 1 | Risk Ratio (Random, 95% CI) | 1.02 [0.94, 1.11] | |
| 10.3 High risk | 3 | Risk Ratio (Random, 95% CI) | 1.08 [0.87, 1.33] | |
| 11 Total mortality ‐ detection bias Show forest plot | 9 | Risk Ratio (Random, 95% CI) | 0.99 [0.96, 1.03] | |
| 11.1 Low risk | 6 | Risk Ratio (Random, 95% CI) | 0.99 [0.94, 1.04] | |
| 11.2 Unclear risk | 2 | Risk Ratio (Random, 95% CI) | 1.00 [0.93, 1.08] | |
| 11.3 High risk | 1 | Risk Ratio (Random, 95% CI) | 0.92 [0.77, 1.10] | |
| 12 Total mortality ‐ incomplete outcome data Show forest plot | 9 | Risk Ratio (Random, 95% CI) | 0.99 [0.96, 1.03] | |
| 12.1 Low risk | 8 | Risk Ratio (Random, 95% CI) | 0.99 [0.95, 1.03] | |
| 12.2 Unclear risk | 1 | Risk Ratio (Random, 95% CI) | 0.98 [0.88, 1.09] | |
| 12.3 High risk | 0 | Risk Ratio (Random, 95% CI) | 0.0 [0.0, 0.0] | |
| 13 Total mortality ‐ contamination Show forest plot | 9 | Risk Ratio (Random, 95% CI) | 0.99 [0.96, 1.03] | |
| 13.1 Low risk | 5 | Risk Ratio (Random, 95% CI) | 0.99 [0.95, 1.03] | |
| 13.2 Unclear risk | 1 | Risk Ratio (Random, 95% CI) | 1.27 [0.95, 1.70] | |
| 13.3 High risk | 3 | Risk Ratio (Random, 95% CI) | 0.99 [0.90, 1.10] | |
| 14 Cardiovascular mortality Show forest plot | 8 | Risk Ratio (Random, 95% CI) | 1.03 [0.91, 1.17] | |
| 15 Cardiovascular mortality ‐ sensitivity analyses Show forest plot | 5 | Risk Ratio (Random, 95% CI) | 0.99 [0.87, 1.12] | |
| 15.1 Excluding cluster trials | 5 | Risk Ratio (Random, 95% CI) | 0.99 [0.87, 1.12] | |
| 16 Cardiovascular mortality ‐ no. of health checks Show forest plot | 8 | Risk Ratio (Random, 95% CI) | 1.03 [0.91, 1.17] | |
| 16.1 Only one health check | 3 | Risk Ratio (Random, 95% CI) | 0.89 [0.69, 1.14] | |
| 16.2 More than one health check | 5 | Risk Ratio (Random, 95% CI) | 1.11 [0.95, 1.30] | |
| 17 Cardiovascular mortality lifestyle intervention Show forest plot | 8 | Risk Ratio (Random, 95% CI) | 1.03 [0.91, 1.17] | |
| 17.1 Major lifestyle intervention | 3 | Risk Ratio (Random, 95% CI) | 0.99 [0.86, 1.15] | |
| 17.2 No major lifestyle intervention | 5 | Risk Ratio (Random, 95% CI) | 1.03 [0.84, 1.27] | |
| 18 Cardiovascular mortality ‐ length of follow‐up Show forest plot | 8 | Risk Ratio (Random, 95% CI) | 1.03 [0.91, 1.17] | |
| 18.1 Up to five years | 2 | Risk Ratio (Random, 95% CI) | 0.84 [0.22, 3.18] | |
| 18.2 More than five years | 6 | Risk Ratio (Random, 95% CI) | 1.02 [0.94, 1.12] | |
| 19 Cardiovascular mortality ‐ age of trial Show forest plot | 8 | Risk Ratio (Random, 95% CI) | 1.03 [0.91, 1.17] | |
| 19.1 Trial started before 1980 | 7 | Risk Ratio (Random, 95% CI) | 1.01 [0.90, 1.13] | |
| 19.2 Trial started after 1980 | 1 | Risk Ratio (Random, 95% CI) | 1.64 [0.97, 2.76] | |
| 20 Cardiovascular mortality ‐ geographical location Show forest plot | 8 | Risk Ratio (Random, 95% CI) | 1.03 [0.91, 1.17] | |
| 20.1 Europe | 7 | Risk Ratio (Random, 95% CI) | 1.04 [0.90, 1.20] | |
| 20.2 USA | 1 | Risk Ratio (Random, 95% CI) | 1.01 [0.85, 1.20] | |
| 21 Cardiovascular mortality ‐ examination by physician Show forest plot | 8 | Risk Ratio (Random, 95% CI) | 1.03 [0.91, 1.17] | |
| 21.1 Examination by physician | 5 | Risk Ratio (Random, 95% CI) | 1.03 [0.84, 1.27] | |
| 21.2 No examination by physician | 3 | Risk Ratio (Random, 95% CI) | 0.99 [0.86, 1.15] | |
| 22 Cardiovascular mortality ‐ selection bias Show forest plot | 8 | Risk Ratio (Random, 95% CI) | 1.03 [0.91, 1.17] | |
| 22.1 Low risk | 6 | Risk Ratio (Random, 95% CI) | 1.01 [0.88, 1.16] | |
| 22.2 Unclear risk | 2 | Risk Ratio (Random, 95% CI) | 1.17 [0.71, 1.91] | |
| 22.3 High risk | 0 | Risk Ratio (Random, 95% CI) | 0.0 [0.0, 0.0] | |
| 23 Cardiovascular mortality ‐ performance bias Show forest plot | 8 | Risk Ratio (Random, 95% CI) | 1.03 [0.91, 1.17] | |
| 23.1 Low risk | 5 | Risk Ratio (Random, 95% CI) | 0.96 [0.85, 1.08] | |
| 23.2 Unclear risk | 1 | Risk Ratio (Random, 95% CI) | 1.05 [0.91, 1.21] | |
| 23.3 High risk | 2 | Risk Ratio (Random, 95% CI) | 1.57 [1.18, 2.09] | |
| 24 Cardiovascular mortality ‐ detection bias Show forest plot | 8 | Risk Ratio (Random, 95% CI) | 1.03 [0.91, 1.17] | |
| 24.1 Low risk | 5 | Risk Ratio (Random, 95% CI) | 1.00 [0.85, 1.17] | |
| 24.2 Unclear risk | 2 | Risk Ratio (Random, 95% CI) | 1.17 [0.71, 1.91] | |
| 24.3 High risk | 1 | Risk Ratio (Random, 95% CI) | 1.09 [0.83, 1.43] | |
| 25 Cardiovascular mortality ‐ incomplete outcome data Show forest plot | 8 | Risk Ratio (Random, 95% CI) | 1.03 [0.91, 1.17] | |
| 25.1 Low risk | 7 | Risk Ratio (Random, 95% CI) | 1.04 [0.90, 1.20] | |
| 25.2 Unclear risk | 1 | Risk Ratio (Random, 95% CI) | 1.01 [0.85, 1.20] | |
| 25.3 High risk | 0 | Risk Ratio (Random, 95% CI) | 0.0 [0.0, 0.0] | |
| 26 Cardiovascular mortality ‐ contamination Show forest plot | 8 | Risk Ratio (Random, 95% CI) | 1.03 [0.91, 1.17] | |
| 26.1 Low risk | 5 | Risk Ratio (Random, 95% CI) | 0.97 [0.86, 1.09] | |
| 26.2 Unclear risk | 1 | Risk Ratio (Random, 95% CI) | 1.64 [0.97, 2.76] | |
| 26.3 High risk | 2 | Risk Ratio (Random, 95% CI) | 1.21 [0.81, 1.83] | |
| 27 Cancer mortality Show forest plot | 8 | Risk Ratio (Random, 95% CI) | 1.01 [0.92, 1.12] | |
| 28 Cancer mortality ‐ sensitivity analyses Show forest plot | 5 | Risk Ratio (Random, 95% CI) | 0.97 [0.85, 1.09] | |
| 28.1 Excluding cluster trials | 5 | Risk Ratio (Random, 95% CI) | 0.97 [0.85, 1.09] | |
| 29 Cancer mortality ‐ no. of health checks Show forest plot | 8 | Risk Ratio (Random, 95% CI) | 1.01 [0.92, 1.12] | |
| 29.1 Only one health check | 3 | Risk Ratio (Random, 95% CI) | 1.10 [1.00, 1.21] | |
| 29.2 More than one health check | 5 | Risk Ratio (Random, 95% CI) | 0.92 [0.83, 1.02] | |
| 30 Cancer mortality lifestyle intervention Show forest plot | 8 | Risk Ratio (Random, 95% CI) | 1.01 [0.92, 1.12] | |
| 30.1 Major lifestyle intervention | 3 | Risk Ratio (Random, 95% CI) | 1.01 [0.82, 1.24] | |
| 30.2 No major lifestyle intervention | 5 | Risk Ratio (Random, 95% CI) | 1.02 [0.91, 1.15] | |
| 31 Cancer mortality ‐ length of follow‐up Show forest plot | 8 | Risk Ratio (Random, 95% CI) | 1.01 [0.92, 1.12] | |
| 31.1 Up to five years | 2 | Risk Ratio (Random, 95% CI) | 1.33 [0.89, 1.99] | |
| 31.2 More than five years | 6 | Risk Ratio (Random, 95% CI) | 1.00 [0.90, 1.10] | |
| 32 Cancer mortality ‐ age of trial Show forest plot | 8 | Risk Ratio (Random, 95% CI) | 1.01 [0.92, 1.12] | |
| 32.1 Trial started before 1980 | 7 | Risk Ratio (Random, 95% CI) | 1.01 [0.91, 1.12] | |
| 32.2 Trial started after 1980 | 1 | Risk Ratio (Random, 95% CI) | 1.19 [0.75, 1.89] | |
| 33 Cancer mortality ‐ geographical location Show forest plot | 8 | Risk Ratio (Random, 95% CI) | 1.01 [0.92, 1.12] | |
| 33.1 Europe | 7 | Risk Ratio (Random, 95% CI) | 1.02 [0.91, 1.15] | |
| 33.2 USA | 1 | Risk Ratio (Random, 95% CI) | 0.98 [0.80, 1.20] | |
| 34 Cancer mortality ‐ examination by physician Show forest plot | 8 | Risk Ratio (Random, 95% CI) | 1.01 [0.92, 1.12] | |
| 34.1 Examination by physician | 5 | Risk Ratio (Random, 95% CI) | 1.02 [0.91, 1.15] | |
| 34.2 No examination by physician | 3 | Risk Ratio (Random, 95% CI) | 1.01 [0.82, 1.24] | |
| 35 Cancer mortality ‐ selection bias Show forest plot | 8 | Risk Ratio (Random, 95% CI) | 1.01 [0.92, 1.12] | |
| 35.1 Low risk | 6 | Risk Ratio (Random, 95% CI) | 0.98 [0.87, 1.10] | |
| 35.2 Unclear risk | 2 | Risk Ratio (Random, 95% CI) | 1.10 [0.98, 1.24] | |
| 35.3 High risk | 0 | Risk Ratio (Random, 95% CI) | 0.0 [0.0, 0.0] | |
| 36 Cancer mortality ‐ performance bias Show forest plot | 8 | Risk Ratio (Random, 95% CI) | 1.01 [0.92, 1.12] | |
| 36.1 Low risk | 5 | Risk Ratio (Random, 95% CI) | 1.00 [0.86, 1.16] | |
| 36.2 Unclear risk | 1 | Risk Ratio (Random, 95% CI) | 1.05 [0.88, 1.25] | |
| 36.3 High risk | 2 | Risk Ratio (Random, 95% CI) | 1.08 [0.80, 1.46] | |
| 37 Cancer mortality ‐ detection bias Show forest plot | 8 | Risk Ratio (Random, 95% CI) | 1.01 [0.92, 1.12] | |
| 37.1 Low risk | 5 | Risk Ratio (Random, 95% CI) | 0.99 [0.86, 1.13] | |
| 37.2 Unclear risk | 2 | Risk Ratio (Random, 95% CI) | 1.10 [0.98, 1.24] | |
| 37.3 High risk | 1 | Risk Ratio (Random, 95% CI) | 0.93 [0.63, 1.38] | |
| 38 Cancer mortality ‐ incomplete outcome data Show forest plot | 8 | Risk Ratio (Random, 95% CI) | 1.01 [0.92, 1.12] | |
| 38.1 Low risk | 6 | Risk Ratio (Random, 95% CI) | 0.98 [0.86, 1.12] | |
| 38.2 Unclear risk | 2 | Risk Ratio (Random, 95% CI) | 1.07 [0.96, 1.20] | |
| 38.3 High risk | 0 | Risk Ratio (Random, 95% CI) | 0.0 [0.0, 0.0] | |
| 39 Cancer mortality ‐ contamination Show forest plot | 8 | Risk Ratio (Random, 95% CI) | 1.01 [0.92, 1.12] | |
| 39.1 Low risk | 5 | Risk Ratio (Random, 95% CI) | 1.01 [0.88, 1.17] | |
| 39.2 Unclear risk | 1 | Risk Ratio (Random, 95% CI) | 1.19 [0.75, 1.89] | |
| 39.3 High risk | 2 | Risk Ratio (Random, 95% CI) | 0.99 [0.82, 1.18] | |