Anthracycline‐containing regimens for treatment of follicular lymphoma in adults
Appendices
Appendix 1. PubMed search strategy
Part I AND part II AND part III
Part I:
((indolent OR follicular OR nodular OR follicle‐cell OR centroblastic OR centrocytic OR ((zentroblast* or zentrocytic*) and lymphom*) OR follicle‐center OR low‐grade OR Brill‐ symmer) AND lymphoma*) OR Lymphoma, Follicular [Mesh]
Part II:
Doxorubicin [Mesh] OR AD mycin OR adriacin OR adriamycin OR adriablastina OR adriablastine OR adriablastin OR adrimedac OR adrim OR adrosal OR axibin OR biorrub OR biorubina OR candria OR dobixin OR daxotel OR dicladox OR dox‐sl OR doxsl OR doxobin OR doxo‐cell OR doxolem OR doxomed OR doxotec OR doxotil OR farmiblastina OR fauldoxo OR ifadox OR myocet OR neoxane OR onkodox OR oxocina OR pallagicin OR rastocin OR ribodoxo OR rubex OR rubidox OR doxil OR caelyx OR Doxocris OR Doxokebir OR Doxonolver OR Doxopeg OR Doxorbin OR Doxtie OR Flavicina OR Lipo‐dox nagun OR Oncodox OR Oncodria OR Onkostatil OR Ranxas OR Rubinat OR Ribodoxo OR Roxorin OR Serodox OR Roxodox OR Tevadox OR Varidoxo OR daunorubicin [MeSH] OR Daunoblastine OR Daunobin OR Daunomycin OR Rubomycin OR Rubidomycin OR daunoxome OR cerubidine OR cerubidin OR daunoblastina OR daunoblastin OR daunocin OR oncodaunotec OR rubilem OR idarubicin [MeSH] OR Desmethoxydaunorubicin OR Demethoxydaunorubicin OR DMDR IDA OR imi‐30 OR imi30 OR nsc‐256439 OR nsc256439 OR idamycin OR idaralem OR zavedos OR epirubicin [MeSH] OR anthracin OR bioepicyna OR ciazil OR ellence OR epi‐cell OR epilem OR epi‐NC OR epirub OR E.P.Mycin OR farmorrubicina OR farmorubicina OR farmorubicine OR farmorubicin megarubicin OR nuovodox OR pharmorubicin OR riboepi OR rubina OR tecnomax OR Epi‐DXR OR Epi‐cell OR Epicell OR Epi‐ADR OR Epiadriamycin OR Axirubine OR Bendaepi OR imi‐28 OR imi28 OR nsc‐256942 OR nsc256942 OR mitoxantrone [MeSH] OR domitrone OR ebexantron OR elsep OR formyxan OR genefadrone OR haemato‐tron OR misostol OR mitaxis OR mitoxal OR mitoxan OR mitoxgen OR mitroxene OR mitroxone OR neotalem OR neoxantron OR norexan OR novantrone OR Mitozantrone OR Novatron OR Onkotrone OR Parlifan OR Ralenova OR anthracyclin* OR anthracenedione
Part III:
| #1 #2 #3 #4 #5 #6 #7 #8 #9 #10 #11 | randomized controlled trial [pt] controlled clinical trial [pt] randomized [tiab] placebo [tiab] drug therapy [sh] randomly [tiab] trial [tiab] groups [tiab] #1 OR #2 OR #3 OR #4 OR #5 OR #6 OR #7 OR #8 animals [mh] NOT humans [mh] #9 NOT #10 |
Appendix 2. CENTRAL search strategy
Part I AND part II
Part I:
((indolent OR follicular OR nodular OR follicle‐cell OR centroblastic OR centrocytic OR ((zentroblast* or zentrocytic*) and lymphom*) OR follicle‐center OR low‐grade OR Brill‐ symmer) AND lymphoma*) OR Lymphoma, Follicular [Mesh]
Part II:
Doxorubicin [Mesh] OR AD mycin OR adriacin OR adriamycin OR adriablastina OR adriablastine OR adriablastin OR adrimedac OR adrim OR adrosal OR axibin OR biorrub OR biorubina OR candria OR dobixin OR daxotel OR dicladox OR dox‐sl OR doxsl OR doxobin OR doxo‐cell OR doxolem OR doxomed OR doxotec OR doxotil OR farmiblastina OR fauldoxo OR ifadox OR myocet OR neoxane OR onkodox OR oxocina OR pallagicin OR rastocin OR ribodoxo OR rubex OR rubidox OR doxil OR caelyx OR Doxocris OR Doxokebir OR Doxonolver OR Doxopeg OR Doxorbin OR Doxtie OR Flavicina OR Lipo‐dox nagun OR Oncodox OR Oncodria OR Onkostatil OR Ranxas OR Rubinat OR Ribodoxo OR Roxorin OR Serodox OR Roxodox OR Tevadox OR Varidoxo OR daunorubicin [MeSH] OR Daunoblastine OR Daunobin OR Daunomycin OR Rubomycin OR Rubidomycin OR daunoxome OR cerubidine OR cerubidin OR daunoblastina OR daunoblastin OR daunocin OR oncodaunotec OR rubilem OR idarubicin [MeSH] OR Desmethoxydaunorubicin OR Demethoxydaunorubicin OR DMDR IDA OR imi‐30 OR imi30 OR nsc‐256439 OR nsc256439 OR idamycin OR idaralem OR zavedos OR epirubicin [MeSH] OR anthracin OR bioepicyna OR ciazil OR ellence OR epi‐cell OR epilem OR epi‐NC OR epirub OR E.P.Mycin OR farmorrubicina OR farmorubicina OR farmorubicine OR farmorubicin megarubicin OR nuovodox OR pharmorubicin OR riboepi OR rubina OR tecnomax OR Epi‐DXR OR Epi‐cell OR Epicell OR Epi‐ADR OR Epiadriamycin OR Axirubine OR Bendaepi OR imi‐28 OR imi28 OR nsc‐256942 OR nsc256942 OR mitoxantrone [MeSH] OR domitrone OR ebexantron OR elsep OR formyxan OR genefadrone OR haemato‐tron OR misostol OR mitaxis OR mitoxal OR mitoxan OR mitoxgen OR mitroxene OR mitroxone OR neotalem OR neoxantron OR norexan OR novantrone OR Mitozantrone OR Novatron OR Onkotrone OR Parlifan OR Ralenova OR anthracyclin* OR anthracenedione

Study flow diagram.
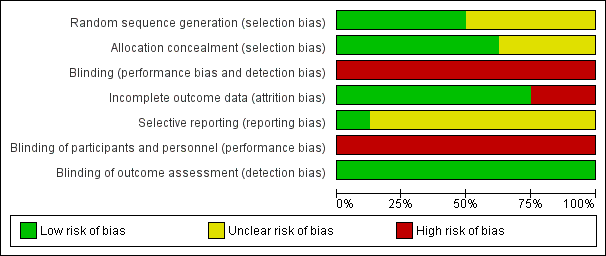
Risk of bias graph: review authors' judgments about each risk of bias item presented as percentages across all included studies.
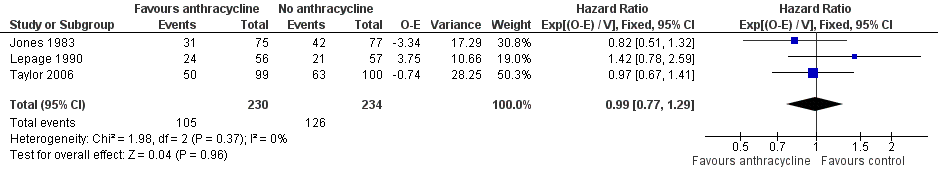
Forest plot of comparison: 1 Anthracycline versus no anthracycline same chemotherapy, outcome: 1.1 Overall survival.

Forest plot of comparison: 1 Anthracycline versus no anthracycline same chemotherapy, outcome: 1.3 Mortality at 3 years.

Forest plot of comparison: 1 Anthracycline versus no anthracycline same chemotherapy, outcome: 1.5 Complete response.

Forest plot of comparison: 1 Anthracycline versus no anthracycline same chemotherapy, outcome: 1.7 Disease control.
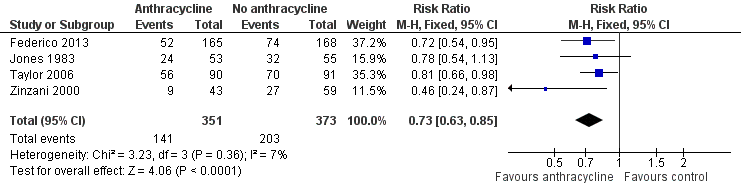
Forest plot of comparison: 1 Anthracycline versus no anthracycline same chemotherapy, outcome: 1.8 Progression or relapse at 3 years.
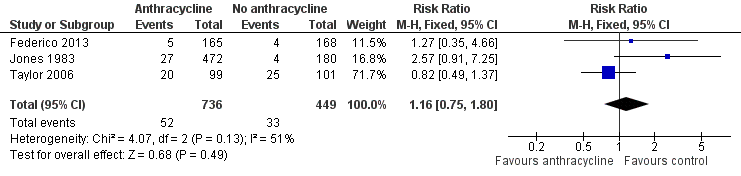
Forest plot of comparison: 1 Anthracycline versus no anthracycline same chemotherapy, outcome: 1.10 Infection.

Forest plot of comparison: 4 Comparison of different anthracyclines, outcome: 4.2 Disease control.

Comparison 1 Anthracycline versus no anthracycline same chemotherapy, Outcome 1 Overall survival.

Comparison 1 Anthracycline versus no anthracycline same chemotherapy, Outcome 2 Overall survival with Zinzani.
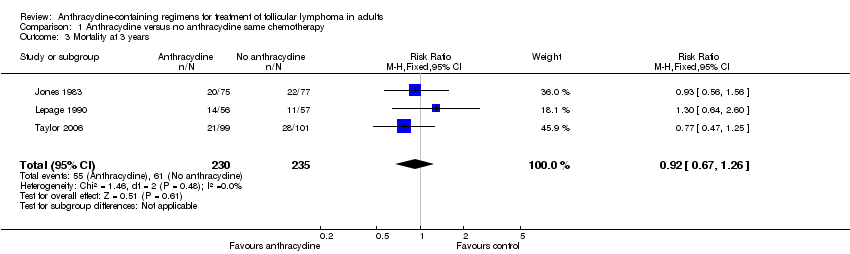
Comparison 1 Anthracycline versus no anthracycline same chemotherapy, Outcome 3 Mortality at 3 years.
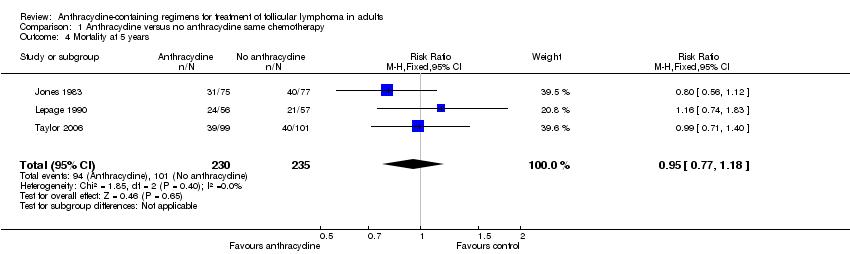
Comparison 1 Anthracycline versus no anthracycline same chemotherapy, Outcome 4 Mortality at 5 years.
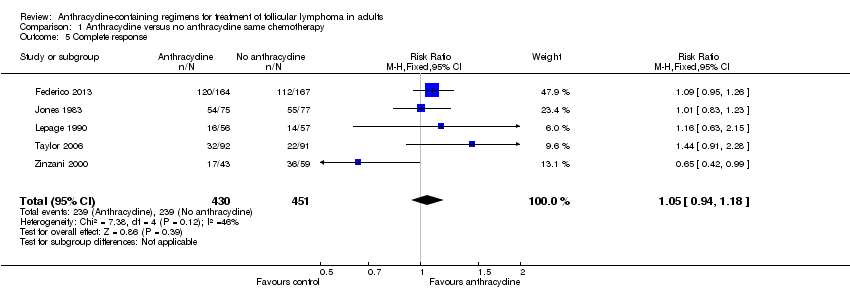
Comparison 1 Anthracycline versus no anthracycline same chemotherapy, Outcome 5 Complete response.

Comparison 1 Anthracycline versus no anthracycline same chemotherapy, Outcome 6 Overall response.
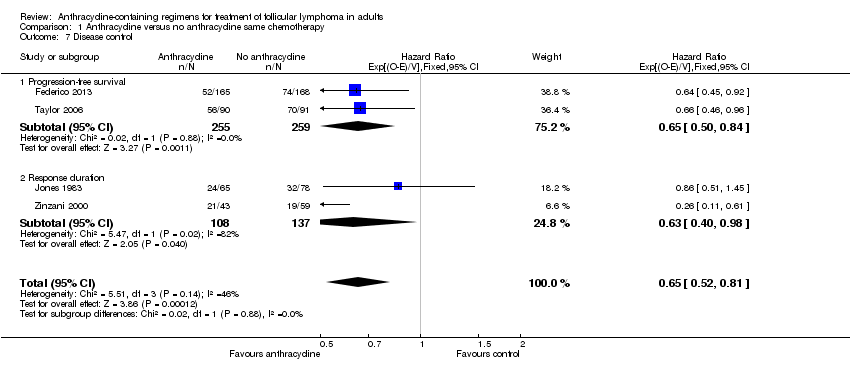
Comparison 1 Anthracycline versus no anthracycline same chemotherapy, Outcome 7 Disease control.

Comparison 1 Anthracycline versus no anthracycline same chemotherapy, Outcome 8 Progression/relapse at 3 years.
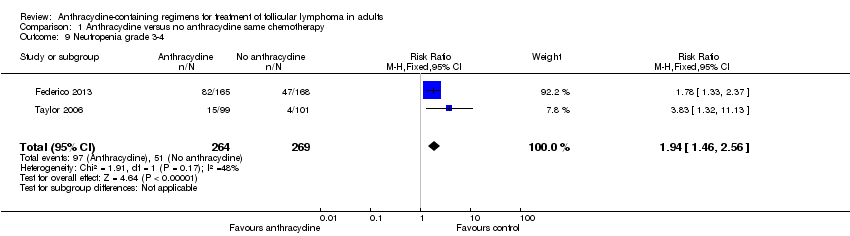
Comparison 1 Anthracycline versus no anthracycline same chemotherapy, Outcome 9 Neutropenia grade 3‐4.
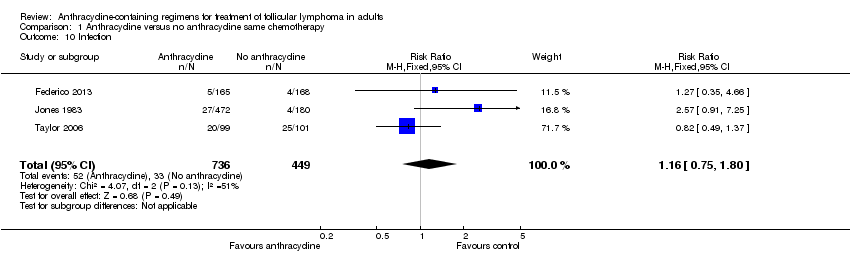
Comparison 1 Anthracycline versus no anthracycline same chemotherapy, Outcome 10 Infection.

Comparison 2 Sensitivity analysis for allocation concealment, Outcome 1 Overall survival.

Comparison 2 Sensitivity analysis for allocation concealment, Outcome 2 Disease control.

Comparison 3 Sensitivity analysis for second randomization, Outcome 1 Disease control.
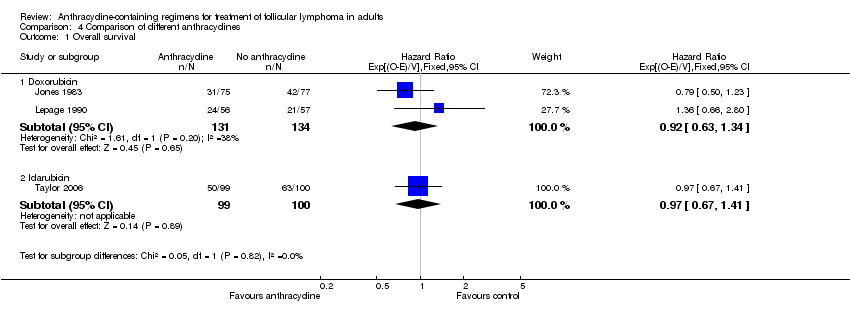
Comparison 4 Comparison of different anthracyclines, Outcome 1 Overall survival.

Comparison 4 Comparison of different anthracyclines, Outcome 2 Disease control.
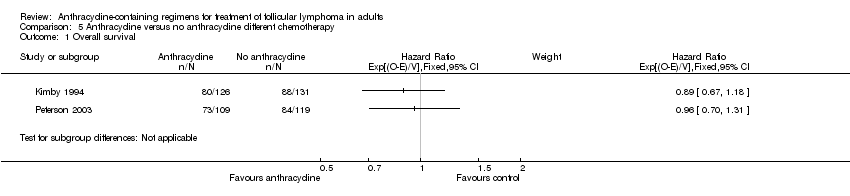
Comparison 5 Anthracycline versus no anthracycline different chemotherapy, Outcome 1 Overall survival.

Comparison 5 Anthracycline versus no anthracycline different chemotherapy, Outcome 2 Mortality at 3 years.
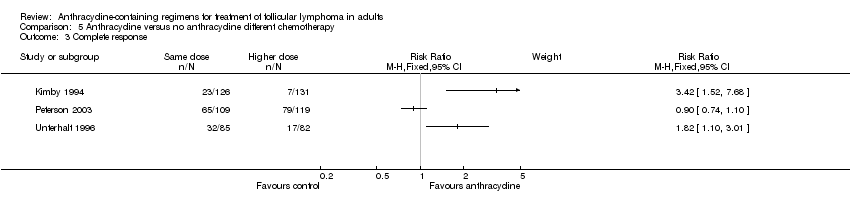
Comparison 5 Anthracycline versus no anthracycline different chemotherapy, Outcome 3 Complete response.
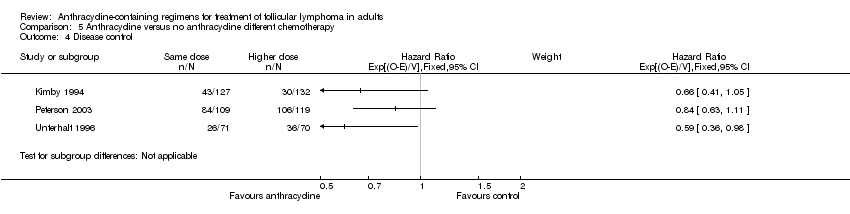
Comparison 5 Anthracycline versus no anthracycline different chemotherapy, Outcome 4 Disease control.
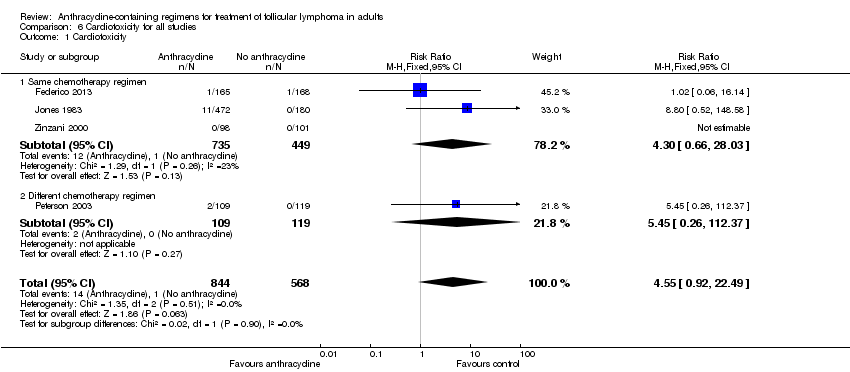
Comparison 6 Cardiotoxicity for all studies, Outcome 1 Cardiotoxicity.
| ACR compared to non‐ACR for treatment of follicular lymphoma in adults | ||||||
| Patient or population: adults receiving treatment for follicular lymphoma | ||||||
| Outcomes | Illustrative comparative risks* (95% CI) | Relative effect | No of participants | Quality of the evidence | Comments | |
| Assumed risk | Corresponding risk | |||||
| No anthracycline same chemotherapy | Anthracycline | |||||
| Overall survival | 538 per 1000 | 535 per 1000 | HR 0.99 | 464 | ⊕⊕⊕⊝ | |
| Mortality at 3 years | 260 per 1000 | 239 per 1000 | RR 0.92 | 465 | ⊕⊕⊕⊝ | |
| Overall response | 839 per 1000 | 889 per 1000 | RR 1.06 | 622 | ⊕⊕⊕⊝ | |
| Disease control | 492 per 1000 | 356 per 1000 | HR 0.65 | 759 | ⊕⊕⊕⊕ | |
| Progression/relapse at 3 years | 544 per 1000 | 397 per 1000 | RR 0.73 | 724 | ⊕⊕⊕⊕ | |
| Neutropenia grade 3‐4 | 190 per 1000 | 368 per 1000 | RR 1.94 | 533 | ⊕⊝⊝⊝ | |
| Cardiotoxicity** | 2 per 1000 | 8 per 1000 | RR 4.55 | 1412 | ⊕⊝⊝⊝ | |
| *The basis for the assumed risk (e.g. the median control group risk across studies) is provided in footnotes. The corresponding risk (and its 95% CI) is based on the assumed risk in the comparison group and the relative effect of the intervention (and its 95% CI). **Includes all trials, irrespectively of the comparison ("same chemotherapy"; "different chemotherapy"). | ||||||
| GRADE Working Group grades of evidence | ||||||
| 1 Small number of events | ||||||
| Author | Randomized | Analyzed | FL analyzed | FL grade | Data specific for FL |
| Federico 2013 | 534 | 504 | 504 (333)* | 1, 2, 3a | For all outcomes |
| Jones 1983 | 652 | 497 | 226 (146)* | 1, 2, 3 | For all outcomes |
| Lepage 1990 | 113 | 113 | 101 | 1, 2 | For some outcomes |
| Taylor 2006 | 200 | 183 | 155 | Low grade | No |
| Zinzani 2000 | 208 | 199 | 102 | Indolent | For some outcomes |
| Kimby 1994 | 259 | 259 | 76 | 1, 2 | For some outcomes |
| Peterson 2003 | 228 | 228 | 189 | 1, 2 | For all outcomes |
| Unterhalt 1996 | 442 | 206 | 167 | 1, 2 | For some outcomes |
| Total | 2636 | 2189 | 1520 | ||
| * number of FL patients analyzed in 2 (of 3) arms compared | |||||
| Author | Publication status | Same/different intervention | Anthracycline | Control arm | Experimental arm |
| Federico 2013 | Full text | Same | Doxorubicin | R‐CVP | R‐CHOP |
| Jones 1983 | Full text | Same* | Doxorubicin | CVP‐B | CHOP‐B |
| Lepage 1990 | Full text | Same | Doxorubicin | PCOP | PACOP |
| Taylor 2006 | Full text | Same | Idarubicin | ChD | ChID |
| Zinzani 2000 | Full text | Same* | Idarubicin | F | FI |
| Kimby 1994 | Full text | Different | Doxorubicin | Ch‐D | CHOP |
| Peterson 2003 | Full text | Different | Doxorubicin | C | CHOP |
| Unterhalt 1996 | Full text | Different | Mitoxantrone | CVP | PmM |
| * trials with higher non‐anthracycline dose in control‐arm | |||||
| Author | Control arm | Experimental arm |
| Federico 2013 | d 1 rituximab 375 mg/m2, d 1 cyclophosphamide 750 mg/m2 IV, d 1 vincristine 1.4 mg/m2 (max 2 mg) IV, d 1‐5 prednisone 40 mg/m2 PO, 8 cycles, every 21 d [Note: more treatment cycles] | d 1 rituximab 375 mg/m2, d 1 cyclophosphamide 750 mg/m2 IV, d 1 doxorubicin 50 mg/m2 IV, d 1 vincristine 1.4 mg/m2 (max 2 mg) IV, d 1‐5 prednisone 100 mg/d PO 6 cycles, every 21 d. Added 2 cycles of rituximab every 21 d |
| Jones 1983 | d 1‐14 cyclophosphamide 125 mg/m2 PO, d 1, 8 vincristine 1.4 mg/m2 IV (max 2 mg/dose), d 1‐5 prednisone 100 mg/d PO, d 1, 8 bleomycin 4 mg/m2 IV. 8 cycles, every 21 d [Note: different route of administration for cyclophosphamide; total doses differ for all drugs; cycles are more frequent] | d 1 cyclophosphamide 750 mg/m2 IV, d 1 doxorubicin 50 mg/m2 IV, d 1 vincristine 1.4 mg/m2 (max 2 mg) IV, d 1‐5 prednisone 100 mg/d PO, d 1 bleomycin 4 mg/m2 IV. 8 cycles, every 28 d |
| Lepage 1990 | d 1, 8 cyclophosphamide 400 mg/m2 IV, d 1, 8 vincristine 1.4 mg/m2 , d 1, 14 procarbazine 80 mg/m2 PO, d 1‐5 prednisone 60 mg/m2 PO. 6 cycles, every 28 d | same + d 1, 8 doxorubicin 20 mg/m2 IV |
| Taylor 2006 | d 1‐3 chlorambucil 20 mg/m2/d, d 1‐5 dexamethasone 4 mg bd. 6 cycles, every 21 d | same + d 1‐3 idarubicin 10 mg/m2/d |
| Zinzani 2000 | d 1‐5 fludarabine 25 mg/m2/d IV. 6 cycles, every 28 d | d 1‐3 fludarabine 25 mg/m2/d IV, d 1‐3, d 1 idarubicin 12 mg/m2 6 cycles, every 28 d |
| Kimby 1994 | d 1 chlorambucil 0.4 mg/kg PO, d 1‐3 prednisone 75 mg PO every 14 d, for 4‐8 months | d 1 cyclophosphamide 750 mg/m2 IV, d 1 doxorubicin 50 mg/m2 IV, d 1 vincristine 2 mg/m2 IV, d 1‐5 prednisone 50 mg/m2 PO 4‐8 cycles every 28 d |
| Peterson 2003 | d 1 cyclophosphamide 750 mg/m2 IV, d 1 doxorubicin 50 mg/m2 IV, d 1 vincristine 1.4 mg/m2 (max 2 mg) IV, d 1‐5 prednisone 60 mg/m2 PO, d 1 bleomycin 10 u/m2 IM every 21 d until complete response and then every 28 d up to 2 years, bleomycin up to 6 cycles | 100 mg/m2/d PO until 2 years from maximal response |
| Unterhalt 1996 | d 1‐5 cyclophosphamide 400 mg/m2/d IV, d 1 vincristine 1.4 mg/m2 (max 2 mg) IV, d 1‐5 prednisone 100 mg/m2/d PO 4‐6 induction cycles every 21 d | d 1‐5 prednimustine 100 mg/m2/d PO, d 1‐2 mitoxantrone 8 mg/m2/d IV. 4‐6 induction cycles every 28 d |
| d: day; IM: intramuscular; IV: intravenous; PO: oral | ||
| OS | Mortality at 3 years | Mortality at 10 years | CR | ORR | Disease control | Progression or relapse | |
| Kimby 1994 | 0.89 (0.67 to 1.18) | 0.87 (0.63 to 1.18) | NR | 3.42 (1.52 to 7.68) | 1.70 (1.30 to 2.23) | 0.66 (0.41 to 1.05) | 0.90 (0.67 to 1.20) |
| Peterson 2003 | 0.96 (0.70 to 1.31) | 1.15 (0.66 to 2.00) | 0.95 (0.74to 1.23) | 0.90 (0.74 to 1.10) | 1.04 (0.96 to 1.13) | 0.84 (0.63 to 1.11) | 1.03 (0.82 to 1.28) |
| Unterhalt 1996 | NR | NR | NR | 1.82 (1.10 to 3.01) | 1.02 (0.89 to 1.17) | 0.59 (0.36 to 0.98) | NR |
| CR: complete response; NR: not reported; ORR: overall response rate; OS: overall survival | |||||||
| Outcome or subgroup title | No. of studies | No. of participants | Statistical method | Effect size |
| 1 Overall survival Show forest plot | 3 | 464 | Hazard Ratio (95% CI) | 0.99 [0.77, 1.29] |
| 2 Overall survival with Zinzani Show forest plot | 4 | 663 | Hazard Ratio (95% CI) | 0.97 [0.76, 1.23] |
| 3 Mortality at 3 years Show forest plot | 3 | 465 | Risk Ratio (M‐H, Fixed, 95% CI) | 0.92 [0.67, 1.26] |
| 4 Mortality at 5 years Show forest plot | 3 | 465 | Risk Ratio (M‐H, Fixed, 95% CI) | 0.95 [0.77, 1.18] |
| 5 Complete response Show forest plot | 5 | 881 | Risk Ratio (M‐H, Fixed, 95% CI) | 1.05 [0.94, 1.18] |
| 6 Overall response Show forest plot | 3 | 616 | Risk Ratio (M‐H, Fixed, 95% CI) | 1.06 [1.00, 1.12] |
| 7 Disease control Show forest plot | 4 | 759 | Hazard Ratio (95% CI) | 0.65 [0.52, 0.81] |
| 7.1 Progression‐free survival | 2 | 514 | Hazard Ratio (95% CI) | 0.65 [0.50, 0.84] |
| 7.2 Response duration | 2 | 245 | Hazard Ratio (95% CI) | 0.63 [0.40, 0.98] |
| 8 Progression/relapse at 3 years Show forest plot | 4 | 724 | Risk Ratio (M‐H, Fixed, 95% CI) | 0.73 [0.63, 0.85] |
| 9 Neutropenia grade 3‐4 Show forest plot | 2 | 533 | Risk Ratio (M‐H, Fixed, 95% CI) | 1.94 [1.46, 2.56] |
| 10 Infection Show forest plot | 3 | 1185 | Risk Ratio (M‐H, Fixed, 95% CI) | 1.16 [0.75, 1.80] |
| Outcome or subgroup title | No. of studies | No. of participants | Statistical method | Effect size |
| 1 Overall survival Show forest plot | 3 | Hazard Ratio (95% CI) | Subtotals only | |
| 1.1 Adequate allocation concealment | 2 | 265 | Hazard Ratio (95% CI) | 0.92 [0.63, 1.34] |
| 1.2 Unclear allocation concealment | 1 | 199 | Hazard Ratio (95% CI) | 0.97 [0.67, 1.41] |
| 2 Disease control Show forest plot | 4 | Hazard Ratio (95% CI) | Subtotals only | |
| 2.1 Adequate allocation concealment | 2 | 476 | Hazard Ratio (95% CI) | 0.70 [0.52, 0.95] |
| 2.2 Unclear allocation concealment | 2 | 283 | Hazard Ratio (95% CI) | 0.58 [0.41, 0.81] |
| Outcome or subgroup title | No. of studies | No. of participants | Statistical method | Effect size |
| 1 Disease control Show forest plot | 4 | Hazard Ratio (95% CI) | Subtotals only | |
| 1.1 Second randomization | 2 | 324 | Hazard Ratio (95% CI) | 0.72 [0.54, 0.98] |
| 1.2 No second randomization | 2 | 435 | Hazard Ratio (95% CI) | 0.56 [0.40, 0.78] |
| Outcome or subgroup title | No. of studies | No. of participants | Statistical method | Effect size |
| 1 Overall survival Show forest plot | 3 | Hazard Ratio (95% CI) | Subtotals only | |
| 1.1 Doxorubicin | 2 | 265 | Hazard Ratio (95% CI) | 0.92 [0.63, 1.34] |
| 1.2 Idarubicin | 1 | 199 | Hazard Ratio (95% CI) | 0.97 [0.67, 1.41] |
| 2 Disease control Show forest plot | 4 | Hazard Ratio (95% CI) | Subtotals only | |
| 2.1 Doxorubicin | 2 | 476 | Hazard Ratio (95% CI) | 0.70 [0.52, 0.95] |
| 2.2 Idarubicin | 2 | 283 | Hazard Ratio (95% CI) | 0.58 [0.41, 0.81] |
| Outcome or subgroup title | No. of studies | No. of participants | Statistical method | Effect size |
| 1 Overall survival Show forest plot | 2 | Hazard Ratio (95% CI) | Subtotals only | |
| 2 Mortality at 3 years Show forest plot | 2 | Risk Ratio (M‐H, Fixed, 95% CI) | Subtotals only | |
| 3 Complete response Show forest plot | 3 | Risk Ratio (M‐H, Fixed, 95% CI) | Subtotals only | |
| 4 Disease control Show forest plot | 3 | Hazard Ratio (95% CI) | Subtotals only | |
| Outcome or subgroup title | No. of studies | No. of participants | Statistical method | Effect size |
| 1 Cardiotoxicity Show forest plot | 4 | 1412 | Risk Ratio (M‐H, Fixed, 95% CI) | 4.55 [0.92, 22.49] |
| 1.1 Same chemotherapy regimen | 3 | 1184 | Risk Ratio (M‐H, Fixed, 95% CI) | 4.30 [0.66, 28.03] |
| 1.2 Different chemotherapy regimen | 1 | 228 | Risk Ratio (M‐H, Fixed, 95% CI) | 5.45 [0.26, 112.37] |