Tratamiento con hormona de crecimiento recombinante para la fibrosis quística en niños y adultos jóvenes
Resumen
Antecedentes
La fibrosis quística (FQ) es una afección hereditaria que afecta los pulmones, el tracto gastrointestinal y el páncreas. Las personas con fibrosis quística a menudo presentan desnutrición y retraso del crecimiento. La administración adecuada de suplementos nutricionales no mejora óptimamente el crecimiento y, en consecuencia, se propuso un agente anabólico, la hormona de crecimiento humana recombinante (rhGH), como una intervención potencial. Ésta es una actualización de una revisión publicada anteriormente.
Objetivos
Evaluar la efectividad y la seguridad del tratamiento con rhGH para mejorar la función pulmonar, la calidad de vida y el estado clínico de niños y adultos jóvenes con fibrosis quística.
Métodos de búsqueda
Se realizaron búsquedas en el Registro de ensayos del Grupo Cochrane de Fibrosis quística y enfermedades genéticas (Cochrane Cystic Fibrosis and Genetic Disorders Group) que incluye referencias identificadas de búsquedas exhaustivas en bases de datos electrónicas o búsquedas manuales en revistas pertinentes y libros de resúmenes de congresos. Fecha de la última búsqueda: 12 de enero de 2021.
También se hicieron búsquedas en registros de ensayos en curso:
clinicaltrials.gov de los EE.UU. ‐ fecha de la última búsqueda: 19 de Junio de 2021;
Plataforma de registros internacionales de ensayos clínicos (ICTRP) de la OMS ‐ fecha de la última búsqueda: 5 de marzo de 2018 (no disponible en 2021).
Se realizó una búsqueda en revistas de endocrinología y actas relevantes de las reuniones de la Sociedad de Endocrinología mediante Web of Science, Scopus y Proceedings First. Fecha de la última búsqueda: 21 de junio de 2021.
Criterios de selección
Ensayos controlados aleatorizados y cuasialeatorizados de todas las preparaciones de rhGH en comparación con ningún tratamiento, placebo o las mismas preparaciones comparadas entre sí, a cualquier dosis (alta y baja), por cualquier vía y en cualquier duración, en niños o adultos jóvenes (de hasta 25 años) con diagnóstico de fibrosis quística (mediante prueba de sudor o análisis genéticos).
Obtención y análisis de los datos
Dos autores seleccionaron los documentos, extrajeron los detalles del ensayo y evaluaron el riesgo de sesgo de forma independiente. La calidad de la evidencia se evaluó mediante el método GRADE.
Resultados principales
En esta actualización de la revisión se incluyeron ocho ensayos (291 participantes de entre cinco y 23 años). Siete ensayos compararon una dosis estándar de rhGH (aproximadamente 0,3 mg/kg/semana) con ningún tratamiento y un ensayo de tres grupos (63 participantes) comparó el placebo, una dosis estándar de rhGH (0,3 mg/kg/semana) y una dosis alta de rhGH (0,5 mg/kg/semana). Seis ensayos duraron al menos un años y dos ensayos duraron seis meses. Se encontró que el tratamiento con rhGH podría mejorar algunos de los desenlaces de la función pulmonar, pero no hubo diferencias entre los niveles de dosis estándar y los niveles de dosis altas (evidencia de certeza baja, limitada por la inconsistencia entre los ensayos, el escaso número de participantes y la corta duración del tratamiento). Los ensayos muestran evidencia de mejoría en los parámetros antropométricos (estatura, peso y masa corporal magra) con el tratamiento con rhGH, de nuevo sin diferencias entre los niveles de dosis. Se encontró una mejoría en la estatura en todas las comparaciones (evidencia de certeza muy baja a baja), pero las mejorías en el peso y en la masa corporal magra solo se informaron para la dosis estándar de rhGH versus ningún tratamiento (evidencia de certeza muy baja). Hay alguna evidencia que indica un cambio en el nivel de glucosa en sangre en ayunas con el tratamiento con rhGH; sin embargo, no cruzó el umbral clínico para el diagnóstico de diabetes en los ensayos de corta duración (evidencia de certeza baja). Hay evidencia de certeza baja a muy baja de una mejoría en las exacerbaciones pulmonares sin efectos adversos significativos adicionales, pero este hallazgo se ve limitado por la corta duración de los ensayos y el escaso número de participantes. Un ensayo pequeño proporcionó evidencia inconsistente de mejoría en la calidad de vida (evidencia de certeza muy baja). Hay evidencia limitada de tres ensayos sobre mejorías en la capacidad de ejercicio (evidencia de certeza baja). Ninguno de los ensayos ha comparado sistemáticamente el gasto del tratamiento con los costes generales de la atención médica.
Conclusiones de los autores
Al compararlo con ningún tratamiento, el tratamiento con rhGH es eficaz para mejorar los desenlaces intermedios de estatura, peso y masa corporal magra. Algunas medidas de la función pulmonar mostraron una mejoría moderada, pero no se observaron efectos beneficiosos consistente en todos los ensayos. El cambio significativo en los niveles de glucosa en sangre, aunque no es causa de diabetes, pone de relieve la necesidad de una monitorización cuidadosa de este efecto adverso con el tratamiento en una población predispuesta a la diabetes relacionada con la fibrosis quística. En esta revisión, no se observaron cambios significativos en la calidad de vida, el estado clínico ni los efectos secundarios debido al escaso número de participantes. Se requieren ensayos controlados aleatorizados a largo plazo y bien diseñados acerca de la rhGH en personas con FQ antes del uso clínico habitual de la rhGH en la FQ.
PICO
Resumen en términos sencillos
Administración de hormona de crecimiento recombinante para mejorar el crecimiento y la salud de niños y adultos jóvenes con fibrosis quística
Pregunta de revisión
Se revisó la evidencia sobre los efectos de la hormona de crecimiento humana recombinante (rhGH) en la salud de las personas con fibrosis quística (FQ).
Antecedentes
La FQ es una afección hereditaria que afecta los pulmones, el sistema digestivo y el páncreas. Las personas con FQ a menudo presentan bajo peso y retraso del crecimiento que podría afectar la función de sus pulmones. Los suplementos nutricionales podrían no ser suficientes y se ha indicado que el tratamiento con rhGH, que mejora la tasa de crecimiento y la densidad ósea, podría ayudar. El tratamiento con rhGH se suele administrar una vez al día a través de una aguja bajo la piel. Es caro y puede afectar el metabolismo de la glucosa, lo que tiene implicaciones para los niños con riesgo de presentar diabetes relacionada con la FQ. Por lo tanto, se deben examinar cuidadosamente los riesgos y beneficios de este tratamiento. Esta revisión es una actualización de una revisión anterior.
Fecha de la búsqueda
La evidencia está actualizada hasta el: 12 de enero de 2021.
Características de los estudios
Esta revisión consideró la administración de rhGH para mejorar la función pulmonar, el crecimiento y la calidad de vida de niños y jóvenes con fibrosis quística. Incluye ocho ensayos con 291 personas con FQ seleccionadas al azar para un tratamiento o el otro. Las personas de los ensayos tenían entre cinco y 23 años de edad, pero la mayoría aún no habían alcanzado la pubertad. Seis ensayos duraron al menos un años y dos ensayos duraron seis meses. El tratamiento con rhGH se comparó con ningún tratamiento en siete ensayos y con un placebo (un líquido que no contenía hormona de crecimiento) en un ensayo. El ensayo que utilizó un placebo lo comparó con dos dosis diferentes de tratamiento con rhGH.
Resultados clave
Los resultados mostraron una modesta mejoría en la talla, el peso y la masa corporal magra entre los seis y los 12 meses. Sin embargo, no existe evidencia consistente de que el tratamiento con rhGH mejore la función pulmonar, la fuerza muscular, ni la calidad de vida. Los ensayos fueron pequeños y no se encontró evidencia de cambios en el metabolismo de la glucosa o en el riesgo de diabetes a largo plazo debido al tratamiento. Debido a estos resultados, no es posible identificar un efecto beneficioso claro del tratamiento y se considera necesario realizar más estudios de investigación a partir de ensayos clínicos bien diseñados y con un poder estadístico suficiente.
Certeza de la evidencia
No hubo suficiente información para decidir si en general los ensayos tenían un sesgo tal que pudiera afectar los resultados. Todos los desenlaces medidos se informaron claramente en los ensayos, pero estos fueron pequeños y no tuvieron suficientes participantes para mostrar una diferencia que podría no haberse debido al azar. También preocupaba que los desenlaces basados en la valoración personal, como las puntuaciones de la calidad de vida, pudieran verse afectados porque los participantes de siete de los ensayos sabían a qué grupo estaban asignados.
Authors' conclusions
Summary of findings
| Standard rhGH compared with placebo for children and young adults with CF | ||||||
| Patient or population: children and young adults with CF Settings: outpatient Intervention: standard rhGH Comparison: placebo | ||||||
| Outcomes | Illustrative comparative risks* (95% CI) | Relative effect | No of Participants | Quality of the evidence | Comments | |
|---|---|---|---|---|---|---|
| Assumed risk | Corresponding risk | |||||
| Placebo | Standard rhGH | |||||
| FEV1 (% predicted) change since baseline Follow‐up: 6 months | The mean (SD) change in FEV1 % predicted since baseline in the control group was 1% (23%). | The mean change in FEV1 % predicted in the standard rhGH group was 2.50% higher (8.60 lower to 13.60 higher). | ‐ | 43 participants | ⊕⊕⊝⊝ | No significant differences were found between treatment groups. |
| FVC (% predicted) change since baseline Follow‐up: 6 months | The mean (SD) change in FVC % predicted from baseline in the control group was ‐0.70% (15.1%). | The mean change in FVC (% predicted) in the standard rhGH group was 3.80% higher | ‐ | 43 participants | ⊕⊕⊝⊝ | No significant differences were found between treatment groups. |
| Height velocity (cm/year) Follow‐up: 6 months | The mean (SD) height velocity in the control group was 3.5 (2.3) cm/year. | The mean height velocity in the standard rhGH group was 2.1 cm/year higher (0.54 lower to 3.66 higher). | ‐ | 43 participants | ⊕⊕⊝⊝ | Height velocity (change in height measured in cm/year) showed significant improvement in those receiving standard rhGH; however, there was no statistically significant difference in the height z score between treatment groups. |
| Weight (kg) Change from baseline Follow‐up: 6 months | The mean (SD) change from baseline in weight in the control group was 1.4 (1.7) kg. | The mean change in weight in the standard rhGH group was 1.00 kg higher (‐0.08 lower to 2.08 higher). | ‐ | 43 participants | ⊕⊕⊝⊝ low1,2 | No significant differences were found between the two treatment groups. |
| QoL Follow‐up: 6 months | See comments. | ⊕⊝⊝⊝ very low1,2,3 | Schnabel used standardised CF HRQoL questionnaires and reported no major differences among the treatment groups (no data available for analysis). | |||
| Fasting blood glucose (mg/dL) Follow‐up: 6 months | The mean (SD) fasting blood glucose level in the control group was 88.8 (13.7) mg/dL. | The mean fasting blood glucose level in the standard rhGH group was 12.40 mg/dL higher (3.76 higher to 21.04 higher). | ‐ | 43 participants | ⊕⊕⊝⊝ | Statistically significant difference found in favour of the standard rhGH group. |
| Number of pulmonary exacerbations or hospitalisations Follow‐up: 6 months | 182 pulmonary exacerbations per 1000 participants. | 273 pulmonary exacerbations per 1000 participants (89 to 835). | RR 1.50 | 44 participants | ⊕⊕⊝⊝ | RR greater than 1 indicates an advantage for placebo. |
| *The basis for the assumed risk (e.g. the median control group risk across studies) is provided in footnotes. The corresponding risk (and its 95% CI) in the standard rhGH group is based on the assumed risk in the comparison group and the relative effect of the intervention (and its 95% CI). CF: cystic fibrosis;CI: confidence interval; FEV1 : forced expiratory volume at one second; FVC: forced vital capacity; HRQoL: health‐related quality of life; N/A: not applicable; QoL: quality of life; rhGH: recombinant growth hormone; RR: risk ratio; SD: standard deviation. | ||||||
| GRADE Working Group grades of evidence | ||||||
| 1. Downgraded due to unclear risk of bias due to lack of detail on generation of allocation sequence, allocation concealment, incomplete outcome data and support from a pharmaceutical company. 2. Downgraded due to small sample size and wide CIs. 3. Downgraded due to lack of data for analysis. | ||||||
| Standard rhGH compared with no treatment for children and young adults with CF | ||||||
| Patient or population: children and young adults with CF Settings: outpatient Intervention: standard rhGH Comparison: no treatment | ||||||
| Outcomes | Illustrative comparative risks* (95% CI) | Relative effect | No of Participants | Quality of the evidence | Comments | |
|---|---|---|---|---|---|---|
| Assumed risk | Corresponding risk | |||||
| No treatment | Standard rhGH | |||||
| FEV1(% predicted) Follow‐up: 12 months | The mean change in FEV1 % predicted in the control group was ‐0.4 (4.1). | The mean change in FEV1 % predicted) in the intervention group was 0.29 higher (0.62 lower to 1.19 higher). | ‐ | 19 participants (1 study) | ⊕⊝⊝⊝ | No statistically significant difference between treatment groups. The change in FEV1`(L) was reported by 2 trials (n = 75) and showed a significantly greater increase in the standard rhGH group, SMD 0.74 (95% CI 0.26 to 1.22). |
| FVC (% predicted) Follow‐up: 12 months | The mean (SD) change in FVC % predicted in the control group was 0.4 (2.5) (‐0.1 to 0.4). | The mean change in FVC % predicted in the intervention group was 1.00 higher (0.03 higher to 1.96 higher). | ‐ | 19 participants (1 study) | ⊕⊝⊝⊝very low1,2,3 | Statistically significant difference found in favour of the standard rhGH group. The change in FVC (L) was reported by 2 trials (n = 75) and showed a significantly greater increase in the standard rhGH group, SMD 1.61 (95% CI 0.17 to 3.06). |
| Height velocity (cm/year) Follow‐up: 12 months | The mean (range) height velocity in the control group was 4.47 (3.71 to 5.3) cm/year. | The mean height in the intervention group was 3.53 cm/year higher (2.77 higher to 4.30 higher). | ‐ | 156 participants (4 studies) | ⊕⊝⊝⊝ | Statistically significant difference found in favour of the standard rhGH group. There was a similar result in favour of the rhGH treatment group in height z score measured at the end of the trial, MD 0.58 (95% CI 0.36 to 0.80). |
| Weight (kg) Change from baseline Follow‐up: 12 months | The mean (range) change in weight from baseline in the control group was 1.75 kg (0.7 to 2.8). | The mean change in weight in the intervention group was 1.00 kg higher (0.32 lower to 1.68 higher). | ‐ | 62 participants (1 study) | ⊕⊝⊝⊝ very low1,2,3 | A separate study found no statistically significant difference between the two groups in change from baseline (kg) at six months. In relation to weight velocity, results were consistently significantly higher in the rhGH group at 12 months. |
| QoL Change from baseline Follow‐up: 12 months | The mean (SD) change from baseline in HRQoL score in the control group was 0.3 (0.8). | The mean change from baseline in HRQoL score in the intervention group was 0.10 higher (0.32 lower to 0.52 higher). | ‐ | 57 participants | ⊕⊝⊝⊝ | No statistically significant difference found between treatment groups; however, the same trial reported a significant difference in Body Image Score favouring rhGH. |
| Fasting blood glucose (mg/dL) Follow‐up: 12 months | The mean (range) fasting blood glucose in the control group was 93.33 mg/dL (88.90 mg/dL to 101.00 mg/dL). | The mean fasting blood glucose in the intervention group was 3.2 mg/dL higher (6.09 mg/dL lower to 12.49 mg/dL higher). | ‐ | 92 participants (3 studies) | ⊕⊝⊝⊝ | No statistically significant difference found between the two groups. |
| Number of pulmonary exacerbations or hospitalisations | The mean (range) number of hospitalisations in the control group was 2.70 (2.2 to 3.0). | The mean number of hospitalisations in the intervention group was 1.34 lower (1.75 lower to 0.93 lower). | ‐ | 94 participants (3 studies) | ⊕⊝⊝⊝ | Statistically significant difference found in favour of the standard rhGH group. The episodes of hospitalisations were reported as mean and SD between the 2 groups in these studies. The total number of hospitalisations in each group are not available to calculate RR. |
| *The basis for the assumed risk (e.g. the median control group risk across studies) is provided in footnotes. The corresponding risk (and its 95% CI) is based on the assumed risk in the comparison group and the relative effect of the intervention (and its 95% CI). CF: cystic fibrosis;CI: confidence interval; FEV1 : forced expiratory volume at 1 second; FVC: forced vital capacity; HRQoL: health‐related quality of life; N/A: not applicable; QoL: quality of life; rhGH: recombinant growth hormone; RR: risk ratio; SD: standard deviation. | ||||||
| GRADE Working Group grades of evidence | ||||||
| 1. Downgraded due to unclear risk of bias for generation of allocation sequence, allocation concealment and selective reporting 2. Downgraded due to high risk of bias for blinding or incomplete outcome data or support from a pharmaceutical company (or combination of these) . 3. Downgraded due to small sample size and wide CIs. | ||||||
| High‐dose rhGH compared to placebo for children and young adults with CF | ||||||
| Patient or population: children and young adults with CF | ||||||
| Outcomes | Illustrative comparative risks* (95% CI) | Relative effect | No of participants | Quality of the evidence | Comments | |
|---|---|---|---|---|---|---|
| Assumed risk | Corresponding risk | |||||
| Placebo | High‐dose rhGH | |||||
| FEV1 (% predicted) Change from baseline Follow‐up: 6 months | The mean (SD) change from baseline in FEV1 % predicted in the control group was 1.0 (23.0)% predicted. | The mean change from baseline in FEV1 % predicted in the intervention group was 3.30% higher (8.16% lower to 14.76% higher). | ‐ | 41 participants | ⊕⊕⊝⊝ | No statistically significant difference found between treatment groups. |
| FVC (% predicted) Change from baseline Follow‐up: 6 months | The mean (SD) change from baseline in FVC % predicted in the control group was ‐0.70 (15.10) % predicted. | The mean change from baseline in FVC % predicted in the intervention group was 6.70% higher (1.41% lower to 14.81% higher). | ‐ | 41 participants | ⊕⊕⊝⊝ | No statistically significant difference found between treatment groups. |
| Height velocity (cm/year) Follow‐up: 6 months | The mean (SD) height velocity in the control group was 3.5 (2.3) cm/year. | The mean height velocity in the intervention group was 3.30 cm/year higher (1.17 higher to 5.43 higher). | ‐ | 41 participants | ⊕⊕⊝⊝ | Statistically significant difference found in favour of the standard rhGH group. A similarly significant result was also seen in the height z score at the end of the study. |
| Weight (kg) Change from baseline Follow‐up: 6 months | The mean (SD) change in weight from baseline in the control group was 1.4 (1.7) kg. | The mean change in weight in the intervention group was 0.80 kg higher (0.44 lower to 2.04 higher). | 41 participants | ⊕⊕⊝⊝ | No statistically significant difference found between treatment groups. | |
| QoL Follow‐up: 6 months | See comments | 41 participants | ⊕⊝⊝⊝ | Schnabel reported QoL using standardised CF HRQoL questionnaires, but did not provide data we could enter into the analysis; the published paper reported no major differences between the treatment groups. | ||
| Fasting blood glucose (mg/dL) Follow‐up: 6 months | The mean (SD) fasting blood glucose in the control group was 88.8 (13.7) mg/dL. | The mean fasting blood glucose in the intervention group was 8.00 mg/dL higher (0.30 mg/dL lower to 16.3 mg/dL higher). | ‐ | 41 participants | ⊕⊕⊝⊝ | No statistically significant difference found between treatment groups |
| Number of pulmonary exacerbations or hospitalisations Follow‐up: 6 months | 182 pulmonary exacerbations per 1,000 participants. | 350 pulmonary exacerbations per 1,000 participants (120 to 1021). | RR 1.92 (0.66 to 5.61) | 42 participants | ⊕⊕⊝⊝ | RR over 1 indicates an advantage for placebo. |
| *The risk in the intervention group (and its 95% CI) is based on the assumed risk in the comparison group and the relative effect of the intervention (and its 95% CI). CF: cystic fibrosis; CI: confidence interval; FEV1 : forced expiratory volume at 1 second; FVC: forced vital capacity; HRQoL: health‐related quality of life; N/A: not applicable; QoL: quality of life; rhGH: recombinant growth hormone; RR: risk ratio; SD: standard deviation. | ||||||
| GRADE Working Group grades of evidence | ||||||
| 1. Downgraded due to unclear risk of bias due to lack of detail on generation of allocation sequence, allocation concealment, incomplete outcome data and support from a pharmaceutical company. 2. Downgraded due to small sample size and wide CIs. 3. Downgraded due to lack of data for analysis. | ||||||
| High‐dose rhGH compared to standard dose rhGH for children and young adults with CF | ||||||
| Patient or population: children and young adults with CF | ||||||
| Outcomes | Illustrative comparative risks* (95% CI) | Relative effect | No of participants | Quality of the evidence | Comments | |
|---|---|---|---|---|---|---|
| Assumed risk | Corresponding risk | |||||
| Standard‐dose rhGH | High‐dose rhGH | |||||
| FEV1 (% predicted) Change from baseline Follow‐up: 6 months | The mean (SD) absolute change from baseline in FEV1 % predicted in the standard‐dose group was 5.60 (2.90)% predicted. | The mean absolute change from baseline in FEV1 % predicted in the high‐dose group was 1.20% higher (1.04% lower to 3.44% higher). | ‐ | 42 participants | ⊕⊕⊝⊝ | No statistically significant difference found between treatment groups. This was also true for FEV1 z score. |
| FVC (% predicted) Change from baseline Follow‐up: 6 months | The mean (SD) absolute change from baseline in FVC % predicted in the standard‐dose group was ‐0.70 (15.1) % predicted. | The mean absolute change from baseline in FVC % predicted in the high‐dose group was 6.70% higher (1.29% lower to 14.69% higher). | ‐ | 42 participants | ⊕⊕⊝⊝ | No statistically significant difference found between treatment groups. |
| Height velocity (cm/year) Follow‐up: 6 months | The mean (SD) change from baseline in height velocity in the standard‐dose group was 5.6 (2.9) cm/year. | The mean change from baseline in height velocity in the high‐dose group was 1.20 cm/year higher (1.04 lower to 3.44 higher). | ‐ | 42 participants | ⊕⊕⊝⊝ | No statistically significant difference found between treatment groups. Also no difference between groups in height velocity z score. |
| Weight (kg) Change from baseline Follow‐up: 6 months | The mean (SD) change from baseline in weight in the standard‐dose group was 2.4 (1.9) kg. | The mean change from baseline in weight in the high‐dose group was 0.2 kg lower (1.48 kg lower to 1.08 kg higher). | 42 participants | ⊕⊕⊝⊝ | No statistically significant difference found between treatment groups. | |
| QoL | Not reported. | N/A | ||||
| Fasting blood glucose (mg/dL) Follow‐up: 6 months | The mean (SD) fasting blood glucose level in the standard‐dose group was 101.20 (15.2) mg/dL. | The mean fasting blood glucose level in the high‐dose group was 4.40 mg/dL lower (13.05 mg/dL lower to 4.25 mg/dL higher). | ‐ | 42 participants | ⊕⊕⊝⊝ | No statistically significant difference found between treatment groups. |
| Number of pulmonary exacerbations or hospitalisations Follow‐up: 6 months | 273 pulmonary exacerbations per 1000 participants. | 350 pulmonary exacerbations per 1000 participants (142 to 868). | RR 1.28 | 42 participants | ⊕⊕⊝⊝ | RR greater than 1 indicates an advantage for standard rhGH. |
| *The risk in the intervention group (and its 95% CI) is based on the assumed risk in the comparison group and the relative effect of the intervention (and its 95% CI). | ||||||
| GRADE Working Group grades of evidence | ||||||
| 1. Downgraded due to unclear risk of bias for generation of allocation sequence, concealment of allocation, lack of blinding of outcome assessment, incomplete outcome data and support from a pharmaceutical company. 2. Downgraded due to small sample size. | ||||||
Background
Description of the condition
Cystic fibrosis (CF) is the most common autosomal recessive genetic disease in individuals of European ancestry. With the current use of newborn screening, CF is estimated to affect 1 in 3000 to 1 in 6000 births (De Boeck 2020; Scotet 2020 ). A genetic defect in the cystic fibrosis transmembrane conductance regulator (CFTR) gene results in thickened secretions across cells causing a spectrum of clinical symptoms dominated by chronic lung disease and exocrine pancreatic insufficiency.
Inadequate gastrointestinal function results in the malabsorption of fat, essential vitamins and fatty acids. Long‐standing lung disease increases caloric requirements compounded by a loss of appetite due to the disease, medications and the psychological stress of chronic disease (De Boeck 2017; Goetz 2019). Malnutrition and growth failure are commonly seen in people with CF; 10.5% % of people with CF under 19 years of age are below the fifth percentile for BMI and the median height percentile remains well below normal (CFF 2019).
In the past, a failure to thrive was one of the presenting features of CF. Approximately 40% of infants were below the fifth percentile for weight and length at diagnosis with some catch‐up growth after diagnosis (Barkhouse 1989; Karlberg 1991; Lai 1998; Morison 1997). In the USA, since the introduction of newborn screening for CF, failure to thrive is less likely to be seen, but poor growth is still a problem (Coffey 2017; Leung 2017).
Height and weight influence pulmonary function in people with CF (Mauch 2016; Zemel 2000). Diagnosis by newborn screening has significantly improved the long‐term height and weight outcomes in children and adolescents with CF, but benefits on lung function are yet to be identified (Assael 2009; Leung 2017).
After infancy, the rate of growth of children with CF follows a nearly normal pattern in the pre‐pubertal age, albeit at lower centiles (CFF 2019; Leung 2017; Yen 2013). The adolescent years show more severe growth impairment associated with a delay in skeletal maturation, a delayed pubertal growth spurt, and the attainment of adult height (Haeusler 1994; Lucidi 2009; Morison 1997). Despite comprehensive care at specialised centres, studies show that growth in individuals with CF remains below that of controls or healthy peers (Stettler 2000; Wiedemann 2007). Consequently, the height of adults with CF is reduced (Byard 1994; CFF 2019; Lucidi 2009).
Malnutrition and short stature have been shown to contribute to an individual's poor clinical outcome (Corey 1988; Goetz 2019; Le 2019). While the nutritional care of people with CF has improved significantly, children with CF remain shorter than their peers and fail to reach their genetic potential (Zysman‐Colman 2021). Height is a significant prognostic factor for CF and poor growth adversely impacts lung function and overall health status (Beker 2001; McColley 2017; Yen 2013). Prospective studies have also shown that aggressive nutritional intervention may positively affect pulmonary function (Konstan 2003; Sharma 2001). It is possible that improved growth may allow more lung mass and better lung function, which could be important, independent of the issue of improving weight gain. However, despite adherence to updated nutritional guidelines, there are still people with CF who cannot meet their energy needs or maintain the benefits of nutritional interventions (Dalzell 1992; Stettler 2000) and who are at risk of nutritional failure and deterioration of pulmonary function.
Individuals with CF have been consistently shown to have low levels of GH effector proteins (insulin‐like growth factor ‐1 (IGF‐1) and binding proteins (IGFBP‐3) which correlate with height and body mass index (BMI) (Boguszewski 2007; Rogan 2010). Whether this is due to decreased GH production, relative GH insensitivity, or CFTR dysfunction itself is not clearly defined (Le 2019; Laursen 1999; Taylor 1997). In addition, the chronic inflammation in CF results in the production of inflammatory chemicals like body interleukins (IL‐1, IL‐6) and tumour necrosis factor (TNF‐alpha), which have also been shown to reduce levels of IGF‐1 (De Benedetti 1997; Wong 2016). There is strong evidence that low IGF‐1 levels result in loss of lean body mass and respiratory muscle wasting which ultimately results in the deterioration of lung function and increasing morbidity (Sermet‐Gaudelus 2003).
Description of the intervention
GH acts to mediate growth and metabolic functions in the body. It is released from the pituitary gland in a pulsatile manner throughout the day. At night GH release peaks and stimulates the production of IGF‐1 in the liver, which is its major effector protein and also serves to control its secretion (Williams 2011).
Recombinant human GH (rhGH) (somatotropin) has been available since 1985 and is self‐administered at home, usually as a subcutaneous injection. The frequency of dose is generally six to seven times per week, preferably at night to mimic the body's natural rhythm. The dose of the therapy generally varies between 0.1 mg to 0.4 mg/kg/week depending on the clinical condition.
Treatment with rhGH is expensive. According to an NHS Health Technology Assessment Programme, the costs for treating children with four of the licensed conditions (growth hormone deficiency, Prader Willi Syndrome, idiopathic short stature and Turners syndrome) in England and Wales with rhGH would be approximately GBP 180 million (Bryant 2002). For GH deficiency, the cost of therapy (in 2000) for a nine‐year‐old child for eight years would average more than GBP 50,000 and that for a 12‐year old child for five years over GBP 40,000 (Bryant 2002). This raises the question of consideration of cost‐benefit analysis for the use of therapy, especially if anticipated costs are higher, as in CF.
Adverse effects of the therapy
Besides the discomfort and local reactions caused by daily injections, mild adverse effects like headache, nausea, fever and vomiting have been noted. Overall, the incidence of adverse effects in children treated with rhGH therapy is under 3%. Adverse effects associated with rhGH therapy are intracranial hypertension (pseudotumour cerebri), moderate and severe edema, slipped capital femoral epiphysis, worsening of scoliosis, gynaecomastia and hyperglycaemia (Wilson 2003). There have been some recent concerns that rhGH therapy may increase the tendency towards new tumour formation (Giovannucci 2002; Verhelst 2002), although there are no current documented results with short‐ and long‐term follow‐up in children and adults.
In trials assessing the results of rhGH therapy on glucose metabolism, a slight increase in fasting and post‐prandial insulin and blood glucose levels has been demonstrated (Cutfield 2000; Jeffcoate 2002). In pre‐pubertal children with CF at high risk for CF‐related diabetes, the long‐term safety of rhGH therapy should be an important consideration.
How the intervention might work
Treatment with rhGH can accelerate linear growth in pre‐pubertal children with growth failure including those with CF (Hardin 2004). It also modifies body composition, promoting fat‐free mass in the body. In the long term, rhGH treatment increases bone mass and bone mineral density which can be detected by dual energy X‐ray absorptiometry (DEXA) scan.
In children with CF, rhGH increases IGF‐1 levels and improves growth velocity, lean body mass and bone density (Hardin 1997; Huseman 1996). Improved linear growth can improve pulmonary function, exercise capacity, reduce infection rates and provide a better quality of life (QoL) (Beker 2001; Corey 1988). It was also noted that rhGH reduced TNF‐alpha in people with CF and reduces protein degradation (Hardin 2001).
Why it is important to do this review
Therapy with rhGH has potential side effects such as impairment in glucose metabolism. Presently there is no agreement on the use of rhGH therapy in individuals with CF. A systematic review of the use of rhGH in people with CF is needed to evaluate the treatment outcomes before justifying treatment. If a systematic review of the studies reveals a benefit in pulmonary function, the QoL, and morbidity (including hospitalisations) for people with CF, this will serve as an important adjunct to their current therapy.
This is an update of a previously published review (Thaker 2013; Thaker 2015; Thaker 2018).
Objectives
To evaluate the effectiveness and safety of rhGH therapy in improving lung function, QoL and clinical status of children and young adults with CF.
Methods
Criteria for considering studies for this review
Types of studies
Randomised controlled trials (RCTs) and quasi‐RCTs.
Types of participants
Participants of either sex up to the age of 25 years with a confirmed diagnosis of CF (e.g. by sweat test or molecular diagnosis) who have not received rhGH therapy in the previous six months.
Types of interventions
Therapy with rhGH at any dose compared to placebo, no treatment or a different dose regimen.
Types of outcome measures
We assessed the following outcomes.
Primary outcomes
-
Pulmonary function tests
-
forced expiratory volume at one second (FEV1) (% predicted or litres)
-
forced vital capacity (FVC) (% predicted or litres)
-
maximal inspiratory pressure (PImax)
-
maximal expiratory pressure (PEmax)
-
-
Anthropometric parameters
-
height (cm) and height z score or standard deviation score (SDS)
-
height velocity
-
weight (kg) and weight z score or SDS
-
weight velocity
-
lean body mass (LBM) measured by DEXA scan
-
-
QoL (measured by a validated tool such as the Cystic Fibrosis Questionnaire‐Revised version (CFQ‐R (Quittner 2009)) and the Cystic Fibrosis Quality of Life Questionnaire (CFQoL (Gee 2000))
Secondary outcomes
-
Impact of rhGH therapy on blood glucose abnormality
-
impact on fasting insulin levels in non‐diabetic participants (by measuring insulin levels)
-
fasting blood glucose (FBG) and post‐prandial blood glucose (PPBG) levels (haemoglobin A1c levels and oral glucose tolerance tests)
-
change in exogenous insulin requirements and blood sugar control in diabetic participants
-
-
Muscular strength and exercise capacity
-
changes in overall muscle strength (as measured by hand grip or bicycle ergometry (post hoc change))
-
six‐minute walk
-
-
Serum insulin‐like growth factor‐1 (IGF‐1) levels and insulin‐like growth factor binding protein 3 (IGFBP‐3) levels
-
Change in disease exacerbation
-
hospitalisation
-
frequency
-
duration
-
-
need for antibiotics
-
oral
-
intravenous
-
-
-
Any adverse effects reported
-
mild, requiring no treatment (e.g. transient glucosuria, transient splenomegaly and muscular prominence)
-
moderate, requiring treatment (e.g. benign intracranial hypertension, effects on glucose metabolism)
-
life‐threatening or severe (requiring hospitalisation) (e.g. slipped capital epiphyses, incidence of malignant disease)
-
-
Cost
Search methods for identification of studies
Searches were not limited by language or publication status.
Electronic searches
We identified relevant studies from the Group's Cystic Fibrosis Trials Register using the terms: treatment of growth failure AND (rhGH OR not stated).
The Cystic Fibrosis Trials Register is compiled from electronic searches of the Cochrane Central Register of Controlled Trials (CENTRAL) (updated each new issue of the Cochrane Library), weekly searches of MEDLINE, a search of EMBASE to 1995 and the prospective handsearching of two journals ‐ Pediatric Pulmonology and the Journal of Cystic Fibrosis. Unpublished work is identified by searching the abstract books of three major cystic fibrosis conferences: the International Cystic Fibrosis Conference; the European Cystic Fibrosis Conference and the North American Cystic Fibrosis Conference. For full details of all searching activities for the register, please see the relevant sections of the Cochrane Cystic Fibrosis and Genetic Disorders Group's website.
Date of the latest search: 12 January 2021.
We conducted a search of relevant endocrine journals and proceedings of the Endocrinology and Pulmonary Society meetings. We used Web of Science, Scopus and Proceedings First to conduct this search.
Date of the latest search: 19 June 2021.
We searched the online trial registries at www.clinicaltrials.gov. Date of latest search: 22 June 2021.
We last searched the WHO International Clinical Trials Registry Platform (ICTRP) at www.who.int/trialsearch for ongoing clinical trials on 05 March 2018. We were unable to access this database in 2021 due to the Covid‐19 pandemic.
The search strategies for these additional electronic searches are detailed in the appendices (Appendix 1).
Searching other resources
The bibliographic references of identified trials were reviewed for references to additional trials.
Data collection and analysis
Selection of studies
Two authors (VT and BH, and from 2018, MP) independently assessed the abstracts of trials identified from the searches. We obtained full copies of all relevant and potentially relevant trials (those appearing to meet the inclusion criteria, and for which there were insufficient data in the title and abstract to make a clear decision). The two review authors (VT, BH and from 2018 MP) then independently assessed the full text papers and resolved any disagreement on the eligibility of included trials through discussion and consensus or, if necessary, through a third author (BC). We then excluded those records that did not meet the inclusion criteria and we noted the reasons for their exclusion in the 'Characteristics of excluded studies' table in the review.
Data extraction and management
We entered trial details into the 'Characteristics of included studies' table in the review and collected outcome data using a pre‐determined form designed for this purpose. Two authors (VT, BH and subsequently MP) independently extracted data and only included data for which there was a consensus. We resolved any disagreements by consulting with a third review author (BC).
We extracted the following details.
-
Trial methods
-
method of allocation
-
allocation concealment
-
masking of participants, clinicians and outcome assessors
-
exclusion of participants after randomisation and proportion and reasons for losses at follow‐up
-
-
Participants
-
country of origin and study setting
-
sample size
-
age
-
gender
-
inclusion and exclusion criteria
-
-
Intervention
-
trial duration
-
type
-
concentration, dose and frequency
-
duration of intervention in follow‐up
-
-
Control
-
type
-
concentration, dose and frequency
-
duration of intervention in follow‐up
-
-
Outcomes:
-
primary and secondary outcomes mentioned in the Types of outcome measures section of this review
-
If stated, we recorded the sources of funding of any of the included trials.
We used this information to help assess heterogeneity and the external validity of any included trials. We used Cochrane's Review Manager software for data organisation and analysis (RevMan 2020).
Assessment of risk of bias in included studies
Each review author graded the selected trials using a simple contingency form and followed the domain‐based evaluation described in Chapter 8 of the Cochrane Handbook for Systematic Reviews of Interventions (Higgins 2011a). The authors compared the evaluations and discussed and resolved any inconsistencies in these evaluations.
We assessed the following domains as having either a low, unclear or high risk of bias:
-
sequence generation;
-
allocation concealment;
-
blinding (of participants, personnel and outcome assessors);
-
incomplete outcome data;
-
selective outcome reporting;
-
other bias.
We categorised the risk of bias in any included trial according to the following:
-
low risk of bias (plausible bias unlikely to seriously alter the results) if all criteria were met;
-
unclear risk of bias (plausible bias that raises some doubt about the results) if one or more criteria were assessed as unclear; or
-
high risk of bias (plausible bias that seriously weakens confidence in the results) if one or more criteria were not met.
We report these assessments in the table 'Risk of bias in included studies' in the review.
Measures of treatment effect
For dichotomous outcomes (need for antibiotics, number of people with pulmonary exacerbations and adverse effects), we reported the results as the risk ratio (RR) with 95% confidence intervals (CI). For continuous outcomes (pulmonary function tests, nutritional parameters, QoL, blood glucose levels, muscular strength and exercise capacity, measures of serum IGF‐1 levels, cost of therapy and hospitalisation), we reported the mean relative change from baseline for each group or mean post‐intervention values and their standard deviations (SD). We used Review Manager software to analyse the data (RevMan 2020). We reported data as the mean difference (MD) or standardised mean difference (SMD) if different units are used with 95% CIs.
We processed data according to the intention‐to‐treat principle, using in the denominator the number of randomised participants. We assumed missing values for outcome measures to represent a poor outcome for both groups.
Unit of analysis issues
We did not include any cluster‐RCTs, and we reported repeated measures studies that collected multiple time points for outcomes at clinically relevant time points as discussed in the Cochrane Handbook for Systematic Reviews of Interventions (Higgins 2011b).
We have included data from the first period of cross‐over trials (Hardin 2005a; Hardin 2006). We have excluded data from later periods of cross‐over studies as the duration of treatment effect and the disease effect are more likely to develop over different time periods and the appropriate washout period cannot be clearly defined.
Dealing with missing data
We contacted primary research investigators about missing data from included and ongoing trials. We have provided a narrative synthesis of information where data were not provided.
Assessment of heterogeneity
We assessed clinical heterogeneity by examining the characteristics of the trials, the similarity between the types of participants, the interventions and the outcomes as specified in the criteria for included trials. We used the I² statistic to assess heterogeneity. If we found moderate levels of heterogeneity for the primary outcomes (I² greater than 50%), we would have explored reasons for heterogeneity using subgroup analysis. We considered heterogeneity to be significant when the P value was less than 0.10 (Higgins 2003).
Assessment of reporting biases
We planned to assess publication bias according to the recommendations on testing for funnel plot asymmetry (Egger 1997) and as described in Chapter 10 of the Cochrane Handbook for Systematic Reviews of Interventions (Sterne 2011); however, we were unable to do so due to a lack of data available for analysis.
Data synthesis
For the synthesis and meta‐analysis of any quantitative data we used the random‐effects model. We did not consider it appropriate to combine data for any outcome due to the differences in participant characteristics where trial data were reported at the same time points.
We sought statistical support from the Cochrane Cystic Fibrosis and Genetic Disorders Group. Two review authors (VT, BC) analysed data reported in the included studies and relevant to the primary and secondary outcomes of this review using the Review Manager software (RevMan 2020). We report results as suggested in Chapter 9 of the Cochrane Handbook for Systematic Reviews of Interventions (Deeks 2011).
Subgroup analysis and investigation of heterogeneity
We have not performed any subgroup analyses to date due to the small amount of data, the inability to obtain raw data and the absence of heterogeneity. In future updates, if we identify further trials and are able to combine results that then show heterogeneity (I² greater than 50%), we will undertake subgroup analyses for the following groups:
-
Tanner stage of puberty (Tanner 1962);
-
gender;
-
baseline nutritional or anthropometric status;
-
lung function (FEV1 < 50%, 50% to 80% and > 80%).
Sensitivity analysis
We planned to perform sensitivity analyses if we were able to combine a sufficient number of trials and if we noted a high degree of statistical heterogeneity (I² over 50%) that could not be reasonably explained. We performed meta‐analyses where multiple trials were available for the same outcome. We also performed sensitivity analyses to assess the robustness of our review results by repeating the analysis with the following adjustments: exclusion of trials with unclear or inadequate allocation concealment; unclear or inadequate blinding of outcomes assessment; and completeness of follow‐up.
Summary of findings and assessment of the certainty of the evidence
At the 2018 update, we included a summary of findings table for each comparison in the review. The four main comparisons are as follows
-
standard‐dose rhGH compared to placebo for children and young adults with CF;
-
standard‐dose rhGH compared to no treatment for children and young adults with CF;
-
high‐dose rhGH compared to placebo for children and young adults with CF;
-
high‐dose rhGH compared to standard‐dose rhGH for children and young adults with CF.
We have selected the following seven outcomes, which we consider to be the most important, to include in the tables.
-
FEV1 % predicted (change from baseline)
-
FVC % predicted (change from baseline)
-
Height velocity (cm/year) (at the end of the trial)
-
Weight (kg) (change from the baseline)
-
QoL (measured during the trial)
-
FBG (mg/dL) (at the end of the trial)
-
Number of pulmonary exacerbations or hospitalisations (during the trial period)
We used the GRADE approach to assess the certainty of the evidence for each outcome based on the risk of bias within the trials, relevance to our population of interest (indirectness), unexplained heterogeneity or inconsistency, imprecision of the results or high risk of publication bias. We downgraded the evidence once if the risk was serious and twice if the risk was deemed to be very serious.
We have reported at the longest available time point (final) in the tables.
Results
Description of studies
Please see the tables for additional information (Characteristics of included studies; Characteristics of excluded studies).
Results of the search
The electronic searches retrieved 40 references. After examination of the titles and abstracts of these references, we eliminated from the review any trials that did not match our inclusion criteria and were clearly ineligible. We obtained full‐text copies of the 24 potentially eligible trials and subjected these to further evaluation. The review authors discussed the eligibility of these trials, resolved any remaining uncertainties by consensus and found eight trials to be eligible. Four trials were included in the initial review (Hütler 2002; Schibler 2003; Schnabel 2007; Stalvey 2012), four additional trials previously listed as 'Awaiting classification', were added in the 2018 update of the review after contact with the lead investigator who confirmed that each trial had independent participants (Hardin 2001; Hardin 2005a; Hardin 2005b; Hardin 2006).
We excluded 13 trials from the results of the search of the Cochrane Cystic Fibrosis Trials Register (Alemzadeh 1998; Bucuvalas 2001; Darmaun 2004; Eubanks 2002; Hardin 1997; Hardin 1998; Hardin 2005c; Huseman 1996; Kissner 2000; Marchand 2000; Sackey 1995; Safai‐Kutti 1991; Vanderwel 2006). Our additional online searches identified one new trial from Iranian Registry of Clinical Trials (Ghergherechi 2017) and one trial from the National Institutes of Health clinical trials database (www.clinicaltrials.gov) (NCT00803179); both of these were excluded.
This process is shown in a PRISMA diagram (Figure 1).

Study flow diagram.
Included studies
Methods
Eight published trials are included in this review (Hardin 2001; Hardin 2005a; Hardin 2005b; Hardin 2006; Hütler 2002; Schibler 2003; Schnabel 2007; Stalvey 2012). One was a quasi‐RCT, where sex‐ and age‐matched pairs were recruited and randomly assigned to treatment (Schibler 2003).
Five were RCTs of parallel design (Hardin 2001; Hardin 2005b; Schibler 2003; Schnabel 2007; Stalvey 2012) and three trials were cross‐over in design (Hardin 2005a; Hardin 2006; Hütler 2002). In two trials, participants were randomised to treatment or no treatment for one year followed by continued treatment for another year; only results from the first year of these trial are included in this review (Hardin 2005a; Hardin 2006). In the third cross‐over trial participants received rhGH or no treatment for six months and then crossed over to the alternative treatment for a further six months without any washout period in between (Hütler 2002).
One of the double‐blinded parallel trials used three treatment arms; low‐dose, high‐dose, and placebo (Schnabel 2007). The double‐blind phase in the treatment arms lasted for 24 weeks, following which the controls were randomly assigned to one of the two doses of the rhGH for an additional 24 weeks.
The minimum duration of treatment in six trials was one year (Hardin 2001; Hardin 2005a; Hardin 2005b; Hardin 2006; Schibler 2003; Stalvey 2012), while two trials lasted for six months (Hütler 2002; Schnabel 2007).
Participants and settings
A total of 291 participants provided data for the eight included trials. All trials included diagnosed cases of CF, either by sweat testing or presence of the CFTR gene. The age range of participants was from five years (Stalvey 2012) to 23 years (Schibler 2003), although most of the trials recruited younger participants in Tanner Stage 1 of sexual maturity staging. The height and weight percentile of the participants ranged from below the 10th to below the 25th percentile for age and gender. Most of the participants were in a stable disease state with no colonisation with Burkholderia cepacia and no recent use of systemic or oral steroids. Most of the trials excluded participants with evidence of glucose intolerance or active CF‐related diabetes (CFRD). All of the trials were carried out at tertiary care CF centres in outpatient settings. Three of the trials were single centre (Hütler 2002; Schibler 2003; Hardin 2005b); five were conducted at more than one site (Hardin 2001; Hardin 2005a; Hardin 2006; Schnabel 2007; Stalvey 2012). Only one of the trials included children receiving enteral nutrition (Hardin 2005a).
Interventions
The intervention was daily subcutaneous injections of rhGH. Five trials used the brand Nutropin AQ® (Genentech Inc.) at a dose of 0.3 mg/kg/week (Hardin 2001; Hardin 2005a; Hardin 2005b; Hardin 2006; Stalvey 2012). One trial used rhGH (Saizen®, Merck Serono S.A.) at a dose of 1 IU/kg/week (Schibler 2003). In a further trial, doses of 0.77 to 0.98 IU/kg/week of rhGH (Genotropin®, Pharmacia GmbH, Stockholm, Sweden) were used (Hütler 2002). In the remaining trial, two doses of rhGH (somatotropin) were used ‐ low dose, 0.039 mg/kg/day (0.273 mg/kg/week) and high dose, 0.070 mg/kg/day (0.49 mg/kg/week) (Schnabel 2007). Only one trial used a placebo as a control (Schnabel 2007); the remaining trials compared the active intervention to no treatment (Hardin 2001; Hardin 2005a; Hardin 2005b; Hardin 2006; Hütler 2002; Schibler 2003; Stalvey 2012).
Outcomes measured
All the trials measured at least one of the two of the primary outcomes included in the review ‐ pulmonary function tests and anthropometric parameters. Two trials used validated QoL questionnaires (Hardin 2006; Schnabel 2007). Most of the trials addressed blood glucose abnormality, either in quantitative values or information in the text. Four trials measured changes in serum markers, either IGF‐1 or IGFBP3 (Hardin 2001; Hardin 2005a; Hardin 2005b; Schnabel 2007). Two trials measured changes in disease exacerbation or use of antibiotics, or both (Hardin 2006; Schnabel 2007). Three trials measured exercise capacity ‐ albeit using different parameters (Hütler 2002; Schibler 2003; Schnabel 2007). None of the trials evaluated the cost of the therapy, although one trial mentions information on cost‐benefit analysis in the text (Hardin 2006).
Excluded studies
We excluded 15 trials in total from the review; nine since they were not randomised (Alemzadeh 1998; Ghergherechi 2017; Hardin 1997; Hardin 1998; Hardin 2005c; Huseman 1996; NCT00803179; Sackey 1995; Vanderwel 2006). In six trials the intervention was not appropriate: one used glutamine in conjunction with rhGH (Darmaun 2004); two used an appetite stimulant (megestrol acetate) (Eubanks 2002; Marchand 2000); one used progestational agents (Kissner 2000); one used oral zinc supplementation (Safai‐Kutti 1991); and one used IGF‐1 (Bucuvalas 2001).
Further information on these trials is available in the Characteristics of excluded studies.
Risk of bias in included studies
We classified the risk of bias for the eight included trials in this review as previously described (Assessment of risk of bias in included studies).
We judged all of the included trials as having an 'unclear' overall risk of bias. We based these assessments to a large extent on the inadequate reporting of several of the criteria that are considered to be important in the evaluation of methodological rigour in terms of study design and conduct. For further details, please see the risk of bias tables in Characteristics of included studies, the risk of bias graph (Figure 2) and the risk of bias summary (Figure 3).

Risk of bias graph: review authors' judgements about each risk of bias item presented as percentages across all included studies.

Risk of bias summary: review authors' judgements about each risk of bias item for each included study.
Allocation
Generation of allocation sequence
We judged two trials to have a low risk of bias for the generation of allocation sequence (Hardin 2005a; Stalvey 2012). Hardin reported use of a computer‐generated random assignment in the 2005a trial (Hardin 2005a). Stalvey reported the use of a permuted block randomisation scheme developed by an interactive voice response development system at each site (Stalvey 2012).
The remaining trials do not describe details of the generation of allocation sequence and hence we classified these as having an unclear risk of bias (Hardin 2001; Hardin 2005b; Hardin 2006; Hütler 2002; Schibler 2003; Schnabel 2007).
Concealment of allocation
One trial included a statement "For this open‐label trial, there was no allocation concealment" (Stalvey 2012). However, based on the context, it is possible that the authors are referring to blinding rather than concealment of the allocation sequence, and hence we have judged this as unclear risk. None of the remaining trials described how the allocation sequence was concealed, which did not allow us to determine whether intervention allocations could have been foreseen in advance of, or during, enrolment. We therefore judged all eight trials to have an unclear risk of bias for this domain.
Blinding
Perfomance bias
In one of the trials, participants were grouped into low‐dose, high‐dose and placebo; it is noted in the manuscript that participants and healthcare providers were blinded and hence the overall judgement is low risk of bias (Schnabel 2007).
The remaining seven trials are judged to have a high risk of bias (Hütler 2002; Hardin 2001; Schibler 2003; Hardin 2005a; Hardin 2005b; Hardin 2006; Stalvey 2012). In five of these trials the participants and personnel were able to differentiate between treatment groups (e.g. subcutaneous injection versus no treatment) (Hardin 2001; Hardin 2005a; Hardin 2005b; Hütler 2002; Schibler 2003), in two trials no blinding of participants was stated (Hardin 2006; Stalvey 2012).
Detection bias
None of the eight included trials described any methods to blind outcome assessors and we therefore judge them to have an unclear risk of bias (Hardin 2001; Hardin 2005a; Hardin 2005b; Hardin 2006; Hütler 2002; Schibler 2003; Schnabel 2007; Stalvey 2012).
Incomplete outcome data
We judged five trials as having a low risk of bias (Hardin 2005a; Hardin 2005b; Hardin 2006; Hütler 2002; Schibler 2003). There were no reports of dropouts or incomplete data in either Hardin trial from 2005 (Hardin 2005a; Hardin 2005b). In the latest Hardin trial, 61 participants were enrolled and 57 were included in the analyses; the dropouts, two from each group, are accounted for in the paper (Hardin 2006). In one cross‐over trial there were no withdrawals and no missing or incomplete data (Hütler 2002). The Schibler trial describes the withdrawal of one control evaluated for lung transplantation, likely due to worsening of the disease and also has a low risk of bias (Schibler 2003).
We judged the remaining trials to have an unclear risk of bias (Hardin 2001; Schnabel 2007; Stalvey 2012). In the earliest Hardin trial, 21 participants were enrolled and two participants dropped out within six weeks of starting the trial (Hardin 2001). The Schnabel trial reports the analysis of 63 out of the 67 participants enrolled, but no details are provided on the withdrawals (Schnabel 2007). The Stalvey trial enrolled 68 participants and reported results on efficacy in 53 participants only (loss of 22% participants); several reasons including loss to follow‐up, death of one participant and improper study practices at one centre were reported for this discrepancy (Stalvey 2012).
Selective reporting
Although no trial protocols were available, based on information presented in the methods sections of each of the reports, the investigators appear to have reported on all of their stated objectives and expected outcomes, a number of which were pre‐specified inclusion criteria for this systematic review. We therefore judge there to be a low risk of bias from selective reporting for the included trials.
Other potential sources of bias
All of the included trials were supported in some part by pharmaceutical companies, Pharmacia GmbH (Hütler 2002); Merck Serono SA (Schibler 2003); Pharmacia GmbH (Schnabel 2007) and Genetech Inc. (Hardin 2001; Hardin 2005a; Hardin 2005b; Hardin 2006; Stalvey 2012). The effect, if any, of this support on the results is unclear.
Effects of interventions
See: Summary of findings 1 Standard rhGH compared to placebo for cystic fibrosis in children and young adults; Summary of findings 2 Standard rhGH compared to no treatment for cystic fibrosis in children and young adults; Summary of findings 3 High‐dose rhGH compared to placebo for children and young adults with cystic fibrosis; Summary of findings 4 High‐dose rhGH compared to standard‐dose rhGH for children and young adults with cystic fibrosis
Recombinant growth hormone (standard dose) versus placebo
Only one trial (n = 63) was conducted initially over 24 weeks as a double‐blind RCT with two different doses of rhGH compared with placebo followed by another 24 weeks of open‐labelled hormone use (Schnabel 2007). Data from the end of the first 24 weeks (double‐blinded) are reported in the review; in this section the data for standard dose of rhGH versus placebo are presented.
Primary outcomes
1. Pulmonary function tests
a. FEV1
The trial reported the change in FEV1 % predicted from baseline to six months (Schnabel 2007). There was no difference between the rhGH and placebo groups for this outcome (n = 43), MD 2.50 (95% CI ‐8.60 to 13.60; P = 0.66) (Analysis 1.1) (low‐certainty evidence), or in the z score (n = 43), MD 0.00 (95% CI ‐0.23 to 0.23; P = 1.00) (Analysis 1.2).
b. FVC
There was also no significant difference between groups in the change in FVC % predicted from baseline (n = 43) (Schnabel 2007), MD 3.80 (95% CI ‐4.67 to 12.27; P = 0.38) (Analysis 1.3) (low‐certainty evidence).
2. Anthropometric parameters
a. Height
Data for this outcome (n = 43) showed an increase in the height z score between rhGH and placebo, but this was not statistically significant (Schnabel 2007), MD 2.50 (95% CI ‐0.77 to 5.77; P = 0.13) (Analysis 1.4).
b. Height velocity
Height velocity at six months was found to be in favour of rhGH (n = 43), MD 2.10 cm/year (95% CI 0.54 to 3.66; P = 0.008) (Analysis 1.5) (low‐certainty evidence) (Schnabel 2007).
c. Weight
The trial (n = 43) also reported an increase in weight from baseline at six months (Schnabel 2007), but this was not statistically significant, MD 1.00 kg (95% CI ‐0.08 to 2.08; P = 0.07) (Analysis 1.6) (low‐certainty evidence).
d. Weight velocity
The included trial did not report on this outcome (Schnabel 2007).
e. LBM
The included trial (n = 43) reported data on LBM using DEXA scan at six months (Schnabel 2007), but the difference between treatment and placebo groups in the change from baseline was not statistically significant, MD 1.00 kg (95% CI ‐0.40 to 2.40; P = 0.16) (Analysis 1.7).
3. QoL
Schnabel also reported QoL using standardised CF health‐related quality of life (HRQoL) questionnaires and reported no major differences among the treatment groups; however investigators did not provide data that could be analysed (Schnabel 2007) (very low‐certainty evidence).
Secondary outcomes
1. Impact of rhGH therapy on blood glucose abnormality
a. Impact on fasting insulin levels in non‐diabetic participants
The included trial did not report on this outcome (Schnabel 2007).
b. FBG and PPBGlevels
FBG levels were reported at six months (n = 43) (Schnabel 2007). Data showed a significant increase in the rhGH treatment group, MD 12.40 mg/dL (95% CI 3.76 to 21.04; P=0.005) (Analysis 1.8) (low‐certainty evidence). Although the increase in FBG is statistically significant in the participants receiving rhGH, this is not clinically suggestive of hyperglycaemia or diabetes. The reported difference in PPBG levels is not statistically significant (n = 43), MD 12.10, 95% CI ‐7.18 to 31.38; P = 0.22) (Analysis 1.9).
c. Change in exogenous insulin requirements and blood sugar control in diabetic participants
None of the participants in the included trial had diabetes (Schnabel 2007).
2. Muscular strength and exercise capacity
a. Changes in overall muscle strength
Exercise capacity and muscle strength were measured using a bicycle ergometer (n = 43) (Schnabel 2007). Data showed a non‐statistically significant difference, MD 9.80 watts (95% CI ‐0.90 to 20.50; P = 0.07) (Analysis 1.10). Investigators also measured peak oxygen utilisation during exercise (VO2 max) (n = 43) (Schnabel 2007), but results showed no difference between the two groups, MD 10.10 mL/min (95% CI ‐3.85 to 24.05; P = 0.16) (Analysis 1.11).
b. Six‐minute walk
Schnabel did not report on this outcome (Schnabel 2007).
3. Serum IGF‐1 levels and IGFBP‐3 levels
Schnabel (n = 43) reported levels of IGF‐1 and IGFBP‐3 at six months in z scores (Schnabel 2007). There was an expected increase in IGF‐1 with administration of rhGH, MD 1.37 (95% CI 0.68 to 2.06; P = 0.0001) (Analysis 1.12), but limited evidence of an increase in IGFBP‐3, MD 0.65 (95% CI ‐0.10 to 1.40; P = 0.09) (Analysis 1.13).
4. Change in disease exacerbation
a. Hospitalisation ‐ frequency and duration
Schnabel did not report on this outcome (Schnabel 2007).
b. Need for antibiotics
Schnabel (n = 44) reported similar numbers of pulmonary exacerbations in each of the treatment arms, RR 1.50 (95% CI 0.49 to 4.59; P=0.48) (Analysis 1.14) (low‐certainty evidence).
5. Adverse effects
Schnabel (n = 44) reports the number of participants experiencing at least one adverse event in the groups and the number of participants with severe adverse events, but not categorised as outlined in the review protocol. There was no difference in the total number of participants experiencing at least one adverse event between the two groups, RR 1.08 (95% CI 0.67 to 1.72; P = 0.76) (Analysis 1.15). The range of adverse events was wide (pulmonary exacerbation, haemoptysis, pneumothorax, productive cough, Candida sepsis, distal intestinal obstruction syndrome, hyperglycaemia, convulsion, Port‐a‐cath blockage and ligament rupture) but the paper only reported these by the number of events and not by the number of participants experiencing these events so we are not able to analyse these here.
a. Mild (requiring no treatment)
Schnabel did not report on this outcome separate from total adverse events (Schnabel 2007).
b. Moderate (requiring treatment)
Schnabel reported an equal number of adverse effects observed in all the treatment arms with the commonest adverse effect being pulmonary exacerbations, as reported above (Analysis 1.14).
c. Life‐threatening or severe (requiring hospitalisation)
There was no significant difference in the severe adverse effects reported between the two comparison groups (n = 44), RR 1.25 (95% CI 0.39 to 4.05; P = 0.71) (Analysis 1.15).
6. Cost
Schnabel did not report on this outcome (Schnabel 2007).
Recombinant growth hormone (standard dose) versus no treatment
Seven of the included trials compared the use of daily subcutaneous injections of rhGH with no treatment (n = 228) (Hardin 2001; Hütler 2002; Schibler 2003; Hardin 2005a; Hardin 2005b; Hardin 2006; Stalvey 2012). In the Hütler trial, groups receiving rhGH or no treatment were crossed over after six months; only extractable data from the first treatment period is included in the review (Hütler 2002). All other trials had a period of at least one year where the intervention or no treatment control were administered. In two trials the treatment group, but not the controls, received rhGH for the first year of the trial and all participants received rhGH in the second year; we only report data at the end of the first year in this review (Hardin 2005a; Hardin 2006).
Primary outcomes
1. Pulmonary function tests
a. FEV1
Six trials reported FEV1 at six or 12 months in various formats (Hardin 2001; Hardin 2005a; Hardin 2006; Hütler 2002; Schibler 2003; Stalvey 2012).
Three trials (n = 93) reported absolute values for FEV1 % predicted at 12 months (Hardin 2001; Hardin 2005a; Stalvey 2012). There was no significant difference found between rhGH and no treatment, MD ‐4.15 (95% CI ‐13.99 to 5.70; P = 0.43) (Analysis 2.1). Heterogeneity was low (I² = 18%).
Four trials (n = 104) reported the change from baseline in FEV1, one (n = 19) reported using % predicted (Schibler 2003) and three (n = 85) measured this outcome in L (Hardin 2005a; Hardin 2006; Hütler 2002). We analysed these combined data using the SMD. Analysis showed that at six months the change in FEV1 was not statistically significant, SMD ‐0.32 (95% CI ‐1.06 to 0.41; P = 0.39) with no heterogeneity (I² = 0%). Results were also not significant when data for % predicted and for L were considered separately. However, at 12 months combined results from three trials (n = 94) significantly favoured rhGH, SMD 0.64 (95% CI 0.21 to 1.06; P = 0.003). Results from one trial (n = 19) for the change in FEV1 % predicted was not significantly different between groups, SMD 0.29 (95% CI ‐0.62 to 1.19) (Analysis 2.2) (very low‐certainty evidence), but the difference in FEV1 (L) (two trials, 75 participants) was statistically significant, SMD 0.74 (95% CI 0.26 to 1.22). Moderate heterogeneity for the combined data at 12 months (I² = 64%) was caused by the inclusion of participants who were receiving enteral nutrition (Hardin 2005a); the exclusion of these participants resulted in two trials (n = 76) showing a non‐significant effect, SMD 0.44 (95% CI ‐0.02 to 0.90; P = 0.06) with no heterogeneity (I² = 0%) (Analysis 2.2).
b. FVC
Five trials reported data for FVC at six or 12 months as absolute values in % predicted (Hardin 2001; Hardin 2005a; Stalvey 2012) and change from baseline in % predicted and L (Hardin 2005a; Hardin 2006; Schibler 2003).
Analyses of data for absolute values for FVC % predicted from three trials (n = 93) at 12 months did not show statistically significant results between the two groups, MD 3.05 (95% CI ‐9.50 to 15.60; P = 0.63) (Analysis 2.3). We identified moderate heterogeneity (I² = 62%), likely because of the differences in the baseline condition between the participants across the three trials. The control participants in the Stalvey trial had a significantly higher mean baseline FVC and although both groups showed significantly improved FVC over the duration of the trial, the improvement in the intervention group was smaller (Stalvey 2012).
Three trials (n = 94) reported the change from baseline in FVC using two different units (% predicted and L), hence we used SMD for the meta‐analysis. It should be noted one small trial (n = 19) was measured at six months (% predicted) with a non‐statistically significant difference between groups, SMD 0.43 (95% CI ‐0.48 to 1.34). This trial additionally reported with two larger trials (which reported L) at 12 months (n = 94) and combined data significantly favoured rhGH therapy, SMD 1.32 (95% CI 0.55 to 2.10) with moderate heterogeneity (I² = 55%). There was an improvement in both units of measurement, SMD 1.00 for % predicted change (95% CI 0.03 to 1.96) (very low‐certainty evidence) and SMD 1.61 L (95% CI 0.17 to 3.06) (Analysis 2.4).
c. PImax
One trial (n = 19) reported a significant improvement in PImax with rhGH therapy, MD ‐21.00 mm Hg (95% CI ‐28.69 to ‐13.31; P < 0.0001) (Analysis 2.5) (Hardin 2001). This outcome is not a direct measure of pulmonary function clinically.
d. PEmax
One trial (n = 28) reported a significant improvement in PEmax with rhGH therapy, MD 23.00 mm Hg (95% CI 16.89 to 29.11; P < 0.0001) (Analysis 2.6) (Hardin 2001). This outcome is not a direct measure of pulmonary function clinically.
2. Anthropometric parameters
a. Height
Five trials reported data on height at six or 12 months in a variety of formats.
Four trials (n = 131) reported height z score (Hardin 2001; Hardin 2005a; Hardin 2005b; Stalvey 2012). Height z score significantly favoured rhGH over no treatment at 12 months, MD 0.58 (95% CI 0.36 to 0.80; P < 0.0001) with no heterogeneity (I² = 0%) (Analysis 2.7).
One trial (n = 10) reported the change from baseline in height (cm) (Hütler 2002). There was a (not statistically significant) improvement in height at six months, MD 1.40 cm (95% CI ‐0.07 to 2.87; z = 1.87; P = 0.06) (Analysis 2.8).
b. Height velocity
Four trials (n = 156) reported on height velocity (Hardin 2001; Hardin 2005a; Hardin 2006; Stalvey 2012). Two trials (n = 76) showed a significant difference between rhGH and no treatment in height velocity at six months, MD 4.51 cm/year (95% CI 2.21 to 6.81) but with a significant degree of heterogeneity (I² = 88%) (Analysis 2.9). At 12 months, four trials (n = 156) also showed a significant difference in height velocity, MD 3.53 cm/year (95% CI 2.77 to 4.30; P = 0.09) again with a high degree of heterogeneity (I² = 55%) (Analysis 2.9) (very low‐certaintyevidence). The heterogeneity in both cases was caused by a trial that enrolled participants on enteral nutrition (Hardin 2005a). The exclusion of this trial resulted in lower heterogeneity (I² = 37%) but the result was still significant, MD 3.24 cm/year (95% CI 2.51 to 3.97; P = 0.20) (Analysis 2.9).
There was also a statistically and clinically significant improvement in height percentile rank documented by one trial (n = 19) (Hardin 2001), MD 12.20 (95% CI 10.84 to 13.56; P < 0.0001) (Analysis 2.10).
c. Weight
Six trials reported data on changes in weight at six or 12 months in different formats.
Four trials (n = 88) reported weight z score (Hardin 2001; Hardin 2005a; Hardin 2005b; Schibler 2003). Data from the Schibler trial (n = 19) showed a statistically significant difference in weight z score between groups at six months (favouring no treatment), MD ‐0.10 (95% CI ‐0.21 to ‐0.00; P = 0.05) (Analysis 2.11). Results from four trials (n = 88) at 12 months did not show a statistically significant difference between rhGH and no treatment, MD 0.48 (95% CI ‐0.07 to 1.03; P = 0.09) with high heterogeneity (I² = 73%) (Analysis 2.11). Malnutrition in CF is known to worsen with age and one trial enrolled participants with a much older age range than the other trials showed much less weight gain, giving rise to the heterogeneity in the outcome (Schibler 2003). Omitting this trial, three trials (n = 69) showed a significant improvement in weight, MD 0.74 (95% CI 0.32 to 1.17; P = 0.0006) with no heterogeneity (I² = 0%) (Analysis 2.11).
Two trials (n = 72) reported the change from baseline in weight (kg) (Hütler 2002; Stalvey 2012). At six months (n = 10), there was no significant difference between groups, MD 1.00 kg (95% CI ‐0.22 to 2.22). In the second trial that reported a difference at 12 months (n = 62), there was a significant difference between groups, MD 1.00 kg (95% CI 0.18 to 1.82) (very low‐certainty evidence)(Analysis 2.12).
d. Weight velocity
Weight velocity was measured in three trials at two different time points (Hardin 2001; Hardin 2005a; Hardin 2006). Two trials (n = 76) reported a significant increase favouring rhGH at six months, MD 3.12 (95% CI 1.27 to 4.97; P = 0.001) but with a very high level of heterogeneity (I² = 91%) (Analysis 2.13). All three trials (n = 94) reported at 12 months and also demonstrated significant increases in the rhGH groups compared to no treatment, MD 2.82 (95% CI 1.53 to 4.10; P < 0.0001), again with a high level of heterogeneity (I² = 81%) (Analysis 2.13). Despite the heterogeneity of the results in this outcome, the overall effect indicates a consistent improvement in weight velocity with rhGH.
One trial (n = 19) reported an improvement in weight percentile with rhGH therapy, MD 5.50, 95% CI 4.02 to 6.98; P < 0.0001) (Analysis 2.14) (Hardin 2001).
e. LBM
All seven trials in this comparison reported changes in LBM by DEXA scan; two trials reported at six months (Hardin 2001; Hütler 2002) and six trials at 12 months (Hardin 2001; Hardin 2005a; Hardin 2005b; Hardin 2006; Schibler 2003; Stalvey 2012). There was a statistically significant improvement in LBM at six months (three trials, 90 participants), MD 2.57 (95% CI 2.01 to 3.12; P < 0.00001) with little heterogeneity (I² = 28%) (Analysis 2.15). At 12 months five trials (n = 191) reported data for children who were prepubertal at trial entry and found a significant result in favour of rhGH, MD 2.12 (95% CI 1.13 to 3.10; P < 0.0001) but with a high level of heterogeneity (I² = 87%) (Analysis 2.15). One trial (n = 19) reported on children who were post‐pubertal at the start of the trial and this result was also significant at 12 months, MD 2.50 (95% CI 1.85 to 3.15; P < 0.00001). Although the results at 12 months for prepubertal children show severe heterogeneity amongst the trials, all results support an improvement and the differences in effect size are probably due to the small sample size and differences from the included children (Analysis 2.15). One trial reported lean mass (LM) only in the text (Hardin 2006).
3. QoL
One multicentre trial (n = 57) measured QoL by the change in HRQoL score and in Body Image Score (Hardin 2006). While the change in HRQoL was not different between groups, MD 0.10 (95% CI ‐0.32 to 0.52; P = 0.64) (very low‐certainty evidence), the difference for the change in Body Image Score favoured rhGH, MD 0.50 (95% CI 0.03 to 0.97; P = 0.04) (Analysis 2.16).
Secondary outcomes
1. Impact of rhGH therapy on blood glucose abnormality
a. Impact on fasting insulin levels in non‐diabetic participants
Serum insulin levels were measured in two trials (n = 73) (Hardin 2001; Stalvey 2012). There was a statistically significant difference between the two groups as reported by one trial (n = 19) at six months, MD 3.10 μU/mL, 95% CI 2.40 to 3.80; P < 0.0001), but not when data from both trials were combined at 12 months, MD 1.55 μU/mL (95% CI ‐0.60 to 3.70; P = 0.16) with approaching moderate heterogeneity (I² = 49%) (Analysis 2.17).
b. FBG and PPBG levels
Three trials (n = 92) report FBG levels (Hardin 2001; Schibler 2003; Stalvey 2012). One trial (n = 19) reported at six months (Hardin 2001) and three trials (n = 92) at 12 months (Hardin 2001; Schibler 2003; Stalvey 2012); at neither time point did data show a significant change in FBG levels between treatment with rhGH and no treatment, MD 4.00 mg/dL (95% CI ‐12.57 to 20.57; P = 0.64) and MD 3.20 mg/dL (95% CI ‐6.09 to 12.49; P = 0.50) (very low‐certainty evidence) respectively. However, one trial (n = 19) contributing data to the 12‐month time point showed a significant result in favour of rhGH, MD 12.50 mg/dL (95% CI 5.12 to 19.88; P = 0.0009) (Schibler 2003); this difference is not clinically relevant as diagnosis of glucose intolerance can be made only if fasting blood glucose is greater than 126 mg/dL. There is also a significant variation in the age range of the participants in the trials reporting at 12 months; in the Schibler trial, ages ranged from 10 years to 23 years and in the Hardin and Stalvey trials, the ages ranged from 5.2 years to 13.4 years (Hardin 2001; Schibler 2003; Stalvey 2012). It is possible that the older age group represents an advancement of the disease that is also associated with an increased incidence of glucose intolerance. Therefore, there is unclear evidence for the effect of rhGH on fasting blood glucose (Analysis 2.18).
Two trials (n = 38) reported data on PPBG levels (Hardin 2001; Schibler 2003). One trial (n = 19) reported no statistically significant difference in the PPBG levels between groups at six months, MD 5.00 mg/dL (95% CI ‐2.20 to 12.20); this was also true for both trials (n = 38) at 12 months, MD ‐10.75 (95% CI ‐32.74 to 11.25; P = 0.17) with low heterogeneity (I² = 35%) (Analysis 2.19). As previously noted, there are differences in the baseline characteristics of the participants in the Schibler trial (Schibler 2003).
In other outcomes related to blood glucose control in non‐diabetic participants, in one trial (n = 19) there was no difference in the haemoglobin A1c levels at six months, MD 0.10% (95% CI ‐0.44 to 0.64; P = 0.72) or at 12 months, MD ‐0.30% (95% CI ‐0.66 to 0.06; P = 0.10) (Analysis 2.20) (Hardin 2001). Additionally, a further trial (n = 19) reported no difference in the change in HbA1c from baseline between groups, MD 0.14% (95% CI ‐0.30 to 0.58; P = 0.54) (Analysis 2.21) (Schibler 2003).
c. Change in exogenous insulin requirements and blood sugar control in diabetic participants
One trial included five participants with impaired glucose tolerance (IGT) (three in the treatment group and two in the control group) (Stalvey 2012). Two participants in the treatment group had normal oral glucose tolerance tests (OGTT) at the end of the trial. In each of the trial groups, three participants developed IGT and one developed CF‐related diabetes mellitus (CFRD) at the end of the treatment period (12 months). On further follow‐up to 18 months without any intervention, two additional participants in the rhGH treatment group developed IGT and one CFRD. At a similar follow‐up in the control group, one participant developed IGT. Other trials excluded participants with IGT or diabetes and do not report the incidence of new cases.
2. Muscular strength and exercise capacity
a. Changes in overall muscle strength
Exercise capacity and muscle strength were measured in two trials (n = 29) using a bicycle ergometer (Hütler 2002; Schibler 2003).
The trial by Schibler reported an increase in the maximum exercise capacity, representing an increase in muscle mass, in favour of the rhGH treatment group at both six months, MD 23.10 watts (95% CI 15.58 to 30.62; P < 0.0001) and at 12 months, MD 31.90 watts (95% CI 22.68 to 41.12; P = 0.02) (Analysis 2.22).
The paper by Hütler provided a graph showing the increase in the peak power output in terms of absolute (18%) and age‐predicted (14%) values (Hütler 2002). Both trials measured VO2 max, albeit in different units (Hütler 2002; Schibler 2003). Results from one trial (n = 10) shows a statistically significant improvement at six months, MD 3.65 mL/min (95% CI 0.60 to 6.70; P < 0.02) (Hütler 2002) and from the second trial at 12 months (Schibler 2003), MD 6.10 mL/kg/min, 95% CI 4.29 to 7.91; P < 0.00001) in favour of rhGH treatment (Analysis 2.23).
b. Six‐minute walk
Stalvey (n = 56) measured exercise capacity using the six‐minute walk test (Stalvey 2012). At 12 months, there was no statistically significant difference between the 29 participants treated with rhGH versus the 27 participants who received no treatment, MD 25.90 m (95% CI ‐43.57 to 95.37; P = 0.46) (Analysis 2.24).
3. Serum IGF‐1 levels and IGFBP‐3 levels
Serum IGF‐1 levels were reported in three trials (n = 69) (Hardin 2001; Hardin 2005a; Hardin 2005b). There was a statistically significant increase in the levels as reported by one trial (n = 19) at six months, MD 152.00 ng/mL (95% CI 62.89 to 241.11; P = 0.0008) (Hardin 2001). Combined data from three trials (n = 69) at 12 months also showed significantly higher serum IGF‐1 levels in the rhGH group, MD 198.17 ng/mL (95% CI 135.59 to 260.74; P < 0.00001) with moderate heterogeneity (I² = 51%) (Analysis 2.25).
4. Change in disease exacerbation
a. Hospitalisation ‐ frequency and duration
Three trials (n = 94) reported hospitalisation events at 12 months (Hardin 2001; Hardin 2005a; Hardin 2006). There were significantly fewer hospitalisations with rhGH therapy than with no treatment, MD ‐1.34 (95% CI ‐1.75 to ‐0.93; P <0.0001) (Analysis 2.26) (very low‐certainty evidence).
b. Need for antibiotics ‐ oral and intravenous
Stalvey stated that the number of pulmonary exacerbations was reported equally by the two groups (Stalvey 2012).
5. Adverse effects
Only one trial (n = 68) reported data for adverse events (Stalvey 2012). Drug‐related adverse events were experienced by 10 participants RR 18.73 (95% CI 1.14 to 307.37) (Analysis 2.27).
a. Mild, requiring no treatment
None of the trials mentions the presence of adverse effects which did not require treatment. It is important to mention that subcutaneous injection of rhGH can be perceived as a burden of treatment and Stalvey stated that seven participants reported injection‐site bruising, RR 13.38 (95% CI 0.79 to 225.34; P = 0.07) (Analysis 2.27).
b. Moderate, requiring treatment
Stalvey reported a similar number of pulmonary exacerbations in the two groups. Additionally, five participants in the rhGH group and seven participants in the control group experienced hyperglycaemia, RR 0.63 (95% CI 0.22 to 1.80) (Analysis 2.27); one of those in the rhGH group had to discontinue the trial (Stalvey 2012). One additional participant in the rhGH group had papilledema and headache after five months of rhGH therapy, RR 2.68 (95% CI 0.11 to 63.45; P = 0.54) (Analysis 2.27); the authors conclude this event was rhGH therapy‐related benign intracranial hypertension which resolved with discontinuation of treatment (Stalvey 2012).
c. Life‐threatening or severe (requiring hospitalisation)
Stalvey reported one death due to respiratory failure three months after the 12‐month visit, RR 2.68 (95% CI 0.11 to 63.45); however, the authors postulate this is unrelated to the trial (Stalvey 2012). Hospitalisations as a result of disease exacerbations have been reported earlier.
6. Cost
There was a difference in reports on the cost‐benefit analysis of therapy. Therapy with rhGh is expensive and Schibler reports that the cost of the treatment may not be justified for the modest increase in exercise capacity and LBM (Schibler 2003). Conversely, in 2006 Hardin reported that the cost of therapy may be justified based on the decrease in the number of hospitalisations (Hardin 2006).
High‐dose rhGH versus placebo
One trial reported the use of high‐dose rhGH treatment compared with placebo with data reported at six months (Schnabel 2007). The group of participants receiving placebo in this comparison are the same as that used in the prior comparison with the standard dose.
Primary outcomes
1. Pulmonary function tests
a. FEV1
The trial (n = 41) reported that there was no statistically significant difference between the high‐dose rhGH group and controls in the change from baseline in FEV1 % predicted, MD 3.30 (95% CI ‐8.16 to 14.76; P = 0.57) (Analysis 3.1) (low‐certainty evidence) or change in FEV1 z score, MD ‐0.01 (95% CI ‐0.24 to 0.22; P = 0.93) (Analysis 3.2).
b. FVC
Similarly, there was no statistically significant difference between high‐dose rhGH participants and controls in FVC % predicted (n = 41), MD 6.70 (95% CI ‐1.41 to 14.81; P = 0.11) (Analysis 3.3) (low‐certainty evidence).
2. Anthropometric parameters
a. Height
Data were not available for height in this trial (Schnabel 2007).
b. Height velocity
There was a statistically significant difference in the change from baseline in height velocity when measured with z score with rhGH treatment (n = 41), MD 3.60 (95% CI 0.30 to 6.90; P = 0.03) (Analysis 3.4) and also with cm/year (n = 41), MD 3.30 cm/year (95% CI 1.17 to 5.43; P = 0.002) (Analysis 3.5) (low‐certainty evidence).
c. Weight
The trial (n = 41) noted no significant difference between groups in the change in weight from baseline, MD 0.80 kg (95% CI ‐0.44 to 2.04; P = 0.21) (Analysis 3.6) (low‐certainty evidence).
d. Weight velocity
No data for weight velocity were available for analysis (Schnabel 2007).
e. LBM
No statistically significant difference in LBM was seen between the high‐dose rhGH group and the placebo group (n = 41), MD 0.80 (95% CI ‐0.67 to 2.27; P = 0.29) (Analysis 3.7).
3. QoL
The Schnabel trial also reported QoL using standardised CF HRQoL questionnaires but did not provide data we could enter into the analysis (Schnabel 2007). Within the published paper, Schnabel reported no major differences between the treatment groups (Schnabel 2007) (very low‐certainty evidence).
Secondary outcomes
1. Impact of rhGH therapy on blood glucose abnormality
a. Impact on fasting insulin levels in non‐diabetic participants
No data are available for this outcome (Schnabel 2007).
b. FBG and PPBG levels
Whilst there was limited evidence of a difference in the FBG levels in the high‐dose rhGH group, MD 8.00 mg/dL (95% CI ‐0.30 to 16.30; P = 0.06) (Analysis 3.8) (low‐quality evidence), this was not supported in PPBG, MD 4.60 mg/dL (95% CI ‐23.32 to 32.52; P = 0.75) (Analysis 3.9).
c. Change in exogenous insulin requirements and blood sugar control in diabetic participants
None of the participants in the Schnabel trial was diabetic (Schnabel 2007).
2. Muscular strength and exercise capacity
a. Changes in overall muscle strength
Schnabel (n = 41) evaluated muscle strength using bicycle ergometry (Schnabel 2007). No significant difference was found in the exercise capacity between the two groups, MD 4.40 watts (95% CI ‐13.20 to 22.00; P = 0.62) (Analysis 3.10) or VO2 max, MD 24.00 mL/min (95% CI ‐10.61 to 58.61; P = 0.17) (Analysis 3.11).
b. Six‐minute walk
This test was not used in the Schnabel trial (Schnabel 2007).
3. Serum IGF‐1 levels and IGFBP‐3 levels
Comparison of serum hormone levels showed significant differences between high‐dose rhGH and placebo in favour of high‐dose rhGH treatment: IGF‐1 (z scores), MD 2.03 (95% CI 1.18 to 2.88; P < 0.0001) (Analysis 3.12); and IGFBP‐3 (z scores), MD 0.81 (95% CI 0.11 to 1.51; P = 0.02) (Analysis 3.13).
4. Change in disease exacerbation
Hospitalisation and antibiotic usage, oral or intravenous, were not reported by Schnabel (Schnabel 2007). However, the report does state that pulmonary exacerbations were the most commonly observed category of adverse events, RR 1.93 (95% CI 0.66 to 5.61; P = 0.21) (Analysis 3.14) (low‐certainty evidence).
5. Adverse effects
Schnabel reports the number of participants experiencing at least one adverse event in the groups and the number of participants with severe adverse events, but not categorised as outlined in our review protocol. There was no difference in the total number of participants experiencing at least one adverse event between the two groups, RR 1.02 (95% CI 0.62 to 1.67; P = 0.95) (Analysis 3.15). The range of adverse events was wide (pulmonary exacerbation, haemoptysis, pneumothorax, productive cough, Candida sepsis, distal intestinal obstruction syndrome, hyperglycaemia, convulsion, Port‐a‐cath blockage and ligament rupture) but the paper only reported these by the number of events and not by the number of participants experiencing these events so we are not able to analyse these here.
a. Mild, requiring no treatment
Schnabel did not report on this outcome separate from total adverse events (Schnabel 2007).
b. Moderate, requiring treatment
Schnabel reported an equal number of adverse effects observed in all the treatment arms with the commonest adverse effect being pulmonary exacerbations as reported above (Analysis 3.14).
c. Life‐threatening or severe (requiring hospitalisation)
There was no significant difference in the severe adverse effects reported between the two comparison groups, or for severe adverse events, RR 1.10 (95% CI 0.32 to 3.83; P = 0.88) (Analysis 3.15).
6. Cost
No data were presented on the cost of the therapy by the Schnabel study (Schnabel 2007).
High‐dose versus standard‐dose rhGH
One study compared high‐dose rhGH versus standard‐dose rhGH (Schnabel 2007). The group of participants receiving high‐dose and standard‐dose rhGH in this comparison are the same as those presented in the prior comparisons using high‐dose and standard‐dose compared to placebo.
Primary outcomes
1. Pulmonary function tests
a. FEV1
Schnabel (n = 42) found no statistical difference between high‐dose and the standard‐dose rhGH participants for the change from baseline in FEV1 % predicted, MD 1.20 (95% CI ‐1.04 to 3.44; P = 0.29) (Analysis 4.1) (low‐certainty evidence) or in FEV1 z score, MD ‐0.01 (95% CI ‐0.20 to 0.18; P = 0.92) (Analysis 4.2).
b. FVC
Likewise, Schnabel (n = 42) found no statistically significant difference in FVC % predicted between the high‐dose and the standard‐dose groups, MD 6.70 (95% CI ‐1.29 to 14.69; P = 0.10) (Analysis 4.3) (low‐certainty evidence).
2. Anthropometric parameters
a. Height
Data on absolute height were not reported in the Schnabel trial (Schnabel 2007).
b. Height velocity
Schnabel (n = 42) found a significant improvement height velocity z score in the high‐dose rhGH group compared to standard‐dose, MD 1.10 (95% CI ‐0.51 to 2.71; P = 0.18) (Analysis 4.4) and also when measured in cm/year, MD 1.20 cm/year (95% CI ‐1.04 to 3.44; P = 0.29) (Analysis 4.5) (low‐certainty evidence).
c. Weight
No significant difference in the change from the baseline in weight was found between high‐dose rhGh and standard‐dose therapy, MD ‐0.20 kg (95% CI ‐1.48 to 1.08; P = 0.76) (Analysis 4.6) (low‐certainty evidence).
d. Weight velocity
No data on this outcome were reported in the Schnabel trial (Schnabel 2007).
e. LBM
No significant difference was found in the LBM between the high‐dose and the standard‐dose group, MD ‐0.20 kg (95% CI ‐1.69 to 1.29; P = 0.79) (Analysis 4.7).
3. QoL
No data on this outcome were reported in the Schnabel trial (Schnabel 2007).
Secondary outcomes
1. Impact of rhGH therapy on blood glucose abnormality
a. Impact on fasting insulin levels in non‐diabetic participants
These data were not reported in the Schnabel trial (Schnabel 2007).
b. FBG and PPBG levels
No significant differences were found in FBG levels, MD ‐4.40 mg/dL (95% CI ‐13.05 to 4.25; P = 0.32) (Analysis 4.8) (low‐certainty evidence) or PPBG, MD ‐7.50 mg/dL (95% CI ‐38.36 to 23.36; P = 0.63) (Analysis 4.9).
c. Change in exogenous insulin requirements and blood sugar control in diabetic participants
None of the participants in the Schnabel trial was diabetic or on insulin treatment (Schnabel 2007).
2. Muscular strength and exercise capacity
a. Changes in overall muscle strength
Muscle strength was measured by bicycle ergometry (Schnabel 2007). Schnabel (n = 42) found no significant differences between the two groups in exercise capacity, MD ‐5.40 (95% CI ‐22.96 to 12.16; P = 0.55) (Analysis 4.10) or VO2 max, MD 13.90 (95% CI ‐21.97 to 49.77; P = 0.45) (Analysis 4.11).
b. Six‐minute walk
This test was not used in the Schnabel trial (Schnabel 2007).
3. Serum IGF‐1 levels and IGFBP‐3 levels
Schnabel (n = 42) reported a statistically significant difference in the IGF‐1 levels (z scores) in favour of the high‐dose rhGH therapy, MD 2.03 (95% CI 1.18 to 2.88; P < 0.00001) (Analysis 4.12) and IGFBP‐3 levels (z scores), MD 0.81 (95% CI 0.11 to 1.51; P = 0.02) (Analysis 4.13).
4. Change in disease exacerbation
No data are reported on the hospitalisation or use of oral or intravenous antibiotics in the Schnabel trial (Schnabel 2007). However, the report does state that pulmonary exacerbations were the most commonly observed category of adverse events, RR 1.28 (95% CI 0.52 to 3.18; P = 0.59) (Analysis 4.14) (low‐certainty evidence).
5. Adverse effects
Schnabel reports the number of participants experiencing at least one adverse event in the groups and the number of participants with severe adverse events, but not categorised as outlined in our review protocol. There was no difference in the total number of participants experiencing at least one adverse event between the two groups, RR 0.94 (95% CI 0.58 to 1.52; P = 0.81) (Analysis 4.15). The range of adverse events was wide (pulmonary exacerbation, haemoptysis, pneumothorax, productive cough, Candida sepsis, distal intestinal obstruction syndrome, hyperglycaemia, convulsion, Port‐a‐cath blockage and ligament rupture) but the paper only reported these by the number of events and not by the number of participants experiencing these events so we are not able to analyse these here.
a. Mild, requiring no treatment
Schnabel did not report on this outcome separate from total adverse events (Schnabel 2007).
b. Moderate, requiring treatment
Schnabel reported an equal number of adverse effects observed in all the treatment arms with the commonest adverse effect being pulmonary exacerbations as reported above (Analysis 4.14).
c. Life‐threatening or severe (requiring hospitalisation)
There was no significant difference in the severe adverse effects reported between the two comparison groups, or for severe adverse events, RR 0.88 (95% CI 0.27 to 2.83; P = 0.83) (Analysis 4.15).
6. Cost
This outcome is not reported in the Schnabel trial (Schnabel 2007).
Discussion
Summary of main results
Eight trials with a total 275 participants were included in the review. Seven trials used a standard dose of rhGH of approximately 0.3 mg/kg/week compared with no treatment (Hardin 2001; Hardin 2005a; Hardin 2005b; Hardin 2006; Hütler 2002; Schibler 2003; Stalvey 2012); one of these trials had three treatment arms and compared placebo, standard dose (0.3 mg/kg/week) and high dose (0.5 mg/kg/week) (Schnabel 2007). The intervention was administered by daily subcutaneous injections. Six trials included participants for a minimum of 12 months in the randomised phase followed by either open‐label administration for a longer period or clinical follow‐up without treatment administration. The review includes data up to 12 months for these trials (Hardin 2001; Hardin 2005a; Hardin 2005b; Hardin 2006; Schibler 2003; Stalvey 2012). Two included trials had a randomised phase lasting for six months only (Hütler 2002; Schnabel 2007), while two other 12‐month trials also reported data at six months (Hardin 2001; Schibler 2003). Data from the open‐label phase were not included in the analysis or the review.
The most important indicator of the pulmonary prognosis in CF is FEV1. In the trial comparing standard‐dose, high‐dose and placebo, there was no statistically significant change in the pulmonary parameters at six months (Analysis 1.1; Analysis 1.2; Analysis 1.3; Analysis 3.1; Analysis 3.2; Analysis 3.3) (Schnabel 2007). Similar results were seen in the rhGH versus no treatment group at six months as well as the absolute measurements of FEV1 and FVC (Analysis 2.1; Analysis 2.3). However, there was a statistically significant difference in the change in FEV1 and FVC at 12 months as compared to baseline in the rhGH versus no treatment groups, albeit with significant heterogeneity in the results (Analysis 2.2; Analysis 2.4).
The association between severity of lung disease and body growth, nutritional status and LBM in CF is well established in multiple studies. Individuals with higher anthropometric parameters and LBM are known to have better pulmonary function. There was a statistically significant improvement in at least one of the height measurements at six and 12 months for all comparisons (Analysis 1.5; Analysis 2.7; Analysis 2.8; Analysis 2.9; Analysis 3.4; Analysis 3.5; Analysis 4.4; Analysis 4.5). Weight and LBM were reported as outcomes only in the comparison of rhGH versus no treatment, both of the outcomes showed statistically significant improvements in the rhGH group in trials that enrolled pre‐pubertal participants (Analysis 2.11; Analysis 2.15). Whilst the improvement in the anthropometric parameters is encouraging, this improvement is expected in the first year of rhGH administration. As none of the trials were longer than one year, it is not known whether this will continue with longer‐term administration of rhGH. There was no statistically significant change in QoL with rhGH therapy (Analysis 2.16).
A statistically significant difference was seen in the measured insulin levels in the rhGH treated group compared to no treatment (Analysis 2.17). There was a significant difference in FBG levels between the groups in all comparisons (Analysis 1.8; Analysis 2.18; Analysis 3.8; Analysis 4.8), but this may not be clinically meaningful as none of the participants crossed the threshold for the diagnosis of diabetes. Other measures of blood glucose regulation such as PPBG levels (Analysis 1.9; Analysis 2.19; Analysis 3.9; Analysis 4.9), Hemoglobin A1c (Analysis 2.20), or the change from baseline in Hemoglobin A1c (Analysis 2.21) were similar across the two treatment groups.
Exercise capacity was measured in three trials in different formats (measurements of exercise capacity, VO2 max or six‐minute walk test) and showed significant improvement in the rhGH‐treated participants compared to those receiving no treatment (Analysis 2.22; Analysis 2.23). However, there was unclear evidence from other comparisons of any beneficial treatment effect (Analysis 1.10; Analysis 1.11; Analysis 2.24; Analysis 3.10; Analysis 3.11; Analysis 4.10; Analysis 4.11).
As expected, an increase was noted in the serum levels of IGF‐1 and IGFBP‐3 when rhGH was administered (Analysis 1.12; Analysis 3.12; Analysis 3.13; Analysis 4.12; Analysis 4.13). There was no significant difference in adverse effects of therapy in any of the comparisons (Analysis 1.15; Analysis 2.27; Analysis 3.15; Analysis 4.15). A statistically significant decrease in hospitalisations was reported in three trials at 12 months (Analysis 2.26). Pulmonary exacerbations were measured in one trial at six months and did not show a significant difference between standard dose or high‐dose of rhGH as compared to placebo (Analysis 1.14; Analysis 3.14; Analysis 4.14). It is possible that the benefit of therapy from rhGH requires a longer duration of therapy. No systematic assessment of cost‐effectiveness was performed by any trial, and there is unclear evidence on this measure at this time.
No evidence of a difference in outcomes was found between the standard‐dose versus high‐dose in one under‐powered trial (Schnabel 2007), except for IGF‐1 (Analysis 4.12) and IGFBP3 levels (Analysis 4.13).
Overall completeness and applicability of evidence
The small number of participants in each of the trials limits the overall completeness and ultimately the generalisation of the evidence to the wider CF population. The majority of the trials excluded those with pre‐existing diabetes or those with impaired glucose intolerance. It is known that rhGH can cause disturbances in glucose metabolism and people with CF have a high incidence of CFRD which increases with age. The exclusion of these people introduced selection bias and limits the external validity of the evidence.
In clinical practice, rhGH is given to pre‐pubertal adolescents for longer than one year. Therefore, the short duration and follow‐up of the included trials in this review does not allow complete assessment of the effects of the treatment in a clinical context.
Quality of the evidence
Overall, there was very low to low‐certainty of evidence to support the outcomes assessed in this review, primarily due to the small size of the trials and absence of the details that would allow assessment of risk of bias, such as sequence generation, allocation concealment and absence of blinding in the participants and absence of information on the blinding at the time of statistical analysis (summary of findings Table 1; summary of findings Table 2; summary of findings Table 3; summary of findings Table 4).
Limitations in trial design and implementation
The key factors that are likely to have had a degree of impact on the certainty of the evidence for the outcomes sought in this review can be linked to the design and implementation of the included trials, and in particular to the effective concealment of the allocation sequence and adequate blinding of investigators and outcome assessors. The absence of a placebo and blinding in most of the trials increases the risk of performance and detection bias. It was not possible to blind the control group due to the invasive nature of the treatment. The review captured objective outcomes such as pulmonary function tests, nutritional parameters, blood glucose changes, serum hormone levels and disease status. It is postulated that these outcomes have a low risk of bias despite the absence of a placebo or blinding. The impact of a lack of blinding cannot be ruled out on subjective outcomes such as QoL and exercise capacity.
The duration of the endpoints in the trials included in this review was up to 12 months, which is not reflective of clinical practice. Administration of rhGH causes acceleration of growth in the first year of administration, but it is unclear whether this effect will be sustained. It is also not clear whether participants in the control group will achieve the same height and weight without therapy if followed up for a longer time period.
Indirectness of the evidence
Although the participants in the included trials were a general representative sample as defined in the inclusion criteria, trials consistently excluded children with impaired glucose tolerance or pre‐existing diabetes. It is well known that the prevalence of diabetes in the CF population is larger than in the general population and by the age of 30, the prevalence rate has been estimated as 50% (O'Riordan 2010). Therefore, we have concerns that the findings here may not be indicative of the effects of the intervention on this population. For more details of the populations investigated and the directness of participants identified in the review (see 'Characteristics of included studies').
Imprecision of results
The trials identified for inclusion in this systematic review considered only two doses of rhGH; across these trials, there were a number of outcomes that were measured and indeed able to be pooled. Heterogeneity occurred in a number of analyses, but this was likely to be due to the small number of included trials. In the data which we present, the precision of the estimates could be determined by the width of the CI surrounding it, relative to the distance from a null effect. There was a clear effect and little inconsistency for the following outcomes: height; weight; LBM; and IGF‐1 and IGFBP3 levels. There are hints of improvement in pulmonary function in the trials that measured these outcomes at 12 months. It is possible that the short duration of administration is not enough to capture the beneficial effects (if any) of rhGH therapy. Only a single trial was included in the first, third and fourth comparisons, so we advise caution when interpreting these results since they reflect few participants.
Inconsistency of the results
The small number of trials that investigated the effect of rhGH compared to no treatment did permit some pooling of data. Therefore, any inferences about the inconsistency of the results could only be drawn from this comparison. Most of the meta‐analyses carried out for this comparison illustrated a low degree of unexplained heterogeneity and allowed us to conclude that the differences in treatment effect seen between the trials may not be important. In the instances where heterogeneity was considered to potentially impact on the findings, additional sensitivity analyses were carried out as described in Chapter 9 of the Cochrane Handbook for Systematic Reviews of Interventions (Deeks 2011), where the overall treatment benefit would be concluded on the basis of both the original and subsequent sensitivity analysis findings.
Publication bias
Although all effort was made to search for unpublished data, it is possible that unpublished trials with unfavourable results may not have been identified in the search, which could potentially alter the results of the review. Three of the included trials were funded in part by industry‐sponsored grants. We were unable to contact the authors of the trials to understand the process of funding and whether industry support was limited to the supply of the medication or extended to statistical and analysis support. We were also unable to contact authors of unpublished trials listed in the database http://clinical trials.gov.
In view of the low number of trials included in this review an assessment of publication bias was not possible.
Potential biases in the review process
We made every attempt to limit bias in the review process by ensuring a comprehensive search for potentially eligible trials. The authors’ independent assessments of eligibility of trials for inclusion in this review and the extraction of data minimized the potential for additional bias beyond that detailed in the 'Risk of bias in included studies' tables. The incompleteness of some of the reports and our inability to obtain clarification of certain trial details or to resolve ambiguities in the reports may have contributed to some bias in their assessment, but where these conditions applied, this was explicitly stated in the text of our review. The effects of language bias on the identification and selection of studies for inclusion in a systematic review is widely recognised and therefore we ensured that any trials that were not in the English language were translated so that they could be assessed for eligibility.
Agreements and disagreements with other studies or reviews
A systematic review on the use of rhGh in people with CF was commissioned by the Agency for Health Care Research and Quality (AHRQ), United States of America (Phung 2010). The searches undertaken were without language or publication status restrictions. The review design followed the standard PRISMA protocol and used a standardised data extraction form completed independently by two review authors. However, the details of the format and risk of bias analysis of the included trials are not available for review. All the trials included in the Phung review were graded as 'low risk of bias' although details of randomisation, allocation concealment, blinding of participants and outcome assessors are not available for most of the included trials. For our review, the search strategy was wider in including Web of Science and Scopus and online trials registries to identify ongoing trials. We have presented detailed information on the trials in the risk of bias analysis which makes the assessment of the outcome results more robust.
In the Phung review, 10 controlled trials and eight observational studies were included. The results of retrospective and observational studies, whilst providing valuable information on a range of clinical variables, do not constitute reliable high‐level evidence for the effects of the interventions considered in this review. In addition to the controlled trials we have included in our review, Phung included one trial which was retrospective (Hardin 2005c) and another which used glutamine in addition to rhGH (Darmaun 2004). We disagree with the inclusion of these two trials and pooling of data in the analysis. It is to be noted that participants in the Darmaun trial received intravenous glutamine prior to receiving rhGH for a duration of four weeks (Darmaun 2004). The inclusion of these data with the other trials in a meta‐analysis is not appropriate due to the varying duration of treatment. Additionally, combining data reported at six months and 12 months is not appropriate. We identified substantial heterogeneity when such an analysis was attempted and have chosen to present the data for six months and 12 months in different subgroups. The quality of nine out of 10 controlled trials included in the AHRQ review was assessed as "fair" based on the validity assessment of the EPC guide. There are no details of the assessment of the individual trials in that review based on the criteria of the EPC guidelines; unlike the assessment of those trials included in this review (Figure 3). We agree with the assessment of the trials that appear in both reviews. One trial was assessed by both the reviews to be of high quality (Schnabel 2007), whilst all others were assessed as fair.
However, despite the differences in the conduct of the two reviews, the results were similar. It is acknowledged that the role of rhGH in the care of people with CF is unclear at this point. Phung reported improvements in height, weight and bone mineral capacity and some improvements in pulmonary functions (Phung 2010). We have also found improvements in anthropometric data at 12 months and hints of change in FEV1 and FVC when compared to baseline levels. We would like to emphasize that the only improvement noticed in both the reviews in pulmonary function is small and the generalisation of this result as "rhGH improved almost all intermediate results of pulmonary functions, height and weight in patients with CF" may be misleading (Phung 2010). The lack of information on the effects of rhGH on blood glucose (FBG, PPBG and random blood glucose levels), haemoglobin A1c, IGF‐1 and IGFBP3 as well as long‐term side effects are acknowledged.
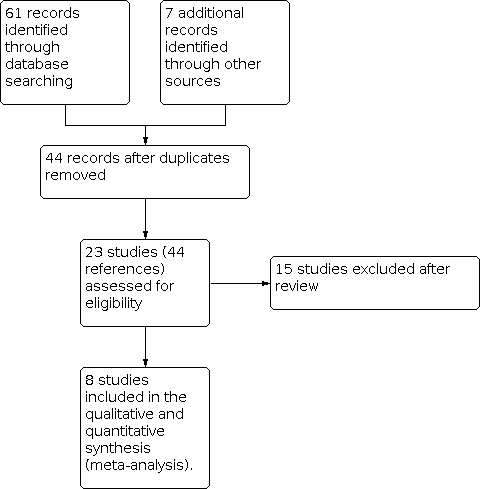
Study flow diagram.

Risk of bias graph: review authors' judgements about each risk of bias item presented as percentages across all included studies.

Risk of bias summary: review authors' judgements about each risk of bias item for each included study.

Comparison 1: Standard rhGH versus placebo, Outcome 1: FEV1 (% predicted) change from baseline

Comparison 1: Standard rhGH versus placebo, Outcome 2: FEV1 (Z‐score) change from baseline

Comparison 1: Standard rhGH versus placebo, Outcome 3: FVC (% predicted) change from baseline

Comparison 1: Standard rhGH versus placebo, Outcome 4: Height (z score)

Comparison 1: Standard rhGH versus placebo, Outcome 5: Height velocity (cm/year)

Comparison 1: Standard rhGH versus placebo, Outcome 6: Weight change from baseline (kg)

Comparison 1: Standard rhGH versus placebo, Outcome 7: Lean body mass (kg) ‐ change from baseline

Comparison 1: Standard rhGH versus placebo, Outcome 8: Fasting blood glucose (mg/dL)

Comparison 1: Standard rhGH versus placebo, Outcome 9: Postprandial blood glucose (mg/dL)

Comparison 1: Standard rhGH versus placebo, Outcome 10: Exercise capacity (watts)

Comparison 1: Standard rhGH versus placebo, Outcome 11: VO2 max (mL/min)

Comparison 1: Standard rhGH versus placebo, Outcome 12: Insulin like growth factor (IGF‐1) (Z‐score)

Comparison 1: Standard rhGH versus placebo, Outcome 13: IGFBP‐3 (z score)

Comparison 1: Standard rhGH versus placebo, Outcome 14: Number of pulmonary exacerbations

Comparison 1: Standard rhGH versus placebo, Outcome 15: Adverse effects

Comparison 2: Standard rhGH versus no treatment, Outcome 1: FEV1 (% predicted)

Comparison 2: Standard rhGH versus no treatment, Outcome 2: FEV1 change from baseline

Comparison 2: Standard rhGH versus no treatment, Outcome 3: FVC (% predicted)

Comparison 2: Standard rhGH versus no treatment, Outcome 4: FVC change from baseline

Comparison 2: Standard rhGH versus no treatment, Outcome 5: Peak inspiratory pressure (PIP), mm Hg

Comparison 2: Standard rhGH versus no treatment, Outcome 6: Peak expiratory pressure (mm Hg)

Comparison 2: Standard rhGH versus no treatment, Outcome 7: Height (z score)

Comparison 2: Standard rhGH versus no treatment, Outcome 8: Height (cm) change from baseline

Comparison 2: Standard rhGH versus no treatment, Outcome 9: Height velocity (cm/year)

Comparison 2: Standard rhGH versus no treatment, Outcome 10: Height percentile rank

Comparison 2: Standard rhGH versus no treatment, Outcome 11: Weight (z score)

Comparison 2: Standard rhGH versus no treatment, Outcome 12: Weight (kg) change from baseline

Comparison 2: Standard rhGH versus no treatment, Outcome 13: Weight velocity (kg/year)

Comparison 2: Standard rhGH versus no treatment, Outcome 14: Weight percentile rank

Comparison 2: Standard rhGH versus no treatment, Outcome 15: Lean body mass change (kg)

Comparison 2: Standard rhGH versus no treatment, Outcome 16: Quality of life

Comparison 2: Standard rhGH versus no treatment, Outcome 17: Plasma insulin level (μU/mL)

Comparison 2: Standard rhGH versus no treatment, Outcome 18: Fasting blood glucose (mg/dL)

Comparison 2: Standard rhGH versus no treatment, Outcome 19: Postprandial blood glucose (mg/dL)

Comparison 2: Standard rhGH versus no treatment, Outcome 20: Hemoglobin A1c (%)

Comparison 2: Standard rhGH versus no treatment, Outcome 21: Change in haemoglobin A1c from baseline (%)

Comparison 2: Standard rhGH versus no treatment, Outcome 22: Exercise capacity (watts)

Comparison 2: Standard rhGH versus no treatment, Outcome 23: VO2 max

Comparison 2: Standard rhGH versus no treatment, Outcome 24: Six‐minute walk test (m) change from baseline

Comparison 2: Standard rhGH versus no treatment, Outcome 25: IGF‐1 level (ng/dL)

Comparison 2: Standard rhGH versus no treatment, Outcome 26: Hospitalisation

Comparison 2: Standard rhGH versus no treatment, Outcome 27: Adverse events

Comparison 3: High‐dose rhGH versus placebo, Outcome 1: FEV1 (% predicted)

Comparison 3: High‐dose rhGH versus placebo, Outcome 2: FEV1 (z score) change from baseline

Comparison 3: High‐dose rhGH versus placebo, Outcome 3: FVC (% predicted)

Comparison 3: High‐dose rhGH versus placebo, Outcome 4: Height velocity (z score)

Comparison 3: High‐dose rhGH versus placebo, Outcome 5: Height velocity (cm/year)

Comparison 3: High‐dose rhGH versus placebo, Outcome 6: Weight (kg) change from baseline

Comparison 3: High‐dose rhGH versus placebo, Outcome 7: Lean body mass (kg)

Comparison 3: High‐dose rhGH versus placebo, Outcome 8: Fasting blood glucose (mg/dL)

Comparison 3: High‐dose rhGH versus placebo, Outcome 9: Postprandial blood glucose (mg/dL)

Comparison 3: High‐dose rhGH versus placebo, Outcome 10: Exercise capacity (watts)

Comparison 3: High‐dose rhGH versus placebo, Outcome 11: VO2 max (mL/min)

Comparison 3: High‐dose rhGH versus placebo, Outcome 12: IGF‐1 (z score)

Comparison 3: High‐dose rhGH versus placebo, Outcome 13: IGFBP‐3 (z score)

Comparison 3: High‐dose rhGH versus placebo, Outcome 14: Number of pulmonary exacerbations

Comparison 3: High‐dose rhGH versus placebo, Outcome 15: Adverse effects

Comparison 4: High‐dose rhGH versus standard dose rhGH, Outcome 1: FEV1 (% predicted)

Comparison 4: High‐dose rhGH versus standard dose rhGH, Outcome 2: FEV1 (z score) change from baseline

Comparison 4: High‐dose rhGH versus standard dose rhGH, Outcome 3: FVC (% predicted)

Comparison 4: High‐dose rhGH versus standard dose rhGH, Outcome 4: Height velocity (z score)

Comparison 4: High‐dose rhGH versus standard dose rhGH, Outcome 5: Height velocity (cm/year)

Comparison 4: High‐dose rhGH versus standard dose rhGH, Outcome 6: Weight (kg) change from baseline

Comparison 4: High‐dose rhGH versus standard dose rhGH, Outcome 7: Lean body mass (kg)

Comparison 4: High‐dose rhGH versus standard dose rhGH, Outcome 8: Fasting blood glucose (mg/dL)

Comparison 4: High‐dose rhGH versus standard dose rhGH, Outcome 9: Post‐prandial blood glucose (mg/dL)

Comparison 4: High‐dose rhGH versus standard dose rhGH, Outcome 10: Exercise capacity (watts)

Comparison 4: High‐dose rhGH versus standard dose rhGH, Outcome 11: VO2 max (mL/min)

Comparison 4: High‐dose rhGH versus standard dose rhGH, Outcome 12: IGF‐1 (z score)

Comparison 4: High‐dose rhGH versus standard dose rhGH, Outcome 13: IGFBP‐3 (z score)

Comparison 4: High‐dose rhGH versus standard dose rhGH, Outcome 14: Number of pulmonary exacerbations

Comparison 4: High‐dose rhGH versus standard dose rhGH, Outcome 15: Adverse effects
| Standard rhGH compared with placebo for children and young adults with CF | ||||||
| Patient or population: children and young adults with CF Settings: outpatient Intervention: standard rhGH Comparison: placebo | ||||||
| Outcomes | Illustrative comparative risks* (95% CI) | Relative effect | No of Participants | Quality of the evidence | Comments | |
|---|---|---|---|---|---|---|
| Assumed risk | Corresponding risk | |||||
| Placebo | Standard rhGH | |||||
| FEV1 (% predicted) change since baseline Follow‐up: 6 months | The mean (SD) change in FEV1 % predicted since baseline in the control group was 1% (23%). | The mean change in FEV1 % predicted in the standard rhGH group was 2.50% higher (8.60 lower to 13.60 higher). | ‐ | 43 participants | ⊕⊕⊝⊝ | No significant differences were found between treatment groups. |
| FVC (% predicted) change since baseline Follow‐up: 6 months | The mean (SD) change in FVC % predicted from baseline in the control group was ‐0.70% (15.1%). | The mean change in FVC (% predicted) in the standard rhGH group was 3.80% higher | ‐ | 43 participants | ⊕⊕⊝⊝ | No significant differences were found between treatment groups. |
| Height velocity (cm/year) Follow‐up: 6 months | The mean (SD) height velocity in the control group was 3.5 (2.3) cm/year. | The mean height velocity in the standard rhGH group was 2.1 cm/year higher (0.54 lower to 3.66 higher). | ‐ | 43 participants | ⊕⊕⊝⊝ | Height velocity (change in height measured in cm/year) showed significant improvement in those receiving standard rhGH; however, there was no statistically significant difference in the height z score between treatment groups. |
| Weight (kg) Change from baseline Follow‐up: 6 months | The mean (SD) change from baseline in weight in the control group was 1.4 (1.7) kg. | The mean change in weight in the standard rhGH group was 1.00 kg higher (‐0.08 lower to 2.08 higher). | ‐ | 43 participants | ⊕⊕⊝⊝ low1,2 | No significant differences were found between the two treatment groups. |
| QoL Follow‐up: 6 months | See comments. | ⊕⊝⊝⊝ very low1,2,3 | Schnabel used standardised CF HRQoL questionnaires and reported no major differences among the treatment groups (no data available for analysis). | |||
| Fasting blood glucose (mg/dL) Follow‐up: 6 months | The mean (SD) fasting blood glucose level in the control group was 88.8 (13.7) mg/dL. | The mean fasting blood glucose level in the standard rhGH group was 12.40 mg/dL higher (3.76 higher to 21.04 higher). | ‐ | 43 participants | ⊕⊕⊝⊝ | Statistically significant difference found in favour of the standard rhGH group. |
| Number of pulmonary exacerbations or hospitalisations Follow‐up: 6 months | 182 pulmonary exacerbations per 1000 participants. | 273 pulmonary exacerbations per 1000 participants (89 to 835). | RR 1.50 | 44 participants | ⊕⊕⊝⊝ | RR greater than 1 indicates an advantage for placebo. |
| *The basis for the assumed risk (e.g. the median control group risk across studies) is provided in footnotes. The corresponding risk (and its 95% CI) in the standard rhGH group is based on the assumed risk in the comparison group and the relative effect of the intervention (and its 95% CI). CF: cystic fibrosis;CI: confidence interval; FEV1 : forced expiratory volume at one second; FVC: forced vital capacity; HRQoL: health‐related quality of life; N/A: not applicable; QoL: quality of life; rhGH: recombinant growth hormone; RR: risk ratio; SD: standard deviation. | ||||||
| GRADE Working Group grades of evidence | ||||||
| 1. Downgraded due to unclear risk of bias due to lack of detail on generation of allocation sequence, allocation concealment, incomplete outcome data and support from a pharmaceutical company. 2. Downgraded due to small sample size and wide CIs. 3. Downgraded due to lack of data for analysis. | ||||||
| Standard rhGH compared with no treatment for children and young adults with CF | ||||||
| Patient or population: children and young adults with CF Settings: outpatient Intervention: standard rhGH Comparison: no treatment | ||||||
| Outcomes | Illustrative comparative risks* (95% CI) | Relative effect | No of Participants | Quality of the evidence | Comments | |
|---|---|---|---|---|---|---|
| Assumed risk | Corresponding risk | |||||
| No treatment | Standard rhGH | |||||
| FEV1(% predicted) Follow‐up: 12 months | The mean change in FEV1 % predicted in the control group was ‐0.4 (4.1). | The mean change in FEV1 % predicted) in the intervention group was 0.29 higher (0.62 lower to 1.19 higher). | ‐ | 19 participants (1 study) | ⊕⊝⊝⊝ | No statistically significant difference between treatment groups. The change in FEV1`(L) was reported by 2 trials (n = 75) and showed a significantly greater increase in the standard rhGH group, SMD 0.74 (95% CI 0.26 to 1.22). |
| FVC (% predicted) Follow‐up: 12 months | The mean (SD) change in FVC % predicted in the control group was 0.4 (2.5) (‐0.1 to 0.4). | The mean change in FVC % predicted in the intervention group was 1.00 higher (0.03 higher to 1.96 higher). | ‐ | 19 participants (1 study) | ⊕⊝⊝⊝very low1,2,3 | Statistically significant difference found in favour of the standard rhGH group. The change in FVC (L) was reported by 2 trials (n = 75) and showed a significantly greater increase in the standard rhGH group, SMD 1.61 (95% CI 0.17 to 3.06). |
| Height velocity (cm/year) Follow‐up: 12 months | The mean (range) height velocity in the control group was 4.47 (3.71 to 5.3) cm/year. | The mean height in the intervention group was 3.53 cm/year higher (2.77 higher to 4.30 higher). | ‐ | 156 participants (4 studies) | ⊕⊝⊝⊝ | Statistically significant difference found in favour of the standard rhGH group. There was a similar result in favour of the rhGH treatment group in height z score measured at the end of the trial, MD 0.58 (95% CI 0.36 to 0.80). |
| Weight (kg) Change from baseline Follow‐up: 12 months | The mean (range) change in weight from baseline in the control group was 1.75 kg (0.7 to 2.8). | The mean change in weight in the intervention group was 1.00 kg higher (0.32 lower to 1.68 higher). | ‐ | 62 participants (1 study) | ⊕⊝⊝⊝ very low1,2,3 | A separate study found no statistically significant difference between the two groups in change from baseline (kg) at six months. In relation to weight velocity, results were consistently significantly higher in the rhGH group at 12 months. |
| QoL Change from baseline Follow‐up: 12 months | The mean (SD) change from baseline in HRQoL score in the control group was 0.3 (0.8). | The mean change from baseline in HRQoL score in the intervention group was 0.10 higher (0.32 lower to 0.52 higher). | ‐ | 57 participants | ⊕⊝⊝⊝ | No statistically significant difference found between treatment groups; however, the same trial reported a significant difference in Body Image Score favouring rhGH. |
| Fasting blood glucose (mg/dL) Follow‐up: 12 months | The mean (range) fasting blood glucose in the control group was 93.33 mg/dL (88.90 mg/dL to 101.00 mg/dL). | The mean fasting blood glucose in the intervention group was 3.2 mg/dL higher (6.09 mg/dL lower to 12.49 mg/dL higher). | ‐ | 92 participants (3 studies) | ⊕⊝⊝⊝ | No statistically significant difference found between the two groups. |
| Number of pulmonary exacerbations or hospitalisations | The mean (range) number of hospitalisations in the control group was 2.70 (2.2 to 3.0). | The mean number of hospitalisations in the intervention group was 1.34 lower (1.75 lower to 0.93 lower). | ‐ | 94 participants (3 studies) | ⊕⊝⊝⊝ | Statistically significant difference found in favour of the standard rhGH group. The episodes of hospitalisations were reported as mean and SD between the 2 groups in these studies. The total number of hospitalisations in each group are not available to calculate RR. |
| *The basis for the assumed risk (e.g. the median control group risk across studies) is provided in footnotes. The corresponding risk (and its 95% CI) is based on the assumed risk in the comparison group and the relative effect of the intervention (and its 95% CI). CF: cystic fibrosis;CI: confidence interval; FEV1 : forced expiratory volume at 1 second; FVC: forced vital capacity; HRQoL: health‐related quality of life; N/A: not applicable; QoL: quality of life; rhGH: recombinant growth hormone; RR: risk ratio; SD: standard deviation. | ||||||
| GRADE Working Group grades of evidence | ||||||
| 1. Downgraded due to unclear risk of bias for generation of allocation sequence, allocation concealment and selective reporting 2. Downgraded due to high risk of bias for blinding or incomplete outcome data or support from a pharmaceutical company (or combination of these) . 3. Downgraded due to small sample size and wide CIs. | ||||||
| High‐dose rhGH compared to placebo for children and young adults with CF | ||||||
| Patient or population: children and young adults with CF | ||||||
| Outcomes | Illustrative comparative risks* (95% CI) | Relative effect | No of participants | Quality of the evidence | Comments | |
|---|---|---|---|---|---|---|
| Assumed risk | Corresponding risk | |||||
| Placebo | High‐dose rhGH | |||||
| FEV1 (% predicted) Change from baseline Follow‐up: 6 months | The mean (SD) change from baseline in FEV1 % predicted in the control group was 1.0 (23.0)% predicted. | The mean change from baseline in FEV1 % predicted in the intervention group was 3.30% higher (8.16% lower to 14.76% higher). | ‐ | 41 participants | ⊕⊕⊝⊝ | No statistically significant difference found between treatment groups. |
| FVC (% predicted) Change from baseline Follow‐up: 6 months | The mean (SD) change from baseline in FVC % predicted in the control group was ‐0.70 (15.10) % predicted. | The mean change from baseline in FVC % predicted in the intervention group was 6.70% higher (1.41% lower to 14.81% higher). | ‐ | 41 participants | ⊕⊕⊝⊝ | No statistically significant difference found between treatment groups. |
| Height velocity (cm/year) Follow‐up: 6 months | The mean (SD) height velocity in the control group was 3.5 (2.3) cm/year. | The mean height velocity in the intervention group was 3.30 cm/year higher (1.17 higher to 5.43 higher). | ‐ | 41 participants | ⊕⊕⊝⊝ | Statistically significant difference found in favour of the standard rhGH group. A similarly significant result was also seen in the height z score at the end of the study. |
| Weight (kg) Change from baseline Follow‐up: 6 months | The mean (SD) change in weight from baseline in the control group was 1.4 (1.7) kg. | The mean change in weight in the intervention group was 0.80 kg higher (0.44 lower to 2.04 higher). | 41 participants | ⊕⊕⊝⊝ | No statistically significant difference found between treatment groups. | |
| QoL Follow‐up: 6 months | See comments | 41 participants | ⊕⊝⊝⊝ | Schnabel reported QoL using standardised CF HRQoL questionnaires, but did not provide data we could enter into the analysis; the published paper reported no major differences between the treatment groups. | ||
| Fasting blood glucose (mg/dL) Follow‐up: 6 months | The mean (SD) fasting blood glucose in the control group was 88.8 (13.7) mg/dL. | The mean fasting blood glucose in the intervention group was 8.00 mg/dL higher (0.30 mg/dL lower to 16.3 mg/dL higher). | ‐ | 41 participants | ⊕⊕⊝⊝ | No statistically significant difference found between treatment groups |
| Number of pulmonary exacerbations or hospitalisations Follow‐up: 6 months | 182 pulmonary exacerbations per 1,000 participants. | 350 pulmonary exacerbations per 1,000 participants (120 to 1021). | RR 1.92 (0.66 to 5.61) | 42 participants | ⊕⊕⊝⊝ | RR over 1 indicates an advantage for placebo. |
| *The risk in the intervention group (and its 95% CI) is based on the assumed risk in the comparison group and the relative effect of the intervention (and its 95% CI). CF: cystic fibrosis; CI: confidence interval; FEV1 : forced expiratory volume at 1 second; FVC: forced vital capacity; HRQoL: health‐related quality of life; N/A: not applicable; QoL: quality of life; rhGH: recombinant growth hormone; RR: risk ratio; SD: standard deviation. | ||||||
| GRADE Working Group grades of evidence | ||||||
| 1. Downgraded due to unclear risk of bias due to lack of detail on generation of allocation sequence, allocation concealment, incomplete outcome data and support from a pharmaceutical company. 2. Downgraded due to small sample size and wide CIs. 3. Downgraded due to lack of data for analysis. | ||||||
| High‐dose rhGH compared to standard dose rhGH for children and young adults with CF | ||||||
| Patient or population: children and young adults with CF | ||||||
| Outcomes | Illustrative comparative risks* (95% CI) | Relative effect | No of participants | Quality of the evidence | Comments | |
|---|---|---|---|---|---|---|
| Assumed risk | Corresponding risk | |||||
| Standard‐dose rhGH | High‐dose rhGH | |||||
| FEV1 (% predicted) Change from baseline Follow‐up: 6 months | The mean (SD) absolute change from baseline in FEV1 % predicted in the standard‐dose group was 5.60 (2.90)% predicted. | The mean absolute change from baseline in FEV1 % predicted in the high‐dose group was 1.20% higher (1.04% lower to 3.44% higher). | ‐ | 42 participants | ⊕⊕⊝⊝ | No statistically significant difference found between treatment groups. This was also true for FEV1 z score. |
| FVC (% predicted) Change from baseline Follow‐up: 6 months | The mean (SD) absolute change from baseline in FVC % predicted in the standard‐dose group was ‐0.70 (15.1) % predicted. | The mean absolute change from baseline in FVC % predicted in the high‐dose group was 6.70% higher (1.29% lower to 14.69% higher). | ‐ | 42 participants | ⊕⊕⊝⊝ | No statistically significant difference found between treatment groups. |
| Height velocity (cm/year) Follow‐up: 6 months | The mean (SD) change from baseline in height velocity in the standard‐dose group was 5.6 (2.9) cm/year. | The mean change from baseline in height velocity in the high‐dose group was 1.20 cm/year higher (1.04 lower to 3.44 higher). | ‐ | 42 participants | ⊕⊕⊝⊝ | No statistically significant difference found between treatment groups. Also no difference between groups in height velocity z score. |
| Weight (kg) Change from baseline Follow‐up: 6 months | The mean (SD) change from baseline in weight in the standard‐dose group was 2.4 (1.9) kg. | The mean change from baseline in weight in the high‐dose group was 0.2 kg lower (1.48 kg lower to 1.08 kg higher). | 42 participants | ⊕⊕⊝⊝ | No statistically significant difference found between treatment groups. | |
| QoL | Not reported. | N/A | ||||
| Fasting blood glucose (mg/dL) Follow‐up: 6 months | The mean (SD) fasting blood glucose level in the standard‐dose group was 101.20 (15.2) mg/dL. | The mean fasting blood glucose level in the high‐dose group was 4.40 mg/dL lower (13.05 mg/dL lower to 4.25 mg/dL higher). | ‐ | 42 participants | ⊕⊕⊝⊝ | No statistically significant difference found between treatment groups. |
| Number of pulmonary exacerbations or hospitalisations Follow‐up: 6 months | 273 pulmonary exacerbations per 1000 participants. | 350 pulmonary exacerbations per 1000 participants (142 to 868). | RR 1.28 | 42 participants | ⊕⊕⊝⊝ | RR greater than 1 indicates an advantage for standard rhGH. |
| *The risk in the intervention group (and its 95% CI) is based on the assumed risk in the comparison group and the relative effect of the intervention (and its 95% CI). | ||||||
| GRADE Working Group grades of evidence | ||||||
| 1. Downgraded due to unclear risk of bias for generation of allocation sequence, concealment of allocation, lack of blinding of outcome assessment, incomplete outcome data and support from a pharmaceutical company. 2. Downgraded due to small sample size. | ||||||
| Outcome or subgroup title | No. of studies | No. of participants | Statistical method | Effect size |
| 1.1 FEV1 (% predicted) change from baseline Show forest plot | 1 | Mean Difference (IV, Random, 95% CI) | Subtotals only | |
| 1.1.1 At 6 months | 1 | 43 | Mean Difference (IV, Random, 95% CI) | 2.50 [‐8.60, 13.60] |
| 1.2 FEV1 (Z‐score) change from baseline Show forest plot | 1 | Mean Difference (IV, Random, 95% CI) | Subtotals only | |
| 1.2.1 At 6 months | 1 | 43 | Mean Difference (IV, Random, 95% CI) | 0.00 [‐0.23, 0.23] |
| 1.3 FVC (% predicted) change from baseline Show forest plot | 1 | Mean Difference (IV, Random, 95% CI) | Subtotals only | |
| 1.3.1 At 6 months | 1 | 43 | Mean Difference (IV, Random, 95% CI) | 3.80 [‐4.67, 12.27] |
| 1.4 Height (z score) Show forest plot | 1 | Mean Difference (IV, Random, 95% CI) | Subtotals only | |
| 1.4.1 At 6 months | 1 | 43 | Mean Difference (IV, Random, 95% CI) | 2.50 [‐0.77, 5.77] |
| 1.5 Height velocity (cm/year) Show forest plot | 1 | Mean Difference (IV, Random, 95% CI) | Subtotals only | |
| 1.5.1 At 6 months | 1 | 43 | Mean Difference (IV, Random, 95% CI) | 2.10 [0.54, 3.66] |
| 1.6 Weight change from baseline (kg) Show forest plot | 1 | Mean Difference (IV, Random, 95% CI) | Subtotals only | |
| 1.6.1 At 6 months | 1 | 43 | Mean Difference (IV, Random, 95% CI) | 1.00 [‐0.08, 2.08] |
| 1.7 Lean body mass (kg) ‐ change from baseline Show forest plot | 1 | Mean Difference (IV, Random, 95% CI) | Subtotals only | |
| 1.7.1 At 6 months | 1 | 43 | Mean Difference (IV, Random, 95% CI) | 1.00 [‐0.40, 2.40] |
| 1.8 Fasting blood glucose (mg/dL) Show forest plot | 1 | Mean Difference (IV, Random, 95% CI) | Subtotals only | |
| 1.8.1 At 6 months | 1 | 43 | Mean Difference (IV, Random, 95% CI) | 12.40 [3.76, 21.04] |
| 1.9 Postprandial blood glucose (mg/dL) Show forest plot | 1 | Mean Difference (IV, Random, 95% CI) | Subtotals only | |
| 1.9.1 At 6 months | 1 | 43 | Mean Difference (IV, Random, 95% CI) | 12.10 [‐7.18, 31.38] |
| 1.10 Exercise capacity (watts) Show forest plot | 1 | Mean Difference (IV, Random, 95% CI) | Subtotals only | |
| 1.10.1 At 6 months | 1 | 43 | Mean Difference (IV, Random, 95% CI) | 9.80 [‐0.90, 20.50] |
| 1.11 VO2 max (mL/min) Show forest plot | 1 | Mean Difference (IV, Random, 95% CI) | Subtotals only | |
| 1.11.1 At 6 months | 1 | 43 | Mean Difference (IV, Random, 95% CI) | 10.10 [‐3.85, 24.05] |
| 1.12 Insulin like growth factor (IGF‐1) (Z‐score) Show forest plot | 1 | Mean Difference (IV, Random, 95% CI) | Subtotals only | |
| 1.12.1 At 6 months | 1 | 43 | Mean Difference (IV, Random, 95% CI) | 1.37 [0.68, 2.06] |
| 1.13 IGFBP‐3 (z score) Show forest plot | 1 | Mean Difference (IV, Random, 95% CI) | Subtotals only | |
| 1.13.1 At 6 months | 1 | 43 | Mean Difference (IV, Random, 95% CI) | 0.65 [‐0.10, 1.40] |
| 1.14 Number of pulmonary exacerbations Show forest plot | 1 | Risk Ratio (M‐H, Random, 95% CI) | Subtotals only | |
| 1.14.1 At 6 months | 1 | 44 | Risk Ratio (M‐H, Random, 95% CI) | 1.50 [0.49, 4.59] |
| 1.15 Adverse effects Show forest plot | 1 | Risk Ratio (M‐H, Random, 95% CI) | Subtotals only | |
| 1.15.1 Any adverse effects | 1 | 44 | Risk Ratio (M‐H, Random, 95% CI) | 1.08 [0.67, 1.72] |
| 1.15.2 Severe adverse effects | 1 | 44 | Risk Ratio (M‐H, Random, 95% CI) | 1.25 [0.39, 4.05] |
| Outcome or subgroup title | No. of studies | No. of participants | Statistical method | Effect size |
| 2.1 FEV1 (% predicted) Show forest plot | 3 | Std. Mean Difference (IV, Random, 95% CI) | Subtotals only | |
| 2.1.1 At 12 months | 3 | 93 | Std. Mean Difference (IV, Random, 95% CI) | ‐0.22 [‐0.65, 0.21] |
| 2.2 FEV1 change from baseline Show forest plot | 4 | Std. Mean Difference (IV, Fixed, 95% CI) | Subtotals only | |
| 2.2.1 At 6 months | 2 | 29 | Std. Mean Difference (IV, Fixed, 95% CI) | ‐0.31 [‐1.06, 0.44] |
| 2.2.2 At 12 months | 3 | 94 | Std. Mean Difference (IV, Fixed, 95% CI) | 0.64 [0.21, 1.06] |
| 2.3 FVC (% predicted) Show forest plot | 3 | Mean Difference (IV, Random, 95% CI) | Subtotals only | |
| 2.3.1 At 12 months | 3 | 93 | Mean Difference (IV, Random, 95% CI) | 3.05 [‐9.50, 15.60] |
| 2.4 FVC change from baseline Show forest plot | 3 | Std. Mean Difference (IV, Random, 95% CI) | Subtotals only | |
| 2.4.1 At 6 months | 1 | 19 | Std. Mean Difference (IV, Random, 95% CI) | 0.43 [‐0.48, 1.34] |
| 2.4.2 At 12 months | 3 | 94 | Std. Mean Difference (IV, Random, 95% CI) | 1.32 [0.55, 2.10] |
| 2.5 Peak inspiratory pressure (PIP), mm Hg Show forest plot | 1 | Mean Difference (IV, Random, 95% CI) | Subtotals only | |
| 2.5.1 At 12 months | 1 | 19 | Mean Difference (IV, Random, 95% CI) | ‐21.00 [‐28.69, ‐13.31] |
| 2.6 Peak expiratory pressure (mm Hg) Show forest plot | 1 | Mean Difference (IV, Random, 95% CI) | Subtotals only | |
| 2.6.1 At 12 months | 1 | 28 | Mean Difference (IV, Random, 95% CI) | 23.00 [16.89, 29.11] |
| 2.7 Height (z score) Show forest plot | 4 | Mean Difference (IV, Random, 95% CI) | Subtotals only | |
| 2.7.1 At 12 months | 4 | 131 | Mean Difference (IV, Random, 95% CI) | 0.58 [0.36, 0.80] |
| 2.8 Height (cm) change from baseline Show forest plot | 1 | Mean Difference (IV, Random, 95% CI) | Subtotals only | |
| 2.8.1 At 6 months | 1 | 10 | Mean Difference (IV, Random, 95% CI) | 1.40 [‐0.07, 2.87] |
| 2.9 Height velocity (cm/year) Show forest plot | 4 | Mean Difference (IV, Random, 95% CI) | Subtotals only | |
| 2.9.1 At 6 months | 2 | 76 | Mean Difference (IV, Random, 95% CI) | 4.51 [2.21, 6.81] |
| 2.9.2 At 12 months | 4 | 156 | Mean Difference (IV, Random, 95% CI) | 3.53 [2.77, 4.30] |
| 2.10 Height percentile rank Show forest plot | 1 | Mean Difference (IV, Random, 95% CI) | Subtotals only | |
| 2.10.1 At 12 months | 1 | 19 | Mean Difference (IV, Random, 95% CI) | 12.20 [10.84, 13.56] |
| 2.11 Weight (z score) Show forest plot | 4 | Mean Difference (IV, Random, 95% CI) | Subtotals only | |
| 2.11.1 At 6 months | 1 | 19 | Mean Difference (IV, Random, 95% CI) | ‐0.10 [‐0.21, ‐0.00] |
| 2.11.2 At 12 months | 4 | 88 | Mean Difference (IV, Random, 95% CI) | 0.48 [‐0.07, 1.03] |
| 2.12 Weight (kg) change from baseline Show forest plot | 2 | Mean Difference (IV, Random, 95% CI) | Subtotals only | |
| 2.12.1 At 6 months | 1 | 10 | Mean Difference (IV, Random, 95% CI) | 1.00 [‐0.22, 2.22] |
| 2.12.2 At 12 months | 1 | 62 | Mean Difference (IV, Random, 95% CI) | 1.00 [0.18, 1.82] |
| 2.13 Weight velocity (kg/year) Show forest plot | 3 | Mean Difference (IV, Random, 95% CI) | Subtotals only | |
| 2.13.1 At 6 months | 2 | 76 | Mean Difference (IV, Random, 95% CI) | 3.12 [1.27, 4.97] |
| 2.13.2 At 12 months | 3 | 94 | Mean Difference (IV, Random, 95% CI) | 2.82 [1.53, 4.10] |
| 2.14 Weight percentile rank Show forest plot | 1 | Mean Difference (IV, Random, 95% CI) | Subtotals only | |
| 2.14.1 At 12 months | 1 | 19 | Mean Difference (IV, Random, 95% CI) | 5.50 [4.02, 6.98] |
| 2.15 Lean body mass change (kg) Show forest plot | 7 | Mean Difference (IV, Random, 95% CI) | Subtotals only | |
| 2.15.1 At 6 months | 3 | 90 | Mean Difference (IV, Random, 95% CI) | 2.57 [2.01, 3.12] |
| 2.15.2 At 12 months (age population pre‐puberty at entry of study) | 5 | 191 | Mean Difference (IV, Random, 95% CI) | 2.12 [1.13, 3.10] |
| 2.15.3 At 12 months (age populations spans pubertal age range) | 1 | 19 | Mean Difference (IV, Random, 95% CI) | 2.50 [1.85, 3.15] |
| 2.16 Quality of life Show forest plot | 1 | Mean Difference (IV, Random, 95% CI) | Subtotals only | |
| 2.16.1 Health Care Quality of Life (HRQOL) score change | 1 | 57 | Mean Difference (IV, Random, 95% CI) | 0.10 [‐0.32, 0.52] |
| 2.16.2 Body Image Score change | 1 | 57 | Mean Difference (IV, Random, 95% CI) | 0.50 [0.03, 0.97] |
| 2.17 Plasma insulin level (μU/mL) Show forest plot | 2 | Mean Difference (IV, Random, 95% CI) | Subtotals only | |
| 2.17.1 At 6 months | 1 | 19 | Mean Difference (IV, Random, 95% CI) | 3.10 [2.40, 3.80] |
| 2.17.2 At 12 months | 2 | 73 | Mean Difference (IV, Random, 95% CI) | 1.55 [‐0.60, 3.70] |
| 2.18 Fasting blood glucose (mg/dL) Show forest plot | 3 | Mean Difference (IV, Random, 95% CI) | Subtotals only | |
| 2.18.1 At 6 months | 1 | 19 | Mean Difference (IV, Random, 95% CI) | 4.00 [‐12.57, 20.57] |
| 2.18.2 At 12 months | 3 | 92 | Mean Difference (IV, Random, 95% CI) | 3.20 [‐6.09, 12.49] |
| 2.19 Postprandial blood glucose (mg/dL) Show forest plot | 2 | Mean Difference (IV, Random, 95% CI) | Subtotals only | |
| 2.19.1 At 6 months | 1 | 19 | Mean Difference (IV, Random, 95% CI) | 5.00 [‐2.20, 12.20] |
| 2.19.2 At 12 months | 2 | 38 | Mean Difference (IV, Random, 95% CI) | ‐10.75 [‐32.74, 11.25] |
| 2.20 Hemoglobin A1c (%) Show forest plot | 1 | Mean Difference (IV, Random, 95% CI) | Subtotals only | |
| 2.20.1 At 6 months | 1 | 19 | Mean Difference (IV, Random, 95% CI) | 0.10 [‐0.44, 0.64] |
| 2.20.2 At 12 months | 1 | 19 | Mean Difference (IV, Random, 95% CI) | ‐0.30 [‐0.66, 0.06] |
| 2.21 Change in haemoglobin A1c from baseline (%) Show forest plot | 1 | Mean Difference (IV, Random, 95% CI) | Subtotals only | |
| 2.21.1 At 12 months | 1 | 19 | Mean Difference (IV, Random, 95% CI) | 0.14 [‐0.30, 0.58] |
| 2.22 Exercise capacity (watts) Show forest plot | 1 | Mean Difference (IV, Random, 95% CI) | Subtotals only | |
| 2.22.1 At 6 months | 1 | 19 | Mean Difference (IV, Random, 95% CI) | 23.10 [15.58, 30.62] |
| 2.22.2 At 12 months | 1 | 19 | Mean Difference (IV, Random, 95% CI) | 31.90 [22.68, 41.12] |
| 2.23 VO2 max Show forest plot | 2 | Mean Difference (IV, Random, 95% CI) | Subtotals only | |
| 2.23.1 At 6 months (mL/min) | 1 | 10 | Mean Difference (IV, Random, 95% CI) | 3.65 [0.60, 6.70] |
| 2.23.2 At 12 months (mL/kg/min) | 1 | 19 | Mean Difference (IV, Random, 95% CI) | 6.10 [4.29, 7.91] |
| 2.24 Six‐minute walk test (m) change from baseline Show forest plot | 1 | Mean Difference (IV, Random, 95% CI) | Subtotals only | |
| 2.24.1 At 12 months | 1 | 56 | Mean Difference (IV, Random, 95% CI) | 25.90 [‐43.57, 95.37] |
| 2.25 IGF‐1 level (ng/dL) Show forest plot | 3 | Mean Difference (IV, Random, 95% CI) | Subtotals only | |
| 2.25.1 At 6 months | 1 | 19 | Mean Difference (IV, Random, 95% CI) | 152.00 [62.89, 241.11] |
| 2.25.2 At 12 months | 3 | 69 | Mean Difference (IV, Random, 95% CI) | 198.17 [135.59, 260.74] |
| 2.26 Hospitalisation Show forest plot | 3 | Mean Difference (IV, Random, 95% CI) | Subtotals only | |
| 2.26.1 At 12 months | 3 | 94 | Mean Difference (IV, Random, 95% CI) | ‐1.34 [‐1.75, ‐0.93] |
| 2.27 Adverse events Show forest plot | 1 | Risk Ratio (M‐H, Random, 95% CI) | Subtotals only | |
| 2.27.1 Drug‐related adverse effect | 1 | 68 | Risk Ratio (M‐H, Random, 95% CI) | 18.73 [1.14, 307.37] |
| 2.27.2 Injection‐site bruising | 1 | 68 | Risk Ratio (M‐H, Random, 95% CI) | 13.38 [0.79, 225.34] |
| 2.27.3 Hyperglycaemia | 1 | 68 | Risk Ratio (M‐H, Random, 95% CI) | 0.63 [0.22, 1.80] |
| 2.27.4 Papilledema | 1 | 68 | Risk Ratio (M‐H, Random, 95% CI) | 2.68 [0.11, 63.45] |
| 2.27.5 Headache | 1 | 68 | Risk Ratio (M‐H, Random, 95% CI) | 2.68 [0.11, 63.45] |
| 2.27.6 Death | 1 | 68 | Risk Ratio (M‐H, Random, 95% CI) | 2.68 [0.11, 63.45] |
| Outcome or subgroup title | No. of studies | No. of participants | Statistical method | Effect size |
| 3.1 FEV1 (% predicted) Show forest plot | 1 | Mean Difference (IV, Random, 95% CI) | Subtotals only | |
| 3.1.1 At 6 months | 1 | 41 | Mean Difference (IV, Random, 95% CI) | 3.30 [‐8.16, 14.76] |
| 3.2 FEV1 (z score) change from baseline Show forest plot | 1 | Mean Difference (IV, Random, 95% CI) | Subtotals only | |
| 3.2.1 At 6 months | 1 | 41 | Mean Difference (IV, Random, 95% CI) | ‐0.01 [‐0.24, 0.22] |
| 3.3 FVC (% predicted) Show forest plot | 1 | Mean Difference (IV, Random, 95% CI) | Subtotals only | |
| 3.3.1 At 6 months | 1 | 41 | Mean Difference (IV, Random, 95% CI) | 6.70 [‐1.41, 14.81] |
| 3.4 Height velocity (z score) Show forest plot | 1 | Mean Difference (IV, Random, 95% CI) | Subtotals only | |
| 3.4.1 At 6 months | 1 | 41 | Mean Difference (IV, Random, 95% CI) | 3.60 [0.30, 6.90] |
| 3.5 Height velocity (cm/year) Show forest plot | 1 | Mean Difference (IV, Random, 95% CI) | Subtotals only | |
| 3.5.1 At 6 months | 1 | 41 | Mean Difference (IV, Random, 95% CI) | 3.30 [1.17, 5.43] |
| 3.6 Weight (kg) change from baseline Show forest plot | 1 | Mean Difference (IV, Random, 95% CI) | Subtotals only | |
| 3.6.1 At 6 months | 1 | 41 | Mean Difference (IV, Random, 95% CI) | 0.80 [‐0.44, 2.04] |
| 3.7 Lean body mass (kg) Show forest plot | 1 | Mean Difference (IV, Random, 95% CI) | Subtotals only | |
| 3.7.1 At 6 months | 1 | 41 | Mean Difference (IV, Random, 95% CI) | 0.80 [‐0.67, 2.27] |
| 3.8 Fasting blood glucose (mg/dL) Show forest plot | 1 | Mean Difference (IV, Random, 95% CI) | Subtotals only | |
| 3.8.1 At 6 months | 1 | 41 | Mean Difference (IV, Random, 95% CI) | 8.00 [‐0.30, 16.30] |
| 3.9 Postprandial blood glucose (mg/dL) Show forest plot | 1 | Mean Difference (IV, Random, 95% CI) | Subtotals only | |
| 3.9.1 At 6 months | 1 | 41 | Mean Difference (IV, Random, 95% CI) | 4.60 [‐23.32, 32.52] |
| 3.10 Exercise capacity (watts) Show forest plot | 1 | Mean Difference (IV, Random, 95% CI) | Subtotals only | |
| 3.10.1 At 6 months | 1 | 41 | Mean Difference (IV, Random, 95% CI) | 4.40 [‐13.20, 22.00] |
| 3.11 VO2 max (mL/min) Show forest plot | 1 | Mean Difference (IV, Random, 95% CI) | Subtotals only | |
| 3.11.1 At 6 months | 1 | 41 | Mean Difference (IV, Random, 95% CI) | 24.00 [‐10.61, 58.61] |
| 3.12 IGF‐1 (z score) Show forest plot | 1 | Mean Difference (IV, Random, 95% CI) | Subtotals only | |
| 3.12.1 At 6 months | 1 | 41 | Mean Difference (IV, Random, 95% CI) | 2.03 [1.18, 2.88] |
| 3.13 IGFBP‐3 (z score) Show forest plot | 1 | Mean Difference (IV, Random, 95% CI) | Subtotals only | |
| 3.13.1 At 6 months | 1 | 41 | Mean Difference (IV, Random, 95% CI) | 0.81 [0.11, 1.51] |
| 3.14 Number of pulmonary exacerbations Show forest plot | 1 | Risk Ratio (M‐H, Random, 95% CI) | Subtotals only | |
| 3.14.1 At 6 months | 1 | 42 | Risk Ratio (M‐H, Random, 95% CI) | 1.92 [0.66, 5.61] |
| 3.15 Adverse effects Show forest plot | 1 | Risk Ratio (M‐H, Random, 95% CI) | Subtotals only | |
| 3.15.1 Any adverse effects | 1 | 42 | Risk Ratio (M‐H, Random, 95% CI) | 1.02 [0.62, 1.67] |
| 3.15.2 Severe adverse effects | 1 | 42 | Risk Ratio (M‐H, Random, 95% CI) | 1.10 [0.32, 3.83] |
| Outcome or subgroup title | No. of studies | No. of participants | Statistical method | Effect size |
| 4.1 FEV1 (% predicted) Show forest plot | 1 | Mean Difference (IV, Random, 95% CI) | Subtotals only | |
| 4.1.1 At 6 months | 1 | 42 | Mean Difference (IV, Random, 95% CI) | 1.20 [‐1.04, 3.44] |
| 4.2 FEV1 (z score) change from baseline Show forest plot | 1 | Mean Difference (IV, Random, 95% CI) | Subtotals only | |
| 4.2.1 At 6 months | 1 | 42 | Mean Difference (IV, Random, 95% CI) | ‐0.01 [‐0.20, 0.18] |
| 4.3 FVC (% predicted) Show forest plot | 1 | Mean Difference (IV, Random, 95% CI) | Subtotals only | |
| 4.3.1 At 6 months | 1 | 42 | Mean Difference (IV, Random, 95% CI) | 6.70 [‐1.29, 14.69] |
| 4.4 Height velocity (z score) Show forest plot | 1 | Mean Difference (IV, Random, 95% CI) | Subtotals only | |
| 4.4.1 At 6 months | 1 | 42 | Mean Difference (IV, Random, 95% CI) | 1.10 [‐0.51, 2.71] |
| 4.5 Height velocity (cm/year) Show forest plot | 1 | Mean Difference (IV, Random, 95% CI) | Subtotals only | |
| 4.5.1 At 6 months | 1 | 42 | Mean Difference (IV, Random, 95% CI) | 1.20 [‐1.04, 3.44] |
| 4.6 Weight (kg) change from baseline Show forest plot | 1 | Mean Difference (IV, Random, 95% CI) | Subtotals only | |
| 4.6.1 At 6 months | 1 | 42 | Mean Difference (IV, Random, 95% CI) | ‐0.20 [‐1.48, 1.08] |
| 4.7 Lean body mass (kg) Show forest plot | 1 | Mean Difference (IV, Random, 95% CI) | Subtotals only | |
| 4.7.1 At 6 months | 1 | 42 | Mean Difference (IV, Random, 95% CI) | ‐0.20 [‐1.69, 1.29] |
| 4.8 Fasting blood glucose (mg/dL) Show forest plot | 1 | Mean Difference (IV, Random, 95% CI) | Subtotals only | |
| 4.8.1 At 6 months | 1 | 42 | Mean Difference (IV, Random, 95% CI) | ‐4.40 [‐13.05, 4.25] |
| 4.9 Post‐prandial blood glucose (mg/dL) Show forest plot | 1 | Mean Difference (IV, Random, 95% CI) | Subtotals only | |
| 4.9.1 At 6 months | 1 | 42 | Mean Difference (IV, Random, 95% CI) | ‐7.50 [‐38.36, 23.36] |
| 4.10 Exercise capacity (watts) Show forest plot | 1 | Mean Difference (IV, Random, 95% CI) | Subtotals only | |
| 4.10.1 At 6 months | 1 | 42 | Mean Difference (IV, Random, 95% CI) | ‐5.40 [‐22.96, 12.16] |
| 4.11 VO2 max (mL/min) Show forest plot | 1 | Mean Difference (IV, Random, 95% CI) | Subtotals only | |
| 4.11.1 At 6 months | 1 | 42 | Mean Difference (IV, Random, 95% CI) | 13.90 [‐21.97, 49.77] |
| 4.12 IGF‐1 (z score) Show forest plot | 1 | Mean Difference (IV, Random, 95% CI) | Subtotals only | |
| 4.12.1 At 6 months | 1 | 42 | Mean Difference (IV, Random, 95% CI) | 2.03 [1.18, 2.88] |
| 4.13 IGFBP‐3 (z score) Show forest plot | 1 | Mean Difference (IV, Random, 95% CI) | Subtotals only | |
| 4.13.1 At 6 months | 1 | 42 | Mean Difference (IV, Random, 95% CI) | 0.81 [0.11, 1.51] |
| 4.14 Number of pulmonary exacerbations Show forest plot | 1 | Risk Ratio (M‐H, Random, 95% CI) | Subtotals only | |
| 4.14.1 At 6 months | 1 | 42 | Risk Ratio (M‐H, Random, 95% CI) | 1.28 [0.52, 3.18] |
| 4.15 Adverse effects Show forest plot | 1 | Risk Ratio (M‐H, Random, 95% CI) | Subtotals only | |
| 4.15.1 Any adverse effects | 1 | 42 | Risk Ratio (M‐H, Random, 95% CI) | 0.94 [0.58, 1.52] |
| 4.15.2 Severe adverse effects | 1 | 42 | Risk Ratio (M‐H, Random, 95% CI) | 0.88 [0.27, 2.83] |