Vaccines for preventing herpes zoster in older adults
Abstract
Background
Herpes zoster, also known as 'shingles', is a neurocutaneous disease characterised by the reactivation of the latent varicella zoster virus (VZV), the virus that causes chickenpox when immunity to VZV declines. It is an extremely painful condition that can last many weeks or months and it can significantly compromise the quality of life of affected individuals. The natural process of aging is associated with a reduction in cellular immunity and this predisposes older people to herpes zoster. Vaccination with an attenuated form of VZV activates specific T cell production avoiding viral reactivation. The Food and Drug Administration has approved a herpes zoster vaccine with an attenuated active virus for clinical use among older adults, which has been tested in large populations. A new adjuvanted recombinant VZV subunit zoster vaccine has also been tested. It consists of recombinant VZV glycoprotein E and a liposome‐based AS01B adjuvant system. This new vaccine is not yet available for clinical use.
Objectives
To evaluate the effectiveness and safety of vaccination for preventing herpes zoster in older adults.
Search methods
For this 2015 update, we searched the Cochrane Central Register of Controlled Trials (CENTRAL 2015, Issue 9), MEDLINE (1948 to the 3rd week of October 2015), EMBASE (2010 to October 2015), CINAHL (1981 to October 2015) and LILACS (1982 to October 2015).
Selection criteria
Randomised controlled trials (RCTs) or quasi‐RCTs comparing zoster vaccine with placebo or no vaccine, to prevent herpes zoster in older adults (mean age > 60 years).
Data collection and analysis
Two review authors independently collected and analysed data using a data extraction form. They also performed 'Risk of bias' assessment.
Main results
We identified 13 studies involving 69,916 participants. The largest study included 38,546 participants. All studies were conducted in high‐income countries and included only healthy Caucasian individuals ≥ 60 years of age without immunosuppressive comorbidities. Ten studies used live attenuated varicella zoster virus (VZV) vaccines. Three studies tested a new type of vaccine not yet available for clinical use. We judged five of the included studies to be at low risk of bias.
The incidence of herpes zoster, at up to three years of follow‐up, was lower in participants who received the vaccine than in those who received a placebo: risk ratio (RR) 0.49; 95% confidence interval (CI) 0.43 to 0.56, risk difference (RD) 2%, number needed to treat to benefit (NNTB) 50; GRADE: moderate quality evidence. The vaccinated group had a higher incidence of mild to moderate intensity adverse events. These date came from one large study that included 38,546 people aged 60 years or older.
A study including 8122 participants compared the new vaccine (not yet available) to the placebo; the group that received the new vaccine had a lower incidence of herpes zoster at 3.2 years of follow‐up: RR 0.04, 95% CI 0.02 to 0.10, RD 3%, NNTB 33; GRADE: moderate quality evidence. The vaccinated group had a higher incidence of adverse events but most them were of mild to moderate intensity.
All studies received funding from the pharmaceutical industry.
Authors' conclusions
Herpes zoster vaccine is effective in preventing herpes zoster disease and this protection can last three years. In general, zoster vaccine is well tolerated; it produces few systemic adverse events and injection site adverse events of mild to moderate intensity.
There are studies of a new vaccine (with a VZV glycoproteic fraction plus adjuvant), which is currently not yet available for clinical use.
PICOs
Plain language summary
Vaccines for preventing herpes zoster (shingles) in older adults
Review question
There is a vaccine to prevent shingles. Our objective was to evaluate the effectiveness and safety of the vaccine to prevent shingles in healthy older people.
Background
The varicella zoster virus causes chickenpox and can remain dormant inside nerve cells. After many years, it can reactivate, travel through the nerve to the skin and produce blisters along the nerve path. This is called herpes zoster or shingles. It affects people with low immunity such as older people. Before the blisters, the person may feel itching, numbness, tingling or local pain. Herpes zoster causes inflammation of the nerves and severe pain, which can affect quality of life. There are about 5.22 episodes of herpes zoster for every 1000 older people. This is increasing, in part because people are living longer.
Study characteristics
Our evidence is current to 26 October 2015. We found 13 randomised controlled trials including 69,917 healthy older adults. Only five of the 13 trials were of high quality and had a low risk of bias. Pharmaceutical companies that produce the vaccines funded all of the included studies.
Key results and quality of the evidence
All included studies were conducted in high‐income countries and included only healthy elderly Caucasians (> 60 years) without any immunosuppressive problems.
One big study included 38,546 persons 60 years of age or older. It compared the vaccine with a placebo (fake vaccine). It was a high quality study, which showed that the vaccine is effective in preventing shingles at three years (moderate quality evidence). Adverse effects caused by the vaccine were mostly mild to moderate symptoms at the injection site. Refrigerated vaccines caused fewer injection site adverse effects than frozen vaccines. The injection of the vaccine into the muscle caused fewer adverse effects when it was injected under the skin (subcutaneously). The herpes zoster vaccine caused fewer adverse effects than the 'pneumo 23' vaccine.
A new vaccine, not yet available for clinical use, is being tested. This vaccine contains a small part of varicella zoster virus plus substances that boost the immune response of the body. A study including 8122 participants who were randomised to receive either the new vaccine or a placebo vaccine showed that those in the new vaccine group had fewer episodes of herpes zoster and more mild to moderate adverse events than those in the placebo group (moderate quality evidence).
Authors' conclusions
Summary of findings
| Available live attenuated VZV zoster vaccine versus placebo for preventing herpes zoster in older adults | ||||||
| Patient or population: healthy older adults Settings: outpatients Intervention: available live attenuated VZV zoster vaccine Comparison: placebo | ||||||
| Outcomes | Illustrative comparative risks* (95% CI) | Relative effect | No of participants | Quality of the evidence | Comments | |
| Assumed risk | Corresponding risk | |||||
| Placebo | Available live attenuated VZV zoster vaccine | |||||
| Incidence of herpes zoster Clinical and laboratory criteria | Study population | RR 0.49 | 38,546 | ⊕⊕⊕⊝ | Absolute risk for available live attenuated VZV zoster vaccine = 1.6% Absolute risk for placebo group = 3.3% | |
| 33 per 1000 | 16 per 1000 | |||||
| Participants with AEs: ≥ 1 serious AE regardless of type of storage of the vaccine Clinical and laboratory criteria | Study population | RR 1.08 | 50,896 | ⊕⊕⊕⊝ | Absolute risk for available live attenuated VZV zoster vaccine = 2.3% Absolute risk for placebo group = 2.2% | |
| 22 per 1000 | 23 per 1000 | |||||
| Participants with AEs: hospitalised Number of participants hospitalised | Study population | RR 1.00 | 6616 | ⊕⊕⊕⊝ | Absolute risk for available live attenuated VZV zoster vaccine = 34.1% Absolute risk for placebo group = 34.1% | |
| 341 per 1000 | 341 per 1000 | |||||
| Participants with AEs: injection site AEs Clinical and laboratory criteria | Study population | RR 2.99 (2.75 to 3.26) | 6986 | ⊕⊕⊕⊝ | Absolute risk for available live attenuated VZV zoster vaccine = 47.9% Absolute risk for placebo group = 16.0% | |
| 160 per 1000 | 479 per 1000 | |||||
| Drop‐outs: death Number of deaths | Study population | RR 1.01 | 50,687 | ⊕⊕⊕⊝ | Absolute risk for available live attenuated VZV zoster vaccine = 3.3% Absolute risk for placebo group = 3.2% | |
| 32 per 1000 | 33 per 1000 | |||||
| *The basis for the assumed risk (e.g. the median control group risk across studies) is provided in footnotes. The corresponding risk (and its 95% confidence interval) is based on the assumed risk in the comparison group and the relative effect of the intervention (and its 95% CI). | ||||||
| GRADE Working Group grades of evidence | ||||||
| 1Did not describe random sequence generation. | ||||||
| Adjuvanted recombinant VZV subunit zoster vaccine (not yet available) versus placebo for preventing herpes zoster in older adults | ||||||
| Patient or population: healthy older adults Comparison: placebo | ||||||
| Outcomes | Illustrative comparative risks* (95% CI) | Relative effect | No of participants | Quality of the evidence | Comments | |
| Assumed risk | Corresponding risk | |||||
| Placebo | Adjuvanted recombinant VZV subunit zoster vaccine (not yet available) versus placebo | |||||
| Incidence of herpes zoster 3.2 years follow‐up (≥ 60 yo) Clinical and laboratory criteria | Study population | RR 0.04 (0.02 to 0.1) | 8122 | ⊕⊕⊕⊝ | Absolute risk for adjuvanted recombinant VZV subunit zoster vaccine (not yet available) = 0.2% Absolute risk for placebo group = 3.4% | |
| 34 per 1000 | 2 per 1000 | |||||
| Participants with AEs: any local symptom Clinical criteria | Study population | RR 6.83 (6.30 to 7.42) | 8759 | ⊕⊕⊕⊝ | Absolute risk for adjuvanted recombinant VZV subunit zoster vaccine (not yet available) = 81.5% Absolute risk for placebo group = 11.9% | |
| 119 per 1000 | 815 per 1000 | |||||
| Participants with AEs: serious AEs Clinical and laboratory criteria | Study population | RR 1.01 (0.91 to 1.1) | 15,411 | ⊕⊕⊕⊝ | Absolute risk for adjuvanted recombinant VZV subunit zoster vaccine (not yet available) = 9.0% Absolute risk for placebo group = 8.9% | |
| 89 per 1000 | 90 per 1000 | |||||
| Participants with AEs: potential immune‐mediated disease Clinical and laboratory criteria | Study population | RR 0.81 (0.06 to 1.08) | 15,411 | ⊕⊕⊕⊝ | Absolute risk for adjuvanted recombinant VZV subunit zoster vaccine (not yet available) = 1.0% Absolute risk for placebo group = 1.3% | |
| 13 per 1000 | 10 per 1000 | |||||
| Participants with AEs: deaths Number of deaths Follow‐up: mean 3.2 years | Study population | RR 0.96 (0.78 to 1.19) | 15,411 | ⊕⊕⊕⊝ | Absolute risk for adjuvanted recombinant VZV subunit zoster vaccine (not yet available) = 2.2% Absolute risk for placebo group = 2.3% | |
| 23 per 1000 | 22 per 1000 | |||||
| *The basis for the assumed risk (e.g. the median control group risk across studies) is provided in footnotes. The corresponding risk (and its 95% confidence interval) is based on the assumed risk in the comparison group and the relative effect of the intervention (and its 95% CI). | ||||||
| GRADE Working Group grades of evidence | ||||||
| 1Did not describe allocation concealment and participant flow not clear. | ||||||
Background
Description of the condition
Herpes zoster, or shingles, is a neurocutaneous disease that can be extremely painful. Frequently, the symptoms can last for many weeks or months after complete healing of the lesions (Gilden 2000). It is caused by the reactivation of the varicella zoster virus (VZV) when immunity to VZV declines.
The geographical distribution of VZV indicates that it is a common human pathogen with a worldwide occurrence (Cohen 2007). Although varicella occurs worldwide, the epidemiology of the disease is markedly different in tropical and temperate countries. In temperate countries such as the United Kingdom (UK) and the United States (US), most people have seroconverted to VZV by adolescence (this means that they have had prior contact with the virus and developed antibodies against it). Serological studies of resident tropical populations and of immigrants from tropical countries indicate that seroconversion generally occurs in late adolescence and adulthood (Lee 1998).
The VZV is a highly contagious agent and in the first contact with the virus, usually in childhood, the individual develops chickenpox (varicella). After this, the VZV can remain dormant for years in the dorsal sensory ganglia of the spinal cord. The latency of the virus is maintained by cellular immunity, which inhibits viral replication. Years later, during periods of decreased cell‐mediated immunity or simply because of aging, the virus can replicate in the dorsal sensory ganglia of the spinal cord and migrate along sensory nerves. Prodromal symptoms of viral reactivation include itching, numbness, tingling or severe localised pain, which precede the appearance of skin lesions by one to five days. The typical cutaneous manifestations of an acute herpes zoster episode include clusters of vesicles that spread in a linear pattern along the path of nerves and do not cross the midline of the body (Cohen 2007; Moffat 2007). Within three to five days, these lesions progress to pustules, ulcerations and crusting and go on to heal spontaneously within two to four weeks (Gnann 2002). This disease causes substantial morbidity and has a significant impact on the quality of life of patients (Gnann 2002; Partridge 2009; Sampathkumar 2009). Schmader 2007 conducted a prospective, observational study of 165 outpatients with acute herpes zoster who were enrolled within 14 days of onset of rash. The pain was moderate to severe and discomfort was common during the acute rash phase. Acute herpetic neuralgia was associated with sleep disruption and impaired general activities and enjoyment of life, especially after the onset of the rash, and had a significant impact on the quality of life of the patients.
Older adults (aged > 60 years old) have an increased risk of developing herpes zoster disease (Arvin 1996; Cho 2007; Heymann 2008; Jih 2009; Thomas 2004). Although familial history of herpes zoster suggests possible genetic predisposition to the disease (Cho 2007; Haanpaa 2002), results from available case‐control studies are conflicting (Gatti 2010; Hicks 2008). Due to lengthening lifespans, there are increasing concerns about quality of life for older adults, a growing segment of the population, especially in high‐income countries. In the United States, the annual incidence of herpes zoster increased from 3.10 episodes per 1000 in older adults in 2000 to 5.22 in 2007 (Rimland 2010).
Description of the intervention
Vaccination with an attenuated form of VZV activates specific T cell production, therefore avoiding viral reactivation. A herpes zoster vaccine with an active virus has been approved for clinical use among older adults by the Food and Drug Administration (FDA) and has been tested in large populations (Oxman 2005). A new adjuvanted recombinant VZV subunit zoster vaccine, not yet available for clinical use, has also been tested. It is composed of recombinant VZV glycoprotein E plus a liposome‐based AS01B adjuvant system (Lal 2015).
-
Available live attenuated VZV zoster vaccine: this vaccine contains the same live attenuated virus used in the chickenpox vaccine but it has over 14‐fold more plaque‐forming units (PFUs) of the attenuated virus per dose. Therefore the two vaccines are not interchangeable (Oxman 2005).
-
Adjuvanted recombinant subunit zoster vaccine (not yet clinically available): this other type of vaccine has recently been tested (Leroux‐Roels 2012). It does not contain the live attenuated virus but a small fraction of the virus, which cannot replicate but can boost immunogenicity. This vaccine contains antigen gE (glycoprotein E), which is the most abundant antigen in VZV‐infected cells and the main target for VZV‐specific CD4 + T‐cell response (Arvin 1986). This vaccine also includes adjuvant AS01, which is a liposome‐based adjuvant system containing immunoenhancers 3‐O‐desacyl‐4′‐monophosphoryl lipid A (MPL) plus saponin QS‐21 (Quillaja saponaria Molina, fraction 21) (Baldridge 2004; Kensil 1991). It has not yet been approved for clinical use.
How the intervention might work
Primary infection with VZV induces the production of specific memory T cells in sufficient numbers to keep the virus in its latent form. Host factors such as aging, or other conditions that affect cellular immunity, may reduce T cells to levels that can no longer inhibit viral replication therefore increasing the likelihood of clinical manifestations of the disease.
-
Available live attenuated VZV zoster vaccine: this vaccine, which consists of live attenuated VZV, activates specific T cell production, thus increasing existing immunity and avoiding reactivation of viral replication (Arvin 2005). Several randomised controlled trials (RCTs) have evaluated the efficacy and safety of live attenuated virus vaccine in preventing herpes zoster (Gilderman 2008; Mills 2010; Murray 2011; Oxman 2005; Vermeulen 2012).
-
Adjuvanted recombinant VZV subunit zoster vaccine (not yet available): this new vaccine contains antigen gE (glycoprotein E), which is the most abundant antigen in VZV‐infected cells and the main target for VZV‐specific immunity CD4 + T‐cell response (Arvin 1986). This vaccine also includes adjuvant AS01, which is a liposome‐based adjuvant system containing immunoenhancers 3‐O‐desacyl‐4′‐monophosphoryl lipid A (MPL) plus saponin QS‐21 (Quillaja saponaria Molina, fraction 21) (Baldridge 2004; Kensil 1991). The adjuvant component is important because it helps to elicit an early, high and long‐lasting immune response with less antigen (Rajesh 1995); consequently this leads to additional stimulation of the immune system when it is given with the gE antigen. The new adjuvanted recombinant zoster vaccine improves immune stimulation against VZV and its efficacy and safety have been tested in several RCTs (Chlibek 2013; Chlibek 2014; Lal 2015; Leroux‐Roels 2012).
Why it is important to do this review
Although the incidence of herpes zoster increases with age, prevalence rates differ worldwide (Choi 2010; Hope‐Simpson 1965; Jih 2009; Rimland 2010; Schmader 2008). Every year more than one million new cases are diagnosed in the US (Weaver 2007). The acute episode of herpes zoster can significantly affect the quality of life of affected individuals due to pain, increased risk of depression, anxiety and significantly lower emotional well‐being (Katz 2004).
Herpes zoster also has a significant impact on the health system, particularly among older adults. In addition, the effectiveness of some treatments for herpes zoster is relatively uncertain (Hornberger 2006). Several randomised controlled trials (RCTs) have evaluated the efficacy and safety of vaccines in preventing herpes zoster (Gilderman 2008; Oxman 2005). Recent trials have tested a new adjuvanted recombinant VZV vaccine (Chlibek 2013; Chlibek 2014; Leroux‐Roels 2012). If it is proved that this vaccine is safe and effective, it could be given to immunocompromised people who frequently have herpes zoster (Dolin 1978). Therefore, it is necessary to conduct a systematic review of these trials to critically appraise and synthesise the best available evidence.
This is an update of a Cochrane review first published in 2012 (Gagliardi 2012).
Objectives
To evaluate the effectiveness and safety of vaccination for preventing herpes zoster in older adults.
Methods
Criteria for considering studies for this review
Types of studies
We included RCTs and quasi‐RCTs, regardless of publication date or language.
Types of participants
We included studies involving older adults (mean age ≥ 60 years). We excluded trials involving participants with immunosuppressive disorders.
Types of interventions
We included clinical trials that compared herpes zoster vaccine, of any dose and potency, with at least one of the following comparison groups.
-
Any other type of intervention (for example, varicella vaccine, antiviral medication).
-
Placebo.
-
Nothing (no vaccine).
Types of outcome measures
Primary outcomes
-
Incidence of herpes zoster, diagnosed according to the criteria (clinical and/or laboratory) established by the primary studies.
Secondary outcomes
-
Adverse events: local or systemic reactions (for example, pain, pruritus, swelling, headache) occurring at any time after vaccination.
-
Drop‐outs.
Search methods for identification of studies
Electronic searches
In this 2015 update we searched the Cochrane Central Register of Controlled Trials (CENTRAL 2015, Issue 9), MEDLINE (1948 to October week 3 2015), EMBASE (2010 to October 2015), CINAHL (1981 to October 2015) and LILACS (1982 to October 2015).
We used the search strategy in Appendix 1 to search MEDLINE and CENTRAL. We combined the MEDLINE search with the Cochrane Highly Sensitive Search Strategy for identifying randomised trials in MEDLINE: sensitivity‐ and precision‐maximising version (2008 revision); Ovid format (Lefebvre 2011). We adapted the search strategy to search EMBASE (Appendix 2), LILACS (Appendix 3) and CINAHL (Appendix 4). We imposed no language or publication restrictions.
Searching other resources
We searched two trial registries, the World Health Organization (WHO) International Clinical Trials Registry Platform (ICTRP) and ClinicalTrials.gov, for completed and ongoing studies (latest search 26 October 2015).
We checked the reference lists of relevant studies. We contacted trial authors for additional information and unpublished studies. We checked conference proceedings and thesis banks for unpublished studies. We also contacted vaccine manufacturers for unpublished data.
Data collection and analysis
Selection of studies
Two review authors (AG, BNGS) independently assessed titles and abstracts of all retrieved citations according to our inclusion criteria. We used the Kappa coefficient to test concordance among review authors (Latour 1997). We resolved discrepancies through consensus and consulted a third review author (MRT) in case of disagreements.
Data extraction and management
We created a specific data extraction form for this review to collect relevant information such as study methods, participants, intervention group, control group and outcomes.
Assessment of risk of bias in included studies
We evaluated the methodological quality of each included study in accordance with the criteria established by the Cochrane tool for assessing risk of bias (Higgins 2011). We evaluated the following domains.
-
Random sequence generation (selection bias)
-
Allocation concealment (selection bias)
-
Blinding of participants and personnel (performance bias)
-
Blinding of outcome assessment (detection bias)
-
Incomplete outcome data (attrition bias)
-
Selective reporting (reporting bias)
-
Other bias
We classified each of these domains as 'low risk of bias', 'uncertain risk of bias' or 'high risk of bias'.
Measures of treatment effect
Dichotomous data
For binary data, we calculated the results for each study using the risk ratio (RR) with 95% confidence interval (CI) and number needed to treat for an additional beneficial outcome (NNTB) for efficacy and number needed to treat for an additional harmful outcome (NNTH) for adverse events, where there were statistically significant differences. We entered the data into the Cochrane Review Manager software (RevMan 2014), and conducted meta‐analyses using a random‐effects model.
Continuous data
For outcomes presented in other forms (for example, reported as medians, quartiles, etc.) or without consistent statistical information (despite requests to the trial authors) (for example, standard deviations (SDs), number of patients, etc.), we inserted these data into an additional table.
Unit of analysis issues
The patient was the unit of analysis, including patients undergoing more than one intervention in a cross‐over trial.
Dealing with missing data
For dichotomous data, we performed intention‐to‐treat (ITT) analyses to include all participants randomised to the intervention groups. We contacted trial authors to supply any missing data from the included studies. In studies that did not explain the reasons for withdrawal, we analysed data assuming the worst possible outcome, since imputation of data is a matter of personal judgement (Higgins 2011).
Assessment of heterogeneity
We assessed the consistency of results through visual inspection of the forest plots and by calculating the I2 statistic (Higgins 2003), which estimates the proportion of variation in point estimates that is due to heterogeneity rather than sampling error. We assumed substantial (significant) heterogeneity when the I2 statistic was > 50%. We analysed data using a fixed‐effect model, but if there was significant heterogeneity between studies, we used the random‐effects model.
Assessment of reporting biases
It was not necessary to prepare a funnel plot since we included fewer than 10 studies in the meta‐analysis.
Data synthesis
For dichotomous variables we calculated the RR and for continuous variables we calculated the mean difference (MD), when studies reported their results in the same units of measurement. When continuous data were reported in different units, we pooled the data through standardised mean differences (SMDs). For all statistical methods used to pool data, we used 95% CIs.
GRADE and 'Summary of findings' table
We created a 'Summary of findings' table using the following outcomes: incidence of herpes zoster, adverse events and drop‐outs. We used the five GRADE considerations (study limitations, consistency of effect, imprecision, indirectness and publication bias) (Atkins 2004), in order to assess the quality of the body of evidence as it relates to the studies that contribute data to the meta‐analyses for the prespecified outcomes (Guyatt 2006a; Guyatt 2006b). We used the methods and recommendations described in Section 8.5 and Chapter 12 of the Cochrane Handbook for Systematic Reviews of Interventions (Higgins 2011). We used GRADEpro GDT software (GRADEpro GDT 2015). We justified all decisions to downgrade or upgrade the quality of studies using footnotes, and we made comments to aid the reader's understanding of the review where necessary.
Factors that can reduce the quality of the evidence (downgrade) include:
-
limitations in study design or execution (risk of bias): lower by one or two levels;
-
inconsistency of results: lower by one or two levels;
-
indirectness of evidence: lower by one or two levels;
-
imprecision: lower by one or two levels;
-
publication bias: lower by one or two levels.
Factors that can increase the quality of the evidence (upgrade) include:
-
large magnitude of effect: upgrade by one or two levels;
-
all plausible confounding that would reduce the demonstrated effect or increase the effect if no effect was observed: upgrade by one level;
-
dose‐response gradient: upgrade by one level.
Based on those factors, for each outcome, the quality of evidence is classified as: 'high quality evidence', ' moderate quality evidence', 'low quality evidence' or 'very low quality evidence' (Schünemann 2011):
-
high quality evidence: RCTs or double‐upgraded observational studies;
-
moderate quality evidence: downgraded RCTs or upgraded observational studies;
-
low quality evidence: double‐downgraded RCTs or observational studies;
-
very low quality evidence: triple‐downgraded RCTs or downgraded observational studies; or case series/case reports.
Subgroup analysis and investigation of heterogeneity
We grouped results from studies according to methodological and clinical aspects, such as vaccine dosage (plaque‐forming units (pfu) per dose), vaccine conservation method (refrigerated or frozen), participant age, previous episode of herpes zoster and simultaneous administration of other vaccines.
Sensitivity analysis
Where possible, we performed sensitivity analyses. We investigated the impact of quasi‐RCTs, studies with lower methodological quality and unpublished data on the results of the review.
Results
Description of studies
In this 2015 review update, we included 13 RCTs published in 20 papers (Berger 1998; Chlibek 2013; Chlibek 2014; Diez‐Domingo 2015; Gilderman 2008; Lal 2015; Levin 2000; Mills 2010; Murray 2011; Oxman 2005; Tyring 2007; Vermeulen 2012; Vesikari 2013). Only Mills 2010 used a cross‐over design and reported data separately for patients 50 to 59 years and 60 or older; we only included data pertaining to the older participants of this study. The Lal 2015 study presented efficacy data by age and in theory we would be able to use these data for participants aged 60 or over. However, the authors replied that safety data per age were not yet available and we therefore used the data provided for participants 50 years of age or more.
Results of the search
In the first publication of this review, we searched five databases (CENTRAL, MEDLINE, EMBASE, CINAHL and LILACS) and identified 467 citations, which reduced to 328 after excluding duplicates (Gagliardi 2012). Of these, we selected 19 citations for full‐text reading, which reported on 14 RCTs. We excluded six of these trials and included eight in the review (corresponding to 13 published references). In the clinical trials registry platforms, we identified three ongoing studies as of 25 June 2012.
In this 2015 update we searched the same five databases: CENTRAL (2015, Issue 3); MEDLINE (1948 to October week 3 2015), EMBASE (2010 to October 2015), CINAHL (1981 to October 2015) and LILACS (1982 to October 2015) and we identified a total of 101 references. After excluding the references examined in the initial search and duplicated references, we identified 72 newly published records. After analysis of titles and abstracts, we excluded 65 records and selected seven for full‐text reading: we included six of these and excluded one because it did not involve older people (Leroux‐Roels 2012). One of the newly included studies had two publications (European Geriatric Medicine 2013;4 (Suppl):81‐141 and Vaccine 2015;33(6):789‐95) (Diez‐Domingo 2015). Since we considered both publications as being one study, a total of five new studies are included in this update (Chlibek 2013; Chlibek 2014; Diez‐Domingo 2015; Lal 2015; Vesikari 2013). Figure 1 depicts the complete process of study identification and selection of all studies (including those included in the first publication of this review).

Study flow diagram 2015 update
We identified 11 ongoing studies in the trial registry platforms (ClinicalTrials.gov site and the International Clinical Trials Registry Platform (ICTRP)) on 15 November 2015. The detailed steps of the whole process of selection of studies are shown in Figure 1.
Included studies
The 13 included trials enrolled a total of 69,916 participants.
Available live attenuated VZV zoster vaccine
We included 10 trials (53,381 participants) reporting on the live attenuated VZV zoster vaccine. All of them assessed the safety of the vaccine and only Oxman 2005 also evaluated its efficacy. Four studies compared the vaccine with placebo (Mills 2010; Murray 2011; Oxman 2005; Vermeulen 2012), one study compared it with pneumo 23 vaccine (Berger 1998), and another study compared different routes of administration (intramuscular versus subcutaneous; Diez‐Domingo 2015). One study assessed different forms of vaccine conservation (refrigerated and frozen; Gilderman 2008); another study compared live versus inactivated virus (Levin 2000). One trial tested different amounts of the virus (higher‐potency zoster vaccine to lower‐potency zoster vaccine; Tyring 2007), and another compared two doses of a zoster vaccine versus a single dose and also two doses given at different intervals (Vesikari 2013). The most important study was Oxman 2005, which included 38,546 participants and evaluated the efficacy and safety of zoster vaccine versus placebo and performed a more detailed safety investigation, with voluntary (not randomised) participation of patients. This study followed participants for an average of five years.
Investigators reported adverse events at various time intervals after inoculation of the zoster vaccine: 28 days (Gilderman 2008; Mills 2010; Vesikari 2013), 35 days (Diez‐Domingo 2015), 42 days (Berger 1998; Oxman 2005; Tyring 2007; Vermeulen 2012), and serious side effects until 182 days after the vaccination (Murray 2011). Vermeulen 2012 reported adverse events within six months after the second vaccination.
Adjuvanted recombinant VZV subunit zoster vaccine (not yet available)
We included three studies on a new zoster vaccine that it not yet available for clinical use. These studies involved a total of 16,535 participants (Chlibek 2013; Chlibek 2014; Lal 2015). Both Chlibek 2013 and Chlibek 2014 evaluated adverse effects. The first study compared four groups that received either lower or higher volumes of adjuvants plus gE subunit VZV or unadjuvanted gE or saline injections. The second trial compared adverse events in three groups of VZV plus gE in three different quantities, one group that received unadjuvanted gE and one group that received only saline. The third study assessed the efficacy and safety of the new vaccine versus placebo (Lal 2015).
The adverse effects were monitored for approximately one year after last vaccination (Chlibek 2013), and 36 months after last dose (Chlibek 2014). Lal 2015 is a ongoing study.
Excluded studies
We excluded the following seven studies.
-
Hayward 1994, Hayward 1996 and Patterson‐Bartlett 2007: RCTs evaluating zoster vaccine focused on immunogenicity, without any clinical outcomes.
-
Irwin 2007: a RCT that tested another intervention (Tai Chi) and not the zoster vaccine.
-
Kerzner 2007: a RCT evaluating zoster vaccine administered concomitantly with influenza vaccine.
-
Leroux‐Roels 2012: a RCT evaluating zoster vaccine, but including participants outside the age range of interest (55 to 57 years).
-
Macaladad 2007: a RCT evaluating zoster vaccine, but including participants outside the age range of interest (adults less than 60 years).
Risk of bias in included studies
Details of the 'Risk of bias' assessment for each trial are shown in the Characteristics of included studies section. The overall risk of bias is presented graphically in Figure 2 and summarised in Figure 3. We categorised Chlibek 2013, Diez‐Domingo 2015, Lal 2015, Oxman 2005, Vermeulen 2012 and Vesikari 2013 as having a low risk of bias. All of these studies had at least five of the eight domains categorised as 'low risk of bias', thus fulfilling the criteria recommended by Cochrane for establishing that a study is at low risk of bias.

'Risk of bias' graph: review authors' judgements about each risk of bias item presented as percentages across all included studies.
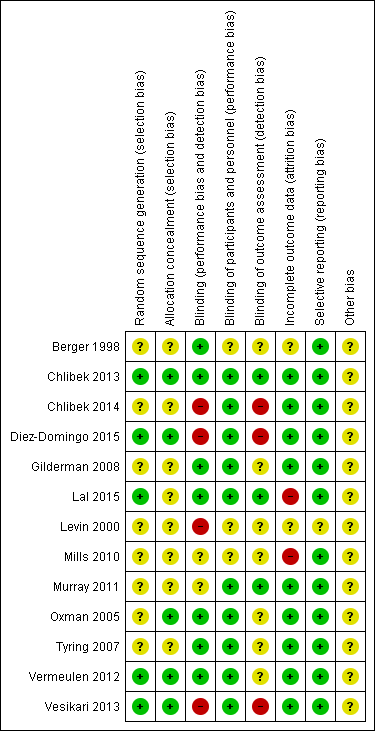
'Risk of bias' summary: review authors' judgements about each risk of bias item for each included study.
See Table 1 for the complete evaluation of the risk of bias of included studies.
| Domain | Risk of bias |
| Allocation (selection bias): randomisation criteria | We graded 5 studies as having a low risk of bias for random sequence generation (selection bias) because they described how the randomisation was done (Chlibek 2013; Diez‐Domingo 2015; Lal 2015; Vermeulen 2012; Vesikari 2013). Chlibek 2013 stated that "Randomization was made using an algorithm that stratified by country, minimized for age, and included a block size of 11". In Diez‐Domingo 2015: "The subjects were randomised using an electronic case report form (e‐CRF)". Lal 2015 stated that "We randomly assigned participants in a 1:1 ratio to receive either vaccine or placebo using an online centralized randomization system". Vermeulen 2012 stated that "Subjects were randomised in a 1:1 ratio to receive two doses of either zoster vaccine or placebo, according to a computer‐generated, study‐centre specific allocation schedule". Vesikari 2013 used "blocks of randomisation, with stratification by age (70–79 y and ≥ 80 y) and country". The other 8 trials provided no details on the randomisation process and we therefore classified them as having an unclear risk of bias for this domain (Berger 1998; Chlibek 2014; Gilderman 2008; Levin 2000; Mills 2010; Murray 2011; Oxman 2005; Tyring 2007). |
| Allocation (selection bias): allocation criteria | We classified Chlibek 2013, Diez‐Domingo 2015, Lal 2015, Oxman 2005, Vermeulen 2012 and Vesikari 2013 as having low risk of bias because of adequate allocation concealment described by the trial authors as follows. Chlibek 2013: "Treatments were allocated at each site using a central randomisation system on the Internet". Diez‐Domingo 2015: "Allocation schedules were generated using a 1:1 ratio with permuted blocks of 4‐6". Lal 2015: "Participants were stratified according to region and age group (50 to 59, 60 to 69, and ≥70 years)". Oxman 2005: "Each study site received randomly ordered vials of zoster vaccine and placebo in separate boxes for each age stratum". Vermeulen 2012: "Allocation numbers were assigned sequentially by the study site personnel to subjects who met the study eligibility criteria, beginning with the lowest number available at the study centre, after informed consent and medical history had been obtained. The allocation schedule was generated by a sponsor statistician not otherwise associated with the zoster vaccine program". Vesikari 2013: "The allocation schedule was generated using balanced permuted blocks of randomisation" Berger 1998, Chlibek 2014, Gilderman 2008, Levin 2000, Mills 2010, Murray 2011 and Tyring 2007 did not report details of allocation concealment and we therefore classified these trials as having an 'unclear' risk of bias for this domain. |
| Blinding (performance bias and detection bias) | 8 trials were double‐blind and we considered them at low risk for this domain (Berger 1998; Chlibek 2013; Gilderman 2008; Lal 2015; Murray 2011; Oxman 2005; Tyring 2007; Vermeulen 2012). The Berger 1998 trial had 4 arms: 3 received different concentrations of a live attenuated VZV/Oka vaccine under double‐blind conditions. The 4th arm used a pneumococcal polysaccharide vaccine as a control for reactogenicity and immune response, under single‐blind conditions Chlibek 2013 stated that "Both vaccine recipients and observers responsible for evaluations were blinded to which formulation was administered". Gilderman 2008 included the following comment: "Double‐blind, with in‐house blinding. The vaccine and placebo were indistinguishable from each other." Lal 2015 reported "Because the appearance of the reconstituted HZ/su vaccine differed from the placebo solution, injections were prepared and administered by study staff who did not participate in any study assessment." In Murray 2011, the authors reported that "The zoster vaccine and placebo were reconstituted with sterile diluent immediately prior to administration, and were indistinguishable from each other in appearance. Placebo was the vaccine stabiliser of zoster vaccine with no live virus. An independent Data Monitoring Committee was established for continuous safety oversight during the study." Oxman 2005 provided the following statement: "Since the reconstituted zoster vaccine had a different appearance from the placebo, reconstitution and administration were performed by technicians who did not otherwise interact with subjects, evaluate outcomes or adverse events, answer the telephone or enter study data." Tyring 2007 states "Blinded subject, investigator and sponsor. The 2 potency formulations were indistinguishable in appearance". Vermeulen 2012 declares that "The subject, investigator, clinical study site personnel, and sponsor personnel directly involved in the study were blinded to whether the subject received zoster vaccine or placebo. They remained blinded until all subjects completed the study. The clinical materials were prepared by an unblinded vaccine coordinator at each clinical site, because of differences in the turbidity of the study vaccine and placebo. Each vial of vaccine or placebo was labelled with a subject‐specific allocation number. The unblinded vaccine coordinator reconstituted the study vaccine/placebo and wrapped the syringe in an opaque label containing subject allocation number and time of reconstitution. The unblinded vaccine coordinator did not have any contact with the subject and did not disclose the contents of the syringe to the person administering the study vaccine/placebo." We classified 3 trials as having a 'low risk of bias' only for the domain "blinding of participants and personnel (performance bias)" although "personnel were not blinded" because the participants themselves were blinded and they were the ones who described adverse events in diary cards (Chlibek 2014; Diez‐Domingo 2015; Vesikari 2013). Please see below: Chlibek 2014 described: "solicited local reactions (pain, redness and swelling) and general reactions (fatigue, fever, headache and myalgia) were recorded by subjects on diary cards for seven days after each vaccination". Diez‐Domingo 2015 stated: "Between visit 1 and 2, the participants were given a diary card to record their temperature if they were febrile (oral temperature ≥38.3 ◦C), occurrence of any solicited injection‐site (erythema, swelling and pain) adverse reactions (Days 0–4) and any unsolicited injection‐site adverse reactions, varicella, varicella‐like rashes, HZ and zoster‐like rashes and other systemic adverse events (AEs) (Days 0–28). They were also asked to report any serious AEs (SAEs) that occurred at any time during the study". Vesikari 2013 provided the following description: "Solicited injection‐site reactions (erythema, swelling, and pain) occurring within 4 days of vaccination were recorded by participants in a diary card. Other injection‐site reactions and systemic AEs were recorded in the diary card for up to 28 d following each vaccination." 1 trial was an open study and we considered it to be at high risk of bias for blinding (Levin 2000). We classified Mills 2010 as 'unclear risk of bias' because the authors did not provide any information on blinding. |
| Incomplete outcome data (attrition bias) | We classified Chlibek 2013, Chlibek 2014, Diez‐Domingo 2015, Gilderman 2008, Murray 2011, Oxman 2005, Tyring 2007, Vermeulen 2012 and Vesikari 2013 as 'low risk' in this domain because the flow of patients was clear. Mills 2010 had no data on the first arm of the cross‐over study and we therefore classified it as 'high risk'. We also classified Lal 2015 as high risk of bias because the patient flow is not clear. We classified Berger 1998 and Levin 2000 as 'unclear risk' as they did not provide any information for this domain. |
| Selective reporting (reporting bias) | We classified the following studies as 'low risk' in this domain. In Berger 1998, the adverse events originally defined by the authors were presented for all groups. Chlibek 2013 presented the adverse events originally defined by the authors in all groups that received 2 doses of 2 different amounts of adjuvant plus gE subunit VZV, unadjuvanted gE or saline. Chlibek 2014 also presented the adverse events associated with 2 doses of different amounts of adjuvanted gE, unadjuvanted gE or saline. Diez‐Domingo 2015 presented all adverse events proposed in the methodology in both groups (intramuscular versus subcutaneous zoster vaccine). Gilderman 2008 reported all adverse events that the investigators selected, for both groups (refrigerated versus frozen zoster vaccines). In Lal 2015, the data for efficacy and safety of the adjuvanted recombinant zoster vaccine proposed in the methods were described in the results. Mills 2010 described in the results all of the adverse events listed in the methods. Murray 2011 presented in the results all the serious adverse events that were defined in the methods section. Oxman 2005 reported in the results all the data on effectiveness and adverse events that the authors proposed in their methodology. Tyring 2007 provided in the results all the adverse events defined in the methods section, for both higher‐potency and lower‐potency zoster vaccines. Vermeulen 2012 described in their results all adverse events listed by the authors in the methods for both groups and Vesikari 2013 reported all the data that had been proposed in their methodology in the results section, for the 3 groups who received 2 doses of zoster vaccines given at different times or a single dose. We classified Levin 2000 as having an 'unclear' risk of bias for this domain because it was basically a study that analysed immune response. |
| Other potential sources of bias | We did not identify any significant aspects pertaining to this domain. |
Allocation
Randomisation criteria
We graded five studies as having a low risk of bias for random sequence generation (selection bias) because they described how the randomisation was done (Chlibek 2013; Diez‐Domingo 2015; Lal 2015; Vermeulen 2012; Vesikari 2013). See Table 1 for more details.
Allocation criteria
We classified Chlibek 2013, Diez‐Domingo 2015, Lal 2015, Oxman 2005, Vermeulen 2012 and Vesikari 2013 as having a low risk of bias because of adequate allocation concealment described by the trial authors. See Table 1 for more details.
Blinding
Seven trials were double‐blind and we considered them at low risk for this domain (Berger 1998; Chlibek 2013; Gilderman 2008; Murray 2011; Oxman 2005; Tyring 2007; Vermeulen 2012). See Table 1 for more details.
Incomplete outcome data
We classified Chlibek 2013, Chlibek 2014, Diez‐Domingo 2015, Gilderman 2008, Murray 2011, Oxman 2005, Tyring 2007, Vesikari 2013 and Vermeulen 2012 as 'low risk' in this domain because the flow of patients was clear. Mills 2010 had no data on the first arm of the cross‐over study and we therefore classified it as 'high risk'. We classified Berger 1998 and Levin 2000 as 'unclear risk' as they did not provide any information for this domain.
Selective reporting
We classified the following studies as 'low risk' in this domain: Berger 1998; Chlibek 2013; Chlibek 2014; Diez‐Domingo 2015; Gilderman 2008; Lal 2015; Mills 2010; Murray 2011; Oxman 2005; Tyring 2007; Vermeulen 2012; Vesikari 2013. See Table 1 for more details. We classified Levin 2000 as having an 'unclear' risk of bias for this domain because it was basically a study that analysed immune response.
Other potential sources of bias
We did not identify any significant aspects pertaining to this domain.
Quality of evidence
In the comparison between available live attenuated zoster vaccine versus placebo (Oxman 2005), the overall quality of the evidence for the main effectiveness outcome ('incidence of herpes zoster' up to three years of follow‐up) (Types of outcome measures) was moderate. The reason for downgrading the evidence was due to the risk of bias of this study, because it did not describe random sequence generation (summary of findings Table for the main comparison).
We classified the quality of the evidence for safety outcomes up to three years of follow‐up (hospital admissions or participants with injection site adverse effects) as moderate. We downgraded by one point because of risk of bias due to the lack of description of random sequence generation (summary of findings Table for the main comparison).
Effects of interventions
See: Summary of findings for the main comparison Available live attenuated VZV zoster vaccine versus placebo for preventing herpes zoster in older adults; Summary of findings 2 Adjuvanted recombinant VZV subunit zoster vaccine (not yet available) versus placebo for preventing herpes zoster in older adults
Primary outcome
1. Incidence of herpes zoster
Available live attenuated varicella zoster virus (VZV) vaccine versus placebo
Oxman 2005 evaluated the effectiveness of zoster vaccine versus placebo in reducing the incidence of herpes zoster with a median surveillance of 3.1 years and reported a significant reduction for this outcome in the vaccinated group: risk ratio (RR) 0.49, 95% confidence interval (CI) 0.43 to 0.56 (Analysis 1.1.1). Although this was a significant difference in favour of the intervention, the magnitude of this effect was a risk difference (RD) of 2% and the number needed to treat for an additional beneficial outcome (NNTB) was 50. The quality of the evidence was moderate due to one downgrade because of risk of bias (no description of the randomisation process) (summary of findings Table for the main comparison).
The vaccinated group had a reduced incidence of herpes zoster as early as 30 days post‐vaccination: RR 0.33, 95% CI 0.13 to 0.84 (Analysis 1.1.2). These cases were excluded from the final intention‐to‐treat (ITT) analysis. At 42 days post‐vaccination, the benefits of vaccination are clear, with a RR of 0.29 (95% CI 0.13 to 0.68) (Analysis 1.1.3).
The continuation of the Oxman 2005 study was published in 2012 (Schmader KE, Oxman MN, Levin MJ, Johnson G, Zhang JH, Betts R et al. Clinical Infectious Diseases 2012;55(10): 1320–8) and evaluated the effectiveness of the vaccine five years after the individuals had been vaccinated. However, the published data report different dates for the collection of outcomes in the intervention and the placebo groups. The data from the zoster vaccine group are from December 2004 to March 2006 (16 months). In the placebo group, data were reported from December 2004 to September 2005 (10 months), since in October 2005 the zoster vaccine was also offered to participants in the placebo group, as stated by the authors: "Beginning in October 2005, open‐label zoster vaccine was offered without charge to Shingles Prevention Study placebo recipients." We contacted the authors of this study asking for the data corresponding to the period from December 2004 to September 2005 (10 months) for both groups (vaccine and placebo). They replied to our request but did not provide this information and suggested instead that we should assume a uniform rate of events and calculate the estimated number of cases from that. According to their suggestion, we calculated that the inferred rate of incidence of herpes zoster (from December 2004 to September 2005) would be 53 in the vaccine group at 10 months (total number of herpes zoster cases in the vaccine group 84 in 16 months, therefore 53 in 10 months) and the incidence of herpes zoster would be 95 cases in 10 months in the placebo group. The resulting RR was 0.53, 95% CI 0.38 to 0.74, RD ‐0.01, 95% CI ‐0.01 to ‐0.00 and NNTB 100, in favour of the vaccinated group (Analysis 1.1.4). By the same reasoning, when considering the follow‐up period of five years, there was a significant decrease in the incidence of herpes zoster in the vaccine group compared to the placebo group: RR 0.50, 95% CI 0.44 to 0.56; RD ‐0.02, 95% CI ‐0.02 to ‐0.02 and NNTB 50 (Analysis 1.1.5). We did not include these data in summary of findings Table for the main comparison since they are inferred data.
The interference of herpes zoster in activities of daily life (ADL) was measured by the zoster brief pain inventory (ZBPI ADL), in which scores greater than or equal to 300 indicate significant pain‐related interference in daily life and quality of life (Coplan 2004). There were no significant differences between the vaccinated and placebo groups for this outcome in the study by Oxman 2005 (RR 0.63, 95% CI 0.34 to 1.16) (Analysis 1.2).
Higher‐potency versus lower‐potency zoster vaccine
Tyring 2007 compared higher‐potency zoster vaccine with lower‐potency zoster vaccine and reported a higher incidence of herpes zoster (the polymerase chain reaction was positive for wild type of VZV in two cases) in the first group but this difference was not significant (RR 2.55, 95% CI 0.12 to 52.99) (Analysis 2.1).
Live versus inactivated zoster vaccine
One study, Levin 2000, compared live zoster vaccine with an inactivated zoster vaccine and reported no differences in the incidence of herpes zoster (RR 0.96, 95% CI 0.06 to 15.17) (Analysis 4.1).
Adjuvanted recombinant VZV subunit zoster vaccine (not yet available)
The efficacy of the new recombinant adjuvanted VZV subunit vaccine was tested by Lal 2015. During the follow‐up of 3.2 years, there was a decrease in the incidence of herpes zoster in vaccinated participants compared to those who received a placebo: RR 0.04, 95% CI 0.02 to 0.10 (Analysis 10.1), RD 3% and NNTB 33. We classified the evidence as being of moderate quality because we downgraded the score due to lack of information on allocation concealment and because the flow of the participants was not clear (summary of findings Table 2).
Secondary outcomes
1. Adverse events
Available live attenuated VZV zoster vaccine versus placebo
Four studies compared herpes zoster vaccine to placebo and presented safety data that could be pooled into a meta‐analysis (Mills 2010; Murray 2011; Oxman 2005; Vermeulen 2012). Oxman 2005 presented more detailed assessment of safety only in a subgroup of patients (zoster vaccine N = 3345; placebo N = 3271). Murray 2011 assessed only serious adverse events.
The main findings for adverse events are:
Participants receiving the active agent had a higher risk of adverse events than those receiving placebo. When we pooled data from studies reporting the number of participants with one or more adverse events (Mills 2010; Oxman 2005; Vermeulen 2012), we observed an increased risk in the vaccine group: RR 1.70, 95% CI 1.61 to 1.80, RD 0.24, 95% CI 0.22 to 0.26 and number needed to treat to harm (NNTH) 4.1, 95% CI 3.8 to 4.5 (Analysis 1.3.1).
As expected, vaccine‐related adverse events were more frequent in the vaccinated group than in the placebo group (RR 4.63, 95% CI 2.64 to 8.12; RD 0.41, 95% CI 0.30 to 0.53 and NNTH 2.4, 95% CI 1.9 to 3.3) (Analysis 1.3.2) (Vermeulen 2012).
Vaccine‐related systemic adverse events were more frequent in the vaccinated group than in the placebo group: pooled data RR 1.29, 95% CI 1.06 to 1.57, RD 0.01, 95% CI ‐0.01 to 0.02 (Mills 2010; Oxman 2005) (Analysis 1.3.5).
There were no significant differences between the groups receiving zoster vaccine or placebo for: one or more serious adverse event (including death) (Mills 2010; Murray 2011; Oxman 2005; Vermeulen 2012); vaccine‐related serious adverse events (Mills 2010; Murray 2011; Oxman 2005); discontinuation due to a vaccine‐related adverse event (Mills 2010; Vermeulen 2012).
The vaccinated group had a higher risk of injection site adverse events than the placebo group, with a pooled RR of 2.99 (95% CI 2.75 to 3.26), a RD of 0.32 (95% CI 0.30 to 0.34) and a NNTH of 3.1 (95% CI 2.9 to 3.3) (Analysis 1.3.14) (Mills 2010; Oxman 2005; Vermeulen 2012).
Specific injection site adverse events were more frequent in the vaccinated group but mild to moderate in intensity.
In summary of findings Table for the main comparison we present the most important adverse events: serious adverse events, hospitalisation, injection site adverse events and death. Although the vaccinated groups had a higher rate of injection site adverse events, this was not detected for serious adverse events, hospitalisation or deaths.
See Table 2 for details of adverse events.
| Comparison (studies) | Results |
| Available live attenuated VZV zoster vaccineversus placebo | The risk of herpes zoster‐like rash up to 42 days post‐vaccination (Oxman 2005) was lower in the vaccinated group (RR 0.47, 95% CI 0.27 to 0.84) than the placebo group but without a significant RD (Analysis 1.3.7). The following systemic AEs were not significantly different between the groups receiving zoster vaccine or placebo: systemic AEs (Mills 2010; Oxman 2005; Vermeulen 2012), systemic pruritus (Vermeulen 2012), varicella‐like rash not at injection site (from day of vaccination to day 42) (Oxman 2005; Vermeulen 2012), rash unrelated to HZ (from day of vaccination to day 42) (Oxman 2005), 1 or more SAE (including death) (Mills 2010; Murray 2011; Oxman 2005; Vermeulen 2012), vaccine‐related SAEs (Mills 2010; Murray 2011; Oxman 2005), discontinuation due to a vaccine‐related AE (Mills 2010; Vermeulen 2012), hospitalisation (Oxman 2005), and hospitalisation related to HZ (Oxman 2005). Specific injection site AEs were more frequent in the vaccinated group. Specific risks for individual AEs were:
Varicella‐like rash at injection site (up to day 42) was also more frequent in the vaccinated group: RR 2.86, 95% CI 1.21 to 6.76 (Analysis 1.3.23) (Oxman 2005), but without a significant RD due to the small number of events. Duration of injection site AEs In general, injection site AEs lasted longer in the zoster vaccine group. There were significant differences with respect to the duration of the following local AEs: erythema, with a mean difference (MD) of 2.40 days (95% CI 1.56 to 3.24) (Analysis 1.4.1), swelling MD 1.90 days (95% CI 1.35 to 2.45) (Analysis 1.4.2) and pruritus MD 2.40 days (95% CI 1.32 to 3.48) (Analysis 1.4.5). The duration of pain and haematoma did not differ significantly between the groups, MD 1.00 (95% CI ‐0.10 to 2.10) (Analysis 1.4.3) and MD ‐0.50 (95% CI ‐5.52 to 4.52) (Analysis 1.4.6) respectively. The duration of rash was longer in the placebo compared to the vaccine group: RR ‐16.60 (95% CI ‐33.68 to 0.48) (Analysis 1.4.4). |
| High‐potency versus low‐potency zoster vaccine (Tyring 2007) | The comparison of high versus low‐potency zoster vaccine yielded no significant differences between groups for the following AEs: vaccine‐related AEs, systemic vaccine‐related AEs and vaccine‐related serious AEs (death). |
| Refrigerated versus frozen zoster vaccine | Compared refrigerated versus frozen zoster vaccine and reported no significant differences between groups for the following AEs: 1 or more AEs, vaccine‐related AEs, systemic AEs, systemic vaccine‐related AEs, serious AEs, vaccine‐related serious AEs or death. However, there were more injection site AEs in the group receiving frozen vaccines (RR 0.77, 95% CI 0.60 to 0.98) (Analysis 3.1.8). |
| Zoster vaccine versus pneumo 23 | One study compared 3 different concentrations of plaque‐forming units (pfu) of live attenuated VZV and presented the following adverse events: 3200 pfu VZV/dose versus pneumo 23 There was a lower incidence of 1 or more injection site reactions in the group vaccinated with the 3200 pfu/dose zoster vaccine (RR 0.61, 95% CI 0.41 to 0.91) (Analysis 5.1.1) as well as pain at the injection site (RR 0.49, 95% CI 0.30 to 0.81) (Analysis 5.1.3). There were no significant differences between the 3200 pfu/dose zoster vaccine and the pneumo 23 vaccine for the following local adverse events: induration (≥ 2 cm diameter injection site), probably vaccine‐related injection site pain, redness (≥ 2 cm diameter injection site), pruritus or vesicles (no patients had vesicles in the 3200 pfu/dose zoster vaccine nor the pneumo 23 groups). 8500 pfu VZV/dose versus pneumo 23 There was a lower incidence of 1 or more injection site reaction in the group vaccinated with the 8500 pfu/dose zoster vaccine (RR 0.63, 95% CI 0.43 to 0.93) (Analysis 5.2.1). There were no significant differences for the following injection site AEs between participants who received the 8500 pfu/dose VZV vaccine and those who received the pneumo 23 vaccine: induration (≥ 2 cm diameter injection site), pain (injection site), probably vaccine‐related injection site pain, redness, pruritus and vesicles. 41,650 pfu VZV/dose VZV versus pneumo 23 Participants receiving the 41,650 pfu/dose zoster vaccine had significantly lower rates of one or more injection site reaction (RR 0.41, 95% CI 0.24 to 0.68) (Analysis 5.3.1) and pain at injection site (RR 0.43, 95% CI 0.25 to 0.74) (Analysis 5.3.3) than those receiving the pneumo 23 vaccine. There were no significant differences between the groups for the following injection site AEs: induration (≥ 2 cm diameter injection site), probably vaccine‐related injection site pain, redness (≥ 2 cm diameter injection site), pruritus and vesicles (no patients had vesicles in the 41,650 pfu/dose zoster vaccine nor the pneumo 23 vaccine groups). |
| Zoster vaccine intramuscular route versus zoster vaccine subcutaneous route | Compared intramuscular (IM) versus subcutaneous (SC) zoster vaccine and reported that compared to the IM group, participants who received SC vaccines had a significantly higher incidence of the following AEs:
There were no significant differences between groups for the following AEs: all systemic AEs: RR 1.03, 95% CI 0.70 to 1.51 (Analysis 6.1.3); vaccine‐related systemic AE: RR 0.93, 95% CI 0.44 to 1.98 (Analysis 6.1.4); headache considered as vaccine‐related by the investigator: RR 0.75, 95% CI 0.17 to 3.32 (Analysis 6.1.5); unsolicited injection site reaction: RR 0.65 95% CI 0.29 to 1.45 (Analysis 6.1.7); severe injection site erythema (> 10 cm): RR 0.67 95% CI 0.11 to 3.96 (Analysis 6.1.9); severe injection site pain (inability to work or usual activity): RR 1.01, 95% CI 0.14 to 7.06 (Analysis 6.1.11); severe injection site swelling (> 10 cm): RR 0.25, 95% CI 0.03 to 2.23 (Analysis 6.1.13). No participant withdrew from the trial because of AE (Analysis 6.1.15). |
| 2 doses of a zoster vaccine versus a single dose and also 2 doses given at different intervals | Zoster vaccine 1‐month schedule versus zoster vaccine 3‐month schedule There was no statistical difference between participants who received the doses of zoster vaccine 2 months apart compared to those receiving the doses 3 months apart: AE RR 1.10, 95% CI 0.91 to 1.31 (Analysis 7.1.1), vaccine‐related AE RR 1.00, 95% CI 0.81 to 1.24 (Analysis 7.1.2); serious AE RR 0.95, 95% CI 0.14 to 6.70 (Analysis 7.1.3); withdrawal due to AE RR 2.86, 95% CI 0.12 to 69.80 (Analysis 7.1.5); systemic AE RR 1.34, 95% CI 0.90 to 2.00 (Analysis 7.1.8); vaccine‐related systemic AE RR 1.27, 95% CI 0.45 to 3.60 (Analysis 7.1.9); rash of interest non‐injection site rashes RR 0.95, 95% CI 0.06 to 15.14 (Analysis 7.1.10); varicella/varicella‐like rash RR 0.95, 95% CI 0.06 to 15.14 (Analysis 7.1.11); injection site reaction RR 0.99, 95% CI 0.80 to 1.23 (Analysis 7.1.13); solicited injection site reaction RR 1.00, 95% CI 0.81 to 1.25 (Analysis 7.1.14); unsolicited injection site reaction RR 0.41, 95% CI 0.11 to 1.56 (Analysis 7.1.15); erythema injection site RR 1.01, 95% CI 0.80 to 1.27 (Analysis 7.1.16); pain injection site RR 0.84, 95% CI 0.57 to 1.25 (Analysis 7.1.17); swelling injection site RR 1.05, 95% CI 0.75 to 1.47 (Analysis 7.1.18). No participants, from either group, reported the following AE: vaccine‐related serious AE (Analysis 7.1.4); vaccine‐related withdrawal due to AE (Analysis 7.1.6); non‐serious vaccine‐related withdrawal due to AE (Analysis 7.1.7) and herpes zoster/zoster‐like rash (Analysis 7.1.12). Zoster vaccine 1 month schedule versus zoster vaccine single dose Only participants with systemic AE: there were significant differences in favour of the 2 doses 1 month apart, with a higher incidence in the single dose group: RR 0.74, 95% CI 0.56 to 0.97, RD ‐0.07, 95% CI ‐0.13 to ‐0.01 and NNTH 14.3, 95% CI 7.6 to 100 (Analysis 7.2.8). For most AEs, there was no statistical difference: AE RR 0.92, 95% CI 0.80 to 1.05 (Analysis 7.2.1), vaccine‐related AE RR 0.91, 95% CI 0.77 to 1.08 (Analysis 7.2.2); serious AE RR 0.72, 95% CI 0.16 to 3.30 (Analysis 7.2.3); withdrawal due to AE RR 0.36, 95% CI 0.05 to 2.82 (Analysis 7.1.5); vaccine‐related withdrawal due to AE RR 0.21, 95% CI 0.01 to 3.74 (Analysis 7.2.6); non‐serious vaccine‐related withdrawal due to AE RR 0.21, 95% CI 0.01 to 3.74 (Analysis 7.2.7); vaccine‐related systemic AE RR 0.54, 95% CI 0.26 to 1.12 (Analysis 7.2.9); rash of interest non‐injection site rashes RR 1.61, 95% CI 0.15 to 17.72 (Analysis 7.2.10); varicella/varicella‐like rash RR 9.66, 95% CI 0.39 to 236.25 (Analysis 7.2.11); herpes zoster/zoster‐like rash RR 0.64, 95% CI 0.03 to 13.36 (Analysis 7.2.12); injection site reaction RR 0.93, 95% CI 0.78 to 1.10 (Analysis 7.2.13); solicited injection site reaction RR 0.94, 95% CI 0.79 to 1.11 (Analysis 7.2.14); unsolicited injection site reaction RR 0.35, 95% CI 0.11 to 1.13 (Analysis 7.2.15); injection site erythema RR 0.98, 95% CI 0.81 to 1.17 (Analysis 7.2.16); injection site pain RR 0.74, 95% CI 0.54 to 1.01 (Analysis 7.2.17); injection site swelling RR 1.08, 95% CI 0.82 to 1.41 (Analysis 7.2.18). There were no participants with vaccine‐related serious AE in either group (Analysis 7.2.4). Zoster vaccine 3 month schedule versus zoster vaccine single dose The participants in the group that received a single dose had a higher incidence of the following AE in comparison to those in the group that received 2 doses, 3 months apart: AEs RR 0.84, 95% CI 0.72 to 0.97; RD ‐0.09; 95% CI ‐0.17 to ‐0.02 and NNTH 11.1, 95% CI 5.9 to 50 (Analysis 7.3.1), systemic AEs RR 0.55, 95% CI 0.39 to 0.76, RD ‐0.13, 95% CI ‐0.18 to ‐0.07 and NNTH 7.6, 95% CI 5.6 to 14.3 (Analysis 7.3.8) and vaccine‐related systemic AE RR 0.42, 95% CI 0.18 to 0.98), RD ‐0.04, 95% CI ‐0.06 to ‐0.01 and NNTH 25.0, 95% CI 16.6 to 100 (Analysis 7.3.9). There were no significant differences between these groups in relation to the following AEs: vaccine‐related AE RR 0.91, 95% CI 0.77 to 1.08 (Analysis 7.3.2); serious AE RR 0.75, 95% CI 0.16 to 3.46 (Analysis 7.3.3); withdrawal due to AE RR 0.18, 95% CI 0.01 to 3.04 (Analysis 7.3.5); vaccine‐related withdrawal due to AE RR 0.23, 95% CI 0.01 to 3.93 (Analysis 7.3.6); non‐serious vaccine‐related withdrawal due to AE RR 0.23, 95% CI 0.01 to 3.93 (Analysis 7.3.7); rash of interest non‐injection site rashes RR 1.69, 95% CI 0.15 to 18.60 (Analysis 7.3.10); varicella/varicella‐like rash RR 10.14, 95% CI 0.41 to 247.92 (Analysis 7.3.11); herpes zoster/zoster‐like rash RR 0.68, 95% CI 0.03 to 14.02 (Analysis 7.3.12); injection site reaction RR 1.10, 95% CI 0.79 to 1.11 (Analysis 7.3.13); solicited injection site reaction RR 0.93, 95% CI 0.78 to 1.11 (Analysis 7.3.14); unsolicited injection site reaction RR 0.85, 95% CI 0.38 to 1.91 (Analysis 7.3.15); injection site erythema RR 0.97, 95% CI 0.80 to 1.17 (Analysis 7.3.16); injection site pain RR 0.87, 95% CI 0.65 to 1.17 (Analysis 7.3.17); injection site swelling RR 1.03, 95% CI 0.77 to 1.36 (Analysis 7.3.18). There were no participants with vaccine‐related serious AE in either group (Analysis 7.3.4). |
AE: adverse event
CI: confidence interval
HZ: herpes zoster
RD: risk difference
RR: risk ratio
SC: subcutaneous
VZV: varicella zoster virus
Adjuvanted recombinant VZV subunit zoster vaccine (not yet available)
Lower or higher volumes of adjuvants plus gE subunit VZV or unadjuvanted gE or saline
Chlibek 2013 compared adverse events in the four groups that received two doses two months apart: two groups with different amounts of adjuvants with the same amount of antigen (50 gE/AS01B and 50 gE/AS01E), one group receiving 50 µg gE plus saline and one group receiving only saline (placebo).
General and local reactions to vaccination were more frequent with both adjuvanted candidate herpes zoster vaccines and were most frequent with the groups that received higher amounts of adjuvant (gE/AS01B). The participants who received gE/AS01B had a significantly higher incidence of adverse events: any symptom, general reaction (fatigue, headache) and local reaction (any symptom, pain and redness). However, all adverse events were generally mild to moderate and transient. No vaccine‐related severe adverse events were reported.
Three groups of VZV subunit gE in three different quantities versus unadjuvanted gE or saline
Chlibek 2014 compared adverse events in five groups that received two doses two months apart: three groups received vaccines, each one with different amounts of antigen (25 μg gE, 50 μg gE and 100 μg gE) but the same amount of adjuvant AS01B; one group received one dose of saline + one dose 100 µg gE two months later; and one group received100 µg gE/saline (unadjuvanted gE).
All adverse events were common in the three different formulations of gE/AS01B and more frequent than with the unadjuvanted gE/saline. In the comparison between the three different amounts of gE antigen, there were no differences in the incidence of adverse events except for any myalgia in which there was a slightly higher incidence in the group receiving 100 µg compared with 50 µg: RR 1.26, 95% CI 1.01 to 1.59, RD 0.11 95% CI 0.00 to 0.22 and NNTH 9.0 95% CI 0 to 4.5 (Analysis 9.3.7). Thre was no difference between groups for more important myalgia that prevents normal everyday activities.
Adjuvanted recombinant VZV subunit zoster vaccine (not yet available) versus placebo
We did the analysis of adverse events in patients aged 50 years or more because the data for adverse events by specific age groups were not available. We performed intention‐to‐treat (ITT) analyses for adverse events that did not include all randomised participants. In other words, we considered the worst case scenario for the intervention group (we assumed that the participants with missing information had adverse events) and the best case scenario for the placebo group (we assumed that the participants with missing information did not have adverse events). In this analysis, we detected no differences between the groups. Therefore, we decided to present the results for adverse events as they were published.
In the comparison between the new adjuvanted recombinant VZV subunit zoster vaccine versus placebo, the vaccinated group had a higher incidence of the following adverse events: systemic symptoms (myalgia, fatigue, headache, shivering, fever and gastrointestinal symptoms) and injection site adverse events (pain, redness and swelling) but most symptoms were of mild to moderate intensity. The most important difference between the adverse events was injection site events with an absolute risk of 81.5% in comparison to placebo, which was 11.9% (summary of findings Table 2).
There was no significant difference between groups for serious adverse events, potential immune‐mediated disease and deaths (summary of findings Table 2).
See Table 3 for details of adverse events for these comparisons between the new adjuvanted recombinant VZV subunit zoster vaccine versus placebo.
| Comparison (studies) | Results |
| Adjuvanted recombinant VZV subunit zoster vaccine: lower or higher quantities of adjuvants plus gE subunit VZV versus unadjuvanted gE or saline | Compared 4 groups that received either lower (AS01E) or higher (AS01B) volumes of adjuvants plus gE subunit VZ or unadjuvanted gE or saline injections. 50 μg gE/AS01E versus 50 μg gE/AS01B There was a significantly higher incidence of AEs in the participants who received a higher quantity of adjuvant (AS01B):
There were no significant differences between groups for all other AEs: any grade 3 symptom; any general symptom, any general grade 3 symptom, grade 3 fatigue, fever, gastrointestinal symptoms, grade 3 gastrointestinal symptoms, grade 3 headache, myalgia, grade 3 myalgia, any grade 3 local symptom, local grade 3 pain, local grade 3 redness, local swelling and local grade 3 swelling, consent withdrawal, loss to follow‐up and serious AE. No participants had grade 3 fever in either group. 50 μg gE/AS01E versus 50 μg gE/saline (unadjuvanted)
All these AE differences were favourable to the unadjuvanted gE group. There were no significant differences between the groups for the following AEs: any grade 3 symptom, any general grade 3 symptom, fatigue, grade 3 fatigue, gastrointestinal symptoms, grade 3 gastrointestinal symptoms, headache, grade 3 myalgia, any local grade 3 symptom, local grade 3 pain, local grade 3 redness and local grade 3 swelling, consent withdrawal, loss to follow‐up and serious AE. No participants had grade 3 fever or grade 3 headache in either group. 50 μg gE/AS01B versus 50 μg gE/saline (unadjuvanted)
All these AE differences were favourable to unadjuvanted gE. There were no significant differences between the groups for the following AEs: any grade 3 symptom, any general grade 3 symptom, grade 3 fatigue, gastrointestinal symptoms, grade 3 headache, grade 3 myalgia, any local grade 3 symptom, local grade 3 pain, local grade 3 redness and local grade 3 swelling, consent withdrawal, loss to follow‐up and serious AE. No participant had grade 3 fever or grade 3 gastrointestinal symptoms in either group. 50 μg gE/AS01E versus saline
All differences in these AEs were favourable to the saline group. There were no significant differences in the following AEs between the groups:any grade 3 symptom, any general grade 3 symptom, fatigue, grade 3 fatigue, fever, gastrointestinal symptoms, grade 3 gastrointestinal symptoms, headache, grade 3 headache, grade 3 myalgia, any local grade 3 symptom, local grade 3 pain, local redness, local grade 3 redness, local swelling and local grade 3 swelling, consent withdrawal, loss to follow‐up and serious AE No participants had grade 3 fever or grade 3 headache in either group. 50 μg gE/AS01B versus saline
All AE differences were favourable to saline. There was no significant difference in AEs between groups for the following: any grade 3 symptom, any general grade 3 symptom, grade 3 fatigue, fever, gastrointestinal symptoms, grade 3 gastrointestinal symptoms, grade 3, headache, grade 3 myalgia, any local grade 3 symptom, local grade 3 pain, local grade 3 redness, local swelling and local grade 3 swelling, consent withdrawal, loss to follow‐up and serious AEs. No participant had grade 3 fever in either group. 50 μg gE/saline (unadjuvanted) versus saline
There were no significant differences between groups for the following AEs: any grade 3 symptom, any general symptom, any general grade 3 symptom, fatigue, grade 3 fatigue, fever, gastrointestinal symptoms, grade 3 gastrointestinal symptoms, headache, myalgia, grade 3 myalgia, any local symptom, local pain, local redness and local swelling or consent withdrawal. No participant, in either group had grade 3 fever, grade 3 headache, any local grade 3 symptom, local grade 3 pain, local grade 3 redness, local grade 3 swelling, loss to follow‐up and serious AE. |
| Adjuvanted recombinant VZV subunit zoster vaccine: three groups of VZV subunit gE in 3 different quantities versus unadjuvanted gE or saline | 3 groups of VZV plus gE were compared in 3 different quantities, 1 group that received unadjuvanted gE and 1 group that received only saline 25 µg gE/AS01B versus 50 µg gE/AS01B There was no difference in the incidence of the following AEs: any fatigue, grade 3 fatigue, any fever, grade 3 fever, any headache, grade 3 headache, any myalgia, grade 3 myalgia, local pain, local grade 3 pain, local redness, local grade 3 redness, local swelling, local grade 3 swelling, consent withdrawal, loss to follow‐up and serious AEs. 25 µg gE/AS01B versus 100 µg gE/AS01B There were no differences in the incidence of the following AEs: any fatigue, grade 3 fatigue, any fever, any headache, grade 3 headache, any myalgia, grade 3 myalgia, local pain, grade 3 local pain, local redness, local grade 3 redness, local swelling, local grade 3 swelling, consent withdrawal, loss to follow‐up and serious AEs. 50 µg gE/AS01B versus 100 µg gE/AS01B
There were no differences in the incidence of all the others AEs: any fatigue, grade 3 fatigue, any fever, grade 3 fever, any headache, grade 3 headache, grade 3 myalgia, local pain, local grade 3 pain, local redness, local grade 3 redness, local swelling, local grade 3 swelling, consent withdrawal and serious AEs 25 µg gE/AS01B versus 100 µg gE/saline (unadjuvanted gE)
All these differences in AEs were favourable to unadjuvanted gE. There were no differences in the incidence of the following AEs: grade 3 fatigue, any fever, any headache, grade 3 headache, grade 3 myalgia, local grade 3 pain, local grade 3 redness, local grade 3 swelling, consent withdrawal, loss to follow‐up and serious AEs. No participant had grade 3 fever in either of the groups. 50 µg gE/AS01B versus 100 µg gE/saline (unadjuvanted gE)
All these differences of AEs were favourable to unadjuvanted gE. There were no differences in the incidence of the following AEs: grade 3 fatigue, any fever, grade 3 headache, grade 3 myalgia, local grade 3 pain, local grade 3 redness, local grade 3 swelling, consent withdrawal, loss to follow‐up and serious AEs. No participant had grade 3 fever in either of the groups 100 µg gE/AS01B versus 100 µg gE/saline (unadjuvanted gE)
All these differences in AEs were favourable to unadjuvanted gE. There were no differences in the incidence of the following AEs: grade 3 fatigue, any fever, grade 3 headache, grade 3 myalgia, local grade 3 pain, local grade 3 redness, local grade 3 swelling, consent withdrawal, loss to follow‐up and serious AEs. No participant had grade 3 fever in either of the groups. 25 µg gE/AS01B versus saline + 100 µg gE/AS01B
All differences in AEs were favourable to saline + 100 µg gE/AS01B. There were no differences in the incidence of the following AEs:, any fatigue, grade 3 fever, any headache, grade 3 headache, grade 3 myalgia, local grade 3 pain, local grade 3 redness, local swelling, local grade 3 swelling, consent withdrawal, loss to follow‐up and serious AEs. No participant had grade 3 fever in either of the groups. 50 µg gE/AS01B versus saline + 100 µg gE/AS01B
All differences in AEs were favourable to saline + 100 µg gE/AS01B. There were no differences in the incidence of the following AEs: grade 3 fatigue, any fever, grade 3 fever, grade 3 headache, grade 3 myalgia, local grade 3 pain, local redness, local grade 3 redness, local swelling, local grade 3 swelling, consent withdrawal, loss to follow‐up and serious AEs. 100 µg gE/AS01B versus saline + 100 µg gE/AS01B
All differences in AEs were favourable to saline + 100 µg gE/AS01B. There were no difference in the incidence of the following AEs: grade 3 fatigue, headache, grade 3 headache, grade 3 myalgia, local grade 3 pain, local grade 3 redness, local swelling, local grade 3 swelling, consent withdrawal, loss to follow‐up and serious AEs. No participant had grade 3 fever in either of the groups. Saline + 100 µg gE/AS01B versus 100 µg gE/saline (unadjuvanted gE)
All differences in AEs were favourable to 100 µg gE/saline. There were no differences in the incidence of the following AEs: any fatigue, grade 3 fatigue, any fever, any headache, any myalgia, grade 3 myalgia, local grade 3 pain, local grade 3 redness, consent withdrawal, loss to follow‐up and serious AEs. No participant had grade 3 fever, grade 3 headache and local grade 3 swelling in either of the groups. |
| Adjuvanted recombinant VZV subunit zoster vaccine (not yet available) versus placebo (Lal 2015) | The AEs related the comparison between adjuvanted recombinant VZV subunit zoster vaccine (not yet available) and placebo are shown below:
|
AEs: adverse events
CI: confidence interval
HZ: herpes zoster
NNTH: number needed to treat for an additional harmful outcome
RD: risk difference
RR: risk ratio
VZV: varicella zoster virus
2. Drop‐outs
There were no important differences in the reasons for drop‐outs in the two main studies that assessed the incidence of herpes zoster between vaccinated and placebo groups, regardless of the type of vaccine (live attenuated VZV zoster vaccine or adjuvanted recombinant VZV subunit zoster vaccine).
Lal 2015 described three reasons for drop‐out: not receiving vaccine according to protocol, receiving the wrong vaccine and a diagnosis of herpes zoster less than 30 days after dose 2. This last outcome had a RR of 0.29, 95% CI 0.09 to 0.87 but no RD. We considered it as a drop‐out and did not put it in the incidence outcome since it was reported for participants aged 50 years or more and not specifically for participants 60 years or more, who were our group of interest.
See Table 4 for details on all the comparisons of drop‐outs in all of the included studies.
| Drop‐outs of all included studies | Available live attenuated VZV zoster vaccine versus placebo The pooled data from the studies that compared zoster vaccine and placebo showed no differences in the reasons for drop‐outs (Analysis 1.4): for any reason (RR 0.99, 95% CI 0.91 to 1.08) (Analysis 1.4.1) (Mills 2010; Oxman 2005; Vermeulen 2012), for death (RR 1.01, 95% CI 0.92 to 1.11) (Analysis 1.4.2) (Mills 2010; Murray 2011; Oxman 2005), for withdrawal of consent (RR 0.87, 95% CI 0.64 to 1.19) (Analysis 1.4.3) (Murray 2011; Oxman 2005; Vermeulen 2012), for loss to follow‐up (RR 1.29, 95% CI 0.97 to 1.73) (Analysis 1.4.4) (Mills 2010; Murray 2011; Oxman 2005; Vermeulen 2012), for protocol deviation (RR 1.58, 95% CI 0.41 to 6.02) (Analysis 1.4.5) (Murray 2011; Vermeulen 2012), for clinical AE (RR 1.36, 95% CI 0.73 to 2.54) (Analysis 1.4.6) (Murray 2011; Vermeulen 2012) and for physician decision (RR 0.20, 95% CI 0.01 to 4.17) (Analysis 1.4.7) (Murray 2011). In Mills 2010, Oxman 2005 and Vermeulen 2012 consent was withdrawn after the intervention. In Murray 2011, some patients apparently withdrew consent after randomisation, but the trial authors do not describe the exact number who withdrew consent after the intervention. The pooled data from the studies that compared zoster vaccine and placebo (Mills 2010; Murray 2011; Oxman 2005) showed no differences in the reasons for participants with no follow‐up (Analysis 1.5). High‐potency versus low‐potency zoster vaccine: There were no differences between the groups (Analysis 2.6). Refrigerated versus frozen zoster vaccine: There were no differences between the groups (Analysis 3.2). Zoster vaccine IM route versus zoster vaccine SC route: There were no withdrawals due to AE in either group (Analysis 6.1.15). 2 doses of a zoster vaccine versus a single dose and also 2 doses given at different intervals: There were no differences between the groups for participants with withdrawal due to AE (Analysis 7.1.5; Analysis 7.2.5; Analysis 7.3.5) (Vesikari 2013). Adjuvanted recombinant VZV subunit zoster vaccine (not yet available) ‐ lower or higher volumes of adjuvants plus gE subunit VZV or unadjuvanted gE or saline injections: There were no differences between the groups for the following reasons of drop‐out: participants with consent withdrawal and participants with loss to follow‐up (Chlibek 2013). 3 groups of VZV subunit gE in 3 different quantities versus unadjuvanted gE or saline: There were no differences between groups for participants with withdrawal of consent or participants with loss to follow‐up for all comparisons provided (Chlibek 2014). Adjuvanted recombinant VZV subunit zoster vaccine not yet available versus placebo:Lal 2015 described 3 reasons to drop‐out: did not receive vaccine according to protocol (Analysis 10.3.1), received wrong vaccine (Analysis 10.3.2) and had diagnosis of HZ less than 30 days after dose 2 (Analysis 10.3.3). For the first 2 there were no differences between the groups. The last outcome had a RR of 0.29 (95% CI 0.09 to 0.87) but no RD and we considered it as drop‐out and not an incidence outcome since it is related to participants aged > 50 years old and not with our age group of interest (participants 60 years old or more). |
AE: adverse event
CI: confidence interval
HZ: herpes zoster
IM: intramuscular
RD: risk difference
RR: risk ratio
SC: subcutaneous
VZV: varicella zoster virus
Discussion
Summary of main results
Available live attenuated varicella zoster virus (VZV) vaccine
For this vaccine we included a total of 10 clinical trials that had clinical outcomes (herpes zoster cases, adverse events and drop‐outs) (Berger 1998; Diez‐Domingo 2015; Gilderman 2008; Levin 2000; Mills 2010; Murray 2011; Oxman 2005; Tyring 2007; Vermeulen 2012; Vesikari 2013). We excluded a total of six trials: three with only immunological outcomes (Hayward 1994; Hayward 1996; Patterson‐Bartlett 2007), one RCT that tested another intervention (Irwin 2007), one RCT evaluating zoster vaccine administered concomitantly with another vaccine (Kerzner 2007), and one trial that did not fulfil our age criteria (Macaladad 2007).
We considered four of these 10 studies to be at low risk of bias (Diez‐Domingo 2015; Oxman 2005; Vermeulen 2012; Vesikari 2013). Data from a major randomised controlled trial (RCT), the Shingles Prevention Study (Oxman 2005), which included 38,546 participants, confirm its effectiveness when compared to placebo in the elderly population, for at least for 3.1 years. The continuation of this study was the study with the longest duration of follow‐up, reporting an average five years of herpes zoster surveillance in individuals aged 60 or older. The available data suggest that the vaccine works for an average of five years to prevent herpes zoster in individuals over 60 years of age. However, these long‐term effect estimates for the outcome incidence of herpes zoster should be interpreted with caution since they were derived from inferred data.
A previous review on zoster vaccine highlighted that individuals in the Shingles Prevention Study who developed herpes zoster despite vaccination had a lower duration and severity of symptoms than those in the placebo group (Sanford 2010).
The impact of zoster episodes on daily life activities was assessed. Despite the lower incidence of cases in the vaccinated population, there were no significant differences for this outcome when compared to the placebo group.
According to a few observational studies acute herpes zoster pain can have an important negative impact on the lives of a significant proportion of affected individuals (Katz 2004; Lydick 1995; Schmader 2007). However, one randomised study did not detect significant differences in the health‐related quality of life of herpes zoster patients treated with placebo compared to analgesics (Dworkin 2009). Only one of the studies included in our review addressed this issue and did not detect significant differences between the zoster vaccine versus the placebo groups (Oxman 2005). The advantage of the vaccine is that it reduces the risk of developing herpes zoster, a disease that can potentially affect the quality of life of patients. In our review, 13 participants in the vaccine group and 42 in the placebo group had severe impairment in their quality of life due to acute herpes zoster pain.
Data from other studies included in this review failed to detect any significant differences in relevant outcomes for higher‐ versus lower‐potency zoster vaccines and live versus inactivated zoster vaccines. It should be noted that there were no cases of herpes zoster caused by attenuated live zoster vaccines.
The vaccine proved to be safe and well tolerated with a low incidence of systemic adverse events. Although systemic adverse events were more frequent in the vaccinated group than in the placebo group, the number needed to treat for an additional harmful outcome (NNTH) for any systemic adverse event is 100. Serious adverse events and vaccine‐related serious adverse events had similar frequencies in both groups.
Although the rate of adverse events was higher in the group receiving the zoster vaccine, the rates of drop‐outs were similar in the vaccine and placebo group, suggesting that these adverse events did not have important repercussions.
Diez‐Domingo 2015 compared rates of adverse events with the intramuscular versus the subcutaneous route using zoster vaccines. These authors reported a higher incidence of adverse events, mainly injection site reactions (erythema, pain and swelling), in the group vaccinated by the subcutaneous route. For every four patients receiving the vaccine by the subcutaneous route, there was one additional individual who had an adverse event when compared to participants who received the vaccine by the intramuscular route. However, there were no differences in the rate of severe injection site, systemic and vaccine‐related systemic adverse events.
In the Vesikari 2013 study we used only data for the single dose.
Injection site adverse events were less frequent in participants inoculated with refrigerated herpes zoster vaccine than in those receiving the frozen vaccine.
Even with this unfavourable safety profile, it is of note that the majority of the adverse events were of mild to moderate intensity. This is clearly reported in the adverse event sub‐study of Oxman 2005.
A previously published review pooled data from two studies to evaluate the safety of zoster vaccines and concluded that tolerability was good and that safety was not a major concern (Sutradhar 2009). Berger 1998 compared different dosages of zoster vaccines and pneumo 23 and also reported that zoster vaccine produced fewer injection site adverse events than the pneumo 23 vaccine.
The Food and Drug Administration (FDA) approved zoster vaccine for older adults (60 years and over) in May 2006 (http://www.fda.gov/ForConsumers/ConsumerUpdates/ucm132873.htm).
Adjuvanted recombinant VZV subunit zoster vaccine (not yet available)
We included three trials that tested this new vaccine on clinical outcomes (efficacy, adverse events and drop‐out) and we considered two of them as having a low risk of bias (Chlibek 2013; Lal 2015). The main study, Lal 2015, evaluated the incidence of herpes zoster in a vaccinated group versus a placebo group during an average of 3.2 years of follow‐up and observed a significant decrease in this outcome in the vaccinated group. This new vaccine also proved to be safe since there was no difference in serious adverse events between the vaccinated and placebo groups. Although systemic and injection sites adverse events were more frequent in the vaccinated group, these were transient.
All studies received funding from the pharmaceutical industry.
Overall completeness and applicability of evidence
All included studies except one enrolled healthy elderly participants with previous VZV contact but without a history of herpes zoster. Only Mills 2010 enrolled participants with a history of herpes zoster. Most (> 68%) of the participants in the primary studies were Caucasian and their mean/median age was 60 to 70 years. One study included individuals aged ≥ 70 years (Vesikari 2013).
All studies were conducted in high‐income countries. Three studies were conducted in the United States (Gilderman 2008; Mills 2010; Oxman 2005), and one in Switzerland (Berger 1998). The others were multi‐country studies: Chlibek 2013 recruited participants in the Czech Republic, Spain and the United States, Chlibek 2014 enrolled participants in the Czech Republic, Germany, The Netherlands and Sweden, Diez‐Domingo 2015 recruited participants in Germany and Spain, Murray 2011 enrolled patients in Canada, Germany, Spain, the United Kingdom and the United States, Tyring 2007 recruited participants in the United States, Canada, the United Kingdom, Germany and Belgium, and Vermeulen 2012 enrolled participants in the United States and the Netherlands.
Despite the wide geographic diversity of the primary studies, we consider the external validity to be low due to the homogeneous characteristics of the participants enrolled in the primary studies.
Quality of the evidence
We classified Chlibek 2013 as having a low risk of bias in six domains of the Cochrane 'Risk of bias' tool: random sequence generation, allocation concealment, blinding (performance bias and detection bias), blinding of participants and personnel (performance bias), blinding of outcome assessment (detection bias), incomplete outcome data and freedom from selective reporting. We judged it to have an unclear risk of bias for the 'other bias' domain because it lacked details for this domain.
We classified Diez‐Domingo 2015 and Vesikari 2013 as being at low risk of bias for the domains random sequence generation (selection bias), allocation concealment (selection bias), blinding of participants and personnel (performance bias), incomplete outcome data (attrition bias) and selective reporting (reporting bias).
We classified Oxman 2005 and Vermeulen 2012 as having a low risk of bias in four of the domains of the Cochrane 'Risk of bias' tool: allocation concealment, blinding, incomplete outcome data and freedom from selective reporting. We classified Murray 2011 as having a low risk of bias in the following four domains: blinding, blinding of outcome assessment, incomplete outcome data and freedom from selective reporting.
Chlibek 2014 had a low risk of bias in three domains (blinding of participants and personnel (performance bias), incomplete outcome data and freedom from selective reporting).
Only Levin 2000 had an unclear risk of bias for selective reporting, while we classified all other studies as having a low risk of bias for this domain (Berger 1998; Chlibek 2013; Chlibek 2014; Diez‐Domingo 2015; Gilderman 2008; Mills 2010; Murray 2011; Oxman 2005; Tyring 2007; Vermeulen 2012; Vesikari 2013).
Berger 1998, Chlibek 2013, Gilderman 2008, Murray 2011, Oxman 2005, Tyring 2007 and Vermeulen 2012 had a low risk of bias for blinding.
Nine studies were at low risk of attrition bias (Chlibek 2013; Chlibek 2014; Diez‐Domingo 2015; Gilderman 2008; Murray 2011; Oxman 2005; Tyring 2007; Vermeulen 2012; Vesikari 2013). We classified Berger 1998 and Levin 2000 as having an unclear risk of bias for this domain and we considered Mills 2010 to have a high risk of bias for this domain.
Potential biases in the review process
Due to the existence of ongoing but unfinished studies, the results currently described in this review may be underestimated (NCT00886613; NCT01165177; NCT01165229; NCT01385566; NCT01505647; NCT01751165; NCT01777321; NCT02075515; NCT02114333; NCT02180295; NCT02526745).
Agreements and disagreements with other studies or reviews
A cohort study followed 766,330 individuals of 65 years of age or more (a 5% random sample of Medicare patients) who had received and not received zoster vaccines between 1 January 2007 and 31 December 2009. Overall, the incidence rate of herpes zoster in the vaccinated participants was 5.4 (95% confidence interval (CI) 4.6 to 6.4) per 1000 person‐years compared to 10.0 (95% CI 9.8 to 0.2) per 1000 person‐years in those not vaccinated (Langan 2013).
Although the primary studies did not assess adverse events associated with autoimmune diseases, a matched case‐control study that collected data from May 2006 to November 2014 was conducted by the Vaccine Adverse Event Reporting System (a national vaccine safety surveillance database maintained jointly by the United States Centers for Disease Control and Prevention (CDC) and the Food and Drug Administration (FDA)) to clarify severe autoimmune adverse events post live attenuated herpes zoster vaccine. The adverse events assessed were arthritis, vasculitis, systemic lupus erythematosus, thrombocytopenia, alopecia, Guillain‐Barre syndrome, optic neuritis and multiple sclerosis. That study reported a higher incidence of arthritis and alopecia, after vaccination. Compared to the unexposed, patients with zoster vaccination had 2.2 and 2.7 times the odds of developing arthritis and alopecia, respectively (P value < 0.001 and P value = 0.015, respectively) (Lay 2015).
Our main findings are in concordance with the previous review by Sanford 2010 regarding both the effectiveness and tolerability of herpes zoster vaccines and we have completed their data with additional studies.
Study flow diagram 2015 update
'Risk of bias' graph: review authors' judgements about each risk of bias item presented as percentages across all included studies.
'Risk of bias' summary: review authors' judgements about each risk of bias item for each included study.
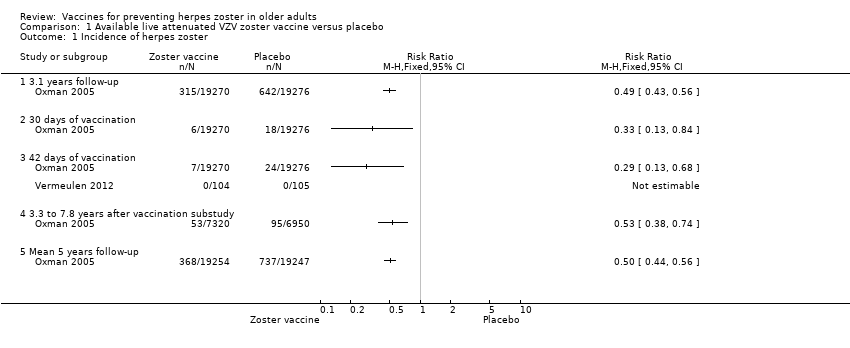
Comparison 1 Available live attenuated VZV zoster vaccine versus placebo, Outcome 1 Incidence of herpes zoster.

Comparison 1 Available live attenuated VZV zoster vaccine versus placebo, Outcome 2 Incidence of herpes zoster with ZBPI ADL. Severity of interference scores of 300 or greater (high score is worse).

Comparison 1 Available live attenuated VZV zoster vaccine versus placebo, Outcome 3 Participants with AEs.

Comparison 1 Available live attenuated VZV zoster vaccine versus placebo, Outcome 4 Drop‐outs.

Comparison 1 Available live attenuated VZV zoster vaccine versus placebo, Outcome 5 Participants with no follow‐up.

Comparison 2 Live attenuated VZV zoster vaccine higher‐potency zoster vaccine versus lower‐potency zoster vaccine, Outcome 1 Incidence of herpes zoster.

Comparison 2 Live attenuated VZV zoster vaccine higher‐potency zoster vaccine versus lower‐potency zoster vaccine, Outcome 2 Vaccine‐related adverse effects.

Comparison 2 Live attenuated VZV zoster vaccine higher‐potency zoster vaccine versus lower‐potency zoster vaccine, Outcome 3 Vaccine‐related systemic adverse effects.
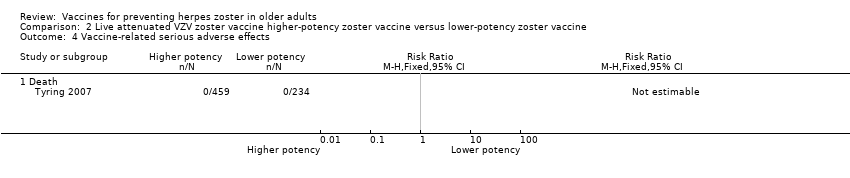
Comparison 2 Live attenuated VZV zoster vaccine higher‐potency zoster vaccine versus lower‐potency zoster vaccine, Outcome 4 Vaccine‐related serious adverse effects.
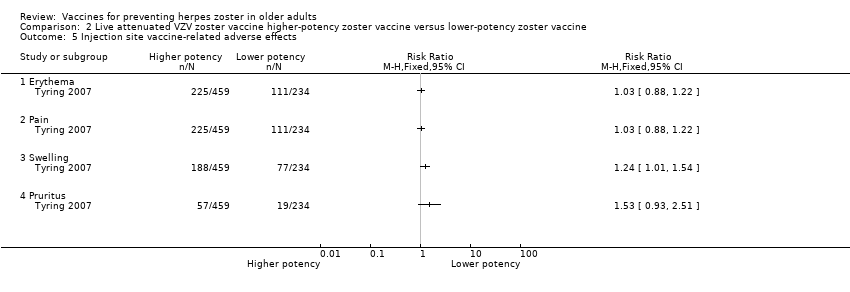
Comparison 2 Live attenuated VZV zoster vaccine higher‐potency zoster vaccine versus lower‐potency zoster vaccine, Outcome 5 Injection site vaccine‐related adverse effects.

Comparison 2 Live attenuated VZV zoster vaccine higher‐potency zoster vaccine versus lower‐potency zoster vaccine, Outcome 6 Participants with no follow‐up.

Comparison 3 Live attenuated VZV zoster vaccine zoster vaccine refrigerated versus zoster vaccine frozen, Outcome 1 Participants with adverse effects.

Comparison 3 Live attenuated VZV zoster vaccine zoster vaccine refrigerated versus zoster vaccine frozen, Outcome 2 Participants with no follow‐up.
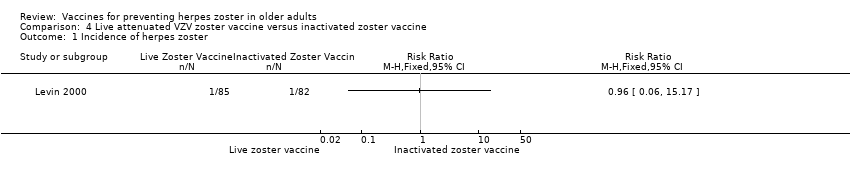
Comparison 4 Live attenuated VZV zoster vaccine versus inactivated zoster vaccine, Outcome 1 Incidence of herpes zoster.
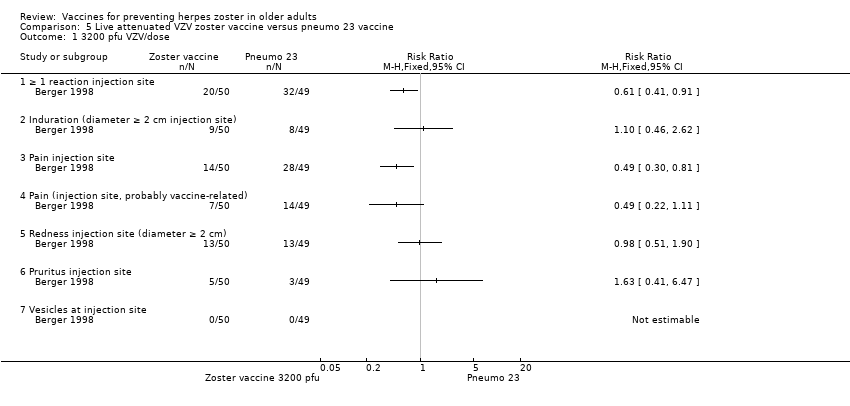
Comparison 5 Live attenuated VZV zoster vaccine versus pneumo 23 vaccine, Outcome 1 3200 pfu VZV/dose.
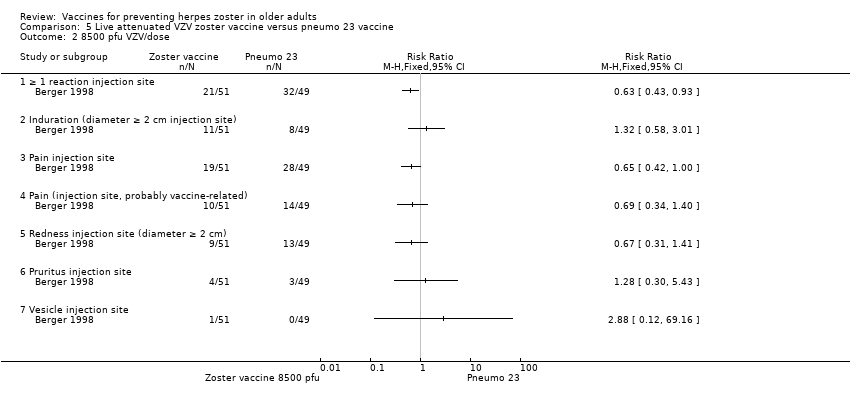
Comparison 5 Live attenuated VZV zoster vaccine versus pneumo 23 vaccine, Outcome 2 8500 pfu VZV/dose.

Comparison 5 Live attenuated VZV zoster vaccine versus pneumo 23 vaccine, Outcome 3 41,650 pfu/dose.

Comparison 5 Live attenuated VZV zoster vaccine versus pneumo 23 vaccine, Outcome 4 Duration in days of adverse effects.
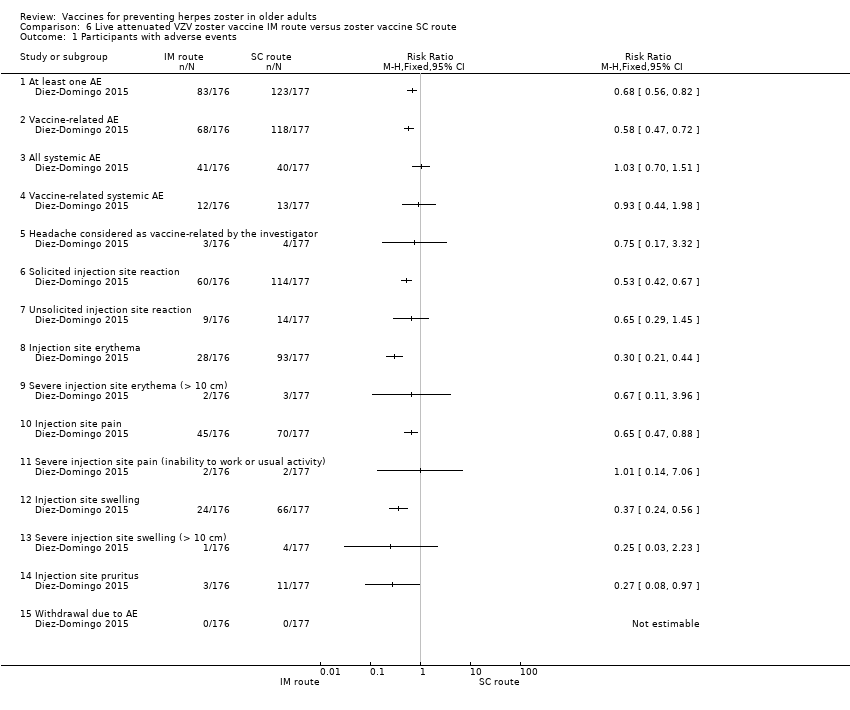
Comparison 6 Live attenuated VZV zoster vaccine IM route versus zoster vaccine SC route, Outcome 1 Participants with adverse events.

Comparison 7 Live attenuated VZV zoster vaccine 2 doses versus single dose and also 2 doses given at different intervals, Outcome 1 Zoster vaccine 1 month schedule versus zoster vaccine 3 month schedule.

Comparison 7 Live attenuated VZV zoster vaccine 2 doses versus single dose and also 2 doses given at different intervals, Outcome 2 Zoster vaccine 1 month schedule versus zoster vaccine single dose.
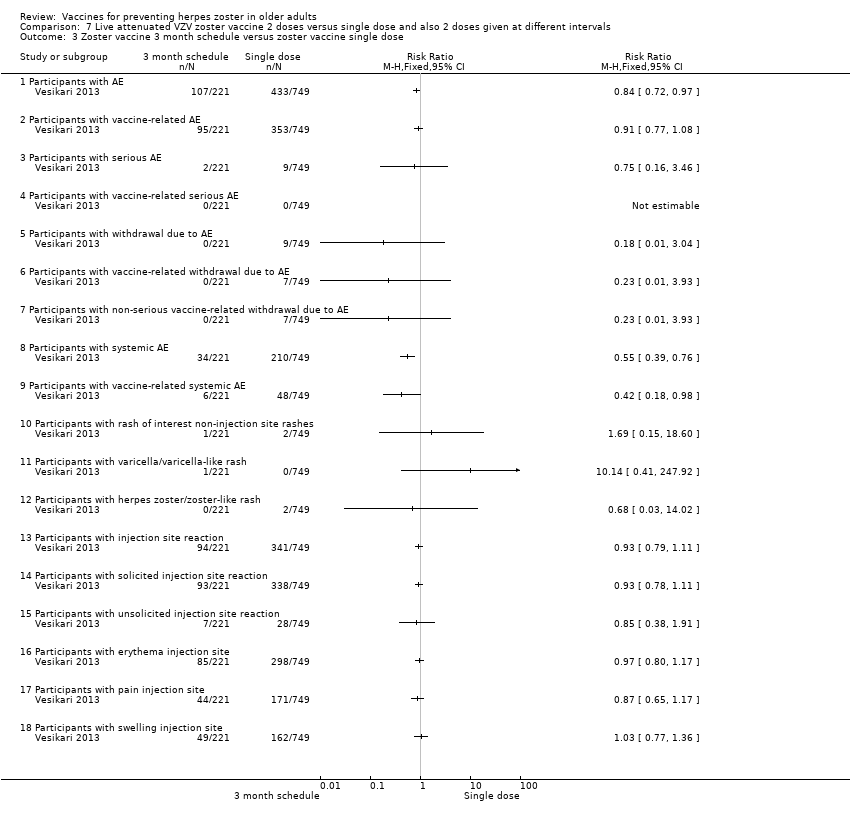
Comparison 7 Live attenuated VZV zoster vaccine 2 doses versus single dose and also 2 doses given at different intervals, Outcome 3 Zoster vaccine 3 month schedule versus zoster vaccine single dose.

Comparison 8 Adjuvanted recombinant VZV subunit zoster vaccine: lower or higher quantities of adjuvants plus gE subunit VZV versus unadjuvanted gE or saline, Outcome 1 50 μg gE/AS01E versus 50 μg gE/AS01B.
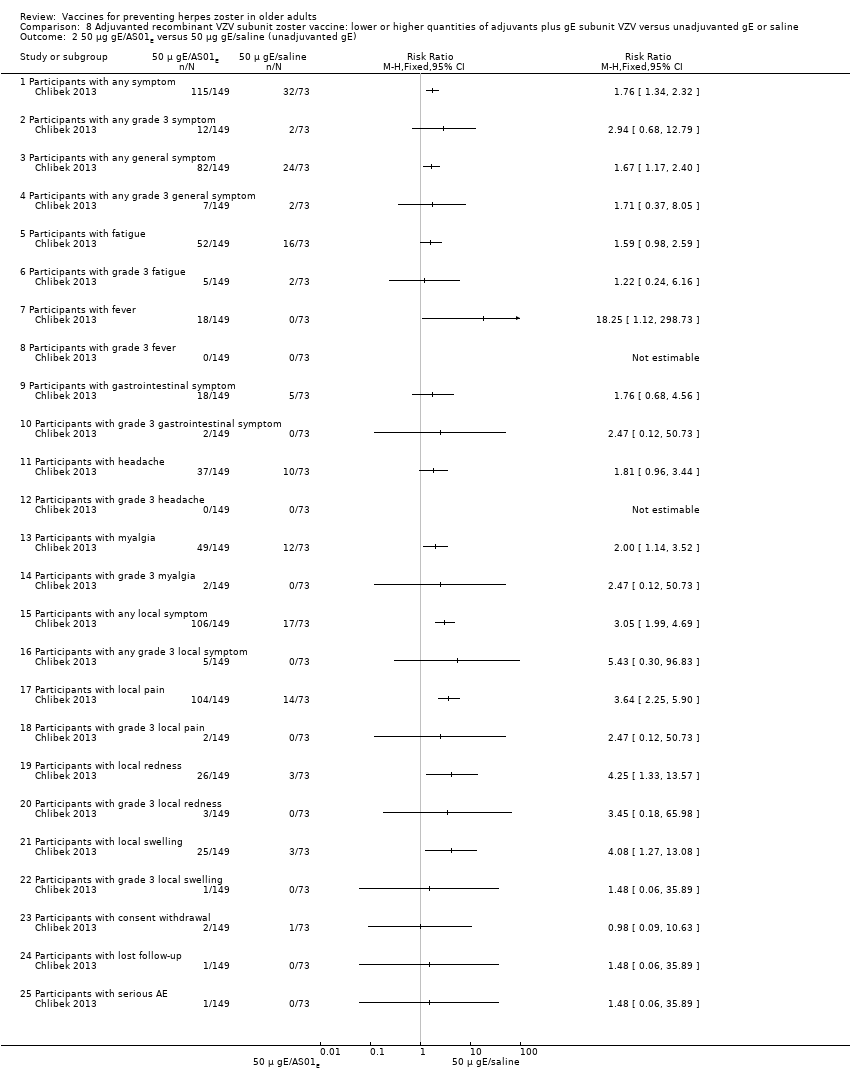
Comparison 8 Adjuvanted recombinant VZV subunit zoster vaccine: lower or higher quantities of adjuvants plus gE subunit VZV versus unadjuvanted gE or saline, Outcome 2 50 μg gE/AS01E versus 50 μg gE/saline (unadjuvanted gE).

Comparison 8 Adjuvanted recombinant VZV subunit zoster vaccine: lower or higher quantities of adjuvants plus gE subunit VZV versus unadjuvanted gE or saline, Outcome 3 50 μg gE/AS01B versus 50 μg gE/saline (unadjuvanted gE).
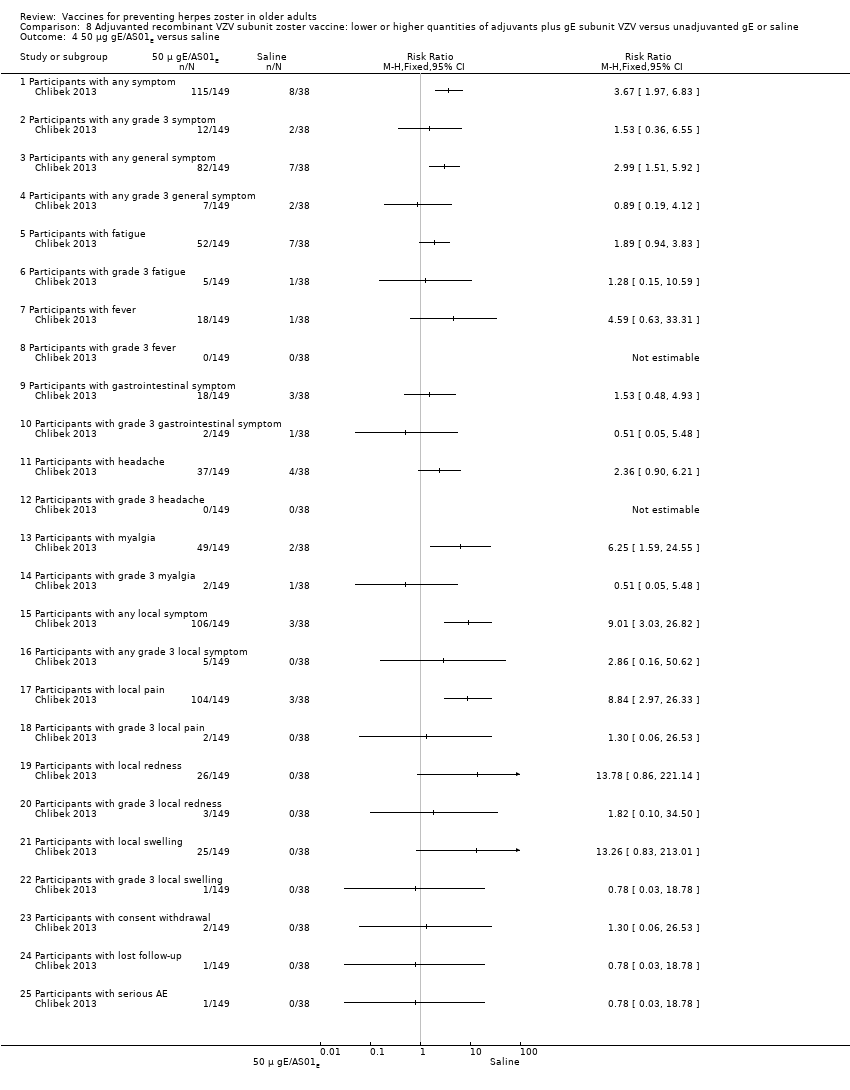
Comparison 8 Adjuvanted recombinant VZV subunit zoster vaccine: lower or higher quantities of adjuvants plus gE subunit VZV versus unadjuvanted gE or saline, Outcome 4 50 μg gE/AS01E versus saline.

Comparison 8 Adjuvanted recombinant VZV subunit zoster vaccine: lower or higher quantities of adjuvants plus gE subunit VZV versus unadjuvanted gE or saline, Outcome 5 50 μg gE/AS01B versus saline.

Comparison 8 Adjuvanted recombinant VZV subunit zoster vaccine: lower or higher quantities of adjuvants plus gE subunit VZV versus unadjuvanted gE or saline, Outcome 6 50 μg gE/Saline (unadjuvanted) versus saline.
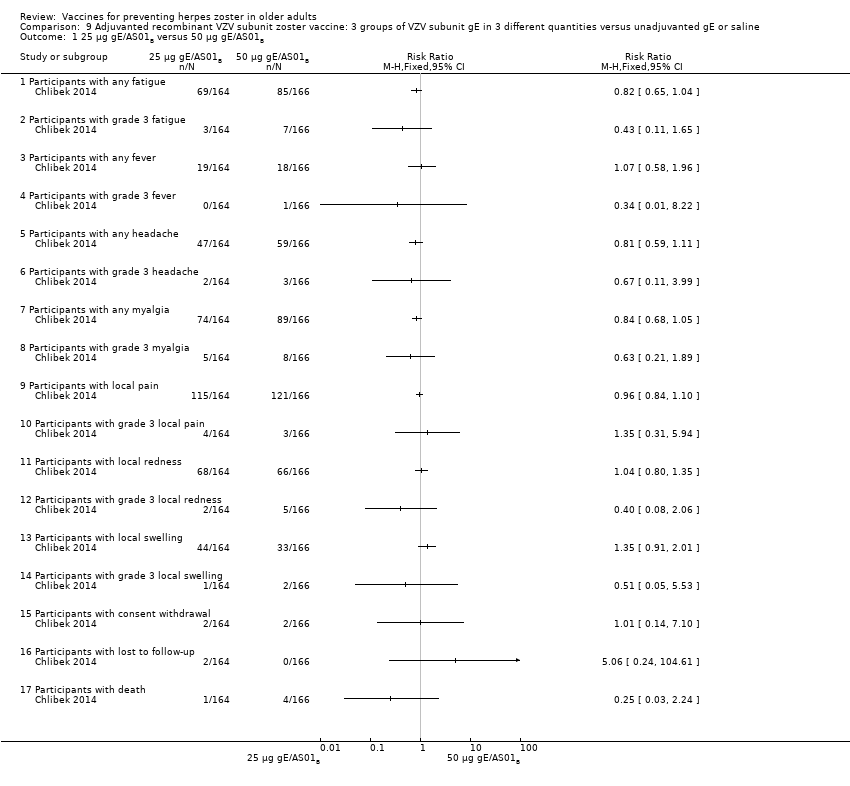
Comparison 9 Adjuvanted recombinant VZV subunit zoster vaccine: 3 groups of VZV subunit gE in 3 different quantities versus unadjuvanted gE or saline, Outcome 1 25 µg gE/AS01B versus 50 µg gE/AS01B.

Comparison 9 Adjuvanted recombinant VZV subunit zoster vaccine: 3 groups of VZV subunit gE in 3 different quantities versus unadjuvanted gE or saline, Outcome 2 25 µg gE/AS01B versus 100 µg gE/AS01B.

Comparison 9 Adjuvanted recombinant VZV subunit zoster vaccine: 3 groups of VZV subunit gE in 3 different quantities versus unadjuvanted gE or saline, Outcome 3 50 µg gE/AS01B versus 100 µg gE/AS01B.

Comparison 9 Adjuvanted recombinant VZV subunit zoster vaccine: 3 groups of VZV subunit gE in 3 different quantities versus unadjuvanted gE or saline, Outcome 4 25 µg gE/AS01B versus 100 µg gE/saline (unadjuvanted gE).

Comparison 9 Adjuvanted recombinant VZV subunit zoster vaccine: 3 groups of VZV subunit gE in 3 different quantities versus unadjuvanted gE or saline, Outcome 5 50 µg gE/AS01B a versus 100 µg gE/saline (unadjuvanted gE).

Comparison 9 Adjuvanted recombinant VZV subunit zoster vaccine: 3 groups of VZV subunit gE in 3 different quantities versus unadjuvanted gE or saline, Outcome 6 100 µg gE/AS01B versus 100 µg gE/saline (unadjuvanted gE).
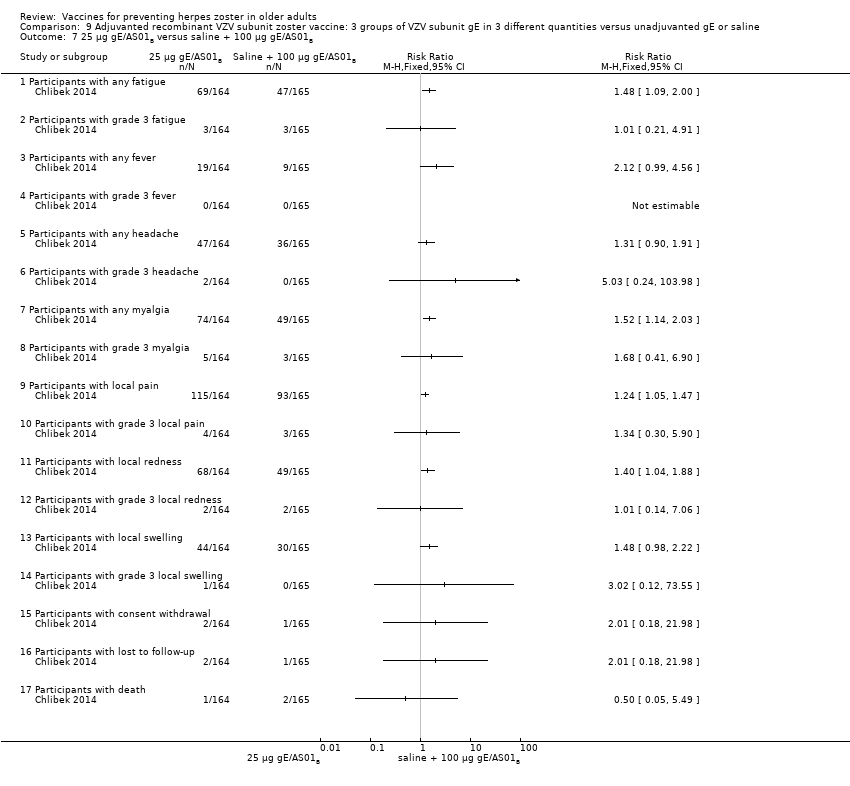
Comparison 9 Adjuvanted recombinant VZV subunit zoster vaccine: 3 groups of VZV subunit gE in 3 different quantities versus unadjuvanted gE or saline, Outcome 7 25 µg gE/AS01B versus saline + 100 µg gE/AS01B.

Comparison 9 Adjuvanted recombinant VZV subunit zoster vaccine: 3 groups of VZV subunit gE in 3 different quantities versus unadjuvanted gE or saline, Outcome 8 50 µg gE/AS01B versus saline + 100 µg gE/AS01B.
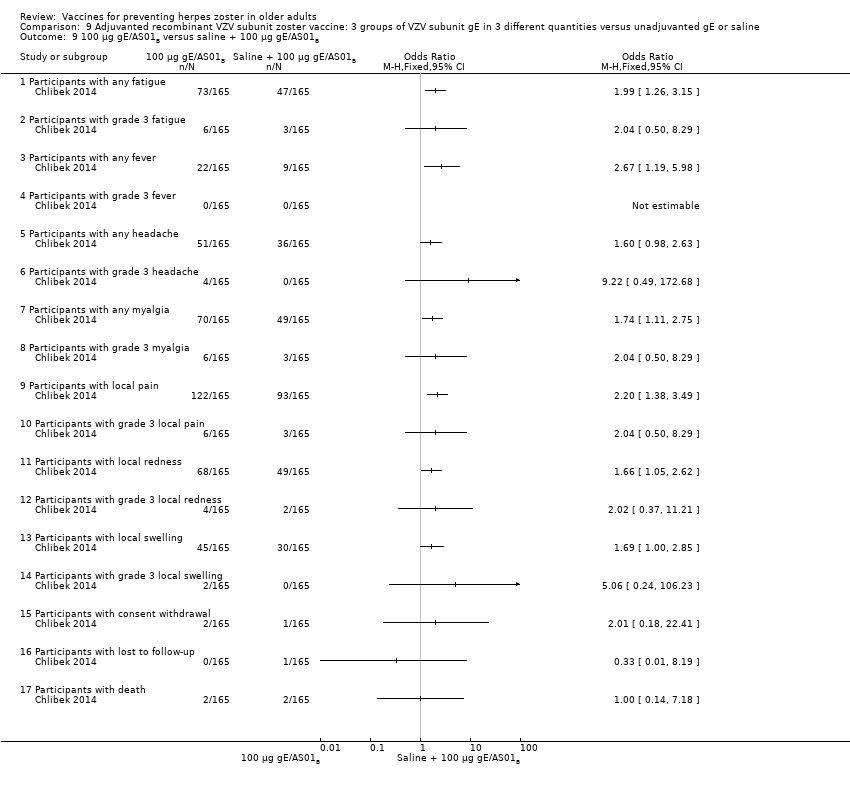
Comparison 9 Adjuvanted recombinant VZV subunit zoster vaccine: 3 groups of VZV subunit gE in 3 different quantities versus unadjuvanted gE or saline, Outcome 9 100 µg gE/AS01B versus saline + 100 µg gE/AS01B.

Comparison 9 Adjuvanted recombinant VZV subunit zoster vaccine: 3 groups of VZV subunit gE in 3 different quantities versus unadjuvanted gE or saline, Outcome 10 Saline + 100 µg gE/AS01B versus 100 µg gE/saline (unadjuvanted gE).

Comparison 10 Adjuvanted recombinant VZV subunit zoster vaccine (not yet available) versus placebo, Outcome 1 Incidence of herpes zoster 3.2 years follow‐up (≥ 60 yo).
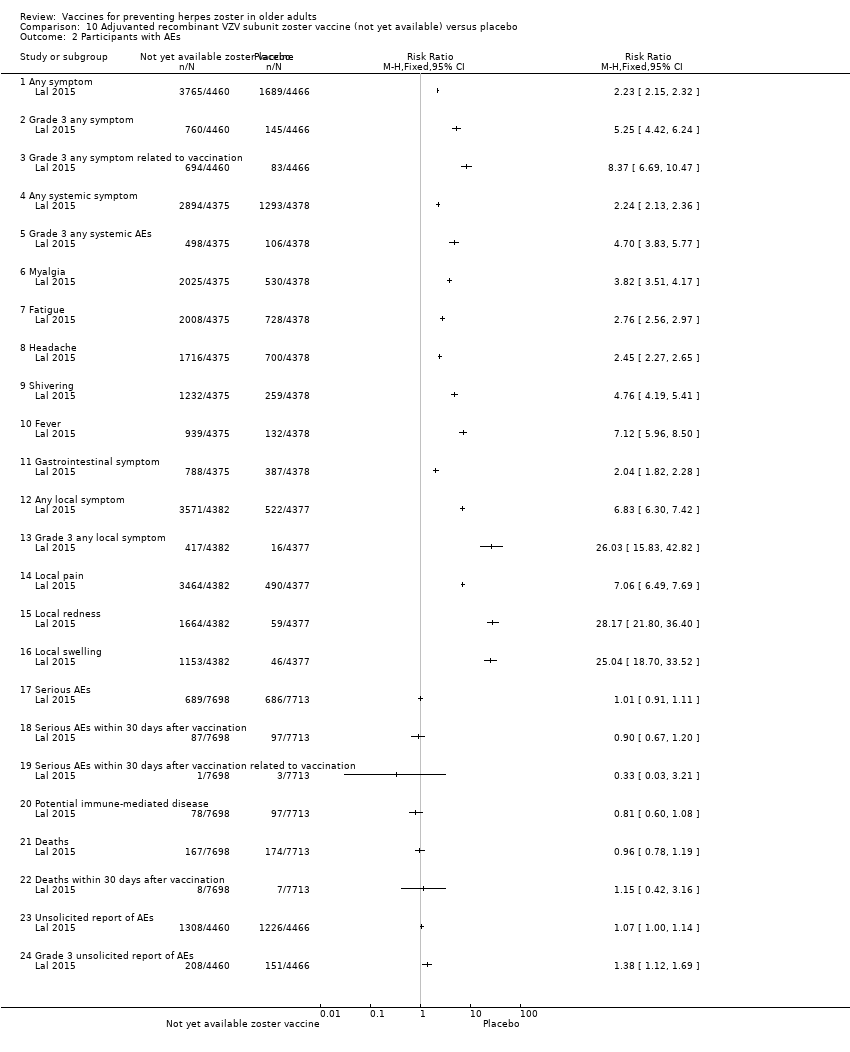
Comparison 10 Adjuvanted recombinant VZV subunit zoster vaccine (not yet available) versus placebo, Outcome 2 Participants with AEs.
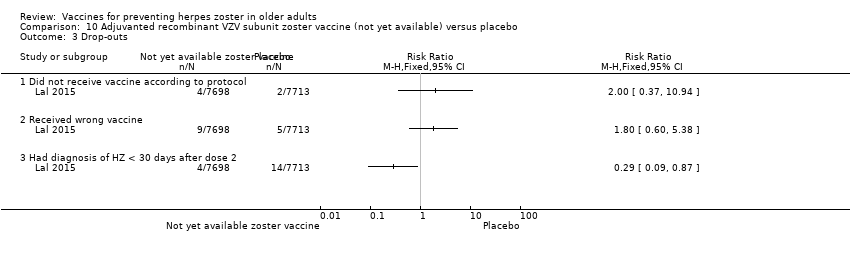
Comparison 10 Adjuvanted recombinant VZV subunit zoster vaccine (not yet available) versus placebo, Outcome 3 Drop‐outs.
| Available live attenuated VZV zoster vaccine versus placebo for preventing herpes zoster in older adults | ||||||
| Patient or population: healthy older adults Settings: outpatients Intervention: available live attenuated VZV zoster vaccine Comparison: placebo | ||||||
| Outcomes | Illustrative comparative risks* (95% CI) | Relative effect | No of participants | Quality of the evidence | Comments | |
| Assumed risk | Corresponding risk | |||||
| Placebo | Available live attenuated VZV zoster vaccine | |||||
| Incidence of herpes zoster Clinical and laboratory criteria | Study population | RR 0.49 | 38,546 | ⊕⊕⊕⊝ | Absolute risk for available live attenuated VZV zoster vaccine = 1.6% Absolute risk for placebo group = 3.3% | |
| 33 per 1000 | 16 per 1000 | |||||
| Participants with AEs: ≥ 1 serious AE regardless of type of storage of the vaccine Clinical and laboratory criteria | Study population | RR 1.08 | 50,896 | ⊕⊕⊕⊝ | Absolute risk for available live attenuated VZV zoster vaccine = 2.3% Absolute risk for placebo group = 2.2% | |
| 22 per 1000 | 23 per 1000 | |||||
| Participants with AEs: hospitalised Number of participants hospitalised | Study population | RR 1.00 | 6616 | ⊕⊕⊕⊝ | Absolute risk for available live attenuated VZV zoster vaccine = 34.1% Absolute risk for placebo group = 34.1% | |
| 341 per 1000 | 341 per 1000 | |||||
| Participants with AEs: injection site AEs Clinical and laboratory criteria | Study population | RR 2.99 (2.75 to 3.26) | 6986 | ⊕⊕⊕⊝ | Absolute risk for available live attenuated VZV zoster vaccine = 47.9% Absolute risk for placebo group = 16.0% | |
| 160 per 1000 | 479 per 1000 | |||||
| Drop‐outs: death Number of deaths | Study population | RR 1.01 | 50,687 | ⊕⊕⊕⊝ | Absolute risk for available live attenuated VZV zoster vaccine = 3.3% Absolute risk for placebo group = 3.2% | |
| 32 per 1000 | 33 per 1000 | |||||
| *The basis for the assumed risk (e.g. the median control group risk across studies) is provided in footnotes. The corresponding risk (and its 95% confidence interval) is based on the assumed risk in the comparison group and the relative effect of the intervention (and its 95% CI). | ||||||
| GRADE Working Group grades of evidence | ||||||
| 1Did not describe random sequence generation. | ||||||
| Adjuvanted recombinant VZV subunit zoster vaccine (not yet available) versus placebo for preventing herpes zoster in older adults | ||||||
| Patient or population: healthy older adults Comparison: placebo | ||||||
| Outcomes | Illustrative comparative risks* (95% CI) | Relative effect | No of participants | Quality of the evidence | Comments | |
| Assumed risk | Corresponding risk | |||||
| Placebo | Adjuvanted recombinant VZV subunit zoster vaccine (not yet available) versus placebo | |||||
| Incidence of herpes zoster 3.2 years follow‐up (≥ 60 yo) Clinical and laboratory criteria | Study population | RR 0.04 (0.02 to 0.1) | 8122 | ⊕⊕⊕⊝ | Absolute risk for adjuvanted recombinant VZV subunit zoster vaccine (not yet available) = 0.2% Absolute risk for placebo group = 3.4% | |
| 34 per 1000 | 2 per 1000 | |||||
| Participants with AEs: any local symptom Clinical criteria | Study population | RR 6.83 (6.30 to 7.42) | 8759 | ⊕⊕⊕⊝ | Absolute risk for adjuvanted recombinant VZV subunit zoster vaccine (not yet available) = 81.5% Absolute risk for placebo group = 11.9% | |
| 119 per 1000 | 815 per 1000 | |||||
| Participants with AEs: serious AEs Clinical and laboratory criteria | Study population | RR 1.01 (0.91 to 1.1) | 15,411 | ⊕⊕⊕⊝ | Absolute risk for adjuvanted recombinant VZV subunit zoster vaccine (not yet available) = 9.0% Absolute risk for placebo group = 8.9% | |
| 89 per 1000 | 90 per 1000 | |||||
| Participants with AEs: potential immune‐mediated disease Clinical and laboratory criteria | Study population | RR 0.81 (0.06 to 1.08) | 15,411 | ⊕⊕⊕⊝ | Absolute risk for adjuvanted recombinant VZV subunit zoster vaccine (not yet available) = 1.0% Absolute risk for placebo group = 1.3% | |
| 13 per 1000 | 10 per 1000 | |||||
| Participants with AEs: deaths Number of deaths Follow‐up: mean 3.2 years | Study population | RR 0.96 (0.78 to 1.19) | 15,411 | ⊕⊕⊕⊝ | Absolute risk for adjuvanted recombinant VZV subunit zoster vaccine (not yet available) = 2.2% Absolute risk for placebo group = 2.3% | |
| 23 per 1000 | 22 per 1000 | |||||
| *The basis for the assumed risk (e.g. the median control group risk across studies) is provided in footnotes. The corresponding risk (and its 95% confidence interval) is based on the assumed risk in the comparison group and the relative effect of the intervention (and its 95% CI). | ||||||
| GRADE Working Group grades of evidence | ||||||
| 1Did not describe allocation concealment and participant flow not clear. | ||||||
| Domain | Risk of bias |
| Allocation (selection bias): randomisation criteria | We graded 5 studies as having a low risk of bias for random sequence generation (selection bias) because they described how the randomisation was done (Chlibek 2013; Diez‐Domingo 2015; Lal 2015; Vermeulen 2012; Vesikari 2013). Chlibek 2013 stated that "Randomization was made using an algorithm that stratified by country, minimized for age, and included a block size of 11". In Diez‐Domingo 2015: "The subjects were randomised using an electronic case report form (e‐CRF)". Lal 2015 stated that "We randomly assigned participants in a 1:1 ratio to receive either vaccine or placebo using an online centralized randomization system". Vermeulen 2012 stated that "Subjects were randomised in a 1:1 ratio to receive two doses of either zoster vaccine or placebo, according to a computer‐generated, study‐centre specific allocation schedule". Vesikari 2013 used "blocks of randomisation, with stratification by age (70–79 y and ≥ 80 y) and country". The other 8 trials provided no details on the randomisation process and we therefore classified them as having an unclear risk of bias for this domain (Berger 1998; Chlibek 2014; Gilderman 2008; Levin 2000; Mills 2010; Murray 2011; Oxman 2005; Tyring 2007). |
| Allocation (selection bias): allocation criteria | We classified Chlibek 2013, Diez‐Domingo 2015, Lal 2015, Oxman 2005, Vermeulen 2012 and Vesikari 2013 as having low risk of bias because of adequate allocation concealment described by the trial authors as follows. Chlibek 2013: "Treatments were allocated at each site using a central randomisation system on the Internet". Diez‐Domingo 2015: "Allocation schedules were generated using a 1:1 ratio with permuted blocks of 4‐6". Lal 2015: "Participants were stratified according to region and age group (50 to 59, 60 to 69, and ≥70 years)". Oxman 2005: "Each study site received randomly ordered vials of zoster vaccine and placebo in separate boxes for each age stratum". Vermeulen 2012: "Allocation numbers were assigned sequentially by the study site personnel to subjects who met the study eligibility criteria, beginning with the lowest number available at the study centre, after informed consent and medical history had been obtained. The allocation schedule was generated by a sponsor statistician not otherwise associated with the zoster vaccine program". Vesikari 2013: "The allocation schedule was generated using balanced permuted blocks of randomisation" Berger 1998, Chlibek 2014, Gilderman 2008, Levin 2000, Mills 2010, Murray 2011 and Tyring 2007 did not report details of allocation concealment and we therefore classified these trials as having an 'unclear' risk of bias for this domain. |
| Blinding (performance bias and detection bias) | 8 trials were double‐blind and we considered them at low risk for this domain (Berger 1998; Chlibek 2013; Gilderman 2008; Lal 2015; Murray 2011; Oxman 2005; Tyring 2007; Vermeulen 2012). The Berger 1998 trial had 4 arms: 3 received different concentrations of a live attenuated VZV/Oka vaccine under double‐blind conditions. The 4th arm used a pneumococcal polysaccharide vaccine as a control for reactogenicity and immune response, under single‐blind conditions Chlibek 2013 stated that "Both vaccine recipients and observers responsible for evaluations were blinded to which formulation was administered". Gilderman 2008 included the following comment: "Double‐blind, with in‐house blinding. The vaccine and placebo were indistinguishable from each other." Lal 2015 reported "Because the appearance of the reconstituted HZ/su vaccine differed from the placebo solution, injections were prepared and administered by study staff who did not participate in any study assessment." In Murray 2011, the authors reported that "The zoster vaccine and placebo were reconstituted with sterile diluent immediately prior to administration, and were indistinguishable from each other in appearance. Placebo was the vaccine stabiliser of zoster vaccine with no live virus. An independent Data Monitoring Committee was established for continuous safety oversight during the study." Oxman 2005 provided the following statement: "Since the reconstituted zoster vaccine had a different appearance from the placebo, reconstitution and administration were performed by technicians who did not otherwise interact with subjects, evaluate outcomes or adverse events, answer the telephone or enter study data." Tyring 2007 states "Blinded subject, investigator and sponsor. The 2 potency formulations were indistinguishable in appearance". Vermeulen 2012 declares that "The subject, investigator, clinical study site personnel, and sponsor personnel directly involved in the study were blinded to whether the subject received zoster vaccine or placebo. They remained blinded until all subjects completed the study. The clinical materials were prepared by an unblinded vaccine coordinator at each clinical site, because of differences in the turbidity of the study vaccine and placebo. Each vial of vaccine or placebo was labelled with a subject‐specific allocation number. The unblinded vaccine coordinator reconstituted the study vaccine/placebo and wrapped the syringe in an opaque label containing subject allocation number and time of reconstitution. The unblinded vaccine coordinator did not have any contact with the subject and did not disclose the contents of the syringe to the person administering the study vaccine/placebo." We classified 3 trials as having a 'low risk of bias' only for the domain "blinding of participants and personnel (performance bias)" although "personnel were not blinded" because the participants themselves were blinded and they were the ones who described adverse events in diary cards (Chlibek 2014; Diez‐Domingo 2015; Vesikari 2013). Please see below: Chlibek 2014 described: "solicited local reactions (pain, redness and swelling) and general reactions (fatigue, fever, headache and myalgia) were recorded by subjects on diary cards for seven days after each vaccination". Diez‐Domingo 2015 stated: "Between visit 1 and 2, the participants were given a diary card to record their temperature if they were febrile (oral temperature ≥38.3 ◦C), occurrence of any solicited injection‐site (erythema, swelling and pain) adverse reactions (Days 0–4) and any unsolicited injection‐site adverse reactions, varicella, varicella‐like rashes, HZ and zoster‐like rashes and other systemic adverse events (AEs) (Days 0–28). They were also asked to report any serious AEs (SAEs) that occurred at any time during the study". Vesikari 2013 provided the following description: "Solicited injection‐site reactions (erythema, swelling, and pain) occurring within 4 days of vaccination were recorded by participants in a diary card. Other injection‐site reactions and systemic AEs were recorded in the diary card for up to 28 d following each vaccination." 1 trial was an open study and we considered it to be at high risk of bias for blinding (Levin 2000). We classified Mills 2010 as 'unclear risk of bias' because the authors did not provide any information on blinding. |
| Incomplete outcome data (attrition bias) | We classified Chlibek 2013, Chlibek 2014, Diez‐Domingo 2015, Gilderman 2008, Murray 2011, Oxman 2005, Tyring 2007, Vermeulen 2012 and Vesikari 2013 as 'low risk' in this domain because the flow of patients was clear. Mills 2010 had no data on the first arm of the cross‐over study and we therefore classified it as 'high risk'. We also classified Lal 2015 as high risk of bias because the patient flow is not clear. We classified Berger 1998 and Levin 2000 as 'unclear risk' as they did not provide any information for this domain. |
| Selective reporting (reporting bias) | We classified the following studies as 'low risk' in this domain. In Berger 1998, the adverse events originally defined by the authors were presented for all groups. Chlibek 2013 presented the adverse events originally defined by the authors in all groups that received 2 doses of 2 different amounts of adjuvant plus gE subunit VZV, unadjuvanted gE or saline. Chlibek 2014 also presented the adverse events associated with 2 doses of different amounts of adjuvanted gE, unadjuvanted gE or saline. Diez‐Domingo 2015 presented all adverse events proposed in the methodology in both groups (intramuscular versus subcutaneous zoster vaccine). Gilderman 2008 reported all adverse events that the investigators selected, for both groups (refrigerated versus frozen zoster vaccines). In Lal 2015, the data for efficacy and safety of the adjuvanted recombinant zoster vaccine proposed in the methods were described in the results. Mills 2010 described in the results all of the adverse events listed in the methods. Murray 2011 presented in the results all the serious adverse events that were defined in the methods section. Oxman 2005 reported in the results all the data on effectiveness and adverse events that the authors proposed in their methodology. Tyring 2007 provided in the results all the adverse events defined in the methods section, for both higher‐potency and lower‐potency zoster vaccines. Vermeulen 2012 described in their results all adverse events listed by the authors in the methods for both groups and Vesikari 2013 reported all the data that had been proposed in their methodology in the results section, for the 3 groups who received 2 doses of zoster vaccines given at different times or a single dose. We classified Levin 2000 as having an 'unclear' risk of bias for this domain because it was basically a study that analysed immune response. |
| Other potential sources of bias | We did not identify any significant aspects pertaining to this domain. |
| Comparison (studies) | Results |
| Available live attenuated VZV zoster vaccineversus placebo | The risk of herpes zoster‐like rash up to 42 days post‐vaccination (Oxman 2005) was lower in the vaccinated group (RR 0.47, 95% CI 0.27 to 0.84) than the placebo group but without a significant RD (Analysis 1.3.7). The following systemic AEs were not significantly different between the groups receiving zoster vaccine or placebo: systemic AEs (Mills 2010; Oxman 2005; Vermeulen 2012), systemic pruritus (Vermeulen 2012), varicella‐like rash not at injection site (from day of vaccination to day 42) (Oxman 2005; Vermeulen 2012), rash unrelated to HZ (from day of vaccination to day 42) (Oxman 2005), 1 or more SAE (including death) (Mills 2010; Murray 2011; Oxman 2005; Vermeulen 2012), vaccine‐related SAEs (Mills 2010; Murray 2011; Oxman 2005), discontinuation due to a vaccine‐related AE (Mills 2010; Vermeulen 2012), hospitalisation (Oxman 2005), and hospitalisation related to HZ (Oxman 2005). Specific injection site AEs were more frequent in the vaccinated group. Specific risks for individual AEs were:
Varicella‐like rash at injection site (up to day 42) was also more frequent in the vaccinated group: RR 2.86, 95% CI 1.21 to 6.76 (Analysis 1.3.23) (Oxman 2005), but without a significant RD due to the small number of events. Duration of injection site AEs In general, injection site AEs lasted longer in the zoster vaccine group. There were significant differences with respect to the duration of the following local AEs: erythema, with a mean difference (MD) of 2.40 days (95% CI 1.56 to 3.24) (Analysis 1.4.1), swelling MD 1.90 days (95% CI 1.35 to 2.45) (Analysis 1.4.2) and pruritus MD 2.40 days (95% CI 1.32 to 3.48) (Analysis 1.4.5). The duration of pain and haematoma did not differ significantly between the groups, MD 1.00 (95% CI ‐0.10 to 2.10) (Analysis 1.4.3) and MD ‐0.50 (95% CI ‐5.52 to 4.52) (Analysis 1.4.6) respectively. The duration of rash was longer in the placebo compared to the vaccine group: RR ‐16.60 (95% CI ‐33.68 to 0.48) (Analysis 1.4.4). |
| High‐potency versus low‐potency zoster vaccine (Tyring 2007) | The comparison of high versus low‐potency zoster vaccine yielded no significant differences between groups for the following AEs: vaccine‐related AEs, systemic vaccine‐related AEs and vaccine‐related serious AEs (death). |
| Refrigerated versus frozen zoster vaccine | Compared refrigerated versus frozen zoster vaccine and reported no significant differences between groups for the following AEs: 1 or more AEs, vaccine‐related AEs, systemic AEs, systemic vaccine‐related AEs, serious AEs, vaccine‐related serious AEs or death. However, there were more injection site AEs in the group receiving frozen vaccines (RR 0.77, 95% CI 0.60 to 0.98) (Analysis 3.1.8). |
| Zoster vaccine versus pneumo 23 | One study compared 3 different concentrations of plaque‐forming units (pfu) of live attenuated VZV and presented the following adverse events: 3200 pfu VZV/dose versus pneumo 23 There was a lower incidence of 1 or more injection site reactions in the group vaccinated with the 3200 pfu/dose zoster vaccine (RR 0.61, 95% CI 0.41 to 0.91) (Analysis 5.1.1) as well as pain at the injection site (RR 0.49, 95% CI 0.30 to 0.81) (Analysis 5.1.3). There were no significant differences between the 3200 pfu/dose zoster vaccine and the pneumo 23 vaccine for the following local adverse events: induration (≥ 2 cm diameter injection site), probably vaccine‐related injection site pain, redness (≥ 2 cm diameter injection site), pruritus or vesicles (no patients had vesicles in the 3200 pfu/dose zoster vaccine nor the pneumo 23 groups). 8500 pfu VZV/dose versus pneumo 23 There was a lower incidence of 1 or more injection site reaction in the group vaccinated with the 8500 pfu/dose zoster vaccine (RR 0.63, 95% CI 0.43 to 0.93) (Analysis 5.2.1). There were no significant differences for the following injection site AEs between participants who received the 8500 pfu/dose VZV vaccine and those who received the pneumo 23 vaccine: induration (≥ 2 cm diameter injection site), pain (injection site), probably vaccine‐related injection site pain, redness, pruritus and vesicles. 41,650 pfu VZV/dose VZV versus pneumo 23 Participants receiving the 41,650 pfu/dose zoster vaccine had significantly lower rates of one or more injection site reaction (RR 0.41, 95% CI 0.24 to 0.68) (Analysis 5.3.1) and pain at injection site (RR 0.43, 95% CI 0.25 to 0.74) (Analysis 5.3.3) than those receiving the pneumo 23 vaccine. There were no significant differences between the groups for the following injection site AEs: induration (≥ 2 cm diameter injection site), probably vaccine‐related injection site pain, redness (≥ 2 cm diameter injection site), pruritus and vesicles (no patients had vesicles in the 41,650 pfu/dose zoster vaccine nor the pneumo 23 vaccine groups). |
| Zoster vaccine intramuscular route versus zoster vaccine subcutaneous route | Compared intramuscular (IM) versus subcutaneous (SC) zoster vaccine and reported that compared to the IM group, participants who received SC vaccines had a significantly higher incidence of the following AEs:
There were no significant differences between groups for the following AEs: all systemic AEs: RR 1.03, 95% CI 0.70 to 1.51 (Analysis 6.1.3); vaccine‐related systemic AE: RR 0.93, 95% CI 0.44 to 1.98 (Analysis 6.1.4); headache considered as vaccine‐related by the investigator: RR 0.75, 95% CI 0.17 to 3.32 (Analysis 6.1.5); unsolicited injection site reaction: RR 0.65 95% CI 0.29 to 1.45 (Analysis 6.1.7); severe injection site erythema (> 10 cm): RR 0.67 95% CI 0.11 to 3.96 (Analysis 6.1.9); severe injection site pain (inability to work or usual activity): RR 1.01, 95% CI 0.14 to 7.06 (Analysis 6.1.11); severe injection site swelling (> 10 cm): RR 0.25, 95% CI 0.03 to 2.23 (Analysis 6.1.13). No participant withdrew from the trial because of AE (Analysis 6.1.15). |
| 2 doses of a zoster vaccine versus a single dose and also 2 doses given at different intervals | Zoster vaccine 1‐month schedule versus zoster vaccine 3‐month schedule There was no statistical difference between participants who received the doses of zoster vaccine 2 months apart compared to those receiving the doses 3 months apart: AE RR 1.10, 95% CI 0.91 to 1.31 (Analysis 7.1.1), vaccine‐related AE RR 1.00, 95% CI 0.81 to 1.24 (Analysis 7.1.2); serious AE RR 0.95, 95% CI 0.14 to 6.70 (Analysis 7.1.3); withdrawal due to AE RR 2.86, 95% CI 0.12 to 69.80 (Analysis 7.1.5); systemic AE RR 1.34, 95% CI 0.90 to 2.00 (Analysis 7.1.8); vaccine‐related systemic AE RR 1.27, 95% CI 0.45 to 3.60 (Analysis 7.1.9); rash of interest non‐injection site rashes RR 0.95, 95% CI 0.06 to 15.14 (Analysis 7.1.10); varicella/varicella‐like rash RR 0.95, 95% CI 0.06 to 15.14 (Analysis 7.1.11); injection site reaction RR 0.99, 95% CI 0.80 to 1.23 (Analysis 7.1.13); solicited injection site reaction RR 1.00, 95% CI 0.81 to 1.25 (Analysis 7.1.14); unsolicited injection site reaction RR 0.41, 95% CI 0.11 to 1.56 (Analysis 7.1.15); erythema injection site RR 1.01, 95% CI 0.80 to 1.27 (Analysis 7.1.16); pain injection site RR 0.84, 95% CI 0.57 to 1.25 (Analysis 7.1.17); swelling injection site RR 1.05, 95% CI 0.75 to 1.47 (Analysis 7.1.18). No participants, from either group, reported the following AE: vaccine‐related serious AE (Analysis 7.1.4); vaccine‐related withdrawal due to AE (Analysis 7.1.6); non‐serious vaccine‐related withdrawal due to AE (Analysis 7.1.7) and herpes zoster/zoster‐like rash (Analysis 7.1.12). Zoster vaccine 1 month schedule versus zoster vaccine single dose Only participants with systemic AE: there were significant differences in favour of the 2 doses 1 month apart, with a higher incidence in the single dose group: RR 0.74, 95% CI 0.56 to 0.97, RD ‐0.07, 95% CI ‐0.13 to ‐0.01 and NNTH 14.3, 95% CI 7.6 to 100 (Analysis 7.2.8). For most AEs, there was no statistical difference: AE RR 0.92, 95% CI 0.80 to 1.05 (Analysis 7.2.1), vaccine‐related AE RR 0.91, 95% CI 0.77 to 1.08 (Analysis 7.2.2); serious AE RR 0.72, 95% CI 0.16 to 3.30 (Analysis 7.2.3); withdrawal due to AE RR 0.36, 95% CI 0.05 to 2.82 (Analysis 7.1.5); vaccine‐related withdrawal due to AE RR 0.21, 95% CI 0.01 to 3.74 (Analysis 7.2.6); non‐serious vaccine‐related withdrawal due to AE RR 0.21, 95% CI 0.01 to 3.74 (Analysis 7.2.7); vaccine‐related systemic AE RR 0.54, 95% CI 0.26 to 1.12 (Analysis 7.2.9); rash of interest non‐injection site rashes RR 1.61, 95% CI 0.15 to 17.72 (Analysis 7.2.10); varicella/varicella‐like rash RR 9.66, 95% CI 0.39 to 236.25 (Analysis 7.2.11); herpes zoster/zoster‐like rash RR 0.64, 95% CI 0.03 to 13.36 (Analysis 7.2.12); injection site reaction RR 0.93, 95% CI 0.78 to 1.10 (Analysis 7.2.13); solicited injection site reaction RR 0.94, 95% CI 0.79 to 1.11 (Analysis 7.2.14); unsolicited injection site reaction RR 0.35, 95% CI 0.11 to 1.13 (Analysis 7.2.15); injection site erythema RR 0.98, 95% CI 0.81 to 1.17 (Analysis 7.2.16); injection site pain RR 0.74, 95% CI 0.54 to 1.01 (Analysis 7.2.17); injection site swelling RR 1.08, 95% CI 0.82 to 1.41 (Analysis 7.2.18). There were no participants with vaccine‐related serious AE in either group (Analysis 7.2.4). Zoster vaccine 3 month schedule versus zoster vaccine single dose The participants in the group that received a single dose had a higher incidence of the following AE in comparison to those in the group that received 2 doses, 3 months apart: AEs RR 0.84, 95% CI 0.72 to 0.97; RD ‐0.09; 95% CI ‐0.17 to ‐0.02 and NNTH 11.1, 95% CI 5.9 to 50 (Analysis 7.3.1), systemic AEs RR 0.55, 95% CI 0.39 to 0.76, RD ‐0.13, 95% CI ‐0.18 to ‐0.07 and NNTH 7.6, 95% CI 5.6 to 14.3 (Analysis 7.3.8) and vaccine‐related systemic AE RR 0.42, 95% CI 0.18 to 0.98), RD ‐0.04, 95% CI ‐0.06 to ‐0.01 and NNTH 25.0, 95% CI 16.6 to 100 (Analysis 7.3.9). There were no significant differences between these groups in relation to the following AEs: vaccine‐related AE RR 0.91, 95% CI 0.77 to 1.08 (Analysis 7.3.2); serious AE RR 0.75, 95% CI 0.16 to 3.46 (Analysis 7.3.3); withdrawal due to AE RR 0.18, 95% CI 0.01 to 3.04 (Analysis 7.3.5); vaccine‐related withdrawal due to AE RR 0.23, 95% CI 0.01 to 3.93 (Analysis 7.3.6); non‐serious vaccine‐related withdrawal due to AE RR 0.23, 95% CI 0.01 to 3.93 (Analysis 7.3.7); rash of interest non‐injection site rashes RR 1.69, 95% CI 0.15 to 18.60 (Analysis 7.3.10); varicella/varicella‐like rash RR 10.14, 95% CI 0.41 to 247.92 (Analysis 7.3.11); herpes zoster/zoster‐like rash RR 0.68, 95% CI 0.03 to 14.02 (Analysis 7.3.12); injection site reaction RR 1.10, 95% CI 0.79 to 1.11 (Analysis 7.3.13); solicited injection site reaction RR 0.93, 95% CI 0.78 to 1.11 (Analysis 7.3.14); unsolicited injection site reaction RR 0.85, 95% CI 0.38 to 1.91 (Analysis 7.3.15); injection site erythema RR 0.97, 95% CI 0.80 to 1.17 (Analysis 7.3.16); injection site pain RR 0.87, 95% CI 0.65 to 1.17 (Analysis 7.3.17); injection site swelling RR 1.03, 95% CI 0.77 to 1.36 (Analysis 7.3.18). There were no participants with vaccine‐related serious AE in either group (Analysis 7.3.4). |
| AE: adverse event | |
| Comparison (studies) | Results |
| Adjuvanted recombinant VZV subunit zoster vaccine: lower or higher quantities of adjuvants plus gE subunit VZV versus unadjuvanted gE or saline | Compared 4 groups that received either lower (AS01E) or higher (AS01B) volumes of adjuvants plus gE subunit VZ or unadjuvanted gE or saline injections. 50 μg gE/AS01E versus 50 μg gE/AS01B There was a significantly higher incidence of AEs in the participants who received a higher quantity of adjuvant (AS01B):
There were no significant differences between groups for all other AEs: any grade 3 symptom; any general symptom, any general grade 3 symptom, grade 3 fatigue, fever, gastrointestinal symptoms, grade 3 gastrointestinal symptoms, grade 3 headache, myalgia, grade 3 myalgia, any grade 3 local symptom, local grade 3 pain, local grade 3 redness, local swelling and local grade 3 swelling, consent withdrawal, loss to follow‐up and serious AE. No participants had grade 3 fever in either group. 50 μg gE/AS01E versus 50 μg gE/saline (unadjuvanted)
All these AE differences were favourable to the unadjuvanted gE group. There were no significant differences between the groups for the following AEs: any grade 3 symptom, any general grade 3 symptom, fatigue, grade 3 fatigue, gastrointestinal symptoms, grade 3 gastrointestinal symptoms, headache, grade 3 myalgia, any local grade 3 symptom, local grade 3 pain, local grade 3 redness and local grade 3 swelling, consent withdrawal, loss to follow‐up and serious AE. No participants had grade 3 fever or grade 3 headache in either group. 50 μg gE/AS01B versus 50 μg gE/saline (unadjuvanted)
All these AE differences were favourable to unadjuvanted gE. There were no significant differences between the groups for the following AEs: any grade 3 symptom, any general grade 3 symptom, grade 3 fatigue, gastrointestinal symptoms, grade 3 headache, grade 3 myalgia, any local grade 3 symptom, local grade 3 pain, local grade 3 redness and local grade 3 swelling, consent withdrawal, loss to follow‐up and serious AE. No participant had grade 3 fever or grade 3 gastrointestinal symptoms in either group. 50 μg gE/AS01E versus saline
All differences in these AEs were favourable to the saline group. There were no significant differences in the following AEs between the groups:any grade 3 symptom, any general grade 3 symptom, fatigue, grade 3 fatigue, fever, gastrointestinal symptoms, grade 3 gastrointestinal symptoms, headache, grade 3 headache, grade 3 myalgia, any local grade 3 symptom, local grade 3 pain, local redness, local grade 3 redness, local swelling and local grade 3 swelling, consent withdrawal, loss to follow‐up and serious AE No participants had grade 3 fever or grade 3 headache in either group. 50 μg gE/AS01B versus saline
All AE differences were favourable to saline. There was no significant difference in AEs between groups for the following: any grade 3 symptom, any general grade 3 symptom, grade 3 fatigue, fever, gastrointestinal symptoms, grade 3 gastrointestinal symptoms, grade 3, headache, grade 3 myalgia, any local grade 3 symptom, local grade 3 pain, local grade 3 redness, local swelling and local grade 3 swelling, consent withdrawal, loss to follow‐up and serious AEs. No participant had grade 3 fever in either group. 50 μg gE/saline (unadjuvanted) versus saline
There were no significant differences between groups for the following AEs: any grade 3 symptom, any general symptom, any general grade 3 symptom, fatigue, grade 3 fatigue, fever, gastrointestinal symptoms, grade 3 gastrointestinal symptoms, headache, myalgia, grade 3 myalgia, any local symptom, local pain, local redness and local swelling or consent withdrawal. No participant, in either group had grade 3 fever, grade 3 headache, any local grade 3 symptom, local grade 3 pain, local grade 3 redness, local grade 3 swelling, loss to follow‐up and serious AE. |
| Adjuvanted recombinant VZV subunit zoster vaccine: three groups of VZV subunit gE in 3 different quantities versus unadjuvanted gE or saline | 3 groups of VZV plus gE were compared in 3 different quantities, 1 group that received unadjuvanted gE and 1 group that received only saline 25 µg gE/AS01B versus 50 µg gE/AS01B There was no difference in the incidence of the following AEs: any fatigue, grade 3 fatigue, any fever, grade 3 fever, any headache, grade 3 headache, any myalgia, grade 3 myalgia, local pain, local grade 3 pain, local redness, local grade 3 redness, local swelling, local grade 3 swelling, consent withdrawal, loss to follow‐up and serious AEs. 25 µg gE/AS01B versus 100 µg gE/AS01B There were no differences in the incidence of the following AEs: any fatigue, grade 3 fatigue, any fever, any headache, grade 3 headache, any myalgia, grade 3 myalgia, local pain, grade 3 local pain, local redness, local grade 3 redness, local swelling, local grade 3 swelling, consent withdrawal, loss to follow‐up and serious AEs. 50 µg gE/AS01B versus 100 µg gE/AS01B
There were no differences in the incidence of all the others AEs: any fatigue, grade 3 fatigue, any fever, grade 3 fever, any headache, grade 3 headache, grade 3 myalgia, local pain, local grade 3 pain, local redness, local grade 3 redness, local swelling, local grade 3 swelling, consent withdrawal and serious AEs 25 µg gE/AS01B versus 100 µg gE/saline (unadjuvanted gE)
All these differences in AEs were favourable to unadjuvanted gE. There were no differences in the incidence of the following AEs: grade 3 fatigue, any fever, any headache, grade 3 headache, grade 3 myalgia, local grade 3 pain, local grade 3 redness, local grade 3 swelling, consent withdrawal, loss to follow‐up and serious AEs. No participant had grade 3 fever in either of the groups. 50 µg gE/AS01B versus 100 µg gE/saline (unadjuvanted gE)
All these differences of AEs were favourable to unadjuvanted gE. There were no differences in the incidence of the following AEs: grade 3 fatigue, any fever, grade 3 headache, grade 3 myalgia, local grade 3 pain, local grade 3 redness, local grade 3 swelling, consent withdrawal, loss to follow‐up and serious AEs. No participant had grade 3 fever in either of the groups 100 µg gE/AS01B versus 100 µg gE/saline (unadjuvanted gE)
All these differences in AEs were favourable to unadjuvanted gE. There were no differences in the incidence of the following AEs: grade 3 fatigue, any fever, grade 3 headache, grade 3 myalgia, local grade 3 pain, local grade 3 redness, local grade 3 swelling, consent withdrawal, loss to follow‐up and serious AEs. No participant had grade 3 fever in either of the groups. 25 µg gE/AS01B versus saline + 100 µg gE/AS01B
All differences in AEs were favourable to saline + 100 µg gE/AS01B. There were no differences in the incidence of the following AEs:, any fatigue, grade 3 fever, any headache, grade 3 headache, grade 3 myalgia, local grade 3 pain, local grade 3 redness, local swelling, local grade 3 swelling, consent withdrawal, loss to follow‐up and serious AEs. No participant had grade 3 fever in either of the groups. 50 µg gE/AS01B versus saline + 100 µg gE/AS01B
All differences in AEs were favourable to saline + 100 µg gE/AS01B. There were no differences in the incidence of the following AEs: grade 3 fatigue, any fever, grade 3 fever, grade 3 headache, grade 3 myalgia, local grade 3 pain, local redness, local grade 3 redness, local swelling, local grade 3 swelling, consent withdrawal, loss to follow‐up and serious AEs. 100 µg gE/AS01B versus saline + 100 µg gE/AS01B
All differences in AEs were favourable to saline + 100 µg gE/AS01B. There were no difference in the incidence of the following AEs: grade 3 fatigue, headache, grade 3 headache, grade 3 myalgia, local grade 3 pain, local grade 3 redness, local swelling, local grade 3 swelling, consent withdrawal, loss to follow‐up and serious AEs. No participant had grade 3 fever in either of the groups. Saline + 100 µg gE/AS01B versus 100 µg gE/saline (unadjuvanted gE)
All differences in AEs were favourable to 100 µg gE/saline. There were no differences in the incidence of the following AEs: any fatigue, grade 3 fatigue, any fever, any headache, any myalgia, grade 3 myalgia, local grade 3 pain, local grade 3 redness, consent withdrawal, loss to follow‐up and serious AEs. No participant had grade 3 fever, grade 3 headache and local grade 3 swelling in either of the groups. |
| Adjuvanted recombinant VZV subunit zoster vaccine (not yet available) versus placebo (Lal 2015) | The AEs related the comparison between adjuvanted recombinant VZV subunit zoster vaccine (not yet available) and placebo are shown below:
|
| AEs: adverse events | |
| Drop‐outs of all included studies | Available live attenuated VZV zoster vaccine versus placebo The pooled data from the studies that compared zoster vaccine and placebo showed no differences in the reasons for drop‐outs (Analysis 1.4): for any reason (RR 0.99, 95% CI 0.91 to 1.08) (Analysis 1.4.1) (Mills 2010; Oxman 2005; Vermeulen 2012), for death (RR 1.01, 95% CI 0.92 to 1.11) (Analysis 1.4.2) (Mills 2010; Murray 2011; Oxman 2005), for withdrawal of consent (RR 0.87, 95% CI 0.64 to 1.19) (Analysis 1.4.3) (Murray 2011; Oxman 2005; Vermeulen 2012), for loss to follow‐up (RR 1.29, 95% CI 0.97 to 1.73) (Analysis 1.4.4) (Mills 2010; Murray 2011; Oxman 2005; Vermeulen 2012), for protocol deviation (RR 1.58, 95% CI 0.41 to 6.02) (Analysis 1.4.5) (Murray 2011; Vermeulen 2012), for clinical AE (RR 1.36, 95% CI 0.73 to 2.54) (Analysis 1.4.6) (Murray 2011; Vermeulen 2012) and for physician decision (RR 0.20, 95% CI 0.01 to 4.17) (Analysis 1.4.7) (Murray 2011). In Mills 2010, Oxman 2005 and Vermeulen 2012 consent was withdrawn after the intervention. In Murray 2011, some patients apparently withdrew consent after randomisation, but the trial authors do not describe the exact number who withdrew consent after the intervention. The pooled data from the studies that compared zoster vaccine and placebo (Mills 2010; Murray 2011; Oxman 2005) showed no differences in the reasons for participants with no follow‐up (Analysis 1.5). High‐potency versus low‐potency zoster vaccine: There were no differences between the groups (Analysis 2.6). Refrigerated versus frozen zoster vaccine: There were no differences between the groups (Analysis 3.2). Zoster vaccine IM route versus zoster vaccine SC route: There were no withdrawals due to AE in either group (Analysis 6.1.15). 2 doses of a zoster vaccine versus a single dose and also 2 doses given at different intervals: There were no differences between the groups for participants with withdrawal due to AE (Analysis 7.1.5; Analysis 7.2.5; Analysis 7.3.5) (Vesikari 2013). Adjuvanted recombinant VZV subunit zoster vaccine (not yet available) ‐ lower or higher volumes of adjuvants plus gE subunit VZV or unadjuvanted gE or saline injections: There were no differences between the groups for the following reasons of drop‐out: participants with consent withdrawal and participants with loss to follow‐up (Chlibek 2013). 3 groups of VZV subunit gE in 3 different quantities versus unadjuvanted gE or saline: There were no differences between groups for participants with withdrawal of consent or participants with loss to follow‐up for all comparisons provided (Chlibek 2014). Adjuvanted recombinant VZV subunit zoster vaccine not yet available versus placebo:Lal 2015 described 3 reasons to drop‐out: did not receive vaccine according to protocol (Analysis 10.3.1), received wrong vaccine (Analysis 10.3.2) and had diagnosis of HZ less than 30 days after dose 2 (Analysis 10.3.3). For the first 2 there were no differences between the groups. The last outcome had a RR of 0.29 (95% CI 0.09 to 0.87) but no RD and we considered it as drop‐out and not an incidence outcome since it is related to participants aged > 50 years old and not with our age group of interest (participants 60 years old or more). |
| AE: adverse event | |
| Outcome or subgroup title | No. of studies | No. of participants | Statistical method | Effect size |
| 1 Incidence of herpes zoster Show forest plot | 2 | Risk Ratio (M‐H, Fixed, 95% CI) | Totals not selected | |
| 1.1 3.1 years follow‐up | 1 | Risk Ratio (M‐H, Fixed, 95% CI) | 0.0 [0.0, 0.0] | |
| 1.2 30 days of vaccination | 1 | Risk Ratio (M‐H, Fixed, 95% CI) | 0.0 [0.0, 0.0] | |
| 1.3 42 days of vaccination | 2 | Risk Ratio (M‐H, Fixed, 95% CI) | 0.0 [0.0, 0.0] | |
| 1.4 3.3 to 7.8 years after vaccination substudy | 1 | Risk Ratio (M‐H, Fixed, 95% CI) | 0.0 [0.0, 0.0] | |
| 1.5 Mean 5 years follow‐up | 1 | Risk Ratio (M‐H, Fixed, 95% CI) | 0.0 [0.0, 0.0] | |
| 2 Incidence of herpes zoster with ZBPI ADL. Severity of interference scores of 300 or greater (high score is worse) Show forest plot | 1 | Risk Ratio (M‐H, Fixed, 95% CI) | Totals not selected | |
| 3 Participants with AEs Show forest plot | 4 | Risk Ratio (M‐H, Fixed, 95% CI) | Subtotals only | |
| 3.1 One or more AEs | 3 | 6986 | Risk Ratio (M‐H, Fixed, 95% CI) | 1.70 [1.61, 1.80] |
| 3.2 Vaccine‐related AEs | 1 | 209 | Risk Ratio (M‐H, Fixed, 95% CI) | 4.63 [2.64, 8.12] |
| 3.3 Systemic AEs | 3 | 6986 | Risk Ratio (M‐H, Fixed, 95% CI) | 1.07 [0.98, 1.16] |
| 3.4 Systemic pruritus | 1 | 209 | Risk Ratio (M‐H, Fixed, 95% CI) | 7.07 [0.37, 135.13] |
| 3.5 Vaccine‐related systemic AEs | 2 | 6777 | Risk Ratio (M‐H, Fixed, 95% CI) | 1.29 [1.06, 1.57] |
| 3.6 Varicella‐like rash not at injection site (day of vaccination to day 42) | 2 | 38755 | Risk Ratio (M‐H, Fixed, 95% CI) | 1.12 [0.58, 2.18] |
| 3.7 Herpes zoster‐like rash (day of vaccination to day 42) | 1 | 38546 | Risk Ratio (M‐H, Fixed, 95% CI) | 0.47 [0.27, 0.84] |
| 3.8 Rash unrelated to herpes zoster (day of vaccination to day 42) | 1 | 38546 | Risk Ratio (M‐H, Fixed, 95% CI) | 0.96 [0.86, 1.07] |
| 3.9 ≥ 1 serious AEs regardless of type of storage of the vaccine | 4 | 50896 | Risk Ratio (M‐H, Fixed, 95% CI) | 1.08 [0.96, 1.20] |
| 3.10 Vaccine‐related serious AEs | 3 | 50687 | Risk Ratio (M‐H, Fixed, 95% CI) | 1.00 [0.25, 4.00] |
| 3.11 Discontinued due to vaccine‐related AEs | 2 | 370 | Risk Ratio (M‐H, Fixed, 95% CI) | 5.05 [0.25, 103.88] |
| 3.12 Hospitalised | 1 | 6616 | Risk Ratio (M‐H, Fixed, 95% CI) | 1.00 [0.93, 1.07] |
| 3.13 Hospitalisation related to herpes zoster | 1 | 6616 | Risk Ratio (M‐H, Fixed, 95% CI) | 0.81 [0.25, 2.67] |
| 3.14 Injection site AEs | 3 | 6986 | Risk Ratio (M‐H, Fixed, 95% CI) | 2.99 [2.75, 3.26] |
| 3.15 Erythema inoculation site | 2 | 6825 | Risk Ratio (M‐H, Fixed, 95% CI) | 5.15 [4.51, 5.87] |
| 3.16 Pain inoculation site | 2 | 6825 | Risk Ratio (M‐H, Fixed, 95% CI) | 4.14 [3.67, 4.68] |
| 3.17 Pruritus inoculation site | 2 | 6825 | Risk Ratio (M‐H, Fixed, 95% CI) | 6.91 [4.87, 9.82] |
| 3.18 Swelling inoculation site | 2 | 6825 | Risk Ratio (M‐H, Fixed, 95% CI) | 5.85 [4.96, 6.91] |
| 3.19 Warmth inoculation site | 2 | 6825 | Risk Ratio (M‐H, Fixed, 95% CI) | 5.15 [2.75, 9.66] |
| 3.20 Rash inoculation site | 1 | 6616 | Risk Ratio (M‐H, Fixed, 95% CI) | 3.26 [1.31, 8.11] |
| 3.21 Haematoma inoculation site | 1 | 6616 | Risk Ratio (M‐H, Fixed, 95% CI) | 1.13 [0.76, 1.67] |
| 3.22 Mass inoculation site | 1 | 6616 | Risk Ratio (M‐H, Fixed, 95% CI) | 14.67 [3.51, 61.33] |
| 3.23 Varicella‐like rash at injection site (day of vaccination to day 42) | 1 | 38546 | Risk Ratio (M‐H, Fixed, 95% CI) | 2.86 [1.21, 6.76] |
| 4 Drop‐outs Show forest plot | 4 | Risk Ratio (M‐H, Fixed, 95% CI) | Subtotals only | |
| 4.1 For any reason | 3 | 38916 | Risk Ratio (M‐H, Fixed, 95% CI) | 0.99 [0.91, 1.08] |
| 4.2 Death | 3 | 50687 | Risk Ratio (M‐H, Fixed, 95% CI) | 1.01 [0.92, 1.11] |
| 4.3 Withdrew consent | 3 | 50735 | Risk Ratio (M‐H, Fixed, 95% CI) | 0.87 [0.64, 1.19] |
| 4.4 Lost to follow‐up | 3 | 50735 | Risk Ratio (M‐H, Fixed, 95% CI) | 1.29 [0.97, 1.73] |
| 4.5 Protocol deviation | 2 | 12189 | Risk Ratio (M‐H, Fixed, 95% CI) | 1.58 [0.41, 6.02] |
| 4.6 Clinical adverse event | 2 | 12189 | Risk Ratio (M‐H, Fixed, 95% CI) | 1.36 [0.73, 2.54] |
| 4.7 Physician decision | 1 | 11980 | Risk Ratio (M‐H, Fixed, 95% CI) | 0.20 [0.01, 4.17] |
| 5 Participants with no follow‐up Show forest plot | 3 | Risk Ratio (M‐H, Fixed, 95% CI) | Totals not selected | |
| Outcome or subgroup title | No. of studies | No. of participants | Statistical method | Effect size |
| 1 Incidence of herpes zoster Show forest plot | 1 | Risk Ratio (M‐H, Fixed, 95% CI) | Totals not selected | |
| 2 Vaccine‐related adverse effects Show forest plot | 1 | Risk Ratio (M‐H, Fixed, 95% CI) | Totals not selected | |
| 3 Vaccine‐related systemic adverse effects Show forest plot | 1 | Risk Ratio (M‐H, Fixed, 95% CI) | Totals not selected | |
| 4 Vaccine‐related serious adverse effects Show forest plot | 1 | Risk Ratio (M‐H, Fixed, 95% CI) | Totals not selected | |
| 4.1 Death | 1 | Risk Ratio (M‐H, Fixed, 95% CI) | 0.0 [0.0, 0.0] | |
| 5 Injection site vaccine‐related adverse effects Show forest plot | 1 | Risk Ratio (M‐H, Fixed, 95% CI) | Totals not selected | |
| 5.1 Erythema | 1 | Risk Ratio (M‐H, Fixed, 95% CI) | 0.0 [0.0, 0.0] | |
| 5.2 Pain | 1 | Risk Ratio (M‐H, Fixed, 95% CI) | 0.0 [0.0, 0.0] | |
| 5.3 Swelling | 1 | Risk Ratio (M‐H, Fixed, 95% CI) | 0.0 [0.0, 0.0] | |
| 5.4 Pruritus | 1 | Risk Ratio (M‐H, Fixed, 95% CI) | 0.0 [0.0, 0.0] | |
| 6 Participants with no follow‐up Show forest plot | 1 | Risk Ratio (M‐H, Fixed, 95% CI) | Totals not selected | |
| Outcome or subgroup title | No. of studies | No. of participants | Statistical method | Effect size |
| 1 Participants with adverse effects Show forest plot | 1 | Risk Ratio (M‐H, Fixed, 95% CI) | Totals not selected | |
| 1.1 One or more adverse effects | 1 | Risk Ratio (M‐H, Fixed, 95% CI) | 0.0 [0.0, 0.0] | |
| 1.2 Vaccine‐related adverse effects | 1 | Risk Ratio (M‐H, Fixed, 95% CI) | 0.0 [0.0, 0.0] | |
| 1.3 Systemic adverse effects | 1 | Risk Ratio (M‐H, Fixed, 95% CI) | 0.0 [0.0, 0.0] | |
| 1.4 Systemic vaccine‐related adverse effects | 1 | Risk Ratio (M‐H, Fixed, 95% CI) | 0.0 [0.0, 0.0] | |
| 1.5 Serious adverse effects | 1 | Risk Ratio (M‐H, Fixed, 95% CI) | 0.0 [0.0, 0.0] | |
| 1.6 Vaccine‐related serious adverse effects | 1 | Risk Ratio (M‐H, Fixed, 95% CI) | 0.0 [0.0, 0.0] | |
| 1.7 Death | 1 | Risk Ratio (M‐H, Fixed, 95% CI) | 0.0 [0.0, 0.0] | |
| 1.8 Injection site adverse effects | 1 | Risk Ratio (M‐H, Fixed, 95% CI) | 0.0 [0.0, 0.0] | |
| 1.9 Injection site vaccine‐related adverse effects | 1 | Risk Ratio (M‐H, Fixed, 95% CI) | 0.0 [0.0, 0.0] | |
| 1.10 Discontinued due to any adverse effects | 1 | Risk Ratio (M‐H, Fixed, 95% CI) | 0.0 [0.0, 0.0] | |
| 1.11 Discontinued due to a vaccine‐related adverse effect | 1 | Risk Ratio (M‐H, Fixed, 95% CI) | 0.0 [0.0, 0.0] | |
| 2 Participants with no follow‐up Show forest plot | 1 | Risk Ratio (M‐H, Fixed, 95% CI) | Totals not selected | |
| Outcome or subgroup title | No. of studies | No. of participants | Statistical method | Effect size |
| 1 Incidence of herpes zoster Show forest plot | 1 | Risk Ratio (M‐H, Fixed, 95% CI) | Totals not selected | |
| Outcome or subgroup title | No. of studies | No. of participants | Statistical method | Effect size |
| 1 3200 pfu VZV/dose Show forest plot | 1 | Risk Ratio (M‐H, Fixed, 95% CI) | Totals not selected | |
| 1.1 ≥ 1 reaction injection site | 1 | Risk Ratio (M‐H, Fixed, 95% CI) | 0.0 [0.0, 0.0] | |
| 1.2 Induration (diameter ≥ 2 cm injection site) | 1 | Risk Ratio (M‐H, Fixed, 95% CI) | 0.0 [0.0, 0.0] | |
| 1.3 Pain injection site | 1 | Risk Ratio (M‐H, Fixed, 95% CI) | 0.0 [0.0, 0.0] | |
| 1.4 Pain (injection site, probably vaccine‐related) | 1 | Risk Ratio (M‐H, Fixed, 95% CI) | 0.0 [0.0, 0.0] | |
| 1.5 Redness injection site (diameter ≥ 2 cm) | 1 | Risk Ratio (M‐H, Fixed, 95% CI) | 0.0 [0.0, 0.0] | |
| 1.6 Pruritus injection site | 1 | Risk Ratio (M‐H, Fixed, 95% CI) | 0.0 [0.0, 0.0] | |
| 1.7 Vesicles at injection site | 1 | Risk Ratio (M‐H, Fixed, 95% CI) | 0.0 [0.0, 0.0] | |
| 2 8500 pfu VZV/dose Show forest plot | 1 | Risk Ratio (M‐H, Fixed, 95% CI) | Totals not selected | |
| 2.1 ≥ 1 reaction injection site | 1 | Risk Ratio (M‐H, Fixed, 95% CI) | 0.0 [0.0, 0.0] | |
| 2.2 Induration (diameter ≥ 2 cm injection site) | 1 | Risk Ratio (M‐H, Fixed, 95% CI) | 0.0 [0.0, 0.0] | |
| 2.3 Pain injection site | 1 | Risk Ratio (M‐H, Fixed, 95% CI) | 0.0 [0.0, 0.0] | |
| 2.4 Pain (injection site, probably vaccine‐related) | 1 | Risk Ratio (M‐H, Fixed, 95% CI) | 0.0 [0.0, 0.0] | |
| 2.5 Redness injection site (diameter ≥ 2 cm) | 1 | Risk Ratio (M‐H, Fixed, 95% CI) | 0.0 [0.0, 0.0] | |
| 2.6 Pruritus injection site | 1 | Risk Ratio (M‐H, Fixed, 95% CI) | 0.0 [0.0, 0.0] | |
| 2.7 Vesicle injection site | 1 | Risk Ratio (M‐H, Fixed, 95% CI) | 0.0 [0.0, 0.0] | |
| 3 41,650 pfu/dose Show forest plot | 1 | Risk Ratio (M‐H, Fixed, 95% CI) | Totals not selected | |
| 3.1 ≥ 1 reaction injection site | 1 | Risk Ratio (M‐H, Fixed, 95% CI) | 0.0 [0.0, 0.0] | |
| 3.2 Induration (diameter ≥ 2 cm injection site) | 1 | Risk Ratio (M‐H, Fixed, 95% CI) | 0.0 [0.0, 0.0] | |
| 3.3 Pain injection site | 1 | Risk Ratio (M‐H, Fixed, 95% CI) | 0.0 [0.0, 0.0] | |
| 3.4 Pain (injection site, probably vaccine‐related) | 1 | Risk Ratio (M‐H, Fixed, 95% CI) | 0.0 [0.0, 0.0] | |
| 3.5 Redness injection site (diameter ≥ 2 cm) | 1 | Risk Ratio (M‐H, Fixed, 95% CI) | 0.0 [0.0, 0.0] | |
| 3.6 Pruritus injection site | 1 | Risk Ratio (M‐H, Fixed, 95% CI) | 0.0 [0.0, 0.0] | |
| 3.7 Vesicle injection site | 1 | Risk Ratio (M‐H, Fixed, 95% CI) | 0.0 [0.0, 0.0] | |
| 4 Duration in days of adverse effects Show forest plot | 1 | Mean Difference (IV, Fixed, 95% CI) | Totals not selected | |
| 4.1 Erythema | 1 | Mean Difference (IV, Fixed, 95% CI) | 0.0 [0.0, 0.0] | |
| 4.2 Swelling | 1 | Mean Difference (IV, Fixed, 95% CI) | 0.0 [0.0, 0.0] | |
| 4.3 Pain | 1 | Mean Difference (IV, Fixed, 95% CI) | 0.0 [0.0, 0.0] | |
| 4.4 Rash | 1 | Mean Difference (IV, Fixed, 95% CI) | 0.0 [0.0, 0.0] | |
| 4.5 Pruritus | 1 | Mean Difference (IV, Fixed, 95% CI) | 0.0 [0.0, 0.0] | |
| 4.6 Haematoma | 1 | Mean Difference (IV, Fixed, 95% CI) | 0.0 [0.0, 0.0] | |
| Outcome or subgroup title | No. of studies | No. of participants | Statistical method | Effect size |
| 1 Participants with adverse events Show forest plot | 1 | Risk Ratio (M‐H, Fixed, 95% CI) | Totals not selected | |
| 1.1 At least one AE | 1 | Risk Ratio (M‐H, Fixed, 95% CI) | 0.0 [0.0, 0.0] | |
| 1.2 Vaccine‐related AE | 1 | Risk Ratio (M‐H, Fixed, 95% CI) | 0.0 [0.0, 0.0] | |
| 1.3 All systemic AE | 1 | Risk Ratio (M‐H, Fixed, 95% CI) | 0.0 [0.0, 0.0] | |
| 1.4 Vaccine‐related systemic AE | 1 | Risk Ratio (M‐H, Fixed, 95% CI) | 0.0 [0.0, 0.0] | |
| 1.5 Headache considered as vaccine‐related by the investigator | 1 | Risk Ratio (M‐H, Fixed, 95% CI) | 0.0 [0.0, 0.0] | |
| 1.6 Solicited injection site reaction | 1 | Risk Ratio (M‐H, Fixed, 95% CI) | 0.0 [0.0, 0.0] | |
| 1.7 Unsolicited injection site reaction | 1 | Risk Ratio (M‐H, Fixed, 95% CI) | 0.0 [0.0, 0.0] | |
| 1.8 Injection site erythema | 1 | Risk Ratio (M‐H, Fixed, 95% CI) | 0.0 [0.0, 0.0] | |
| 1.9 Severe injection site erythema (> 10 cm) | 1 | Risk Ratio (M‐H, Fixed, 95% CI) | 0.0 [0.0, 0.0] | |
| 1.10 Injection site pain | 1 | Risk Ratio (M‐H, Fixed, 95% CI) | 0.0 [0.0, 0.0] | |
| 1.11 Severe injection site pain (inability to work or usual activity) | 1 | Risk Ratio (M‐H, Fixed, 95% CI) | 0.0 [0.0, 0.0] | |
| 1.12 Injection site swelling | 1 | Risk Ratio (M‐H, Fixed, 95% CI) | 0.0 [0.0, 0.0] | |
| 1.13 Severe injection site swelling (> 10 cm) | 1 | Risk Ratio (M‐H, Fixed, 95% CI) | 0.0 [0.0, 0.0] | |
| 1.14 Injection site pruritus | 1 | Risk Ratio (M‐H, Fixed, 95% CI) | 0.0 [0.0, 0.0] | |
| 1.15 Withdrawal due to AE | 1 | Risk Ratio (M‐H, Fixed, 95% CI) | 0.0 [0.0, 0.0] | |
| Outcome or subgroup title | No. of studies | No. of participants | Statistical method | Effect size |
| 1 Zoster vaccine 1 month schedule versus zoster vaccine 3 month schedule Show forest plot | 1 | Risk Ratio (M‐H, Fixed, 95% CI) | Totals not selected | |
| 1.1 Participants with AE | 1 | Risk Ratio (M‐H, Fixed, 95% CI) | 0.0 [0.0, 0.0] | |
| 1.2 Participants with vaccine‐related AE | 1 | Risk Ratio (M‐H, Fixed, 95% CI) | 0.0 [0.0, 0.0] | |
| 1.3 Participants with serious AE | 1 | Risk Ratio (M‐H, Fixed, 95% CI) | 0.0 [0.0, 0.0] | |
| 1.4 Participants with vaccine‐related serious AE | 1 | Risk Ratio (M‐H, Fixed, 95% CI) | 0.0 [0.0, 0.0] | |
| 1.5 Participants with withdrawal due to AE | 1 | Risk Ratio (M‐H, Fixed, 95% CI) | 0.0 [0.0, 0.0] | |
| 1.6 Participants with vaccine‐related withdrawal due to AE | 1 | Risk Ratio (M‐H, Fixed, 95% CI) | 0.0 [0.0, 0.0] | |
| 1.7 Participants with non‐serious vaccine‐related withdrawal due to AE | 1 | Risk Ratio (M‐H, Fixed, 95% CI) | 0.0 [0.0, 0.0] | |
| 1.8 Participants with systemic AE | 1 | Risk Ratio (M‐H, Fixed, 95% CI) | 0.0 [0.0, 0.0] | |
| 1.9 Participants with vaccine‐related systemic AE | 1 | Risk Ratio (M‐H, Fixed, 95% CI) | 0.0 [0.0, 0.0] | |
| 1.10 Participants with rash of interest non‐injection site rashes | 1 | Risk Ratio (M‐H, Fixed, 95% CI) | 0.0 [0.0, 0.0] | |
| 1.11 Participants with varicella/varicella‐like rash | 1 | Risk Ratio (M‐H, Fixed, 95% CI) | 0.0 [0.0, 0.0] | |
| 1.12 Participants with herpes zoster/zoster‐like rash | 1 | Risk Ratio (M‐H, Fixed, 95% CI) | 0.0 [0.0, 0.0] | |
| 1.13 Participants with injection site reaction | 1 | Risk Ratio (M‐H, Fixed, 95% CI) | 0.0 [0.0, 0.0] | |
| 1.14 Participants with solicited injection site reaction | 1 | Risk Ratio (M‐H, Fixed, 95% CI) | 0.0 [0.0, 0.0] | |
| 1.15 Participants with unsolicited injection site reaction | 1 | Risk Ratio (M‐H, Fixed, 95% CI) | 0.0 [0.0, 0.0] | |
| 1.16 Participants with erythema injection site | 1 | Risk Ratio (M‐H, Fixed, 95% CI) | 0.0 [0.0, 0.0] | |
| 1.17 Participants with pain injection site | 1 | Risk Ratio (M‐H, Fixed, 95% CI) | 0.0 [0.0, 0.0] | |
| 1.18 Participants with swelling injection site | 1 | Risk Ratio (M‐H, Fixed, 95% CI) | 0.0 [0.0, 0.0] | |
| 2 Zoster vaccine 1 month schedule versus zoster vaccine single dose Show forest plot | 1 | Risk Ratio (M‐H, Fixed, 95% CI) | Totals not selected | |
| 2.1 Participants with adverse events | 1 | Risk Ratio (M‐H, Fixed, 95% CI) | 0.0 [0.0, 0.0] | |
| 2.2 Participants with vaccine‐related AE | 1 | Risk Ratio (M‐H, Fixed, 95% CI) | 0.0 [0.0, 0.0] | |
| 2.3 Participants with serious AE | 1 | Risk Ratio (M‐H, Fixed, 95% CI) | 0.0 [0.0, 0.0] | |
| 2.4 Participants with vaccine‐related serious AE | 1 | Risk Ratio (M‐H, Fixed, 95% CI) | 0.0 [0.0, 0.0] | |
| 2.5 Participants with withdrawal due to AE | 1 | Risk Ratio (M‐H, Fixed, 95% CI) | 0.0 [0.0, 0.0] | |
| 2.6 Participants with vaccine‐related withdrawal due to AE | 1 | Risk Ratio (M‐H, Fixed, 95% CI) | 0.0 [0.0, 0.0] | |
| 2.7 Participants with non‐serious vaccine‐related withdrawal due to AE | 1 | Risk Ratio (M‐H, Fixed, 95% CI) | 0.0 [0.0, 0.0] | |
| 2.8 Participants with systemic AE | 1 | Risk Ratio (M‐H, Fixed, 95% CI) | 0.0 [0.0, 0.0] | |
| 2.9 Participants with vaccine‐related systemic AE | 1 | Risk Ratio (M‐H, Fixed, 95% CI) | 0.0 [0.0, 0.0] | |
| 2.10 Participants with rash of interest non‐injection site rashes | 1 | Risk Ratio (M‐H, Fixed, 95% CI) | 0.0 [0.0, 0.0] | |
| 2.11 Participants with varicella/varicella‐like rash | 1 | Risk Ratio (M‐H, Fixed, 95% CI) | 0.0 [0.0, 0.0] | |
| 2.12 Participants with herpes zoster/zoster‐like rash | 1 | Risk Ratio (M‐H, Fixed, 95% CI) | 0.0 [0.0, 0.0] | |
| 2.13 Participants with injection site reaction | 1 | Risk Ratio (M‐H, Fixed, 95% CI) | 0.0 [0.0, 0.0] | |
| 2.14 Participants with solicited injection site reaction | 1 | Risk Ratio (M‐H, Fixed, 95% CI) | 0.0 [0.0, 0.0] | |
| 2.15 Participants with unsolicited injection site reaction | 1 | Risk Ratio (M‐H, Fixed, 95% CI) | 0.0 [0.0, 0.0] | |
| 2.16 Participants with erythema injection site | 1 | Risk Ratio (M‐H, Fixed, 95% CI) | 0.0 [0.0, 0.0] | |
| 2.17 Participants with pain injection site | 1 | Risk Ratio (M‐H, Fixed, 95% CI) | 0.0 [0.0, 0.0] | |
| 2.18 Participants with swelling injection site | 1 | Risk Ratio (M‐H, Fixed, 95% CI) | 0.0 [0.0, 0.0] | |
| 3 Zoster vaccine 3 month schedule versus zoster vaccine single dose Show forest plot | 1 | Risk Ratio (M‐H, Fixed, 95% CI) | Totals not selected | |
| 3.1 Participants with AE | 1 | Risk Ratio (M‐H, Fixed, 95% CI) | 0.0 [0.0, 0.0] | |
| 3.2 Participants with vaccine‐related AE | 1 | Risk Ratio (M‐H, Fixed, 95% CI) | 0.0 [0.0, 0.0] | |
| 3.3 Participants with serious AE | 1 | Risk Ratio (M‐H, Fixed, 95% CI) | 0.0 [0.0, 0.0] | |
| 3.4 Participants with vaccine‐related serious AE | 1 | Risk Ratio (M‐H, Fixed, 95% CI) | 0.0 [0.0, 0.0] | |
| 3.5 Participants with withdrawal due to AE | 1 | Risk Ratio (M‐H, Fixed, 95% CI) | 0.0 [0.0, 0.0] | |
| 3.6 Participants with vaccine‐related withdrawal due to AE | 1 | Risk Ratio (M‐H, Fixed, 95% CI) | 0.0 [0.0, 0.0] | |
| 3.7 Participants with non‐serious vaccine‐related withdrawal due to AE | 1 | Risk Ratio (M‐H, Fixed, 95% CI) | 0.0 [0.0, 0.0] | |
| 3.8 Participants with systemic AE | 1 | Risk Ratio (M‐H, Fixed, 95% CI) | 0.0 [0.0, 0.0] | |
| 3.9 Participants with vaccine‐related systemic AE | 1 | Risk Ratio (M‐H, Fixed, 95% CI) | 0.0 [0.0, 0.0] | |
| 3.10 Participants with rash of interest non‐injection site rashes | 1 | Risk Ratio (M‐H, Fixed, 95% CI) | 0.0 [0.0, 0.0] | |
| 3.11 Participants with varicella/varicella‐like rash | 1 | Risk Ratio (M‐H, Fixed, 95% CI) | 0.0 [0.0, 0.0] | |
| 3.12 Participants with herpes zoster/zoster‐like rash | 1 | Risk Ratio (M‐H, Fixed, 95% CI) | 0.0 [0.0, 0.0] | |
| 3.13 Participants with injection site reaction | 1 | Risk Ratio (M‐H, Fixed, 95% CI) | 0.0 [0.0, 0.0] | |
| 3.14 Participants with solicited injection site reaction | 1 | Risk Ratio (M‐H, Fixed, 95% CI) | 0.0 [0.0, 0.0] | |
| 3.15 Participants with unsolicited injection site reaction | 1 | Risk Ratio (M‐H, Fixed, 95% CI) | 0.0 [0.0, 0.0] | |
| 3.16 Participants with erythema injection site | 1 | Risk Ratio (M‐H, Fixed, 95% CI) | 0.0 [0.0, 0.0] | |
| 3.17 Participants with pain injection site | 1 | Risk Ratio (M‐H, Fixed, 95% CI) | 0.0 [0.0, 0.0] | |
| 3.18 Participants with swelling injection site | 1 | Risk Ratio (M‐H, Fixed, 95% CI) | 0.0 [0.0, 0.0] | |
| Outcome or subgroup title | No. of studies | No. of participants | Statistical method | Effect size |
| 1 50 μg gE/AS01E versus 50 μg gE/AS01B Show forest plot | 1 | Risk Ratio (M‐H, Fixed, 95% CI) | Totals not selected | |
| 1.1 Participants with any symptom | 1 | Risk Ratio (M‐H, Fixed, 95% CI) | 0.0 [0.0, 0.0] | |
| 1.2 Participants with any grade 3 symptom | 1 | Risk Ratio (M‐H, Fixed, 95% CI) | 0.0 [0.0, 0.0] | |
| 1.3 Participants with any general symptom | 1 | Risk Ratio (M‐H, Fixed, 95% CI) | 0.0 [0.0, 0.0] | |
| 1.4 Participants with any grade 3 general symptom | 1 | Risk Ratio (M‐H, Fixed, 95% CI) | 0.0 [0.0, 0.0] | |
| 1.5 Participants with fatigue | 1 | Risk Ratio (M‐H, Fixed, 95% CI) | 0.0 [0.0, 0.0] | |
| 1.6 Participants with grade 3 fatigue | 1 | Risk Ratio (M‐H, Fixed, 95% CI) | 0.0 [0.0, 0.0] | |
| 1.7 Participants with fever | 1 | Risk Ratio (M‐H, Fixed, 95% CI) | 0.0 [0.0, 0.0] | |
| 1.8 Participants with grade 3 fever | 1 | Risk Ratio (M‐H, Fixed, 95% CI) | 0.0 [0.0, 0.0] | |
| 1.9 Participants with gastrointestinal symptom | 1 | Risk Ratio (M‐H, Fixed, 95% CI) | 0.0 [0.0, 0.0] | |
| 1.10 Participants with grade 3 gastrointestinal symptom | 1 | Risk Ratio (M‐H, Fixed, 95% CI) | 0.0 [0.0, 0.0] | |
| 1.11 Participants with headache | 1 | Risk Ratio (M‐H, Fixed, 95% CI) | 0.0 [0.0, 0.0] | |
| 1.12 Participants with grade 3 headache | 1 | Risk Ratio (M‐H, Fixed, 95% CI) | 0.0 [0.0, 0.0] | |
| 1.13 Participants with myalgia | 1 | Risk Ratio (M‐H, Fixed, 95% CI) | 0.0 [0.0, 0.0] | |
| 1.14 Participants with grade 3 myalgia | 1 | Risk Ratio (M‐H, Fixed, 95% CI) | 0.0 [0.0, 0.0] | |
| 1.15 Participants with any local symptom | 1 | Risk Ratio (M‐H, Fixed, 95% CI) | 0.0 [0.0, 0.0] | |
| 1.16 Participants with any grade 3 local symptom | 1 | Risk Ratio (M‐H, Fixed, 95% CI) | 0.0 [0.0, 0.0] | |
| 1.17 Participants with local pain | 1 | Risk Ratio (M‐H, Fixed, 95% CI) | 0.0 [0.0, 0.0] | |
| 1.18 Participants with grade 3 local pain | 1 | Risk Ratio (M‐H, Fixed, 95% CI) | 0.0 [0.0, 0.0] | |
| 1.19 Participants with local redness | 1 | Risk Ratio (M‐H, Fixed, 95% CI) | 0.0 [0.0, 0.0] | |
| 1.20 Participants with grade 3 local redness | 1 | Risk Ratio (M‐H, Fixed, 95% CI) | 0.0 [0.0, 0.0] | |
| 1.21 Participants with local swelling | 1 | Risk Ratio (M‐H, Fixed, 95% CI) | 0.0 [0.0, 0.0] | |
| 1.22 Participants with grade 3 local swelling | 1 | Risk Ratio (M‐H, Fixed, 95% CI) | 0.0 [0.0, 0.0] | |
| 1.23 Participants with consent withdrawal | 1 | Risk Ratio (M‐H, Fixed, 95% CI) | 0.0 [0.0, 0.0] | |
| 1.24 Participants with lost follow‐up | 1 | Risk Ratio (M‐H, Fixed, 95% CI) | 0.0 [0.0, 0.0] | |
| 1.25 Participants with serious AE | 1 | Risk Ratio (M‐H, Fixed, 95% CI) | 0.0 [0.0, 0.0] | |
| 2 50 μg gE/AS01E versus 50 μg gE/saline (unadjuvanted gE) Show forest plot | 1 | Risk Ratio (M‐H, Fixed, 95% CI) | Totals not selected | |
| 2.1 Participants with any symptom | 1 | Risk Ratio (M‐H, Fixed, 95% CI) | 0.0 [0.0, 0.0] | |
| 2.2 Participants with any grade 3 symptom | 1 | Risk Ratio (M‐H, Fixed, 95% CI) | 0.0 [0.0, 0.0] | |
| 2.3 Participants with any general symptom | 1 | Risk Ratio (M‐H, Fixed, 95% CI) | 0.0 [0.0, 0.0] | |
| 2.4 Participants with any grade 3 general symptom | 1 | Risk Ratio (M‐H, Fixed, 95% CI) | 0.0 [0.0, 0.0] | |
| 2.5 Participants with fatigue | 1 | Risk Ratio (M‐H, Fixed, 95% CI) | 0.0 [0.0, 0.0] | |
| 2.6 Participants with grade 3 fatigue | 1 | Risk Ratio (M‐H, Fixed, 95% CI) | 0.0 [0.0, 0.0] | |
| 2.7 Participants with fever | 1 | Risk Ratio (M‐H, Fixed, 95% CI) | 0.0 [0.0, 0.0] | |
| 2.8 Participants with grade 3 fever | 1 | Risk Ratio (M‐H, Fixed, 95% CI) | 0.0 [0.0, 0.0] | |
| 2.9 Participants with gastrointestinal symptom | 1 | Risk Ratio (M‐H, Fixed, 95% CI) | 0.0 [0.0, 0.0] | |
| 2.10 Participants with grade 3 gastrointestinal symptom | 1 | Risk Ratio (M‐H, Fixed, 95% CI) | 0.0 [0.0, 0.0] | |
| 2.11 Participants with headache | 1 | Risk Ratio (M‐H, Fixed, 95% CI) | 0.0 [0.0, 0.0] | |
| 2.12 Participants with grade 3 headache | 1 | Risk Ratio (M‐H, Fixed, 95% CI) | 0.0 [0.0, 0.0] | |
| 2.13 Participants with myalgia | 1 | Risk Ratio (M‐H, Fixed, 95% CI) | 0.0 [0.0, 0.0] | |
| 2.14 Participants with grade 3 myalgia | 1 | Risk Ratio (M‐H, Fixed, 95% CI) | 0.0 [0.0, 0.0] | |
| 2.15 Participants with any local symptom | 1 | Risk Ratio (M‐H, Fixed, 95% CI) | 0.0 [0.0, 0.0] | |
| 2.16 Participants with any grade 3 local symptom | 1 | Risk Ratio (M‐H, Fixed, 95% CI) | 0.0 [0.0, 0.0] | |
| 2.17 Participants with local pain | 1 | Risk Ratio (M‐H, Fixed, 95% CI) | 0.0 [0.0, 0.0] | |
| 2.18 Participants with grade 3 local pain | 1 | Risk Ratio (M‐H, Fixed, 95% CI) | 0.0 [0.0, 0.0] | |
| 2.19 Participants with local redness | 1 | Risk Ratio (M‐H, Fixed, 95% CI) | 0.0 [0.0, 0.0] | |
| 2.20 Participants with grade 3 local redness | 1 | Risk Ratio (M‐H, Fixed, 95% CI) | 0.0 [0.0, 0.0] | |
| 2.21 Participants with local swelling | 1 | Risk Ratio (M‐H, Fixed, 95% CI) | 0.0 [0.0, 0.0] | |
| 2.22 Participants with grade 3 local swelling | 1 | Risk Ratio (M‐H, Fixed, 95% CI) | 0.0 [0.0, 0.0] | |
| 2.23 Participants with consent withdrawal | 1 | Risk Ratio (M‐H, Fixed, 95% CI) | 0.0 [0.0, 0.0] | |
| 2.24 Participants with lost follow‐up | 1 | Risk Ratio (M‐H, Fixed, 95% CI) | 0.0 [0.0, 0.0] | |
| 2.25 Participants with serious AE | 1 | Risk Ratio (M‐H, Fixed, 95% CI) | 0.0 [0.0, 0.0] | |
| 3 50 μg gE/AS01B versus 50 μg gE/saline (unadjuvanted gE) Show forest plot | 1 | Risk Ratio (M‐H, Fixed, 95% CI) | Totals not selected | |
| 3.1 Participants with any symptom | 1 | Risk Ratio (M‐H, Fixed, 95% CI) | 0.0 [0.0, 0.0] | |
| 3.2 Participants with any grade 3 symptom | 1 | Risk Ratio (M‐H, Fixed, 95% CI) | 0.0 [0.0, 0.0] | |
| 3.3 Participants with any general symptom | 1 | Risk Ratio (M‐H, Fixed, 95% CI) | 0.0 [0.0, 0.0] | |
| 3.4 Participants with any grade 3 general symptom | 1 | Risk Ratio (M‐H, Fixed, 95% CI) | 0.0 [0.0, 0.0] | |
| 3.5 Participants with fatigue | 1 | Risk Ratio (M‐H, Fixed, 95% CI) | 0.0 [0.0, 0.0] | |
| 3.6 Participants with grade 3 fatigue | 1 | Risk Ratio (M‐H, Fixed, 95% CI) | 0.0 [0.0, 0.0] | |
| 3.7 Participants with fever | 1 | Risk Ratio (M‐H, Fixed, 95% CI) | 0.0 [0.0, 0.0] | |
| 3.8 Participants with grade 3 fever | 1 | Risk Ratio (M‐H, Fixed, 95% CI) | 0.0 [0.0, 0.0] | |
| 3.9 Participants with gastrointestinal symptom | 1 | Risk Ratio (M‐H, Fixed, 95% CI) | 0.0 [0.0, 0.0] | |
| 3.10 Participants with grade 3 gastrointestinal symptom | 1 | Risk Ratio (M‐H, Fixed, 95% CI) | 0.0 [0.0, 0.0] | |
| 3.11 Participants with headache | 1 | Risk Ratio (M‐H, Fixed, 95% CI) | 0.0 [0.0, 0.0] | |
| 3.12 Participants with grade 3 headache | 1 | Risk Ratio (M‐H, Fixed, 95% CI) | 0.0 [0.0, 0.0] | |
| 3.13 Participants with myalgia | 1 | Risk Ratio (M‐H, Fixed, 95% CI) | 0.0 [0.0, 0.0] | |
| 3.14 Participants with grade 3 myalgia | 1 | Risk Ratio (M‐H, Fixed, 95% CI) | 0.0 [0.0, 0.0] | |
| 3.15 Participants with any local symptom | 1 | Risk Ratio (M‐H, Fixed, 95% CI) | 0.0 [0.0, 0.0] | |
| 3.16 Participants with any grade 3 local symptom | 1 | Risk Ratio (M‐H, Fixed, 95% CI) | 0.0 [0.0, 0.0] | |
| 3.17 Participants with local pain | 1 | Risk Ratio (M‐H, Fixed, 95% CI) | 0.0 [0.0, 0.0] | |
| 3.18 Participants with grade 3 local pain | 1 | Risk Ratio (M‐H, Fixed, 95% CI) | 0.0 [0.0, 0.0] | |
| 3.19 Participants with local redness | 1 | Risk Ratio (M‐H, Fixed, 95% CI) | 0.0 [0.0, 0.0] | |
| 3.20 Participants with grade 3 local redness | 1 | Risk Ratio (M‐H, Fixed, 95% CI) | 0.0 [0.0, 0.0] | |
| 3.21 Participants with local swelling | 1 | Risk Ratio (M‐H, Fixed, 95% CI) | 0.0 [0.0, 0.0] | |
| 3.22 Participants with grade 3 local swelling | 1 | Risk Ratio (M‐H, Fixed, 95% CI) | 0.0 [0.0, 0.0] | |
| 3.23 Participants with consent withdrawal | 1 | Risk Ratio (M‐H, Fixed, 95% CI) | 0.0 [0.0, 0.0] | |
| 3.24 Participants with lost follow‐up | 1 | Risk Ratio (M‐H, Fixed, 95% CI) | 0.0 [0.0, 0.0] | |
| 3.25 Participants with serious AE | 1 | Risk Ratio (M‐H, Fixed, 95% CI) | 0.0 [0.0, 0.0] | |
| 4 50 μg gE/AS01E versus saline Show forest plot | 1 | Risk Ratio (M‐H, Fixed, 95% CI) | Totals not selected | |
| 4.1 Participants with any symptom | 1 | Risk Ratio (M‐H, Fixed, 95% CI) | 0.0 [0.0, 0.0] | |
| 4.2 Participants with any grade 3 symptom | 1 | Risk Ratio (M‐H, Fixed, 95% CI) | 0.0 [0.0, 0.0] | |
| 4.3 Participants with any general symptom | 1 | Risk Ratio (M‐H, Fixed, 95% CI) | 0.0 [0.0, 0.0] | |
| 4.4 Participants with any grade 3 general symptom | 1 | Risk Ratio (M‐H, Fixed, 95% CI) | 0.0 [0.0, 0.0] | |
| 4.5 Participants with fatigue | 1 | Risk Ratio (M‐H, Fixed, 95% CI) | 0.0 [0.0, 0.0] | |
| 4.6 Participants with grade 3 fatigue | 1 | Risk Ratio (M‐H, Fixed, 95% CI) | 0.0 [0.0, 0.0] | |
| 4.7 Participants with fever | 1 | Risk Ratio (M‐H, Fixed, 95% CI) | 0.0 [0.0, 0.0] | |
| 4.8 Participants with grade 3 fever | 1 | Risk Ratio (M‐H, Fixed, 95% CI) | 0.0 [0.0, 0.0] | |
| 4.9 Participants with gastrointestinal symptom | 1 | Risk Ratio (M‐H, Fixed, 95% CI) | 0.0 [0.0, 0.0] | |
| 4.10 Participants with grade 3 gastrointestinal symptom | 1 | Risk Ratio (M‐H, Fixed, 95% CI) | 0.0 [0.0, 0.0] | |
| 4.11 Participants with headache | 1 | Risk Ratio (M‐H, Fixed, 95% CI) | 0.0 [0.0, 0.0] | |
| 4.12 Participants with grade 3 headache | 1 | Risk Ratio (M‐H, Fixed, 95% CI) | 0.0 [0.0, 0.0] | |
| 4.13 Participants with myalgia | 1 | Risk Ratio (M‐H, Fixed, 95% CI) | 0.0 [0.0, 0.0] | |
| 4.14 Participants with grade 3 myalgia | 1 | Risk Ratio (M‐H, Fixed, 95% CI) | 0.0 [0.0, 0.0] | |
| 4.15 Participants with any local symptom | 1 | Risk Ratio (M‐H, Fixed, 95% CI) | 0.0 [0.0, 0.0] | |
| 4.16 Participants with any grade 3 local symptom | 1 | Risk Ratio (M‐H, Fixed, 95% CI) | 0.0 [0.0, 0.0] | |
| 4.17 Participants with local pain | 1 | Risk Ratio (M‐H, Fixed, 95% CI) | 0.0 [0.0, 0.0] | |
| 4.18 Participants with grade 3 local pain | 1 | Risk Ratio (M‐H, Fixed, 95% CI) | 0.0 [0.0, 0.0] | |
| 4.19 Participants with local redness | 1 | Risk Ratio (M‐H, Fixed, 95% CI) | 0.0 [0.0, 0.0] | |
| 4.20 Participants with grade 3 local redness | 1 | Risk Ratio (M‐H, Fixed, 95% CI) | 0.0 [0.0, 0.0] | |
| 4.21 Participants with local swelling | 1 | Risk Ratio (M‐H, Fixed, 95% CI) | 0.0 [0.0, 0.0] | |
| 4.22 Participants with grade 3 local swelling | 1 | Risk Ratio (M‐H, Fixed, 95% CI) | 0.0 [0.0, 0.0] | |
| 4.23 Participants with consent withdrawal | 1 | Risk Ratio (M‐H, Fixed, 95% CI) | 0.0 [0.0, 0.0] | |
| 4.24 Participants with lost follow‐up | 1 | Risk Ratio (M‐H, Fixed, 95% CI) | 0.0 [0.0, 0.0] | |
| 4.25 Participants with serious AE | 1 | Risk Ratio (M‐H, Fixed, 95% CI) | 0.0 [0.0, 0.0] | |
| 5 50 μg gE/AS01B versus saline Show forest plot | 1 | Risk Ratio (M‐H, Fixed, 95% CI) | Totals not selected | |
| 5.1 Participants with any symptom | 1 | Risk Ratio (M‐H, Fixed, 95% CI) | 0.0 [0.0, 0.0] | |
| 5.2 Participants with any grade 3 symptom | 1 | Risk Ratio (M‐H, Fixed, 95% CI) | 0.0 [0.0, 0.0] | |
| 5.3 Participants with any general symptom | 1 | Risk Ratio (M‐H, Fixed, 95% CI) | 0.0 [0.0, 0.0] | |
| 5.4 Participants with any grade 3 general symptom | 1 | Risk Ratio (M‐H, Fixed, 95% CI) | 0.0 [0.0, 0.0] | |
| 5.5 Participants with fatigue | 1 | Risk Ratio (M‐H, Fixed, 95% CI) | 0.0 [0.0, 0.0] | |
| 5.6 Participants with grade 3 fatigue | 1 | Risk Ratio (M‐H, Fixed, 95% CI) | 0.0 [0.0, 0.0] | |
| 5.7 Participants with fever | 1 | Risk Ratio (M‐H, Fixed, 95% CI) | 0.0 [0.0, 0.0] | |
| 5.8 Participants with grade 3 fever | 1 | Risk Ratio (M‐H, Fixed, 95% CI) | 0.0 [0.0, 0.0] | |
| 5.9 Participants with gastrointestinal symptom | 1 | Risk Ratio (M‐H, Fixed, 95% CI) | 0.0 [0.0, 0.0] | |
| 5.10 Participants with grade 3 gastrointestinal symptom | 1 | Risk Ratio (M‐H, Fixed, 95% CI) | 0.0 [0.0, 0.0] | |
| 5.11 Participants with headache | 1 | Risk Ratio (M‐H, Fixed, 95% CI) | 0.0 [0.0, 0.0] | |
| 5.12 Participants with grade 3 headache | 1 | Risk Ratio (M‐H, Fixed, 95% CI) | 0.0 [0.0, 0.0] | |
| 5.13 Participants with myalgia | 1 | Risk Ratio (M‐H, Fixed, 95% CI) | 0.0 [0.0, 0.0] | |
| 5.14 Participants with grade 3 myalgia | 1 | Risk Ratio (M‐H, Fixed, 95% CI) | 0.0 [0.0, 0.0] | |
| 5.15 Participants with any local symptom | 1 | Risk Ratio (M‐H, Fixed, 95% CI) | 0.0 [0.0, 0.0] | |
| 5.16 Participants with any grade 3 local symptom | 1 | Risk Ratio (M‐H, Fixed, 95% CI) | 0.0 [0.0, 0.0] | |
| 5.17 Participants with local pain | 1 | Risk Ratio (M‐H, Fixed, 95% CI) | 0.0 [0.0, 0.0] | |
| 5.18 Participants with grade 3 local pain | 1 | Risk Ratio (M‐H, Fixed, 95% CI) | 0.0 [0.0, 0.0] | |
| 5.19 Participants with local redness | 1 | Risk Ratio (M‐H, Fixed, 95% CI) | 0.0 [0.0, 0.0] | |
| 5.20 Participants with grade 3 local redness | 1 | Risk Ratio (M‐H, Fixed, 95% CI) | 0.0 [0.0, 0.0] | |
| 5.21 Participants with local swelling | 1 | Risk Ratio (M‐H, Fixed, 95% CI) | 0.0 [0.0, 0.0] | |
| 5.22 Participants with grade 3 local swelling | 1 | Risk Ratio (M‐H, Fixed, 95% CI) | 0.0 [0.0, 0.0] | |
| 5.23 Participants with consent withdrawal | 1 | Risk Ratio (M‐H, Fixed, 95% CI) | 0.0 [0.0, 0.0] | |
| 5.24 Participants with lost follow‐up | 1 | Risk Ratio (M‐H, Fixed, 95% CI) | 0.0 [0.0, 0.0] | |
| 5.25 Participants with serious AE | 1 | Risk Ratio (M‐H, Fixed, 95% CI) | 0.0 [0.0, 0.0] | |
| 6 50 μg gE/Saline (unadjuvanted) versus saline Show forest plot | 1 | Risk Ratio (M‐H, Fixed, 95% CI) | Totals not selected | |
| 6.1 Participants with any symptom | 1 | Risk Ratio (M‐H, Fixed, 95% CI) | 0.0 [0.0, 0.0] | |
| 6.2 Participants with any grade 3 symptom | 1 | Risk Ratio (M‐H, Fixed, 95% CI) | 0.0 [0.0, 0.0] | |
| 6.3 Participants with any general symptom | 1 | Risk Ratio (M‐H, Fixed, 95% CI) | 0.0 [0.0, 0.0] | |
| 6.4 Participants with any grade 3 general symptom | 1 | Risk Ratio (M‐H, Fixed, 95% CI) | 0.0 [0.0, 0.0] | |
| 6.5 Participants with fatigue | 1 | Risk Ratio (M‐H, Fixed, 95% CI) | 0.0 [0.0, 0.0] | |
| 6.6 Participants with grade 3 fatigue | 1 | Risk Ratio (M‐H, Fixed, 95% CI) | 0.0 [0.0, 0.0] | |
| 6.7 Participants with fever | 1 | Risk Ratio (M‐H, Fixed, 95% CI) | 0.0 [0.0, 0.0] | |
| 6.8 Participants with grade 3 fever | 1 | Risk Ratio (M‐H, Fixed, 95% CI) | 0.0 [0.0, 0.0] | |
| 6.9 Participants with gastrointestinal symptom | 1 | Risk Ratio (M‐H, Fixed, 95% CI) | 0.0 [0.0, 0.0] | |
| 6.10 Participants with grade 3 gastrointestinal symptom | 1 | Risk Ratio (M‐H, Fixed, 95% CI) | 0.0 [0.0, 0.0] | |
| 6.11 Participants with headache | 1 | Risk Ratio (M‐H, Fixed, 95% CI) | 0.0 [0.0, 0.0] | |
| 6.12 Participants with grade 3 headache | 1 | Risk Ratio (M‐H, Fixed, 95% CI) | 0.0 [0.0, 0.0] | |
| 6.13 Participants with myalgia | 1 | Risk Ratio (M‐H, Fixed, 95% CI) | 0.0 [0.0, 0.0] | |
| 6.14 Participants with grade 3 myalgia | 1 | Risk Ratio (M‐H, Fixed, 95% CI) | 0.0 [0.0, 0.0] | |
| 6.15 Participants with any local symptom | 1 | Risk Ratio (M‐H, Fixed, 95% CI) | 0.0 [0.0, 0.0] | |
| 6.16 Participants with any grade 3 local symptom | 1 | Risk Ratio (M‐H, Fixed, 95% CI) | 0.0 [0.0, 0.0] | |
| 6.17 Participants with local pain | 1 | Risk Ratio (M‐H, Fixed, 95% CI) | 0.0 [0.0, 0.0] | |
| 6.18 Participants with grade 3 local pain | 1 | Risk Ratio (M‐H, Fixed, 95% CI) | 0.0 [0.0, 0.0] | |
| 6.19 Participants with local redness | 1 | Risk Ratio (M‐H, Fixed, 95% CI) | 0.0 [0.0, 0.0] | |
| 6.20 Participants with grade 3 local redness | 1 | Risk Ratio (M‐H, Fixed, 95% CI) | 0.0 [0.0, 0.0] | |
| 6.21 Participants with local swelling | 1 | Risk Ratio (M‐H, Fixed, 95% CI) | 0.0 [0.0, 0.0] | |
| 6.22 Participants with grade 3 local swelling | 1 | Risk Ratio (M‐H, Fixed, 95% CI) | 0.0 [0.0, 0.0] | |
| 6.23 Participants with consent withdrawal | 1 | Risk Ratio (M‐H, Fixed, 95% CI) | 0.0 [0.0, 0.0] | |
| 6.24 Participants with lost follow‐up | 1 | Risk Ratio (M‐H, Fixed, 95% CI) | 0.0 [0.0, 0.0] | |
| 6.25 Participants with serious AE | 1 | Risk Ratio (M‐H, Fixed, 95% CI) | 0.0 [0.0, 0.0] | |
| Outcome or subgroup title | No. of studies | No. of participants | Statistical method | Effect size |
| 1 25 µg gE/AS01B versus 50 µg gE/AS01B Show forest plot | 1 | Risk Ratio (M‐H, Fixed, 95% CI) | Totals not selected | |
| 1.1 Participants with any fatigue | 1 | Risk Ratio (M‐H, Fixed, 95% CI) | 0.0 [0.0, 0.0] | |
| 1.2 Participants with grade 3 fatigue | 1 | Risk Ratio (M‐H, Fixed, 95% CI) | 0.0 [0.0, 0.0] | |
| 1.3 Participants with any fever | 1 | Risk Ratio (M‐H, Fixed, 95% CI) | 0.0 [0.0, 0.0] | |
| 1.4 Participants with grade 3 fever | 1 | Risk Ratio (M‐H, Fixed, 95% CI) | 0.0 [0.0, 0.0] | |
| 1.5 Participants with any headache | 1 | Risk Ratio (M‐H, Fixed, 95% CI) | 0.0 [0.0, 0.0] | |
| 1.6 Participants with grade 3 headache | 1 | Risk Ratio (M‐H, Fixed, 95% CI) | 0.0 [0.0, 0.0] | |
| 1.7 Participants with any myalgia | 1 | Risk Ratio (M‐H, Fixed, 95% CI) | 0.0 [0.0, 0.0] | |
| 1.8 Participants with grade 3 myalgia | 1 | Risk Ratio (M‐H, Fixed, 95% CI) | 0.0 [0.0, 0.0] | |
| 1.9 Participants with local pain | 1 | Risk Ratio (M‐H, Fixed, 95% CI) | 0.0 [0.0, 0.0] | |
| 1.10 Participants with grade 3 local pain | 1 | Risk Ratio (M‐H, Fixed, 95% CI) | 0.0 [0.0, 0.0] | |
| 1.11 Participants with local redness | 1 | Risk Ratio (M‐H, Fixed, 95% CI) | 0.0 [0.0, 0.0] | |
| 1.12 Participants with grade 3 local redness | 1 | Risk Ratio (M‐H, Fixed, 95% CI) | 0.0 [0.0, 0.0] | |
| 1.13 Participants with local swelling | 1 | Risk Ratio (M‐H, Fixed, 95% CI) | 0.0 [0.0, 0.0] | |
| 1.14 Participants with grade 3 local swelling | 1 | Risk Ratio (M‐H, Fixed, 95% CI) | 0.0 [0.0, 0.0] | |
| 1.15 Participants with consent withdrawal | 1 | Risk Ratio (M‐H, Fixed, 95% CI) | 0.0 [0.0, 0.0] | |
| 1.16 Participants with lost to follow‐up | 1 | Risk Ratio (M‐H, Fixed, 95% CI) | 0.0 [0.0, 0.0] | |
| 1.17 Participants with death | 1 | Risk Ratio (M‐H, Fixed, 95% CI) | 0.0 [0.0, 0.0] | |
| 2 25 µg gE/AS01B versus 100 µg gE/AS01B Show forest plot | 1 | Risk Ratio (M‐H, Fixed, 95% CI) | Totals not selected | |
| 2.1 Participants with any fatigue | 1 | Risk Ratio (M‐H, Fixed, 95% CI) | 0.0 [0.0, 0.0] | |
| 2.2 Participants with grade 3 fatigue | 1 | Risk Ratio (M‐H, Fixed, 95% CI) | 0.0 [0.0, 0.0] | |
| 2.3 Participants with any fever | 1 | Risk Ratio (M‐H, Fixed, 95% CI) | 0.0 [0.0, 0.0] | |
| 2.4 Participants with grade 3 fever | 1 | Risk Ratio (M‐H, Fixed, 95% CI) | 0.0 [0.0, 0.0] | |
| 2.5 Participants with any headache | 1 | Risk Ratio (M‐H, Fixed, 95% CI) | 0.0 [0.0, 0.0] | |
| 2.6 Participants with grade 3 headache | 1 | Risk Ratio (M‐H, Fixed, 95% CI) | 0.0 [0.0, 0.0] | |
| 2.7 Participants with any myalgia | 1 | Risk Ratio (M‐H, Fixed, 95% CI) | 0.0 [0.0, 0.0] | |
| 2.8 Participants with grade 3 myalgia | 1 | Risk Ratio (M‐H, Fixed, 95% CI) | 0.0 [0.0, 0.0] | |
| 2.9 Participants with local pain | 1 | Risk Ratio (M‐H, Fixed, 95% CI) | 0.0 [0.0, 0.0] | |
| 2.10 Participants with grade 3 local pain | 1 | Risk Ratio (M‐H, Fixed, 95% CI) | 0.0 [0.0, 0.0] | |
| 2.11 Participants with local redness | 1 | Risk Ratio (M‐H, Fixed, 95% CI) | 0.0 [0.0, 0.0] | |
| 2.12 Participants with grade 3 local redness | 1 | Risk Ratio (M‐H, Fixed, 95% CI) | 0.0 [0.0, 0.0] | |
| 2.13 Participants with local swelling | 1 | Risk Ratio (M‐H, Fixed, 95% CI) | 0.0 [0.0, 0.0] | |
| 2.14 Participants with grade 3 local swelling | 1 | Risk Ratio (M‐H, Fixed, 95% CI) | 0.0 [0.0, 0.0] | |
| 2.15 Participants with consent withdrawal | 1 | Risk Ratio (M‐H, Fixed, 95% CI) | 0.0 [0.0, 0.0] | |
| 2.16 Participants with lost to follow‐up | 1 | Risk Ratio (M‐H, Fixed, 95% CI) | 0.0 [0.0, 0.0] | |
| 2.17 Participants with death | 1 | Risk Ratio (M‐H, Fixed, 95% CI) | 0.0 [0.0, 0.0] | |
| 3 50 µg gE/AS01B versus 100 µg gE/AS01B Show forest plot | 1 | Risk Ratio (M‐H, Fixed, 95% CI) | Totals not selected | |
| 3.1 Participants with any fatigue | 1 | Risk Ratio (M‐H, Fixed, 95% CI) | 0.0 [0.0, 0.0] | |
| 3.2 Participants with grade 3 fatigue | 1 | Risk Ratio (M‐H, Fixed, 95% CI) | 0.0 [0.0, 0.0] | |
| 3.3 Participants with any fever | 1 | Risk Ratio (M‐H, Fixed, 95% CI) | 0.0 [0.0, 0.0] | |
| 3.4 Participants with grade 3 fever | 1 | Risk Ratio (M‐H, Fixed, 95% CI) | 0.0 [0.0, 0.0] | |
| 3.5 Participants with any headache | 1 | Risk Ratio (M‐H, Fixed, 95% CI) | 0.0 [0.0, 0.0] | |
| 3.6 Participants with grade 3 headache | 1 | Risk Ratio (M‐H, Fixed, 95% CI) | 0.0 [0.0, 0.0] | |
| 3.7 Participants with any myalgia | 1 | Risk Ratio (M‐H, Fixed, 95% CI) | 0.0 [0.0, 0.0] | |
| 3.8 Participants with grade 3 myalgia | 1 | Risk Ratio (M‐H, Fixed, 95% CI) | 0.0 [0.0, 0.0] | |
| 3.9 Participants with local swelling | 1 | Risk Ratio (M‐H, Fixed, 95% CI) | 0.0 [0.0, 0.0] | |
| 3.10 Participants with grade 3 local pain | 1 | Risk Ratio (M‐H, Fixed, 95% CI) | 0.0 [0.0, 0.0] | |
| 3.11 Participants with local redness | 1 | Risk Ratio (M‐H, Fixed, 95% CI) | 0.0 [0.0, 0.0] | |
| 3.12 Participants with grade 3 local redness | 1 | Risk Ratio (M‐H, Fixed, 95% CI) | 0.0 [0.0, 0.0] | |
| 3.13 Participants with local pain | 1 | Risk Ratio (M‐H, Fixed, 95% CI) | 0.0 [0.0, 0.0] | |
| 3.14 Participants with grade 3 local swelling | 1 | Risk Ratio (M‐H, Fixed, 95% CI) | 0.0 [0.0, 0.0] | |
| 3.15 Participants with consent withdrawal | 1 | Risk Ratio (M‐H, Fixed, 95% CI) | 0.0 [0.0, 0.0] | |
| 3.16 Participants with lost to follow‐up | 1 | Risk Ratio (M‐H, Fixed, 95% CI) | 0.0 [0.0, 0.0] | |
| 3.17 Participants with death | 1 | Risk Ratio (M‐H, Fixed, 95% CI) | 0.0 [0.0, 0.0] | |
| 4 25 µg gE/AS01B versus 100 µg gE/saline (unadjuvanted gE) Show forest plot | 1 | Risk Ratio (M‐H, Fixed, 95% CI) | Totals not selected | |
| 4.1 Participants with any fatigue | 1 | Risk Ratio (M‐H, Fixed, 95% CI) | 0.0 [0.0, 0.0] | |
| 4.2 Participants with grade 3 fatigue | 1 | Risk Ratio (M‐H, Fixed, 95% CI) | 0.0 [0.0, 0.0] | |
| 4.3 Participants with any fever | 1 | Risk Ratio (M‐H, Fixed, 95% CI) | 0.0 [0.0, 0.0] | |
| 4.4 Participants with grade 3 fever | 1 | Risk Ratio (M‐H, Fixed, 95% CI) | 0.0 [0.0, 0.0] | |
| 4.5 Participants with any headache | 1 | Risk Ratio (M‐H, Fixed, 95% CI) | 0.0 [0.0, 0.0] | |
| 4.6 Participants with grade 3 headache | 1 | Risk Ratio (M‐H, Fixed, 95% CI) | 0.0 [0.0, 0.0] | |
| 4.7 Participants with any myalgia | 1 | Risk Ratio (M‐H, Fixed, 95% CI) | 0.0 [0.0, 0.0] | |
| 4.8 Participants with grade 3 myalgia | 1 | Risk Ratio (M‐H, Fixed, 95% CI) | 0.0 [0.0, 0.0] | |
| 4.9 Participants with local pain | 1 | Risk Ratio (M‐H, Fixed, 95% CI) | 0.0 [0.0, 0.0] | |
| 4.10 Participants with grade 3 local pain | 1 | Risk Ratio (M‐H, Fixed, 95% CI) | 0.0 [0.0, 0.0] | |
| 4.11 Participants with local redness | 1 | Risk Ratio (M‐H, Fixed, 95% CI) | 0.0 [0.0, 0.0] | |
| 4.12 Participants with grade 3 local redness | 1 | Risk Ratio (M‐H, Fixed, 95% CI) | 0.0 [0.0, 0.0] | |
| 4.13 Participants with local swelling | 1 | Risk Ratio (M‐H, Fixed, 95% CI) | 0.0 [0.0, 0.0] | |
| 4.14 Participants with grade 3 local swelling | 1 | Risk Ratio (M‐H, Fixed, 95% CI) | 0.0 [0.0, 0.0] | |
| 4.15 Participants with consent withdrawal | 1 | Risk Ratio (M‐H, Fixed, 95% CI) | 0.0 [0.0, 0.0] | |
| 4.16 Participants with lost to follow‐up | 1 | Risk Ratio (M‐H, Fixed, 95% CI) | 0.0 [0.0, 0.0] | |
| 4.17 Participants with death | 1 | Risk Ratio (M‐H, Fixed, 95% CI) | 0.0 [0.0, 0.0] | |
| 5 50 µg gE/AS01B a versus 100 µg gE/saline (unadjuvanted gE) Show forest plot | 1 | Risk Ratio (M‐H, Fixed, 95% CI) | Totals not selected | |
| 5.1 Participants with any fatigue | 1 | Risk Ratio (M‐H, Fixed, 95% CI) | 0.0 [0.0, 0.0] | |
| 5.2 Participants with grade 3 fatigue | 1 | Risk Ratio (M‐H, Fixed, 95% CI) | 0.0 [0.0, 0.0] | |
| 5.3 Participants with any fever | 1 | Risk Ratio (M‐H, Fixed, 95% CI) | 0.0 [0.0, 0.0] | |
| 5.4 Participants with grade 3 fever | 1 | Risk Ratio (M‐H, Fixed, 95% CI) | 0.0 [0.0, 0.0] | |
| 5.5 Participants with any headache | 1 | Risk Ratio (M‐H, Fixed, 95% CI) | 0.0 [0.0, 0.0] | |
| 5.6 Participants with grade 3 headache | 1 | Risk Ratio (M‐H, Fixed, 95% CI) | 0.0 [0.0, 0.0] | |
| 5.7 Participants with any myalgia | 1 | Risk Ratio (M‐H, Fixed, 95% CI) | 0.0 [0.0, 0.0] | |
| 5.8 Participants with grade 3 myalgia | 1 | Risk Ratio (M‐H, Fixed, 95% CI) | 0.0 [0.0, 0.0] | |
| 5.9 Participants with local pain | 1 | Risk Ratio (M‐H, Fixed, 95% CI) | 0.0 [0.0, 0.0] | |
| 5.10 Participants with grade 3 local pain | 1 | Risk Ratio (M‐H, Fixed, 95% CI) | 0.0 [0.0, 0.0] | |
| 5.11 Participants with local redness | 1 | Risk Ratio (M‐H, Fixed, 95% CI) | 0.0 [0.0, 0.0] | |
| 5.12 Participants with grade 3 local redness | 1 | Risk Ratio (M‐H, Fixed, 95% CI) | 0.0 [0.0, 0.0] | |
| 5.13 Participants with local swelling | 1 | Risk Ratio (M‐H, Fixed, 95% CI) | 0.0 [0.0, 0.0] | |
| 5.14 Participants with grade 3 local swelling | 1 | Risk Ratio (M‐H, Fixed, 95% CI) | 0.0 [0.0, 0.0] | |
| 5.15 Participants with consent withdrawal | 1 | Risk Ratio (M‐H, Fixed, 95% CI) | 0.0 [0.0, 0.0] | |
| 5.16 Participants with lost to follow‐up | 1 | Risk Ratio (M‐H, Fixed, 95% CI) | 0.0 [0.0, 0.0] | |
| 5.17 Participants with death | 1 | Risk Ratio (M‐H, Fixed, 95% CI) | 0.0 [0.0, 0.0] | |
| 6 100 µg gE/AS01B versus 100 µg gE/saline (unadjuvanted gE) Show forest plot | 1 | Risk Ratio (M‐H, Fixed, 95% CI) | Totals not selected | |
| 6.1 Participants with any fatigue | 1 | Risk Ratio (M‐H, Fixed, 95% CI) | 0.0 [0.0, 0.0] | |
| 6.2 Participants with grade 3 fatigue | 1 | Risk Ratio (M‐H, Fixed, 95% CI) | 0.0 [0.0, 0.0] | |
| 6.3 Participants with any fever | 1 | Risk Ratio (M‐H, Fixed, 95% CI) | 0.0 [0.0, 0.0] | |
| 6.4 Participants with grade 3 fever | 1 | Risk Ratio (M‐H, Fixed, 95% CI) | 0.0 [0.0, 0.0] | |
| 6.5 Participants with any headache | 1 | Risk Ratio (M‐H, Fixed, 95% CI) | 0.0 [0.0, 0.0] | |
| 6.6 Participants with grade 3 headache | 1 | Risk Ratio (M‐H, Fixed, 95% CI) | 0.0 [0.0, 0.0] | |
| 6.7 Participants with any myalgia | 1 | Risk Ratio (M‐H, Fixed, 95% CI) | 0.0 [0.0, 0.0] | |
| 6.8 Participants with grade 3 myalgia | 1 | Risk Ratio (M‐H, Fixed, 95% CI) | 0.0 [0.0, 0.0] | |
| 6.9 Participants with local pain | 1 | Risk Ratio (M‐H, Fixed, 95% CI) | 0.0 [0.0, 0.0] | |
| 6.10 Participants with grade 3 local pain | 1 | Risk Ratio (M‐H, Fixed, 95% CI) | 0.0 [0.0, 0.0] | |
| 6.11 Participants with local redness | 1 | Risk Ratio (M‐H, Fixed, 95% CI) | 0.0 [0.0, 0.0] | |
| 6.12 Participants with grade 3 local redness | 1 | Risk Ratio (M‐H, Fixed, 95% CI) | 0.0 [0.0, 0.0] | |
| 6.13 Participants with local swelling | 1 | Risk Ratio (M‐H, Fixed, 95% CI) | 0.0 [0.0, 0.0] | |
| 6.14 Participants with grade 3 local swelling | 1 | Risk Ratio (M‐H, Fixed, 95% CI) | 0.0 [0.0, 0.0] | |
| 6.15 Participants with consent withdrawal | 1 | Risk Ratio (M‐H, Fixed, 95% CI) | 0.0 [0.0, 0.0] | |
| 6.16 Participants with lost to follow‐up | 1 | Risk Ratio (M‐H, Fixed, 95% CI) | 0.0 [0.0, 0.0] | |
| 6.17 Participants with death | 1 | Risk Ratio (M‐H, Fixed, 95% CI) | 0.0 [0.0, 0.0] | |
| 7 25 µg gE/AS01B versus saline + 100 µg gE/AS01B Show forest plot | 1 | Risk Ratio (M‐H, Fixed, 95% CI) | Totals not selected | |
| 7.1 Participants with any fatigue | 1 | Risk Ratio (M‐H, Fixed, 95% CI) | 0.0 [0.0, 0.0] | |
| 7.2 Participants with grade 3 fatigue | 1 | Risk Ratio (M‐H, Fixed, 95% CI) | 0.0 [0.0, 0.0] | |
| 7.3 Participants with any fever | 1 | Risk Ratio (M‐H, Fixed, 95% CI) | 0.0 [0.0, 0.0] | |
| 7.4 Participants with grade 3 fever | 1 | Risk Ratio (M‐H, Fixed, 95% CI) | 0.0 [0.0, 0.0] | |
| 7.5 Participants with any headache | 1 | Risk Ratio (M‐H, Fixed, 95% CI) | 0.0 [0.0, 0.0] | |
| 7.6 Participants with grade 3 headache | 1 | Risk Ratio (M‐H, Fixed, 95% CI) | 0.0 [0.0, 0.0] | |
| 7.7 Participants with any myalgia | 1 | Risk Ratio (M‐H, Fixed, 95% CI) | 0.0 [0.0, 0.0] | |
| 7.8 Participants with grade 3 myalgia | 1 | Risk Ratio (M‐H, Fixed, 95% CI) | 0.0 [0.0, 0.0] | |
| 7.9 Participants with local pain | 1 | Risk Ratio (M‐H, Fixed, 95% CI) | 0.0 [0.0, 0.0] | |
| 7.10 Participants with grade 3 local pain | 1 | Risk Ratio (M‐H, Fixed, 95% CI) | 0.0 [0.0, 0.0] | |
| 7.11 Participants with local redness | 1 | Risk Ratio (M‐H, Fixed, 95% CI) | 0.0 [0.0, 0.0] | |
| 7.12 Participants with grade 3 local redness | 1 | Risk Ratio (M‐H, Fixed, 95% CI) | 0.0 [0.0, 0.0] | |
| 7.13 Participants with local swelling | 1 | Risk Ratio (M‐H, Fixed, 95% CI) | 0.0 [0.0, 0.0] | |
| 7.14 Participants with grade 3 local swelling | 1 | Risk Ratio (M‐H, Fixed, 95% CI) | 0.0 [0.0, 0.0] | |
| 7.15 Participants with consent withdrawal | 1 | Risk Ratio (M‐H, Fixed, 95% CI) | 0.0 [0.0, 0.0] | |
| 7.16 Participants with lost to follow‐up | 1 | Risk Ratio (M‐H, Fixed, 95% CI) | 0.0 [0.0, 0.0] | |
| 7.17 Participants with death | 1 | Risk Ratio (M‐H, Fixed, 95% CI) | 0.0 [0.0, 0.0] | |
| 8 50 µg gE/AS01B versus saline + 100 µg gE/AS01B Show forest plot | 1 | Risk Ratio (M‐H, Fixed, 95% CI) | Totals not selected | |
| 8.1 Participants with any fatigue | 1 | Risk Ratio (M‐H, Fixed, 95% CI) | 0.0 [0.0, 0.0] | |
| 8.2 Participants with grade 3 fatigue | 1 | Risk Ratio (M‐H, Fixed, 95% CI) | 0.0 [0.0, 0.0] | |
| 8.3 Participants with any fever | 1 | Risk Ratio (M‐H, Fixed, 95% CI) | 0.0 [0.0, 0.0] | |
| 8.4 Participants with grade 3 fever | 1 | Risk Ratio (M‐H, Fixed, 95% CI) | 0.0 [0.0, 0.0] | |
| 8.5 Participants with any headache | 1 | Risk Ratio (M‐H, Fixed, 95% CI) | 0.0 [0.0, 0.0] | |
| 8.6 Participants with grade 3 headache | 1 | Risk Ratio (M‐H, Fixed, 95% CI) | 0.0 [0.0, 0.0] | |
| 8.7 Participants with any myalgia | 1 | Risk Ratio (M‐H, Fixed, 95% CI) | 0.0 [0.0, 0.0] | |
| 8.8 Participants with grade 3 myalgia | 1 | Risk Ratio (M‐H, Fixed, 95% CI) | 0.0 [0.0, 0.0] | |
| 8.9 Participants with local pain | 1 | Risk Ratio (M‐H, Fixed, 95% CI) | 0.0 [0.0, 0.0] | |
| 8.10 Participants with grade 3 local pain | 1 | Risk Ratio (M‐H, Fixed, 95% CI) | 0.0 [0.0, 0.0] | |
| 8.11 Participants with local redness | 1 | Risk Ratio (M‐H, Fixed, 95% CI) | 0.0 [0.0, 0.0] | |
| 8.12 Participants with grade 3 local redness | 1 | Risk Ratio (M‐H, Fixed, 95% CI) | 0.0 [0.0, 0.0] | |
| 8.13 Participants with local swelling | 1 | Risk Ratio (M‐H, Fixed, 95% CI) | 0.0 [0.0, 0.0] | |
| 8.14 Participants with grade 3 local swelling | 1 | Risk Ratio (M‐H, Fixed, 95% CI) | 0.0 [0.0, 0.0] | |
| 8.15 Participants with consent withdrawal | 1 | Risk Ratio (M‐H, Fixed, 95% CI) | 0.0 [0.0, 0.0] | |
| 8.16 Participants with lost to follow‐up | 1 | Risk Ratio (M‐H, Fixed, 95% CI) | 0.0 [0.0, 0.0] | |
| 8.17 Participants with death | 1 | Risk Ratio (M‐H, Fixed, 95% CI) | 0.0 [0.0, 0.0] | |
| 9 100 µg gE/AS01B versus saline + 100 µg gE/AS01B Show forest plot | 1 | Odds Ratio (M‐H, Fixed, 95% CI) | Totals not selected | |
| 9.1 Participants with any fatigue | 1 | Odds Ratio (M‐H, Fixed, 95% CI) | 0.0 [0.0, 0.0] | |
| 9.2 Participants with grade 3 fatigue | 1 | Odds Ratio (M‐H, Fixed, 95% CI) | 0.0 [0.0, 0.0] | |
| 9.3 Participants with any fever | 1 | Odds Ratio (M‐H, Fixed, 95% CI) | 0.0 [0.0, 0.0] | |
| 9.4 Participants with grade 3 fever | 1 | Odds Ratio (M‐H, Fixed, 95% CI) | 0.0 [0.0, 0.0] | |
| 9.5 Participants with any headache | 1 | Odds Ratio (M‐H, Fixed, 95% CI) | 0.0 [0.0, 0.0] | |
| 9.6 Participants with grade 3 headache | 1 | Odds Ratio (M‐H, Fixed, 95% CI) | 0.0 [0.0, 0.0] | |
| 9.7 Participants with any myalgia | 1 | Odds Ratio (M‐H, Fixed, 95% CI) | 0.0 [0.0, 0.0] | |
| 9.8 Participants with grade 3 myalgia | 1 | Odds Ratio (M‐H, Fixed, 95% CI) | 0.0 [0.0, 0.0] | |
| 9.9 Participants with local pain | 1 | Odds Ratio (M‐H, Fixed, 95% CI) | 0.0 [0.0, 0.0] | |
| 9.10 Participants with grade 3 local pain | 1 | Odds Ratio (M‐H, Fixed, 95% CI) | 0.0 [0.0, 0.0] | |
| 9.11 Participants with local redness | 1 | Odds Ratio (M‐H, Fixed, 95% CI) | 0.0 [0.0, 0.0] | |
| 9.12 Participants with grade 3 local redness | 1 | Odds Ratio (M‐H, Fixed, 95% CI) | 0.0 [0.0, 0.0] | |
| 9.13 Participants with local swelling | 1 | Odds Ratio (M‐H, Fixed, 95% CI) | 0.0 [0.0, 0.0] | |
| 9.14 Participants with grade 3 local swelling | 1 | Odds Ratio (M‐H, Fixed, 95% CI) | 0.0 [0.0, 0.0] | |
| 9.15 Participants with consent withdrawal | 1 | Odds Ratio (M‐H, Fixed, 95% CI) | 0.0 [0.0, 0.0] | |
| 9.16 Participants with lost to follow‐up | 1 | Odds Ratio (M‐H, Fixed, 95% CI) | 0.0 [0.0, 0.0] | |
| 9.17 Participants with death | 1 | Odds Ratio (M‐H, Fixed, 95% CI) | 0.0 [0.0, 0.0] | |
| 10 Saline + 100 µg gE/AS01B versus 100 µg gE/saline (unadjuvanted gE) Show forest plot | 1 | Risk Ratio (M‐H, Fixed, 95% CI) | Totals not selected | |
| 10.1 Participants with any fatigue | 1 | Risk Ratio (M‐H, Fixed, 95% CI) | 0.0 [0.0, 0.0] | |
| 10.2 Participants with grade 3 fatigue | 1 | Risk Ratio (M‐H, Fixed, 95% CI) | 0.0 [0.0, 0.0] | |
| 10.3 Participants with any fever | 1 | Risk Ratio (M‐H, Fixed, 95% CI) | 0.0 [0.0, 0.0] | |
| 10.4 Participants with grade 3 fever | 1 | Risk Ratio (M‐H, Fixed, 95% CI) | 0.0 [0.0, 0.0] | |
| 10.5 Participants with any headache | 1 | Risk Ratio (M‐H, Fixed, 95% CI) | 0.0 [0.0, 0.0] | |
| 10.6 Participants with grade 3 headache | 1 | Risk Ratio (M‐H, Fixed, 95% CI) | 0.0 [0.0, 0.0] | |
| 10.7 Participants with any myalgia | 1 | Risk Ratio (M‐H, Fixed, 95% CI) | 0.0 [0.0, 0.0] | |
| 10.8 Participants with grade 3 myalgia | 1 | Risk Ratio (M‐H, Fixed, 95% CI) | 0.0 [0.0, 0.0] | |
| 10.9 Participants with local pain | 1 | Risk Ratio (M‐H, Fixed, 95% CI) | 0.0 [0.0, 0.0] | |
| 10.10 Participants with grade 3 local pain | 1 | Risk Ratio (M‐H, Fixed, 95% CI) | 0.0 [0.0, 0.0] | |
| 10.11 Participants with local redness | 1 | Risk Ratio (M‐H, Fixed, 95% CI) | 0.0 [0.0, 0.0] | |
| 10.12 Participants with grade 3 local redness | 1 | Risk Ratio (M‐H, Fixed, 95% CI) | 0.0 [0.0, 0.0] | |
| 10.13 Participants with local swelling | 1 | Risk Ratio (M‐H, Fixed, 95% CI) | 0.0 [0.0, 0.0] | |
| 10.14 Participants with grade 3 local swelling | 1 | Risk Ratio (M‐H, Fixed, 95% CI) | 0.0 [0.0, 0.0] | |
| 10.15 Participants with consent withdrawal | 1 | Risk Ratio (M‐H, Fixed, 95% CI) | 0.0 [0.0, 0.0] | |
| 10.16 Participants with lost to follow‐up | 1 | Risk Ratio (M‐H, Fixed, 95% CI) | 0.0 [0.0, 0.0] | |
| 10.17 Participants with death | 1 | Risk Ratio (M‐H, Fixed, 95% CI) | 0.0 [0.0, 0.0] | |
| Outcome or subgroup title | No. of studies | No. of participants | Statistical method | Effect size |
| 1 Incidence of herpes zoster 3.2 years follow‐up (≥ 60 yo) Show forest plot | 1 | Risk Ratio (M‐H, Fixed, 95% CI) | Totals not selected | |
| 2 Participants with AEs Show forest plot | 1 | Risk Ratio (M‐H, Fixed, 95% CI) | Totals not selected | |
| 2.1 Any symptom | 1 | Risk Ratio (M‐H, Fixed, 95% CI) | 0.0 [0.0, 0.0] | |
| 2.2 Grade 3 any symptom | 1 | Risk Ratio (M‐H, Fixed, 95% CI) | 0.0 [0.0, 0.0] | |
| 2.3 Grade 3 any symptom related to vaccination | 1 | Risk Ratio (M‐H, Fixed, 95% CI) | 0.0 [0.0, 0.0] | |
| 2.4 Any systemic symptom | 1 | Risk Ratio (M‐H, Fixed, 95% CI) | 0.0 [0.0, 0.0] | |
| 2.5 Grade 3 any systemic AEs | 1 | Risk Ratio (M‐H, Fixed, 95% CI) | 0.0 [0.0, 0.0] | |
| 2.6 Myalgia | 1 | Risk Ratio (M‐H, Fixed, 95% CI) | 0.0 [0.0, 0.0] | |
| 2.7 Fatigue | 1 | Risk Ratio (M‐H, Fixed, 95% CI) | 0.0 [0.0, 0.0] | |
| 2.8 Headache | 1 | Risk Ratio (M‐H, Fixed, 95% CI) | 0.0 [0.0, 0.0] | |
| 2.9 Shivering | 1 | Risk Ratio (M‐H, Fixed, 95% CI) | 0.0 [0.0, 0.0] | |
| 2.10 Fever | 1 | Risk Ratio (M‐H, Fixed, 95% CI) | 0.0 [0.0, 0.0] | |
| 2.11 Gastrointestinal symptom | 1 | Risk Ratio (M‐H, Fixed, 95% CI) | 0.0 [0.0, 0.0] | |
| 2.12 Any local symptom | 1 | Risk Ratio (M‐H, Fixed, 95% CI) | 0.0 [0.0, 0.0] | |
| 2.13 Grade 3 any local symptom | 1 | Risk Ratio (M‐H, Fixed, 95% CI) | 0.0 [0.0, 0.0] | |
| 2.14 Local pain | 1 | Risk Ratio (M‐H, Fixed, 95% CI) | 0.0 [0.0, 0.0] | |
| 2.15 Local redness | 1 | Risk Ratio (M‐H, Fixed, 95% CI) | 0.0 [0.0, 0.0] | |
| 2.16 Local swelling | 1 | Risk Ratio (M‐H, Fixed, 95% CI) | 0.0 [0.0, 0.0] | |
| 2.17 Serious AEs | 1 | Risk Ratio (M‐H, Fixed, 95% CI) | 0.0 [0.0, 0.0] | |
| 2.18 Serious AEs within 30 days after vaccination | 1 | Risk Ratio (M‐H, Fixed, 95% CI) | 0.0 [0.0, 0.0] | |
| 2.19 Serious AEs within 30 days after vaccination related to vaccination | 1 | Risk Ratio (M‐H, Fixed, 95% CI) | 0.0 [0.0, 0.0] | |
| 2.20 Potential immune‐mediated disease | 1 | Risk Ratio (M‐H, Fixed, 95% CI) | 0.0 [0.0, 0.0] | |
| 2.21 Deaths | 1 | Risk Ratio (M‐H, Fixed, 95% CI) | 0.0 [0.0, 0.0] | |
| 2.22 Deaths within 30 days after vaccination | 1 | Risk Ratio (M‐H, Fixed, 95% CI) | 0.0 [0.0, 0.0] | |
| 2.23 Unsolicited report of AEs | 1 | Risk Ratio (M‐H, Fixed, 95% CI) | 0.0 [0.0, 0.0] | |
| 2.24 Grade 3 unsolicited report of AEs | 1 | Risk Ratio (M‐H, Fixed, 95% CI) | 0.0 [0.0, 0.0] | |
| 3 Drop‐outs Show forest plot | 1 | Risk Ratio (M‐H, Fixed, 95% CI) | Totals not selected | |
| 3.1 Did not receive vaccine according to protocol | 1 | Risk Ratio (M‐H, Fixed, 95% CI) | 0.0 [0.0, 0.0] | |
| 3.2 Received wrong vaccine | 1 | Risk Ratio (M‐H, Fixed, 95% CI) | 0.0 [0.0, 0.0] | |
| 3.3 Had diagnosis of HZ < 30 days after dose 2 | 1 | Risk Ratio (M‐H, Fixed, 95% CI) | 0.0 [0.0, 0.0] | |